
Molecular Analyses of Clinical Isolates and Recombinant SARS-CoV-2 Carrying B.1 and B.1.617.2 Spike Mutations Suggest a Potential Role of Non-Spike Mutations in Infection Kinetics
 , , , , and
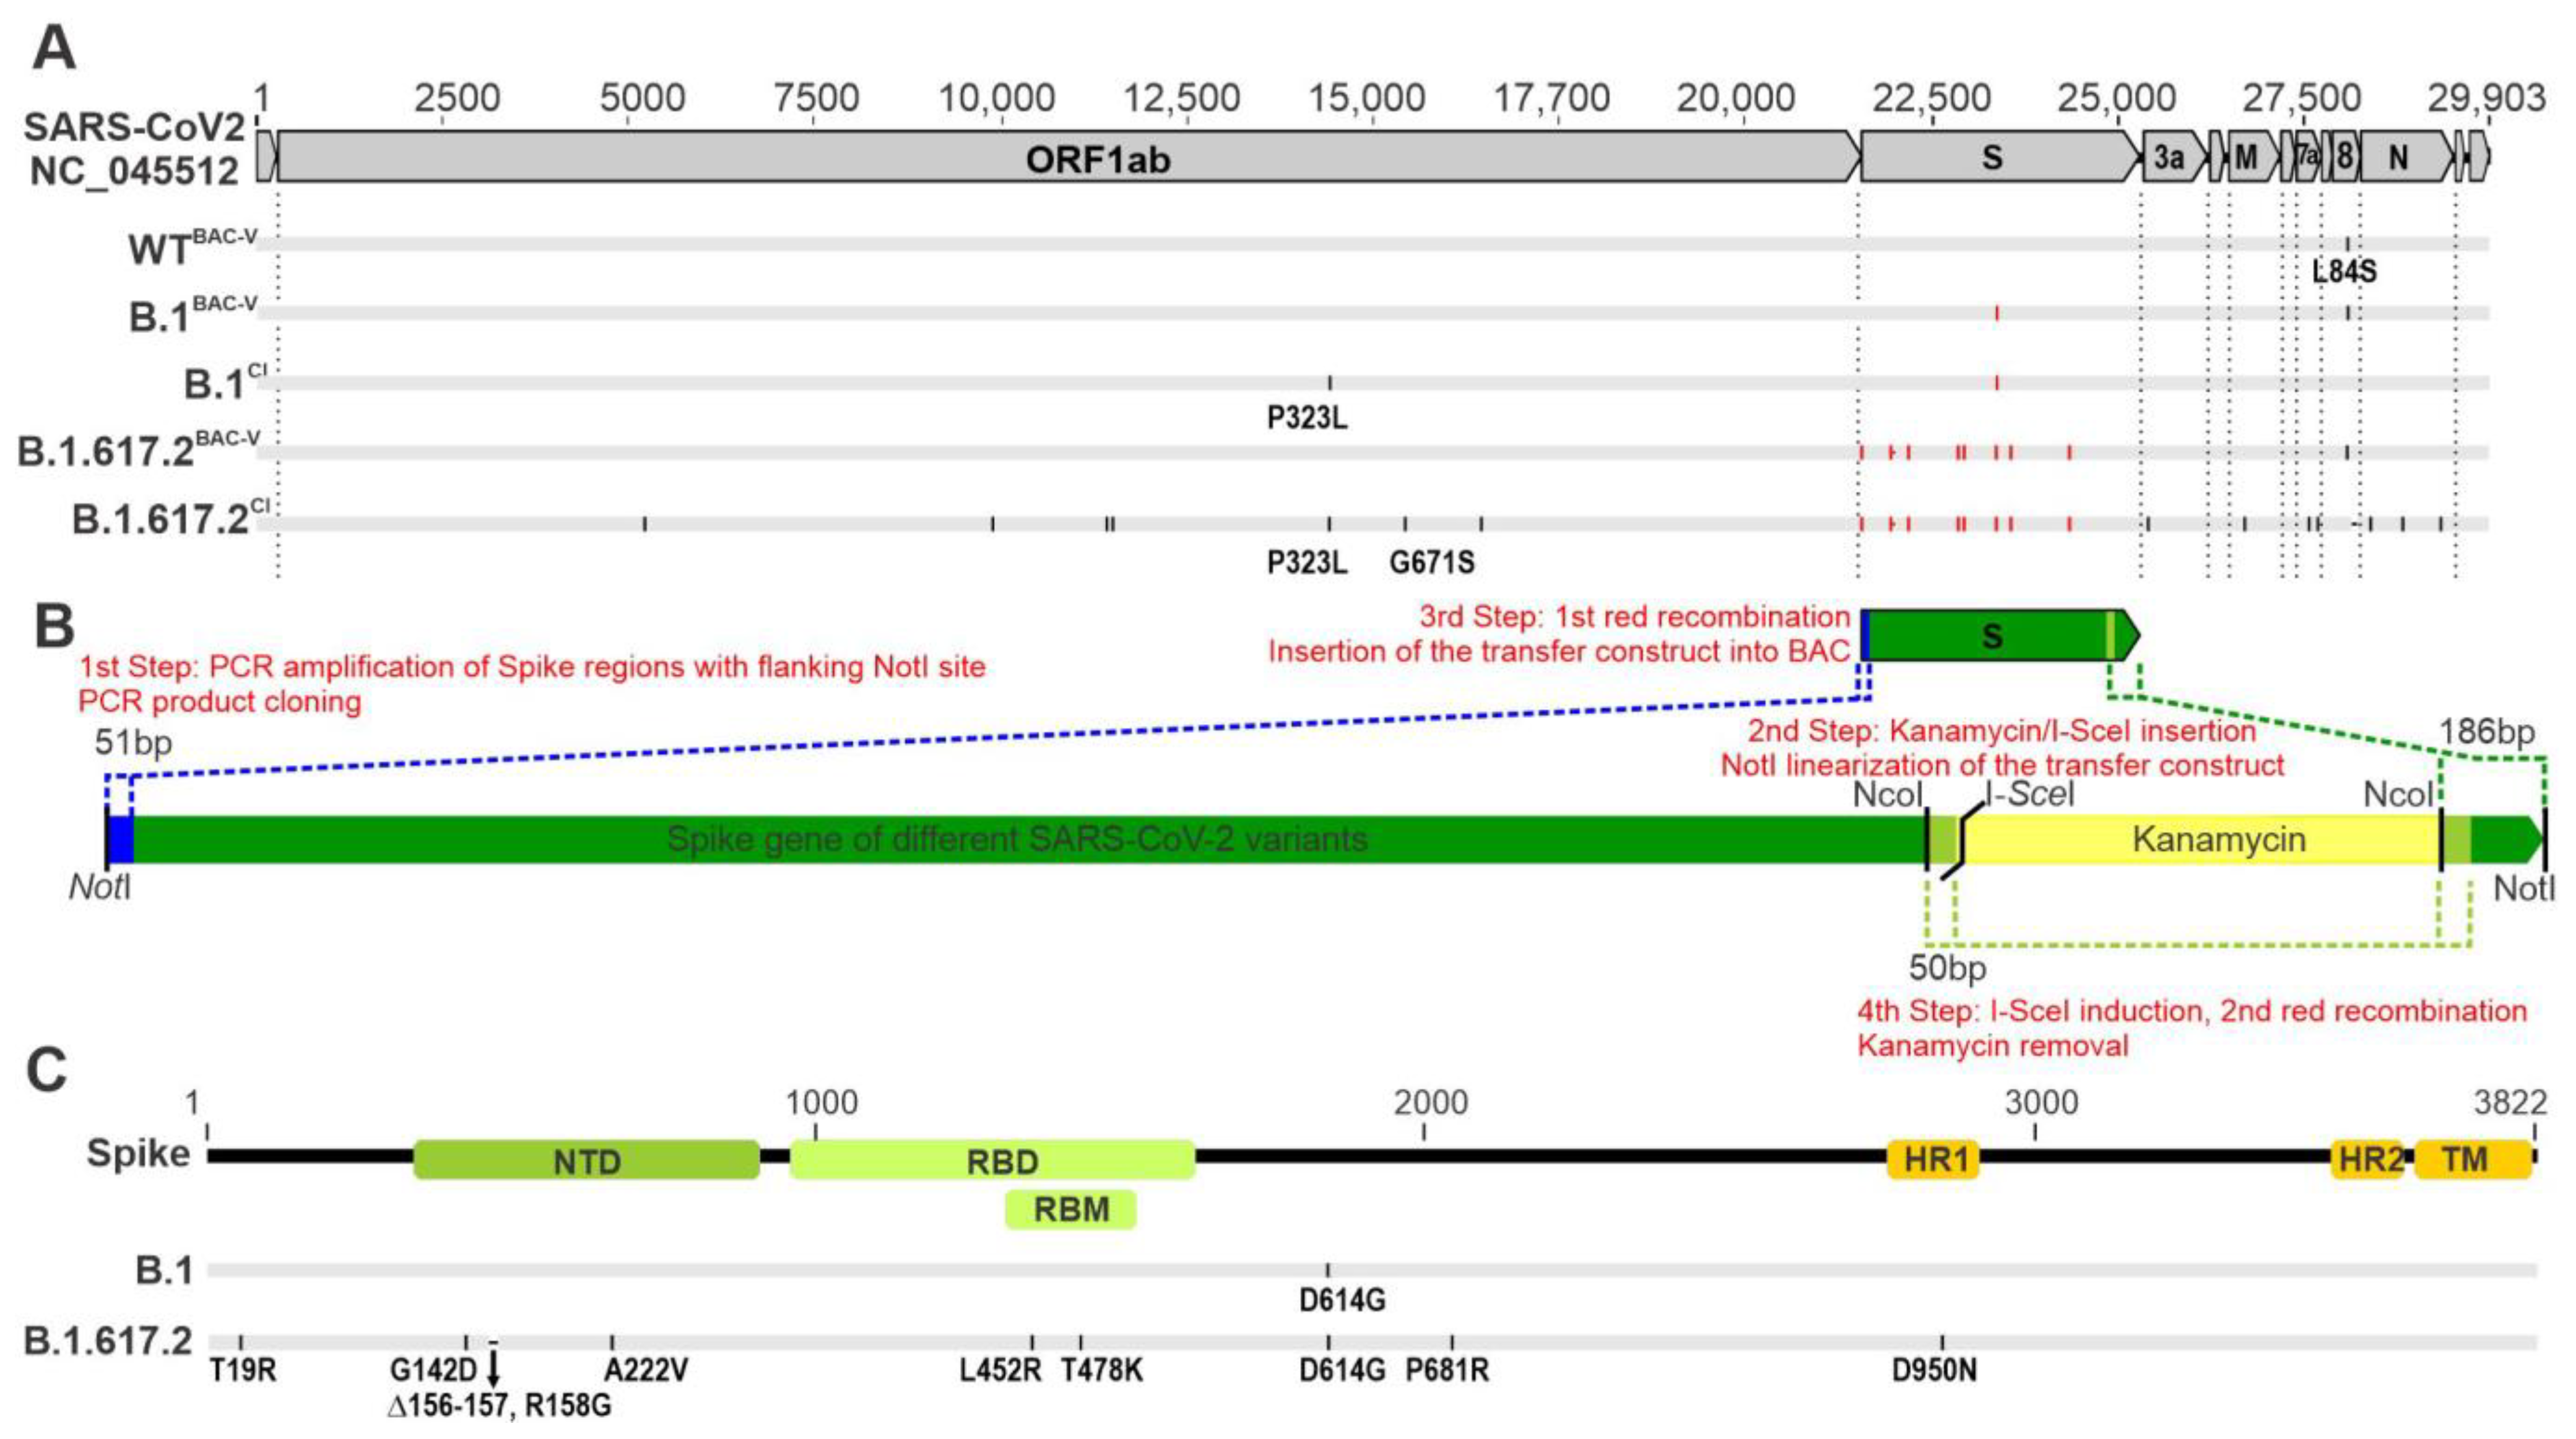
Abstract
:1. Introduction
2. Materials and Methods
2.1. Cell Culture and Clinical SARS-CoV-2 Isolates
2.2. Generation of Recombinant SARS-CoV-2 by En Passant Mutagenesis
2.3. Transfection and Reconstitution of Recombinant Viruses
2.4. Nanopore Sequencing and Bioinformatic Analysis
2.5. Infection Kinetics by Cell Confluence Measurement and Live Cell imaging
2.6. Neutralization Assays Using Vaccine Sera
2.7. Neutralization Assay Using Therapeutic Monoclonal Antibodies
2.8. Antiviral Testing Using Small-Molecule Inhibitors
2.9. Infection of HBEpC and TEER Measurement
2.10. Infection Kinetics by RNA Analysis
2.11. Western Blot Analysis
2.12. Statistical Analysis
2.13. Ethics Statement
3. Results
3.1. Generation of Recombinant SARS-CoV-2 Carrying B.1 and B.1.617.2 Spike Mutations
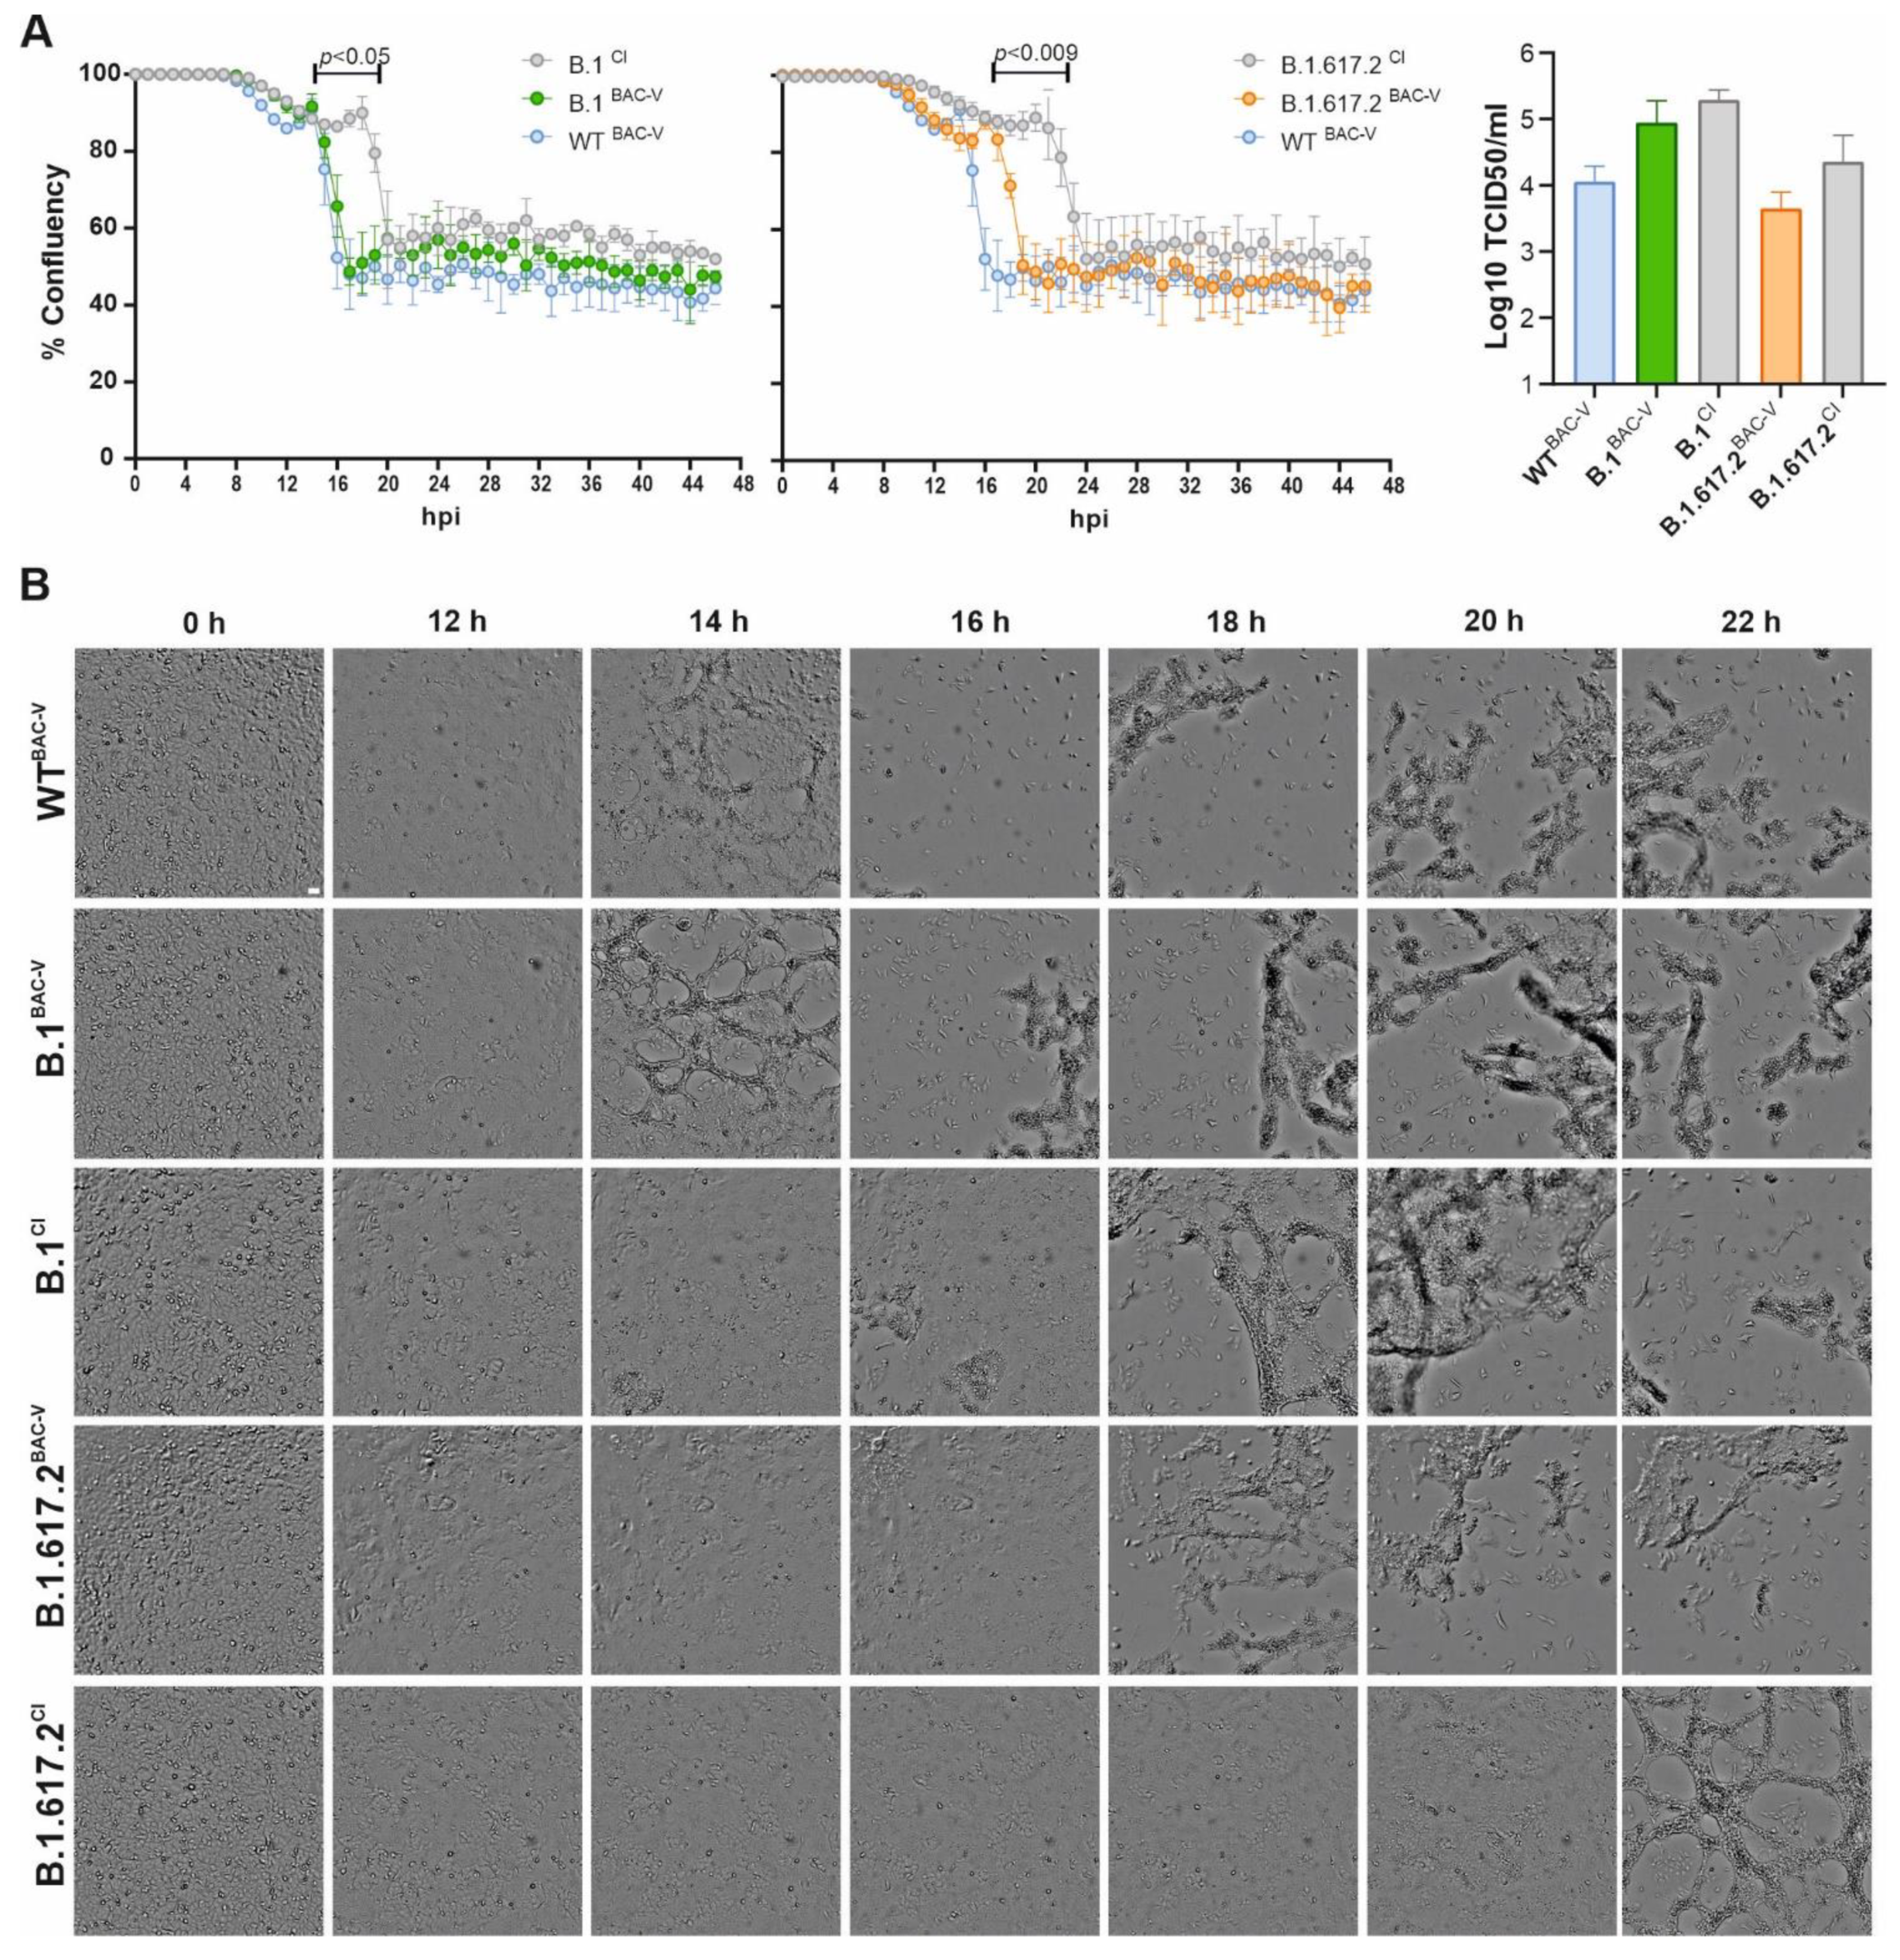
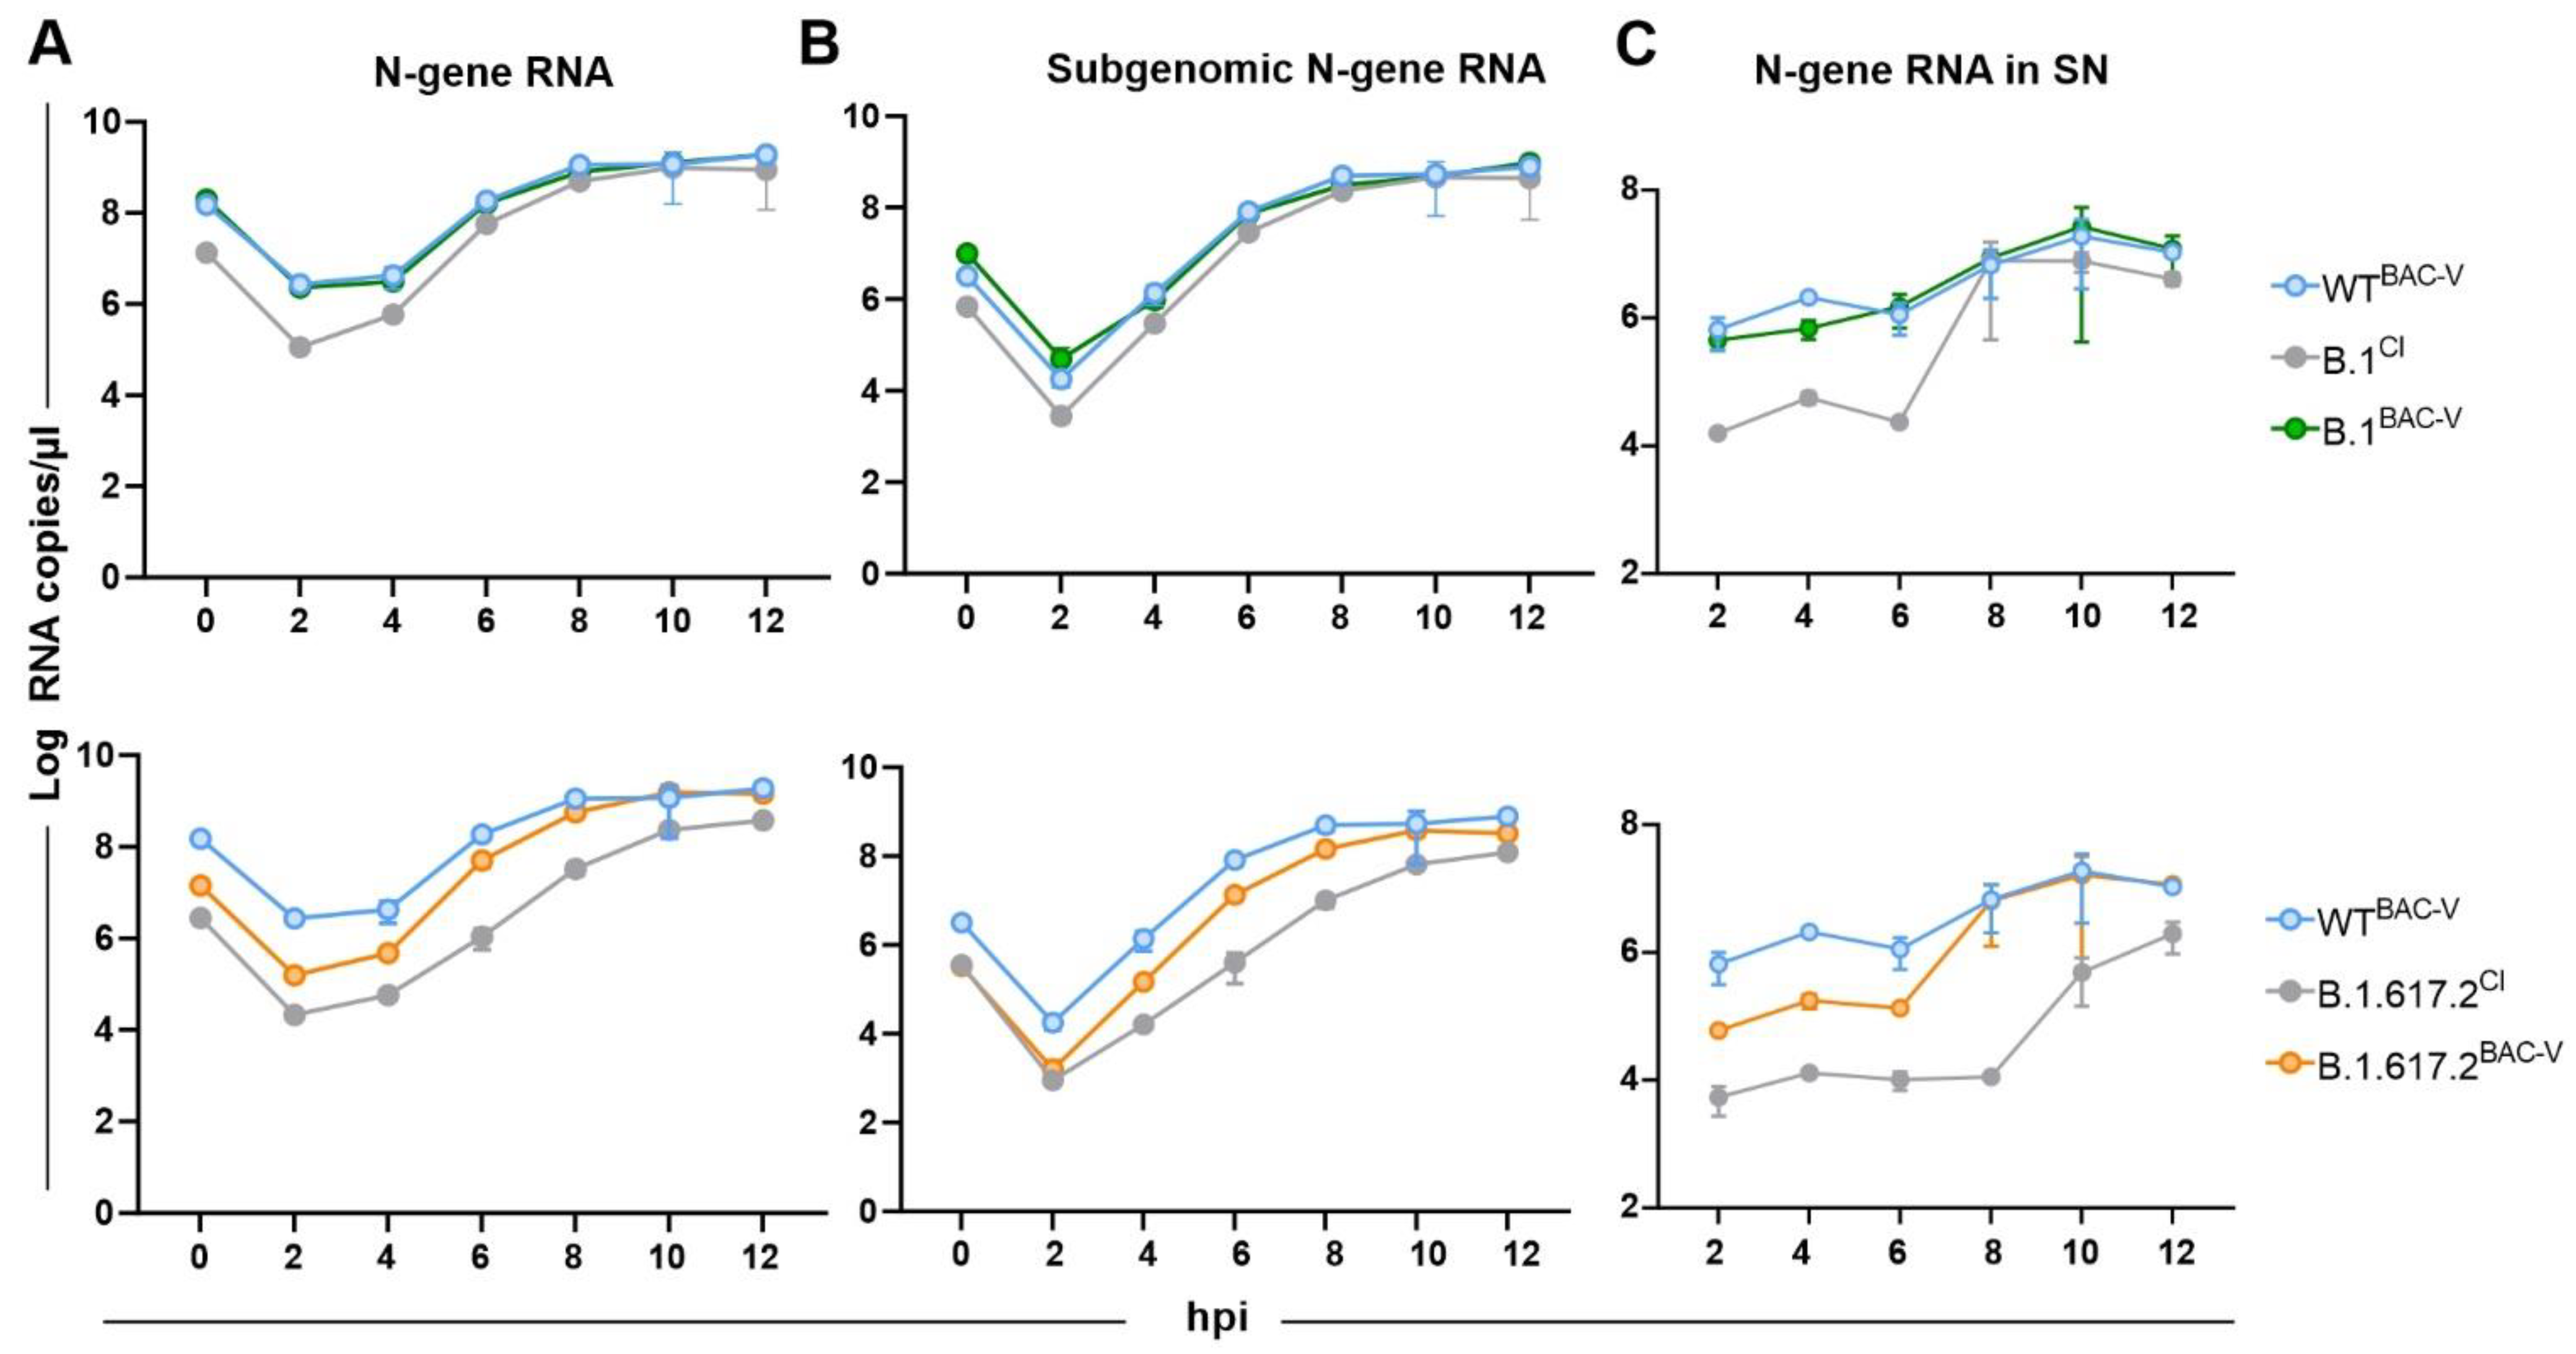
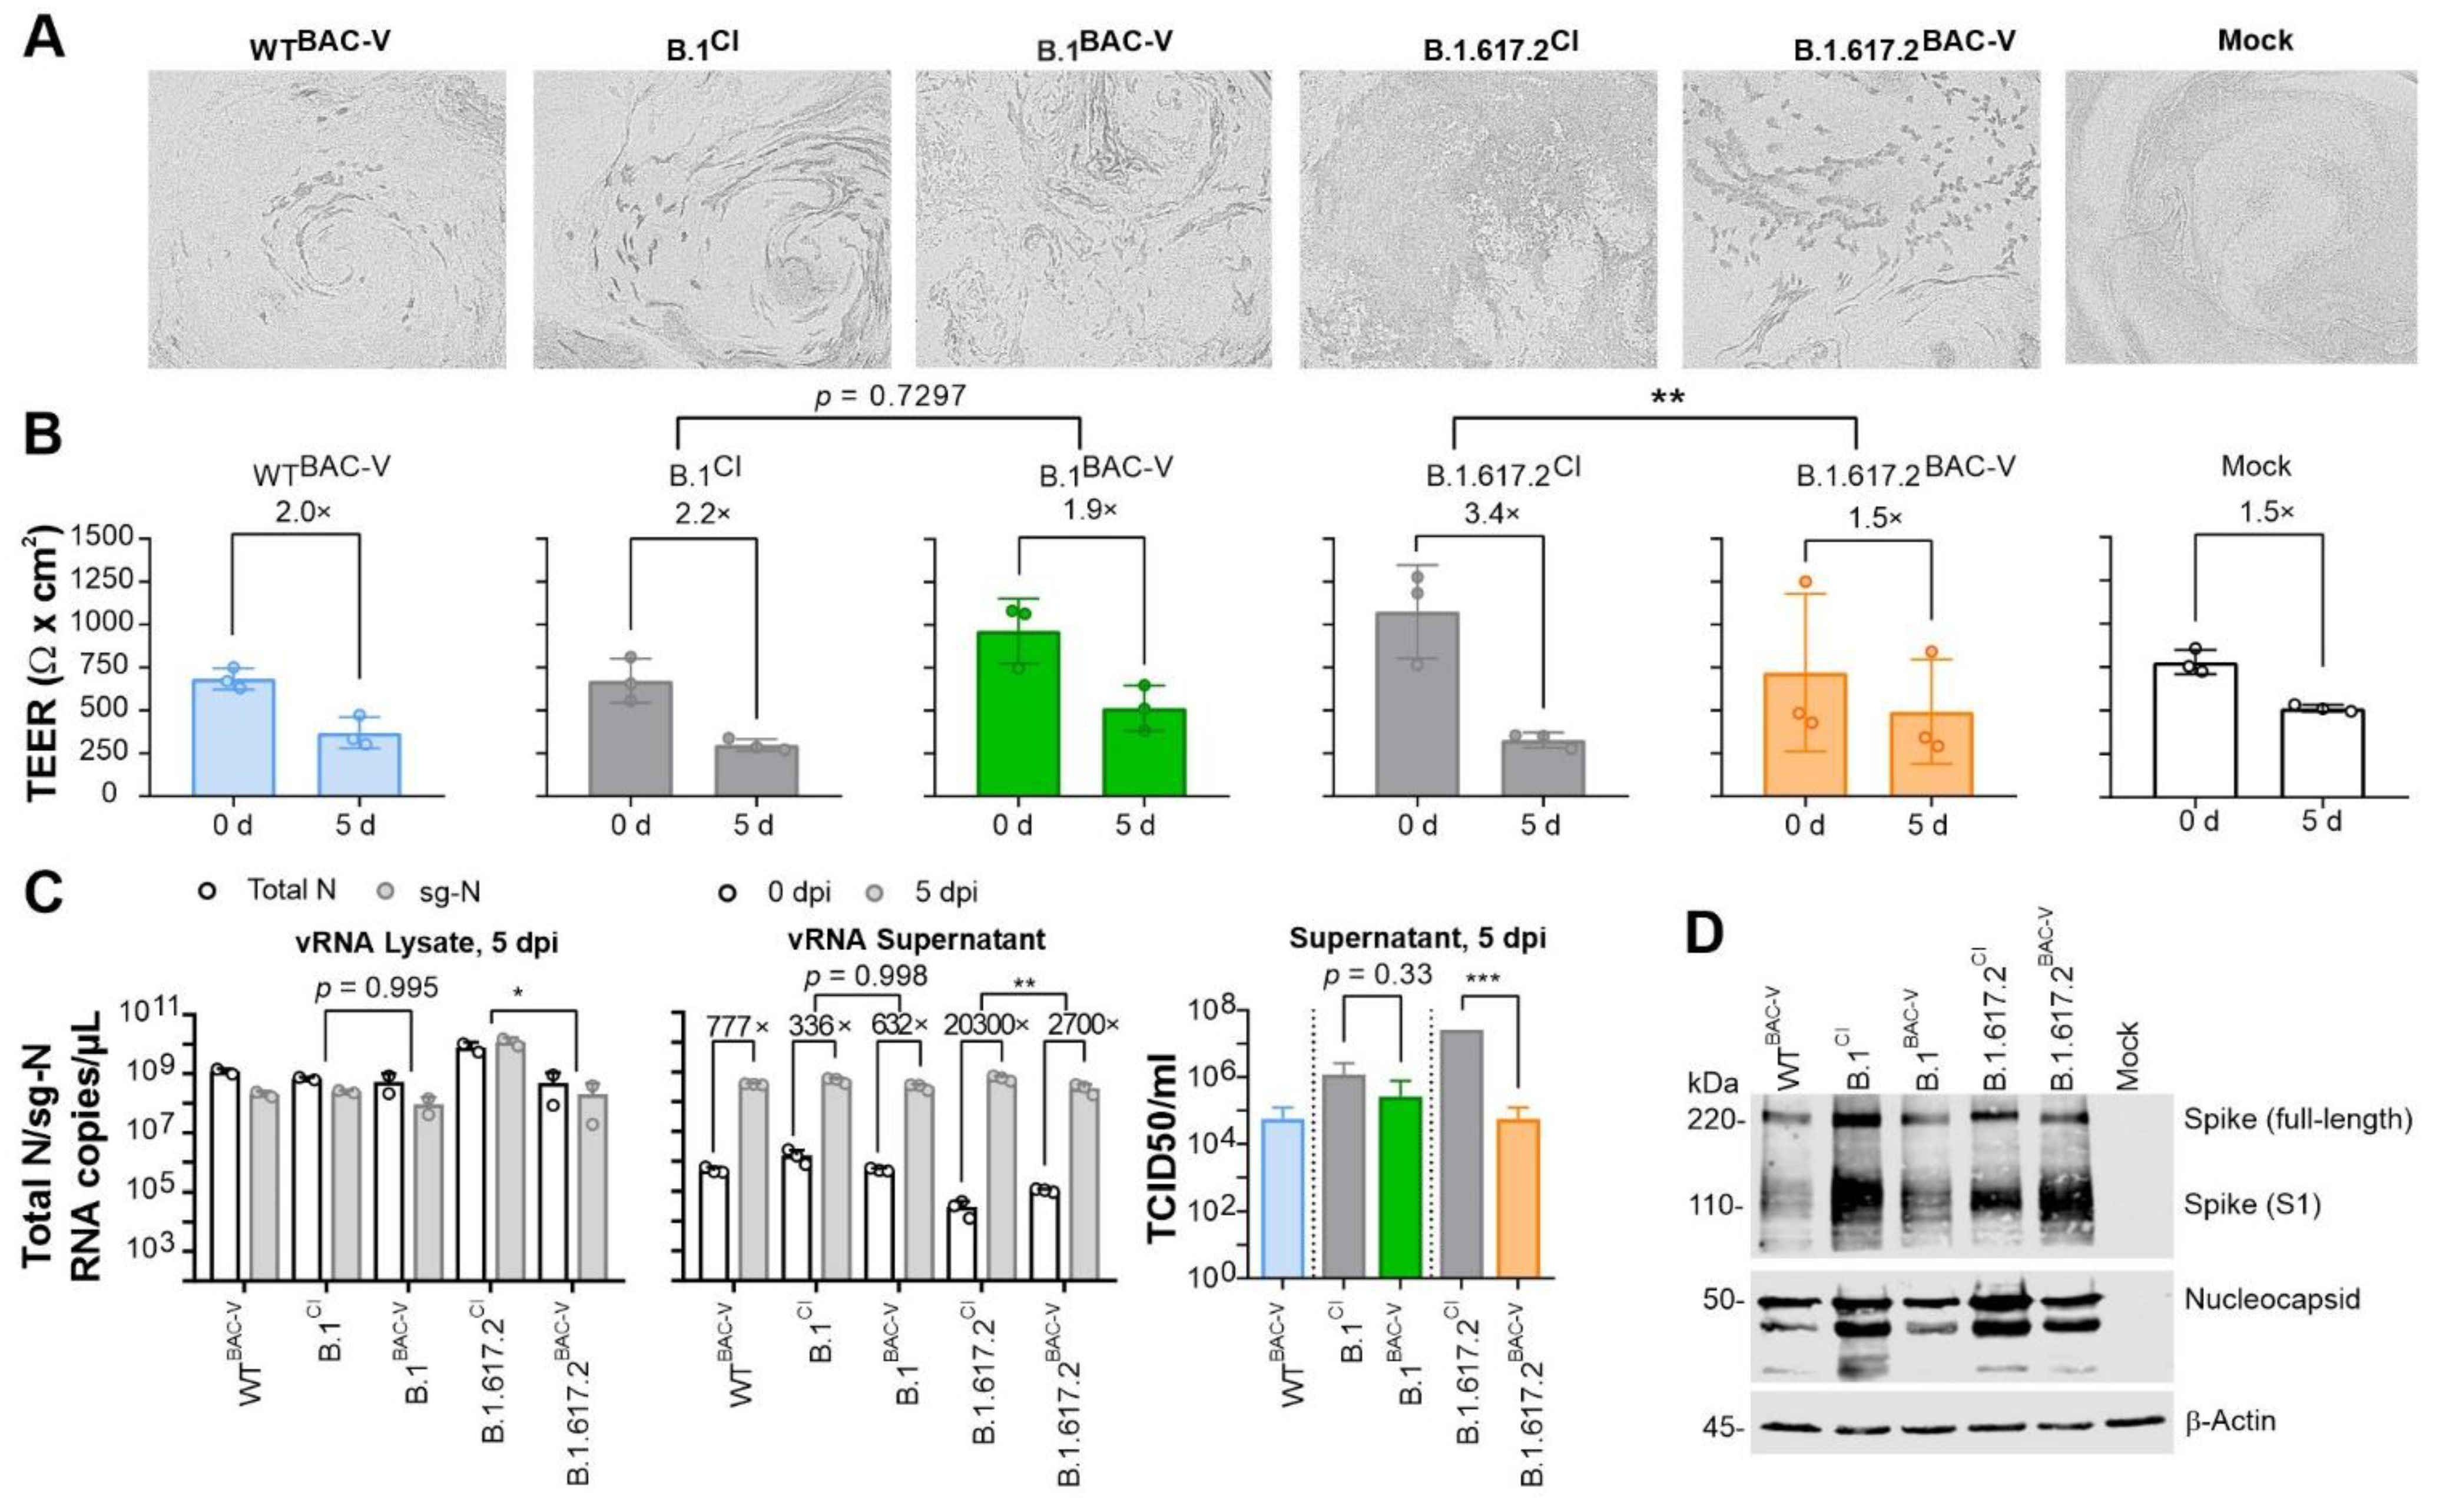
3.2. Recombinant SARS-CoV-2 Variants B.1BAC-V and B.1.617.2BAC-V Show Different Growth Kinetics Than Corresponding Clinical Isolates
3.3. Vaccine and Convalescent Sera Conduct Similar Neutralization of BAC-Derived Viruses and Corresponding Clinical Isolates
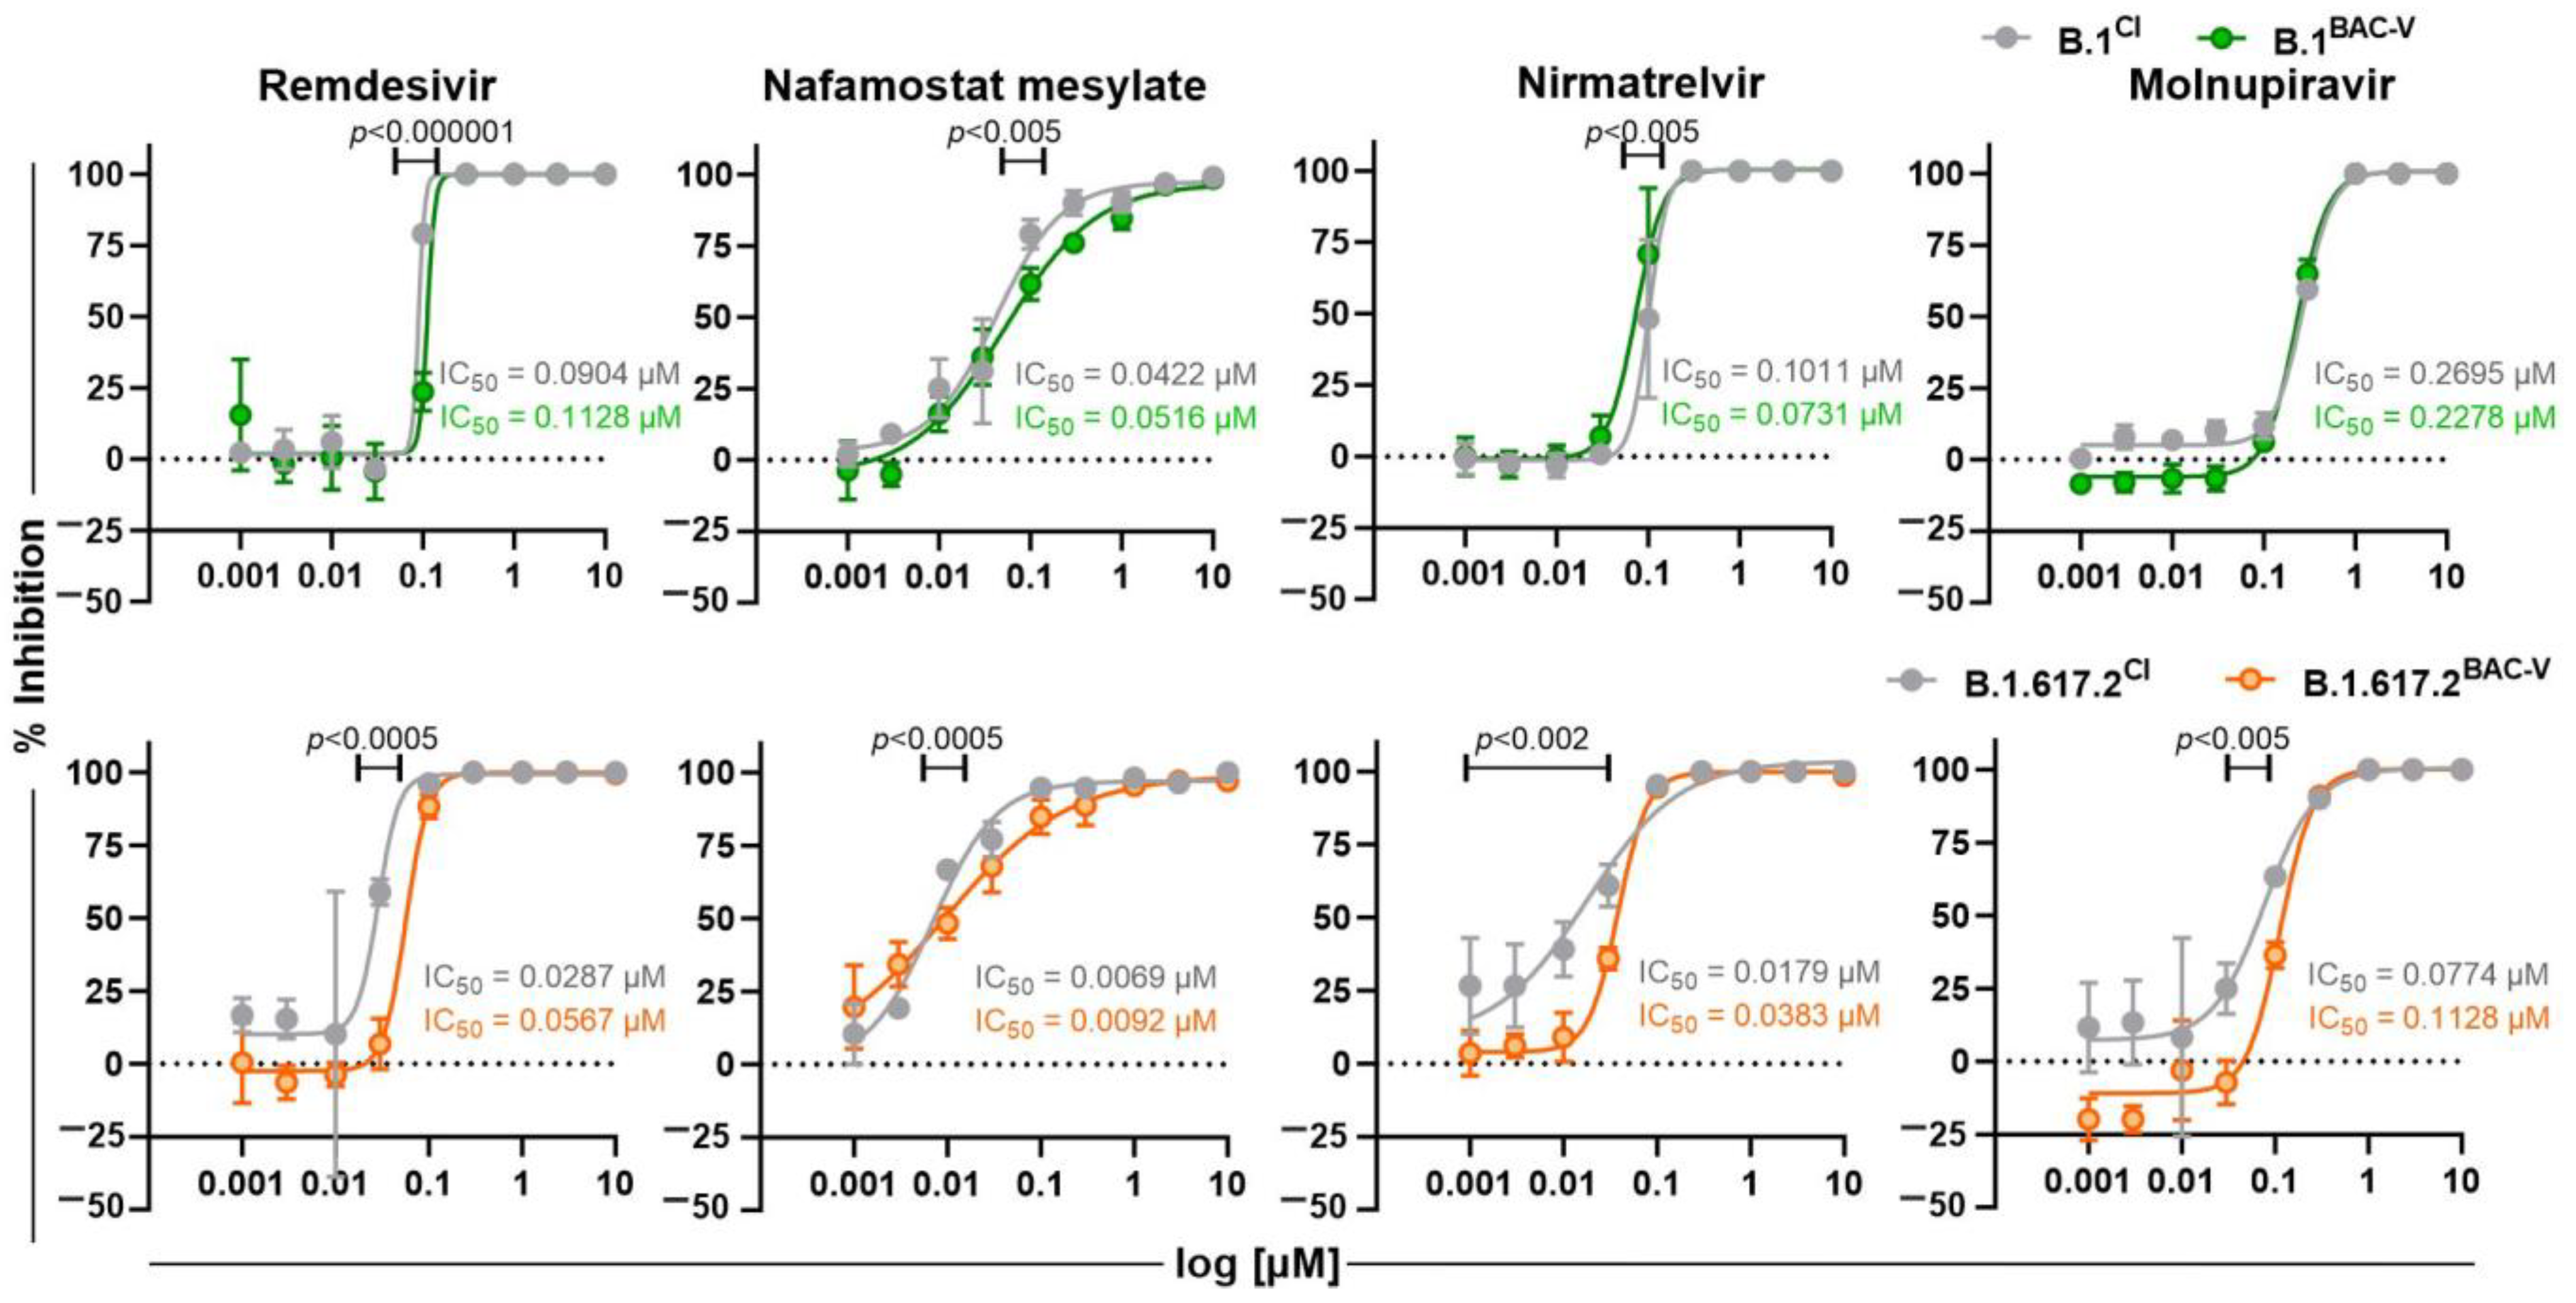
3.4. Treatment of Recombinant Viruses and Clinical Isolate with Monoclonal Antibodies and Small Molecule Inhibitors
4. Discussion
Supplementary Materials
Author Contributions
Funding
Institutional Review Board Statement
Informed Consent Statement
Data Availability Statement
Acknowledgments
Conflicts of Interest
References
- Almazan, F.; Sola, I.; Zuniga, S.; Marquez-Jurado, S.; Morales, L.; Becares, M.; Enjuanes, L. Coronavirus reverse genetic systems: Infectious clones and replicons. Virus Res. 2014, 189, 262–270. [Google Scholar] [CrossRef] [PubMed]
- Almazan, F.; Dediego, M.L.; Galan, C.; Escors, D.; Alvarez, E.; Ortego, J.; Sola, I.; Zuniga, S.; Alonso, S.; Moreno, J.L.; et al. Construction of a severe acute respiratory syndrome coronavirus infectious cDNA clone and a replicon to study coronavirus RNA synthesis. J. Virol. 2006, 80, 10900–10906. [Google Scholar] [CrossRef] [PubMed]
- Martinez-Sobrido, L.; Nogales, A. Editorial overview: Virus reverse genetics approaches for the development of preventive and therapeutic vaccines. Curr. Opin. Virol. 2020, 44, 3–4. [Google Scholar] [CrossRef] [PubMed]
- Kirui, J.; Freed, E.O. Generation and validation of a highly sensitive bioluminescent HIV-1 reporter vector that simplifies measurement of virus release. Retrovirology 2020, 17, 12. [Google Scholar] [CrossRef] [PubMed]
- Nogales, A.; Avila-Perez, G.; Rangel-Moreno, J.; Chiem, K.; DeDiego, M.L.; Martinez-Sobrido, L. A Novel Fluorescent and Bioluminescent Bireporter Influenza A Virus To Evaluate Viral Infections. J. Virol. 2019, 93. [Google Scholar] [CrossRef]
- Shang, B.; Deng, C.; Ye, H.; Xu, W.; Yuan, Z.; Shi, P.Y.; Zhang, B. Development and characterization of a stable eGFP enterovirus 71 for antiviral screening. Antiviral Res. 2013, 97, 198–205. [Google Scholar] [CrossRef]
- Zou, G.; Xu, H.Y.; Qing, M.; Wang, Q.Y.; Shi, P.Y. Development and characterization of a stable luciferase dengue virus for high-throughput screening. Antiviral Res. 2011, 91, 11–19. [Google Scholar] [CrossRef]
- Chou, S.; Van Wechel, L.C.; Lichy, H.M.; Marousek, G.I. Phenotyping of cytomegalovirus drug resistance mutations by using recombinant viruses incorporating a reporter gene. Antimicrob. Agents Chemother. 2005, 49, 2710–2715. [Google Scholar] [CrossRef]
- Melade, J.; Piorkowski, G.; Touret, F.; Fourie, T.; Driouich, J.S.; Cochin, M.; Bouzidi, H.S.; Coutard, B.; Nougairede, A.; de Lamballerie, X. A simple reverse genetics method to generate recombinant coronaviruses. EMBO Rep. 2022, 23, e53820. [Google Scholar] [CrossRef]
- Xie, X.; Lokugamage, K.G.; Zhang, X.; Vu, M.N.; Muruato, A.E.; Menachery, V.D.; Shi, P.Y. Engineering SARS-CoV-2 using a reverse genetic system. Nat. Protoc. 2021, 16, 1761–1784. [Google Scholar] [CrossRef]
- Amarilla, A.A.; Sng, J.D.J.; Parry, R.; Deerain, J.M.; Potter, J.R.; Setoh, Y.X.; Rawle, D.J.; Le, T.T.; Modhiran, N.; Wang, X.; et al. A versatile reverse genetics platform for SARS-CoV-2 and other positive-strand RNA viruses. Nat. Commun. 2021, 12, 3431. [Google Scholar] [CrossRef] [PubMed]
- Almazan, F.; Gonzalez, J.M.; Penzes, Z.; Izeta, A.; Calvo, E.; Plana-Duran, J.; Enjuanes, L. Engineering the largest RNA virus genome as an infectious bacterial artificial chromosome. Proc. Natl. Acad. Sci. USA 2000, 97, 5516–5521. [Google Scholar] [CrossRef] [PubMed]
- Adler, H.; Messerle, M.; Koszinowski, U.H. Cloning of herpesviral genomes as bacterial artificial chromosomes. Rev. Med. Virol. 2003, 13, 111–121. [Google Scholar] [CrossRef] [PubMed]
- Zhang, Y.; Buchholz, F.; Muyrers, J.P.; Stewart, A.F. A new logic for DNA engineering using recombination in Escherichia coli. Nat. Genet. 1998, 20, 123–128. [Google Scholar] [CrossRef] [PubMed]
- St-Jean, J.R.; Desforges, M.; Almazan, F.; Jacomy, H.; Enjuanes, L.; Talbot, P.J. Recovery of a neurovirulent human coronavirus OC43 from an infectious cDNA clone. J. Virol. 2006, 80, 3670–3674. [Google Scholar] [CrossRef]
- Almazan, F.; DeDiego, M.L.; Sola, I.; Zuniga, S.; Nieto-Torres, J.L.; Marquez-Jurado, S.; Andres, G.; Enjuanes, L. Engineering a replication-competent, propagation-defective Middle East respiratory syndrome coronavirus as a vaccine candidate. mBio 2013, 4, e00650-13. [Google Scholar] [CrossRef]
- Ye, C.; Chiem, K.; Park, J.G.; Oladunni, F.; Platt, R.N., II; Anderson, T.; Almazan, F.; de la Torre, J.C.; Martinez-Sobrido, L. Rescue of SARS-CoV-2 from a Single Bacterial Artificial Chromosome. mBio 2020, 11. [Google Scholar] [CrossRef]
- Herrmann, A.; Jungnickl, D.; Cordsmeier, A.; Peter, A.S.; Uberla, K.; Ensser, A. Cloning of a Passage-Free SARS-CoV-2 Genome and Mutagenesis Using Red Recombination. Int. J. Mol. Sci. 2021, 22, 10188. [Google Scholar] [CrossRef]
- Tischer, B.K.; von Einem, J.; Kaufer, B.; Osterrieder, N. Two-step red-mediated recombination for versatile high-efficiency markerless DNA manipulation in Escherichia coli. Biotechniques 2006, 40, 191–197. [Google Scholar] [CrossRef]
- Harvey, W.T.; Carabelli, A.M.; Jackson, B.; Gupta, R.K.; Thomson, E.C.; Harrison, E.M.; Ludden, C.; Reeve, R.; Rambaut, A.; Consortium, C.-G.U.; et al. SARS-CoV-2 variants, spike mutations and immune escape. Nat. Rev. Microbiol. 2021, 19, 409–424. [Google Scholar] [CrossRef]
- Tao, K.; Tzou, P.L.; Nouhin, J.; Gupta, R.K.; de Oliveira, T.; Kosakovsky Pond, S.L.; Fera, D.; Shafer, R.W. The biological and clinical significance of emerging SARS-CoV-2 variants. Nat. Rev. Genet. 2021, 22, 757–773. [Google Scholar] [CrossRef] [PubMed]
- Obermeyer, F.; Jankowiak, M.; Barkas, N.; Schaffner, S.F.; Pyle, J.D.; Yurkovetskiy, L.; Bosso, M.; Park, D.J.; Babadi, M.; MacInnis, B.L.; et al. Analysis of 6.4 million SARS-CoV-2 genomes identifies mutations associated with fitness. Science 2022, 376, 1327–1332. [Google Scholar] [CrossRef] [PubMed]
- Wu, H.; Xing, N.; Meng, K.; Fu, B.; Xue, W.; Dong, P.; Tang, W.; Xiao, Y.; Liu, G.; Luo, H.; et al. Nucleocapsid mutations R203K/G204R increase the infectivity, fitness, and virulence of SARS-CoV-2. Cell Host Microbe 2021, 29, 1788–1801.e1786. [Google Scholar] [CrossRef] [PubMed]
- Hemachudha, P.; Petcharat, S.; Ampoot, W.; Ponpinit, T.; Paitoonpong, L.; Hemachudha, T. Genetic variations from successive whole genome sequencing during COVID-19 treatment in five individuals. New Microbes New Infect. 2022, 45, 100950. [Google Scholar] [CrossRef]
- Ichikawa, T.; Torii, S.; Suzuki, H.; Takada, A.; Suzuki, S.; Nakajima, M.; Tampo, A.; Kakinoki, Y. Mutations in the nonstructural proteins of SARS-CoV-2 may contribute to adverse clinical outcome in patients with COVID-19. Int. J. Infect. Dis. 2022, 122, 123–129. [Google Scholar] [CrossRef]
- McGrath, M.E.; Xue, Y.; Dillen, C.; Oldfield, L.; Assad-Garcia, N.; Zaveri, J.; Singh, N.; Baracco, L.; Taylor, L.J.; Vashee, S.; et al. SARS-CoV-2 variant spike and accessory gene mutations alter pathogenesis. Proc. Natl. Acad. Sci. USA 2022, 119, e2204717119. [Google Scholar] [CrossRef]
- Korber, B.; Fischer, W.M.; Gnanakaran, S.; Yoon, H.; Theiler, J.; Abfalterer, W.; Hengartner, N.; Giorgi, E.E.; Bhattacharya, T.; Foley, B.; et al. Tracking Changes in SARS-CoV-2 Spike: Evidence that D614G Increases Infectivity of the COVID-19 Virus. Cell 2020, 182, 812–827.e819. [Google Scholar] [CrossRef]
- Dhar, M.S.; Marwal, R.; Vs, R.; Ponnusamy, K.; Jolly, B.; Bhoyar, R.C.; Sardana, V.; Naushin, S.; Rophina, M.; Mellan, T.A.; et al. Genomic characterization and epidemiology of an emerging SARS-CoV-2 variant in Delhi, India. Science 2021, 374, 995–999. [Google Scholar] [CrossRef]
- The Scientific Pandemic Influenza Group on Modelling, Operational sub-group (SPI-M-O). Consensus Statement on COVID-19. Available online: https://assets.publishing.service.gov.uk/government/uploads/system/uploads/attachment_data/file/993321/S1267_SPI-M-O_Consensus_Statement.pdf (accessed on 2 June 2021).
- Wilhelm, A.; Toptan, T.; Pallas, C.; Wolf, T.; Goetsch, U.; Gottschalk, R.; Vehreschild, M.; Ciesek, S.; Widera, M. Antibody-Mediated Neutralization of Authentic SARS-CoV-2 B.1.617 Variants Harboring L452R and T478K/E484Q. Viruses 2021, 13, 1693. [Google Scholar] [CrossRef]
- Planas, D.; Veyer, D.; Baidaliuk, A.; Staropoli, I.; Guivel-Benhassine, F.; Rajah, M.M.; Planchais, C.; Porrot, F.; Robillard, N.; Puech, J.; et al. Reduced sensitivity of SARS-CoV-2 variant Delta to antibody neutralization. Nature 2021, 596, 276–280. [Google Scholar] [CrossRef]
- Tada, T.; Zhou, H.; Dcosta, B.M.; Samanovic, M.I.; Mulligan, M.J.; Landau, N.R. Partial resistance of SARS-CoV-2 Delta variants to vaccine-elicited antibodies and convalescent sera. iScience 2021, 24, 103341. [Google Scholar] [CrossRef] [PubMed]
- Nie, J.; Li, Q.; Wu, J.; Zhao, C.; Hao, H.; Liu, H.; Zhang, L.; Nie, L.; Qin, H.; Wang, M.; et al. Quantification of SARS-CoV-2 neutralizing antibody by a pseudotyped virus-based assay. Nat. Protoc. 2020, 15, 3699–3715. [Google Scholar] [CrossRef] [PubMed]
- Bewley, K.R.; Coombes, N.S.; Gagnon, L.; McInroy, L.; Baker, N.; Shaik, I.; St-Jean, J.R.; St-Amant, N.; Buttigieg, K.R.; Humphries, H.E.; et al. Quantification of SARS-CoV-2 neutralizing antibody by wild-type plaque reduction neutralization, microneutralization and pseudotyped virus neutralization assays. Nat. Protoc. 2021, 16, 3114–3140. [Google Scholar] [CrossRef] [PubMed]
- Widera, M.; Muhlemann, B.; Corman, V.M.; Toptan, T.; Beheim-Schwarzbach, J.; Kohmer, N.; Schneider, J.; Berger, A.; Veith, T.; Pallas, C.; et al. Surveillance of SARS-CoV-2 in Frankfurt am Main from October to December 2020 Reveals High Viral Diversity Including Spike Mutation N501Y in B.1.1.70 and B.1.1.7. Microorganisms 2021, 9, 748. [Google Scholar] [CrossRef]
- Cinatl, J., Jr.; Hoever, G.; Morgenstern, B.; Preiser, W.; Vogel, J.U.; Hofmann, W.K.; Bauer, G.; Michaelis, M.; Rabenau, H.F.; Doerr, H.W. Infection of cultured intestinal epithelial cells with severe acute respiratory syndrome coronavirus. Cell Mol. Life Sci. 2004, 61, 2100–2112. [Google Scholar] [CrossRef]
- Widera, M.; Wilhelm, A.; Toptan, T.; Raffel, J.M.; Kowarz, E.; Roesmann, F.; Grozinger, F.; Siemund, A.L.; Luciano, V.; Kulp, M.; et al. Generation of a Sleeping Beauty Transposon-Based Cellular System for Rapid and Sensitive Screening for Compounds and Cellular Factors Limiting SARS-CoV-2 Replication. Front. Microbiol. 2021, 12, 701198. [Google Scholar] [CrossRef]
- Toptan, T.; Hoehl, S.; Westhaus, S.; Bojkova, D.; Berger, A.; Rotter, B.; Hoffmeier, K.; Cinatl, J., Jr.; Ciesek, S.; Widera, M. Optimized qRT-PCR Approach for the Detection of Intra- and Extra-Cellular SARS-CoV-2 RNAs. Int. J. Mol. Sci. 2020, 21, 4396. [Google Scholar] [CrossRef]
- Widera, M.; Westhaus, S.; Rabenau, H.F.; Hoehl, S.; Bojkova, D.; Cinatl, J., Jr.; Ciesek, S. Evaluation of stability and inactivation methods of SARS-CoV-2 in context of laboratory settings. Med. Microbiol. Immunol. 2021, 210, 235–244. [Google Scholar] [CrossRef]
- Tischer, B.K.; Smith, G.A.; Osterrieder, N. En passant mutagenesis: A two step markerless red recombination system. Methods Mol. Biol. 2010, 634, 421–430. [Google Scholar] [CrossRef]
- Wick, R.R.; Judd, L.M.; Holt, K.E. Performance of neural network basecalling tools for Oxford Nanopore sequencing. Genome Biol. 2019, 20, 129. [Google Scholar] [CrossRef] [Green Version]
- Li, H. Minimap2: Pairwise alignment for nucleotide sequences. Bioinformatics 2018, 34, 3094–3100. [Google Scholar] [CrossRef] [PubMed]
- Thorvaldsdottir, H.; Robinson, J.T.; Mesirov, J.P. Integrative Genomics Viewer (IGV): High-performance genomics data visualization and exploration. Brief Bioinform. 2013, 14, 178–192. [Google Scholar] [CrossRef] [PubMed]
- Davis, B.; Dulbecco, R.; Eisen, H.; Ginsberg, H.; Wood, W. Nature of viruses. In Microbiology; Harper and Row: New York, NY, USA, 1972; pp. 1044–1053. [Google Scholar]
- Hoffmann, M.; Kleine-Weber, H.; Pohlmann, S. A Multibasic Cleavage Site in the Spike Protein of SARS-CoV-2 Is Essential for Infection of Human Lung Cells. Mol. Cell 2020, 78, 779–784.e775. [Google Scholar] [CrossRef] [PubMed]
- Matsuyama, S.; Nagata, N.; Shirato, K.; Kawase, M.; Takeda, M.; Taguchi, F. Efficient activation of the severe acute respiratory syndrome coronavirus spike protein by the transmembrane protease TMPRSS2. J. Virol. 2010, 84, 12658–12664. [Google Scholar] [CrossRef]
- Qian, Z.; Dominguez, S.R.; Holmes, K.V. Role of the spike glycoprotein of human Middle East respiratory syndrome coronavirus (MERS-CoV) in virus entry and syncytia formation. PLoS ONE 2013, 8, e76469. [Google Scholar] [CrossRef]
- Bussani, R.; Schneider, E.; Zentilin, L.; Collesi, C.; Ali, H.; Braga, L.; Volpe, M.C.; Colliva, A.; Zanconati, F.; Berlot, G.; et al. Persistence of viral RNA, pneumocyte syncytia and thrombosis are hallmarks of advanced COVID-19 pathology. EBioMedicine 2020, 61, 103104. [Google Scholar] [CrossRef]
- Rajah, M.M.; Bernier, A.; Buchrieser, J.; Schwartz, O. The Mechanism and Consequences of SARS-CoV-2 Spike-Mediated Fusion and Syncytia Formation. J. Mol. Biol. 2022, 434, 167280. [Google Scholar] [CrossRef]
- Plante, J.A.; Liu, Y.; Liu, J.; Xia, H.; Johnson, B.A.; Lokugamage, K.G.; Zhang, X.; Muruato, A.E.; Zou, J.; Fontes-Garfias, C.R.; et al. Spike mutation D614G alters SARS-CoV-2 fitness. Nature 2021, 592, 116–121. [Google Scholar] [CrossRef]
- Fischer, W.A., II; Eron, J.J., Jr.; Holman, W.; Cohen, M.S.; Fang, L.; Szewczyk, L.J.; Sheahan, T.P.; Baric, R.; Mollan, K.R.; Wolfe, C.R.; et al. A phase 2a clinical trial of molnupiravir in patients with COVID-19 shows accelerated SARS-CoV-2 RNA clearance and elimination of infectious virus. Sci. Transl. Med. 2022, 14, eabl7430. [Google Scholar] [CrossRef]
- Mohammad, A.; Al-Mulla, F.; Wei, D.-Q.; Abubaker, J. Remdesivir MD Simulations Suggest a More Favourable Binding to SARS-CoV-2 RNA Dependent RNA Polymerase Mutant P323L Than Wild-Type. Biomolecules 2021, 11, 919. [Google Scholar] [CrossRef]
- Hempel, T.; Raich, L.; Olsson, S.; Azouz, N.P.; Klingler, A.M.; Hoffmann, M.; Pöhlmann, S.; Rothenberg, M.E.; Noé, F. Molecular mechanism of inhibiting the SARS-CoV-2 cell entry facilitator TMPRSS2 with camostat and nafamostat. Chem. Sci. 2021, 12, 983–992. [Google Scholar] [CrossRef] [PubMed]
- WHO. Molecular Assays to Diagnose COVID-19: Summary Table of Available Protocols; WHO: Geneva, Switzerland, 2020. [Google Scholar]


Publisher’s Note: MDPI stays neutral with regard to jurisdictional claims in published maps and institutional affiliations. |
© 2022 by the authors. Licensee MDPI, Basel, Switzerland. This article is an open access article distributed under the terms and conditions of the Creative Commons Attribution (CC BY) license (https://creativecommons.org/licenses/by/4.0/).
Share and Cite
Veleanu, A.; Kelch, M.A.; Ye, C.; Flohr, M.; Wilhelm, A.; Widera, M.; Martinez-Sobrido, L.; Ciesek, S.; Toptan, T. Molecular Analyses of Clinical Isolates and Recombinant SARS-CoV-2 Carrying B.1 and B.1.617.2 Spike Mutations Suggest a Potential Role of Non-Spike Mutations in Infection Kinetics. Viruses 2022, 14, 2017. https://doi.org/10.3390/v14092017
Veleanu A, Kelch MA, Ye C, Flohr M, Wilhelm A, Widera M, Martinez-Sobrido L, Ciesek S, Toptan T. Molecular Analyses of Clinical Isolates and Recombinant SARS-CoV-2 Carrying B.1 and B.1.617.2 Spike Mutations Suggest a Potential Role of Non-Spike Mutations in Infection Kinetics. Viruses. 2022; 14(9):2017. https://doi.org/10.3390/v14092017
Chicago/Turabian StyleVeleanu, Andrei, Maximilian A. Kelch, Chengjin Ye, Melanie Flohr, Alexander Wilhelm, Marek Widera, Luis Martinez-Sobrido, Sandra Ciesek, and Tuna Toptan. 2022. "Molecular Analyses of Clinical Isolates and Recombinant SARS-CoV-2 Carrying B.1 and B.1.617.2 Spike Mutations Suggest a Potential Role of Non-Spike Mutations in Infection Kinetics" Viruses 14, no. 9: 2017. https://doi.org/10.3390/v14092017