Effects of Moloney Leukemia Virus 10 Protein on Hepatitis B Virus Infection and Viral Replication

 , and
, and 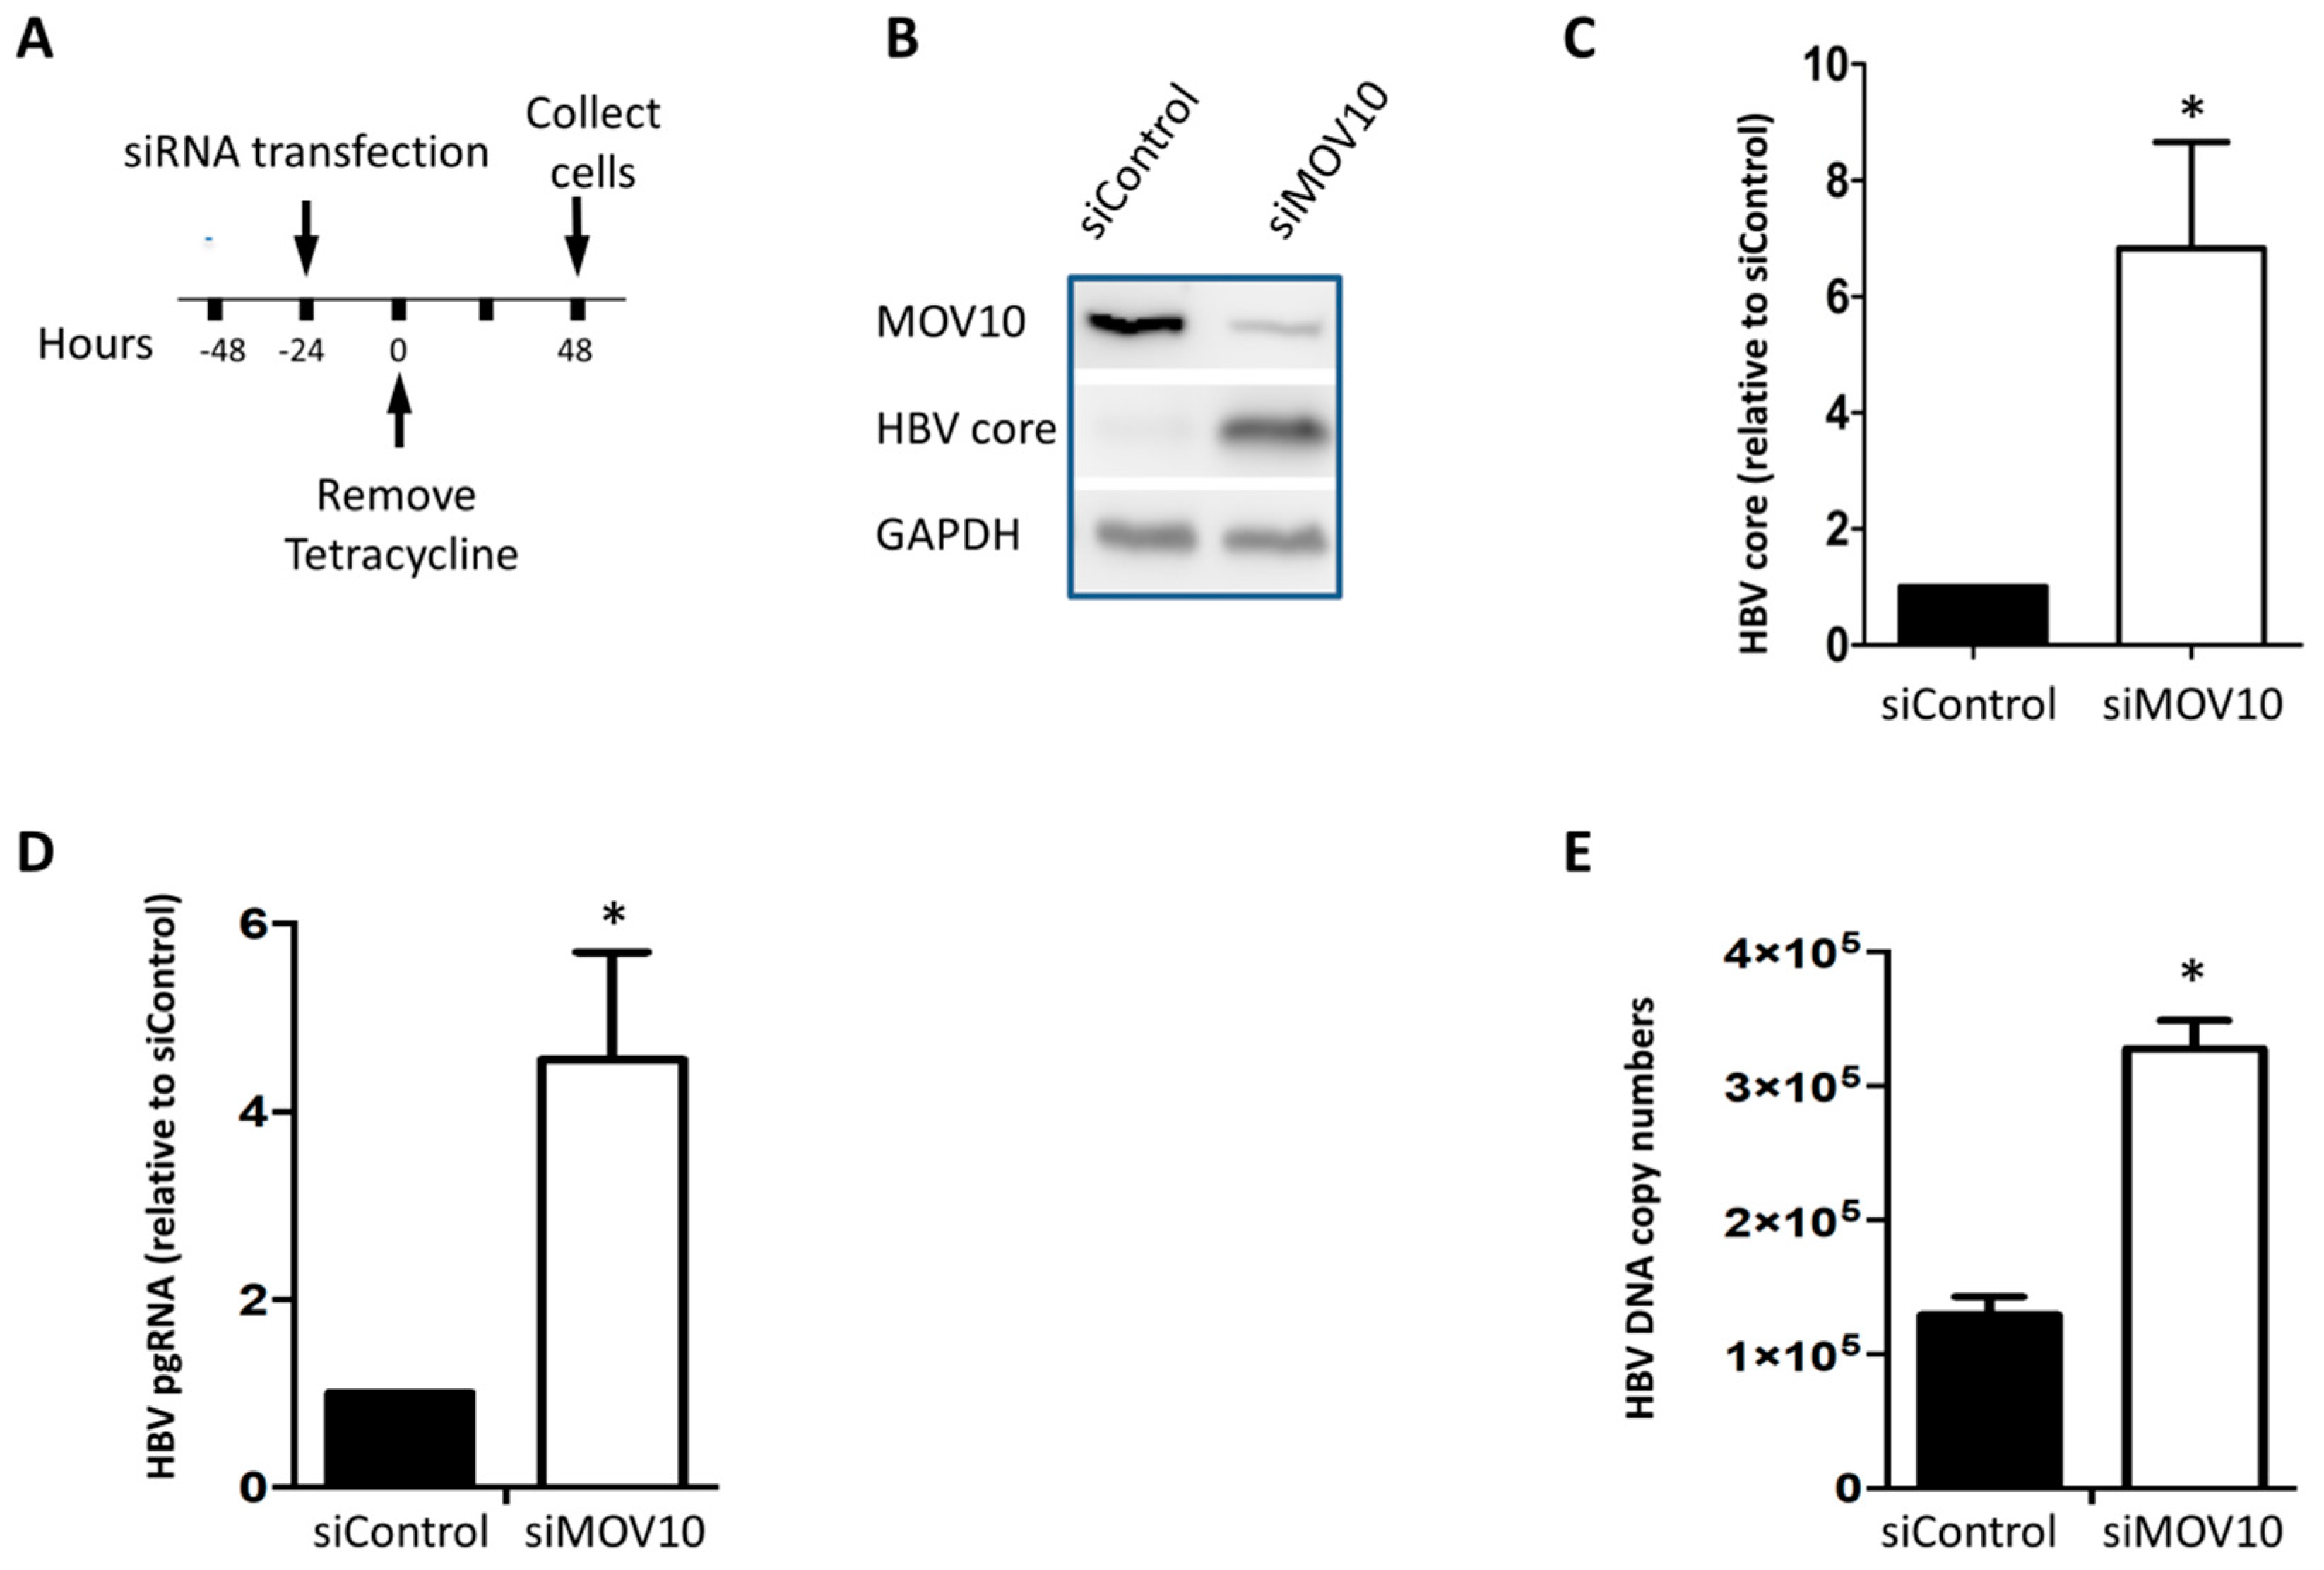
Abstract
:1. Introduction
2. Materials and Methods
2.1. Cell Lines
2.2. Plasmids
2.3. Virus Production and Infection
2.4. Generation of Stable Cell Lines with MOV10 Knocked Out, Down-Regulated, or Over-Expressed
2.5. Transfection
2.6. qPCR Analysis of HBV DNA
2.7. Quantification of HBV pgRNA
2.8. Western Blotting
2.9. RNA-Immunoprecipitation
2.10. Co-Immunoprecipitation
2.11. Statistics
3. Results
3.1. Down-Regulation of MOV10 Enhances HBV Gene Expression in HepAD38 Cells
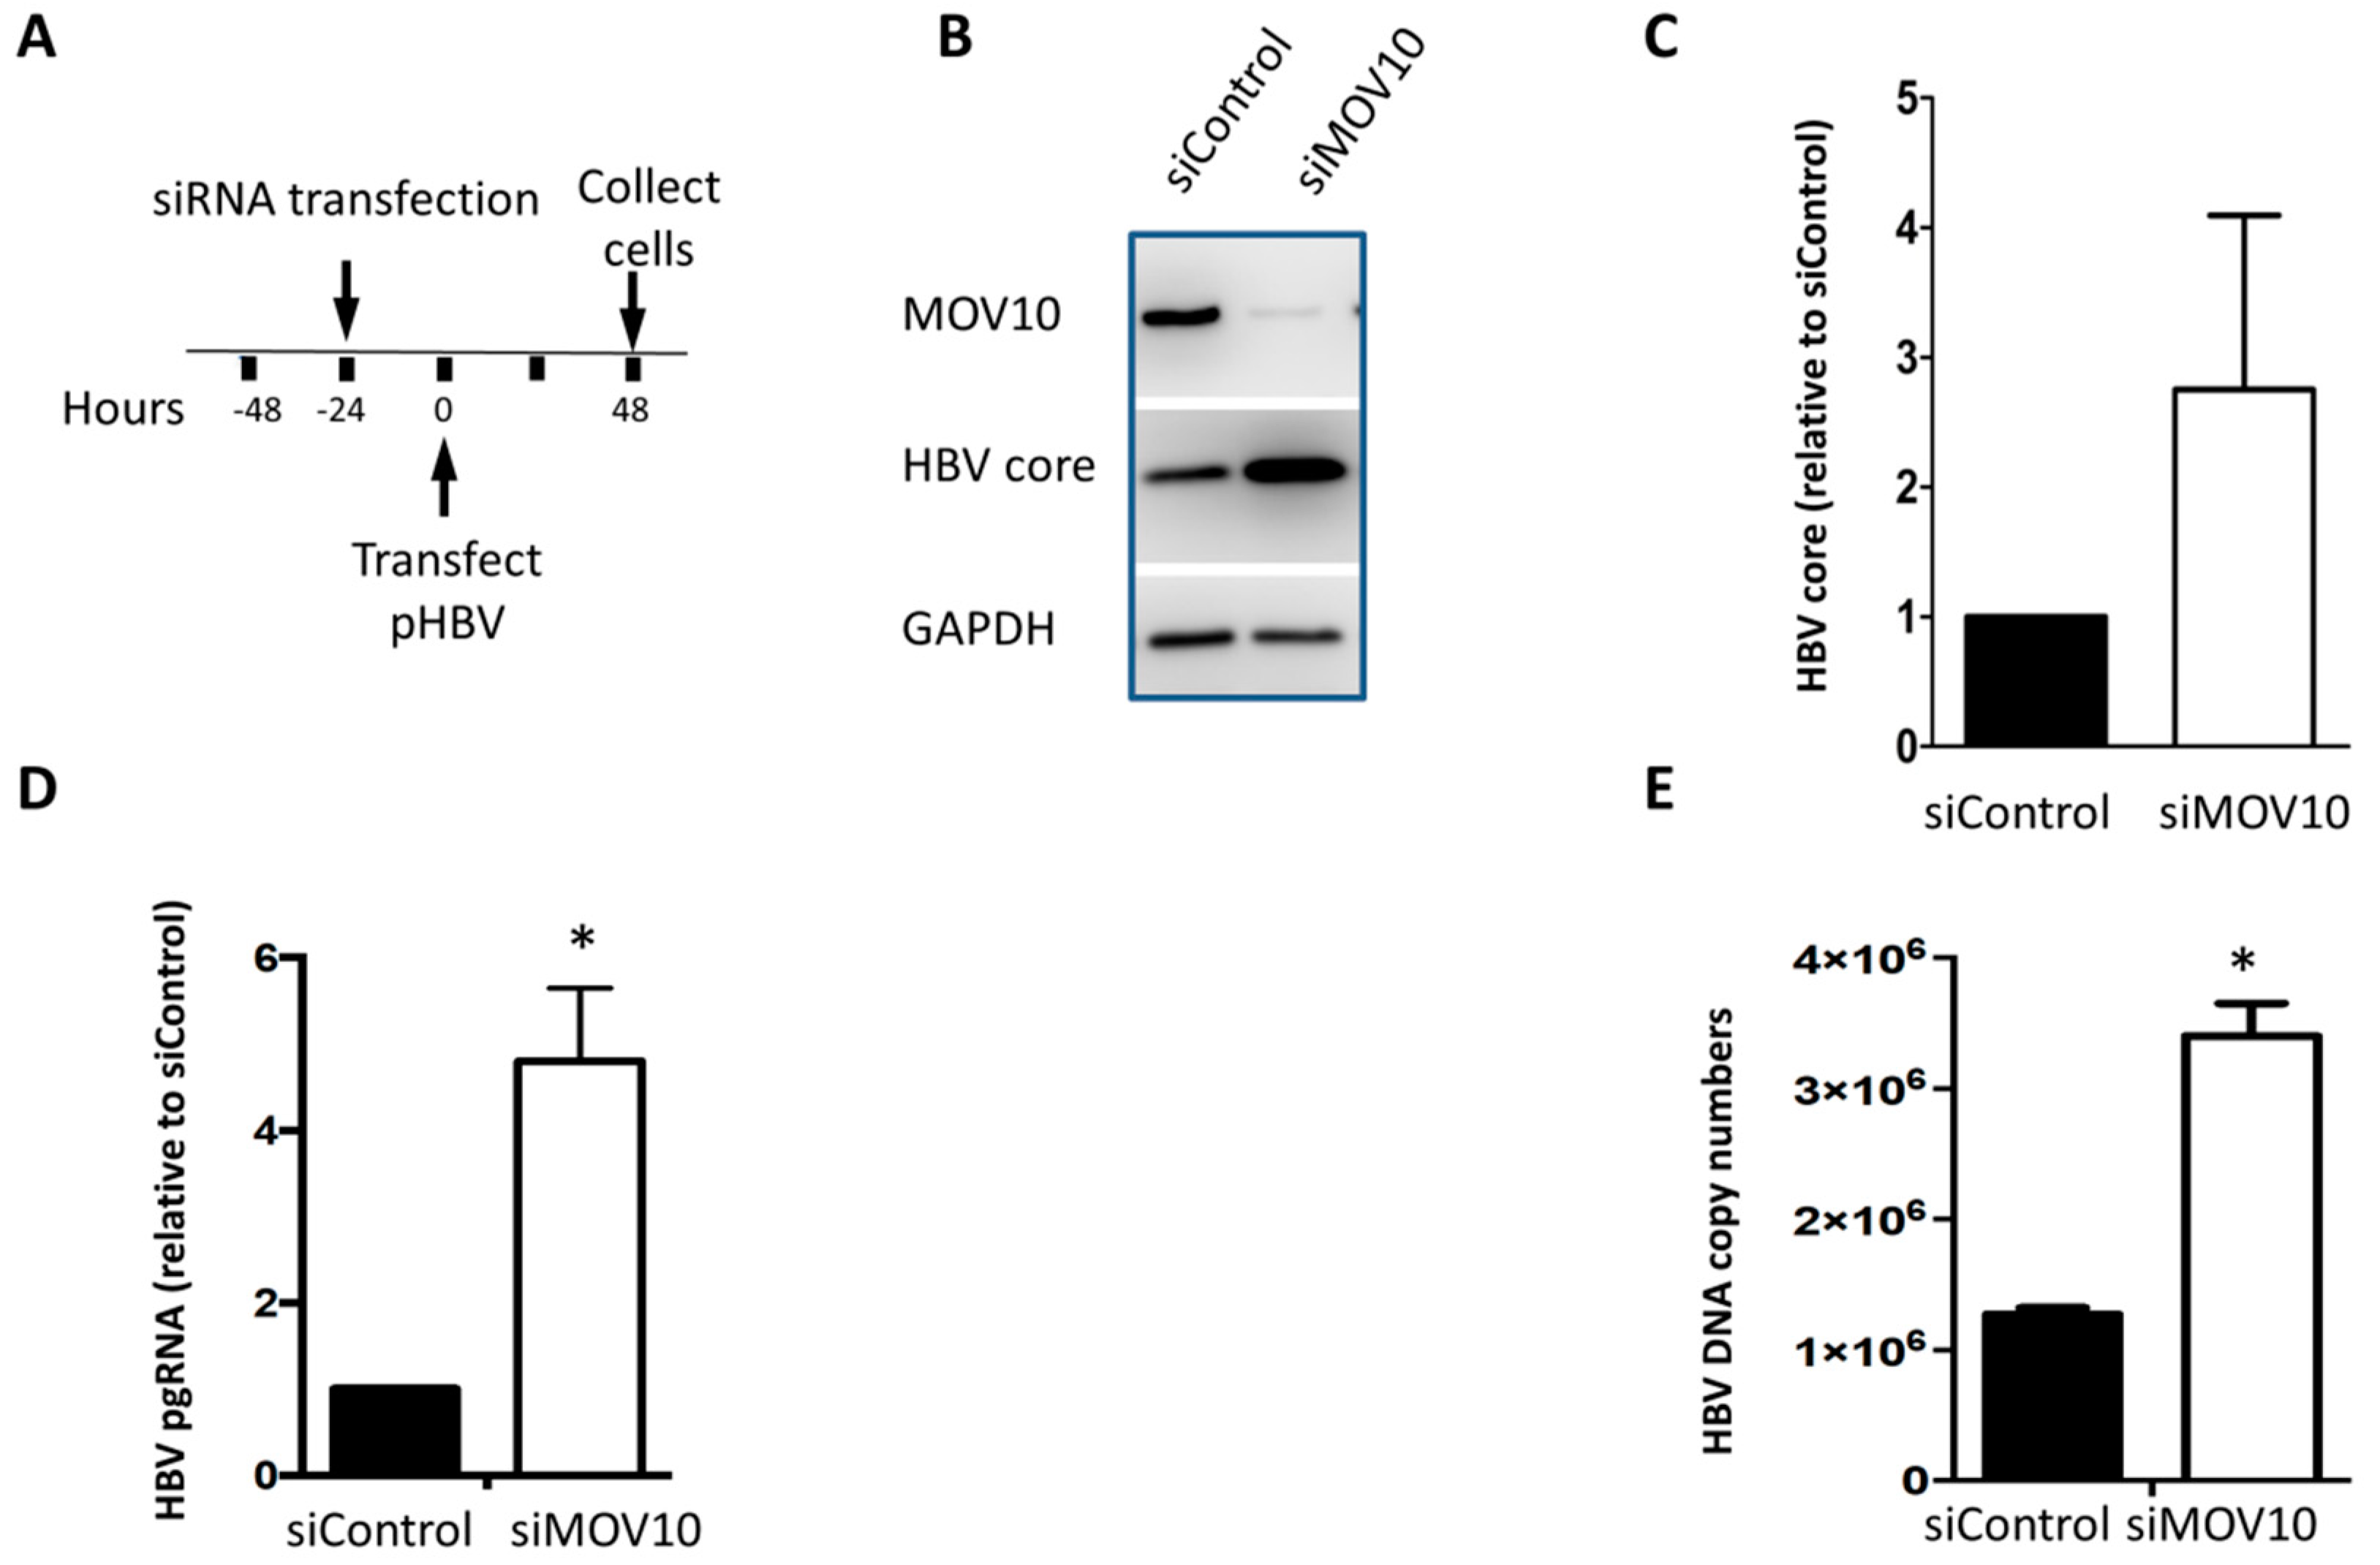
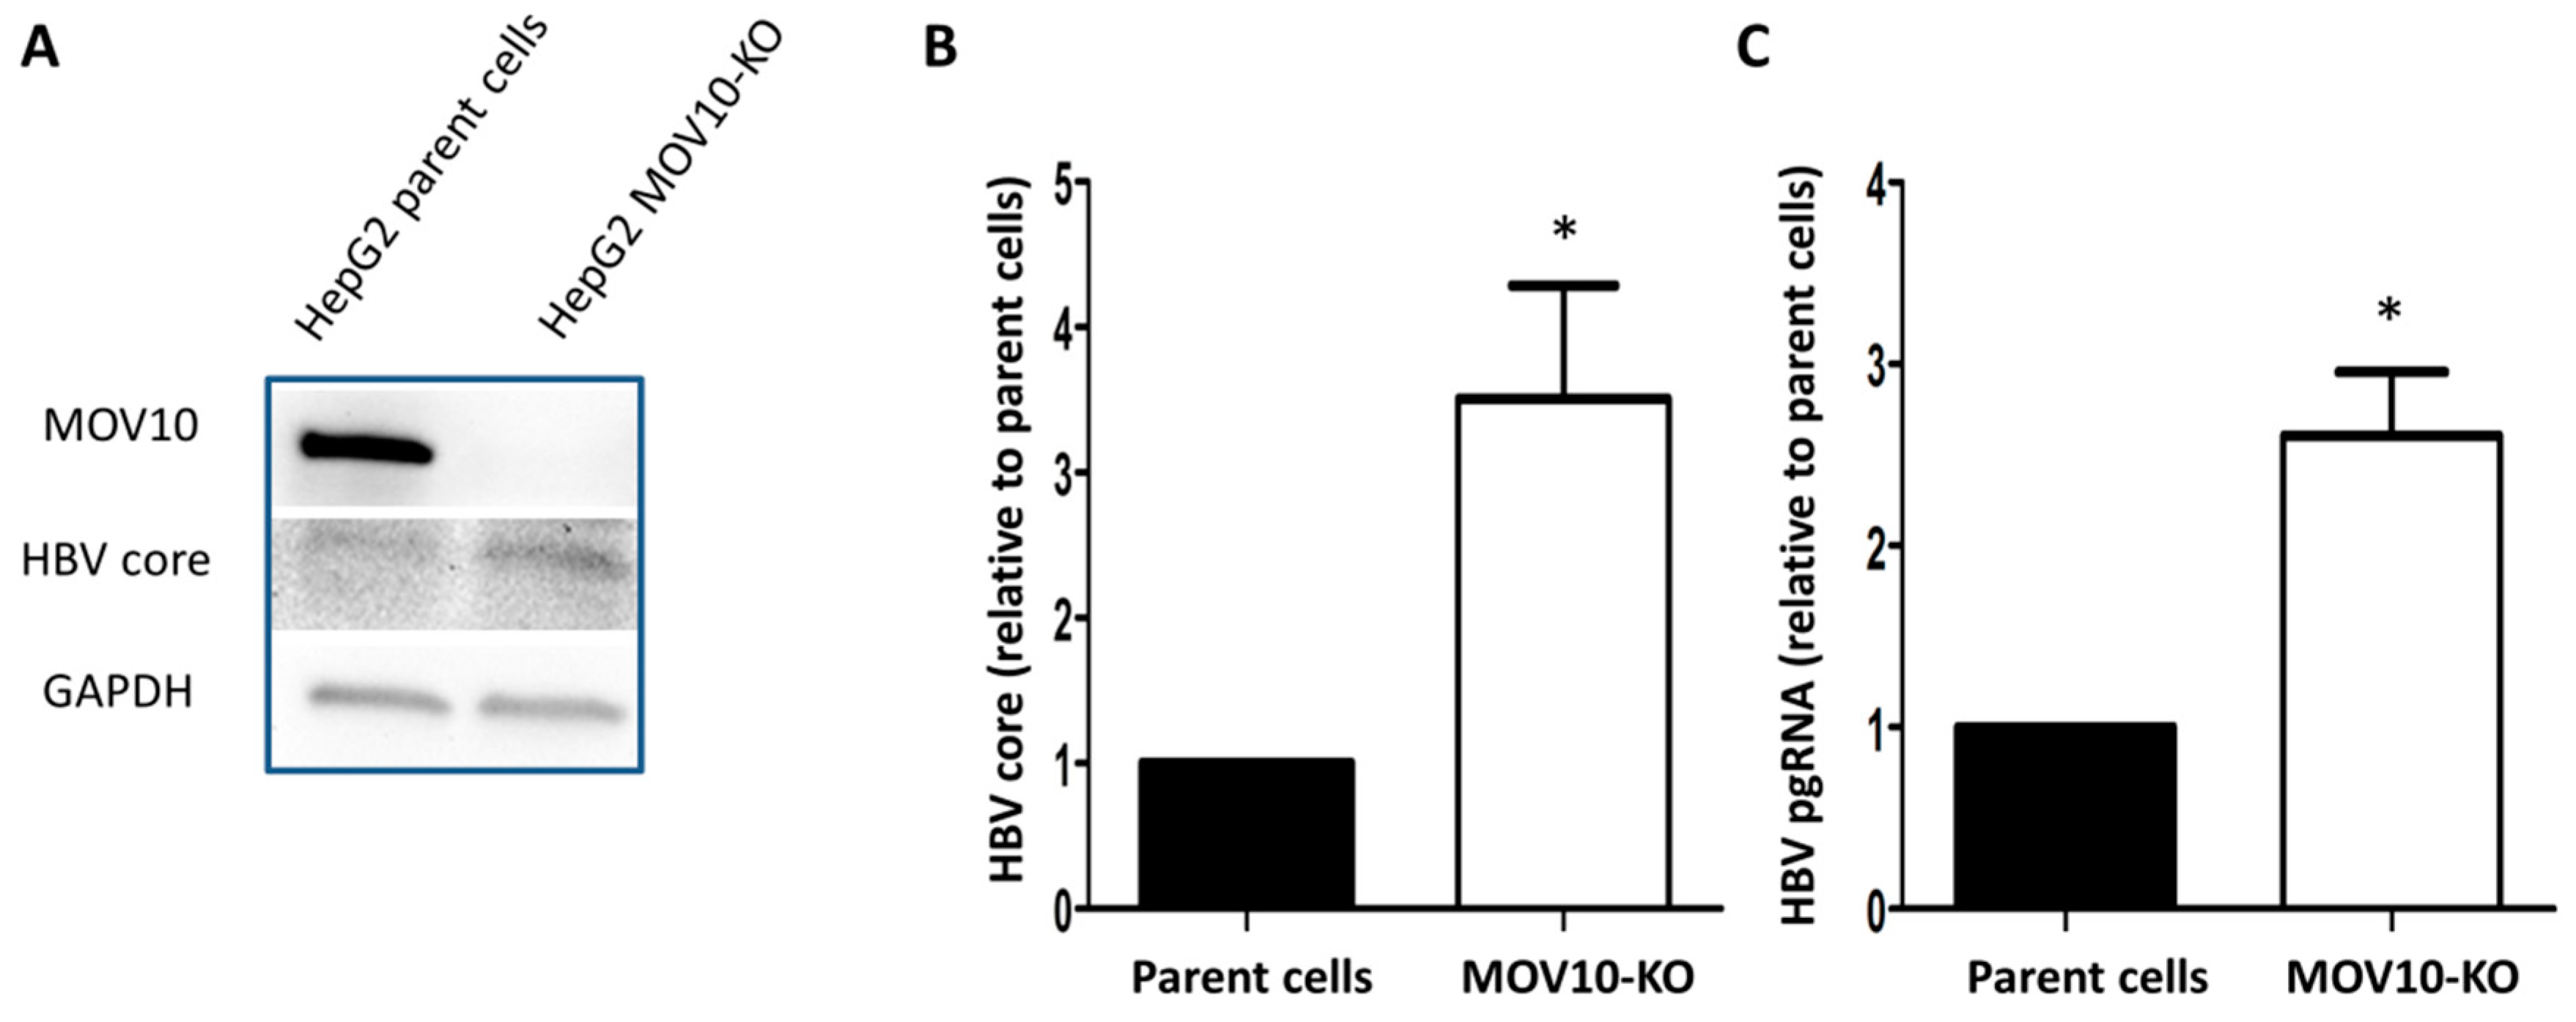
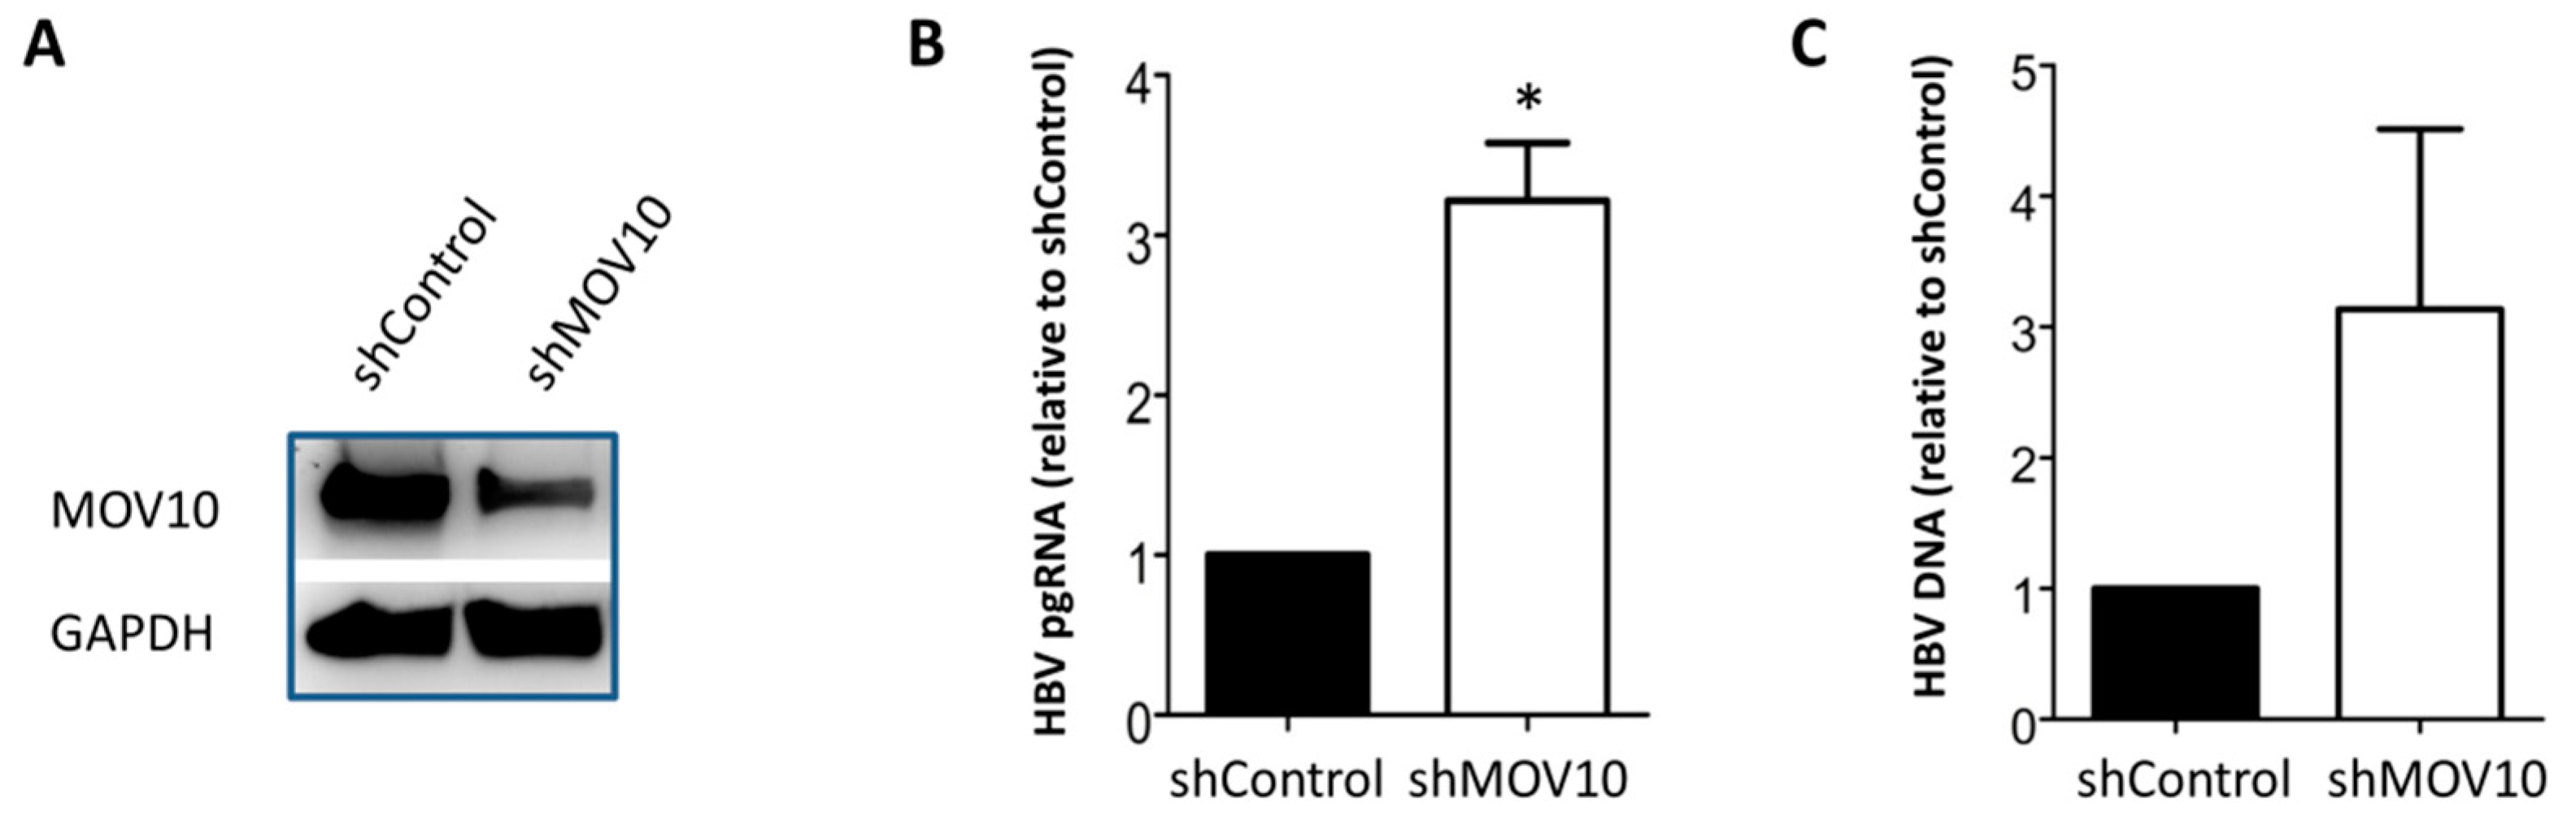
3.2. Down-Regulation of MOV10 Enhances HBV Gene Expression in HBV-Transfected HepG2 Cells
3.3. Down-Regulation of MOV10 Enhances HBV Infection of HepG2-NTCP-C7 Cells
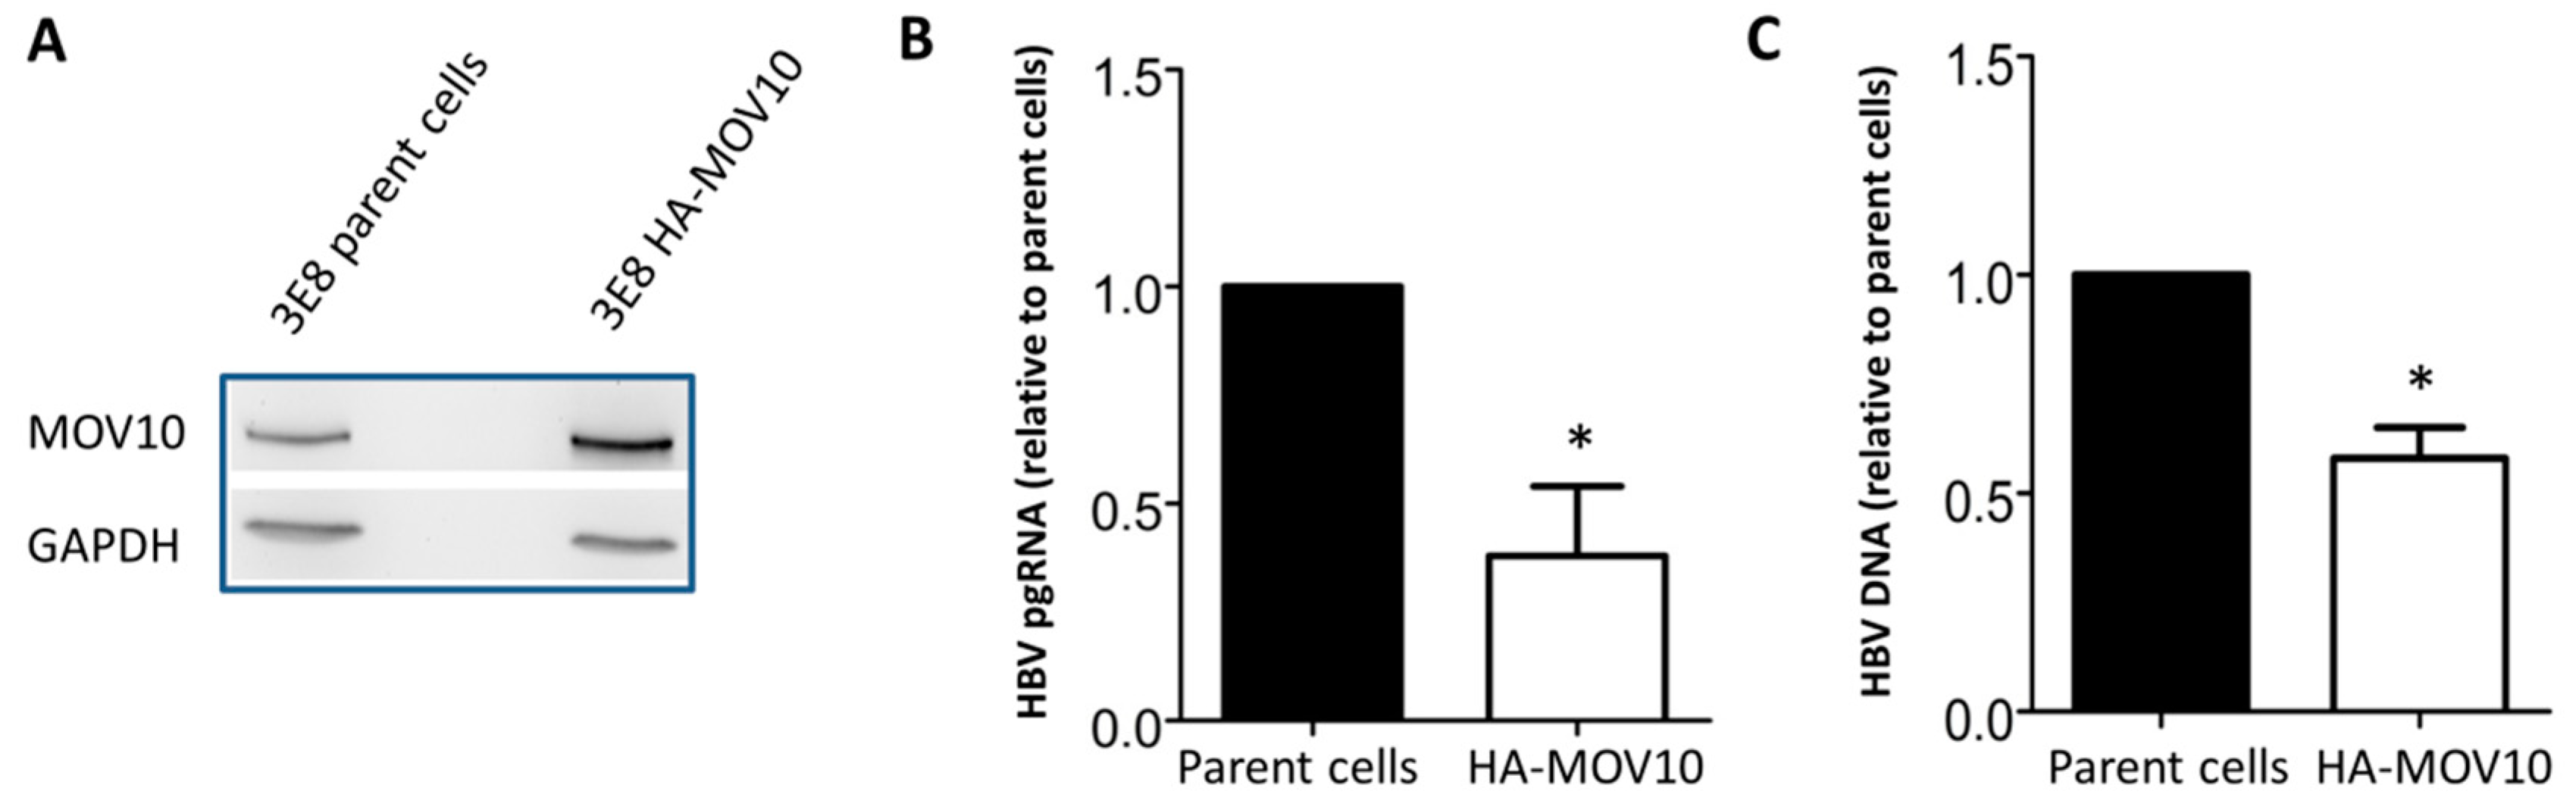
3.4. Over-Expression of MOV10 Diminishes HBV Infection of HepG2-NTCP-3E8 Cells
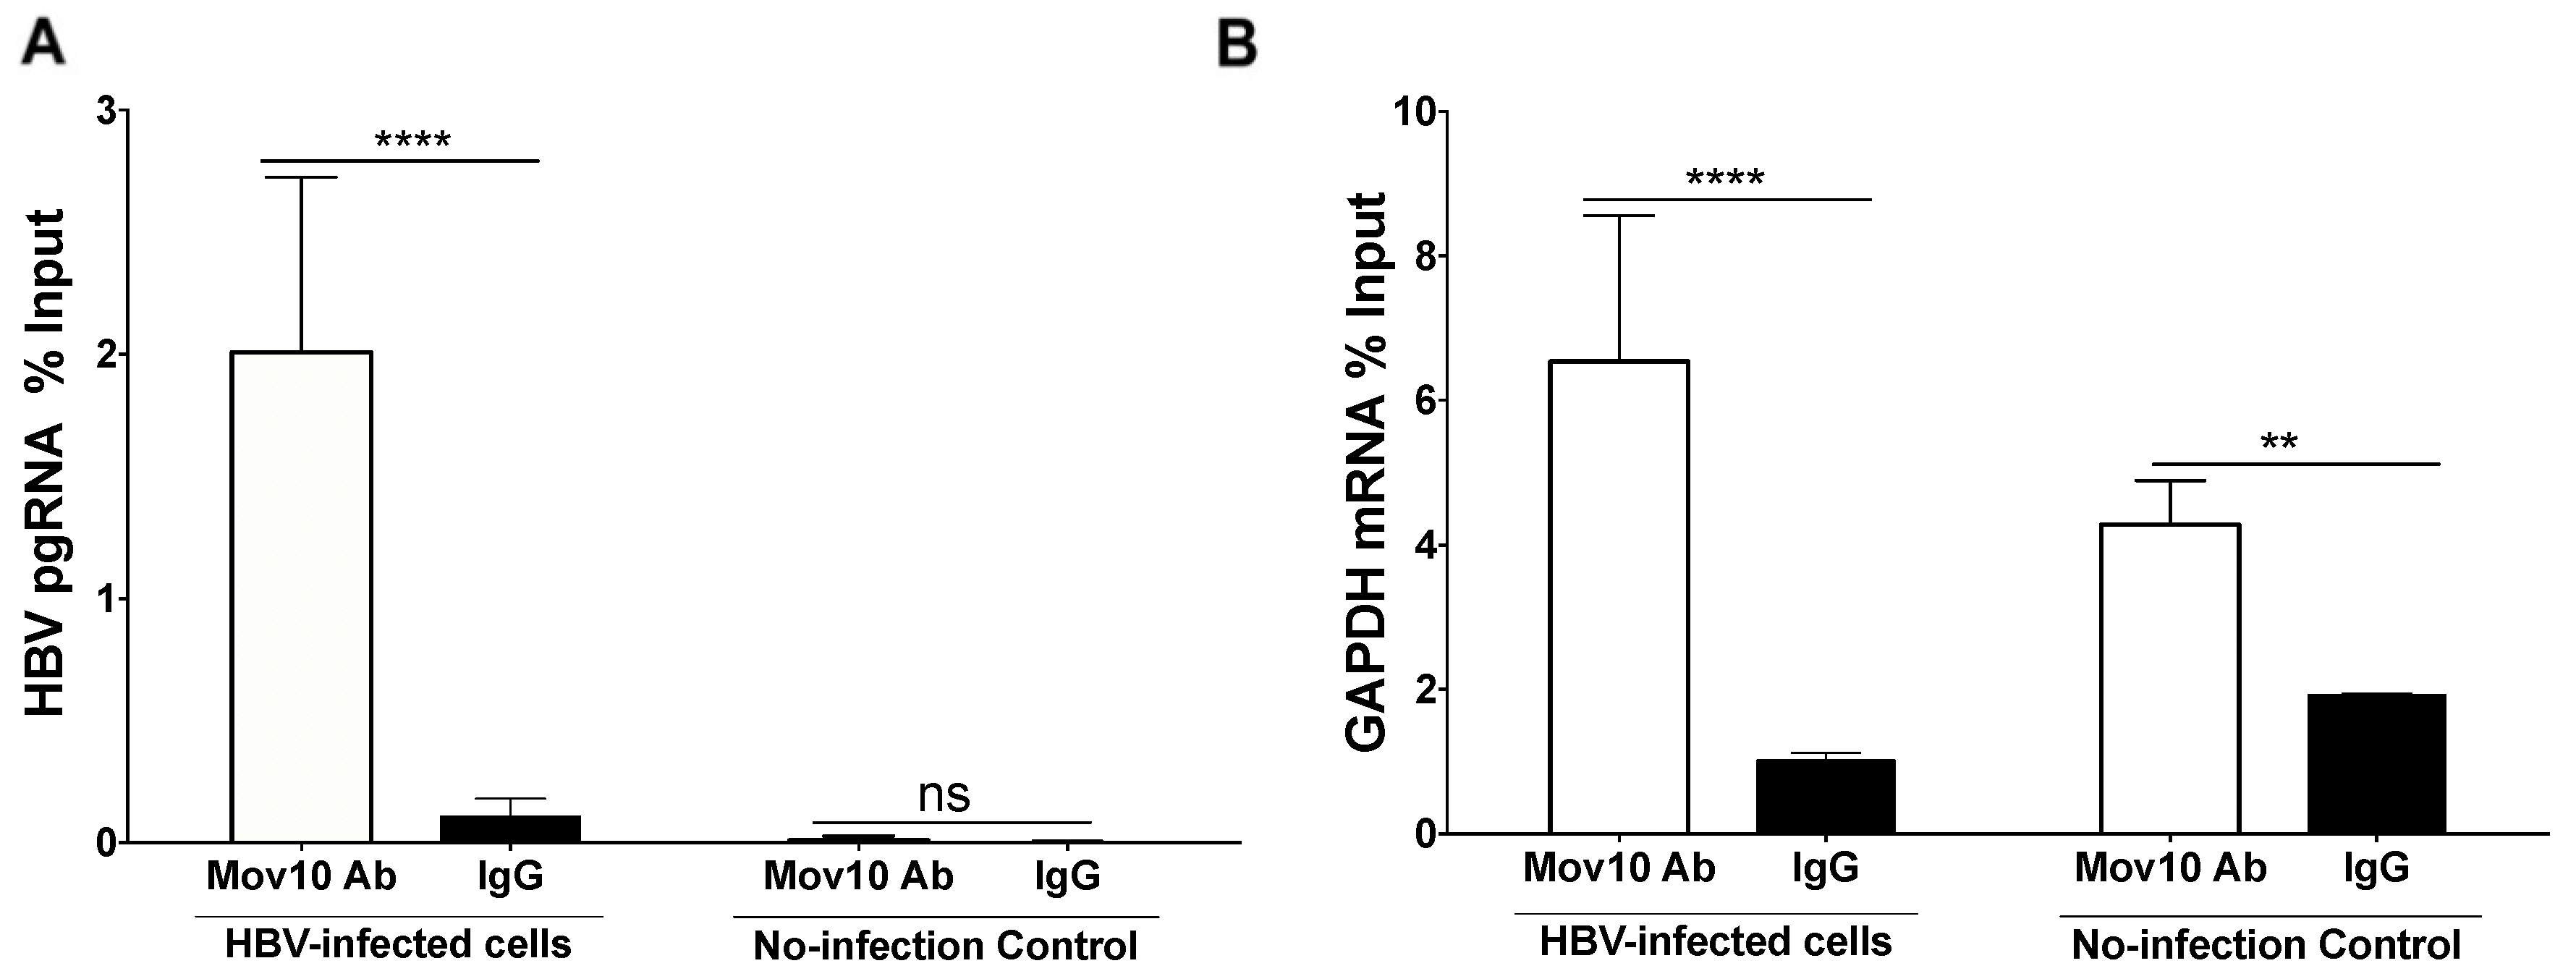
3.5. HBV Pre-Genomic RNA Co-Immunoprecipitated with MOV10
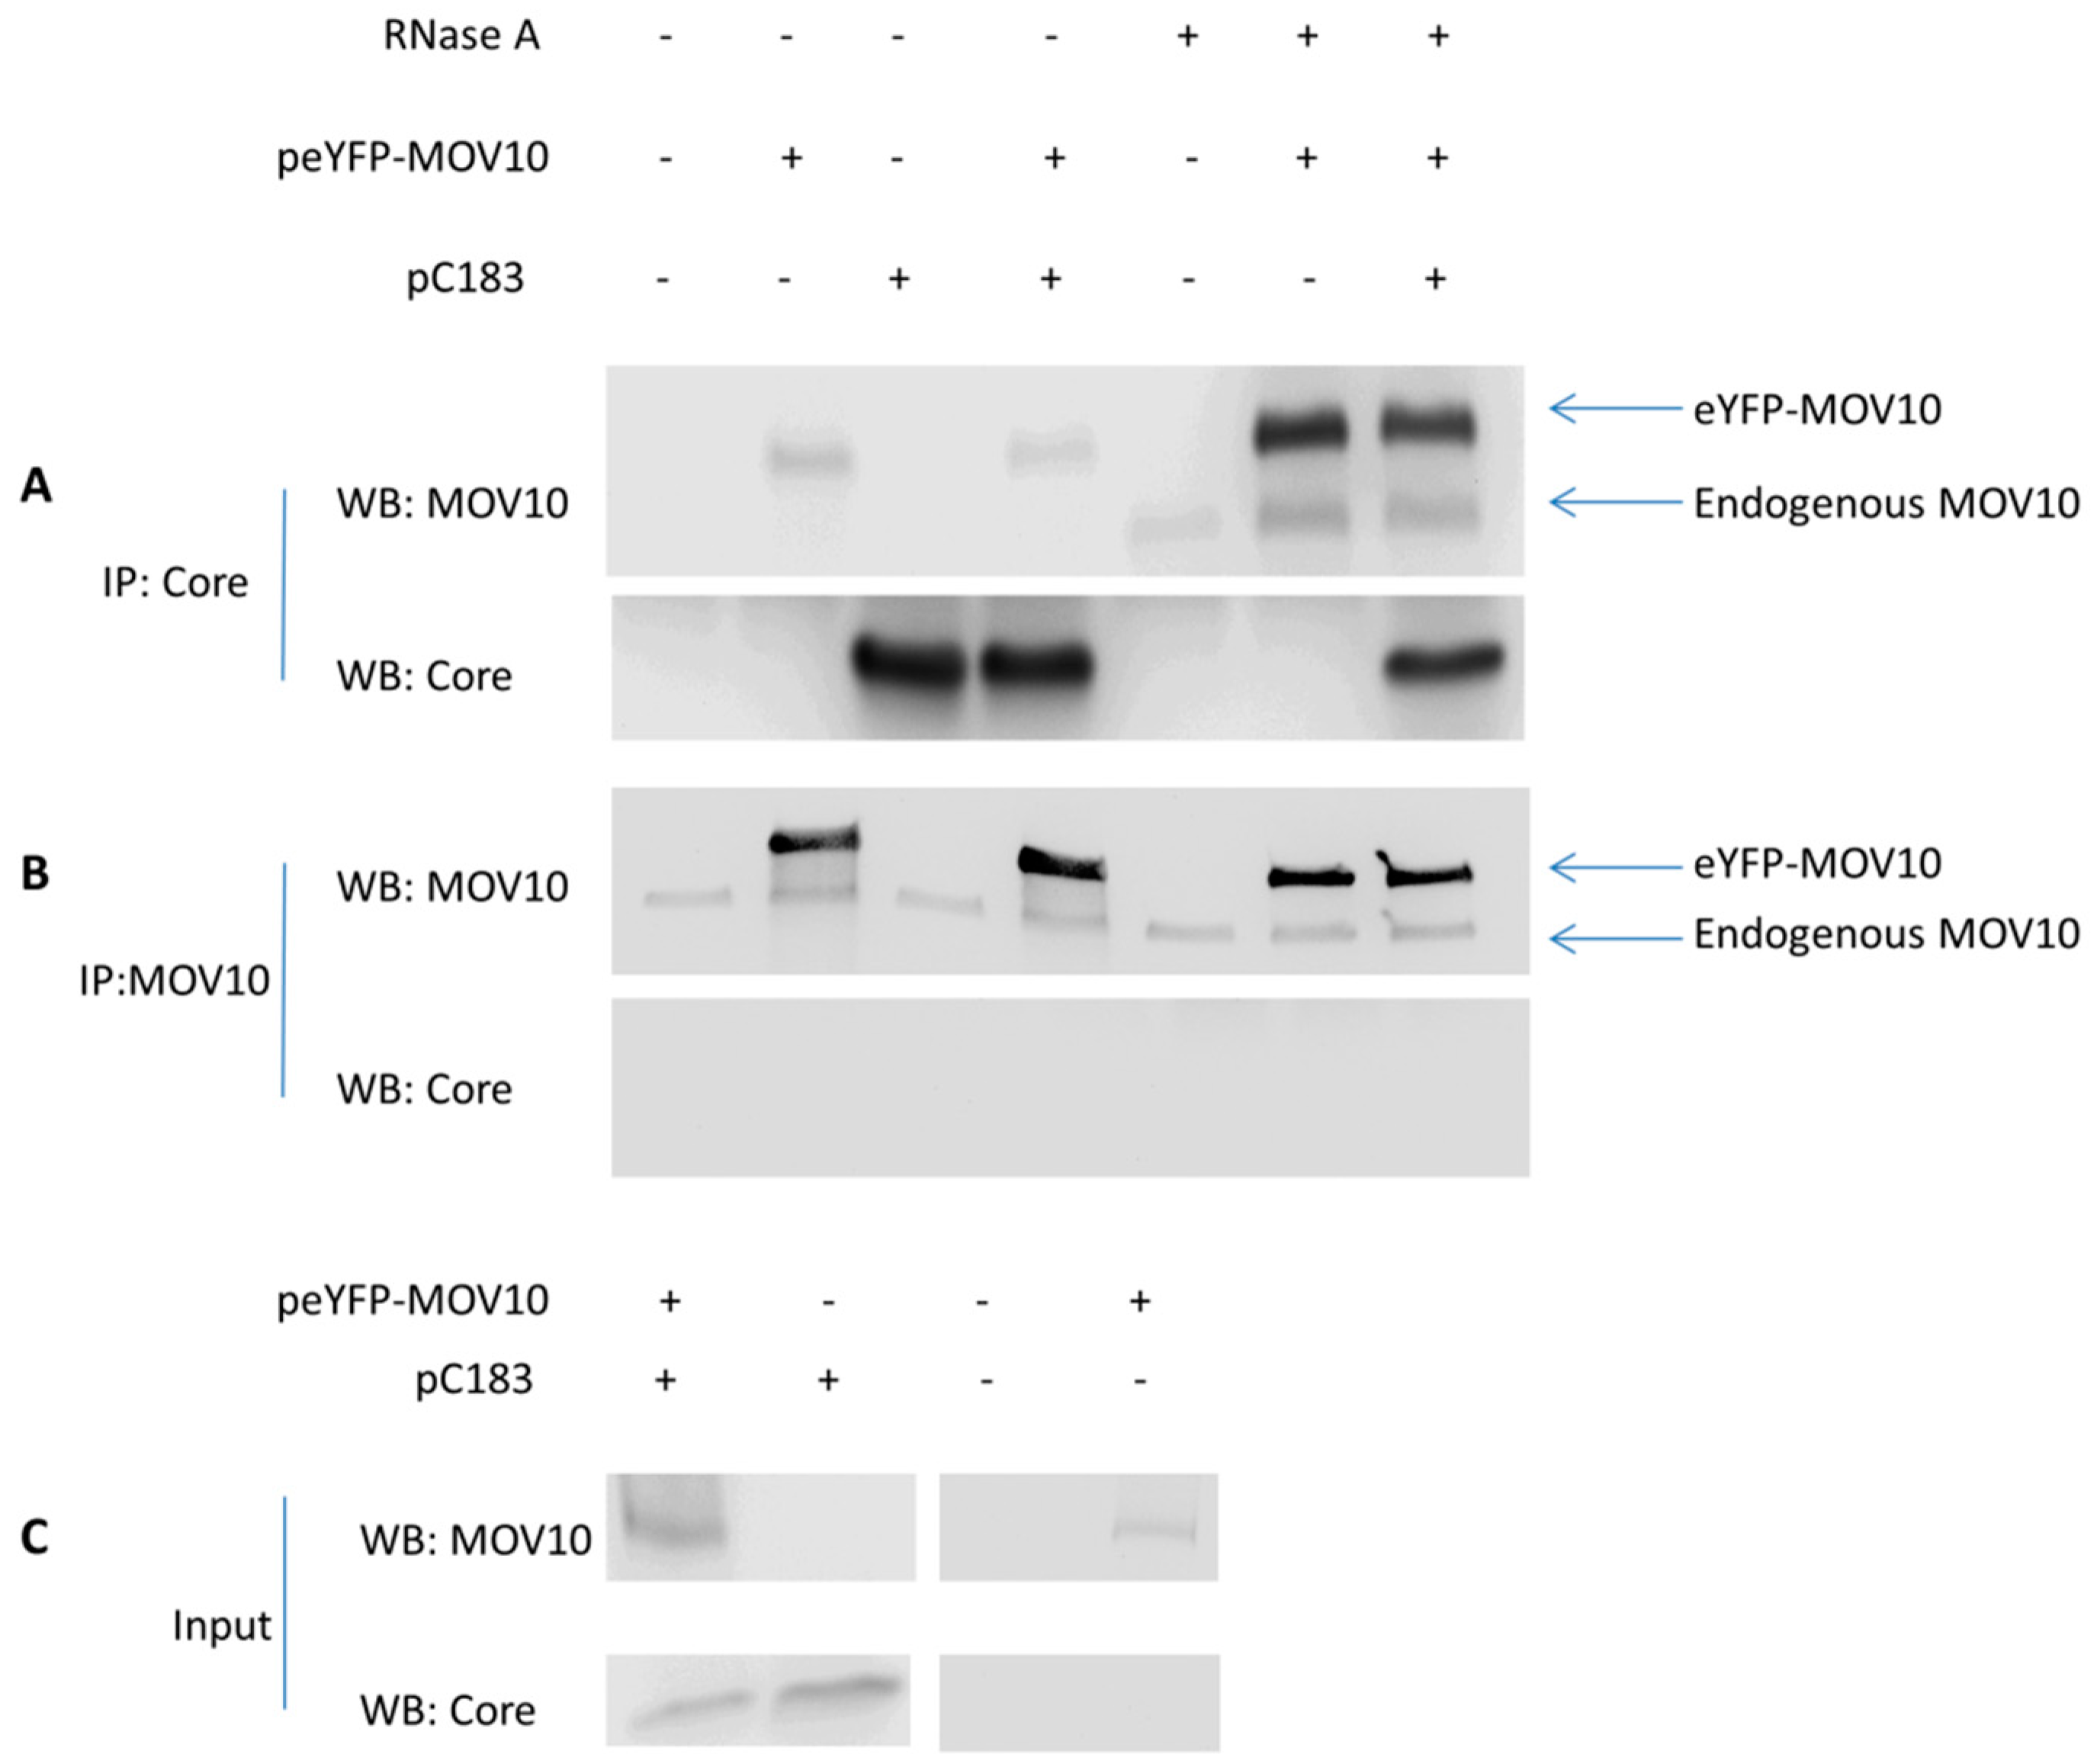
3.6. No Specific Interaction Between MOV10 and HBV Core Protein
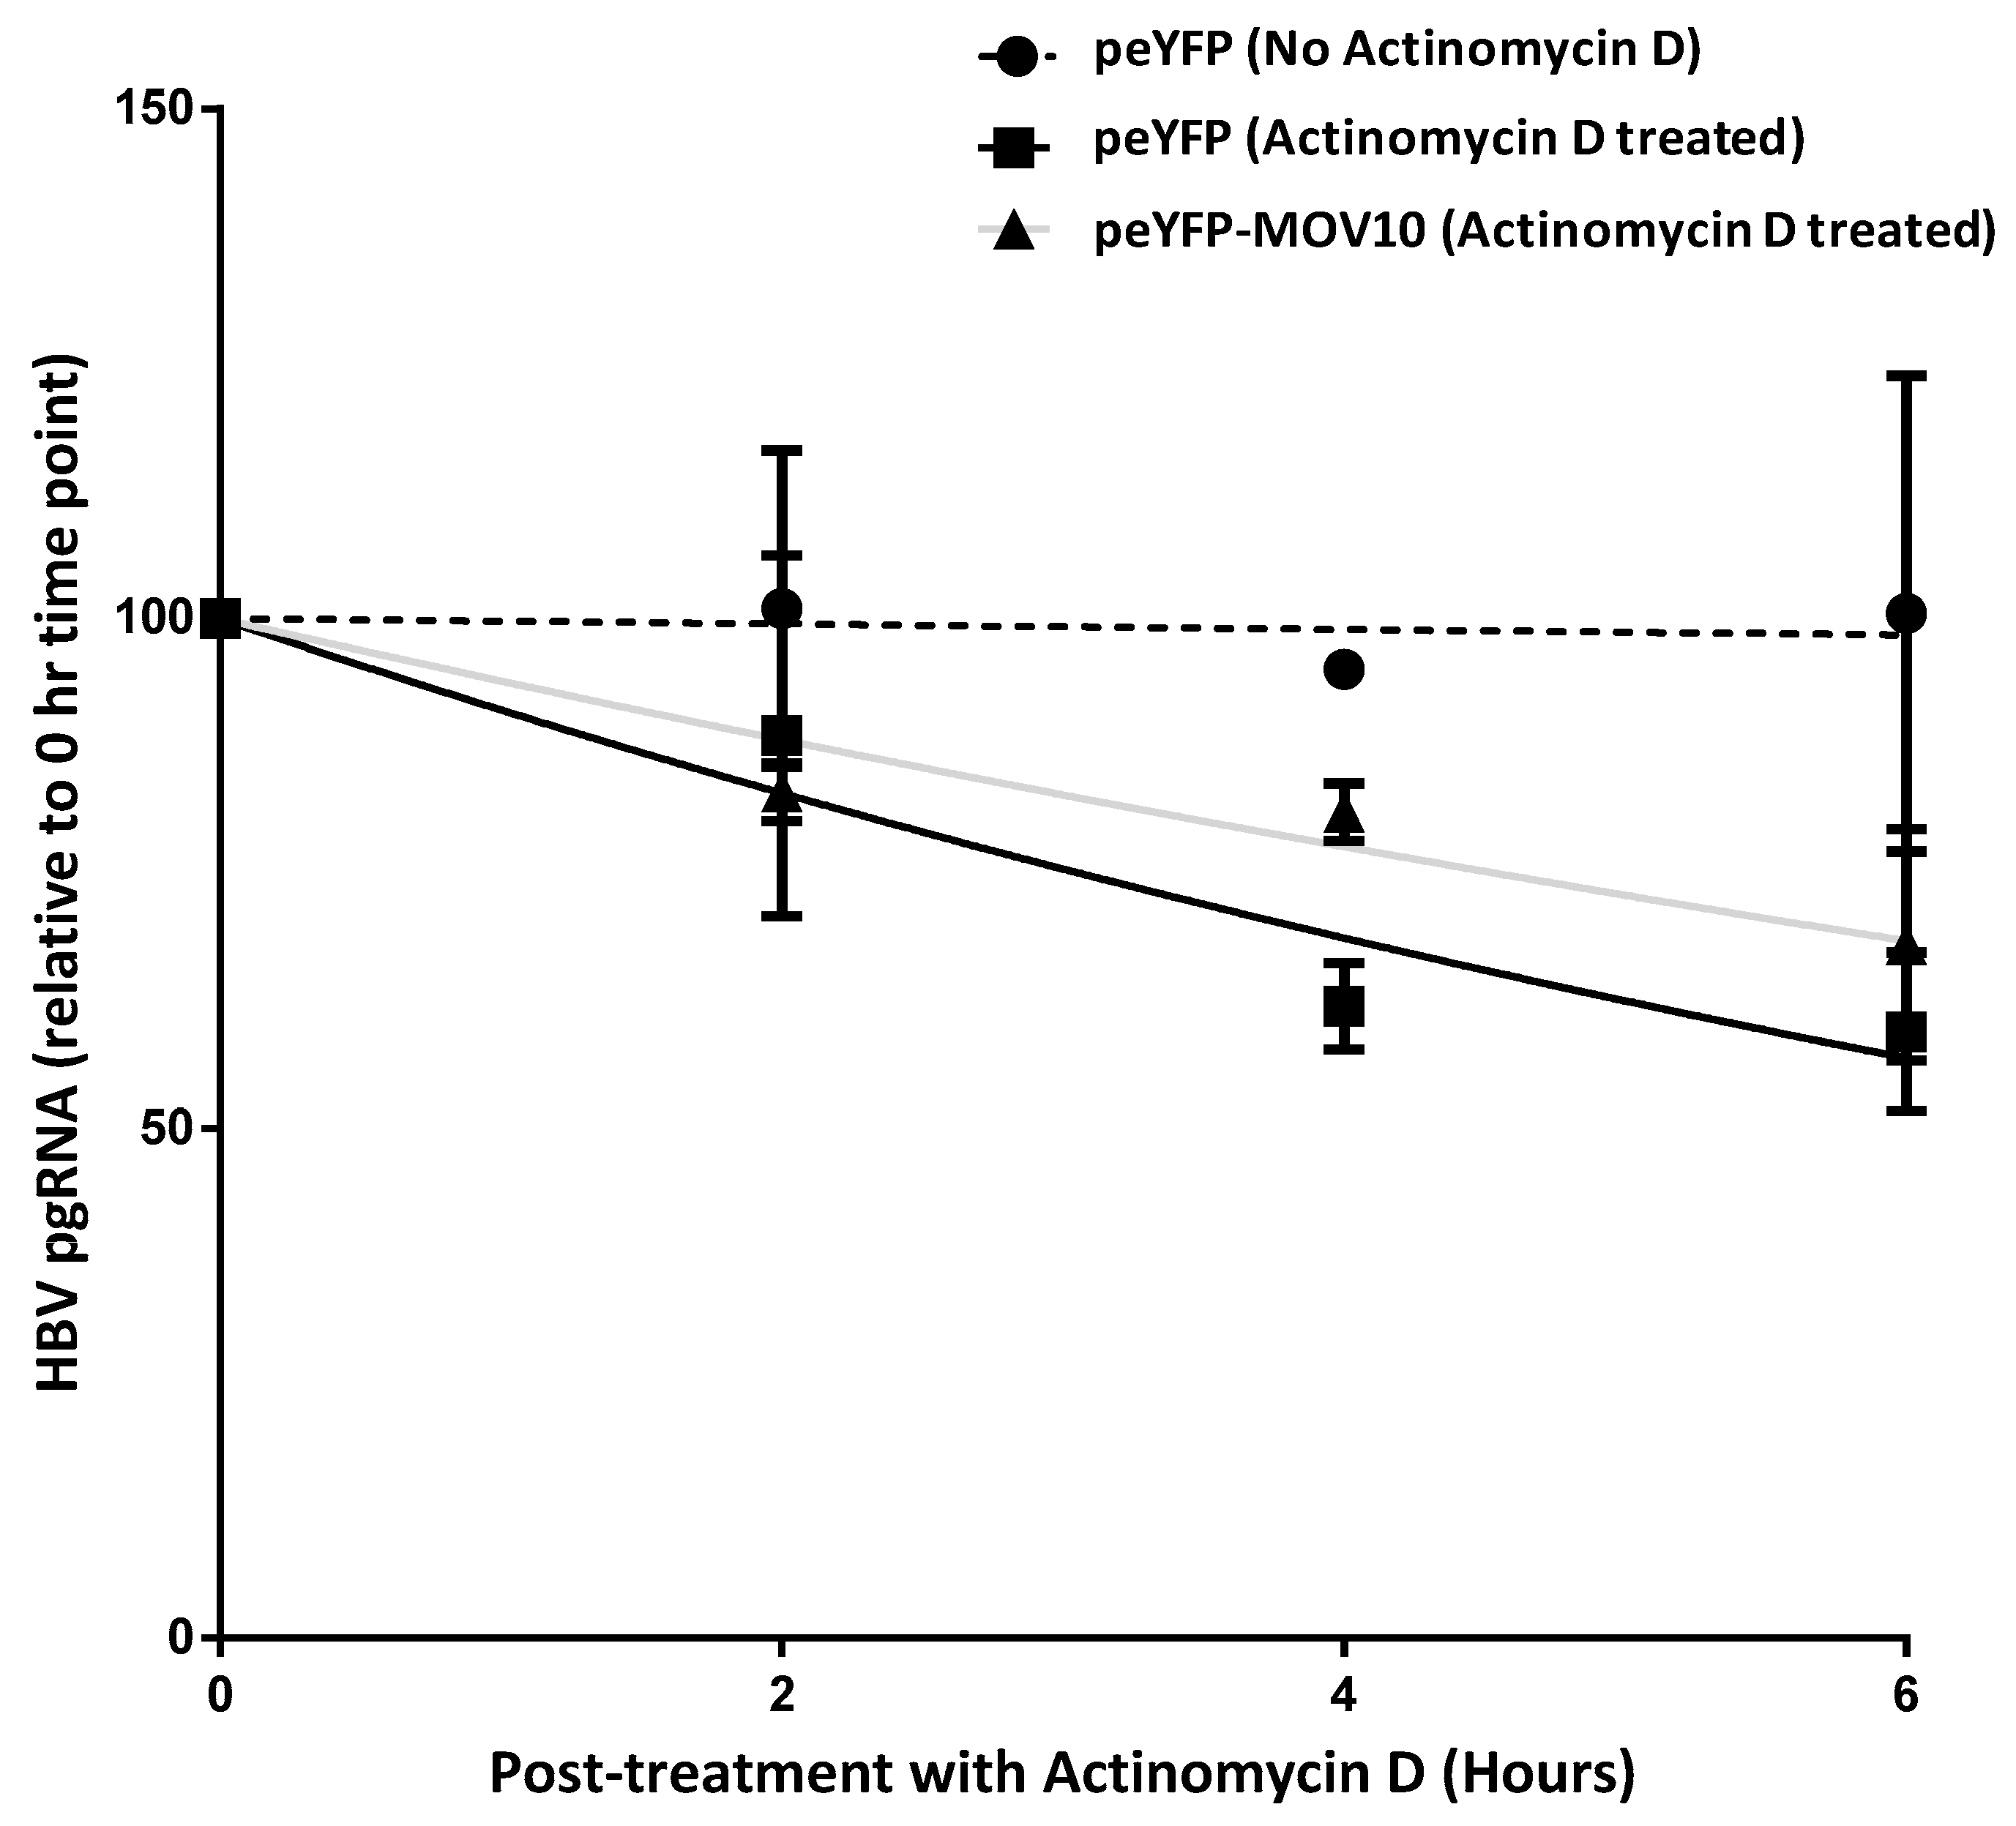
3.7. MOV10 Over-Expression Does Not Induce Degradation of HBV pgRNA
4. Discussion
5. Conclusions
Author Contributions
Funding
Acknowledgments
Conflicts of Interest
Abbreviations
| APOBEC3G | Apolipoprotein-B-mRNA-editing enzyme catalytic polypeptide-like 3G |
| cDNA | Complementary DNA |
| cccDNA | Covalently closed circular DNA |
| CT | Cycle threshold |
| DMSO | Dimethyl sulfoxide |
| DMEM | Dulbecco’s Modified Eagle’s Medium |
| DPBS | Dulbecco’s Phosphate-Buffered Saline |
| FBS | Fetal bovine serum |
| G418 | Geneticin |
| GAPDH | Glyceraldehyde 3-phosphate dehydrogenase |
| pC183 | HBV core expressing plasmid |
| HBV | Hepatitis B virus |
| HCV | Hepatitis C virus |
| HDV | Hepatitis D virus |
| h | Hour |
| hpt | Hours post-transfection |
| HIV-1 | Human immunodeficiency virus type 1 |
| IP | Immunoprecipitation |
| MOV10 | Moloney leukemia virus 10 |
| siMOV10 | MOV10 siRNA |
| MLV | Murine leukemia virus |
| NEAA | Non-essential amino acids |
| sicontrol | Non-targeting control siRNA |
| pHBV | pCMV-HBV-LE-II |
| pgRNA | Pre-genomic RNA |
| PEG | Polyethylene glycol |
| PBS | Phosphate-Buffered Saline |
| rcDNA | Relaxed-circular DNA |
| RT | Room temperature |
| SIV | Simian immunodeficiency virus |
| SDS-PAGE | Sodium dodecyl sulfate polyacrylamide gel electrophoresis |
| TBST | Tris Buffered Saline with 0.1% Tween 20 |
References
- Beck, J.; Nassal, M. Hepatitis B virus replication. World J. Gastroenterol. 2007, 13, 48–64. [Google Scholar] [CrossRef] [Green Version]
- Seeger, C.; Mason, W.S. Hepatitis B virus biology. Microbiol. Mol. Biol. Rev. 2000, 64, 51–68. [Google Scholar] [CrossRef]
- Jones, S.A.; Hu, J. Hepatitis B virus reverse transcriptase: Diverse functions as classical and emerging targets for antiviral intervention. Emerg. Microbes Infect. 2013, 2, e56. [Google Scholar] [CrossRef]
- Michailidis, E.; Kirby, K.A.; Hachiya, A.; Yoo, W.; Hong, S.P.; Kim, S.O.; Folk, W.R.; Sarafianos, S.G. Antiviral therapies: Focus on hepatitis B reverse transcriptase. Int. J. Biochem. Cell Biol. 2012, 44, 1060–1071. [Google Scholar] [CrossRef] [Green Version]
- Tang, C.M.; Yau, T.O.; Yu, J. Management of chronic hepatitis B infection: Current treatment guidelines, challenges, and new developments. World J. Gastroenterol. 2014, 20, 6262–6278. [Google Scholar] [CrossRef]
- Bourne, C.; Lee, S.; Venkataiah, B.; Lee, A.; Korba, B.; Finn, M.G.; Zlotnick, A. Small-molecule effectors of hepatitis B virus capsid assembly give insight into virus life cycle. J. Virol. 2008, 82, 10262–10270. [Google Scholar] [CrossRef]
- Bourne, C.R.; Finn, M.G.; Zlotnick, A. Global structural changes in hepatitis B virus capsids induced by the assembly effector HAP1. J. Virol. 2006, 80, 11055–11061. [Google Scholar] [CrossRef]
- Campagna, M.R.; Liu, F.; Mao, R.; Mills, C.; Cai, D.; Guo, F.; Zhao, X.; Ye, H.; Cuconati, A.; Guo, H.; et al. Sulfamoylbenzamide derivatives inhibit the assembly of hepatitis B virus nucleocapsids. J. Virol. 2013, 87, 6931–6942. [Google Scholar] [CrossRef]
- Wu, S.; Zhao, Q.; Zhang, P.; Kulp, J.; Hu, L.; Hwang, N.; Zhang, J.; Block, T.M.; Xu, X.; Du, Y.; et al. Discovery and Mechanistic Study of Benzamide Derivatives That Modulate Hepatitis B Virus Capsid Assembly. J. Virol. 2017, 91. [Google Scholar] [CrossRef] [Green Version]
- Huber, A.D.; Michailidis, E.; Tang, J.; Puray-Chavez, M.N.; Boftsi, M.; Wolf, J.J.; Boschert, K.N.; Sheridan, M.A.; Leslie, M.D.; Kirby, K.A.; et al. 3-Hydroxypyrimidine-2,4-Diones as Novel Hepatitis B Virus Antivirals Targeting the Viral Ribonuclease H. Antimicrob. Agents. Chemother. 2017, 61. [Google Scholar] [CrossRef]
- Schinazi, R.F.; Ehteshami, M.; Bassit, L.; Asselah, T. Towards HBV curative therapies. Liver Int. 2018, 38 (Suppl. 1), 102–114. [Google Scholar] [CrossRef] [Green Version]
- Tavis, J.E.; Cheng, X.; Hu, Y.; Totten, M.; Cao, F.; Michailidis, E.; Aurora, R.; Meyers, M.J.; Jacobsen, E.J.; Parniak, M.A.; et al. The hepatitis B virus ribonuclease H is sensitive to inhibitors of the human immunodeficiency virus ribonuclease H and integrase enzymes. PLoS Pathog. 2013, 9, e1003125. [Google Scholar] [CrossRef]
- Wang, L.; Zou, Z.Q.; Liu, C.X.; Liu, X.Z. Immunotherapeutic interventions in chronic hepatitis B virus infection: A review. J. Immunol. Methods 2014, 407, 1–8. [Google Scholar] [CrossRef]
- Ko, C.; Lee, S.; Windisch, M.P.; Ryu, W.S. DDX3 DEAD-box RNA helicase is a host factor that restricts hepatitis B virus replication at the transcriptional level. J. Virol. 2014, 88, 13689–13698. [Google Scholar] [CrossRef]
- Li, N.; Zhang, L.; Chen, L.; Feng, W.; Xu, Y.; Chen, F.; Liu, X.; Chen, Z.; Liu, W. MxA inhibits hepatitis B virus replication by interaction with hepatitis B core antigen. Hepatology 2012, 56, 803–811. [Google Scholar] [CrossRef]
- Lucifora, J.; Xia, Y.; Reisinger, F.; Zhang, K.; Stadler, D.; Cheng, X.; Sprinzl, M.F.; Koppensteiner, H.; Makowska, Z.; Volz, T.; et al. Specific and nonhepatotoxic degradation of nuclear hepatitis B virus cccDNA. Science 2014, 343, 1221–1228. [Google Scholar] [CrossRef]
- Xia, Y.; Protzer, U. Control of Hepatitis B Virus by Cytokines. Viruses 2017, 9, 18. [Google Scholar] [CrossRef]
- Ma, Y.X.; Li, D.; Fu, L.J.; Fu, B.Q.; Chen, S.J.; Xu, W.Z.; Teng, X.; Song, Z.W.; Gu, H.X. The role of Moloney leukemia virus 10 in hepatitis B virus expression in hepatoma cells. Virus Res. 2015, 197, 85–91. [Google Scholar] [CrossRef]
- Meister, G.; Landthaler, M.; Peters, L.; Chen, P.Y.; Urlaub, H.; Luhrmann, R.; Tuschl, T. Identification of novel argonaute-associated proteins. Curr. Biol. 2005, 15, 2149–2155. [Google Scholar] [CrossRef]
- Gregersen, L.H.; Schueler, M.; Munschauer, M.; Mastrobuoni, G.; Chen, W.; Kempa, S.; Dieterich, C.; Landthaler, M. MOV10 Is a 5′ to 3′ RNA helicase contributing to UPF1 mRNA target degradation by translocation along 3′ UTRs. Mol. Cell 2014, 54, 573–585. [Google Scholar] [CrossRef]
- Liang, X.H.; Crooke, S.T. RNA helicase A is not required for RISC activity. Biochim. Biophys. Acta. 2013, 1829, 1092–1101. [Google Scholar] [CrossRef] [Green Version]
- Wang, X.; Han, Y.; Dang, Y.; Fu, W.; Zhou, T.; Ptak, R.G.; Zheng, Y.H. Moloney leukemia virus 10 (MOV10) protein inhibits retrovirus replication. J. Biol. Chem. 2010, 285, 14346–14355. [Google Scholar] [CrossRef]
- Burdick, R.; Smith, J.L.; Chaipan, C.; Friew, Y.; Chen, J.; Venkatachari, N.J.; Delviks-Frankenberry, K.A.; Hu, W.S.; Pathak, V.K. P body-associated protein Mov10 inhibits HIV-1 replication at multiple stages. J. Virol. 2010, 84, 10241–10253. [Google Scholar] [CrossRef]
- Furtak, V.; Mulky, A.; Rawlings, S.A.; Kozhaya, L.; Lee, K.; Kewalramani, V.N.; Unutmaz, D. Perturbation of the P-body component Mov10 inhibits HIV-1 infectivity. PLoS ONE 2010, 5, e9081. [Google Scholar] [CrossRef]
- Gallois-Montbrun, S.; Kramer, B.; Swanson, C.M.; Byers, H.; Lynham, S.; Ward, M.; Malim, M.H. Antiviral protein APOBEC3G localizes to ribonucleoprotein complexes found in P bodies and stress granules. J. Virol. 2007, 81, 2165–2178. [Google Scholar] [CrossRef]
- Chen, C.; Ma, X.; Hu, Q.; Li, X.; Huang, F.; Zhang, J.; Pan, T.; Xia, J.; Liu, C.; Zhang, H. Moloney leukemia virus 10 (MOV10) inhibits the degradation of APOBEC3G through interference with the Vif-mediated ubiquitin-proteasome pathway. Retrovirology 2017, 14, 56. [Google Scholar] [CrossRef]
- Cuevas, R.A.; Ghosh, A.; Wallerath, C.; Hornung, V.; Coyne, C.B.; Sarkar, S.N. MOV10 Provides Antiviral Activity against RNA Viruses by Enhancing RIG-I-MAVS-Independent IFN Induction. J. Immunol. 2016, 196, 3877–3886. [Google Scholar] [CrossRef]
- Schoggins, J.W.; Wilson, S.J.; Panis, M.; Murphy, M.Y.; Jones, C.T.; Bieniasz, P.; Rice, C.M. A diverse range of gene products are effectors of the type I interferon antiviral response. Nature 2011, 472, 481–485. [Google Scholar] [CrossRef]
- Haussecker, D.; Cao, D.; Huang, Y.; Parameswaran, P.; Fire, A.Z.; Kay, M.A. Capped small RNAs and MOV10 in human hepatitis delta virus replication. Nat. Struct. Mol. Biol. 2008, 15, 714–721. [Google Scholar] [CrossRef] [Green Version]
- Kasim, V.; Wu, S.; Taira, K.; Miyagishi, M. Determination of the role of DDX3 a factor involved in mammalian RNAi pathway using an shRNA-expression library. PLoS ONE 2013, 8, e59445. [Google Scholar] [CrossRef]
- Ladner, S.K.; Otto, M.J.; Barker, C.S.; Zaifert, K.; Wang, G.H.; Guo, J.T.; Seeger, C.; King, R.W. Inducible expression of human hepatitis B virus (HBV) in stably transfected hepatoblastoma cells: A novel system for screening potential inhibitors of HBV replication. Antimicrob. Agents. Chemother. 1997, 41, 1715–1720. [Google Scholar] [CrossRef]
- Yan, H.; Zhong, G.; Xu, G.; He, W.; Jing, Z.; Gao, Z.; Huang, Y.; Qi, Y.; Peng, B.; Wang, H.; et al. Sodium taurocholate cotransporting polypeptide is a functional receptor for human hepatitis B and D virus. eLife 2012, 1. [Google Scholar] [CrossRef]
- Michailidis, E.; Pabon, J.; Xiang, K.; Park, P.; Ramanan, V.; Hoffmann, H.H.; Schneider, W.M.; Bhatia, S.N.; de Jong, Y.P.; Shlomai, A.; et al. A robust cell culture system supporting the complete life cycle of hepatitis B virus. Sci. Rep. 2017, 7, 16616. [Google Scholar] [CrossRef]
- Shlomai, A.; Schwartz, R.E.; Ramanan, V.; Bhatta, A.; de Jong, Y.P.; Bhatia, S.N.; Rice, C.M. Modeling host interactions with hepatitis B virus using primary and induced pluripotent stem cell-derived hepatocellular systems. Proc. Natl. Acad. Sci. USA 2014, 111, 12193–12198. [Google Scholar] [CrossRef] [Green Version]
- Huber, A.D.; Wolf, J.J.; Liu, D.; Gres, A.T.; Tang, J.; Boschert, K.N.; Puray-Chavez, M.N.; Pineda, D.L.; Laughlin, T.G.; Coonrod, E.M.; et al. The Heteroaryldihydropyrimidine Bay 38-7690 Induces Hepatitis B Virus Core Protein Aggregates Associated with Promyelocytic Leukemia Nuclear Bodies in Infected Cells. mSphere 2018, 3. [Google Scholar] [CrossRef]
- Arzberger, S.; Hosel, M.; Protzer, U. Apoptosis of hepatitis B virus-infected hepatocytes prevents release of infectious virus. J. Virol. 2010, 84, 11994–12001. [Google Scholar] [CrossRef]
- Yan, R.; Zhang, Y.; Cai, D.; Liu, Y.; Cuconati, A.; Guo, H. Spinoculation Enhances HBV Infection in NTCP-Reconstituted Hepatocytes. PLoS ONE 2015, 10, e0129889. [Google Scholar] [CrossRef]
- Jia, R.; Pan, Q.; Ding, S.; Rong, L.; Liu, S.L.; Geng, Y.; Qiao, W.; Liang, C. The N-terminal region of IFITM3 modulates its antiviral activity by regulating IFITM3 cellular localization. J. Virol. 2012, 86, 13697–13707. [Google Scholar] [CrossRef]
- Sitnik, R.; Paes, Â.; Mangueira, C.P.; Pinho, J.R.R. A real-time quantitative assay for hepatitis B DNA virus (HBV) developed to detect all HBV genotypes. Rev. Inst. Med. Trop. S. Paulo 2010, 52, 119–124. [Google Scholar] [CrossRef] [Green Version]
- Galvis, A.E.; Fisher, H.E.; Nitta, T.; Fan, H.; Camerini, D. Impairment of HIV-1 cDNA synthesis by DBR1 knockdown. J. Virol. 2014, 88, 7054–7069. [Google Scholar] [CrossRef]
- Jansen, L.; Kootstra, N.A.; van Dort, K.A.; Takkenberg, R.B.; Reesink, H.W.; Zaaijer, H.L. Hepatitis B Virus Pregenomic RNA Is Present in Virions in Plasma and Is Associated With a Response to Pegylated Interferon Alfa-2a and Nucleos(t)ide Analogues. J. Infect. Dis. 2016, 213, 224–232. [Google Scholar] [CrossRef]
- Prakash, K.; Rydell, G.E.; Larsson, S.B.; Andersson, M.; Norkrans, G.; Norder, H.; Lindh, M. High serum levels of pregenomic RNA reflect frequently failing reverse transcription in hepatitis B virus particles. Virol. J. 2018, 15, 86. [Google Scholar] [CrossRef]
- Keene, J.D.; Komisarow, J.M.; Friedersdorf, M.B. RIP-Chip: The isolation and identification of mRNAs, microRNAs and protein components of ribonucleoprotein complexes from cell extracts. Nat. Protoc. 2006, 1, 302–307. [Google Scholar] [CrossRef]
- Huang, F.; Zhang, J.; Zhang, Y.; Geng, G.; Liang, J.; Li, Y.; Chen, J.; Liu, C.; Zhang, H. RNA helicase MOV10 functions as a co-factor of HIV-1 Rev to facilitate Rev/RRE-dependent nuclear export of viral mRNAs. Virology 2015, 486, 15–26. [Google Scholar] [CrossRef] [Green Version]
- Izumi, T.; Burdick, R.; Shigemi, M.; Plisov, S.; Hu, W.S.; Pathak, V.K. Mov10 and APOBEC3G localization to processing bodies is not required for virion incorporation and antiviral activity. J. Virol. 2013, 87, 11047–11062. [Google Scholar] [CrossRef]
- Abudu, A.; Wang, X.; Dang, Y.; Zhou, T.; Xiang, S.H.; Zheng, Y.H. Identification of molecular determinants from Moloney leukemia virus 10 homolog (MOV10) protein for virion packaging and anti-HIV-1 activity. J. Biol. Chem. 2012, 287, 1220–1228. [Google Scholar] [CrossRef]
- Nair, S.; Zlotnick, A. Asymmetric Modification of Hepatitis B Virus (HBV) Genomes by an Endogenous Cytidine Deaminase inside HBV Cores Informs a Model of Reverse Transcription. J. Virol. 2018, 92. [Google Scholar] [CrossRef] [Green Version]
- Nguyen, D.H.; Gummuluru, S.; Hu, J. Deamination-independent inhibition of hepatitis B virus reverse transcription by APOBEC3G. J. Virol. 2007, 81, 4465–4472. [Google Scholar] [CrossRef]


© 2019 by the authors. Licensee MDPI, Basel, Switzerland. This article is an open access article distributed under the terms and conditions of the Creative Commons Attribution (CC BY) license (http://creativecommons.org/licenses/by/4.0/).
Share and Cite
Puray-Chavez, M.N.; Farghali, M.H.; Yapo, V.; Huber, A.D.; Liu, D.; Ndongwe, T.P.; Casey, M.C.; Laughlin, T.G.; Hannink, M.; Tedbury, P.R.; et al. Effects of Moloney Leukemia Virus 10 Protein on Hepatitis B Virus Infection and Viral Replication. Viruses 2019, 11, 651. https://doi.org/10.3390/v11070651
Puray-Chavez MN, Farghali MH, Yapo V, Huber AD, Liu D, Ndongwe TP, Casey MC, Laughlin TG, Hannink M, Tedbury PR, et al. Effects of Moloney Leukemia Virus 10 Protein on Hepatitis B Virus Infection and Viral Replication. Viruses. 2019; 11(7):651. https://doi.org/10.3390/v11070651
Chicago/Turabian StylePuray-Chavez, Maritza N., Mahmoud H. Farghali, Vincent Yapo, Andrew D. Huber, Dandan Liu, Tanyaradzwa P. Ndongwe, Mary C. Casey, Thomas G. Laughlin, Mark Hannink, Philip R. Tedbury, and et al. 2019. "Effects of Moloney Leukemia Virus 10 Protein on Hepatitis B Virus Infection and Viral Replication" Viruses 11, no. 7: 651. https://doi.org/10.3390/v11070651