
Solar Energetic Particle Events and Forbush Decreases Driven by the Same Solar Sources
by
 , , , , and
Anatoly Belov
1 ,
,
Nataly Shlyk
1,
Maria Abunina
1,
Elena Belova
1,
Artem Abunin
1 and
Athanasios Papaioannou
2,* 1
Pushkov Institute of Terrestrial Magnetism, Ionosphere and Radio Wave Propagation of Russian Academy of Sciences (IZMIRAN), Kaluzhskoe hw., 4, Troitsk, 108840 Moscow, Russia
2
Institute for Astronomy, Astrophysics, Space Applications and Remote Sensing (IAASARS), National Observatory of Athens, I. Metaxa & Vas. Pavlou St., 15236 Penteli, Greece
*
Author to whom correspondence should be addressed.
Universe 2022, 8(8), 403; https://doi.org/10.3390/universe8080403
Submission received: 4 July 2022
/
Revised: 26 July 2022
/
Accepted: 27 July 2022
/
Published: 1 August 2022
(This article belongs to the Special Issue Solar Energetic Particles)
Abstract
:The characteristics of Forbush decreases (FDs) and solar energetic particle (SEP) events driven by the same solar source (i.e., coronal mass ejection and associated solar flare) are investigated. The part of the solar disk (04 E–35 W) in which most of the solar events lead both to an FD and SEP event on Earth was chosen. SEPs for different energies (E > 10 MeV, E > 100 MeV, and Ground Level Enhancements) and with different flux thresholds were considered independently. The obtained results were compared with the control group of FDs that had solar sources within the same longitudinal zone but were not accompanied by any SEPs. It is shown that coronal mass ejections (CMEs) followed by SEPs have a very high probability of creating a large FD in the Earth’s orbit and to further cause a geomagnetic storm. It is also found that the accelerative and modulating efficiencies of powerful solar events are well correlated; this can be explained mostly by high speeds of the corresponding CMEs.
1. Introduction
The possibility of accelerating charged particles on the Sun to high energies was first described many years ago (for example, in Forbush [1], Dorman and Miroshnichenko [2], Shea and Smart [3]). Initially, it was assumed that proton flux increases (solar energetic particle or SEP events) were associated exclusively with powerful solar flares (Dorman and Miroshnichenko [2], Duggal [4]). After regular observation of coronal mass ejections (CMEs), many scientists began to associate proton acceleration with shock waves from the corresponding interplanetary CMEs (ICMEs; for example, Gosling [5], Reames [6]). A lot of papers suggest that gradual SEP events occur as a result of particles’ diffusive acceleration on CME-induced coronal and interplanetary shock waves, and impulsive SEPs have been explained by acceleration during magnetic reconnection in solar flares (Zhang et al. [7] and references therein). There are many studies demonstrating good agreement between the magnitude of proton enhancements and both the CME speed and the magnitude of accompanying X-ray flares (e.g., [8,9,10,11,12,13,14,15,16]). With the development of ground-based detectors and satellite electronics, it became possible to confidently detect and isolate SEPs of different energy ranges, and now several catalogs of SEPs with hundreds of events compiled by different research groups are available for analysis, for example: the NOAA SEP event list ftp://ftp.swpc.noaa.gov/pub/indices/SPE.txt Major SEP Events https://cdaw.gsfc.nasa.gov/CME_list/sepe/ (1997–2017); and SEP catalogs described in separate scientific articles, for example, “Solar CR GLEs in 1976–2006” [17], “Fe-rich SEP events 1995–2013” (https://link.springer.com/article/10.1007/s11207-014-0547-1/tables/2, [18]), and “55–80 MeV proton events in 1996–2016” (https://www.swsc-journal.org/articles/swsc/olm/2017/01/swsc170003/swsc170003-1-olm.pdf, [19]). In the recent paper by Vlasova et al. [20], distinguishing features of a series of solar proton event catalogs for the 20th–24th cycles of solar activity are described.
Along with SEP events, Forbush effects or Forbush decreases (FD)—changes in the density and anisotropy of cosmic rays (CR) [21,22,23,24,25]—also often represent the consequences of sporadic processes on the Sun; they are observed after the ejections of solar matter usually associated with solar flares. Despite the fact that SEPs are events in solar CRs, and FDs are events in galactic CRs, both phenomena are often associated with the same (usually) fast CME. Therefore, it is reasonable to assume that between the characteristics of these events there may exist, if not physical, at least statistical relationships. There are many works that establish statistical relationships between FD and CME characteristics (see, for example, Richardson and Cane [26], Belov et al. [27], Masías-Meza et al. [28], Papaioannou et al. [29], Abunina et al. [30], Melkumyan et al. [31]). In Belov et al. [32], the authors showed that in solar cycle 23, the CMEs that led to ground level enhancements (GLEs) of the solar CR flux with a high degree of probability also created large FDs (with amplitude () > 7%) in the Earth’s orbit, and induced very large geomagnetic storms. Henceforth, the amplitude of FDs () is calculated by the Global Survey Method (GSM, Belov et al. [33]) using the data of the worldwide network of neutron monitors for particles with a rigidity of 10 GV. This was especially pronounced for events with a solar source located in the central longitudinal range. Figure 1 shows the distribution in time and magnitude of FDs with 3% (right y-axis scale) and proton events with a maximum flux > 1 and >300 pfu (i.e., particle flux unit = 1 particle/cm sr s) for particles with energies E > 100 MeV (left y-axis scale) against the background of the sunspot number. Note that the magnitude of six large proton enhancements (29 September 1989, 19 October 1989, 22 October 1989, 14 July 2000, 8 November 2000, and 20 January 2005 with maximum fluxes of 559, 400, 380, 623, 451, and 650 pfu, respectively) are not shown in the figure (marked with red triangles). It can be seen from the figure that most often both large FDs and large SEPs occur at the maximum of solar activity, as anticipated.
The aim of this work is to study and compare the characteristics of events associated with solar flares and corresponding CMEs, for which both an increase in the solar CR flux (SEP) and a change in the density/anisotropy of galactic CRs (FD) were subsequently recorded in the period from 1975 to 2020. Analysis of such events makes it possible to evaluate the acceleration and modulation efficiency of CMEs associated with proton enhancements and to obtain a prognostic tool for determining the possible FD magnitude and changes in the level of geomagnetic activity using data from an already-started SEP event.
2. Data and Methods
This work is performed with the X-ray flare and proton enhancement database [34,35,36]. Enhancements of solar cosmic rays are selected on the basis of measurements of protons with energy E > 10 and E > 100 MeV by satellites (Interplanetary Monitoring Platform) IMP-81 and (Geostationary Operational Environmental Satellite) GOES2. This database continues to be updated daily and at the time of writing contains over 82,000 X-ray flares and over 1400 proton events. Sufficiently complete and homogeneous information on X-ray flares is available for the entire period of operation of X-ray detectors onboard the GOES satellites (GOES 5-17) from September 1975 to the present (http://www.swpc.noaa.gov/ftpdir/lists/xray, ftp://ftp.swpc.noaa.gov/pub/indices/events/).
Further, the database of Forbush effects and Interplanetary Disturbances (FEID), created and maintained at IZMIRAN, is used. The FEID database contains CR parameters calculated by the GSM according to the data of the world network of neutron monitors (NMDB, http://www01.nmdb.eu/) for particles with rigidity of 10 GV. The FEID also contains the parameters of solar wind (SW), interplanetary magnetic field (IMF), and data on geomagnetic activity (GA), shock waves, and CMEs, which are taken from, respectively: the OMNI database (https://omniweb.gsfc.nasa.gov/), ftp://ftp.gfz-potsdam.de/pub/home/obs/kp-ap/wdc/, Matzka et al. [37], http://wdc.kugi.kyotou.ac.jp/dstdir/index.html, http://isgi.unistra.fr/datadownload.php, and https://cdaw.gsfc.nasa.gov/CME_list. The FEID also includes data on magnetic clouds (MC), taken from various online catalogs and papers by various authors: (Huttunen et al. [38], Lynch et al. [39], Lynch et al. [40], Marubashi and Lepping [41], Yermolaev et al. [42], Richardson and Cane [43], Gopalswamy et al. [44], Kim et al. [45]; https://wind.nasa.gov/mfi/mag_cloud_pub1.html, https://wind.nasa.gov/mfi/mag_cloud_S1.html, https://cdaw.gsfc.nasa.gov/meetings/2010_fluxrope/LWS_CDAW2010_ICMEtbl.html, https://izw1.caltech.edu/ACE/ASC/DATA/level3/icmetable2.htm, and http://www.iki.rssi.ru/omni/catalog/).
3. Results
3.1. Characteristics of Solar Flare Events
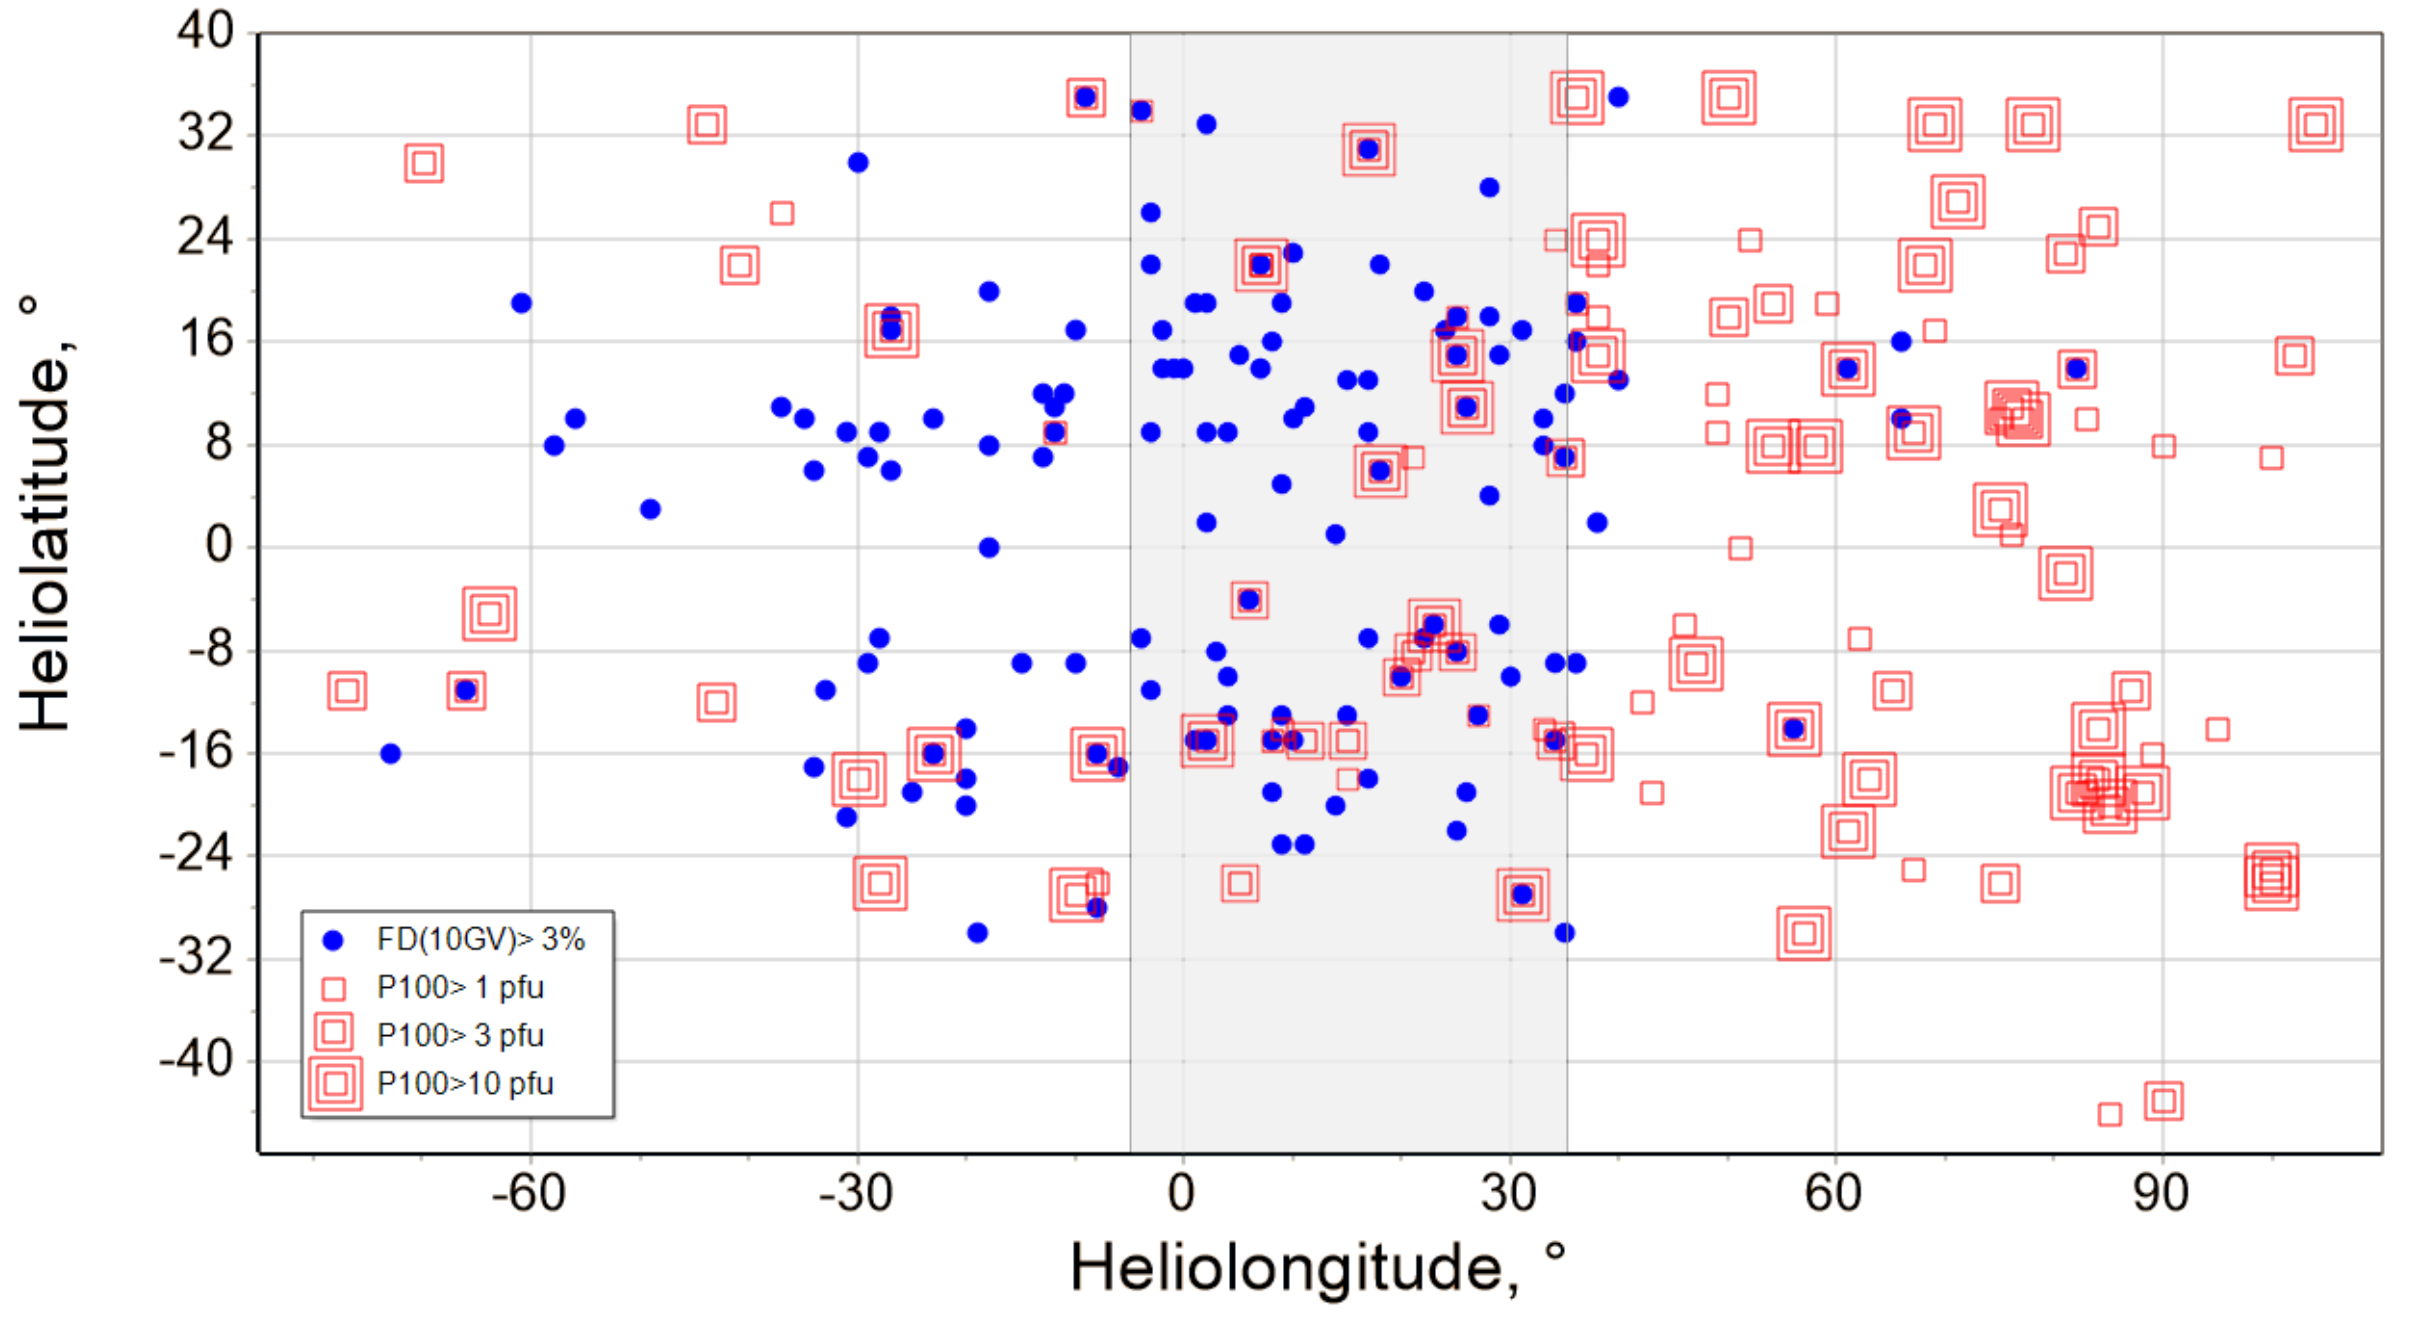
We consider the distribution of longitudes of solar sources associated with FDs (with 3%) and SEPs with different maximum fluxes (Figure 2). It is obvious that the sources of FDs are mainly located in the central zone (30 E–30 W), (see also Papaioannou et al. [29]), while the sources of SEPs are shifted to the west (20 W–80 W), which is consistent with the conclusions of earlier works (e.g., Belov et al. [32]). This difference is explained by the structure of the interplanetary solar wind between the Sun and the Earth close to the Parker Spiral. Therefore, we decided to limit our study to a central range of longitudes: 04 E–35 W, which is located at the intersection of the two above-mentioned zones (this central range is marked in Figure 2 by the gray shaded area).
Belov et al. [32] considered only GLE events. In this study, we expanded the sample under study and consider all solar flares in the 04 E–35 W longitudinal range after which SEP events were recorded from 1975–2020. All identified events were divided into four groups according to the maximum recorded fluxes for particles with different energies (hereinafter, is the peak proton flux for particles with energies E > 10 MeV; is the peak proton flux for particles with energies E > 100 MeV): (1) Ground level enhancements (10 events, GLE group); (2) ≥ 0.5 pfu (29 events, group); (3) ≥ 1 pfu and < 0.5 pfu (39 events, group); (4) < 1 pfu, is not registered (62 events, Weak group). To highlight the features of the selected solar flare events, we created a control group of flares from the same longitude range after which no SEP was recorded (9641 flares, NoSEP group). All compared parameters (average, maximum, and minimum values) are given in Table 1: , (W/m)—X-ray flare magnitude; , (min)—flare duration; , (min)—duration of the rise phase; , (pfu)—the peak flux for particles with energies E > 10 MeV; , (min)—time from the beginning of the flare to the time of recording the peak flux value; , (pfu)—the peak flux for particles with energies E > 100 MeV; , ()—difference between the heliolatitudes of the flare and the Earth; , ()—flare heliolongitude; , (km/s)—speed of associated CME (taken from CDAW CME catalogue https://cdaw.gsfc.nasa.gov/CME_list); —the flare coefficient (the product of X-ray flare magnitude and duration of the rise phase; see Belov [16]); —energy spectrum index of the corresponding SEP.
Table 1 shows that the average values of flares’ coordinates change slightly from group to group; however, for other parameters considered, the differences are more pronounced. This concerns not only and values—for which the differences are primarily due to the event selection criterion (e.g., in the GLE group, the average values are more than 10 times higher than the corresponding values of other groups)—but, on top of these, there are also differences in the flare and corresponding CME characteristics. The GLE group includes flares of at least X1.0 class, with maximum power of 5.7 × 10 W/m (X5.7). The group represents flares of classes ranging from C to X, but not lower than C1.9. This group, it is worth noting, contains the longest flare duration, = 328 min, and the highest maximum speed of the corresponding CME, = 2861 km/s. The group also represents flares from C to X. In the Weak group, the maximum flare powers and CME speeds are much lower than those in the first three groups. On average, events in the GLE group exceed those in the group by 1.9 times, the group by 2.9 times, the Weak group by 5.3 times, and the NoSEP group by 48 times based on the parameter. There are also noticeable differences in flare duration. The longest flares are in the GLE and groups, while the flares in the control group are several times lower.
Differences in energy dependence () are partly related to the division of events into groups. The small value of in the Weak group is due to the artificial limitation of the value, but the hard energy spectrum of GLE group events is a real feature of these events. The coefficient = [16] correlates well with the peak proton flux of the proton enhancements. In the GLE group, the average value is , which is three times larger than the group and 200 times higher than the control group. Expected differences are also obtained for the average speeds of the corresponding CMEs. For the GLE group, CME speeds are the highest (1795 km/s), while the lowest (566 km/s) are found in the control group. The results obtained confirm the optimal choice of CME speed and the flare parameter for predicting the SEP value from solar observations [16]. Thus, from the considered sample, we can conclude that a necessary (but insufficient) condition to increase the proton flux for particles with energies E > 100 MeV is a flare of ≥C1.9 class magnitude with a duration of ≥148 min, and for particles with energies E > 10 MeV, it is a flare of ≥C1.2 class with a duration ≥116 min. The presented results indicate that the probability and magnitude of SEPs are closely related to the characteristics of solar phenomena (X-ray flares and CMEs). For CMEs, the most important characteristic is the initial speed, while for solar flares, it is the maximum power (i.e., class) and duration.
3.2. Characteristics of Associated Forbush Decreases
Further, from the selected solar flare events, we chose only those that caused FDs recorded on Earth by the NM network (for particles with the rigidity of 10 GV). Note that not all selected events were suitable for FD research. We have chosen only those events that can be confidently identified with a solar source. For example, a series of successive flares and ejections from one active region undoubtedly led to the registration of an FD, but it was difficult to say which particular flare and corresponding CME were most responsible for a particular FD. Thus, we have the following groups of FDs: (1) 9 FDs with sources from the GLE group; (2) 20 FDs with sources from the group; (3) 26 FDs with sources from the group; and (4) 55 FDs with sources from the Weak group. A control group was also chosen: 91 FDs with sources without SEPs (Control group). Note that the Control group is significantly smaller than the NoSEP group in terms of the number of events because many flares were too weak, had no corresponding CMEs, and did not affect near-Earth space.
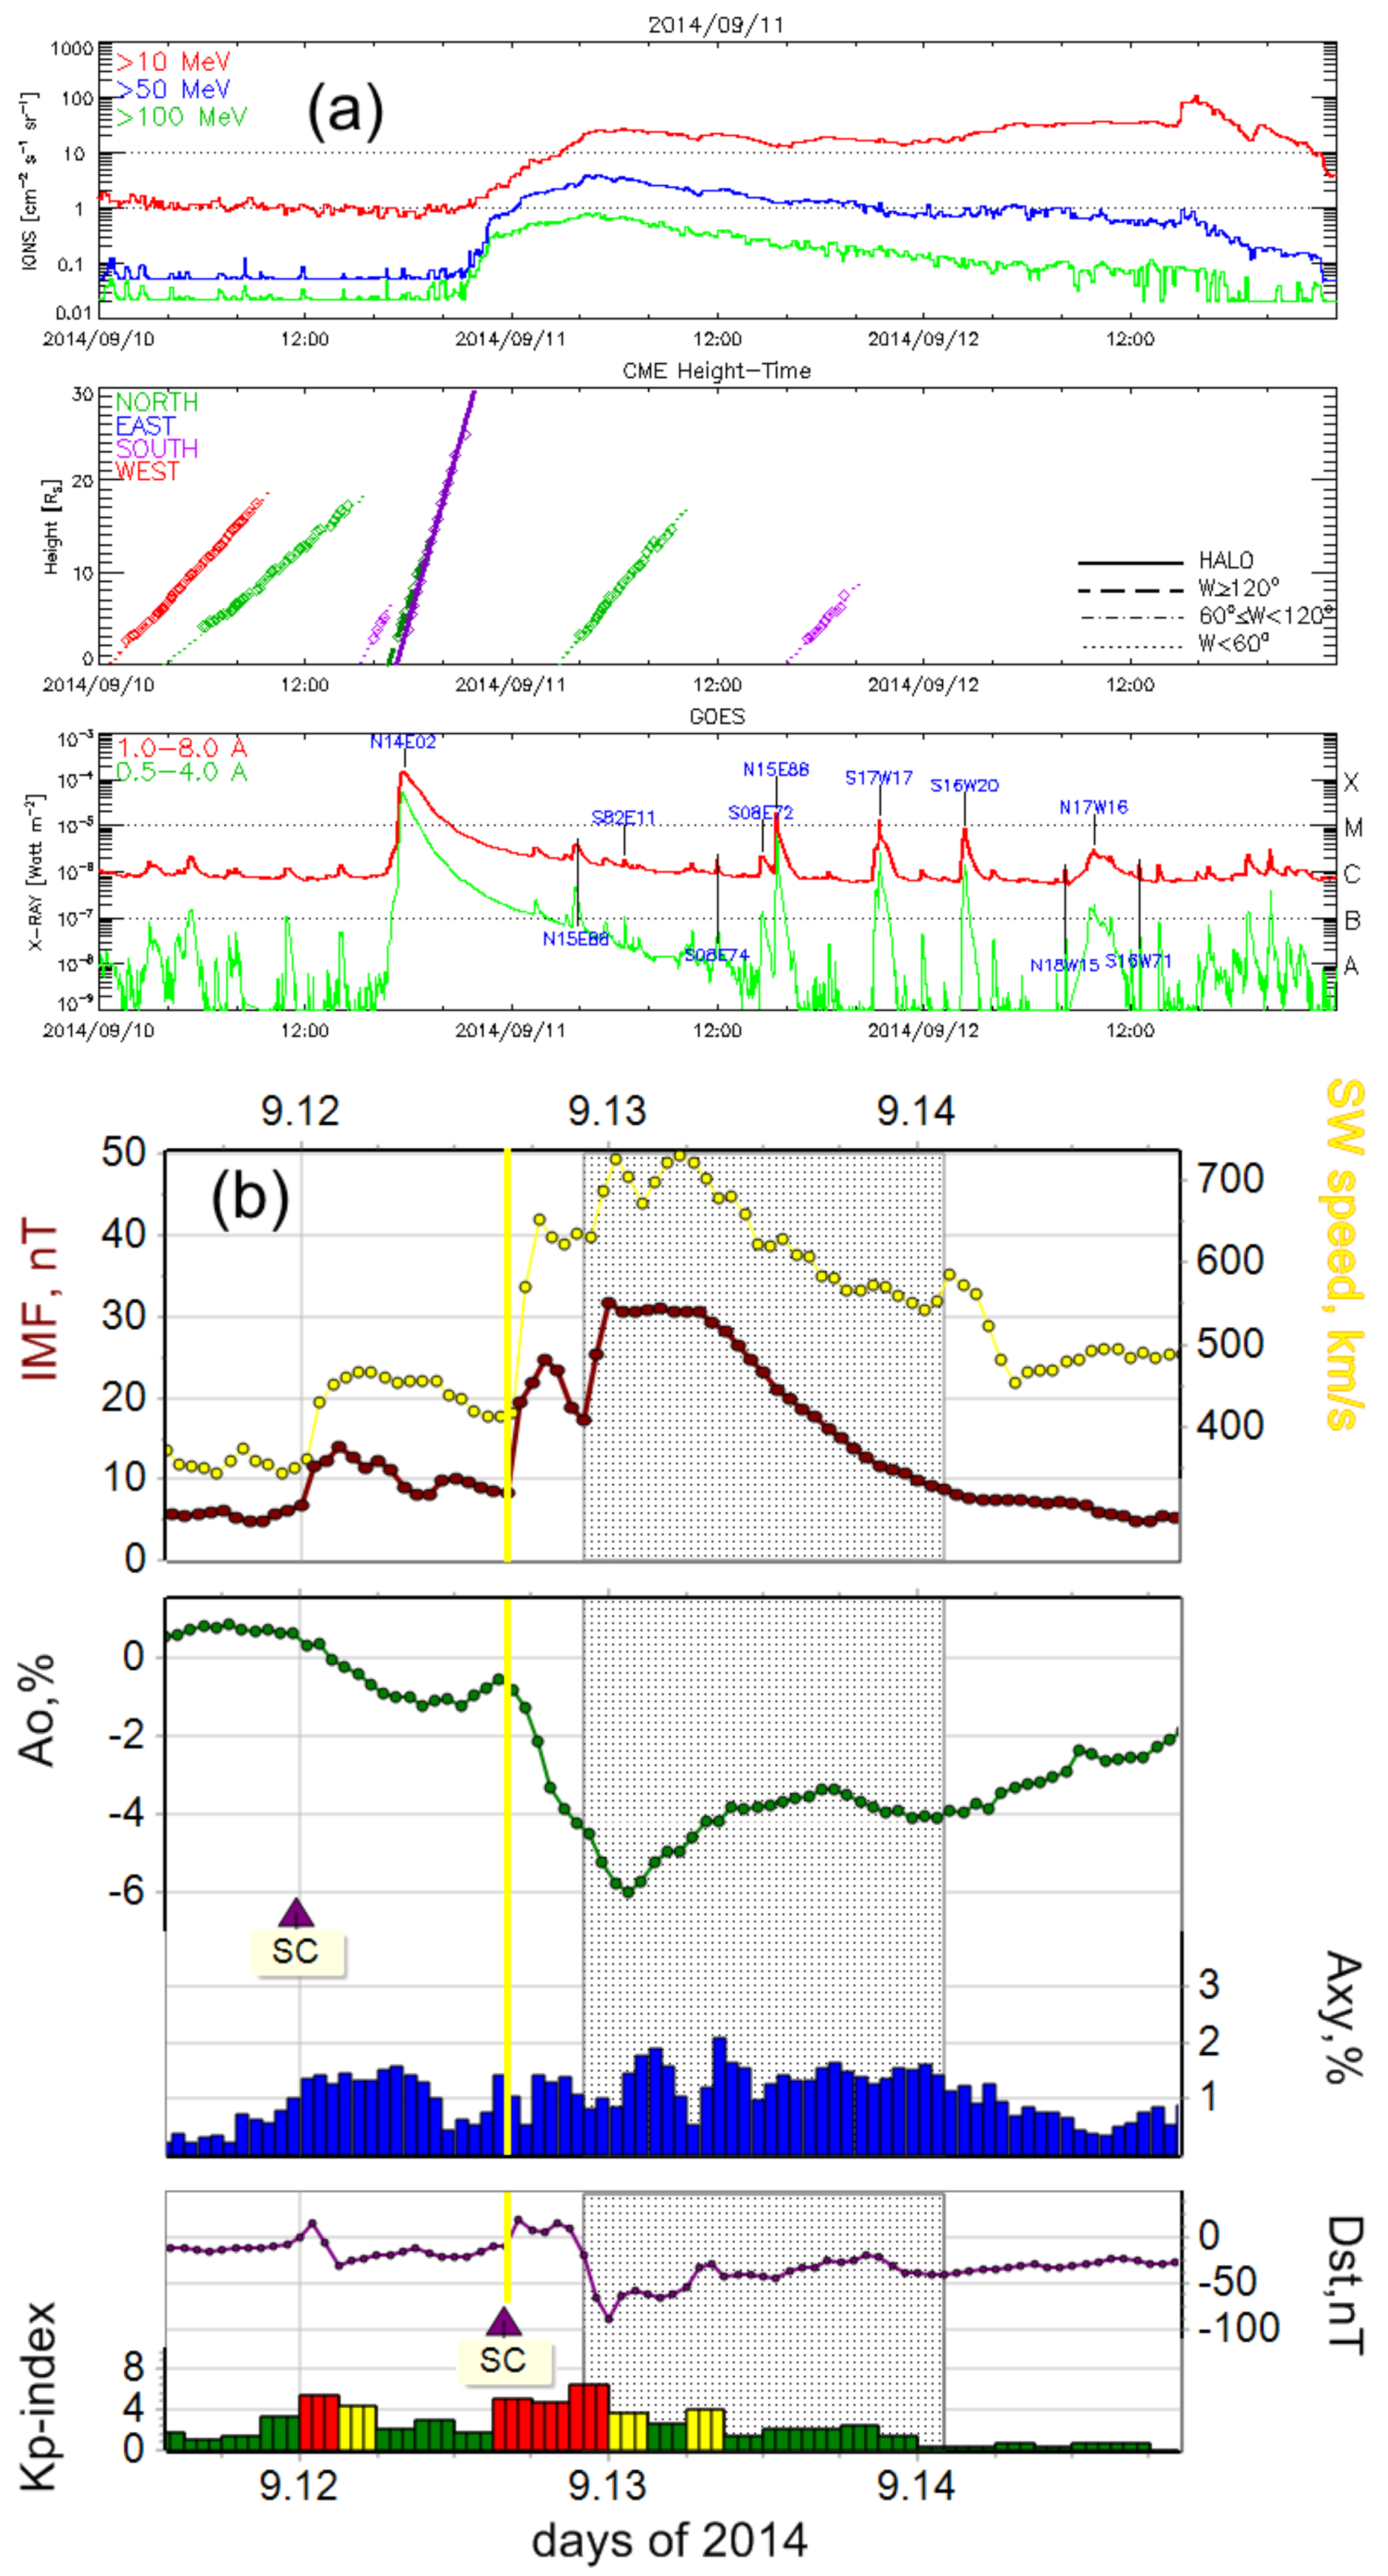
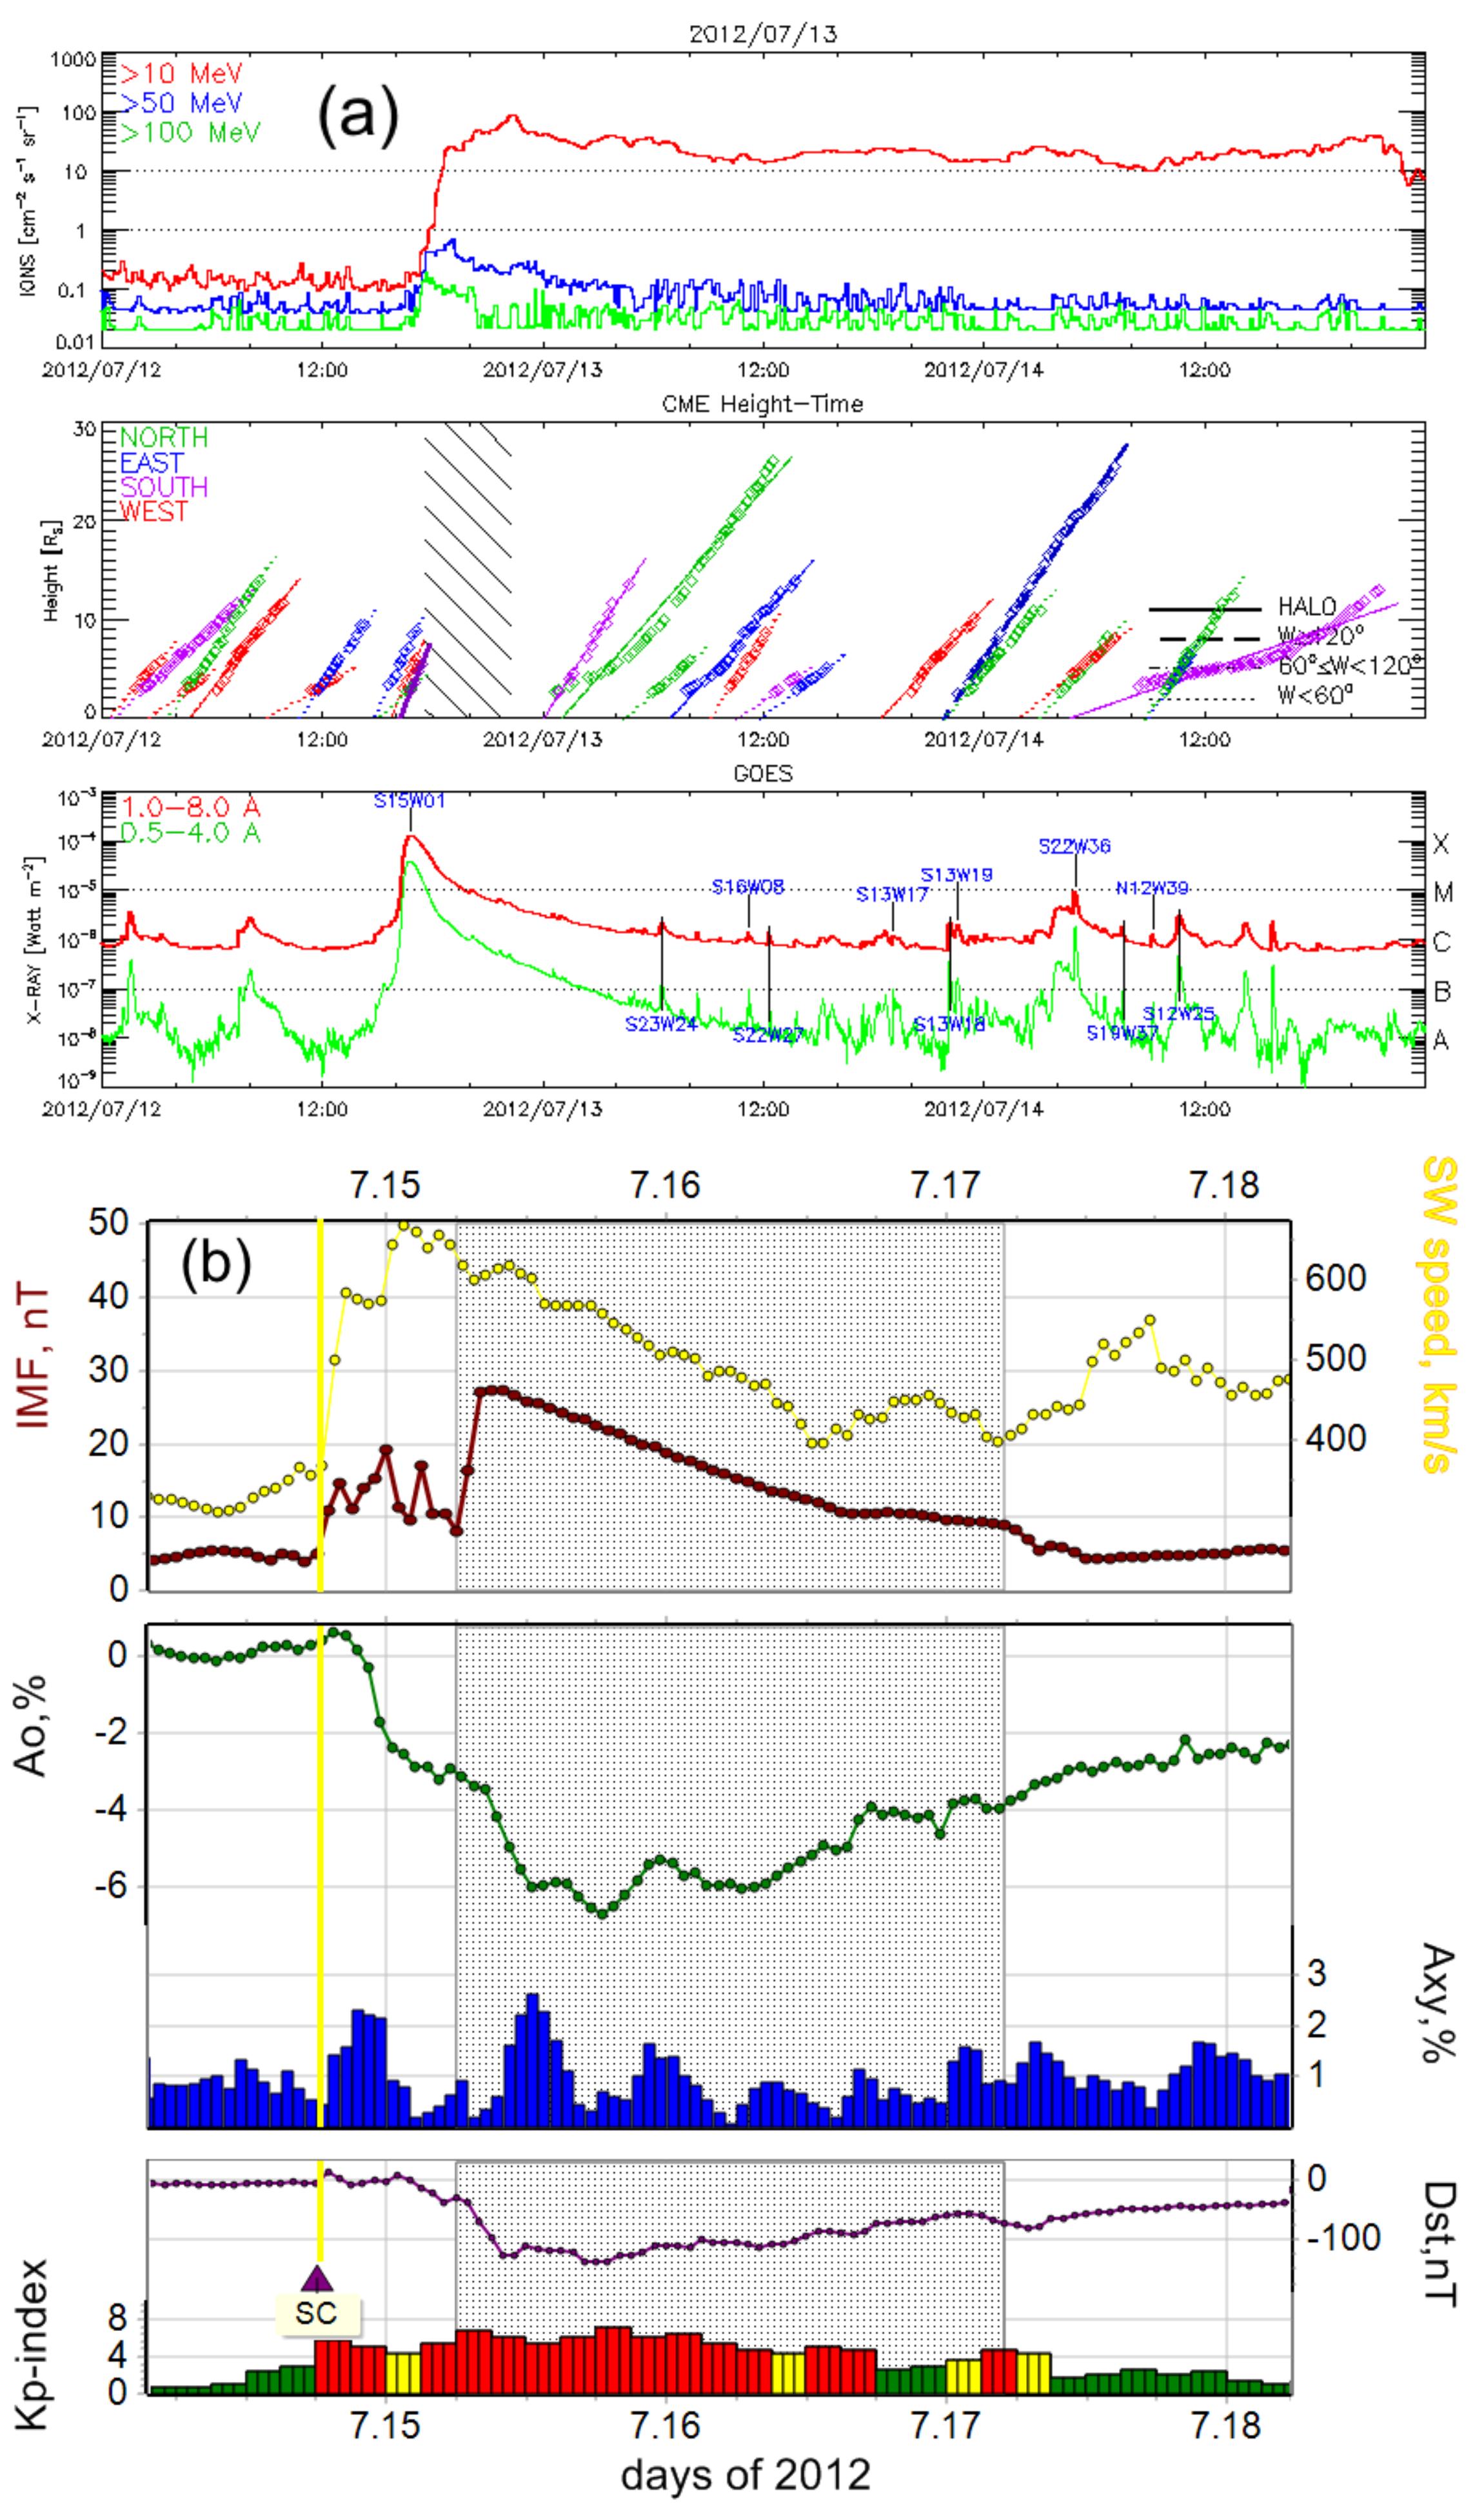
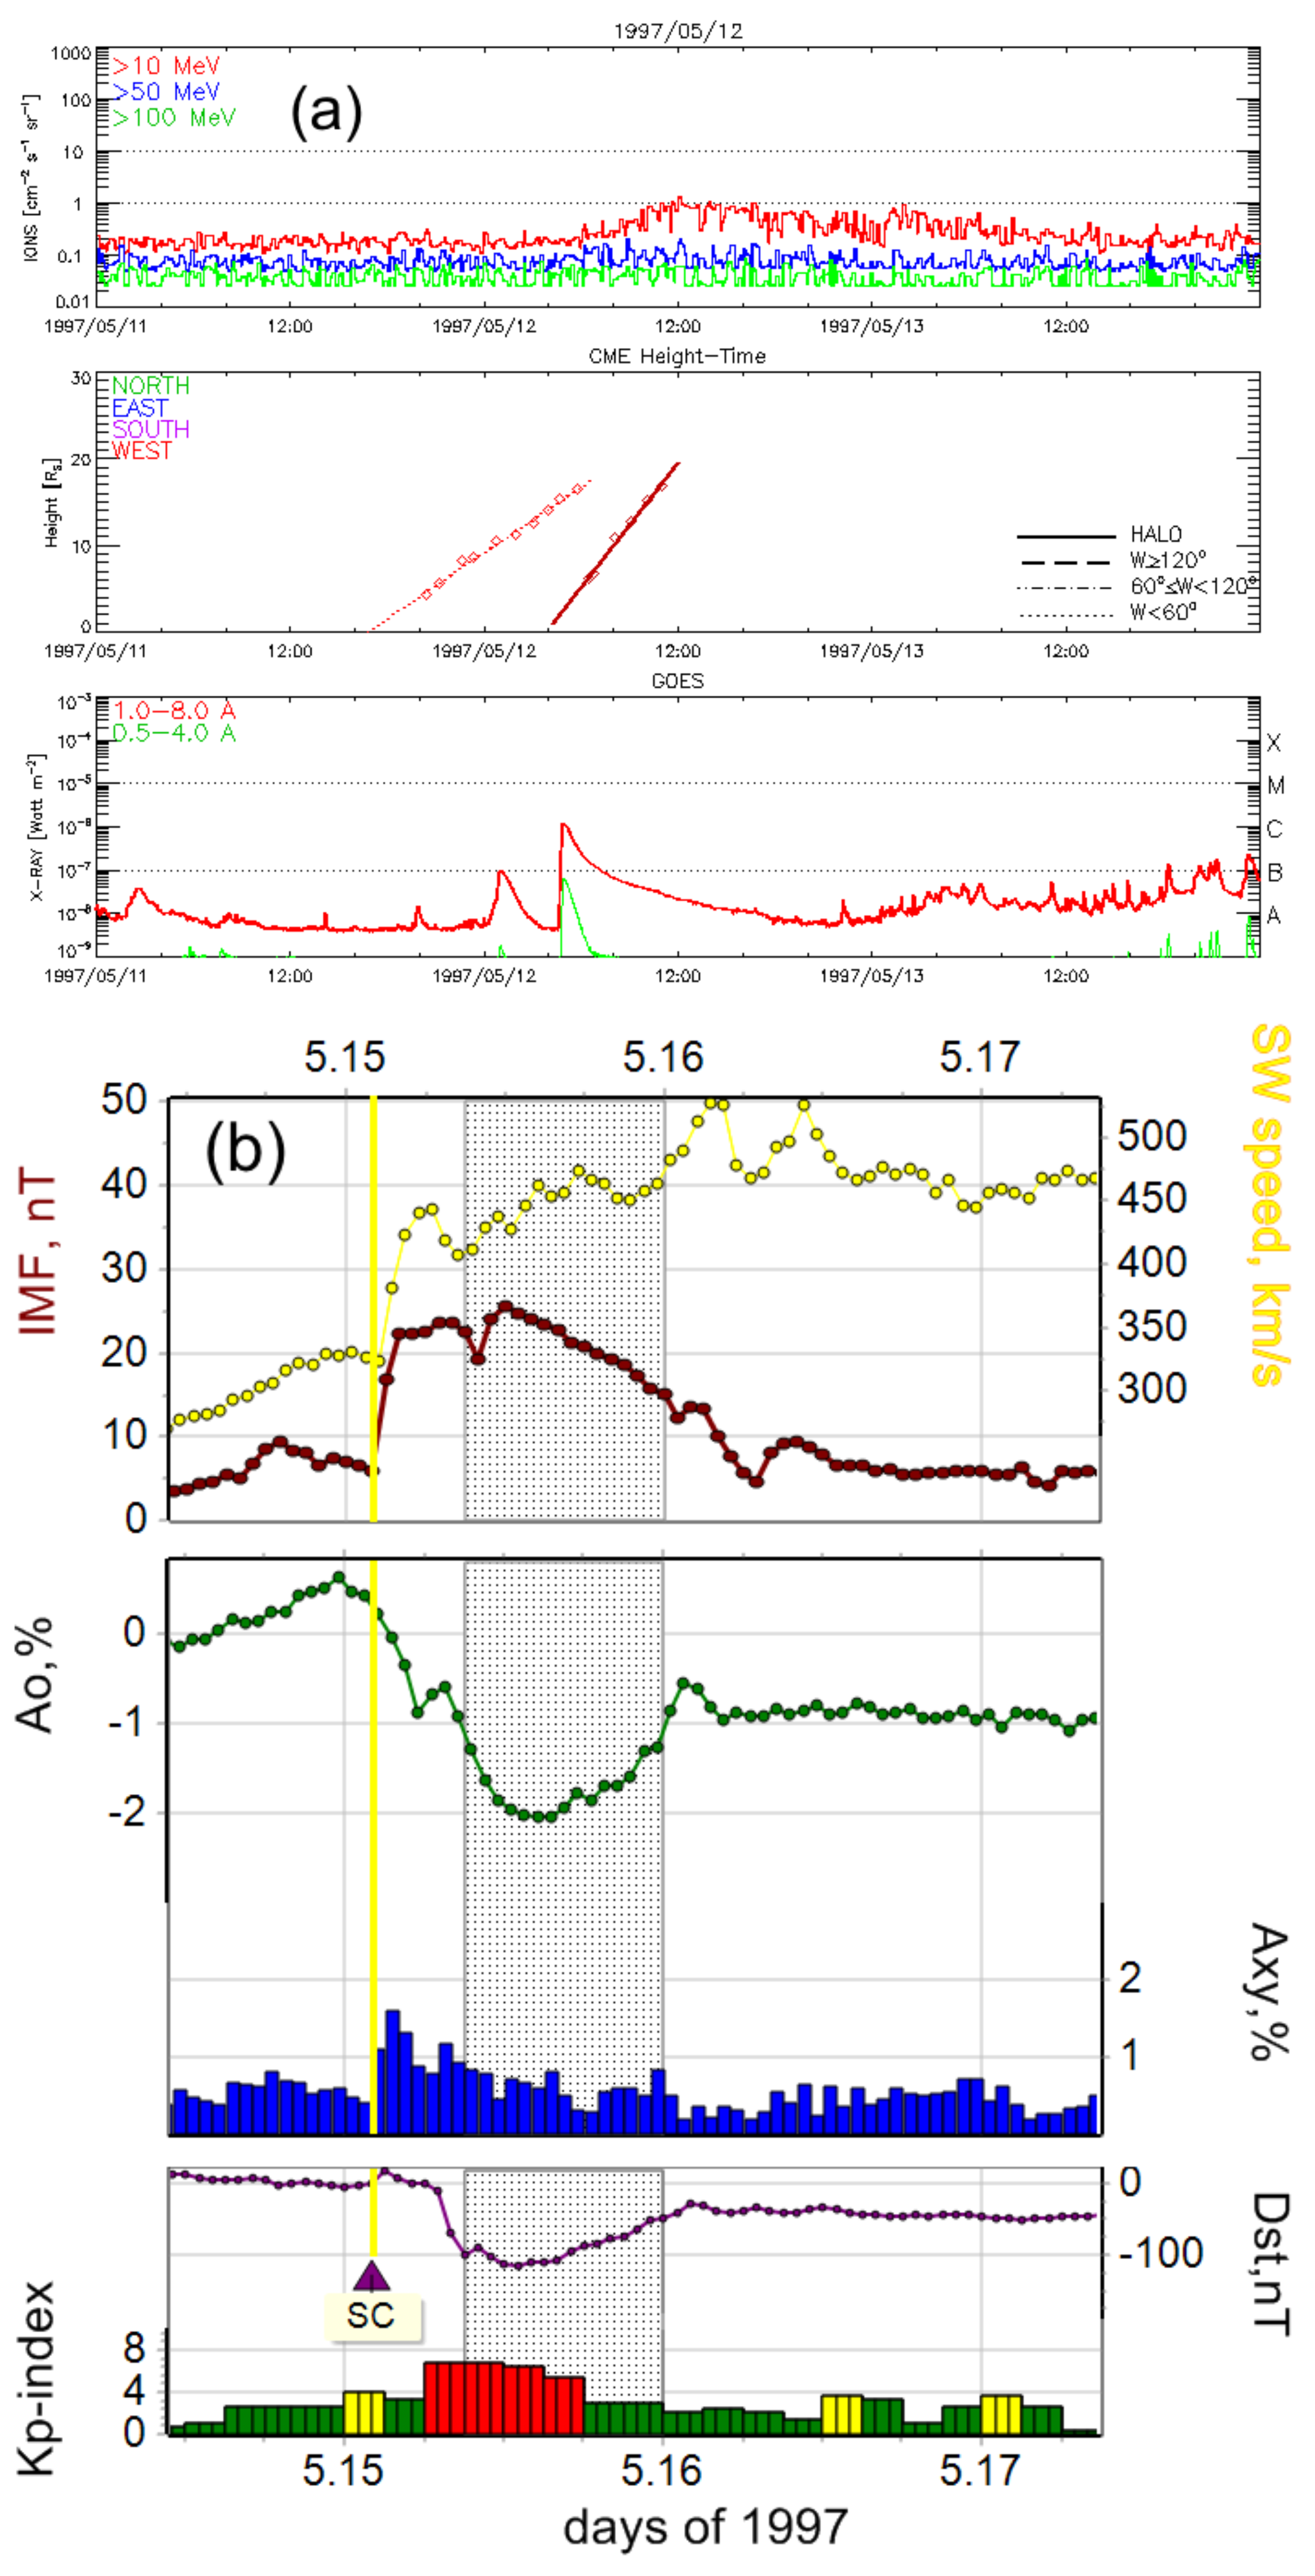
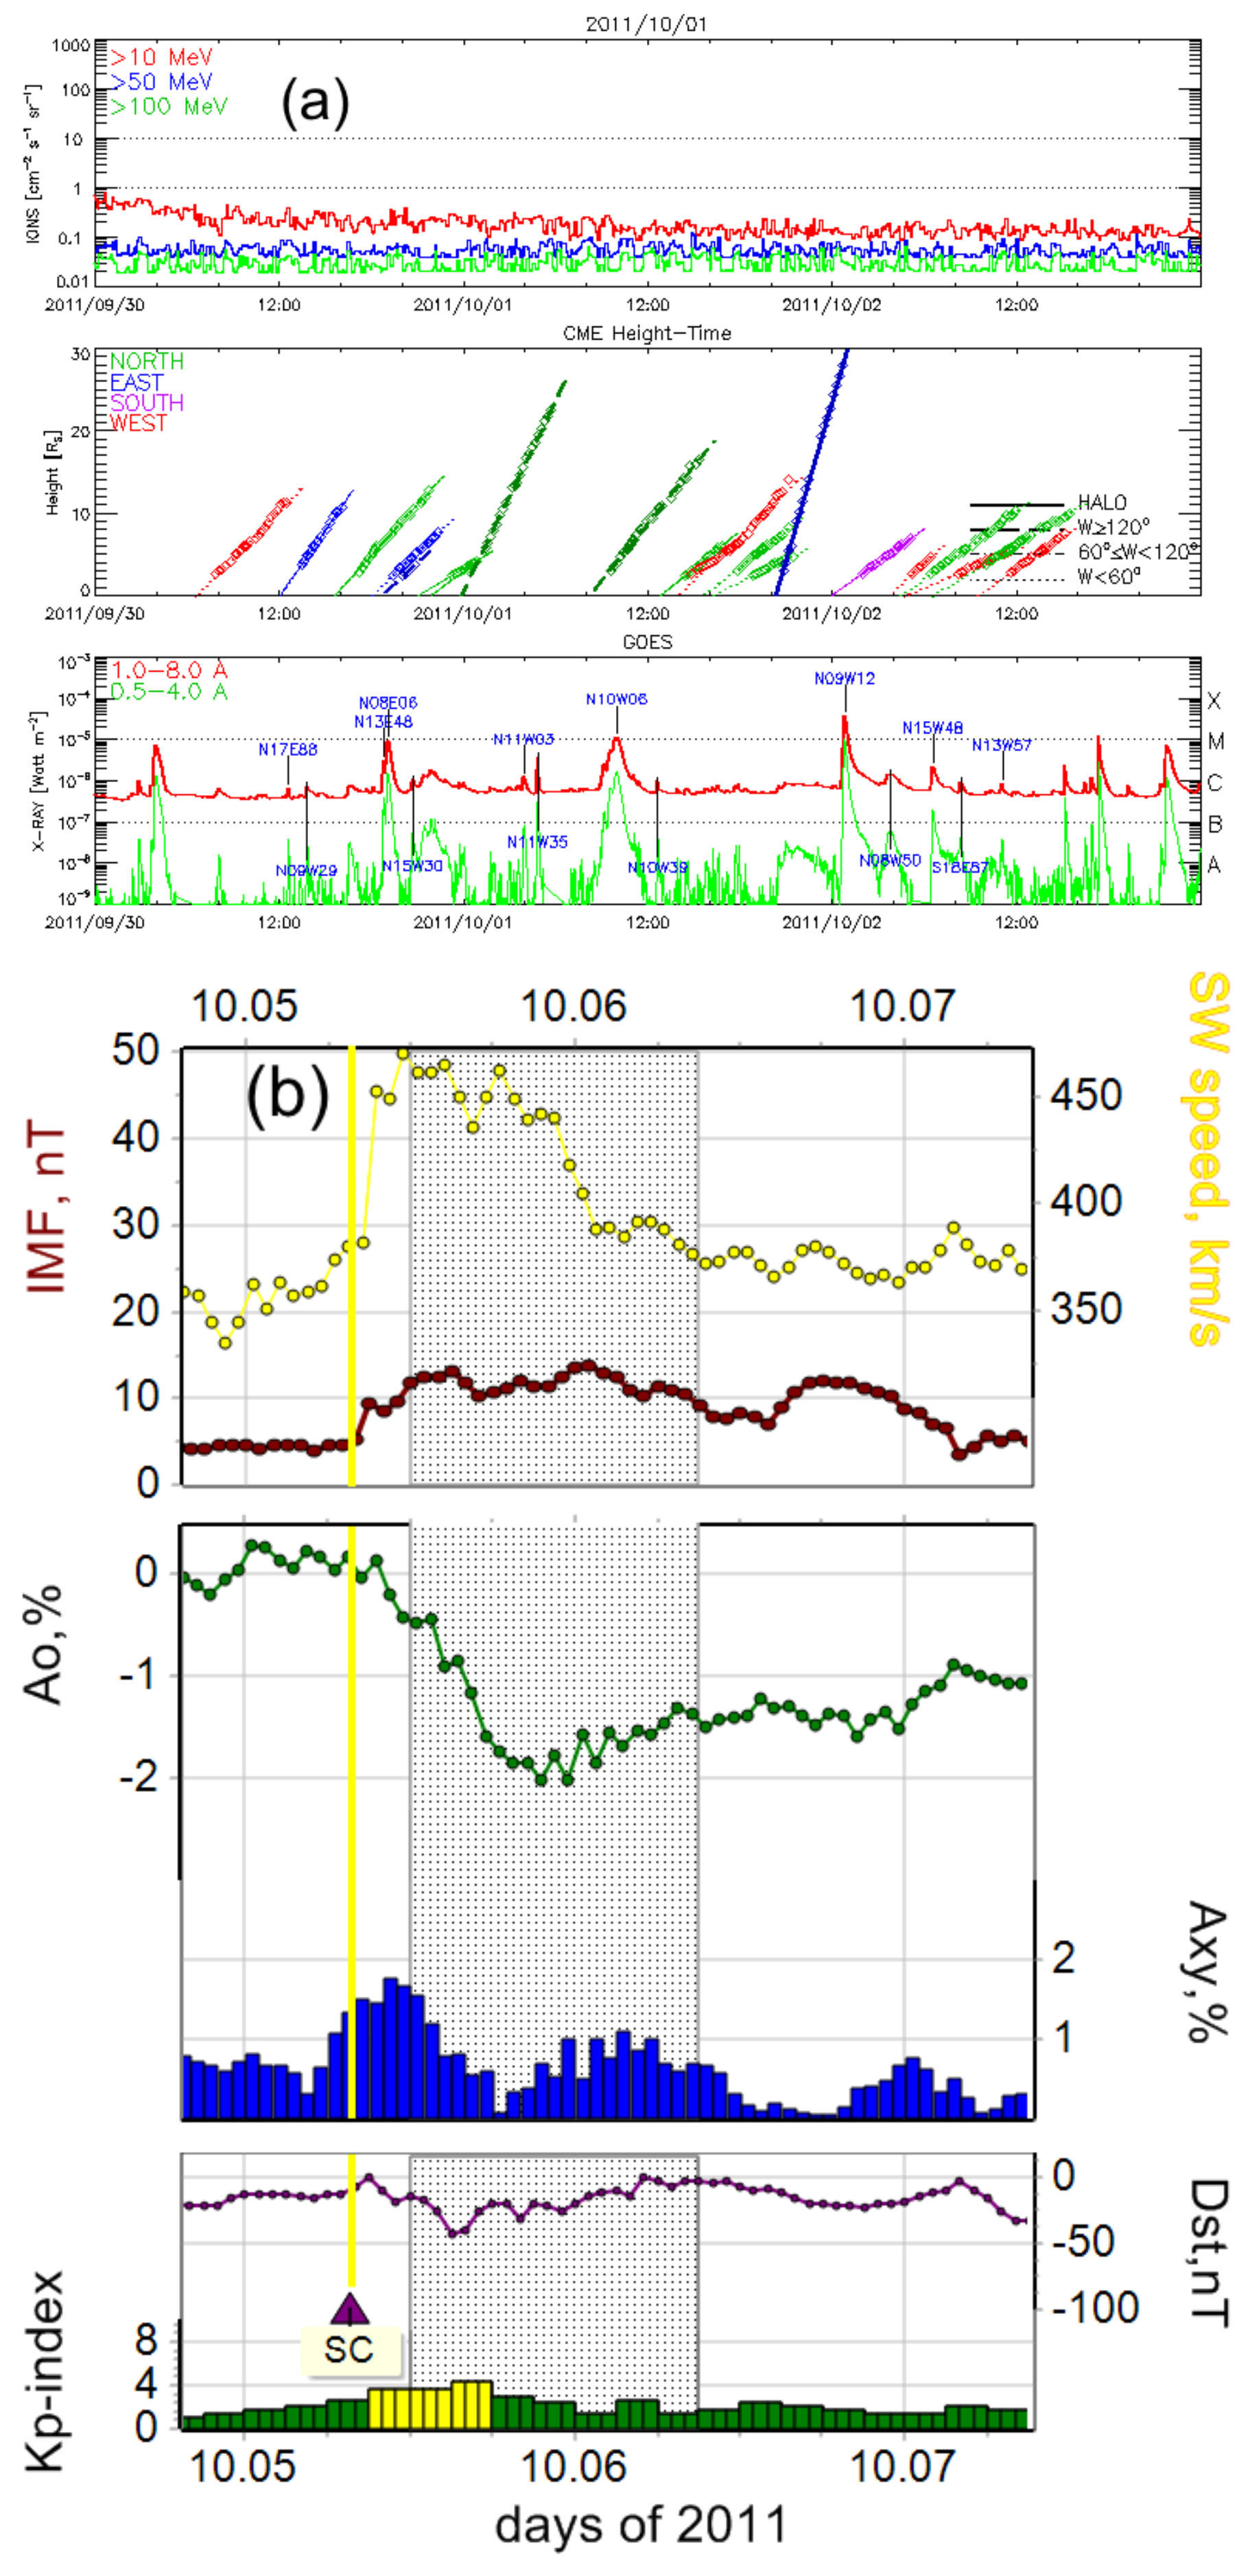
Let us give examples of FDs for each group. Figure 3a, Figure 4a, Figure 5a, Figure 6a and Figure 7a are proton-height/time-X-ray (PHTX) plots from the SOHO/LASCO CME Catalog (https://cdaw.gsfc.nasa.gov/CME_list/daily_plots/sephtx/), which present a three-day overview of SEP events (protons in the E > 10, >50, and >100 MeV GOES channels, ions (cmssr); left axis, upper panel), CME height-time (Height (); left axis, middle panel), and GOES soft X-ray flares (X-ray (W m); left axis), which corresponds to the Class of X-ray Flare (A, B, C, M, or X; right axis, bottom panel). The bottom axis shows the timeline in the format YYYY/MM/DD with 12:00 being noon. Figure 3b, Figure 4b, Figure 5b, Figure 6b, and Figure 7b show the main parameters of the corresponding interplanetary disturbances (ICME) and associated FDs. The upper panels show the behavior of the SW velocity (upper curve, right scale) and the IMF modulus (lower curve, left scale); the middle panels show variations in the CR density (upper curve, left scale, ) and the equatorial component of the vector anisotropy (; bars, right scale); the bottom panel shows changes in geomagnetic activity indices (columns, left scale) and (upper curve, right scale). The shaded area shows the time of passage of a magnetic cloud (MC) past the Earth. An MC is a certain type of interplanetary coronal mass ejection and has a number of characteristics, among which the most significant are a strong magnetic field, smooth rotation of its components at large angles, and low temperature [46,47,48,49].
Figure 3 shows an example of an event from the GLE group. On 13 December 2006 at 02:14 UT, an X3.4 flare in AR10930 (S06W23) was detected on the Sun and was associated with a subsequent Halo-type CME at 02:54 UT (according to the SOHO/LASCO coronagraph) with an initial speed of 1774 km/s, which led to a sharp increase in the proton flux ( = 695 pfu, = 89 pfu) and to the detection of a GLE with an amplitude of 92% according to Oulu neutron monitor station data [17]. On 14 December 2006, the corresponding interplanetary disturbance was registered near the Earth’s orbit (shock arrival at 14:14 UT). The maximum SW velocity in this event was = 955 km/s, the maximum value of the IMF modulus = 17.7 nT, the FD amplitude = 9.6%, and the maximum value of the equatorial component of CR anisotropy was 4.35%. During this event, an MC was registered: it began at 22:00 UT and lasted for 22 h. A very large geomagnetic storm was recorded ( = 8+, = −146 nT).
Figure 4 shows the main parameters of the events on 10 and 12–14 September 2014 from the group. It was associated with an X1.6 class solar flare that occurred on 10 September 2014 at 17:21 UT in AR12158 (N14E02). In the coronagraph data at 18:00 UT, a Halo CME was registered with an initial speed of 1267 km/s. It led to an increase in solar proton fluxes to levels of 30 and 0.8 pfu at and , respectively. On 12 September 2014 at 15:53 UT, an interplanetary disturbance associated with the aforementioned flare and CME was detected on Earth with the following SW, IMF, and CR parameters, respectively: = 730 km/s, = 31.7 nT, = 5.9%, and = 2.09%. The MC passed by the Earth from 22:00 UT on 12 September to 02:00 UT on 14 September. During this event, a moderate geomagnetic storm ( = 6+, = −88 nT) was registered.
Figure 5 shows an example of an event from the group. On 12 July 2012 at 15:37 UT, an X1.4 flare was detected in AR11522 (N13W15), followed by a Halo CME (at 16:48 UT, with an initial speed of 885 km/s). The proton fluxes reached = 90 pfu and = 0.2 pfu. The corresponding ICME reached the Earth’s orbit on 14 July 2012 (shock arrival at 18:09 UT). The maximum recorded SW velocity was = 667 km/s, the maximum value of the IMF modulus = 27.3 nT, the FD amplitude = 7.6%, and the maximum value of the equatorial component of CR anisotropy = 2.62%. An MC was also registered in this event (beginning at 06:00 UT on 15 July, with duration of 47 h). A strong geomagnetic storm was registered ( = 7, = −139 nT).
Figure 6 shows an example of an event from the Weak group. It is associated with a small C1.3 flare that occurred on 12 May 1997 at 04:42 UT in AR8038 (N21W08). A rather slow Halo CME with an initial velocity of 464 km/s was registered in the coronagraph data at 05:30 UT; it led to a slight increase in solar proton fluxes to levels of 0.9 and 0.02 pfu for and , respectively. On 15 May 1997 at 01:59 UT, an interplanetary disturbance associated with this flare and CME was registered on Earth with the following SW, IMF, and CR parameters, respectively: = 527 km/s, = 25.6 nT, = 2.7%, and = 1.6%. The MC passed the Earth on 15 May from 09:00 UT for 15 h. During this event there was a strong geomagnetic storm ( = 7−, = −115 nT).
Figure 7 is an example of an event from the Control group. On 1 October 2011 at 08:56 UT, there was an M1.2 solar flare in AR11305 (N09W04), followed by a partial Halo-type CME (at 09:36 UT, with an initial velocity of 448 km/s). The proton fluxes remained at the background level. The corresponding ICME reached the Earth’s orbit on 5 October 2011 (shock arrival at 07:36 UT). The maximum recorded SW velocity was = 470 km/s, the maximum value of the IMF modulus = 13.8 nT, the FD amplitude = 2.3%, and the maximum value of the equatorial component of CR anisotropy = 1.77%. An MC was also registered in this event (beginning at 12:00 UT on 15 July, duration 21 h). The geomagnetic activity in this event did not exceed the active level ( = 4+, = −43 nT).
It should be noted that in all the above examples there are MCs—special ICME structures characterized by distinctive behavior of some SW and IMF parameters [46,47,48,49]. The presence of MCs in the studied events is not surprising and is due to the chosen central-longitudinal range of solar sources. Of the 201 FDs studied, 142 events were registered since 1995 (when CME identifications began to be available through the SOHO/LASCO coronagraph data). MCs were observed in 61 of these events.
We calculated the average, maximal, and minimal values of the main SW, IMF, CR, and GA parameters for all FDs under study (Table 2). Table 2 shows that the most powerful interplanetary disturbances are associated with solar flares and corresponding CMEs, after which GLE events were recorded: here the largest values of the parameters are identified. During all interplanetary disturbances from this group, geomagnetic storms were registered (in two cases, extreme ones) and large FDs (the FD value varies from 4.7 to 20.4%); all interplanetary disturbances had high maximum speeds near the Earth (from 669 to 1876 km/s) and large values of IMF (from 17.5 to 62 nT).
The FDs from the group and the group are quite similar: all average values overlap with the errors. Small differences are observed between the mean values of the FD amplitude in the group and the group (4.29 and 5.29, respectively), although the maximum values of this parameter are much higher in the group. However, such “dissonance” can be explained by the small number of events in the study groups. Note that in the Weak group and the Control group, with a sufficiently large number of events (55 and 91, respectively), the minimum and maximum values of the FD amplitude practically coincide (minimum = 0.4 and 0.3%, maximum = 9.6 and 9.4%, respectively). The average values of the maximum equatorial CR anisotropy () in all groups are large: 1.53–3.89% (the value = 0.8% is already considered elevated (see, e.g., Papailiou et al. [50], Belov et al. [36]). The maximum values of this parameter, predictably, are in the GLE group, and the minimum values are in the Control group.
In the behavior of geomagnetic activity, it can be noted that severe and extreme storms (max() = 8+…9; max() = 236…400) were recorded in all groups of the studied events, and in the GLE group, there were no events without geomagnetic storms. However, there are events in other groups for which only slightly disturbed or even calm geomagnetic activity was observed (min() = 1…3; min() = 4…15). The maximum absolute values of the Dst-index are also quite large in all groups (max() = −387…−235 nT), while the minimum values are small in all groups (min() = −11…+3 nT) except for the GLE group (min() = −88 nT).
The distributions of the average, maximum, and minimum values of the main interplanetary medium parameters (the SW speed and the IMF modulus) are similar to other ones: the maximum values are in the GLE group, then are approximately the same values in the - and groups, and the smallest values are in the Weak and Control group.
3.3. Relationships between SEP, FD, and GA Parameters
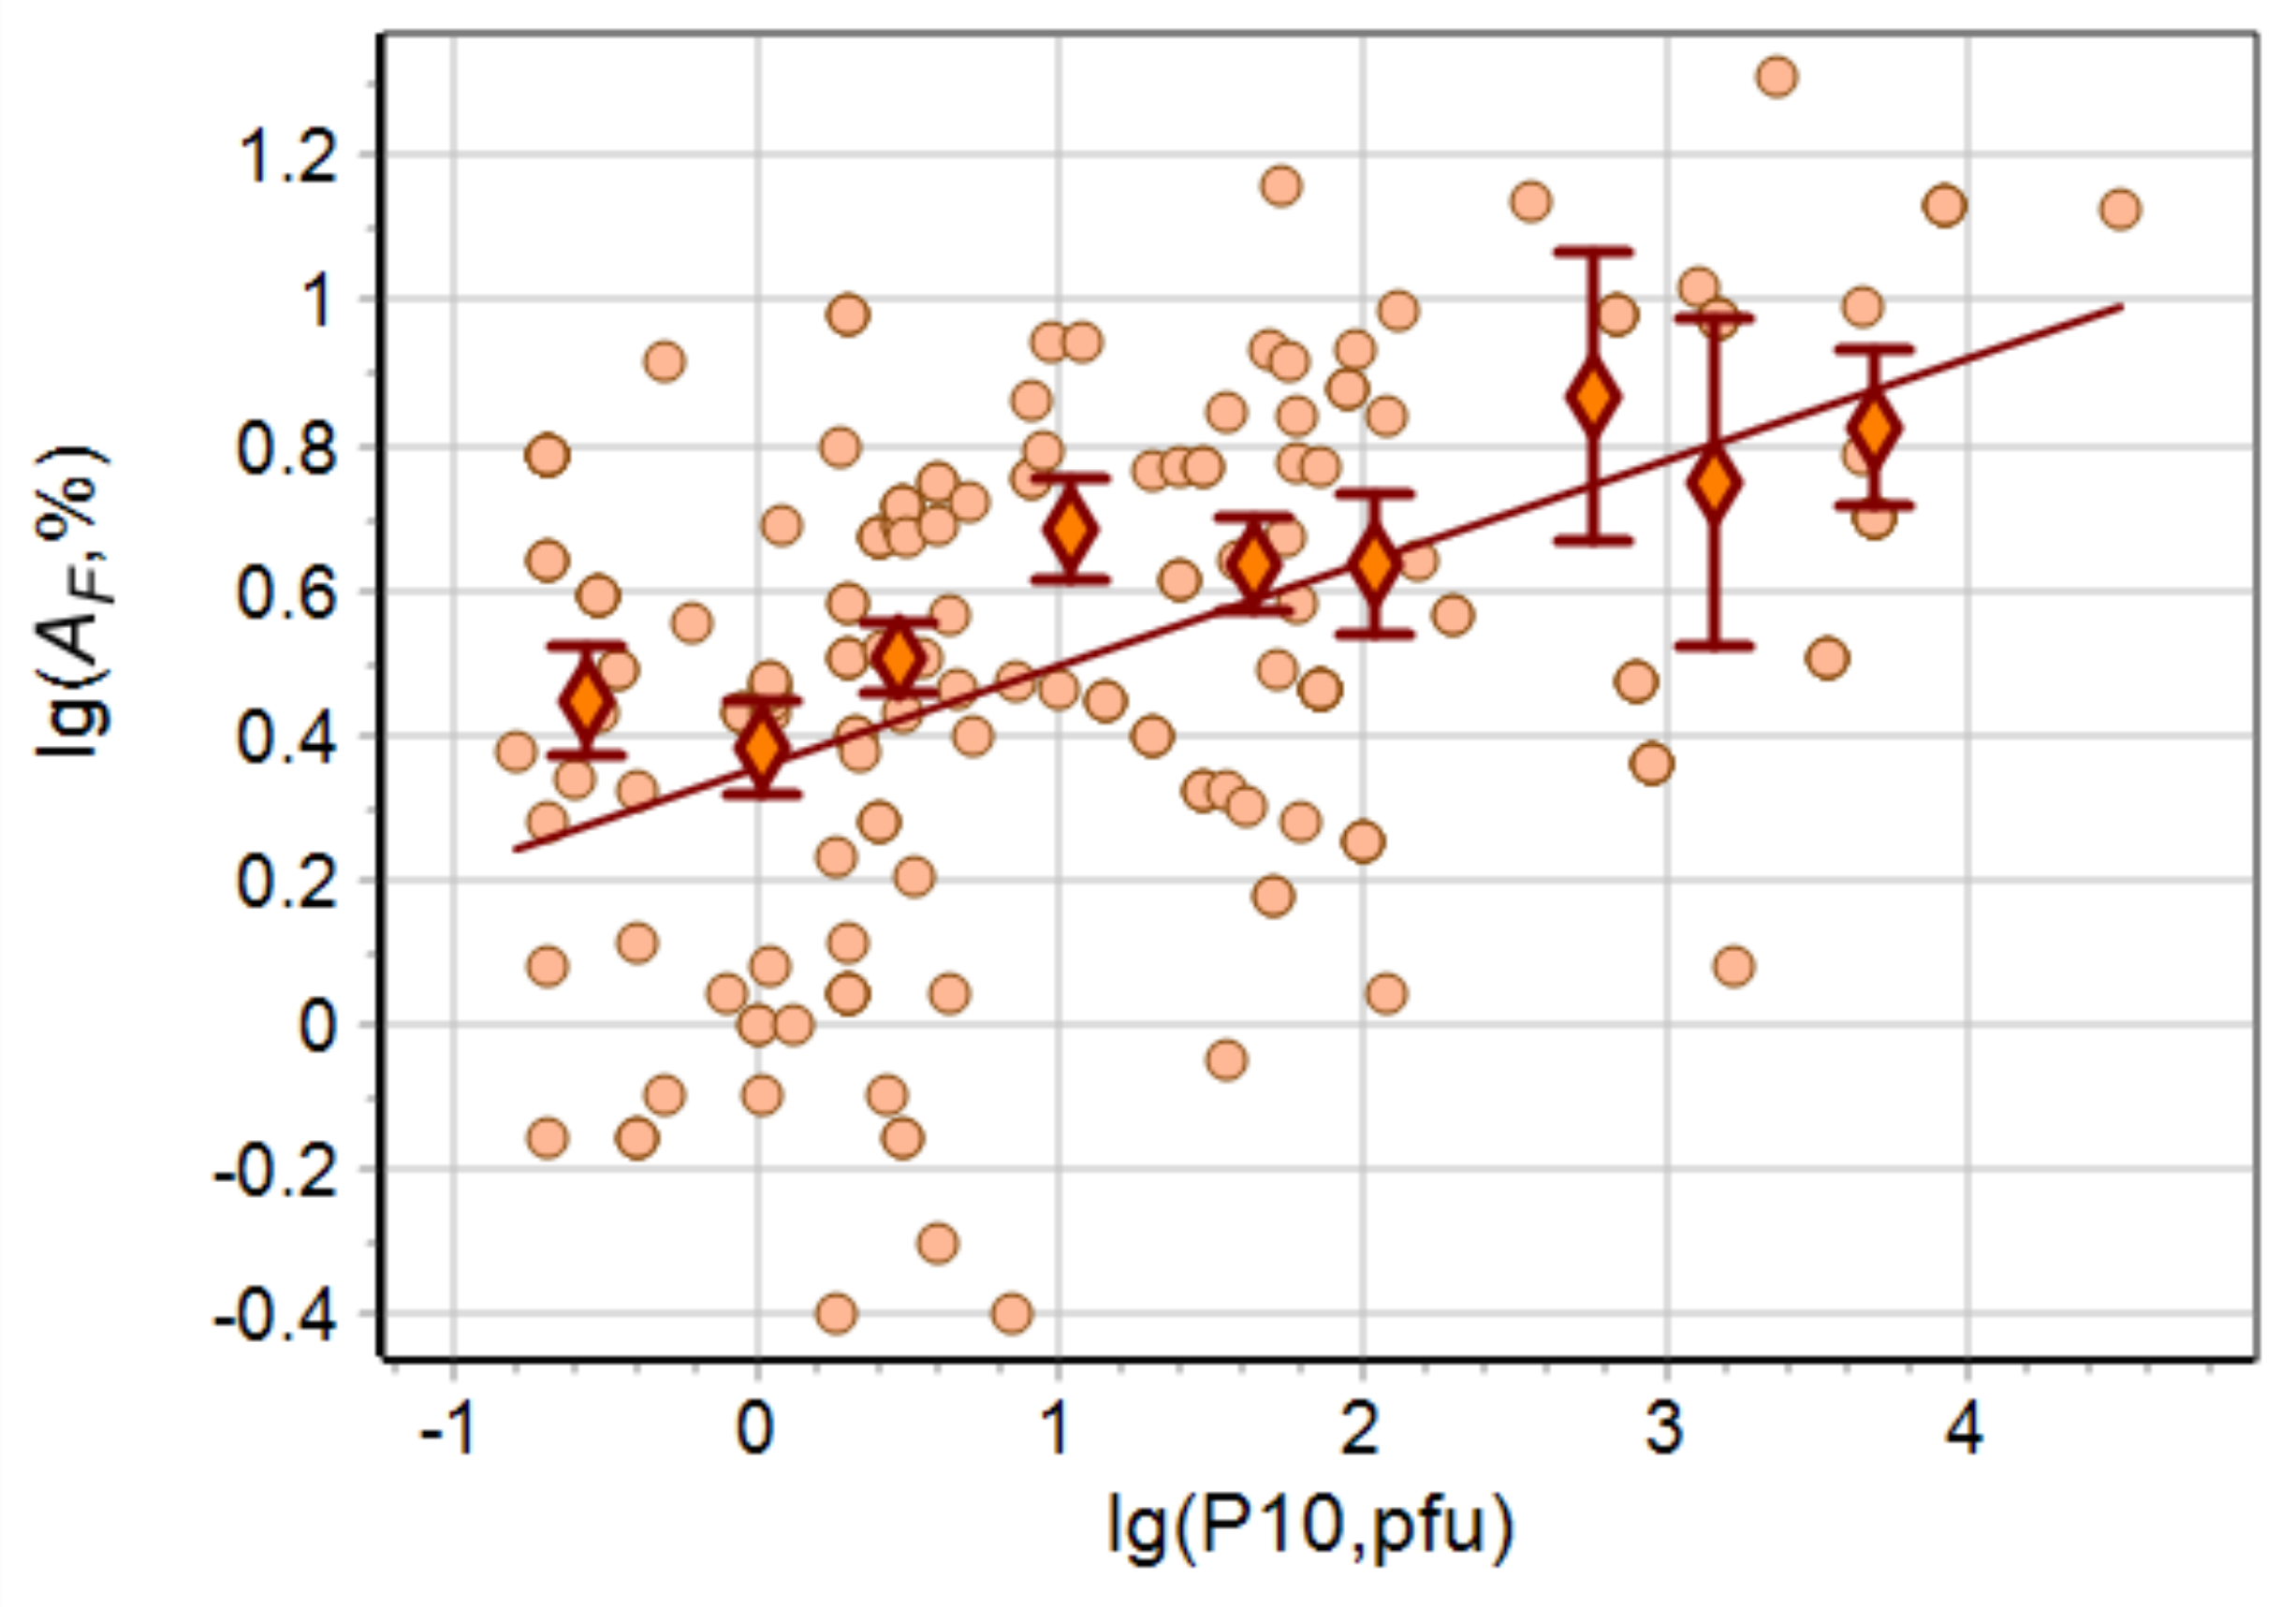
Next, we consider the relationship between the FD amplitude () and the peak proton flux for particles with energy E > 10 MeV () (Figure 8). There is a connection ( = 0.45 ± 0.08) explained by the natural properties of solar sources: mainly this connection is due to both an SEP and an FD being dependent on the speed of the corresponding CME. It is the high that is the key parameter for the increases in particle acceleration, CR modulation, and geomagnetic activity. We further stress that if sufficient statistics are collected for the longitudinal range under study, the correlation will significantly improve.
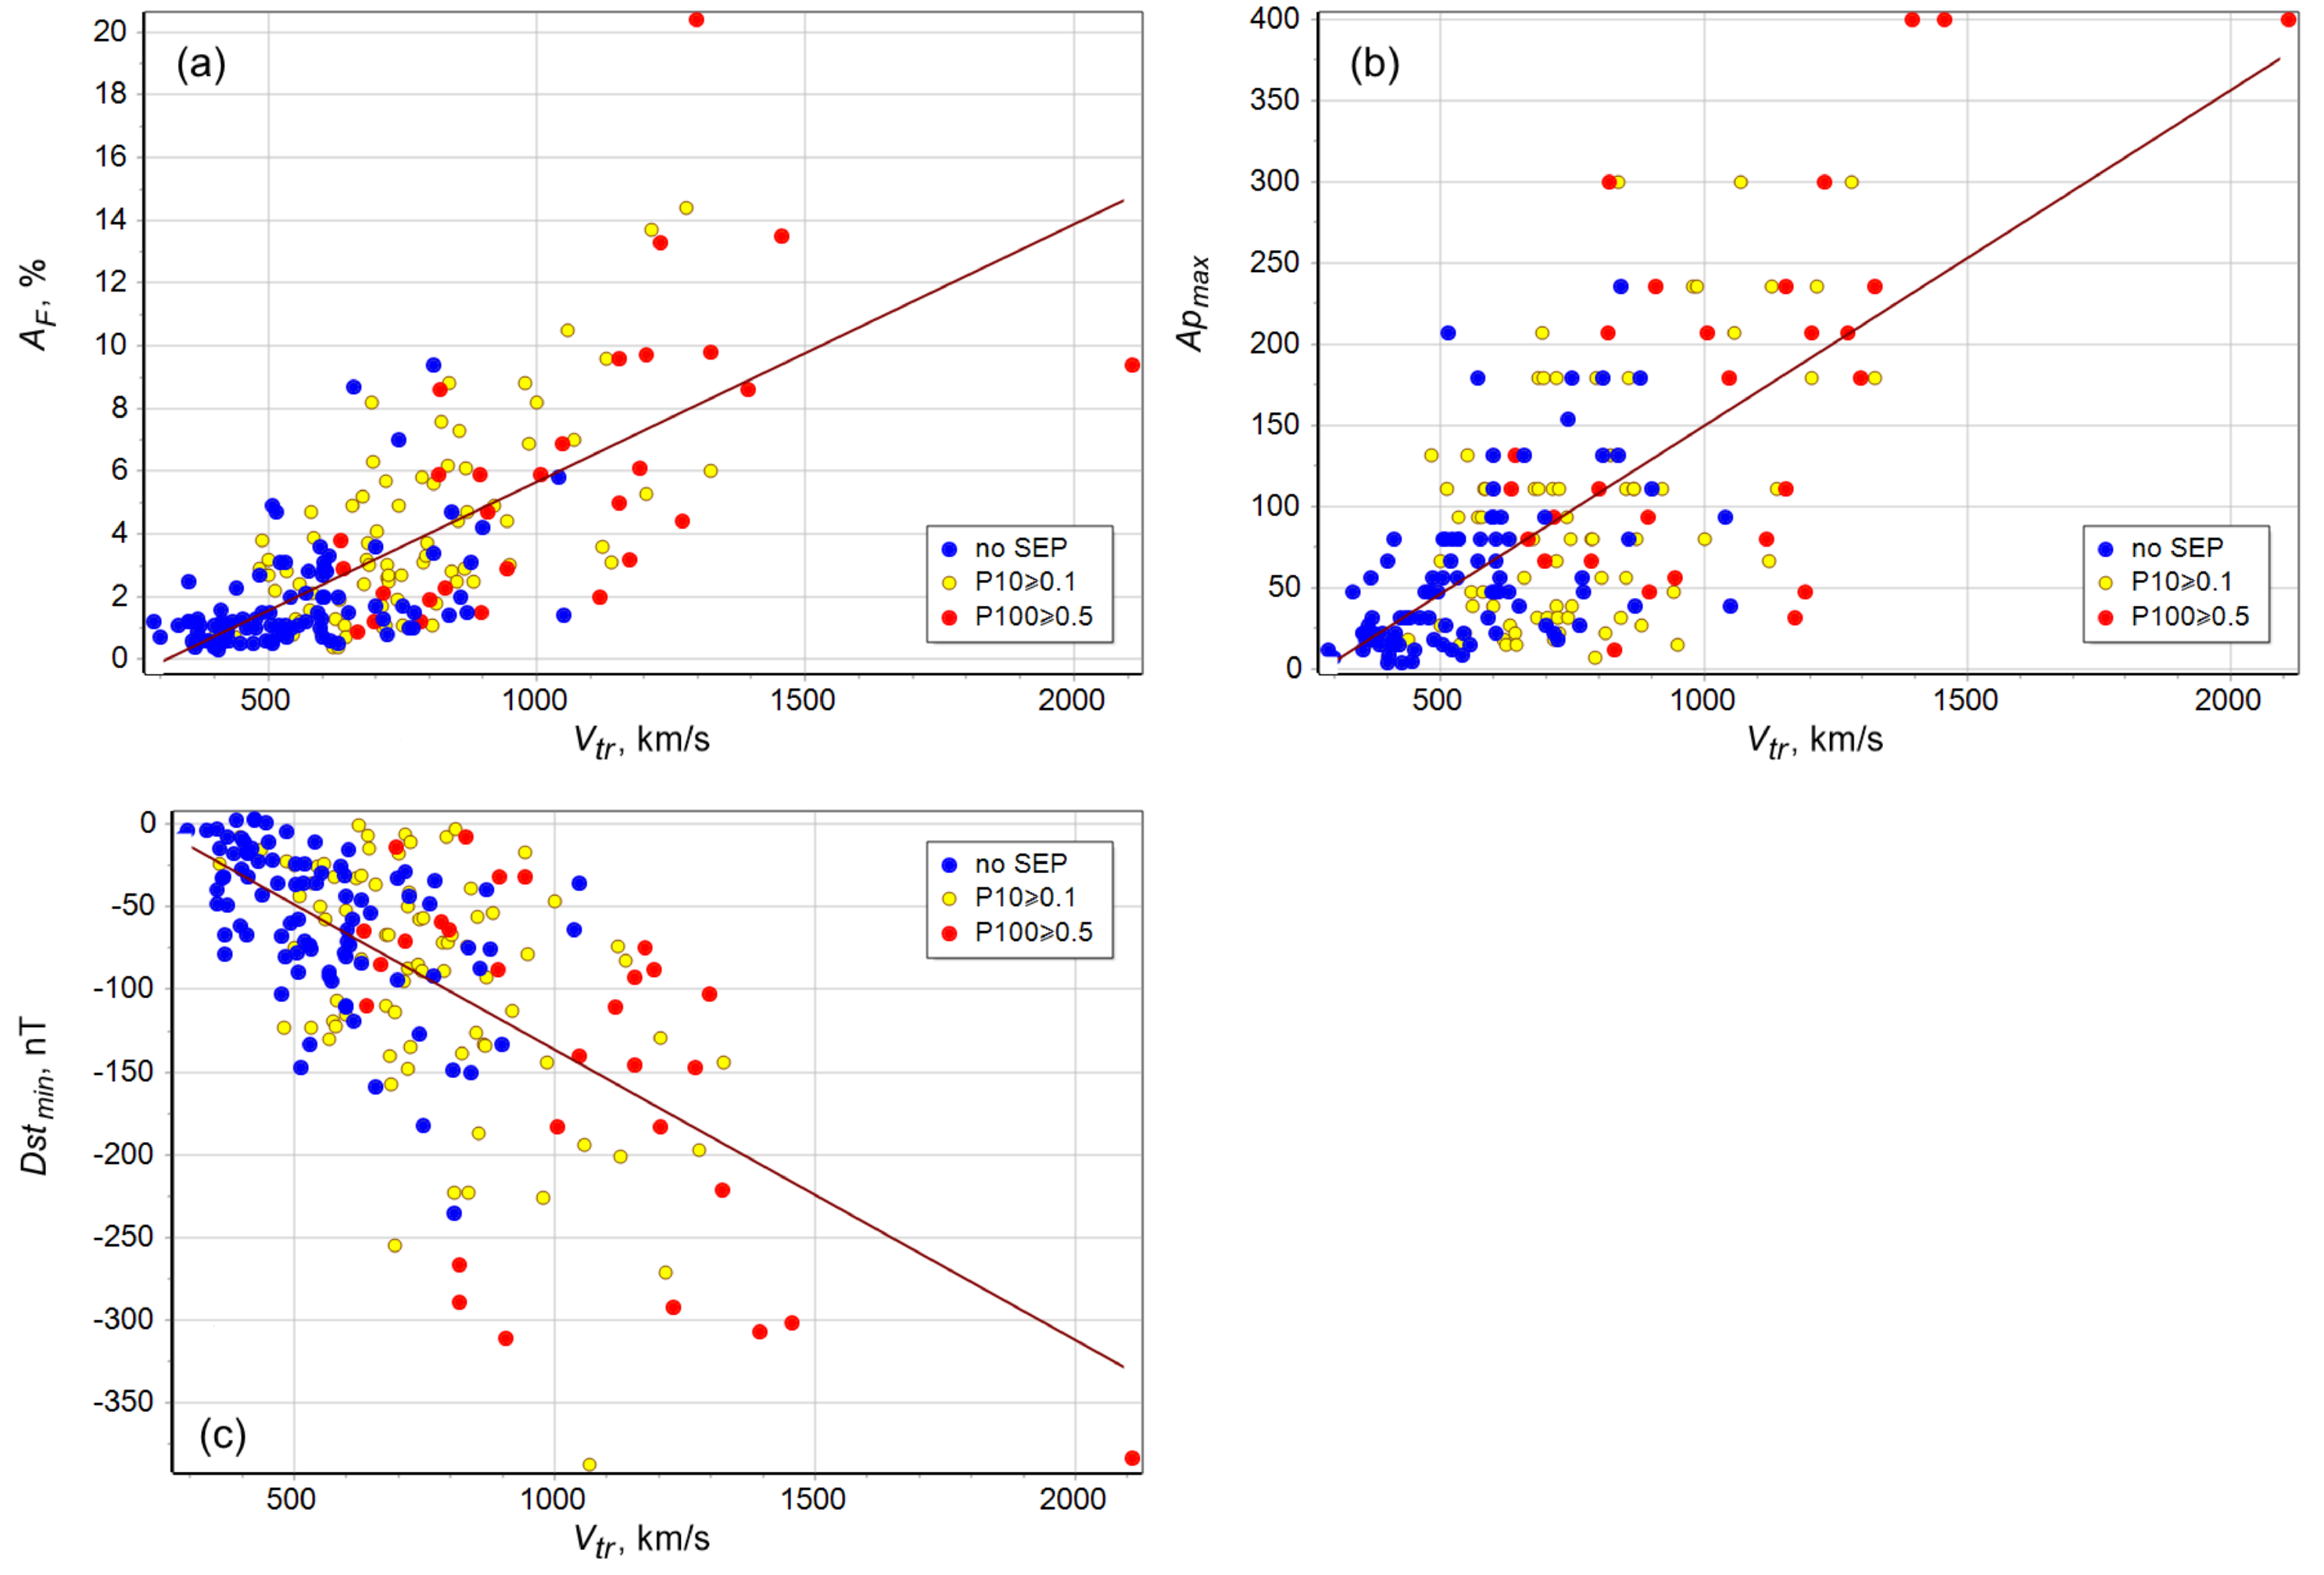
Figure 9a–c show the dependencies of the FD amplitude (), , and -indices of geomagnetic activity on the transit speed of the corresponding ICME () (see definition in Belov et al. [51]) for all the events under study. In the figures, the values of the peak proton flux in SEP events are additionally marked with colors: yellow—FDs associated with flares after which the peak proton fluxes (≥0.1 pfu) for particles with energies E > 10 MeV were recorded; red—FDs associated with flares after which the peak proton fluxes (≥0.5 pfu) for particles with energy E > 100 MeV were recorded; and blue—FDs associated with flares after which no increase in the proton flux was registered. It can be seen that all the listed parameters have a close relationship with the transit speed: = 0.7 ± 0.05, = 0.68 ± 0.05, and = −0.63 ± 0.05. We also note that, in general, the greater the registered proton flux enhancement and the ICME transit velocity, the greater the values of the studied parameters in this work. For example, for a transit speed of <500 km/s, the corresponding FDs are less than 3%, while the maximum -index (i.e., >40) and the minimum -index (<−50 nT) are registered only in every fifth case. It can also be seen that in events without SEPs, a transit velocity of >1000 km/s was recorded only in 2 cases out of 91, and with 0.5 in 15 cases out of 29.
The results shown in Figure 9 confirm that the key parameter in our study is the initial CME velocity and the closely related transit velocity of an interplanetary disturbance.
3.4. Implementation for Space Weather Forecasting
All of the results obtained in this work make it possible to directly utilize the relationship between the characteristics of SEP events and the subsequent CR variations and geomagnetic effects. Consequently, these relations can be used in space weather forecasting. For example, if, after a large solar flare in the central zone with an accompanying fast CME, a GLE is registered, one may assume a magnetic storm will be registered on Earth. A storm will begin, on average, in 35 h and will be at least minor ( = 5, probability 11%) or even extreme ( = 9−…9, probability 33%). In this case, there is the highest probability of the registration (55%) of a major or severe storm ( = 7−…8+). As for changes in the -index, there is a probability of 77% that it will reach minimum values <−100 nT, and a probability of 55% that it will be <−250 nT. The expected maximum speed during an interplanetary disturbance will be greater than 900 km/s with 71% probability, and transit speeds in 77% of cases will be greater than 1100 km/s. The maximum IMF value will be >30 nT with 57% probability.
It is also possible to estimate the amplitude of the corresponding FDs: there is a 100% probability of registering an FD with an amplitude of at least 4.5%, and an FD with an amplitude >13% will occur with a probability of 33%. There is even a probability (11%) of registering FDs with an amplitude of >20%. It is worth noting that adding even one event to the GLE group can change the conclusions drawn, since 9 events are not enough for a full-fledged statistical study. There are more events in other groups, so our conclusions in these groups are more reliable.
Let us discuss the possible influence of the interplanetary disturbances associated with a solar flare and a CME after which proton fluxes for particles with energies E > 100 MeV were recorded (events similar to the group). When observing such a flare, the probability of registering a geomagnetic storm is 90%, an extreme one ( = 9)–5%, strong or severe ( = 7−…8+)–45%, and minor or moderate ( = 5−…6+)–40%. In this case, the minimum values of the -index in 45% of cases will be <−110 nT, and in 35% of cases it will be from −50 to −90 nT. If we consider the maximum speed of an interplanetary disturbance, then in this group, in comparison with the GLE group, the values are much lower: only in 21% of cases will the maximum speed exceed 900 km/s, and in most cases (57%), the speed will be within 550–850 km/s, but transit speeds in 40% of cases will be >1000 km/s. The maximum IMF value in 44% of cases will be >20 nT, and in other cases it will be >10 nT. The amplitude of the corresponding FDs with a probability of 40% will be 4–10%. If there is a solar flare (in the longitudinal range 04 E–35 W) after which proton fluxes surpass 1 pfu (i.e., ≥1 pfu are observed) for particles with energies E > 10 MeV, but <0.5 pfu for particles with energies E > 10 MeV (such as in the group; all these data are usually known in less than 15–20 h), a major or strong magnetic storm should be expected with a probability of 62% in 1.5–2.5 days (depending on the speed of the corresponding CME). There is also the possibility of a minor or moderate magnetic storm ( = 5−…6+, 19%) and unsettled or active geomagnetic activity ( 4+, 20%). Moreover, the probability of registering the minimum value of the Dst-index <−120 nT is 54%, and in 27% of cases, it is from −50 to −120 nT. Events of this type are somewhat slower: the probability of registering a maximum speed of >900 km/s is 9%, and in most cases (61%), a speed of 550–800 km/s will be recorded; transit speeds will be >1000 km/s only in 23% of cases. However, in the vast majority of cases (73%), the maximum IMF value will be >20 nT, and in 23% of cases it will be >30 nT. The probability of registering a large FD (>4%) is also quite high at 54%.
It is natural that when observing a solar flare and CME similar to events from the Control group, one should expect the lowest values of the main interplanetary medium parameters, CR and GA. Thus, there is only a 14% probability that a major or strong magnetic storm will be registered (the same probability is for registering the minimum value of the -index <−100 nT), and there is a probability of 45% that no magnetic storms will be registered at all (and the probability of registering a minimum -index value up to −50 nT is even higher–53%). The maximum values of the SW velocity and the IMF modulus are also much lower. The probability of registering values in the range 550–950 km/s is 26%, and there is a probability of 43% that the maximum SW speed will not exceed 450 km/s. The maximum value of the IMF magnitude ≥20 nT will be recorded with a probability of 26%, and in 30% of cases, it will not reach the value of 10 nT. The probability of registering a large FD (>4%) is low–only 9%. Registration of FDs with an amplitude of ≤2% is the most probable (74%).
We have summarized the above results for probabilities of FDs with different amplitude registrations and various geomagnetic activities in Table 3 below. The results presented here can be used to solve the inverse problem. For example, using data on CR and geomagnetic activity, it is possible to evaluate data on CME characteristics retrospectively prior to the usage of coronagraphs, and good quality CR data are available since the 1950s.
4. Conclusions
In this work, we studied the characteristics of events associated with solar flares and the corresponding CMEs for which both an increase in the solar CR flux (SEP) and a Forbush decrease near Earth (FD) were subsequently recorded in the period from 1975 to 2020. A comparison was also made with the control group of solar events after which no SEPs were observed but FDs were still registered.
Our results confirm the conclusions of earlier works (e.g., Kahler [8], Dierckxsens et al. [12], Papaioannou et al. [14], Belov [16], Lavasa et al. [52], Papaioannou et al. [53]): the probabilities and magnitudes of SEPs are closely related to the characteristics of solar phenomena (maximum power/class and duration of the X-ray flare and CME speed). It is found that the accelerative and modulating efficiencies of powerful solar events are well-correlated. It is shown that there is a relationship between the FD amplitude and the maximum value of the proton flux for particles with energy E > 10 MeV. A close relationship between the main characteristics of CR and GA variations with the transit speed of the corresponding interplanetary disturbances is also revealed. It is shown that CMEs followed by SEPs have a very high probability of creating a large FD in the Earth’s orbit and, further, to cause a geomagnetic storm. At the same time, it can be argued that the greater the registered maximum particle flux in a SEP event and the corresponding CME speed, the higher this probability.
As a result of the analysis, a prognostic tool was obtained that improves the evaluation of the potential geoeffectiveness of different solar phenomena. It has been shown that it is possible to determine an expected FD value and predict changes in the level of geomagnetic activity based on data on the already-started SEP event (solar flare coordinates, initial speed of the corresponding CME, and maximum value of particle flux for different energies).
Author Contributions
Conceptualization, A.B. and M.A.; methodology, N.S. and E.B.; software, A.A.; analysis, M.A., N.S., E.B., A.B. and A.P.; data curation, A.A. and A.P.; writing—original draft preparation, N.S.; writing—review and editing, A.P., M.A. and A.B. All authors have read and agreed to the published version of the manuscript.
Funding
A.A., M.A., A.B. and N.S. are supported by the Russian Science Foundation, grant no. 20-72-10023.
Data Availability Statement
The study made use of the CDAW CME catalogue https://cdaw.gsfc.nasa.gov/CME_list/ and the Forbush Effects and Interplanetary Disturbances Database (FEID, http://spaceweather.izmiran.ru/eng/dbs.html). The FEID database contains CR parameters calculated by the GSM according to data of the world network of neutron monitors (NMDB, http://www01.nmdb.eu/. Moreover, FEID incorporates SW and IMF parameters taken from the OMNI database (https://omniweb.gsfc.nasa.gov/, the list of shock waves—http://isgi.unistra.fr/data_download.php, and the catalogue of flares—https://www.ngdc.noaa.gov/stp/space-weather/solar-data/solar-features/solar-flares/x-rays/goes/xrs/, http://www.swpc.noaa.gov/ftpdir/lists/xray, ftp://ftp.swpc.noaa.gov/pub/indices/events/. FEID further includes data on geomagnetic activity (GA)—ftp://ftp.gfz-potsdam.de/pub/home/obs/kp-ap/wdc/, http://wdc.kugi.kyotou.ac.jp/dstdir/index.html, http://isgi.unistra.fr/datadownload.php. The study further makes use of magnetic clouds (MC), taken from various online catalogs (e.g., https://wind.nasa.gov/mfi/mag_cloud_pub1.html, https://wind.nasa.gov/mfi/mag_cloud_S1.html, https://cdaw.gsfc.nasa.gov/meetings/2010_fluxrope/LWS_CDAW2010_ICMEtbl.html, https://izw1.caltech.edu/ACE/ASC/DATA/level3/icmetable2.htm, http://www.iki.rssi.ru/omni/catalog/.
Acknowledgments
The authors are grateful to the collective worldwide network of cosmic ray stations that provide data for continuous registration of the neutron component: http://cr0.izmiran.ru/ThankYou/OurAcknowledgment.pdf; thanks to the NMDB database (www.nmdb.eu). The work is based on the experimental data of the UNU “Russian National Network of Cosmic Ray Stations”. We used here the CDAW CME catalog (https://cdaw.gsfc.nasa.gov/CME_list/), which is generated and maintained at the CDAW Data Center by NASA and Catholic University of America in cooperation with the Naval Research Laboratory. SOHO is a project of international cooperation between ESA and NASA.
Conflicts of Interest
The authors declare no conflict of interest.
| 1 | |
| 2 |
References
- Forbush, S.E. Three Unusual Cosmic-Ray Increases Possibly Due to Charged Particles from the Sun. Phys. Rev. 1946, 70, 771–772. [Google Scholar] [CrossRef]
- Dorman, L.I.; Miroshnichenko, L.I. Solar Cosmic Rays; Fizmatgiz: Moscow, Russia, 1968. [Google Scholar]
- Shea, M.A.; Smart, D.F. A Summary of Major Solar Proton Events. Sol. Phys. 1990, 127, 297–320. [Google Scholar] [CrossRef]
- Duggal, S.P. Relativistic solar cosmic rays. Rev. Geophys. Space Phys. 1979, 17, 1021–1058. [Google Scholar] [CrossRef]
- Gosling, J.T. The solar flare myth. J. Geophys. Res. Space Phys. 1993, 98, 18937–18950. [Google Scholar] [CrossRef]
- Reames, D.V. Solar energetic particles: A paradigm shift. Rev. Geophys. 1995, 33, 585–589. [Google Scholar] [CrossRef]
- Zhang, J.; Temmer, M.; Gopalswamy, N.; Malandraki, O.; Nitta, N.V.; Patsourakos, S.; Shen, F.; Vršnak, B.; Wang, Y.; Webb, D.; et al. Earth-affecting solar transients: A review of progresses in solar cycle 24. Prog. Earth Planet. Sci. 2021, 8, 56. [Google Scholar] [CrossRef] [PubMed]
- Kahler, S.W. The correlation between solar energetic particle peak intensities and speeds of coronal mass ejections: Effects of ambient particle intensities and energy spectra. J. Geophys. Res. Space Phys. 2001, 106, 20947–20956. [Google Scholar] [CrossRef]
- Bazilevskaya, G.A.; Sladkova, A.I.; Svirzhevskaya, A.K. Features of the solar X-ray bursts related to solar energetic particle events. Adv. Space Res. 2006, 37, 1421–1425. [Google Scholar] [CrossRef]
- Cliver, E.W.; Ling, A.G.; Belov, A.; Yashiro, S. Size distributions of solar flares and solar energetic particle events. Astrophys. J. Lett. 2012, 756, L29. [Google Scholar] [CrossRef]
- Miteva, R.; Klein, K.L.; Malandraki, O.; Dorrian, G. Solar Energetic Particle Events in the 23rd Solar Cycle: Interplanetary Magnetic Field Configuration and Statistical Relationship with Flares and CMEs. Sol. Phys. 2013, 282, 579–613. [Google Scholar] [CrossRef] [Green Version]
- Dierckxsens, M.; Tziotziou, K.; Dalla, S.; Patsou, I.; Marsh, M.S.; Crosby, N.B.; Malandraki, O.; Tsiropoula, G. Relationship between Solar Energetic Particles and Properties of Flares and CMEs: Statistical Analysis of Solar Cycle 23 Events. Sol. Phys. 2015, 290, 841–874. [Google Scholar] [CrossRef] [Green Version]
- Gopalswamy, N.; Mäkelä, P.; Akiyama, S.; Yashiro, S.; Xie, H.; Thakur, N.; Kahler, S.W. Large Solar Energetic Particle Events Associated with Filament Eruptions Outside of Active Regions. Astrophys. J. Lett. 2015, 806, 8. [Google Scholar] [CrossRef] [Green Version]
- Papaioannou, A.; Sandberg, I.; Anastasiadis, A.; Kouloumvakos, A.; Georgoulis, M.K.; Tziotziou, K.; Tsiropoula, G.; Jiggens, P.; Hilgers, A. Solar flares, coronal mass ejections and solar energetic particle event characteristics. J. Space Weather. Space Clim. 2016, 6, A42. [Google Scholar] [CrossRef] [Green Version]
- Richardson, I.G.; von Rosenvinge, T.T.; Cane, H.V. 25 MeV solar proton events in Cycle 24 and previous cycles. Adv. Space Res. 2017, 60, 755–767. [Google Scholar] [CrossRef] [Green Version]
- Belov, A.V. Flares, ejections, proton events. Geomagn. Aeron. 2017, 57, 727–737. [Google Scholar] [CrossRef]
- Belov, A.V.; Eroshenko, E.A.; Kryakunova, O.N.; Kurt, V.G.; Yanke, V.G. Ground level enhancements of solar cosmic rays during the last three solar cycles. Geomagn. Aeron. 2010, 50, 21–33. [Google Scholar] [CrossRef]
- Reames, D.V.; Cliver, E.W.; Kahler, S.W. Abundance Enhancements in Impulsive Solar Energetic-Particle Events with Associated Coronal Mass Ejections. Sol. Phys. 2014, 289, 3817–3841. [Google Scholar] [CrossRef] [Green Version]
- Paassilta, M.; Raukunen, O.; Vainio, R.; Valtonen, E.; Papaioannou, A.; Siipola, R.; Riihonen, E.; Dierckxsens, M.; Crosby, N.; Malandraki, O.; et al. Catalogue of 55–80 MeV solar proton events extending through solar cycles 23 and 24. J. Space Weather Space Clim. 2017, 7, A14. [Google Scholar] [CrossRef]
- Vlasova, N.A.; Logachev, Y.I.; Bazilevskaya, G.A.; Ginzburg, E.A.; Daibog, E.I.; Ishkov, V.N.; Kalegaev, V.V.; Lazutin, L.L.; Nguyen, M.D.; Surova, G.M.; et al. Catalogs of Solar Proton Events as a Tool for Studying Space Weather. Cosm. Res. 2022, 60, 151–164. [Google Scholar] [CrossRef]
- Forbush, S.E. On the Effects in Cosmic-Ray Intensity Observed During the Recent Magnetic Storm. Phys. Rev. 1937, 51, 1108–1109. [Google Scholar] [CrossRef]
- Lockwood, J.A. Forbush Decreases in the Cosmic Radiation. Space Sci. Rev. 1971, 12, 658–715. [Google Scholar] [CrossRef]
- Cane, H.V. Coronal Mass Ejections and Forbush Decreases. Space Sci. Rev. 2000, 93, 55–77. [Google Scholar] [CrossRef]
- Belov, A.V.; Eroshenko, E.A.; Oleneva, V.A.; Struminsky, A.B.; Yanke, V.G. What determines the magnitude of forbush decreases? Adv. Space Res. 2001, 27, 625–630. [Google Scholar] [CrossRef]
- Belov, A.V. Forbush effects and their connection with solar, interplanetary and geomagnetic phenomena. Proc. Int. Astron. Union 2009, S257, 439–450. [Google Scholar] [CrossRef] [Green Version]
- Richardson, I.G.; Cane, H.V. Galactic Cosmic Ray Intensity Response to Interplanetary Coronal Mass Ejections/Magnetic Clouds in 1995–2009. Sol. Phys. 2011, 270, 609–627. [Google Scholar] [CrossRef]
- Belov, A.; Abunin, A.; Abunina, M.; Eroshenko, E.; Oleneva, V.; Yanke, V.; Papaioannou, A.; Mavromichalaki, H.; Gopalswamy, N.; Yashiro, S. Coronal Mass Ejections and Non-recurrent Forbush Decreases. Sol. Phys. 2014, 289, 3949–3960. [Google Scholar] [CrossRef]
- Masías-Meza, J.J.; Dasso, S.; Démoulin, P.; Rodriguez, L.; Janvier, M. Superposed epoch study of ICME sub-structures near Earth and their effects on Galactic cosmic rays. Astron. Astrophys. 2016, 592, A118. [Google Scholar] [CrossRef] [Green Version]
- Papaioannou, A.; Belov, A.; Abunina, M.; Eroshenko, E.; Abunin, A.; Anastasiadis, A.; Patsourakos, S.; Mavromichalaki, H. Interplanetary Coronal Mass Ejections as the Driver of Non-recurrent Forbush Decreases. Astrophys. J. Lett. 2020, 890, 101. [Google Scholar] [CrossRef]
- Abunina, M.A.; Belov, A.V.; Shlyk, N.S.; Eroshenko, E.A.; Abunin, A.A.; Oleneva, V.A.; Pryamushkina, I.I.; Yanke, V.G. Forbush Effects Created by Coronal Mass Ejections with Magnetic Clouds. Geomagn. Aeron. 2021, 61, 678–687. [Google Scholar] [CrossRef]
- Melkumyan, A.A.; Belov, A.V.; Abunina, M.A.; Shlyk, N.C.; Abunin, A.A.; Oleneva, V.A.; Yanke, V.G. Similarities and Differences between Forbush Decreases Associated with Streams from Coronal Holes, Filament Ejections, and Ejections from Active Regions. Geomagn. Aeron. 2022, 62, 159–177. [Google Scholar] [CrossRef]
- Belov, A.; Eroshenko, E.; Oleneva, V.; Yanke, V. Ground level enhancements of the solar cosmic rays and Forbush decreases in 23rd solar cycle. In Proceedings of the 31st International Cosmic Ray Conference, Lodz, Poland, 7–15 July 2009; Volume 1004. [Google Scholar]
- Belov, A.; Eroshenko, E.; Yanke, V.; Oleneva, V.; Abunin, A.; Abunina, M.; Papaioannou, A.; Mavromichalaki, H. The Global Survey Method Applied to Ground-level Cosmic Ray Measurements. Sol. Phys. 2018, 293, 68. [Google Scholar] [CrossRef]
- Belov, A.; Garcia, H.; Kurt, V.; Mavromichalaki, H.; Gerontidou, M. Proton Enhancements and Their Relation to the X-ray Flares During the Three Last Solar Cycles. Sol. Phys. 2005, 229, 135–159. [Google Scholar] [CrossRef]
- Belov, A.; Kurt, V.; Mavromichalaki, H.; Gerontidou, M. Peak-Size Distributions of Proton Fluxes and Associated Soft X-ray Flares. Sol. Phys. 2007, 246, 457–470. [Google Scholar] [CrossRef]
- Belov, A.V.; Abunina, M.A.; Abunin, A.A.; Eroshenko, E.A.; Oleneva, V.A.; Yanke, V.G. Cosmic-ray vector anisotropy and local characteristics of the interplanetary medium. Geomagn. Aeron. 2017, 57, 389–397. [Google Scholar] [CrossRef]
- Matzka, J.; Stolle, C.; Yamazaki, Y.; Bronkalla, O.; Morschhauser, A. The Geomagnetic Kp Index and Derived Indices of Geomagnetic Activity. Space Weather 2021, 19, e02641. [Google Scholar] [CrossRef]
- Huttunen, K.E.J.; Schwenn, R.; Bothmer, V.; Koskinen, H.E.J. Properties and geoeffectiveness of magnetic clouds in the rising, maximum and early declining phases of solar cycle 23. Ann. Geophys. 2005, 23, 625–641. [Google Scholar] [CrossRef] [Green Version]
- Lynch, B.J.; Zurbuchen, T.H.; Fisk, L.A.; Antiochos, S.K. Internal structure of magnetic clouds: Plasma and composition. J. Geophys. Res. (Space Phys.) 2003, 108, 1239. [Google Scholar] [CrossRef]
- Lynch, B.J.; Gruesbeck, J.R.; Zurbuchen, T.H.; Antiochos, S.K. Solar cycle-dependent helicity transport by magnetic clouds. J. Geophys. Res. (Space Phys.) 2005, 110, A08107. [Google Scholar] [CrossRef] [Green Version]
- Marubashi, K.; Lepping, R.P. Long-duration magnetic clouds: A comparison of analyses using torus- and cylinder-shaped flux rope models. Ann. Geophys. 2007, 25, 2453–2477. [Google Scholar] [CrossRef]
- Yermolaev, Y.I.; Nikolaeva, N.S.; Lodkina, I.G.; Yermolaev, M.Y. Catalog of large-scale solar wind phenomena during 1976–2000. Cosm. Res. 2009, 47, 81–94. [Google Scholar] [CrossRef]
- Richardson, I.G.; Cane, H.V. Near-Earth Interplanetary Coronal Mass Ejections During Solar Cycle 23 (1996–2009): Catalog and Summary of Properties. Sol. Phys. 2010, 264, 189–237. [Google Scholar] [CrossRef]
- Gopalswamy, N.; Xie, H.; Mäkelä, P.; Akiyama, S.; Yashiro, S.; Kaiser, M.L.; Howard, R.A.; Bougeret, J.L. Interplanetary Shocks Lacking Type II Radio Bursts. Astrophys. J. Lett. 2010, 710, 1111–1126. [Google Scholar] [CrossRef]
- Kim, R.S.; Gopalswamy, N.; Cho, K.S.; Moon, Y.J.; Yashiro, S. Propagation Characteristics of CMEs Associated with Magnetic Clouds and Ejecta. Sol. Phys. 2013, 284, 77–88. [Google Scholar] [CrossRef]
- Burlaga, L.; Sittler, E.; Mariani, F.; Schwenn, R. Magnetic loop behind an interplanetary shock: Voyager, Helios, and IMP 8 observations. J. Geophys. Res. Space Phys. 1981, 86, 6673–6684. [Google Scholar] [CrossRef]
- Burlaga, L.F.; Behannon, K.W. Magnetic Clouds—Voyager Observations Between 2AU and 4AU. Sol. Phys. 1982, 81, 181–192. [Google Scholar] [CrossRef]
- Klein, L.W.; Burlaga, L.F. Interplanetary magnetic clouds at 1 AU. J. Geophys. Res. Space Phys. 1982, 87, 613–624. [Google Scholar] [CrossRef] [Green Version]
- Gosling, J.T.; Bame, S.J.; McComas, D.J.; Phillips, J.L. Coronal mass ejections and large geomagnetic storms. Geophys. Res. Lett. 1990, 17, 901–904. [Google Scholar] [CrossRef]
- Papailiou, M.; Mavromichalaki, H.; Belov, A.; Eroshenko, E.; Yanke, V. The Asymptotic Longitudinal Cosmic Ray Intensity Distribution as a Precursor of Forbush Decreases. Sol. Phys. 2012, 280, 641–650. [Google Scholar] [CrossRef]
- Belov, A.; Shlyk, N.; Abunina, M.; Abunin, A.; Papaioannou, A. Estimating the Transit Speed and Time of Arrival of Interplanetary Coronal Mass Ejections Using CME and Solar Flare Data. Universe 2022, 8, 327. [Google Scholar] [CrossRef]
- Lavasa, E.; Giannopoulos, G.; Papaioannou, A.; Anastasiadis, A.; Daglis, I.A.; Aran, A.; Pacheco, D.; Sanahuja, B. Assessing the Predictability of Solar Energetic Particles with the Use of Machine Learning Techniques. Sol. Phys. 2021, 296, 107. [Google Scholar] [CrossRef]
- Papaioannou, A.; Vainio, R.; Raukunen, O.; Jiggens, P.; Aran, A.; Dierckxsens, M.; Mallios, S.A.; Paassilta, M.; Anastasiadis, A. The probabilistic solar particle event forecasting (PROSPER) model. J. Space Weather. Space Clim. 2022, 12, 24. [Google Scholar] [CrossRef]
Figure 1.
Distribution in time and magnitude of large FDs ( 3%) and SEPs with a maximum flux of >1 and >300 pfu for particles with energies E > 100 MeV against the background of the sunspot number.
Figure 1.
Distribution in time and magnitude of large FDs ( 3%) and SEPs with a maximum flux of >1 and >300 pfu for particles with energies E > 100 MeV against the background of the sunspot number.

Figure 2.
Distribution of longitudes of solar sources associated with large FDs ( 3%) and SEPs (for particles with energies E > 100 MeV) with different peak fluxes.
Figure 2.
Distribution of longitudes of solar sources associated with large FDs ( 3%) and SEPs (for particles with energies E > 100 MeV) with different peak fluxes.

Figure 3.
An example of an event from the GLE group: (a) PHTX (taken from SOHO/LASCO CME Catalog); (b) behavior of the main SW, IMF, CR, and GA parameters during the FD on 14–15 December 2006.
Figure 3.
An example of an event from the GLE group: (a) PHTX (taken from SOHO/LASCO CME Catalog); (b) behavior of the main SW, IMF, CR, and GA parameters during the FD on 14–15 December 2006.

Figure 4.
An example of an event from the group: (a) PHTX (taken from SOHO/LASCO CME Catalog); (b) behavior of the main SW, IMF, CR, and GA parameters during the FD on 12–14 September 2014.
Figure 4.
An example of an event from the group: (a) PHTX (taken from SOHO/LASCO CME Catalog); (b) behavior of the main SW, IMF, CR, and GA parameters during the FD on 12–14 September 2014.

Figure 5.
An example of an event from the group: (a) PHTX (taken from SOHO/LASCO CME Catalog); (b) behavior of the main SW, IMF, CR, and GA parameters during the FD on 14–17 July 2012.
Figure 5.
An example of an event from the group: (a) PHTX (taken from SOHO/LASCO CME Catalog); (b) behavior of the main SW, IMF, CR, and GA parameters during the FD on 14–17 July 2012.

Figure 6.
An example of an event from the Weak group: (a) PHTX (taken from SOHO/LASCO CME Catalog); (b) behavior of the main SW, IMF, CR, and GA parameters during the FD on 15–16 May 1997.
Figure 6.
An example of an event from the Weak group: (a) PHTX (taken from SOHO/LASCO CME Catalog); (b) behavior of the main SW, IMF, CR, and GA parameters during the FD on 15–16 May 1997.

Figure 7.
An example of an event from the Control group: (a) PHTX (taken from SOHO/LASCO CME Catalog); (b) behavior of the main SW, IMF, CR, and GA parameters during the FD on 5–7 October 2011.
Figure 7.
An example of an event from the Control group: (a) PHTX (taken from SOHO/LASCO CME Catalog); (b) behavior of the main SW, IMF, CR, and GA parameters during the FD on 5–7 October 2011.

Figure 8.
Relationship (lg–lg) between the FD amplitude () and the peak proton flux for particles with energy E > 10 MeV () in events with the same solar source.
Figure 8.
Relationship (lg–lg) between the FD amplitude () and the peak proton flux for particles with energy E > 10 MeV () in events with the same solar source.

Figure 9.
Relationship between (a) FD amplitude (); (b) maximum value of -index; and (c) minimum value of -index and the transit speed () of the corresponding ICMEs.
Figure 9.
Relationship between (a) FD amplitude (); (b) maximum value of -index; and (c) minimum value of -index and the transit speed () of the corresponding ICMEs.


Table 1.
Mean, maximum, and minimum values of the main parameters of solar flare events from different groups under study.
Table 1.
Mean, maximum, and minimum values of the main parameters of solar flare events from different groups under study.
| Parameters | GLE Group | Group | Group | Weak Group | NoSEP Group | |
|---|---|---|---|---|---|---|
| No. of events | 10 | 29 | 39 | 62 | 9641 | |
| Mean | (2.6 ± 0.5) × 10 | (1.4 ± 0.2) × 10 | (9.1 ± 1.8) × 10 | (4.9 ± 0.8) × 10 | (5.4 ± 0.1) × 10 | |
| (W/m) | Max | 5.7 × 10 | 5.0 × 10 | 5.3 × 10 | 3.2 × 10 | 4.70 × 10 |
| Min | 1 × 10 | 1.9 × 10 | 1.2 × 10 | 2.2 × 10 | 1.0 × 10 | |
| Mean | 87.4 ± 25 | 104.1 ± 17 | 66.5 ± 8.7 | 67.3 ± 8.9 | 25.8 ± 0.3 | |
| (min) | Max | 240 | 328 | 202 | 318 | 941 |
| Min | 20 | 10 | 1 | 7 | 0 | |
| Mean | 38.7 ± 15 | 35.4 ± 6.6 | 23 ± 3.8 | 17.4 ± 2.68 | 8.7 ± 0.2 | |
| (min) | Max | 173 | 146 | 116 | 109 | 604 |
| Min | 11 | 3 | 0 | 0 | 0 | |
| Mean | 5422.2 ± 3043 | 421.14 ± 194 | 81.45 ± 34.58 | 0.39 ± 0.03 | - | |
| (pfu) | Max | 31,700 | 4500 | 1300 | 0.95 | - |
| Min | 55 | 1.1 | 1 | 0.1 | - | |
| Mean | 10.7 ± 2.8 | 11.7 ± 1.4 | 13.90 ± 1.50 | 9.02 ± 0.8 | - | |
| (min) | Max | 32 | 36 | 39 | 37 | - |
| Min | 2 | 2 | 3 | 2 | - | |
| Mean | 156.3 ± 63.7 | 1.93 ± 0.33 | 0.22 ± 0.02 | 0.01 | - | |
| (pfu) | Max | 623 | 7.33 | 0.5 | 0.08 | - |
| Min | 7.48 | 0.5 | 0.1 | 0 | - | |
| || | Mean | 16.5 ± 3.4 | 14.2 ± 1.5 | 12.3 ± 1.2 | 16.9 ± 1.0 | 15.5 ± 0.1 |
| () | Max | 35 | 38 | 29 | 37 | 67 |
| Min | 2 | 0 | 0 | 0 | 0 | |
| Mean | 19.9 ± 3.2 | 16.3 ± 2 | 18.5 ± 1.8 | 15.9 ± 1.5 | 15.1 ± 0.1 | |
| () | Max | 35 | 34 | 34 | 35 | 35 |
| Min | 2 | −4 | −4 | −4 | −4 | |
| Mean | 1795 ± 214 (6) | 1566 ± 157 (12) | 1169 ± 114 (19) | 743 ± 87 (14) | 566 ± 24 (108) | |
| (km/s) | Max | 2547 | 2861 | 2411 | 1271 | 1376 |
| Min | 938 | 785 | 558 | 224 | 136 | |
| Mean | 156 ± 59 | 50.5 ± 16 | 16.6 ± 4 | 10.2 ± 4 | 0.6 ± 0.04 | |
| Max | 657.4 | 393.8 | 106 | 251 | 218 | |
| Min | 12.1 | 1.9 | 0.02 | 0.03 | 0 | |
| Mean | 1.29 ± 0.16 | 1.71 ± 0.14 | 1.92 ± 0.13 | 1.14 ± 0.07 | - | |
| Max | 2.24 | 3.17 | 4 | 1.98 | - | |
| Min | 0.81 | 0.04 | 0.33 | 0 | - |
Note: the value of the VCME parameter is given for some powerful flare events and events associated with Forbush decreases after 1995 (numbers are given in parentheses).
Table 2.
Mean, maximum, and minimum values of the main SW, IMF, CR, and GA parameters for the researched events.
Table 2.
Mean, maximum, and minimum values of the main SW, IMF, CR, and GA parameters for the researched events.
| Parameters | GLE Group | Group | Group | Weak Group | Control Group (No SEP) | |
|---|---|---|---|---|---|---|
| No. of events | 9 | 20 | 26 | 55 | 91 | |
| Mean | 9.77 ± 1.73 | 4.29 ± 0.67 | 5.29 ± 0.71 | 3.16 ± 0.29 | 1.84 ± 0.18 | |
| (% ) | Max | 20.4 | 9.8 | 14.4 | 9.6 | 9.4 |
| Min | 4.7 | 0.9 | 0.8 | 0.4 | 0.3 | |
| Mean | 3.89 ± 0.44 | 2.34 ± 0.20 | 2.16 ± 0.20 | 1.73 ± 0.08 | 1.53 ± 0.07 | |
| (% ) | Max | 5.61 | 4.17 | 5.06 | 4.13 | 4.32 |
| Min | 1.44 | 0.9 | 0.93 | 0.69 | 0.62 | |
| Mean | 7.85 ± 0.43 | 6.57 ± 0.35 | 6.53 ± 0.35 | 5.39 ± 0.22 | 4.78 ± 0.17 | |
| Max | 9 | 9 | 9− | 8+ | 8+ | |
| Min | 5 | 3− | 3 | 2 | 1 | |
| Mean | 235.22 ± 39.61 | 136.00 ± 22.03 | 136.58 ± 17.86 | 76.45 ± 7.76 | 58.00 ± 5.26 | |
| Max | 400 | 400 | 300 | 236 | 236 | |
| Min | 48 | 12 | 15 | 7 | 4 | |
| Mean | −220.3 ± 37.5 | −114.2 ± 19.1 | −119.6 ± 17.1 | −78.5 ± 8.0 | −57.8 ± 4.8 | |
| (nT) | Max | −383 | −307 | −387 | −255 | −235 |
| Min | −88 | −8 | −11 | −1 | 3 | |
| Mean | 35.13 ± 6.33 | 22.82 ± 3.11 | 24.63 ± 2.08 | 18.68 ± 1.21 | 14.21 ± 0.66 | |
| (nT) | Max | 62 | 50.1 | 48.2 | 39.5 | 34.1 |
| Min | 17.5 | 11.1 | 7.9 | 6 | 5.2 | |
| Mean | 1036.9 ± 151.3 | 698.9 ± 48.9 | 644.5 ± 32.1 | 562.9 ± 16.0 | 492.9 ± 13.3 | |
| (km/s) | Max | 1876 | 1024 | 1053 | 840 | 922 |
| Min | 669 | 436 | 410 | 367 | 300 |
Note: The data of some interplanetary disturbances were not taken into account if there were no IMF magnitude and/or SW speed measurements (the date of the beginning of the disturbance is given): in the GLE group—24 October 1989 (no SW speed and IMF data) and 17 November 1989 (no SW speed and IMF data); P100 group—19 September 1977 (no IMF data), 19 December 1982 (no SW speed data), 4 February 1983 (no SW speed and IMF data), 11 July 1985 (no regular SW speed data), 7 February 1986 (no regular SW speed data), 10 June 1991 (no SW speed and IMF data), and 22 October 1994 (no SW speed and IMF data); P10 group—14 October 1977 (no IMF data), 28 July 1990 (no SW speed and IMF data), 19 November 1991 (no SW speed and IMF data), and 29 October 1994 (no SW speed and IMF data); Weak group—10 April 1978 (no IMF data), 1 July 1989 (no SW speed and IMF data), 21 March 1991 (no SW speed and IMF data), 4 April 1991 (no SW speed and IMF data), 13 May 1991 (no SW speed and IMF data), and 29 February 1992 (no SW speed and IMF data).
Table 3.
Probability of registering (in %) various values of FD amplitude and maximum geomagnetic -indices after solar flares plus CME events with certain characteristics.
Table 3.
Probability of registering (in %) various values of FD amplitude and maximum geomagnetic -indices after solar flares plus CME events with certain characteristics.
| Parameter | Group | ||||
|---|---|---|---|---|---|
| GLE | Weak | Control (No SEP) | |||
| Probability, % | |||||
| < 3% | 0 | 50 | 30.5 | 56 | 82.5 |
| 3% < 10% | 67 | 50 | 58 | 44 | 17.5 |
| 10% | 33 | 0 | 11.5 | 0 | 0 |
| < 5− | 0 | 10 | 19.5 | 32.5 | 45 |
| = 5−…6+ | 11 | 40 | 19 | 34.5 | 41 |
| = 7−…8+ | 56 | 40 | 50 | 33 | 14 |
| = 9−…9 | 33 | 10 | 11.5 | 0 | 0 |
Publisher’s Note: MDPI stays neutral with regard to jurisdictional claims in published maps and institutional affiliations. |
© 2022 by the authors. Licensee MDPI, Basel, Switzerland. This article is an open access article distributed under the terms and conditions of the Creative Commons Attribution (CC BY) license (https://creativecommons.org/licenses/by/4.0/).
Share and Cite
MDPI and ACS Style
Belov, A.; Shlyk, N.; Abunina, M.; Belova, E.; Abunin, A.; Papaioannou, A. Solar Energetic Particle Events and Forbush Decreases Driven by the Same Solar Sources. Universe 2022, 8, 403. https://doi.org/10.3390/universe8080403
AMA Style
Belov A, Shlyk N, Abunina M, Belova E, Abunin A, Papaioannou A. Solar Energetic Particle Events and Forbush Decreases Driven by the Same Solar Sources. Universe. 2022; 8(8):403. https://doi.org/10.3390/universe8080403
Chicago/Turabian StyleBelov, Anatoly, Nataly Shlyk, Maria Abunina, Elena Belova, Artem Abunin, and Athanasios Papaioannou. 2022. "Solar Energetic Particle Events and Forbush Decreases Driven by the Same Solar Sources" Universe 8, no. 8: 403. https://doi.org/10.3390/universe8080403
Note that from the first issue of 2016, this journal uses article numbers instead of page numbers. See further details here.