Article

Comparison of EEJ Longitudinal Variation from Satellite and Ground Measurements over Different Solar Activity Levels

by
Wan Nur Izzaty Ismail
1,
Nurul Shazana Abdul Hamid
1,2,*,
Mardina Abdullah
2,3,
Akimasa Yoshikawa
4,5,
Teiji Uozumi
4,5 and
Zahira Mohd Radzi
6
1
Department of Applied Physics, Faculty of Science and Technology, Universiti Kebangsaan Malaysia, Bangi 43600, Selangor, Malaysia
2
Space Science Centre (ANGKASA), Institute of Climate Change, Universiti Kebangsaan Malaysia, Bangi 43600, Selangor, Malaysia
3
Department of Electrical, Electronic and Systems Engineering, Faculty of Engineering and Built Environment, Universiti Kebangsaan Malaysia, Bangi 43600, Selangor, Malaysia
4
Department of Earth and Planetary Sciences, Faculty of Sciences, 33 Kyushu University, 6-10-1 Hakozaki, Higashi-ku, Fukuoka 812-8581, Japan
5
International Center for Space Weather Science and Education, Kyushu University, Fukuoka 812-8581, Japan
6
Malaysian Space Agency (MYSA), Banting 42700, Selangor, Malaysia
*
Author to whom correspondence should be addressed.
Universe 2021, 7(2), 23; https://doi.org/10.3390/universe7020023
Submission received: 6 December 2020 / Revised: 17 January 2021 / Accepted: 21 January 2021 / Published: 23 January 2021
(This article belongs to the Special Issue Space Weather)

Abstract

:
The longitudinal variability and local time of equatorial electrojet (EEJ) current using simultaneous data recorded by ground and satellite magnetometers at different levels of solar activity were investigated. In this study, we used data from the CHAMP and Swarm satellites to obtain EEJ current measurements around the globe. The ground data were provided by the MAGDAS, INTERMAGNET, and IIG networks. The ground observation was carried out by analyzing magnetometer data in four different sectors: the South American, Indian, African, and Southeast Asian sectors. These ground data were normalized to the dip equator to overcome the latitudinal variation of each station. The analysis for both measurements was performed using quiet day data. Both the ground and satellite data were categorized according to solar activity level; low, moderate, and high. The results revealed that, during the low solar activity, there was a good agreement between the longitudinal profiles of the EEJ measured using the satellite and the ground data. In general, strong correlations were obtained in most of the sectors where ground data were available between 11 and 13 local time (LT). Besides that, our analysis revealed that the different times of maximum EEJ appearances were seasonally dependent only at certain longitude sectors.

1. Introduction

The equatorial electrojet (EEJ) is the dayside current that circulates along the geomagnetic latitude within ±3° at the altitude of about 90 to 150 km within the E region of the ionosphere [1,2,3]. Since the discovery of the EEJ, a lot of comprehensive research has been carried out using available long-term data from the ground- and satellite-based magnetometers to study the behavior of the EEJ current [4,5,6]. The global longitudinal profile of this current has been one of the most studied research subjects [7,8,9,10]. Nevertheless, studies on the longitudinal profile of the EEJ have been limited to a small number of observatories and satellite missions near the equator [6,11]. This is because our dip equator region lies over the oceans, thereby constraining the global analysis of the EEJ current.
Earlier studies on the longitudinal variation of the EEJ were based on satellite data from the Polar Orbital Geophysical Observatory (POGO) satellite [12,13], Magsat satellite [14], and Ørsted satellite [15,16]. Nowadays, researchers using the latest advanced satellites such as CHAMP and Swarm have confirmed that the structure of the EEJ longitudinal profile consists of four peaks and four troughs, which are known as the wave-4 structures [9,17,18,19,20]. These wave-4 structures appeared during the equinox and June solstice seasons while wave-3 structures were observed during December solstice [21,22]. The recent study by [23] has confirmed this seasonal dependence of EEJ longitudinal variation with the utilization of long term satellite data.
Meanwhile, observations of the longitudinal variation of ground-based measurements have been studied using a different approach. Several of the previous studies have focused only on one particular region such as the South American sector [24,25,26], the Indian region [6,27] and the African region [28,29,30]. As a result, the longitudinal profile of the EEJ could not be shown at the global level. The studies by [7,8,31,32] have reported on the longitudinal profile of the EEJ and stated that the EEJ is higher in the South American sector. This result led to comparisons of the longitudinal variation of the EEJ and the main field, B, in their studies [7,8]. The authors found that the longitudinal variation of the EEJ roughly follow the inverse main field with some dissimilarity over Indian and Southeast Asian sectors. The study by [33] also clarifies the ionospheric conductivity dependence on the main field.
Some research has compared the EEJ variation between ground and satellite data. For example, earlier studies by [5,34,35] compared the EEJ between ground and satellite data; however, these findings have been region-based comparisons. Meanwhile, the study by [15] compared one-year data of the EEJ phenomenon using both the Ørsted satellite and a ground magnetometer in the Indian and American sectors; both sectors have shown a good correlation between satellite and ground data in the analysis. Besides that, a previous study by [36] concluded that the EEJ data from ground and satellite measurements might be compared directly; an analysis of the EEJ correlation was conducted using the CHAMP satellite and ground magnetometers in the West African, Indian, and Pacific sectors.
Additionally, it is also known that the EEJ intensity varies with local time. According to research conducted by [37], the EEJ peak time during noon time (12 LT) was observed throughout the high solar activity and then shifted to early local noon (11 LT) during low solar activity. However, this time transition does not apply to all longitude sectors. In their study, the time shift only occurred in the American, African, and Indian sectors. Another study by [38] also focused on the EEJ peak time, but only during low solar activity levels.
A review of previous EEJ investigations has revealed that not all of these previous studies have focused on finding the longitudinal variations of the EEJ globally. These previous studies are regional, even though satellite data have been used in their research. The lack of continuous data from the ground measurement also contributed to the incomplete global study of longitudinal variation of the EEJ. Besides, some of the previous studies used different methods to obtain EEJ data from the ground. As a result, the Solar quiet (Sq) contribution may not have been eliminated in the calculation of the EEJ current. This may cause some discrepancies if a comparison is made between ground and satellite data. Therefore, these issues have become the impetus for the current study that aimed to examine the longitudinal profile of the EEJ using both ground and satellite measurements. This study also used long-term data that covered three solar activity levels. Additionally, our analysis was detailed to include a comparison of local time variations to estimate the variation of the EEJ peak time in different longitude sectors.

2. Data and Analysis Technique

In the majority of previous studies using ground magnetometer data, researchers tended to employ the two-station method to obtain EEJ current. The general assumption is that the Sq current from the off-dip equator station was similar to the one at the dip equator station, and direct subtraction of it from equator data would provide the EEJ current measurement [35,36]. However, there was a second school of thought where H component data at the dip equator can be directly used to represent the EEJ current [7]. This current study is carried out based on the former approach for both ground and satellite measurements in which a direct measurement at the dip equator region is treated as the total current that consumes the contribution of both EEJ and Sq currents. Thus, to obtain a sole EEJ current, the Sq current effect will be deducted.

2.1. Ground Data

The ground data measurements between 2008 and 2014 were applied in this study. The data were collected from various magnetometers located in four sectors, namely the South American sector, the Southeast Asian sector, the African sector, and the Indian sector. Table 1 presents details of the observatory stations used in this study. Each dip-equatorial observatory station was paired up with its off-dip equator counterpart [39,40].
The EEJ current in this study was calculated based on the equatorial electrojet index, EUEL, introduced by [41], for each station, as presented in Table 1. The EUEL index was derived from the geomagnetic northward H component. In order to construct this index, the median value of the H component (representing the ambient nighttime value) was subtracted from the raw magnetic data to obtain the Er. The mean value of Er observed during the nighttime ( L T   =   18 06 ) along the magnetic equator region was defined as EDst (Equatorial Disturbance in storm time). The EUEL index was obtained from the subtraction of the EDst index from Er. However, the EUEL index proposed by the study of [41] failed to eliminate the effect of the Sq current.
Nevertheless, to obtain clean EEJ data, the normalization method proposed by [38] was implemented in this study. The main idea is to obtain the EEJ current after subtracting Sq current contribution while simultaneously avoiding the latitudinal effect of the observatory stations listed in Table 1. This normalization technique utilized the global current model, CM4, following a similar approach, as suggested by [42]. The normalization method commenced with the estimation of Sq current at the dip equator [ E U E L ( 0 ° ) ] based on the EUEL index from the off-dip equator station, for instance, MUT station by using the following formula
E U E L ( 0 ° ) = C M 4 ( 0 ° ) C M 4 M U T E U E L M U T
C M 4 ( 0 ° ) and C M 4 M U T readings were obtained from the latitudinal profiles of Sq represented by the polynomial fitting of the CM4 model. Here, the area of ±3° across the dip latitude had been masked to avoid the influence of the EEJ current. Next, the total current at the 0° dip latitude was acquired from the normalization of the EUEL index near the dip equator station, for instance, DAV, by the direct usage of the CM4 model profile and the same formula. An example of the DAV–MUT pair in the Southeast Asian sector, where the normalized data is indicated by the square symbol, is shown in Figure 1. After both the normalized total and Sq currents had been obtained, the difference between these two values was determined as the value of the EEJ current at that particular longitude sector.

2.2. Satellite Data

Satellite measurements of the EEJ acquired from three low-orbiting satellites, namely CHAMP, Swarm A, and Swarm B, were used in this study. CHAMP (altitude ~454 km) and Swarm (altitude ~450 km) are known as the low polar-orbiting satellites. They are the suitable satellites for the measurement of the EEJ current because they orbit at low altitudes on the equator. In this study, the CHAMP data were taken from 2005 to 2010; and the Swarm satellite data were from 2014, including a combination of Swarm A and Swarm B data. We used long-term data to ensure good seasonal and local-time coverage of the EEJ. The processing of satellite data was performed when the CHAMP and Swarm satellites had crossed the dip equator and captured the latitudinal magnetic profile where the EEJ signature could be retrieved [21]. Several processing steps were applied to obtain the EEJ data from both satellites. First, the satellite signal was extracted from the geomagnetic field signal. Next, the selection of data was restricted to those at the equator crossing and was selected only between 06 and 18 LT. Then, the Sq signal was removed, and the current inversion steps were carried out to ensure the elimination of other external contributions [43].

2.3. Ground and Satellite Data Selection

Two main approaches have been adopted in this study. First, only current hourly data were selected during noon time, given the current EEJ peak around noon. In this approach, only the quiet day data ( K p   <   3 ) were considered. The second approach was to characterize both measurement data based on three solar activity levels using P parameter index data. The P parameter was calculated from the daily F10.7 using the following equation:
    P = { F 10.7 D + F 10.7 A } / 2
where F10.7D represents the daily F10.7 index, and F10.7A is the 81-day running average of F10.7D [44]. The average of P parameter value for low solar activity levels (covering the years 2008–2009) were 70, 98 for moderate (2010–2011) and 130 for high solar activity levels (2012–2014). We implemented this approach by utilizing the EEJ satellite data for each 10° longitude bin and plotted against the P parameter. Next, the EEJ intensities were then normalized using the data with the selected P parameter values by using the linear regression method ( y = m x + c ) to obtain the average data. Note that a similar approach was applied to calculate EEJ data at each ground observation station. Lastly, interpolation methods were applied to obtain the profile of the EEJ current for satellite and ground data.

3. Results

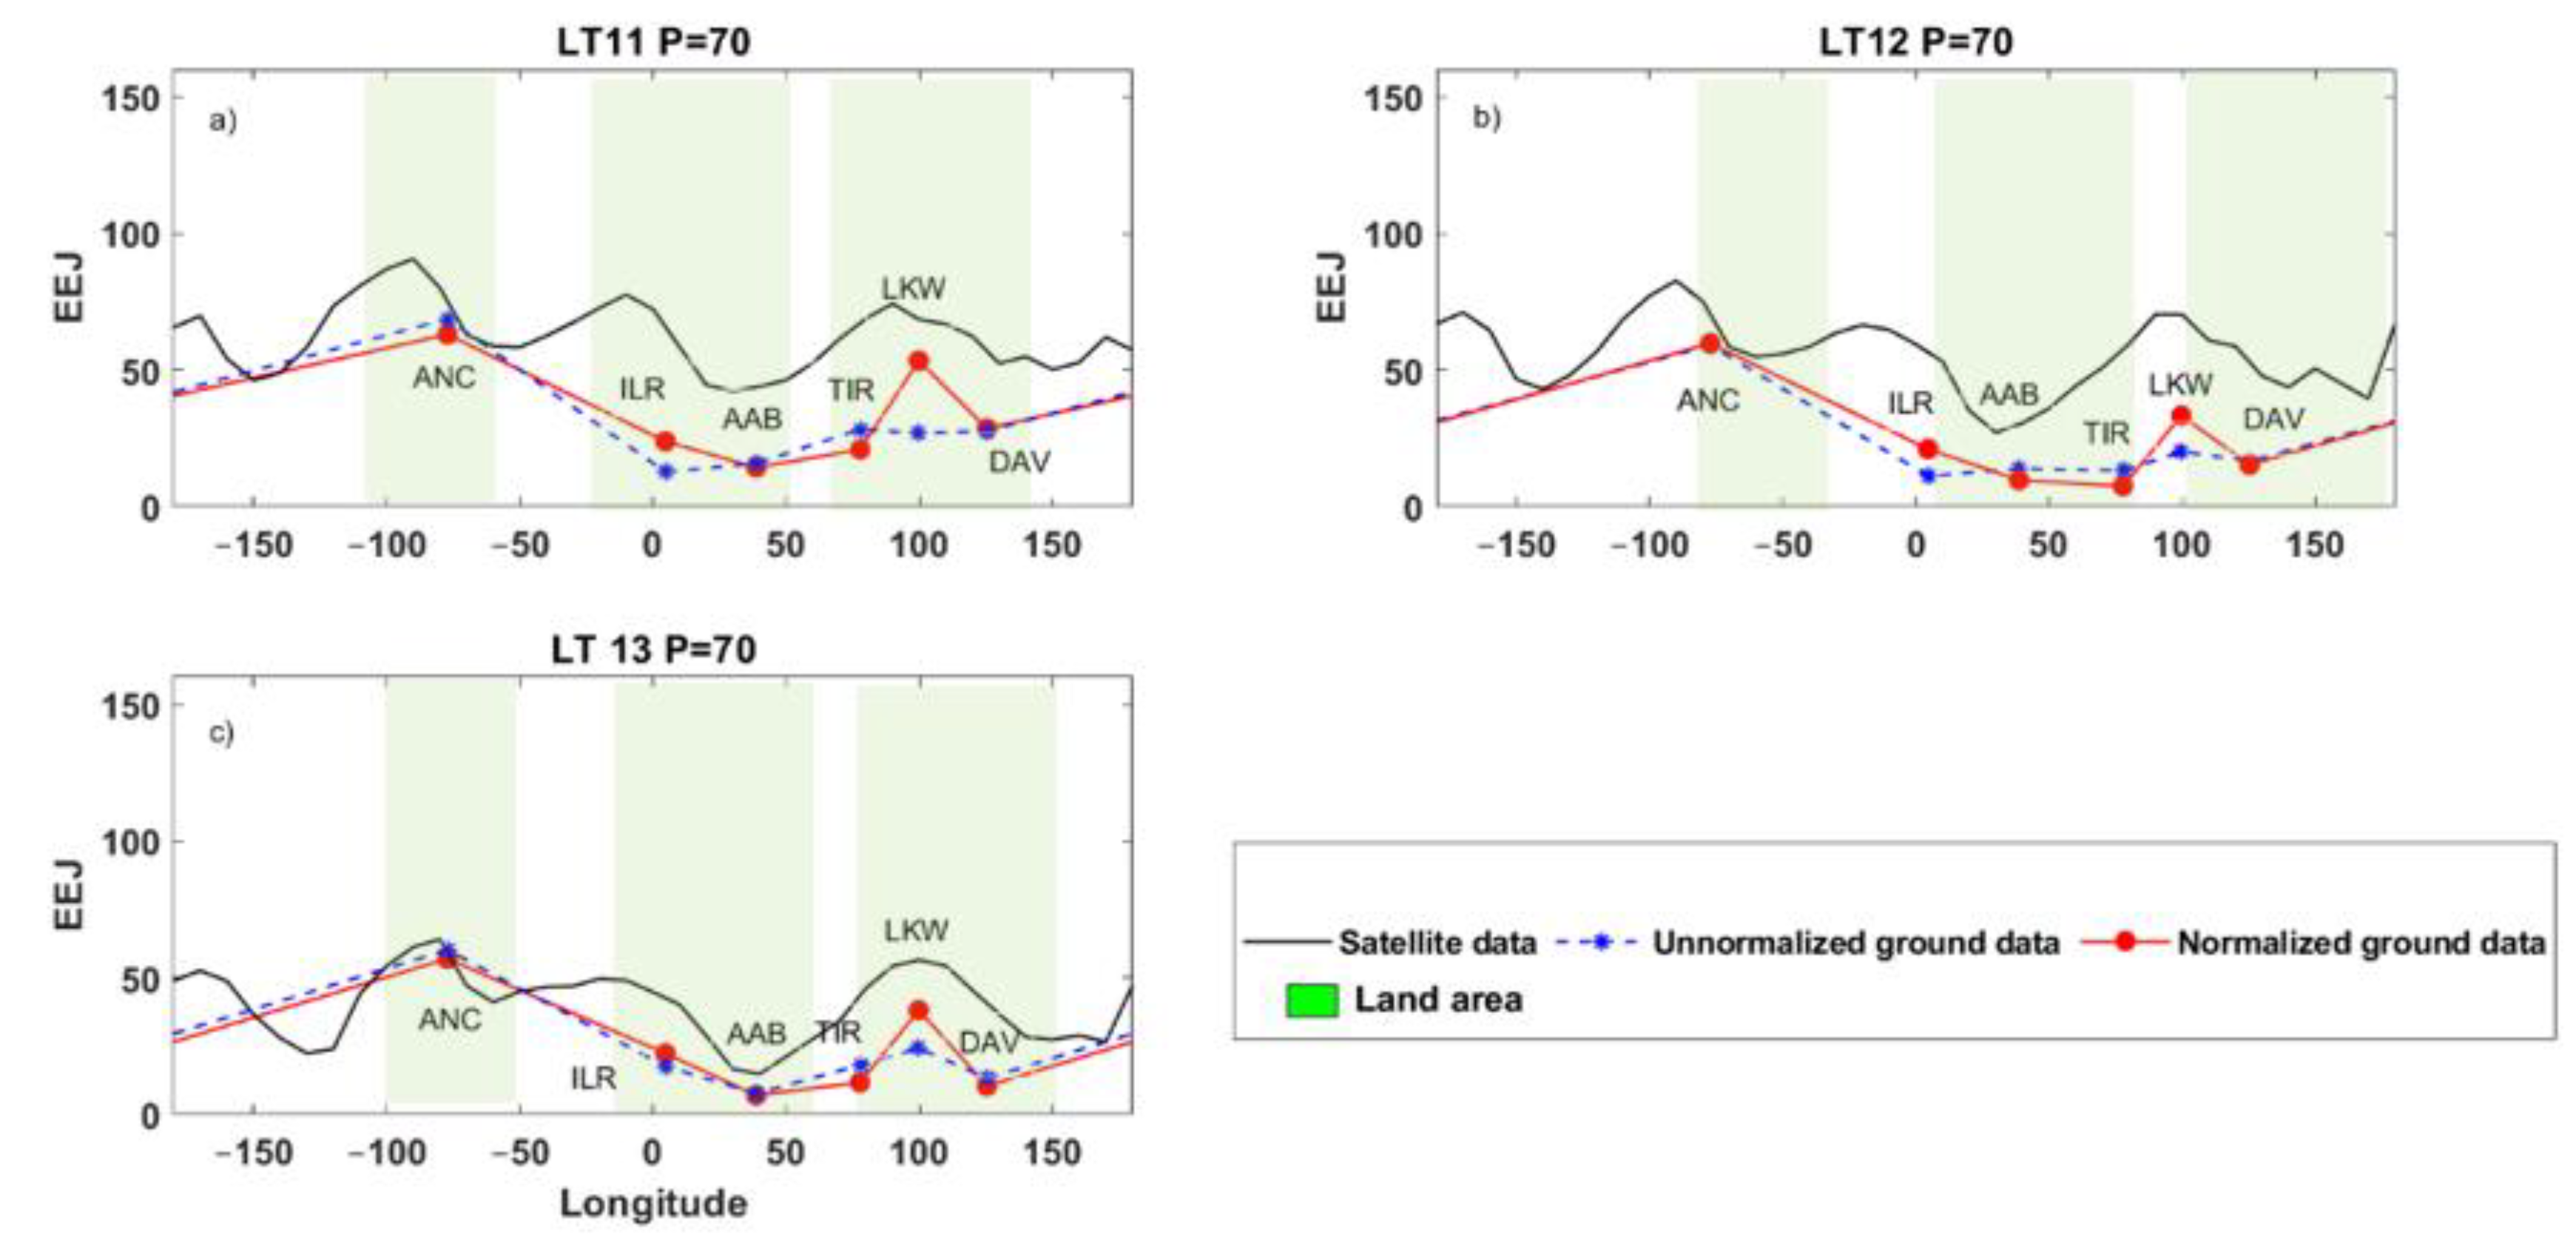
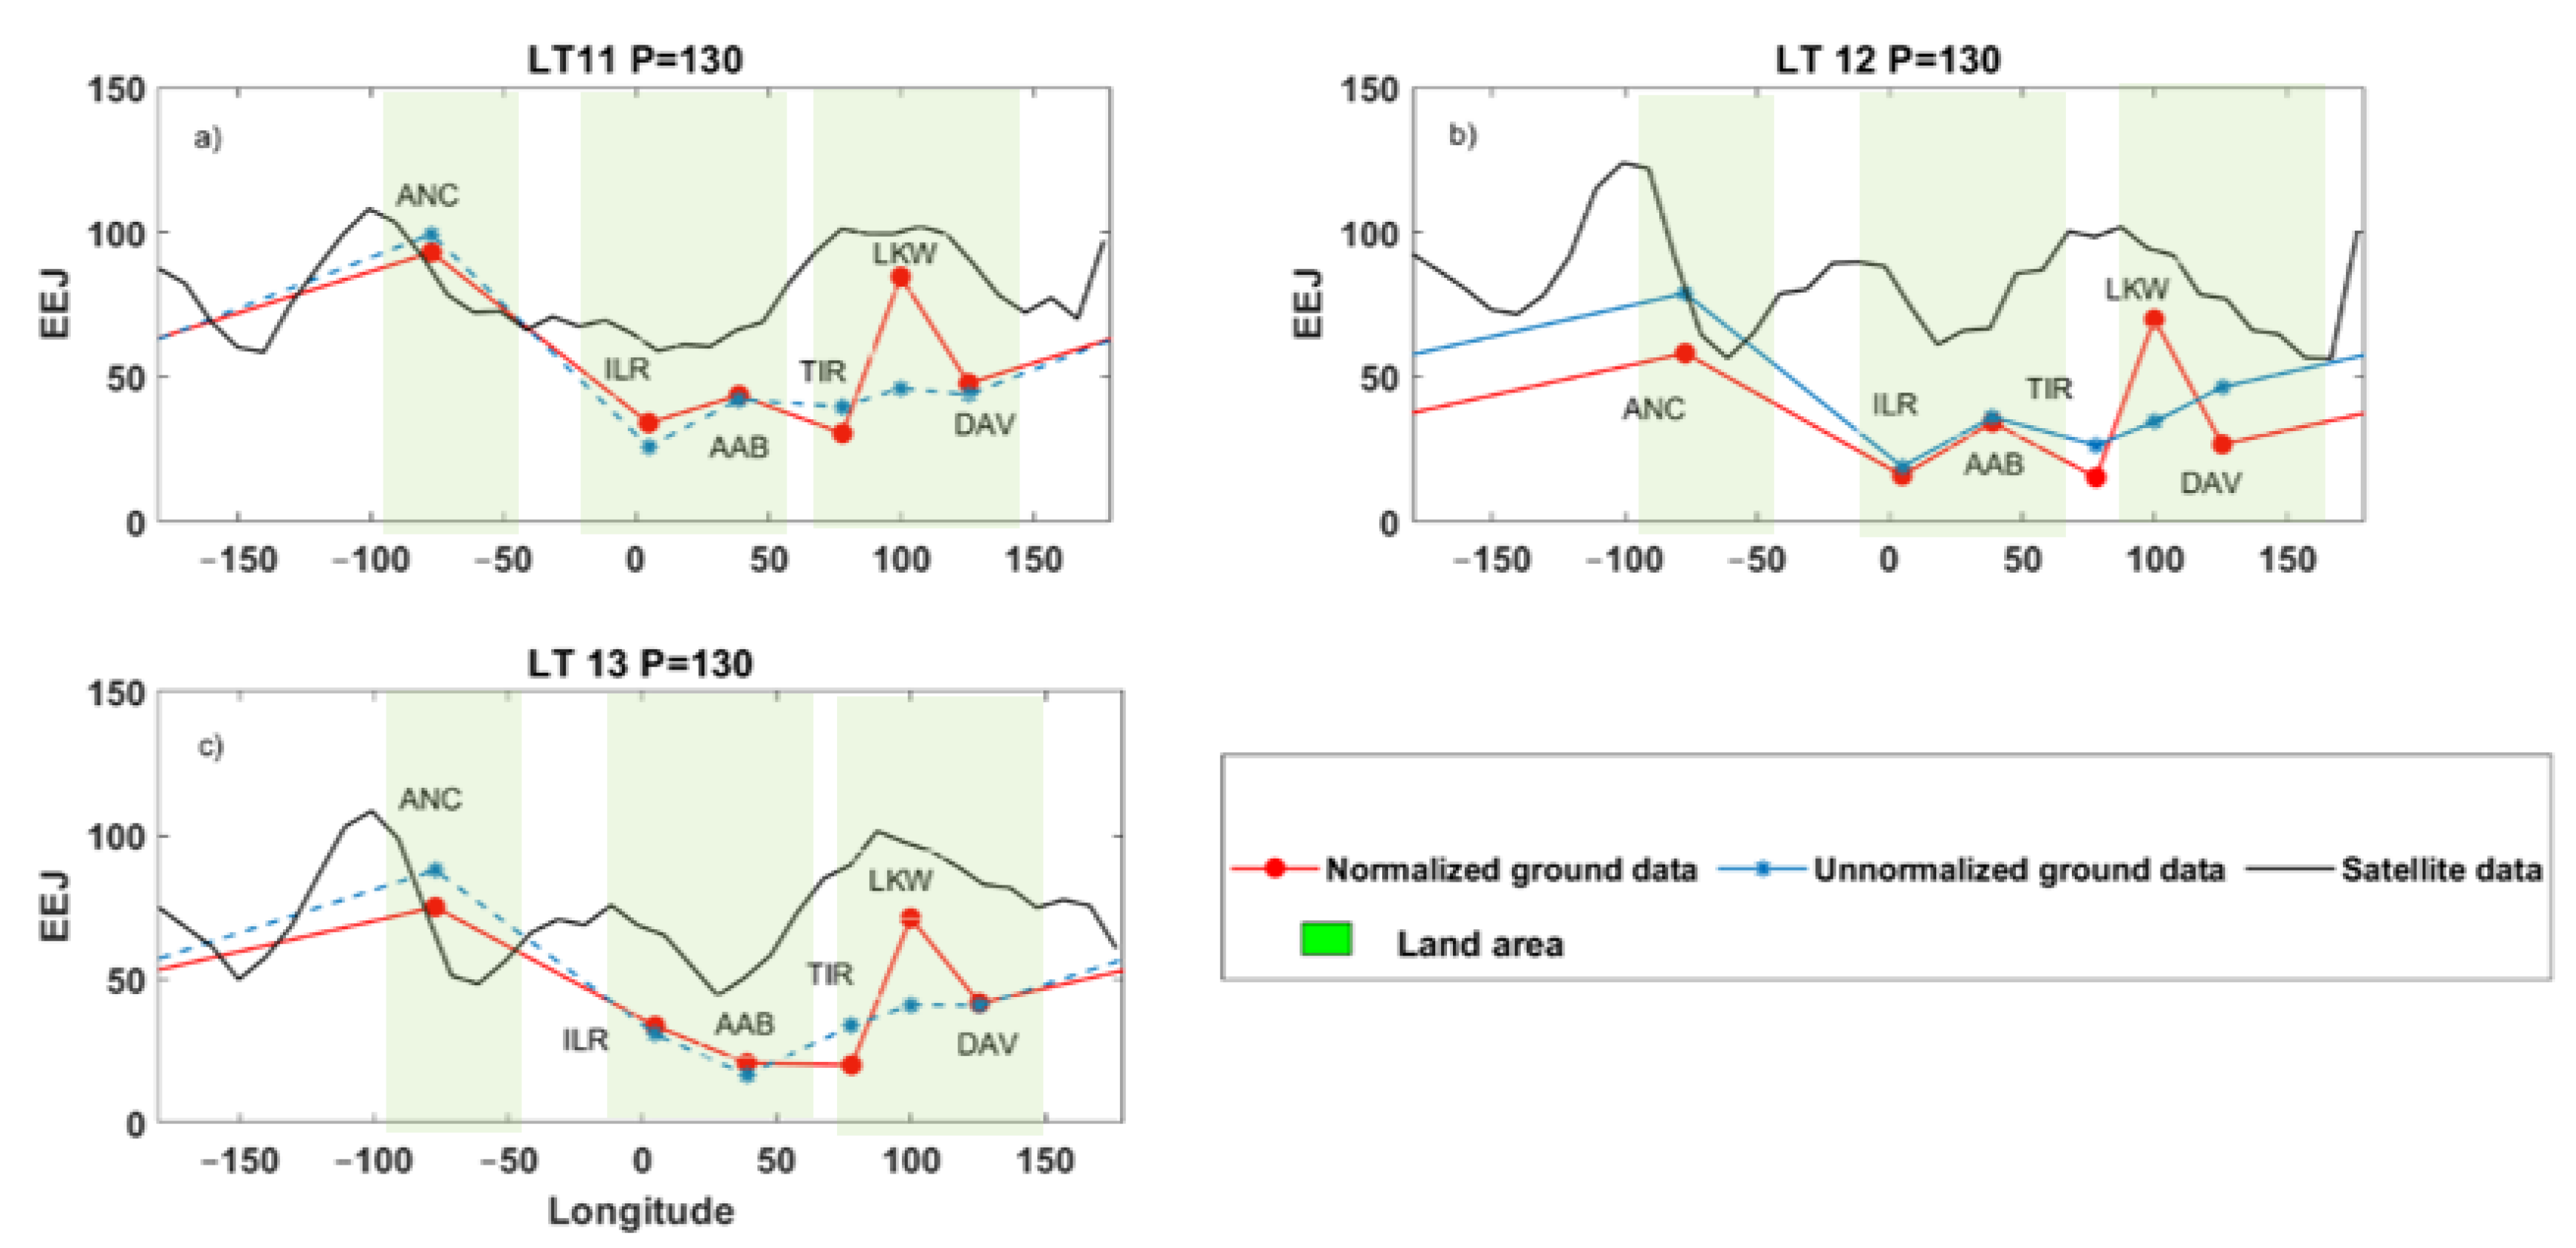
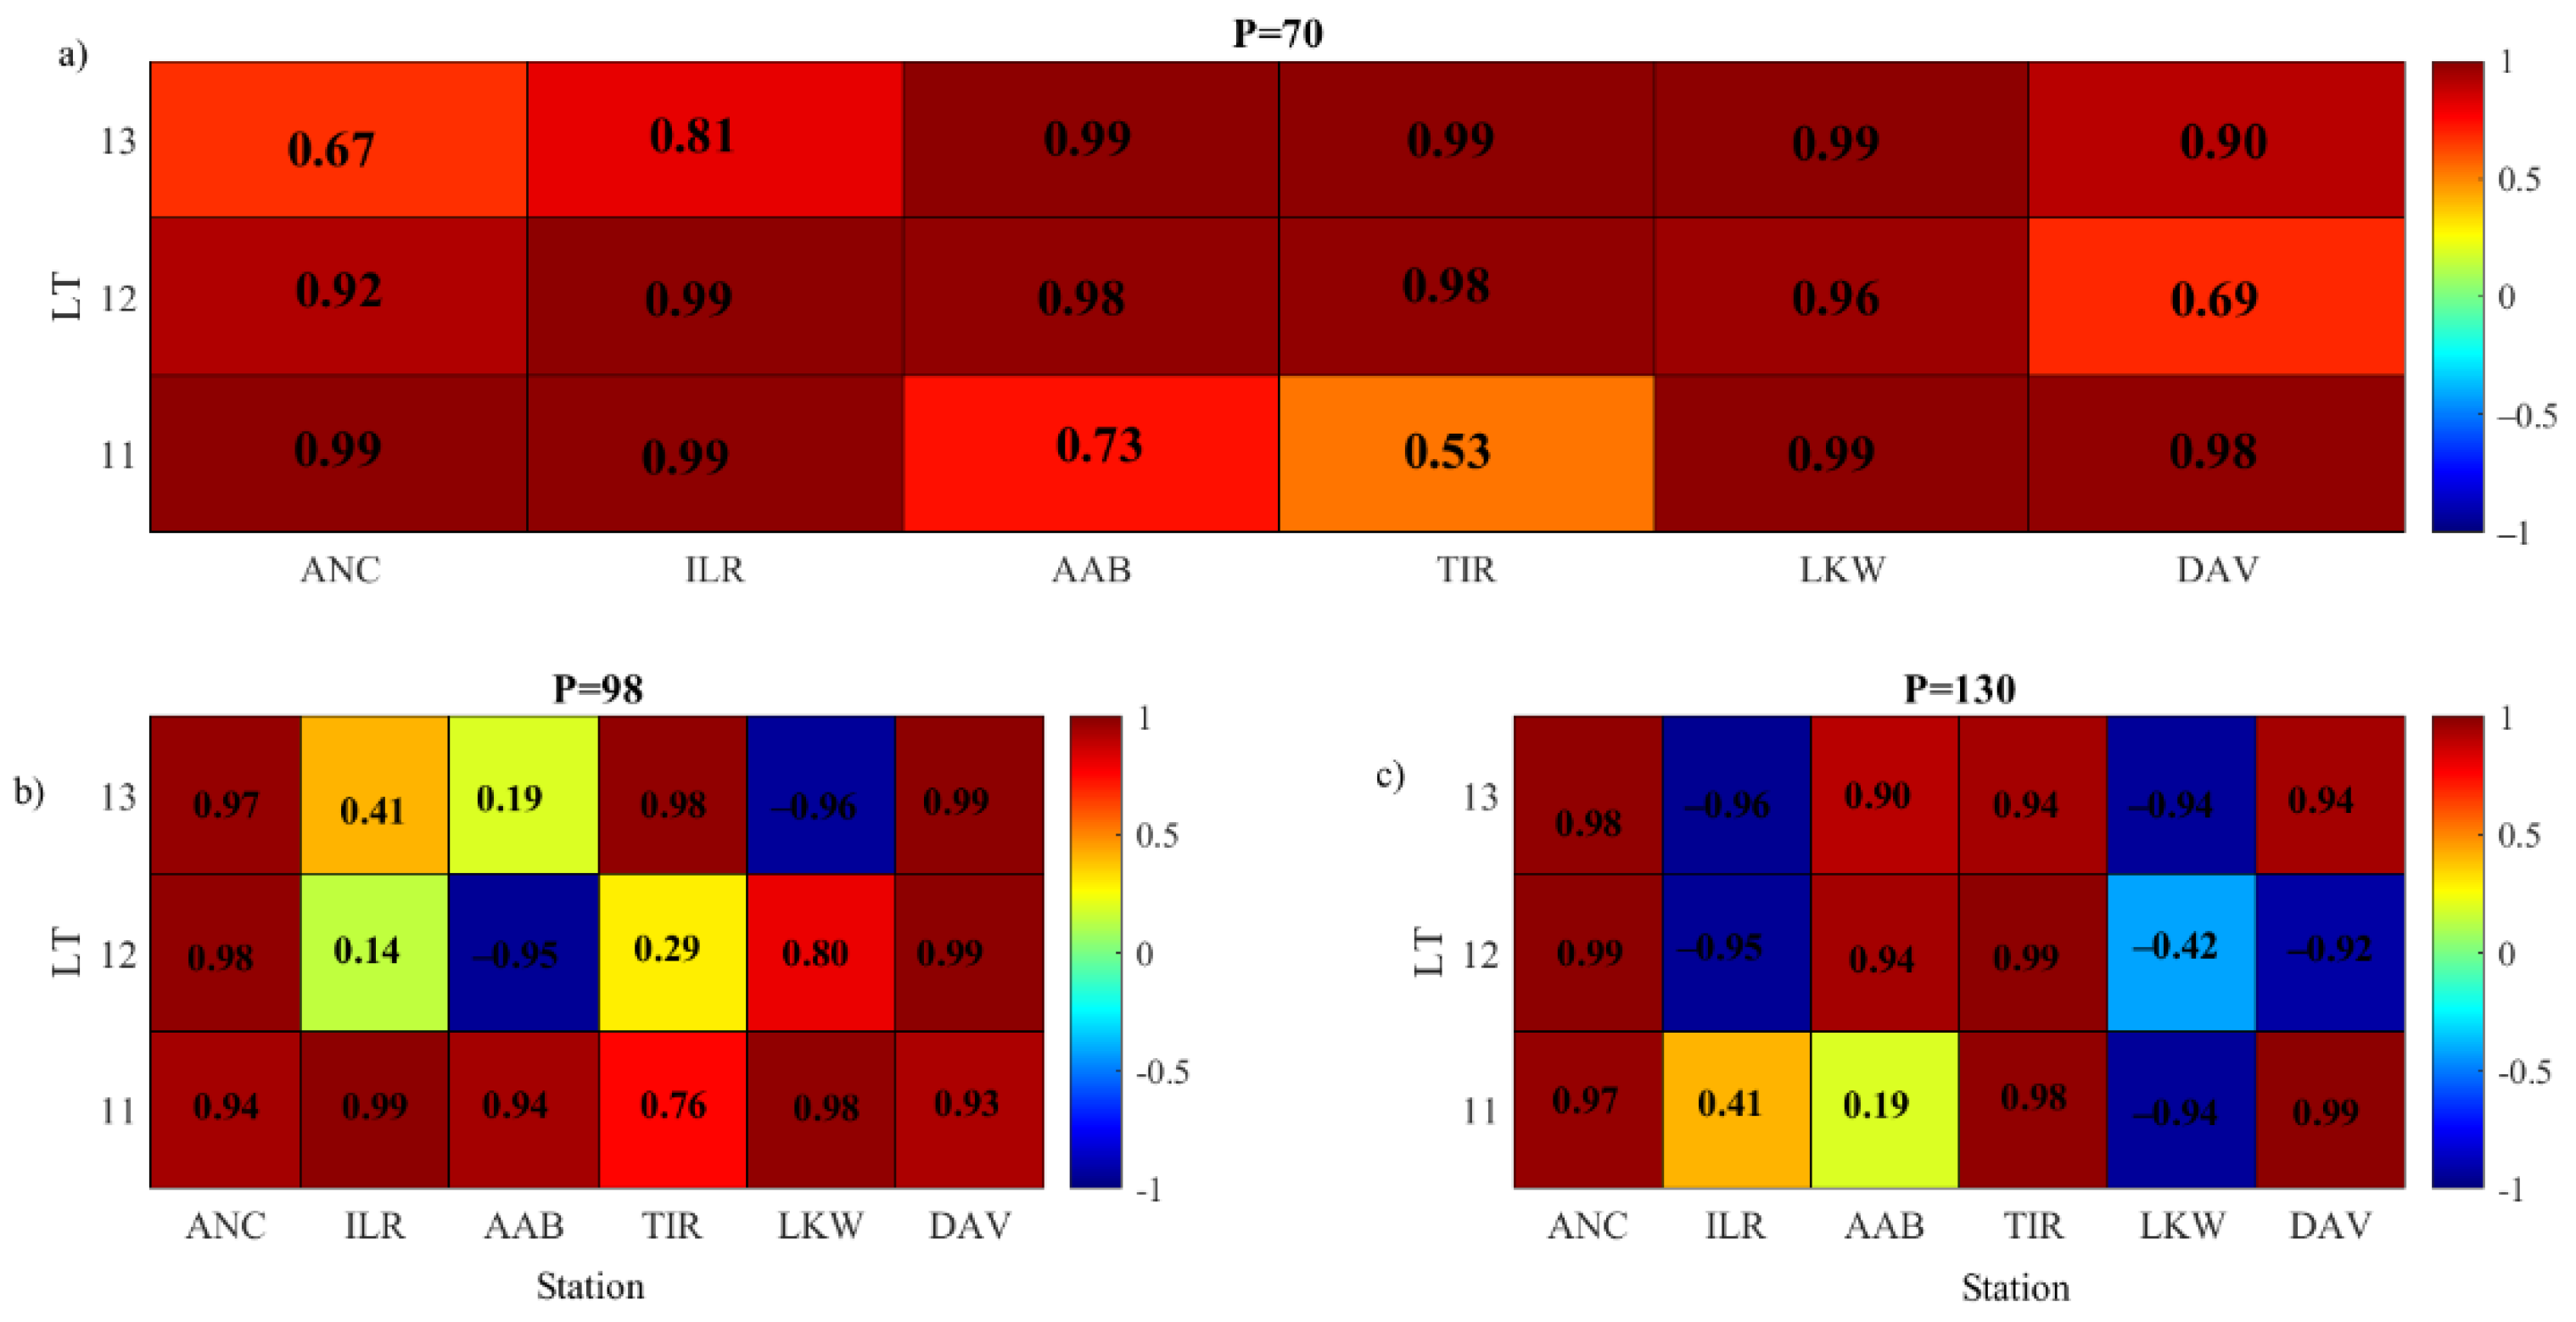
3.1. EEJ Longitudinal Variability

The longitudinal and local time variations of EEJ currents measured from ground and satellite data were analyzed in this study. The results were then separated by LT and solar activity level. Figure 1 presents the EEJ variations at low solar activity levels with an average P parameter value of 70 at three local times, from 11 to 13 LT. In Figure 2, the black, blue, and red lines represent satellite data, normalized and unnormalized ground data, respectively. The satellite data showed the wave-4 structures of the EEJ with peaks at around 100° W, 0° E, 100° E, and 180° E corresponding to North America, the Atlantic Ocean, Southeast Asia, and the Pacific Ocean, respectively. These wave-4 structures were established since many recent studies using satellite data have been reported [15,18,45].
As for the ground data, it is clear that the EEJ current was dominant at the ANC station (77.15° W) using either the normalization technique or otherwise. The LKW station (99.78° E) is the second peak that could be observed from ground data when the normalization technique was applied; however, this peak is invisible when the ground data are used directly. Both peaks were in agreement with the satellite data in which the peaks were observed at around 100° W and 100° E. The lowest EEJ intensity was recorded at the AAB station (38.7° E) in the east of the African sector for all local times; the ground data were consistent with the satellite data where the lowest EEJ value measured was around 40° E regardless of the local time.
Next, an examination of the EEJ discrepancy between ground and satellite data during moderate solar activity with an average value P parameter of 98 was carried out. The variations are shown in Figure 3. Similar to the low solar activity level, the wave-4 structures were seen from satellite data, and the peaks were observable at the LKW and ANC stations when the normalization technique was applied to ground data. Minimum EEJ values were observed for all local time in the African sector. However, the EEJ variations from ground data showed some small peak appearances in the African sector at around 12 LT, which contradicted the variation in satellite data in that sector.
An analysis of the EEJ variations was carried out during high solar activity levels; the peaks are shown in Figure 4. Three peaks appeared at the ANC, AAB, and LKW stations at 11 LT and 12 LT. Surprisingly, these three peaks remained only during peak time, and the EEJ intensity at the AAB station suddenly decreased and was among the lowest at 13 LT. The minimum EEJ intensity was observed in the African sector for satellite measurement.
There are several reasons for the discrepancy of the EEJ current observed from ground- and satellite-based measurements. In this study, a clearer picture of EEJ longitudinal variation was observed. The global coverage of satellite measurements is one of the advantages of using satellite data. As stated earlier, the longitudinal variation of EEJ is dominated by wave-4 structures. This structure has already been established in previous studies using satellite data [15,17,18,46,47,48,49]. It is also important to bear in mind that the satellite orbits at higher altitudes (400 km) compared to the altitude of EEJ (110 km). Therefore, a comparison between satellite and ground data is necessary to identify the longitudinal variation of the EEJ, and our current finding implemented that the variation from these two sources at low solar activity (P = 70) are almost identical. A correlation coefficient (r) was further calculated to examine quantitatively the similarity observed for all solar activity levels.
In this analysis, the correlation coefficient, r, between the satellite and ground for 10° degrees longitude width is calculated by considering the location of the ground station, for example, 30° to 40° over the African sector, where AAB station was located. The satellite data analysis was directly taken from each range, while the ground measurement ranges were taken once having implemented the interpolation technique on the normalized ground data [8]. The results for the correlation coefficient for low, moderate and maximum solar activity level are presented in Figure 5a–c respectively. The ground station codes and locations are labeled below the panel. A strong correlation is given by the value, r ≥ 0.6, while r ≤ 0.6 represents a weak correlation. The analysis reported that the range of r obtained over 11 to 13 LT is between 0.53 and 0.99 (with average 〈r〉 = 0.89). The Indian region reported the lowest value at 11 LT, which may be due to the difference in peak EEJ at that time. Here, we found that the EEJ peak based on the ground measurement lagged by several degrees from the EEJ peak of the satellite measurement. On average, the longitudinal variation of the EEJ has the highest agreement between the satellite and ground at 12 LT, 〈r〉 = 0.92.
On the other hand, for moderate and high solar activity, the range of r obtained over 11 to 13 LT is between −0.96 and 0.99 with average 〈r〉 =0.58 and 〈r〉 = 0.30 respectively. During moderate solar activity levels, strong correlations were obtained at all longitude sectors at 11 LT. In addition, strong correlations for all solar activity levels and local time have been observed at the ANC station. Besides, the weak correlation during moderate and high solar activity could be caused by the different pattern of the longitudinal profile of EEJ for both measurements. For instance, during P = 130 at 11 LT, a small peak appears at the AAB station but this small peak is not observed via satellite measurement (refer Figure 4a). This disagreement between ground and satellite EEJ variation can cause a weak correlation. Therefore our result indicates that the correlations of EEJ between ground and satellite measurements are stronger during low solar activity levels compared to moderate and high.
Past studies by [7,8] have not shown any peaks in the Southeast Asian sector; these studies did not implement the normalization method and limited their station to the Philippines sector alone. In our study, the normalization technique was implemented to carry out a better comparison between ground and satellite data. According to [9], the uncertainty of the EEJ intensity is because the equatorial ground station is not located exactly at the dip equator. Therefore, our data were normalized to the dip equator to avoid any ambiguity in the ground measurement data. When the normalization method had been applied, the results were almost the same as the satellite data because the peaks from the ground can be seen at 99.78° E and 77.15° W. At certain local times, the minimum EEJ was found in the African sector at the AAB station (38.77° E). This is also almost the same concerning satellite data, where the minimum for the African sector was around 40° E. The high correlation is also observed between these two data overall in which LT was considered low during the solar activity levels. This shows that, following the implementation of the normalization technique for ground measurement, it appeared to agree with satellite measurement. The results also showed the similarity of ground and satellite measurements that can be seen during low solar activity. Due to the limitation of the ground magnetometer, it is difficult to clarify wave-4 patterns as the other two peaks appeared in the oceanic area [9]. A previous study by [22] also reported that the discrepancy may have been due to the lack of data points in the area of the Pacific Ocean.

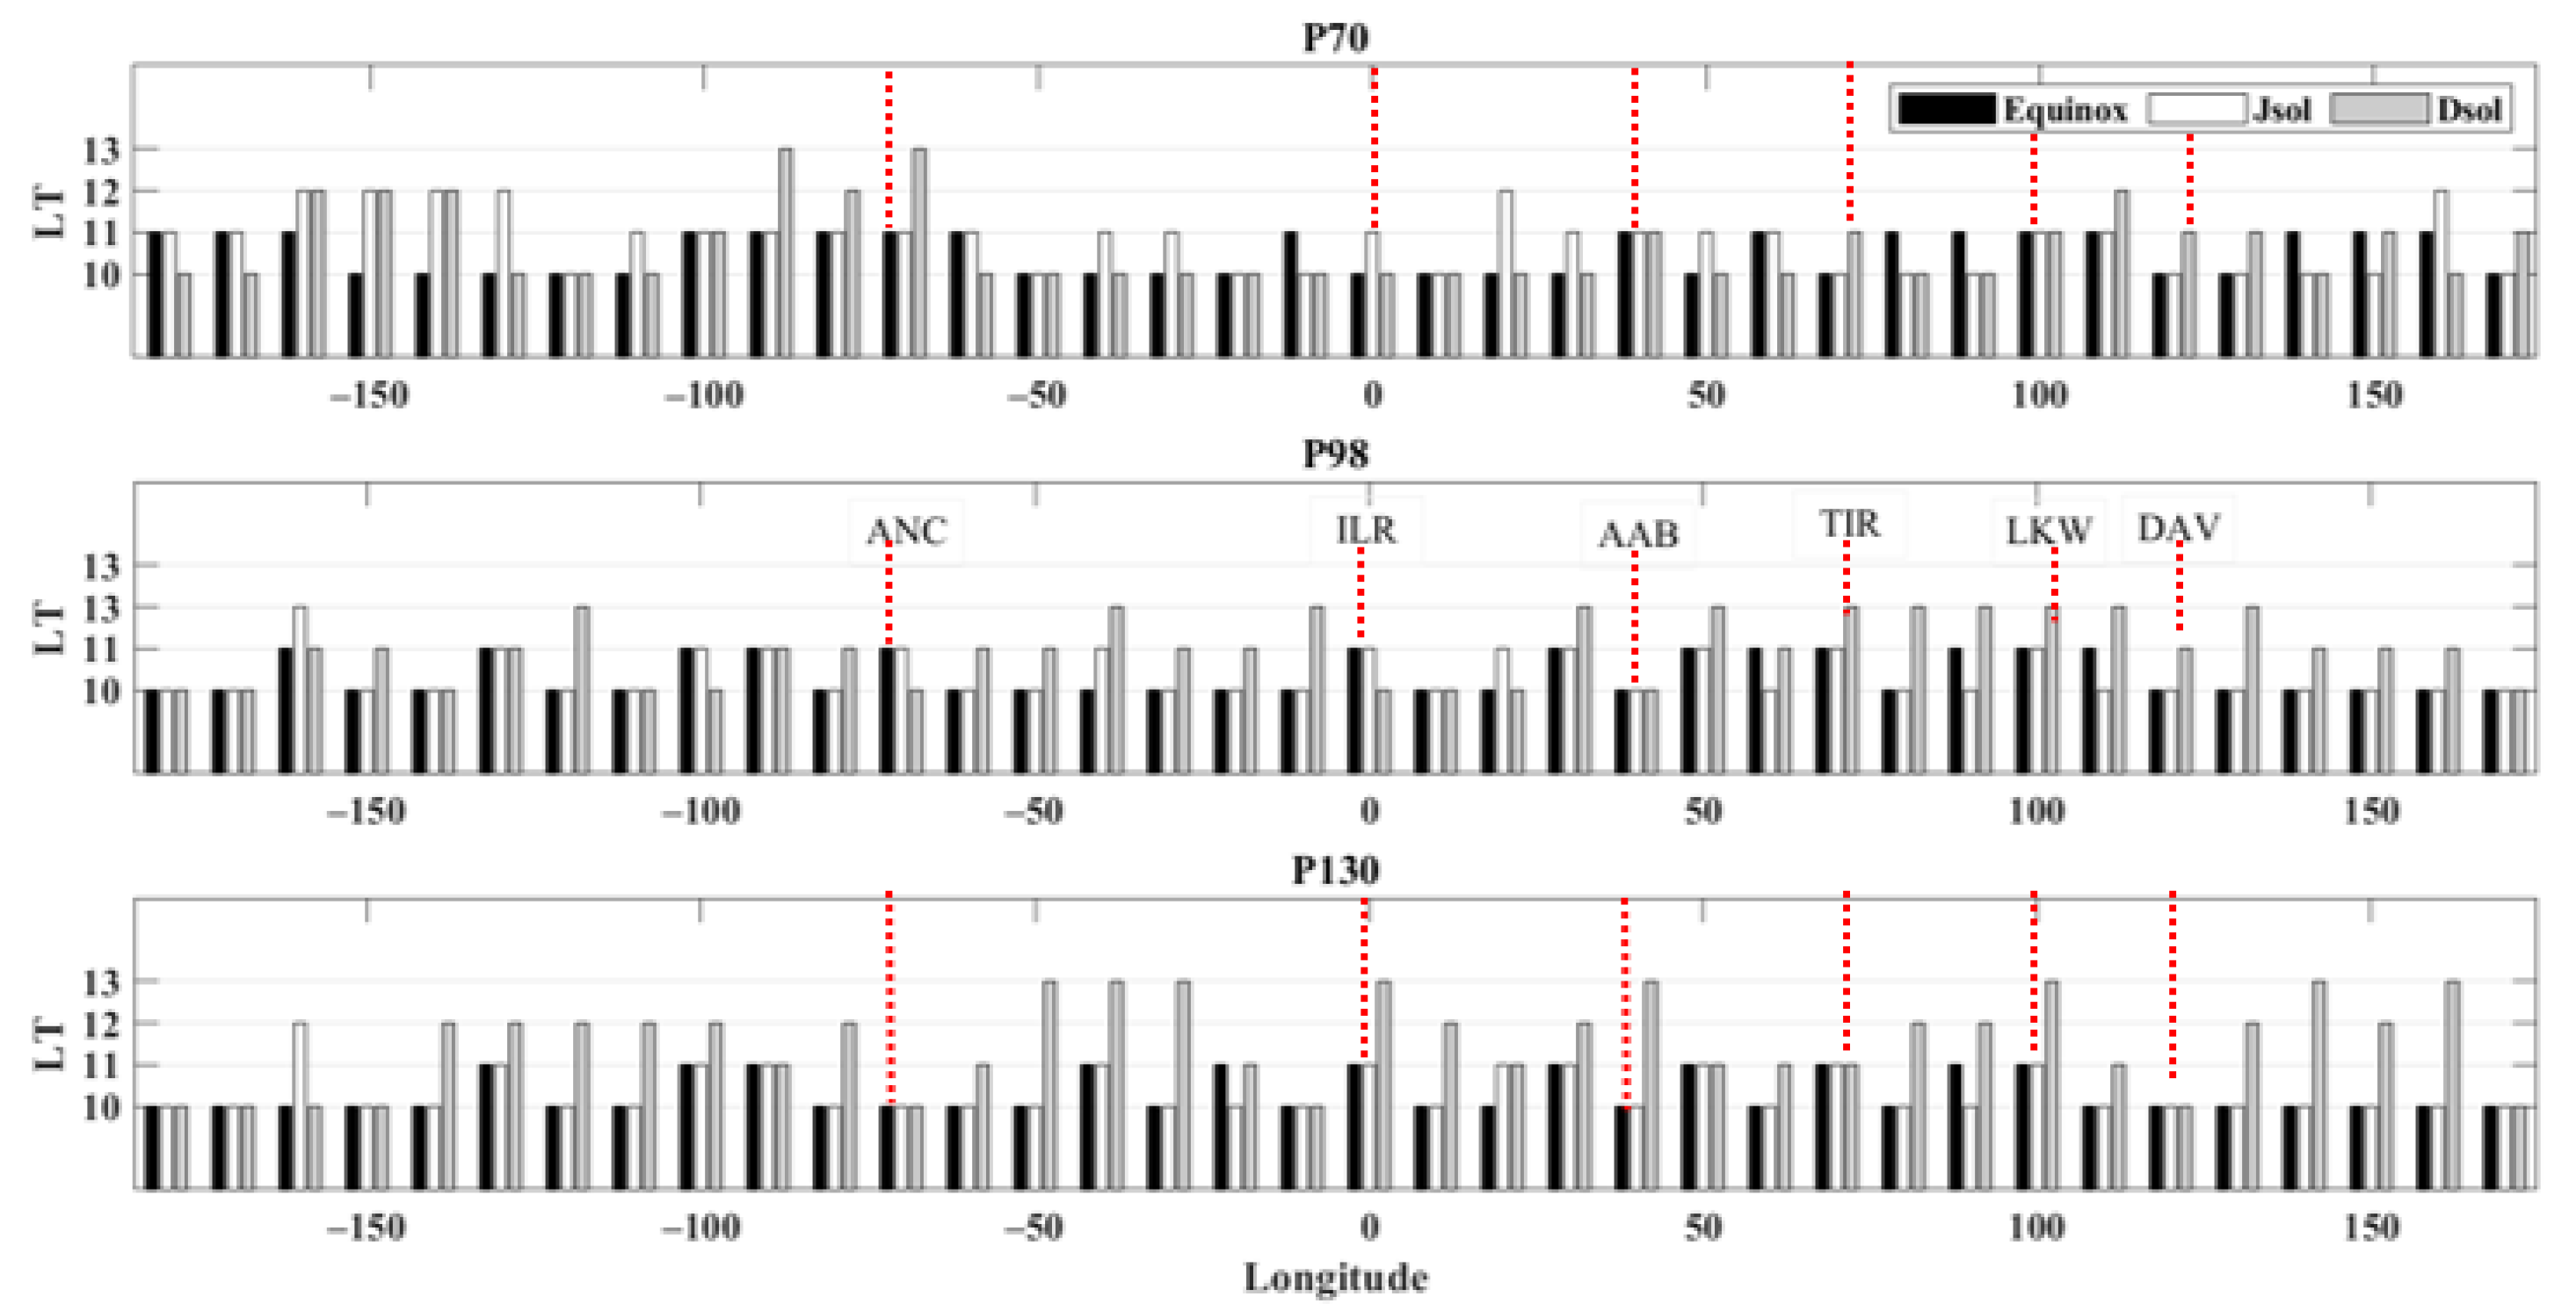
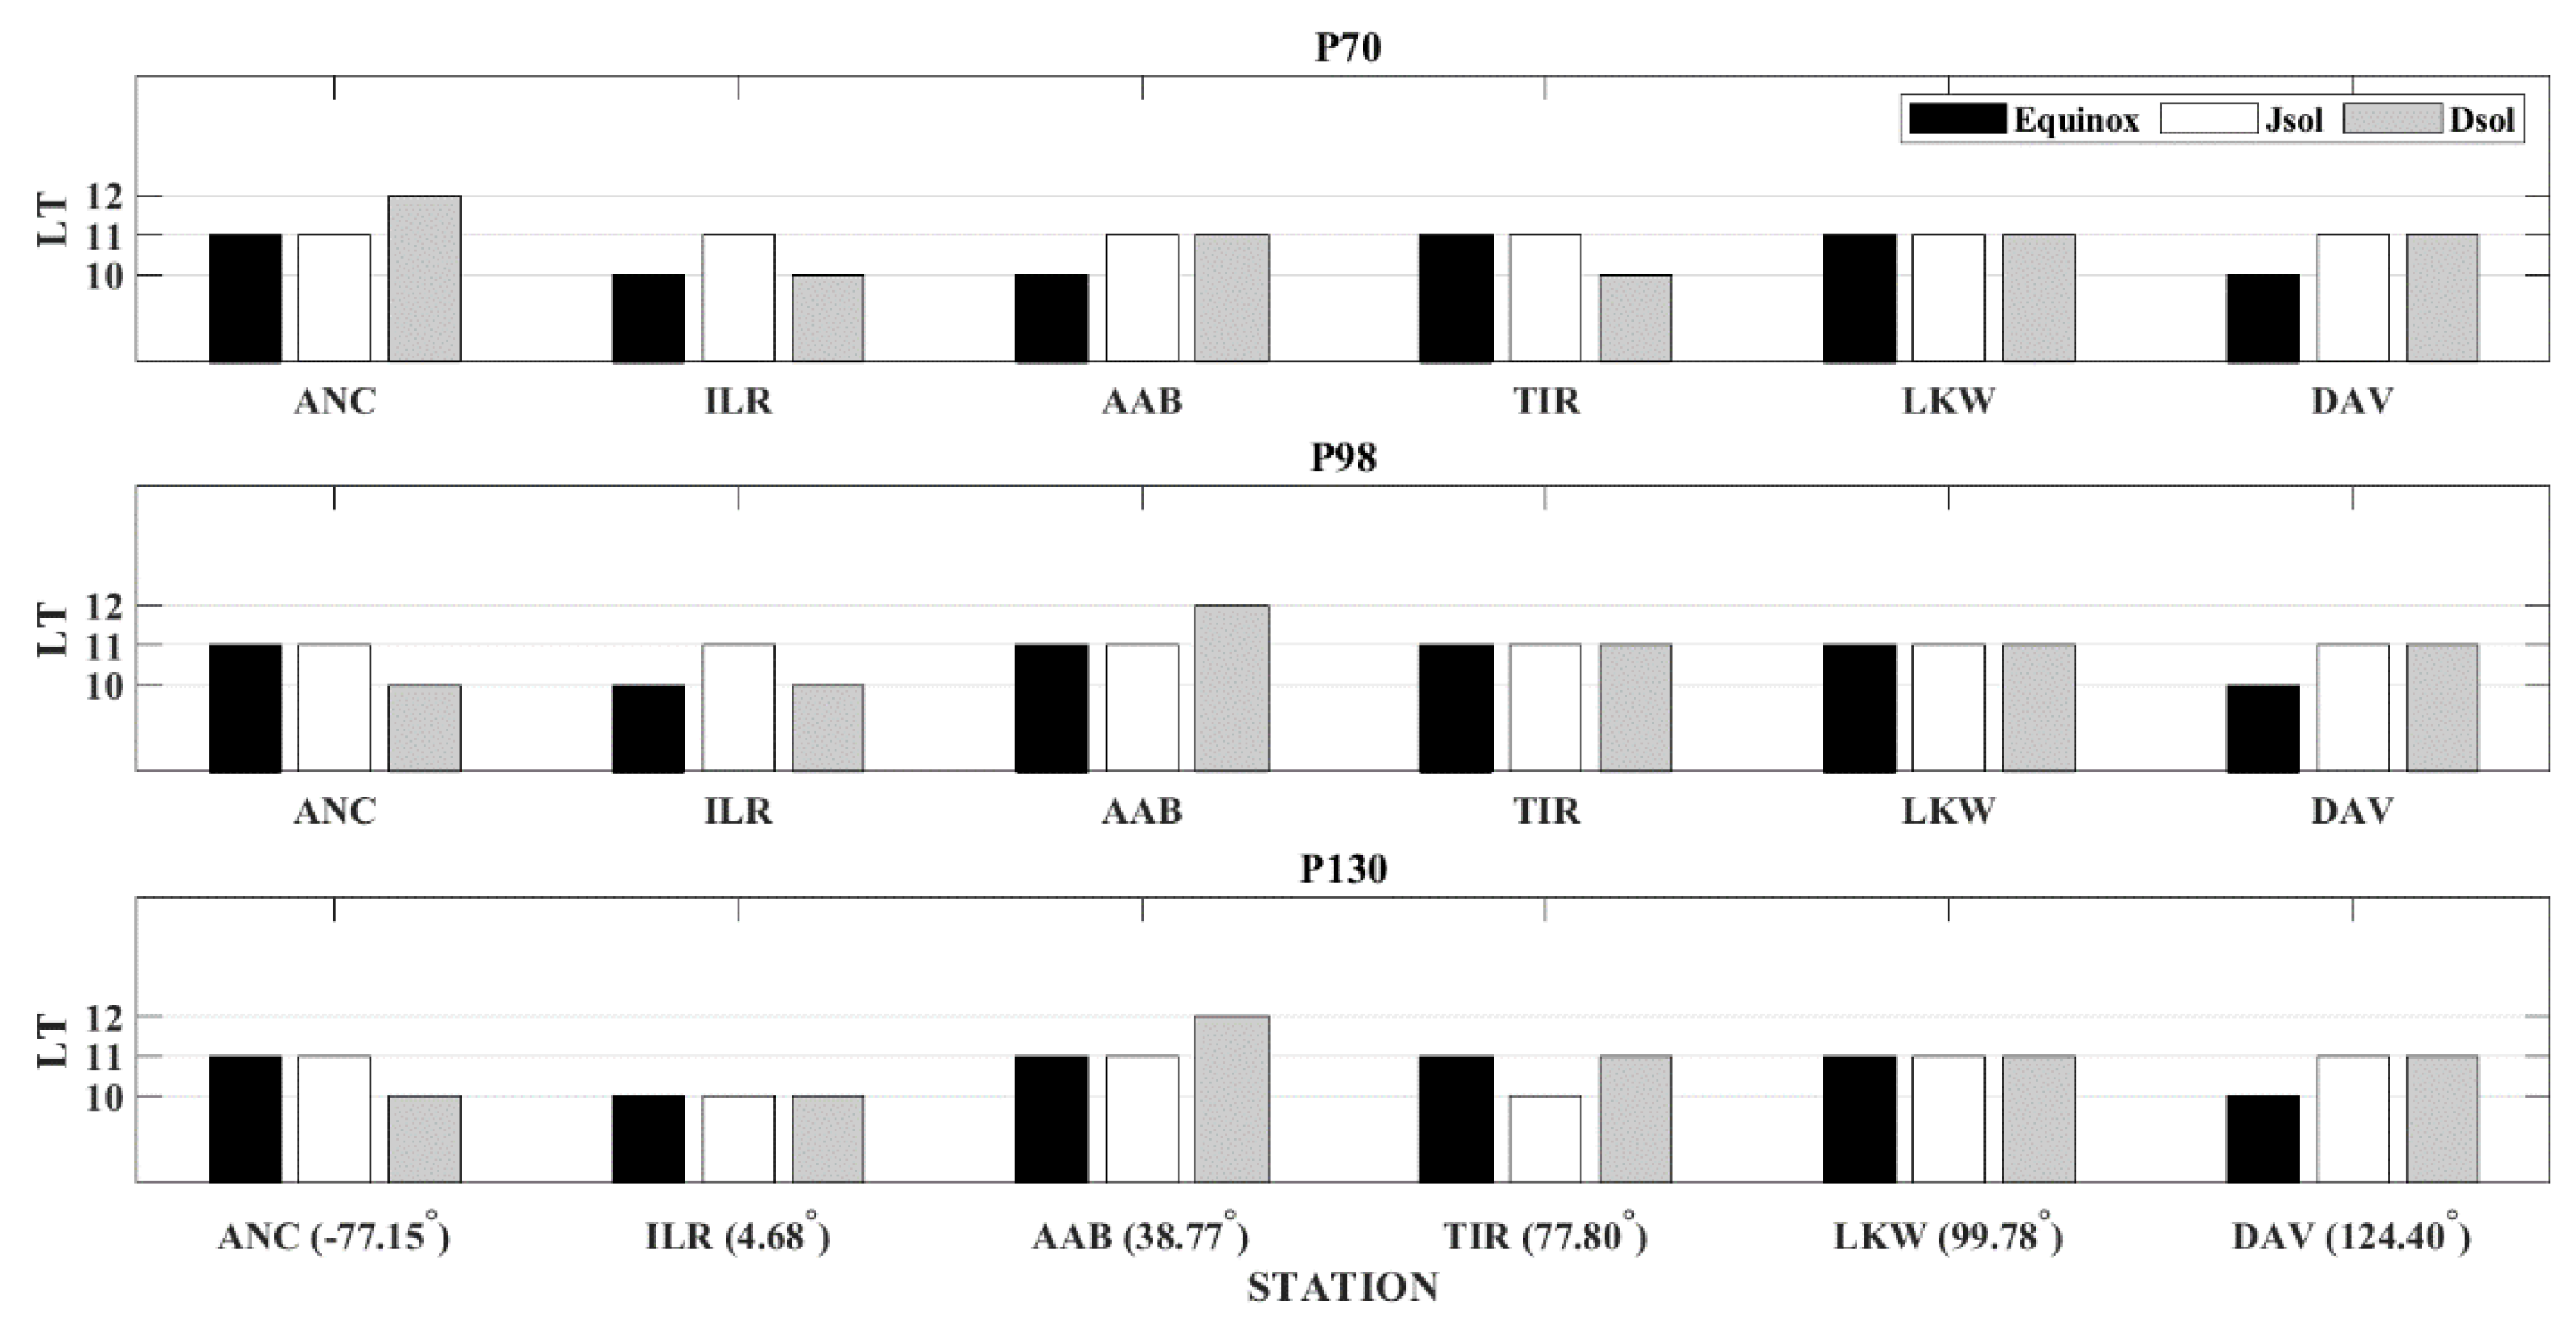
3.2. EEJ Peak Time for Satellite and Ground Measurement

We extend our examination onto the peak time of the EEJ for both ground and satellite measurements in this section. The EEJ intensity has been known to be higher during local noontime. The study by [37] based on ground data has suggested that the peak time of the EEJ has appeared at 11 LT during low solar activity and at 12 LT during high solar activity. In this current work, we explore the discrepancy of EEJ peak time variations between the ground and satellite measurements. Our study focused on the period between 10 LT and 13 LT because the EEJ reaches the highest magnitude during this period. The EEJ peak times for the satellite and ground measurements are shown in Figure 6 and Figure 7, respectively. The black, white, and grey bar plots represent the equinox, the June solstice, and the December solstice, respectively. The red lines in Figure 6 were added to indicate the location of the ground stations for a better comparison.
The local time plots in Figure 6 and Figure 7 are based on the highest magnitude for each longitude and station, respectively. As for satellite data, during all solar activity levels, the peak of the EEJ appeared earlier, at around 10 LT and 11 LT, during the equinox season. Satellite data observations also indicated that the EEJ current appeared later during the December solstice regardless of the solar activity levels. This was in line with a past study from [50], which reported that the EEJ has appeared earlier during equinox and later during the June and December solstices. However, there were some longitude sectors where local times remained the same throughout the season, for example, from the longitude sector −180° to −170° during moderate (P = 98) and high (P = 130) solar activity levels. On the other hand, other regions, such as the longitude from 50° to 120°, did not show a consistent pattern because the EEJ peak was seen to appear earlier in any season.
The consistency of peak time regardless of any solar activity level and the season was also observed in the ground data of the LKW station, as shown in Figure 7. The same consistency was also detected at TIR station (77.80°) and ILR (4.68°) at moderate and high levels of solar activity, respectively. Additionally, the EEJ peak time dependence on the season during low solar activity levels was observed at the ANC station in the South American sector, and in an agreement with satellite measurement where the EEJ peak time appeared later during December solstice. Apart from that, a similar trend was also seen about the EEJ time of appearance during the December solstice at the AAB station in the African sector at moderate (P = 98) and high (P = 130) levels of solar activity.
The study by [50,51] reported that the EEJ intensity during the equinox was higher compared to other seasons, leading to an earlier peak time in the Indian sector during the solar minimum. Their studies partly agree with the results from this study: analysis of the EEJ peak time for both ground and satellite measurements showed that seasonal dependence was observed in certain longitude sectors; for example, the peak time at the ANC station in the South American sector appeared later in December solstice during low solar activity. The previous studies also partly differ from the findings from this study: the seasonal dependence at all levels of solar activity is not observed in certain satellite longitude sectors and at the ground LKW station. On the other hand, this seasonal dependency seemed to be invariant with the level of solar activity in a certain longitude sector, such as the DAV station. In addition, the local time appearance of the EEJ peak time at the AAB station in the African sector was similar only during high solar activity for both ground and satellite measurements. Nevertheless, the previous studies also suggested that the seasonal order of EEJ intensity might be different at all times of the day.

4. Conclusions

The purpose of this paper was to analyze the longitudinal variation of the EEJ from the ground- and satellite-based measurements. The analysis was carried out using data from 2008 to 2014 from ground observation, while data from 2005 to 2010 were obtained from the CHAMP satellite and data from 2014 from the Swarm satellite (A and B). Data from different solar activities were categorized into low solar activity (P = 70), moderate solar activity (P = 98), and maximum solar activity (P = 130). Our analysis shows that the longitudinal profiles of the EEJ for ground and satellite measurements are almost in agreement with each other. The satellite results showed that the wave-4 structures as the EEJ peak were at around 100° W, 0° E, 100° E, and 180° E. On the other hand, ground observation showed a maximum EEJ at around 77.15° W in the South American sector and 99.78° E in the west Southeast sector, and a minimum EEJ at 38.77° E in the African sector. Additionally, it was found that during high solar conditions, the ground data showed some additional peaks in the African sector where the AAB station is located. This peak appeared slightly during moderate solar activity when the average P parameter was 98. However, in some longitude sectors, the location of the EEJ peak from both measurements differed by a few degrees. In order to have a better understanding of the longitudinal variation of EEJ between ground and satellite, the correlation analysis was performed. The correlation was calculated for 10° longitude width where the ground stations were located. Our analysis reported that a strong correlation was obtained with the 〈r〉 = 0.89 for EEJ that measured between 11 to 13 LT during low solar activity and weak correlation with 〈r〉 = 0.58 and 〈r〉 = 0.30 for moderate and high solar activity, respectively.
Subsequently, the EEJ peak time from both ground and satellite was also examined. Our analysis revealed the importance of considering the seasonal effect in a certain longitude sector, but this seasonal dependence does not depend completely on solar activity levels. In fact, in certain longitude sectors, there was no obvious pattern in which the EEJ peak time could appear earlier in the equinox compared to other seasons. Only certain longitude sectors have shown a consistent pattern of local time variation across all solar activity levels, while some of them have not. The differences in results between the previous studies and the present study may be due to several factors, including the lack of consideration of the Sq contribution on the EEJ from the ground measurement and the different levels of solar activity in those studies.
The past research has shown that the wave-4 structures from satellite data have been caused by the eastward propagating diurnal tide with wavenumber 3 (DE3); DE3 occurs from latent heat due to tropical convection in the troposphere region [52]. It is understood that this longitudinal variation could be caused by a possible mechanism from below the ionosphere. Among comprehensive studies on this issue were those reported by [53,54,55] using a first-principle model and various measurement of thermospheric parameters. Research by [6] also suggests that possible mechanisms such as tides in the ionosphere, planetary wave oscillations, interaction of gravity waves, and many others, may affect EEJ longitudinal variations. As some studies suggest, one of the interesting causes of EEJ variation is the Quasi-Biennial Oscillation (QBO) [56,57]. A recent study by [58] suggested that the QBO might not only affect the lower atmosphere but the upper atmosphere as well, such as the thermosphere and ionosphere. Moreover, the upward propagation of lower atmospheric tides plays an important role in shaping the EEJ on a daily basis [59,60]. We intend to carry out a study on the QBO and longitudinal variation of the EEJ in the future using both ground and satellite measurements.

Author Contributions

Conceptualization, W.N.I.I., N.S.A.H. and M.A.; Data curation, A.Y. and T.U.; Funding acquisition, N.S.A.H.; Investigation, W.N.I.I.; Methodology, W.N.I.I., and N.S.A.H. Project administration, M.A. and N.S.A.H.; Resources A.Y. and T.U.; Supervision N.S.A.H. and M.A.; Visualization, W.N.I.I.; Writing—original draft, W.N.I.I.; Writing—review and editing, N.S.A.H., M.A. and Z.M.R. All authors have read and agreed to the published version of the manuscript.

Funding

This work is supported by the grant FRGS/1/2018/STG02/UKM/02/3 of Ministry of Higher Education Malaysia and the work of A.Y. is supported by 367 JSPS KAKENHI Grant 19K03956, 15H05815 and JP20H01961.

Institutional Review Board Statement

Not applicable.

Informed Consent Statement

Not applicable.

Data Availability Statement

Ground geomagnetic data (MAGDAS) are available on request from Akimasa Yoshikawa ([email protected]) and INTERMAGNET are publicy available at www.intermagnet.org. EEJ satellite data are provided by Patrik Alken and European Space Agency (www.esa.int). The F10.7 data are publicy available at www.omniweb.gsfc.nasa.gov magnetic inclination component magnetic inclination component values which were obtained from www.ngdc.noaa.gov/geomag/.

Acknowledgments

The authors would like to extend their gratitude to all members of the MAGDAS project for their cooperation and contribution to this study. Appreciation is also extended to INTERMAGNET for promoting high standards of magnetic observatory practices. We would also like to thank Patrick Alken and the European Space Agency Swarm Level 2 for providing the EEJ satellite dataset, and Yosuke Yamazaki (from GFZ) for his support. The P parameter was calculated from F10.7 data that were obtained from the GSFC/SPDF OMNIWeb interface. Our gratitude goes to the National Geophysical Data Center (NGDC) for the magnetic inclination component values.

Conflicts of Interest

The authors declare no conflict of interest.

References

  1. Chapman, S.; Raja Rao, K.S. The H and Z variations along and near the equatorial electrojet in India, Africa and the Pacific. J. Atmos. Terr. Phys. 1965, 27, 559–581. [Google Scholar] [CrossRef]
  2. Egedal, J. The magnetic diurnal variation of the horizontal force near the magnetic equator. Terr. Magn. Atmos. Electr. 1947, 52, 658–676. [Google Scholar] [CrossRef]
  3. Onwumechili, C.A. The Equatorial Electrojet; Gordon and Breach: Newark, NJ, USA, 1997; ISBN 9056990691. [Google Scholar]
  4. Yacob, A.; Bhargava, B.N. The electrojet field from satellite and surface observations in the Indian equatorial region. J. Atmos. Sol. Terr. Phys. 1973, 35, 1253–1255. [Google Scholar] [CrossRef]
  5. Agu, C.E.; Onwumechili, C.A. Comparison of the POGO satellite and ground measurement of the magnetic field of the equatorial electrojet. J. Atmos. Terr. Phys. 1981, 43, 801–807. [Google Scholar] [CrossRef]
  6. Phani Chandrasekhar, N.; Arora, K.; Nagarajan, N. Characterization of seasonal and longitudinal variability of EEJ in the Indian region. J. Geophys. Res. Space Phys. 2014, 119, 10242–10259. [Google Scholar] [CrossRef] [Green Version]
  7. Doumouya, V.; Cohen, Y.; Arora, B.R.; Yumoto, K. Local time and longitude dependence of the equatorial electrojet magnetic effects. J. Atmos. Terr. Phys. 2003, 65, 1265–1282. [Google Scholar] [CrossRef]
  8. Hamid, N.S.A.; Liu, H.; Uozumi, T.; Yoshikawa, A. Empirical model of EEJ based on ground-based magnetometer data during solar minimum in fall. Earth Planets Space 2015, 67, 205. [Google Scholar] [CrossRef] [Green Version]
  9. Yamazaki, Y.; Maute, A. Sq and EEJ- A review on the Daily Variation of the Geomagnetic Field Caused by Ionospheric Dynamo Currents. Space Sci. Rev. 2016. [Google Scholar] [CrossRef] [Green Version]
  10. Yizengaw, E.; Brett, A.C. Longitudinal, seasonal and solar cycle variation in lunar tide influence on the equatorial electrojet. Ann. Geophys. 2017, 35, 525–533. [Google Scholar] [CrossRef] [Green Version]
  11. Kim, H.R.; King, S.D. A study of local time and longitudinal variability of the amplitude of the equatorial electrojet observed in POGO satellited data. Earth Planets Space 1999, 51, 373–381. [Google Scholar] [CrossRef] [Green Version]
  12. Cain, J.C.; Sweeney, R.E. The POGO data. J. Atmos. Terr. Phys. 1973, 35, 1231–1247. [Google Scholar] [CrossRef]
  13. Onwumechili, C.A.; Agu, C.E. Longitudinal variation of equatorial electrojet parameters derived from POGO satellite observations. Planet. Space Sci. 1980, 29, 627–634. [Google Scholar] [CrossRef]
  14. Langel, R.A.; Purucker, M.; Rajaram, M. The equatorial electrojet and associated currents as seen in Magsat data. J. Atmos. Terr. Phys. 1993, 55, 1233–1269. [Google Scholar] [CrossRef]
  15. Jadhav, G.; Rajaram, M.; Rajaram, R. A detailed study of equatorial electrojet phenomenon using Ørsted satellite observations. J. Geophys. Res. 2002, 107, 1175. [Google Scholar] [CrossRef]
  16. Ivers, D.; Stening, R.; Turner, J.; Winch, D. Equatorial electrojet from Ørsted scalar magnetic Field observations. J. Geophys. Res. 2003, 108, 1061. [Google Scholar] [CrossRef] [Green Version]
  17. Lühr, H.; Rother, M.; Häusler, K.; Alken, P.; Maus, S. The influence of non migrating tides on the longitudinal variation of the equatorial electrojet. J. Geophys. Res. 2008, 113, A08313. [Google Scholar]
  18. Lühr, H.; Manoj, C. The complete spectrum of the equatorial electrojet related to solar tides: CHAMP observations. Ann. Geophys. 2013, 31, 1315–1331. [Google Scholar] [CrossRef] [Green Version]
  19. Chulliat, A.; Vigneron, P.; Hulot, G. First results from the swarm dedicated ionospheric Field inversion chain. Earth Planets Space 2016, 68, 1–18. [Google Scholar] [CrossRef] [Green Version]
  20. Thomas, N.; Vichare, G.; Sinha, A.K. Characteristics of the equatorial electrojet derived from Swarm satellites. Adv. Space Res. 2017, 59, 1526–1538. [Google Scholar] [CrossRef]
  21. Alken, P.; Maus, S. Spatio-temporal characterization of the equatorial electrojet from CHAMP, Ørsted, and SAC-C satellite magnetic measurements. J. Geophys. Res. 2007, 112, A09305. [Google Scholar] [CrossRef] [Green Version]
  22. Doumbia, V.; Grodji, O.D.F. On the Longitudinal Dependence of the Equatorial Electrojet. In Geophysical Monograph Series; Fuller-Rowell, T., Yizengaw, E., Doherty, P.H., Basu, S., Eds.; Wiley: Hoboken, NJ, USA, 2016; pp. 115–125. [Google Scholar] [CrossRef]
  23. Tuo, Z.; Doumbia, V.; Coïsson, P.; Kouassi, N.; Kassamba, A.A. Variations of the peak positions in the longitudinal profile of noon-time equatorial electrojet. Earth Planets Space 2020, 72, 174. [Google Scholar] [CrossRef]
  24. Rigoti, A.; Chamalaun, F.H.; Trivedi, N.B.; Padilha, A.L. Characteristics of the equatorial electrojet determined from an array of magnetometers in N-NE Brazil. Earth Planets Space 1999, 51, 115–128. [Google Scholar] [CrossRef] [Green Version]
  25. Rastogi, R.G.; Chandra, H.; James, M.E.; Kitamura, K.; Yumoto, K. Characteristics of the equatorial electrojet in the central region of South America. Earth Planets Space 2008, 60, 623–632. [Google Scholar] [CrossRef] [Green Version]
  26. Rastogi, R.G.; Chandra, H.; Yumoto, K. Equatorial electrojet in east Brazil longitudes. J. Earth Syst. Sci. 2010, 119, 497–505. [Google Scholar] [CrossRef] [Green Version]
  27. Rastogi, R.G.; Kitamura, T.; Kitamura, K. Geomagnetic Field variations at the equatorial electrojet station in Sri Lanka, Peredinia. Ann. Geophys. 2004, 22, 2729–2739. [Google Scholar] [CrossRef] [Green Version]
  28. Onwumechili, C.A. A study of the equatorial electrojet, I: An experimental study. J. Atmos. Sol. Terr. Phys. 1959, 13, 222–234. [Google Scholar] [CrossRef]
  29. Doumouya, V.; Vassal, J.; Cohen, Y.; Fambitakoye, O.; Menvielle, M. Equatorial electrojet African longitude: First results from magnetic measurement. Ann. Geophys. 1998, 16, 658–676. [Google Scholar] [CrossRef]
  30. Rastogi, R.G.; Chandra, H. Equatorial electrojet in the African sector. Indian J. Radio Space Phys. 2015, 44, 187–198. [Google Scholar]
  31. Rastogi, R.G. Longitudinal variation in the equatorial electrojet. J. Atmos. Sol. Terr. Phys. 1962, 24, 1031–1040. [Google Scholar] [CrossRef]
  32. Babatunde Rabiu, A.; Folarin, O.O.; Uozumi, T.; Hamid, N.S.A.; Yoshikawa, A. Longitudinal variation of equatorial electrojet and the occurrence of its counter electrojet. Ann. Geophys. 2017, 35, 535–545. [Google Scholar] [CrossRef] [Green Version]
  33. Matzka, J.; Siddiqui, T.A.; Lilienkamp, H.; Stolle, C.; Veliz, O. Quantifying solar flux and geomagnetic main field influence on the equatorial ionospheric current system at the geomagnetic observatory Huancayo. J. Atmos. Sol. Terr. Phys. 2017, 56, 1364–6826. [Google Scholar] [CrossRef] [Green Version]
  34. Osborne, D.G. Electrojet measurements from satellite and ground. J. Atmos. Sol. Terr. Phys. 1973, 35, 1273–1279. [Google Scholar] [CrossRef]
  35. Yacob, A. Internal induction by the equatorial electrojet in India examined with surface and satellite geomagnetic observations. J. Atmos. Sol. Terr. Phys. 1973, 39, 601–606. [Google Scholar] [CrossRef]
  36. Manoj, C.; Lühr, H.; Maus, S.; Nagarajan, N. Evidence for short spatial correlation lengths of the noontime equatorial electrojet inferred from a comparison of satellite and ground magnetic data. J. Geophys. Res. 2006, 111, A11312. [Google Scholar] [CrossRef]
  37. Rastogi, R.G.; Iyer, K.N. Quiet Day Variation of Geomagnetic H-Field at Low Latitude. J. Geomagn. Geoelectr. 1976, 28, 461–479. [Google Scholar] [CrossRef]
  38. Hamid, N.S.A.; Liu, H.; Uozumi, T.; Yoshikawa, A. Relationship between the equatorial electrojet and global Sq currents at the dip equator region. Earth Planets Space 2014, 66, 146. [Google Scholar] [CrossRef] [Green Version]
  39. Ismail, W.N.I.; Hamid, N.S.A.; Abdullah, M.; Yoshikawa, A.; Uozumi, T. Longitudinal Variation of EEJ current during Different Phases of Solar Cycle. Iop Conf. Ser. J. Phys. Conf. Ser. 2017, 852, 012019. [Google Scholar] [CrossRef] [Green Version]
  40. Ismail, W.N.I.; Hamid, N.S.A.; Abdullah, M.; Shukur, N.H.A.; Yoshikawa, A. Variation of equatorial electrojet curret profiles over solar phases. Asm Sci. J. 2019, 12, 125–133. [Google Scholar]
  41. Uozumi, T.; Yumoto, K.; Kitamura, K.; Abe, S.; Kakinami, Y.; Shinohara., M.; Yoshikawa, A.; Kawano, H.; Ueno, T.; Tokunaga, T.; et al. A new index to monitor temporal and long-term variations of the Equatorial Electrojet by MAGDAS/CPMN real-time data: EE-Index. Earth Planets Space 2008, 60, 784–790. [Google Scholar] [CrossRef] [Green Version]
  42. Sabaka, T.J.; Olsen, N.; Purucker, M.E. Extending comprehensive models of the Earth’s magnetic field with Ørsted and CHAMP data. Geophys. J. Int. 2004, 159, 521–547. [Google Scholar] [CrossRef]
  43. Alken, P.; Maus, S.; Vigneron, P.; Olivier, S.; Gauthier, H. Swarm SCARF equatorial electric field inversion chain. Earth Planets Space 2013, 65, 1309–1317. [Google Scholar] [CrossRef] [Green Version]
  44. Yamazaki, Y.; Yumoto, K.; Cardinal, M.G.; Fraser, B.J.; Hattori, P.; Kakinami, Y.; Liu, J.Y.; Lynn, J.W.; Marshall, R.; McNamara, D.; et al. An empirical model of the quiet daily geomagnetic field variation. J. Geophys. Res. 2011, 116. [Google Scholar] [CrossRef]
  45. Pedatella, N.M.; Forbes, J.M.; Richmond, A.D. Seasonal and longitudinal variation of the solar quiet (Sq) current system during solar minimum determined by CHAMP satellite magnetic field observations. J. Geophys. Res. 2011, 116, A04317. [Google Scholar] [CrossRef] [Green Version]
  46. Doumouya, V.; Cohen, Y. Improving and testing the empirical equatorial electrojet model with CHAMP satellite data. Ann. Geophys. 2004, 22, 3323–3333. [Google Scholar] [CrossRef]
  47. Le Mouel, J.L.; Shebalin, P.; Chulliat, A. The field of the equatorial electrojet from CHAMP data. Ann. Geophys. 2006, 24, 515–527. [Google Scholar] [CrossRef] [Green Version]
  48. England, S.L.; Maus, S.; Immel, T.J.; Mende., S.B. Longitudinal variation of the E-region electric fields caused by atmospheric tides. J. Geophys. Res. 2006, 33, L21105. [Google Scholar] [CrossRef] [Green Version]
  49. Alken, P.; Maus, S. Electric fields in the equatorial ionosphere derived from CHAMP satellite magnetic fields measurements. J. Atmos. Terr. Phys. 2010, 72, 319–326. [Google Scholar] [CrossRef]
  50. Oko, S.O.; Onwumechili, C.A.; Ezema, P.O. Geomagnetically quiet day ionospheric currents over the Indian sector-II. Equatorial Electrojet currents. J. Atmos. Sol. Terr. Phys. 1996, 58, 555–564. [Google Scholar] [CrossRef]
  51. Ogbuehi, P.O.; Onwumechili, C.A. Daily and seasonal changes in the equatorial electrojet in Nigeria. J. Atmos. Sol. Terr. Phys. 1964, 26, 889–898. [Google Scholar] [CrossRef]
  52. Forbes, J.M.; Zhang, X.; Palo, S.; Russell, J.; Mertens, C.J.; Mlynczak, M. Tidal variability in the ionospheric dynamo region. J. Geophys. Res. 2008, 113, A02310. [Google Scholar] [CrossRef]
  53. Doumbia, V.; Maute, A.; Richmond, A.D. Simulation of equatorial electrojet magnetic effects with the thermosphere-ionosphere-electrodynamics general circulation model: Equatorial electrojet magnetic effects. J. Geophys. Res. Space Phys. 2007, 112, A09309. [Google Scholar] [CrossRef] [Green Version]
  54. Klimenko, V.V.; Klimenko, M.V.; Bessarab, F.S.; Sukhodolov, T.V.; Rozanov, E.V. The dependence of four-peak longitudinal structure of the tropical electric field on the processes in the lower atmosphere and geomagnetic field configuration. 2019, 64, 1854–1864.doi 10.1016/j.asr.2019.06.029. Adv. Space Res. 2019, 64, 1854–1864. [Google Scholar] [CrossRef]
  55. Oberheide, J.; Forbes, J.M.; Zhang, X.; Bruinsma, S.L. Wavedriven variability in the ionosphere-thermosphere-mesosphere system from TIMED observations: What contributes to the ‘‘wave 4”? J. Geophys. Res. 2011, 116, A01306. [Google Scholar] [CrossRef]
  56. Kane, R.P. Quasi-biennial oscillations in quiet-day ranges of low latitude geomagnetic H component. Indian J. Radio Space Phys. 1996, 25, 101–105. [Google Scholar]
  57. Rao, K.R.; Joseph, K.T. Quasi-biennial oscillations in the geomagnetic Sq field in the low latitude region. J. Atmos. Sol. Terr. Phys. 1971, 33, 797–805. [Google Scholar] [CrossRef]
  58. Yadav, S.; Vineeth, C.; Kumar, K.K.; Choudhary, R.K.; Pant, T.K.; Sunda, S. The Role of the Phase of QBO in Modulating the Influence of the SSW Effect on the Equatorial Ionosphere. J. Geophys. Res. 2019, 124, 6047–6063. [Google Scholar] [CrossRef]
  59. Abdu, M.A.; Ramkumar, T.K.; Batista, I.S.; Brum, C.G.M.; Takahashi, H.; Reinisch, B.W.; Sobral, J.H.A. Planetary wave signatures in the equatorial atmosphere-ionosphere system, and mesosphere-E- and F-region coupling. J. Atmos. Sol. Terr. Phys. 2006, 68, 509–522. [Google Scholar] [CrossRef]
  60. Vineeth, C.; Pant, T.K.; Kumar, K.K.; Sumod, S.G.; Gurubaran, S.; Sridharan, R. Planetary wave-tidal interactions over the equatorial mesosphere-lower thermosphere region and their possible implications for the equatorial electrojet. J. Geophys. Res. 2011, 116, A01314. [Google Scholar] [CrossRef] [Green Version]
Figure 1. An example of normalization method of the EUEL index at the Southeast Asian sector (DAV–MUT stations pair).
Universe 07 00023 g001
Figure 2. The longitudinal variation of the EEJ current derived from ground (nT) and satellite (mA/m) data during low solar activity level (P = 70) at (a) 11 LT (b) 12 LT and (c) 13 LT.
Universe 07 00023 g002
Figure 3. The longitudinal variation of the EEJ current derived from the ground (nT) and satellite (mA/m) data during moderate solar activity level (P = 98) at (a) 11 LT (b) 12 LT, and (c) 13 LT.
Universe 07 00023 g003
Figure 4. The longitudinal variation of the EEJ current derived from the ground (nT) and satellite (mA/m) data during high solar activity level (P = 130) at (a) 11 LT (b) 12 LT, and (c) 13 LT.
Universe 07 00023 g004
Figure 5. The computed correlation coefficient (r) between satellite and ground data at 11 to 13 LT during (a) low (P = 70), (b) moderate (P = 98) and (c) high (P = 130) solar activity level.
Universe 07 00023 g005
Figure 6. Bar plots for local time vs. longitude for satellite measurements during low (P = 70), moderate (P = 98) and high (P = 130) solar activity levels. The black, white, and grey plots represent the equinox, June solstice and December solstice, respectively. The red lines represent the locations of the ground stations.
Universe 07 00023 g006
Figure 7. Bar plots for local time vs. longitude for ground measurements during low (P = 70), moderate (P = 98), and high (P = 130) solar activity levels. The black, white, and grey plots represent the equinox, June solstice and December solstice, respectively.
Universe 07 00023 g007
Table 1. Geographic and geomagnetic coordinates for ground observations.
SectorStation NameStation CodeGeographicGeomagnetic
Lat. (°)Lon. (°)Lat. (°)Lon. (°)
South AmericaAnconANC−11.77−77.150.77354.33
FuqueneFUQ5.40−73.7315.72357.99
AfricaIlorinILR8.504.68−1.8276.80
TamanrassetTAM22.805.5025.4080.60
Adis AbabaAAB9.0438.770.18110.47
NairobiNAB−1.1636.48−10.65108.18
IndiaTirunelveliTIR8.7077.800.21149.30
AlibagABG18.6272.8710.36146.54
Southeast AsiaLangkawiLKW6.3099.78−2.32171.29
KototabangKTB−0.20100.32−10.63171.93
DavaoDAV7.00125.40−1.02196.54
MuntinlupaMUT14.37121.026.79192.24
Publisher’s Note: MDPI stays neutral with regard to jurisdictional claims in published maps and institutional affiliations.

