
Evolutionary Game Analysis between Local Government and Enterprises on Bridge Employment from the Perspective of Dynamic Incentive and Punishment


School of Economics and Management, Tongji University, Shanghai 200092, China
*
Author to whom correspondence should be addressed.
Systems 2022, 10(4), 115; https://doi.org/10.3390/systems10040115
Submission received: 12 July 2022
/
Revised: 28 July 2022
/
Accepted: 4 August 2022
/
Published: 5 August 2022
(This article belongs to the Section Systems Practice in Social Science)
Abstract
:The popularization of bridge employment is conducive to the realization of active aging, which requires not only the subjective initiative of retirees but also the active cooperation of local governments and relevant enterprises. This study combined evolutionary game theory with system dynamics to model and simulate the behavior of local government and enterprises on bridge employment, aiming to highlight the importance of government behavior and enterprise actions in the process of active aging and to analyze the effectiveness of different incentive and punishment mechanisms in promoting bridge employment. Results show that the system with dynamic incentive and punishment is easier to keep stable than the system with static incentive and punishment; specifically, the dynamic mechanism with low incentive intensity and high punishment intensity is better than other mechanisms. Finally, this study emphasized the importance of government policy to bridge employment and put forward relevant management implications.
1. Introduction
In 2002, the World Health Organization (WHO) formally put forward the concept of active aging, which is defined as “…the process of optimizing opportunities for health, participation and security in order to enhance the quality of life as people age” [1]. In recent years, active aging has grown from an abstract concept to a concept guiding the formulation of legal systems, policies, and regulations related to the elderly in various countries around the world, covering many aspects of economic and social life, including health, finance, labor, society, family, and social security. For example, Active Aging Strategy 2016–2022 in Northern Ireland, The National Strategic Policy for Active Aging 2014–2020 in Malta, Healthy Aging 2014–2030 in Lithuania, and the Asian Active Aging Index (AAI) in South-East Asia. According to the WHO report, “active” in active aging refers to continued participation in social, cultural, economic, spiritual, and civic matters, as well as physical activity or participation in the labor force [2]. In other words, the social participation of the elderly has become an important part of the policy to respond to the aging population, and bridge employment is one of the important forms of social participation, which refers to any type of paid work that an employee takes after retirement from a career [3,4].
It is revealed that the proportion of the elderly returning to paid work after retirement form an important and growing share of the labor market in many countries. For instance, data from the China Health and Retirement Longitudinal Study (CHARLS) showed that 32.23% of Chinese workers are re-employed after retirement [5]. Statistics by Platts et al. [6] indicated that 25% of British citizens aged 50–69 years experienced a retirement reversal after reporting being retired. The proportion of the elderly who are re-employed for income is reported to be 36.3% and increasing by the Statistics Canada Labour Force Survey [7]. In addition, about half of the workers are re-employed after retirement in the United States [8]. Participation in bridge employment is increasingly common in various countries. A large percentage of the elderly are engaged in some form of paid work after retirement, and the vast majority of baby boomers intend to carry on such bridge employments [9]. As a result, bridge employment could become the “new normal” for retirees [10].
The existing research has made a lot of achievements in the definition, antecedents, and outcomes of bridge employment, focusing on the mental health and behavior of bridge employees. Scholars have adopted different theories to explain the heterogeneity of bridge employment, but few studies have applied evolutionary game theory. This paper holds that bridge employment, as an important implementation measure of active aging, involves not only individual factors and organizational factors but also government factors at the national level. However, the current research on how to regulate government and enterprise behavior is still scattered. Many scholars have quantified the intervention measures used by the government into specific parameters and established mathematical models to calculate and deduce the relationship between various subjects, especially the incentive and punishment mechanism model based on evolutionary game theory. For example, You et al. [11] simulated the multi-player evolutionary game and analyzed the influence of different reward and punishment strategies on the game process and equilibrium state. Fan et al. [12] studied how to mobilize the enthusiasm of government, community, and residents by using evolutionary game theory and system dynamics. Meng et al. [13] studied the dynamic evolution between different government reward and punishment mechanisms and contractor behavior in the process of green building construction. Based on the existing research, this paper assumes that the government and enterprises are bounded rational groups and constructs the game matrix of the government and enterprises on the bridge employment problem from the perspective of dynamic reward and punishment combined with evolutionary game theory and system dynamics. The purpose of this study was to highlight the importance of government and enterprises’ actions in the process of active aging and to analyze the effectiveness of different incentive and punishment mechanisms in promoting bridge employment.
This research made contributions in the following aspects. Firstly, we focused on the behavior of government and enterprises, which is a supplement to the existing research on bridge employment. Secondly, we applied the evolutionary game theory and system dynamics to study how to promote bridge employment, which is a breakthrough in the method and theory. Thirdly, we studied bridge employment from multiple perspectives such as government static incentive and punishment as well as dynamic incentive and punishment, the research conclusions have practical significance and can provide a reference for management practice.
2. Literature Review
Bridge employment refers to the labor force participation mode shown by older workers when they leave their jobs and move toward absolute labor force withdrawal [14]. It includes self-employment, part-time jobs, or temporary jobs after full-time employment ends and before formal retirement begins [15]. Bridge employment is of great significance because it has an influence on the transition process of retirement and therefore redefines retirement [16,17].
The existing literature has studied bridge employment from different perspectives such as sociology [18], gerontology [19], management [20], economics [21], and psychology [22], mainly involving the following topics: (a) Types of bridge employment. Most literature generally divides bridge employment into two categories: career bridge employment and non-career bridge employment (bridge employment in different fields) [17]. Career bridge employment refers to individuals accepting jobs in the same organization or field [14,23]. While the majority of seniors prefer to seek bridge employment in a different field (non-career bridge employment), usually taking part-time or other temporary jobs in exchange for flexibility [14,24]. (b) Predictors of bridge employment. At the individual level, health is an important predictor of bridge employment [25]. More educated retirees may have more options for bridge employment [26]. Moreover, financial status and income level have a somewhat convoluted relationship with bridge employment [10,27]. At the organizational level, organizational commitment is positively correlated with bridge employment [28]. The degree of compatibility between perceived organizational support and psychological contract jointly determines the motivation to choose bridge employment [29], and job satisfaction is also positively correlated with accepting a bridge employment job [30]. (c) Outcomes of bridge employment. Studies have shown that older people with bridge employment have a lower risk of all-cause mortality [31], better mental health [32], and overall life satisfaction [33]. In general, bridge employment is a positive phenomenon for individuals, employers, and the country as a whole [34]. (d) Relevant theories of bridge employment. For example, Mazumdar et al. [35] used socio-emotional selectivity theory to describe the experience and expectations of bridge employees. Zhan et al. [36] applied the social gender role theory to explore the impact of different motivational orientations on bridge employment participation. Wang [17] combined continuity theory, role theory, and the life course perspective to examine the change patterns of bridge employees’ psychological well-being. Lahlouh et al. [37] explored the relationship between two types of retirement intentions and different categories of person–environment fit based on the theory of person–environment fit. Peng et al. [38] examined the mechanism between bridge employment intentions and preretirement job-related psychosocial factors based on the socioemotional selectivity theory. Garcia, Amarnani, Bordia, and Restubog [29] verified the influence of perceived organizational support and psychological contract in predicting bridge employment intentions drawing on social exchange theory.
The majority of existing research has focused on bridge employees themselves. However, as one of the important forms of active aging, the governmental and organizational factors related to bridge employment are rarely mentioned in the literature. In order to cope with aging, the government should actively promote the re-employment of retirees, and enterprises should also actively respond to the implementation of this policy. However, in reality, it is hard for older people to re-enter organizations because of widespread stereotypes about older workers’ productivity and attitudes, which can be partly attributed to the idea of an age–productivity gap [39]. Despite the prospect of future labor shortages, only 13% of European employers would be interested in employees over 65 years old [40]. In addition, employers are usually reluctant to develop formal policies for hiring retirees [41], and they tend to devalue the skills and productivity of older workers; therefore, retirees are often not the first choice for employers [42]. For retirees entering career bridge employment, a sense of personal accomplishment may be the main driver of their return to work [43]. However, employers may not anticipate such expectations from them. One study indicated that retirees who return to their former employers report more underutilization and disappointments compared to those who work for other companies [44] because bridge employees feel that their prior expertise and experience are rarely recognized at work [45]. On the other hand, the majority of older workers who enter non-career bridge employment often choose non-standard employment with reduced status in exchange for flexibility in working hours, such as contract workers, seasonal workers, or agency workers [46,47], and employers expect them to accept lower wages when signing work contracts [41].
In general, in terms of research content, existing research has achieved fruitful results in the field of bridge employment, but there are few studies on how to regulate the behavior of local governments and enterprises. From the perspective of research theory, although different scholars have adopted different theories to explain the heterogeneity of bridge employment, there are few findings on the use of evolutionary game theory to discuss bridge employment. At present, the aging problem is a global issue, and actively encouraging retirees to return to employment is helpful to achieve active aging. In the process of promoting bridge employment, not only the subjective initiative of retirees should be taken into account but also the active cooperation between the local government and relevant enterprises. Therefore, this paper intends to make innovative use of evolutionary game theory to study how to effectively regulate the behavior of local government and enterprises on the issue of bridge employment so as to provide a new theoretical perspective for promoting the re-employment of retirees and realizing active aging.
3. Materials and Methods
3.1. Theoretical Basis
Evolutionary game theory was first developed by theoretical biologists such as Maynard Smith. They used the game theory framework of economics to analyze the interdependence and struggle in the biological world, thereby formalizing Darwin’s idea of evolution by natural selection. The evolutionary game theory contains two significant concepts, one is the evolutionary stable strategy (ESS) proposed by Smith and Price [48], and the other is the replication dynamic equation (RD) used by Taylor and Jonker [49]. The ESS gives the condition that a given strategy can remain stable when it is invaded by mutation strategy, while the RD describes the dynamic trajectory of strategy evolution to achieve equilibrium.
Let be the probability of individuals who choose strategy , and is the state vector of the population. Let be the payoff per unit time when choosing strategy , which means the fitness of in state .
Definition 1
Definition 2
[49]. Let of a strategy be an estimate of the growth rate , then the RD can be written as
Although born in theoretical biology, the evolutionary game theory also has applications in management, economics, and sociology. For example, Zhiwen et al. [51] proposed an evolutionary-game-theory-based supply chain logistics information collaboration strategy and analyzed the strategy evolution game of manufacturers, suppliers, and the combination of manufacturers and suppliers. Pan et al. [52] innovatively expounded the process of cultural transmission, adaptation, maintenance, and change based on evolutionary game theory. Krapohl et al. [53] analyzed the stability of international trade cooperation by using evolutionary game theory. Dong and Yan [54] constructed an evolutionary game matrix about working overtime from the perspective of information asymmetry.
3.2. Problem Description
Promoting the re-employment of the elderly is a multi-player process with randomness and variability as its important characteristics. Evolutionary game theory has the advantages of bounded rationality hypothesis and incomplete information, which is suitable for local governments and enterprises to make complex and dynamic decisions on bridge employment. The implementation of “bridge employment” is a long-term, cyclical problem. Policy simulation based on system dynamics is helpful to scientifically explain the game between local government and enterprises to obtain the optimal result of the game. From the perspective of incentive and punishment, the local government is the executioner of incentive and punishment, and the enterprise is the receiver of incentive and punishment. Both parties are bounded rational subjects who will find the optimal strategy through multiple games under the condition of information asymmetry.
As one party of the game, local governments will not only consider public interests but also their own interests. In the process of promoting active aging, local governments are obliged to take effective measures to guide and encourage relevant enterprises to achieve the sound development of the social economy and maximize their interests. The government’s incentive and punishment strategies can be divided into active and passive, and the corresponding probabilities are and , respectively, . The active strategy of local government refers to the promulgation and implementation of incentive and punishment policies to promote the participation of the elderly in bridge employment, such as subsidies, bonuses, high fines, and other forms. The passive strategy of local government means that the government only adopts encouragement and publicity to promote bridge employment, and there are no practical incentive measures, or the punishment is too low for enterprises’ violations. Assume that the direct cost of active government supervision is , including financial support for enterprises, additional supervision, and training costs. The indirect cost of government expenditure is , which includes the cost of policy implementation, media publicity, special research, and other activities. In addition, when enterprises actively respond to policies related to bridge employment, the government will get additional benefits , including the economic benefits brought by the re-employment of the elderly and social praise for the government. However, when enterprises respond passively to the call of the government, the government needs to pay extra governance cost to deal with the aging problem.
The goal of the enterprise is to maximize profits. Enterprises need to spend a certain amount of manpower, material, and resources on overall planning and related training to recruit the elderly for bridge employment, which will reduce the current earnings of enterprises. However, if driven by external incentive and punishment policies, enterprises may gain additional benefits by actively promoting bridge employment. Assume that the probability of enterprises actively responding to the government’s call to promote bridge employment is , and the probability of passive participation is , . Assume that the profit earned by the enterprise in the process of operation is . is the indirect benefits obtained by enterprises actively responding to relevant government policies, such as economic benefits and social reputation brought by bridge employees. is the cost consumed by the enterprise to actively implement the bridge employment policy, such as employee training expenses. When enterprises take passive measures, they will be fined by the government.
According to the above assumptions, in order to maximize their interests, both parties of the game evolve through different strategy combinations to achieve the optimal state. Table 1 shows the descriptions of each parameter used in our game, and Table 2 displays the payoff matrix for different strategy combinations.
3.3. Model Establishment
According to the payment matrix in Table 2, the expected returns of active government regulation at a moment are:
The expected returns of passive regulation are:
Therefore, the average expected returns of local government can be denoted by:
The replicated dynamic equation of the local government can be expressed as:
Accordingly, the expected returns of the enterprise’s active participation , the expected returns of the enterprise’s passive participation , the average expected returns of the enterprise , and the replicated dynamic equation can be expressed as follows:
4. Results
4.1. Static Equilibrium Analysis
4.1.1. Static Equilibrium Analysis of Local Government
We can obtain three equilibrium values , , and from .
Proposition 1.
The local government can reach a stable state at any value ofif .
Proof of Proposition 1.
When , then at any value of . □
Proposition 1 only indicates that the local government has reached a stable state but not necessarily an ESS.
Proposition 2.
The local government can reach a stable state at if .
Proposition 3.
The local government can reach a stable state at if .
Proof of Propositions 2 and 3.
When , we can obtain and from . We take the derivative concerning , where :
There can be two scenarios:
- (1)
- If , we can have , and , then is the stable point.
- (2)
- If , we can have , and , then is the stable point.
Both Proposition 2 and Proposition 3 show that the probability of the government choosing the active strategy is related to the enterprises’ behavior and the size of the static game equilibrium value. □
4.1.2. Static Equilibrium Analysis of Enterprises
If we set , we can also obtain three equilibrium values , , and .
Proposition 4.
Enterprises can reach a stable state at any value of if .
Proof of Proposition 4.
When , then at any value of . □
Proposition 4 indicates that the enterprise can reach a stable state at any value of , but this is not necessarily an ESS.
Proposition 5.
Enterprises can reach a stable state at if (i) , or (ii) and .
Proposition 6.
Enterprises can reach a stable state at if (i) , or (ii) and .
Proof of Propositions 5 and 6.
If , we can obtain and from . The derivative of can be expressed as
The value of the derivative is discussed as follows:
- (1)
- If , we can have , then is the stable point.
- (2)
- If , we can have , then is the stable point.
- (3)
- If , there are two scenarios to discuss:
- (i)
- if , then , , is the stable point.
- (ii)
- if , then , , is the stable point.
According to Propositions 5 and 6, we can learn that there are two ways to encourage enterprises to choose an active strategy. The first way is to make the indirect benefits of the enterprise exceed the costs, but this is uncontrollable. The second way is to increase the direct cost to the government or the fines on the enterprise. Increasing the direct cost paid by the government helps to supervise the behavior of enterprises and facilitate the relevant training from the perspective of incentives while increasing the fines imposed by the government on enterprises urges enterprises to choose active strategies from the perspective of punishment. □
4.1.3. Static Equilibrium Analysis of the System
From the static game analysis above, it can be concluded that the evolution strategies of local governments and enterprises are different under different initial conditions. Since equilibrium analysis under other conditions is relatively simple, this section only discusses the evolutionary equilibrium of the system in the case of .
Proposition 7.
There are five equilibrium points in the system of replicating dynamic equations:
- (1)
- The system always has four fixed equilibrium points, namely , , , and .
- (2)
- If and , the system has another equilibrium point , where , .
Proof of Proposition 7.
If we set 0 and at the same time, we can obtain these five equilibrium points. □
Proposition 8.
The replication dynamic equations have no asymptotic stability at the five local equilibrium points, and there is no evolutionary stability strategy for the system.
Proof of Proposition 8.
According to the idea of Friedman [55], when the determinant of the Jacobian matrix corresponding to the differential equation system composed of and is positive and the trace sign is negative, the system will achieve local stability. The Jacobian , determinant , and trace of the system are expressed as follows:
The stability analysis results of each equilibrium point are shown in Table 3.
Table 3 shows that the system does not have stability at (0,0), (0,1), (1,0), and (1,1). The stability at the equilibrium point is discussed below, the corresponding Jacobian matrix is:
The characteristic roots of the above Jacobian matrix are a pair of purely imaginary roots , and thus, the differential equation system only has a stable limit cycle but no asymptotic stability. The strategy selection trajectory of the government and enterprises is a closed-loop curve around the point , which is close to the equilibrium point but cannot be automatically stabilized to this point. □
4.1.4. Simulation Analysis
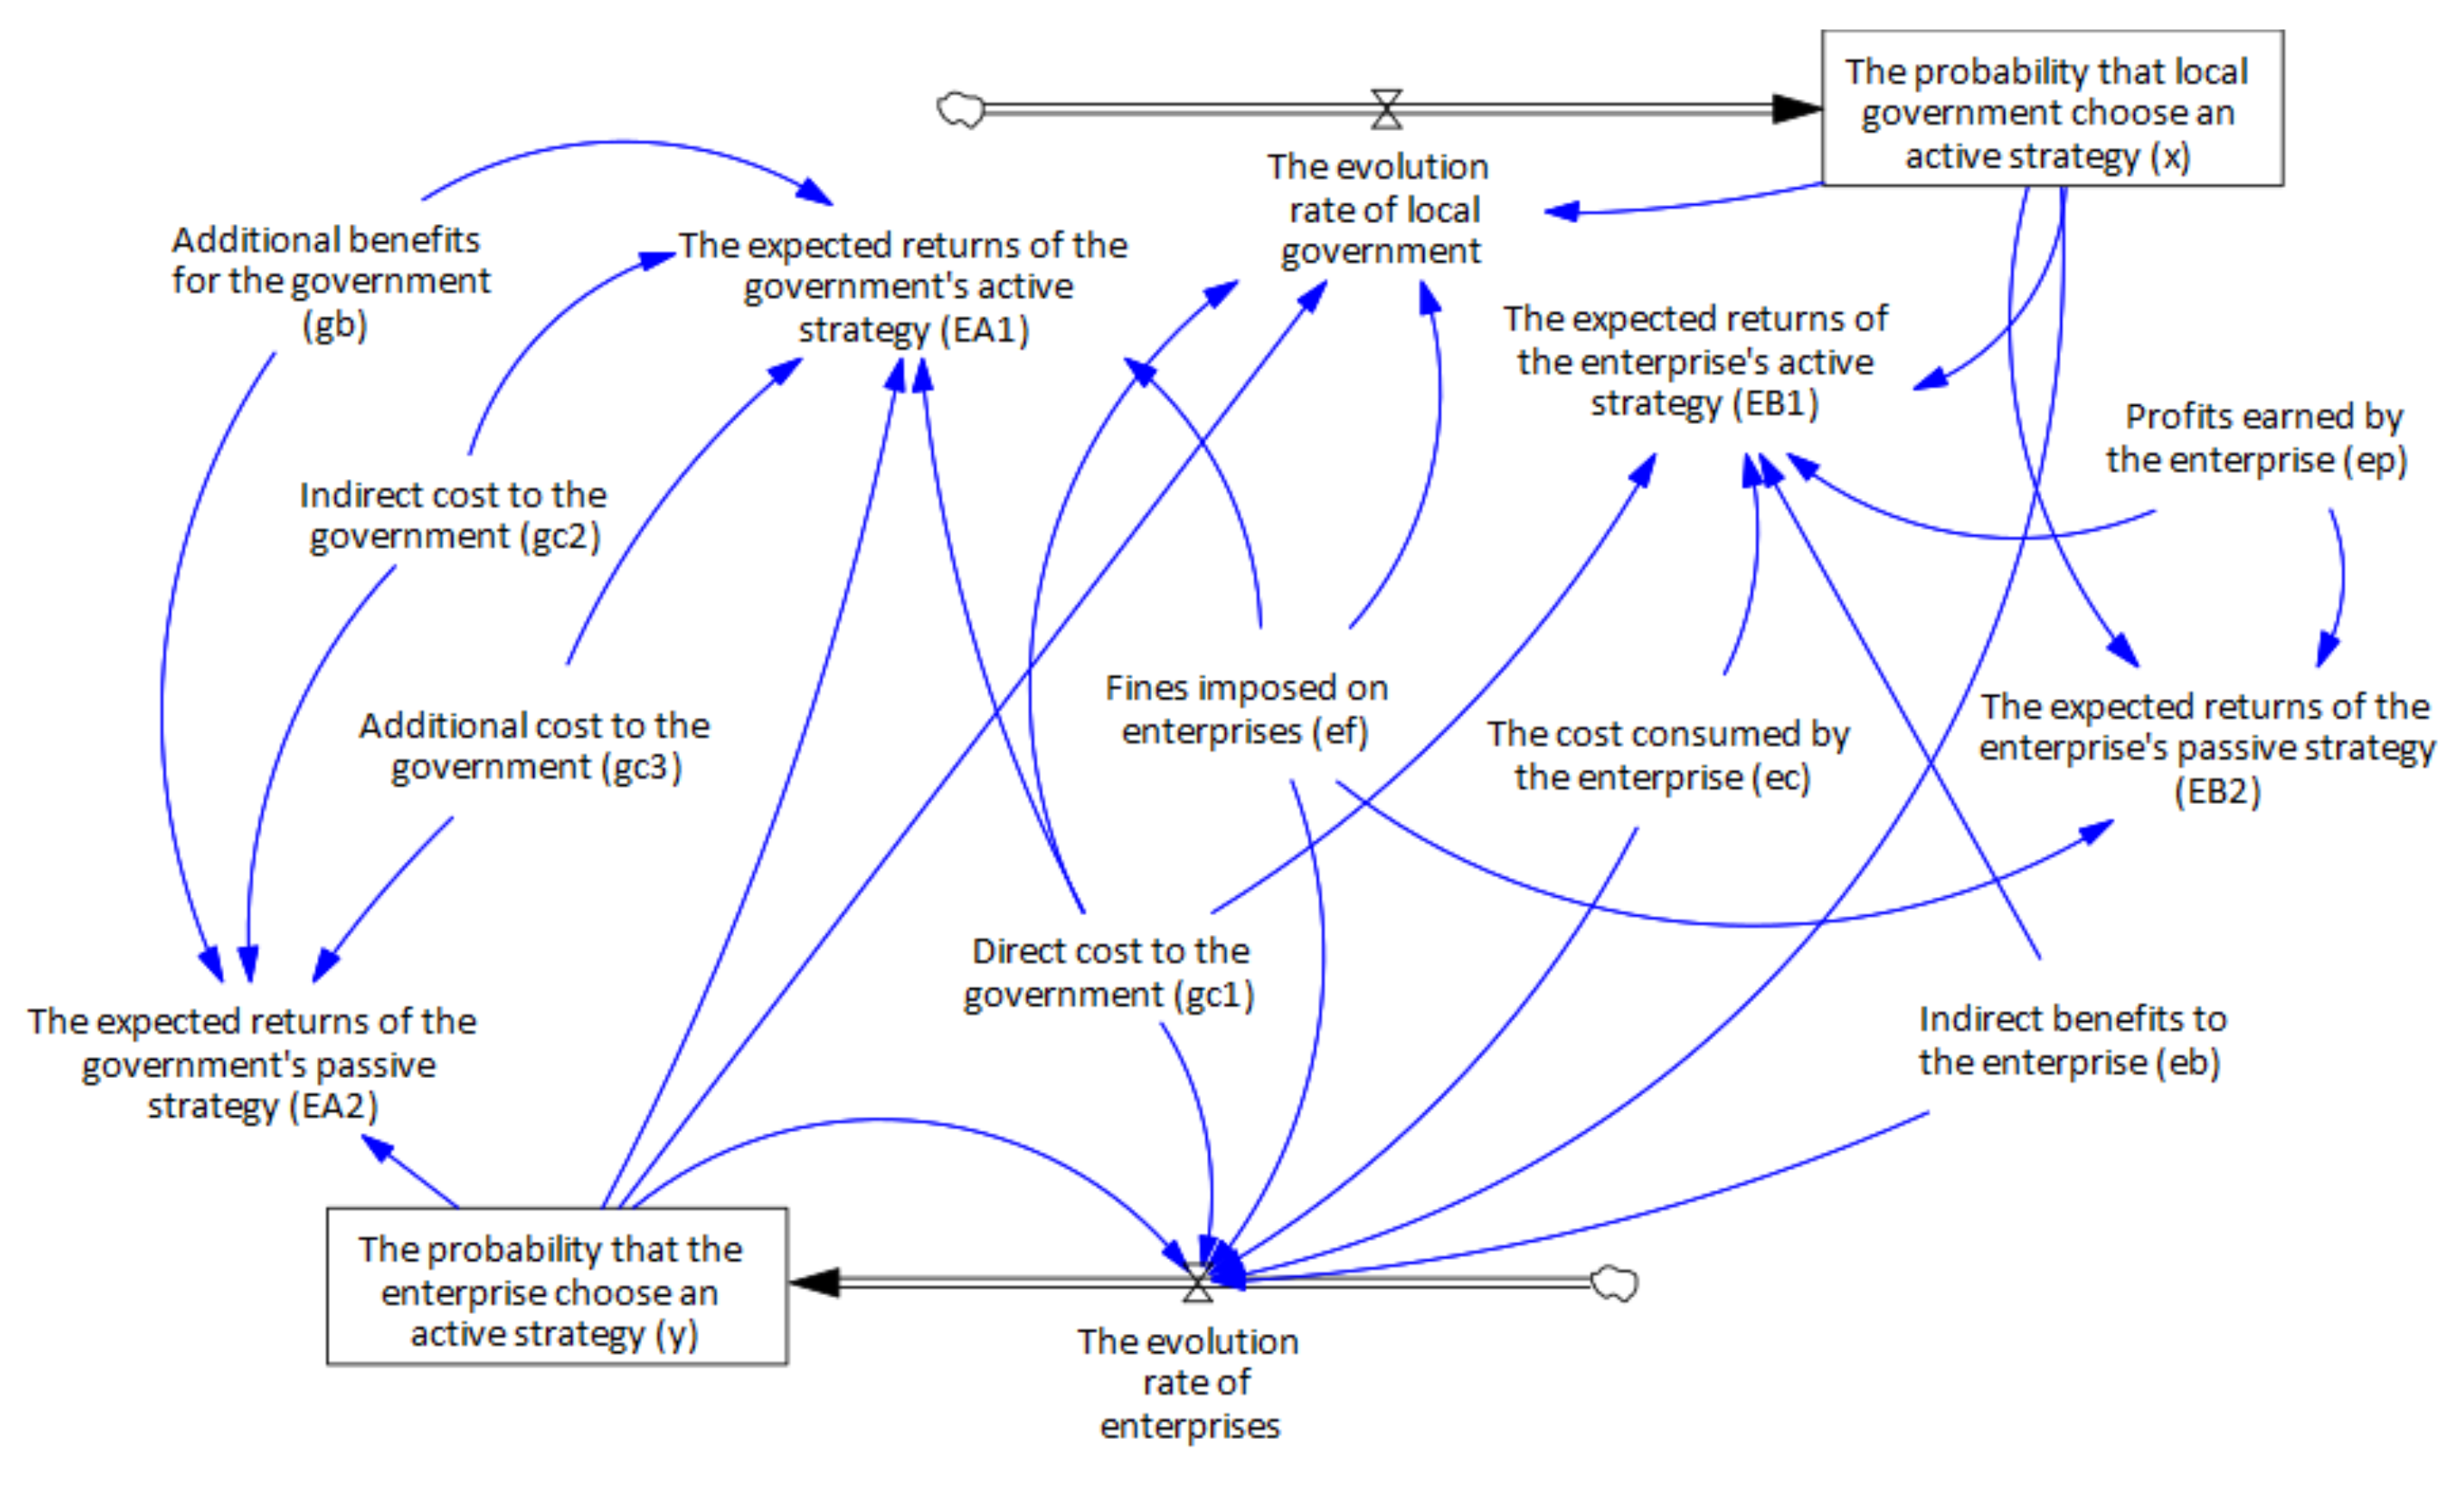
This section applies the method of system dynamics to simulate the evolution process of the system and uses simulation software Vensim to visualize the stability of the system. The parameter values of the model must meet the conditions ; we set the initial values of the following parameters: , , , , , and . As shown in Figure 1, the system dynamics model contains two horizontal variables, two rate variables, four intermediate variables, and eight external variables.
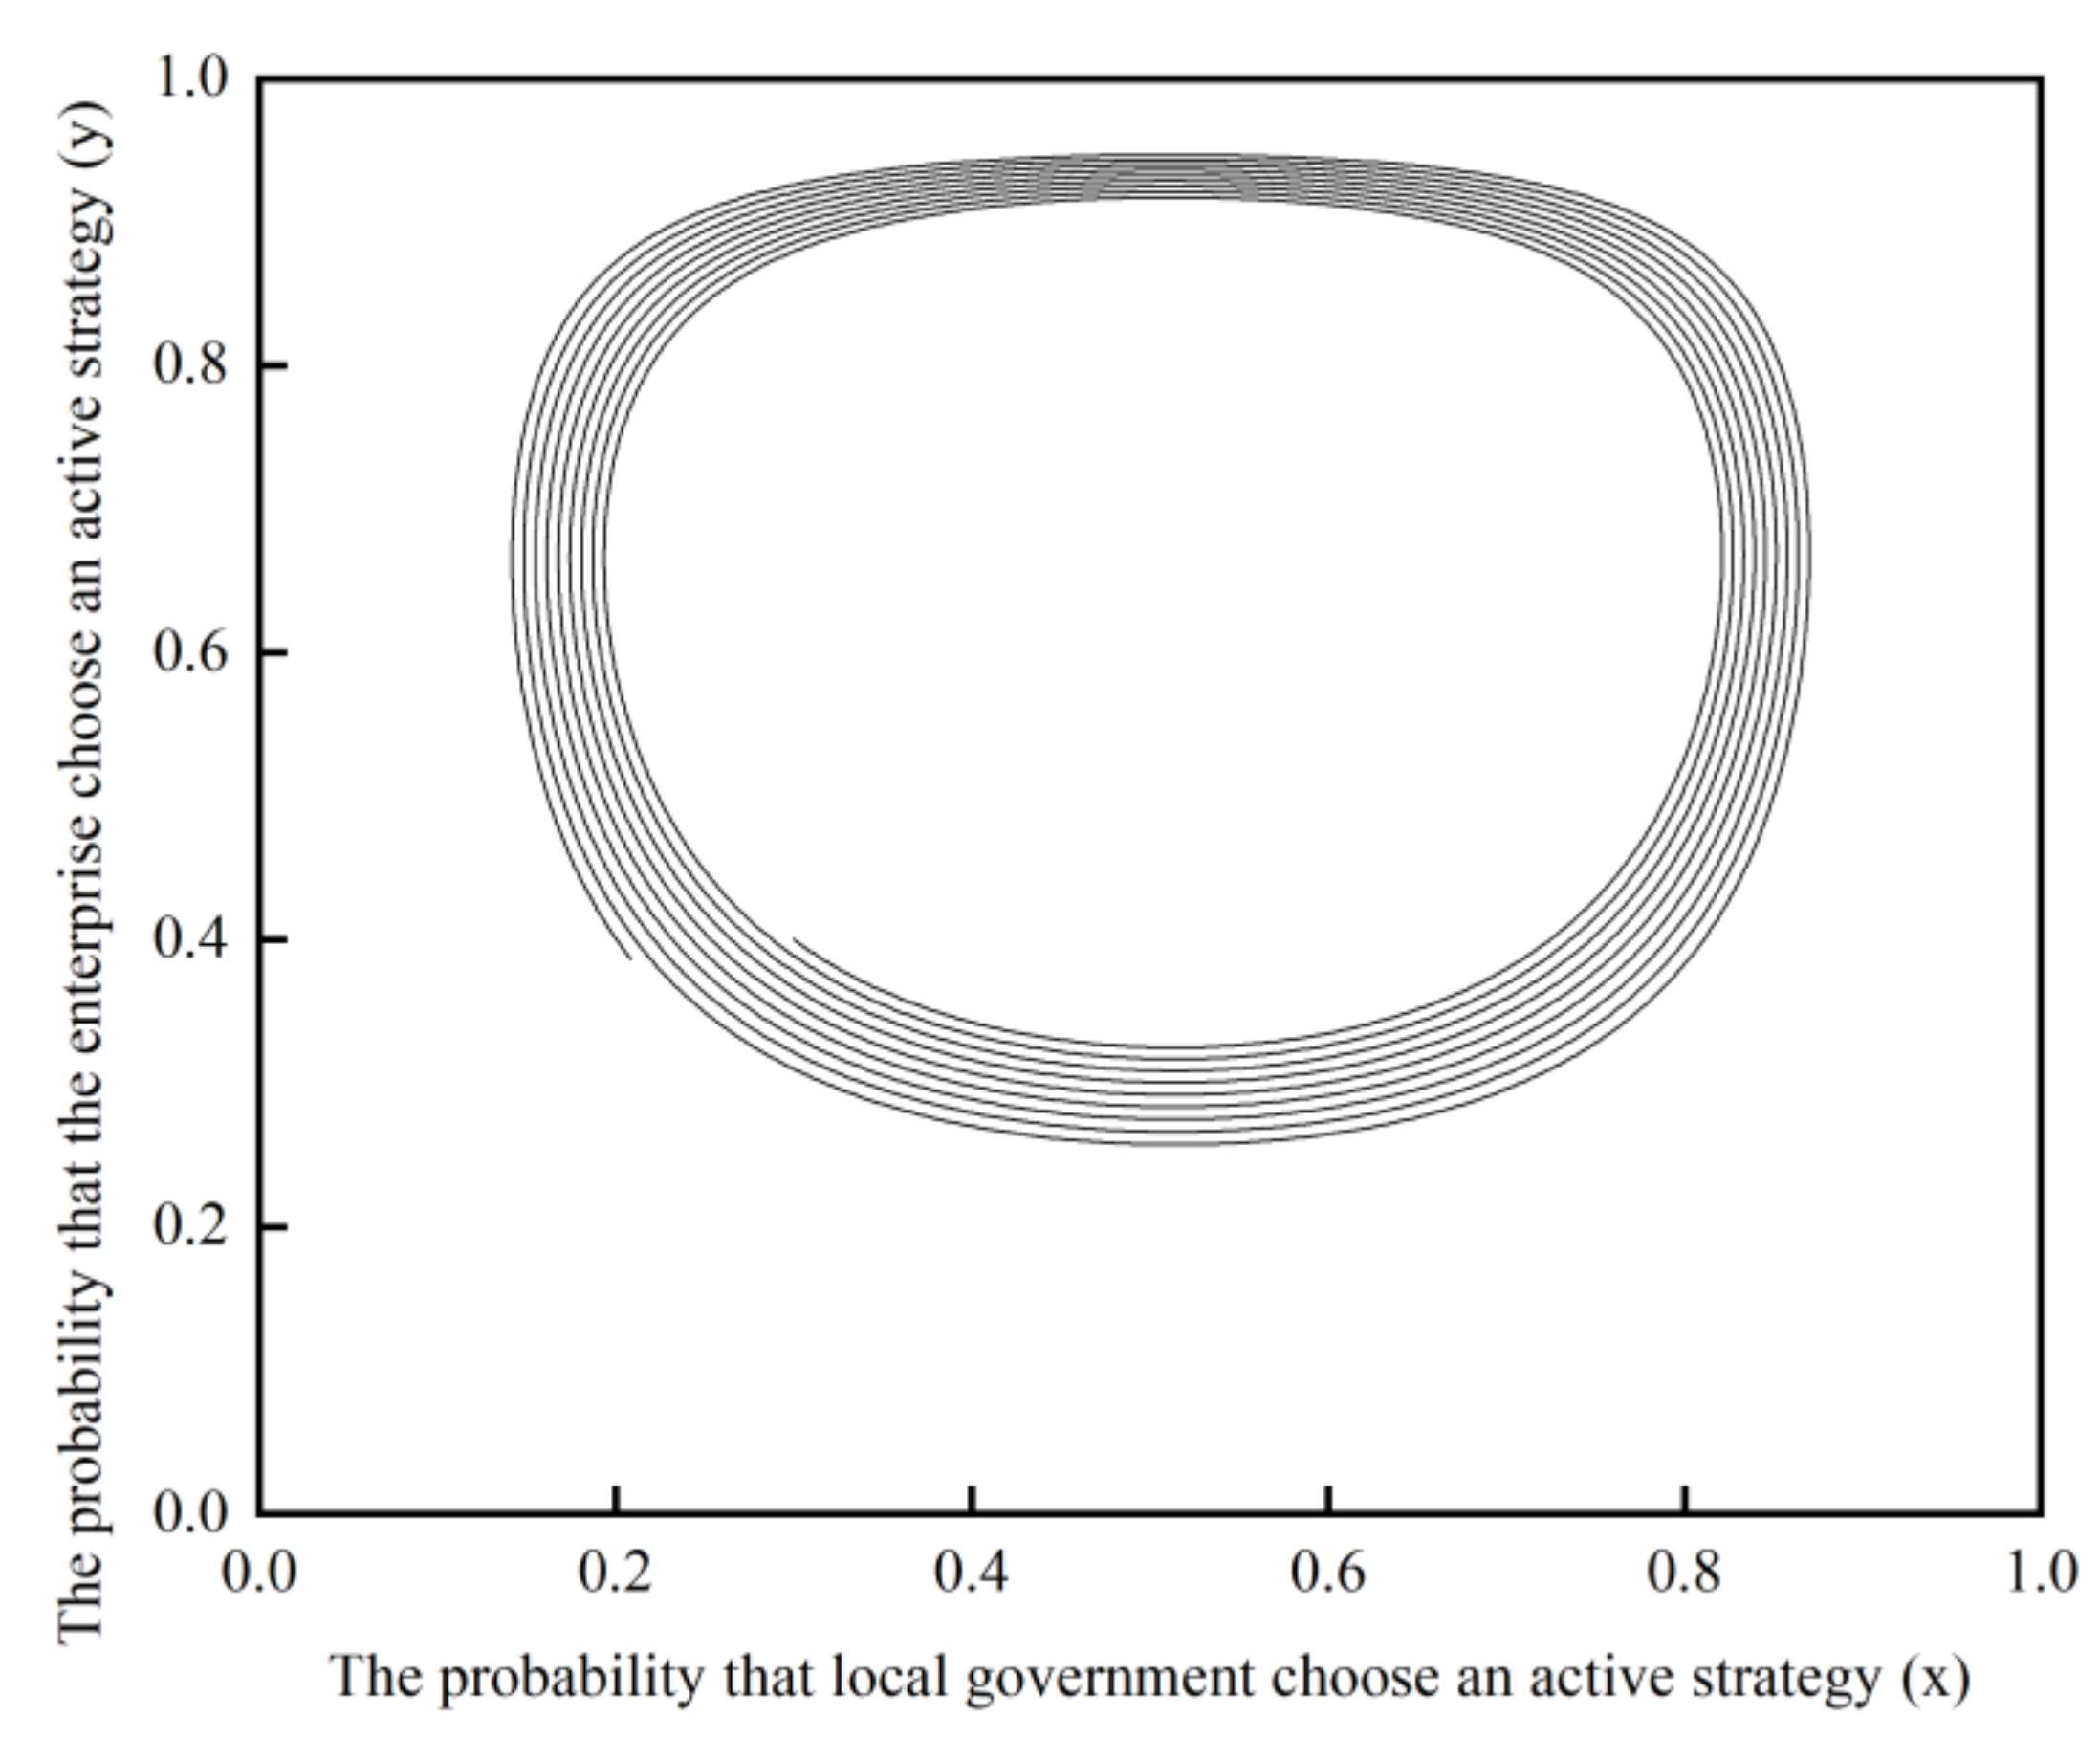
It can be seen from Figure 2 that the game evolution trend of the whole system is a closed rail line ring with periodic movement around the stable center. The game between the local government and enterprises shows an unstable periodic behavior pattern, and the game behavior is not easy to control, indicating that the local government and enterprises are constantly changing their strategies in the process of promoting the bridge employment of the elderly.
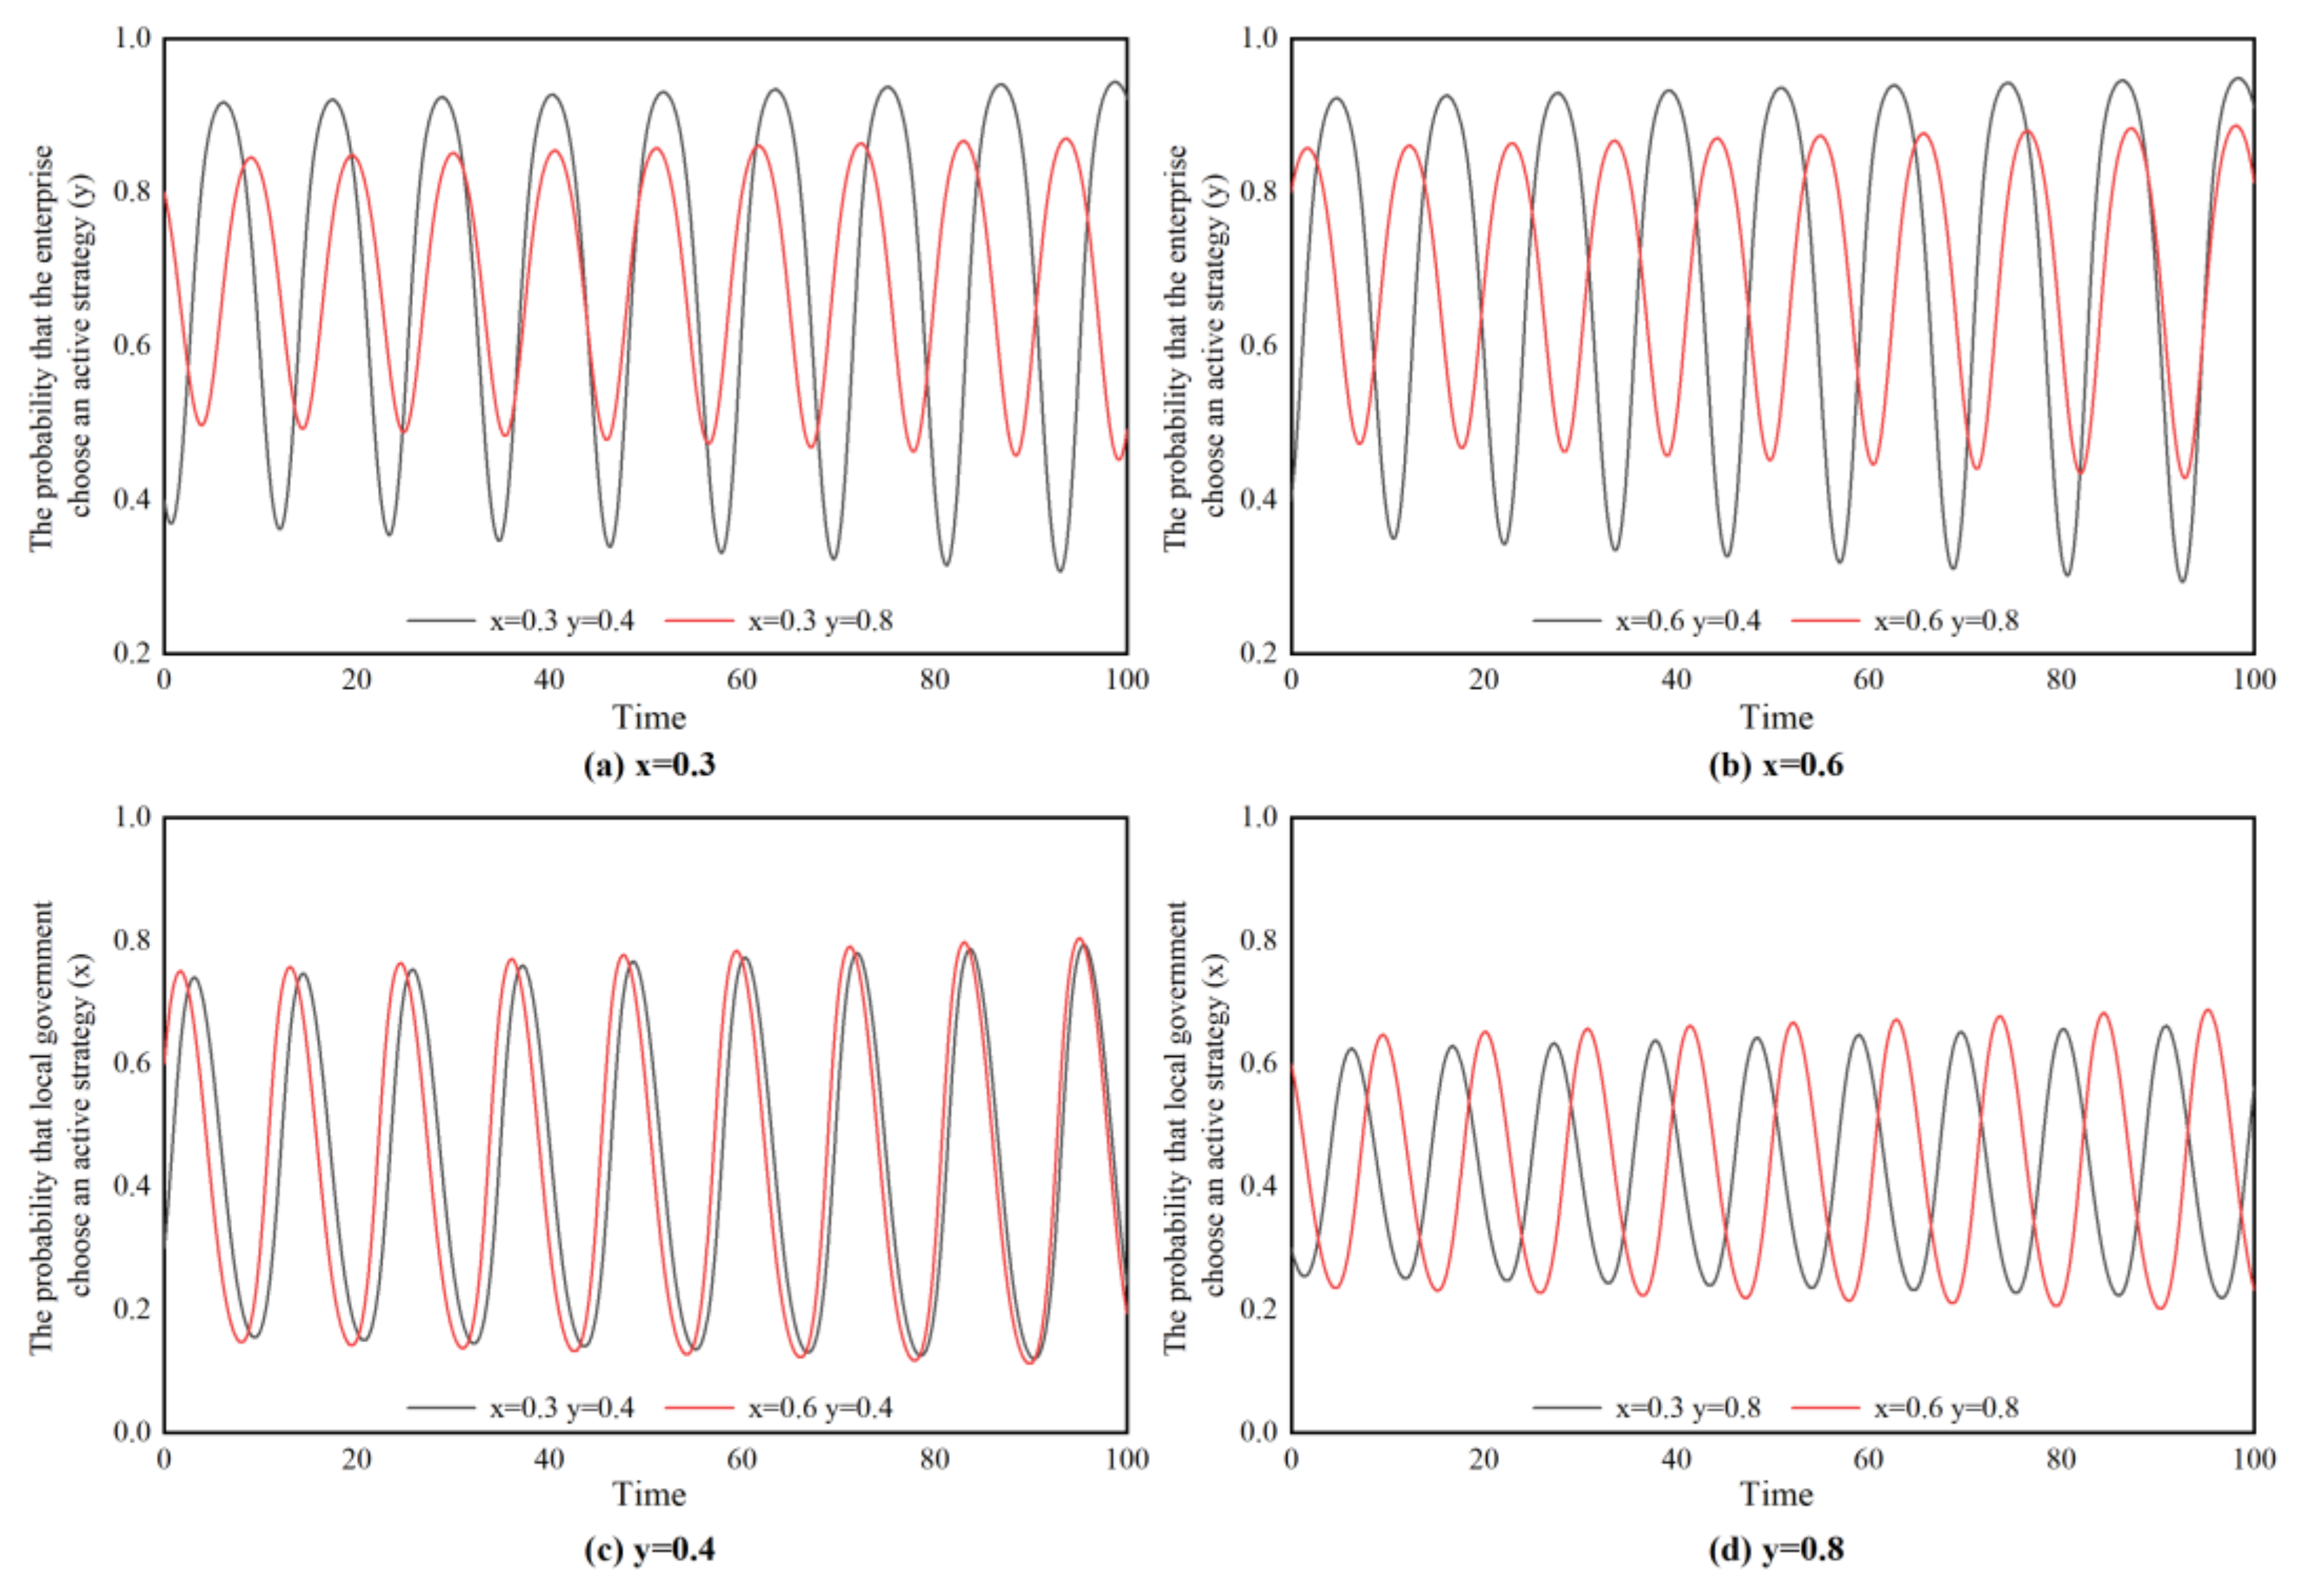
If and , assuming that the initial probability of the government actively implementing the bridge employment policy , the initial probabilities of enterprises actively responding to the policy are and , respectively. The evolution path of enterprises is shown in Figure 3a. Assuming that the initial probability of the government adopting active strategy , the evolution curve of enterprises is shown in Figure 3b. On the whole, with a given value and different initial values of , the evolution path of the enterprise shows periodic fluctuation over time without an evolutionary equilibrium point. In terms of the fluctuation amplitude of the curve, the difference between Figure 3a,b is not so obvious.
If and , assuming that is the initial probability of the enterprise actively responding to the government’s bridge employment policy, and the initial probability of the local government actively implementing the bridge employment policy is and , respectively. The evolution curves of the government’s choice of active strategy are shown in Figure 3c. Assuming that is the initial probability of the enterprise adopting an active strategy, the evolution curves of the government are shown in Figure 3d. On the whole, with a given value and different initial values of , the evolution path of the government fluctuates periodically over time, and there is no evolutionary equilibrium point. In terms of the fluctuation amplitude of the evolutionary path, there are obvious differences between Figure 3c,d. The fluctuation amplitude of Figure 3c is larger, and the two curves are close to overlapping at the end.
Figure 3 shows that the evolution paths of the game between the government and enterprises vary from different initial values of and , but both of them show periodic fluctuations over time and cannot be stable. Specifically, when one party’s strategy changes, the other will adjust its strategy to the other’s strategy.
According to the system dynamics model in Figure 1, the simulation process of Vensim software indicates that the values of , , , and will cause significant changes in the evolution path of and . Therefore, we vary the values of these four parameters to simulate the changes in government and enterprise behaviors under different circumstances. Under the constraints of and , we set the initial values and .
Figure 4 presents the impact of the size of the direct costs paid by the government on the evolutionary paths of both parties. It indicates that the increase in will accelerate the evolution rate of both parties and reduce the probability of them choosing active strategies, but it cannot promote them to reach a stable state.
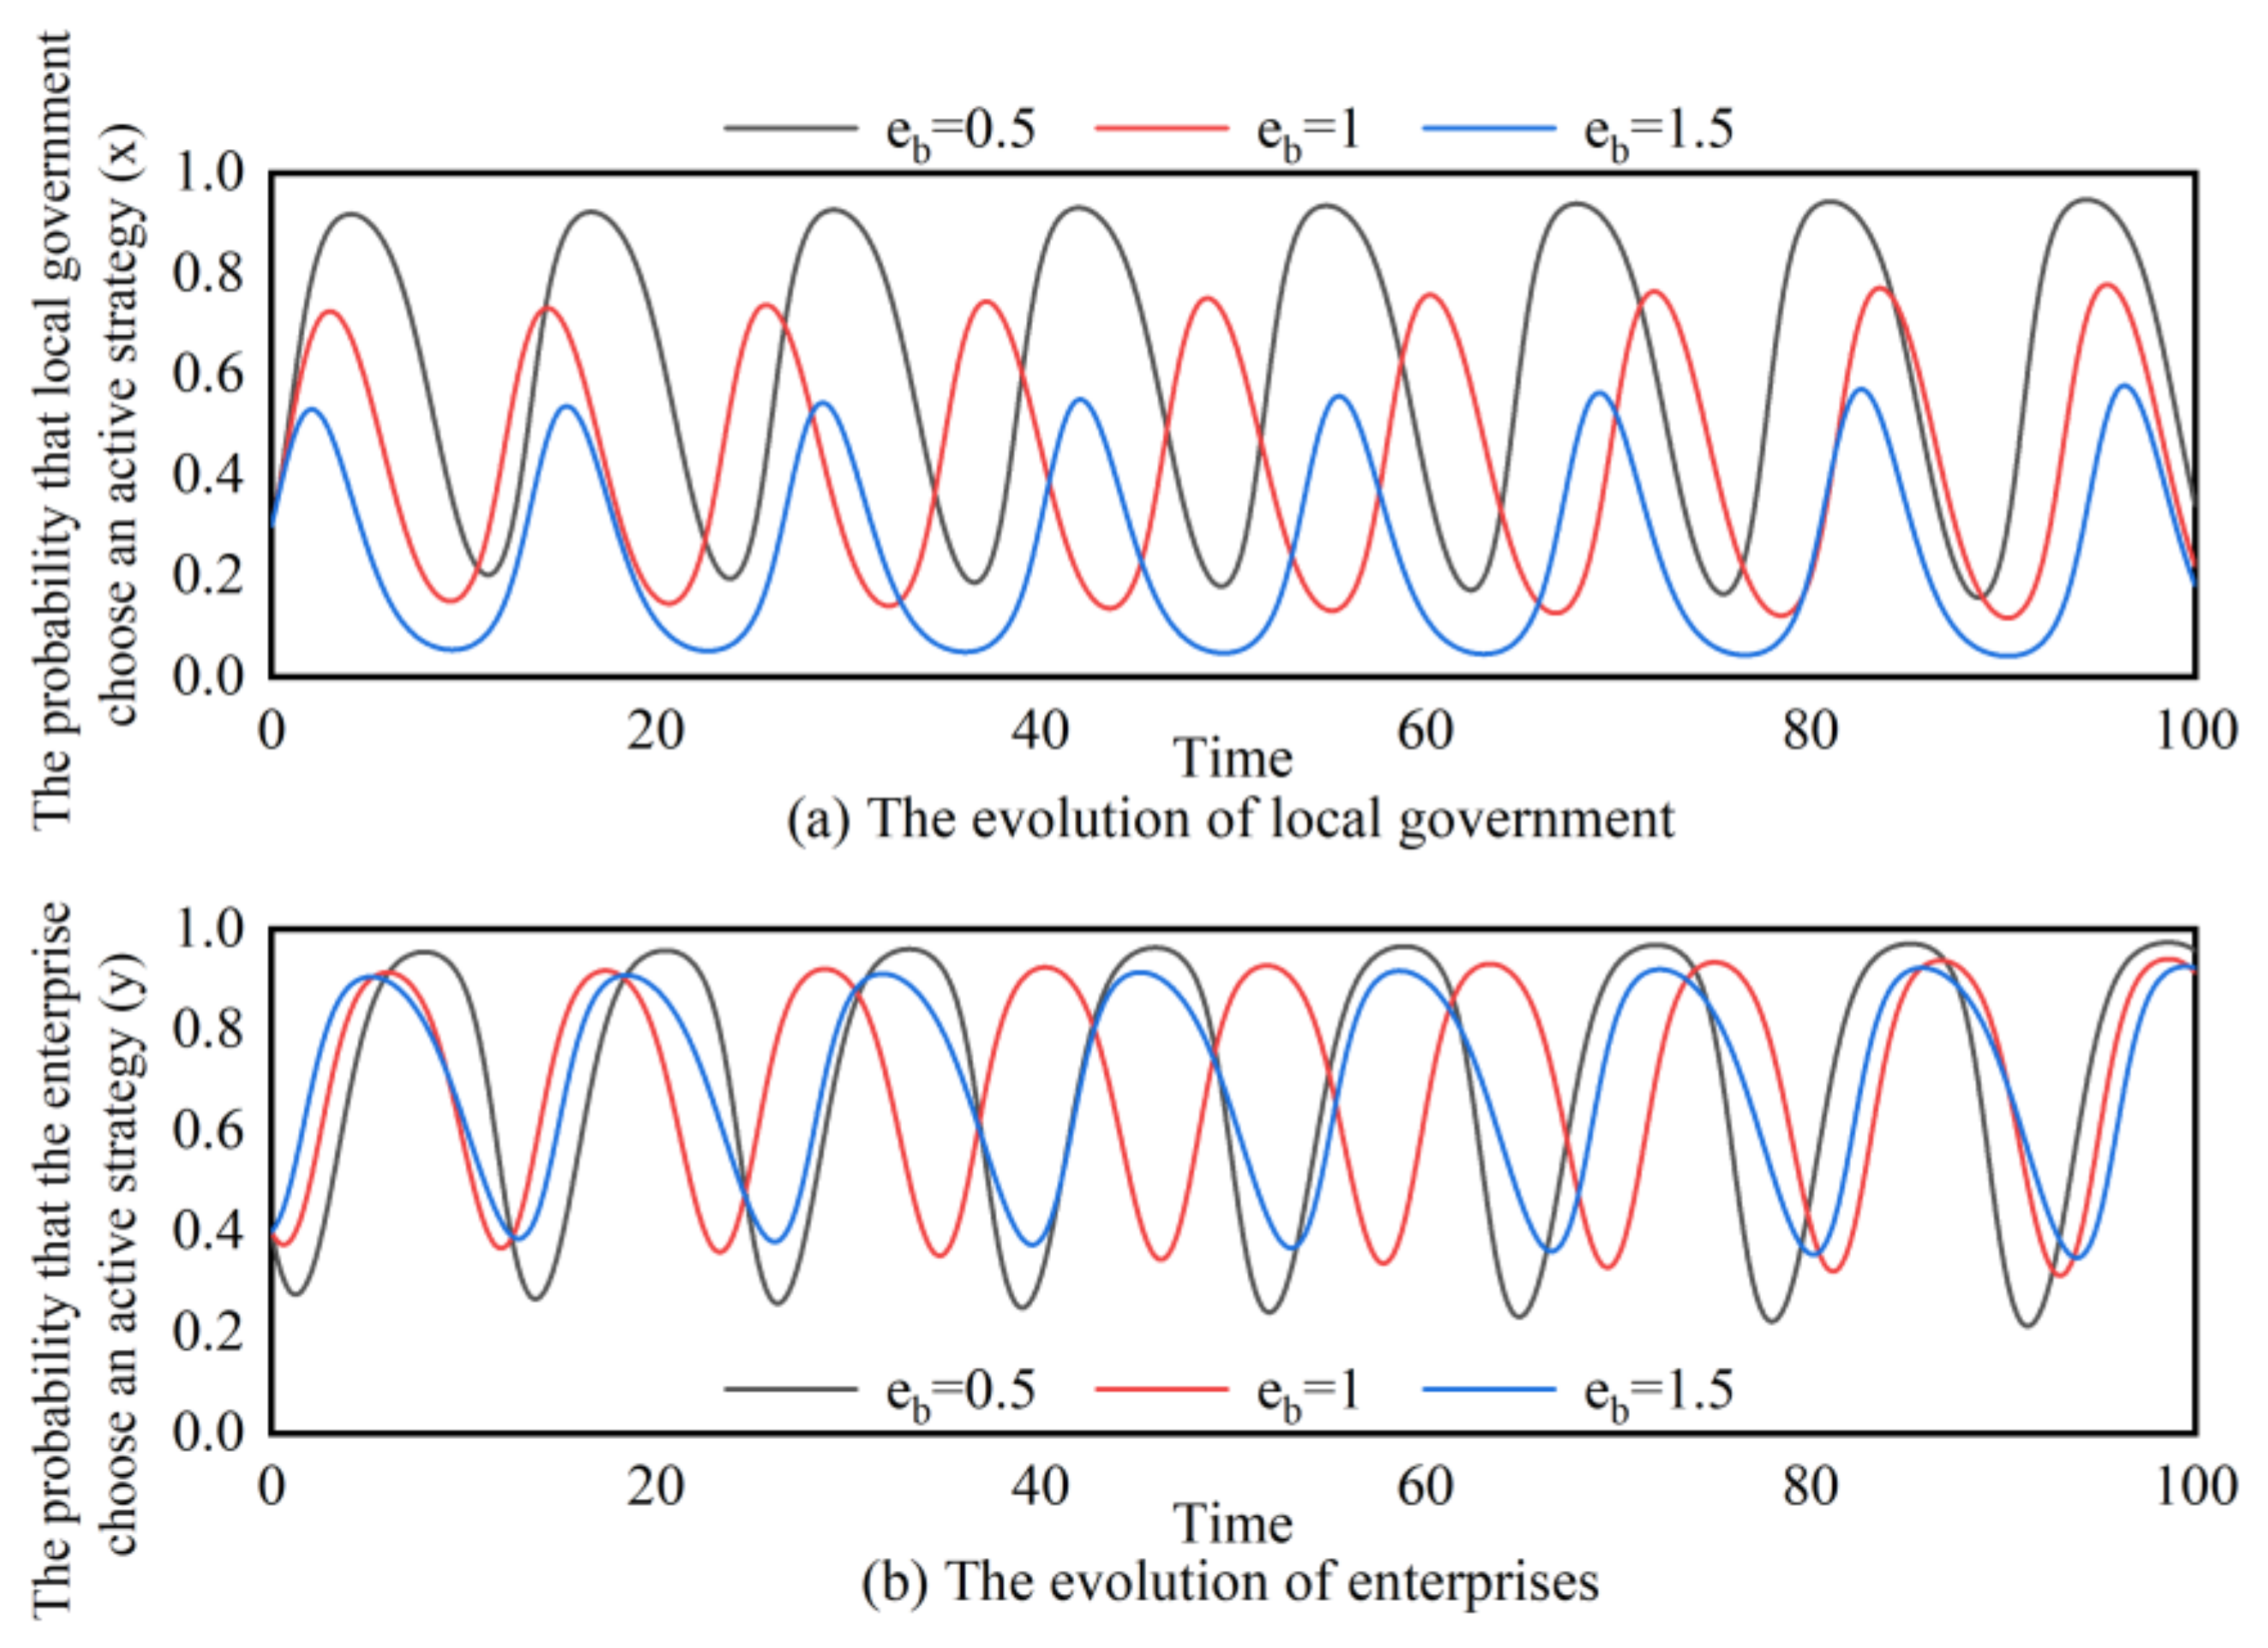
Figure 5 depicts the impact of the size of indirect benefits on the evolutionary path. For the government, an increase in makes the amplitude of the curve smaller, and the peaks and troughs move down. It means that the evolution rate of the government will rise with the increase in , and the probability of the government choosing the active strategy will decrease significantly. As for enterprises, the increase in shortens the wavelength of the curve, but the changes in amplitude, crest, and trough are relatively insignificant. This means that the increase in will help accelerate the evolution of the enterprise.
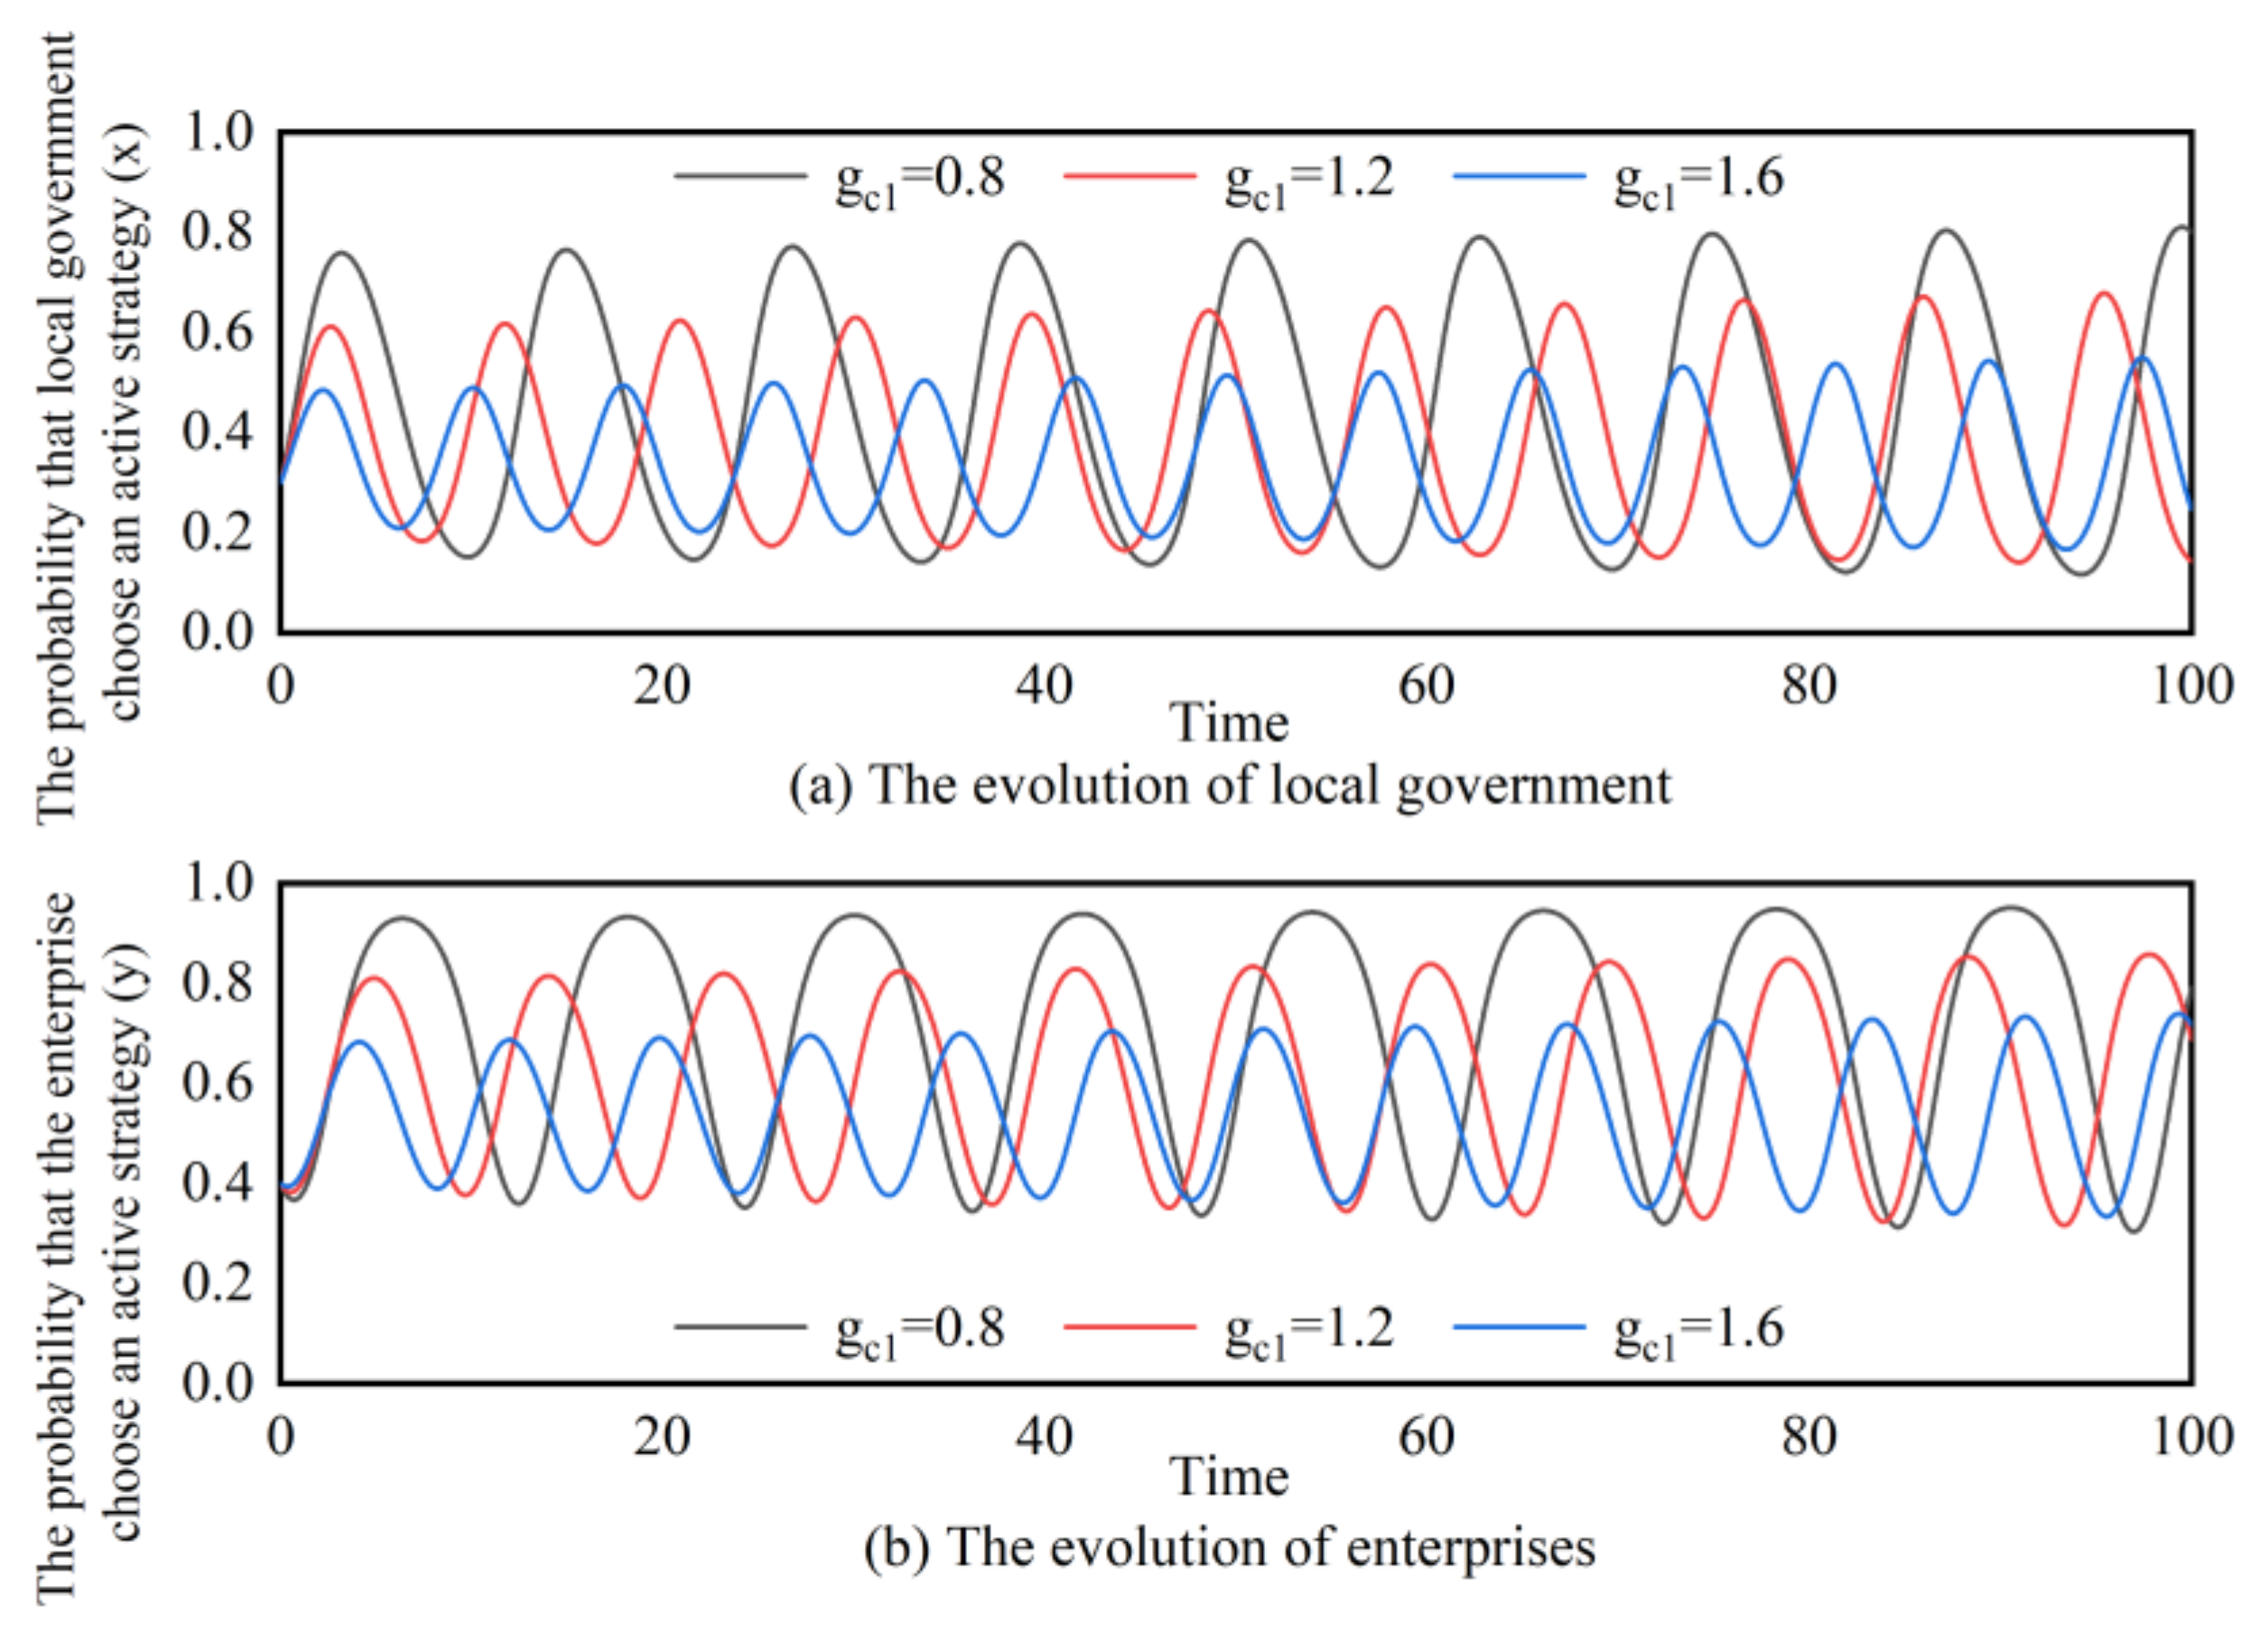
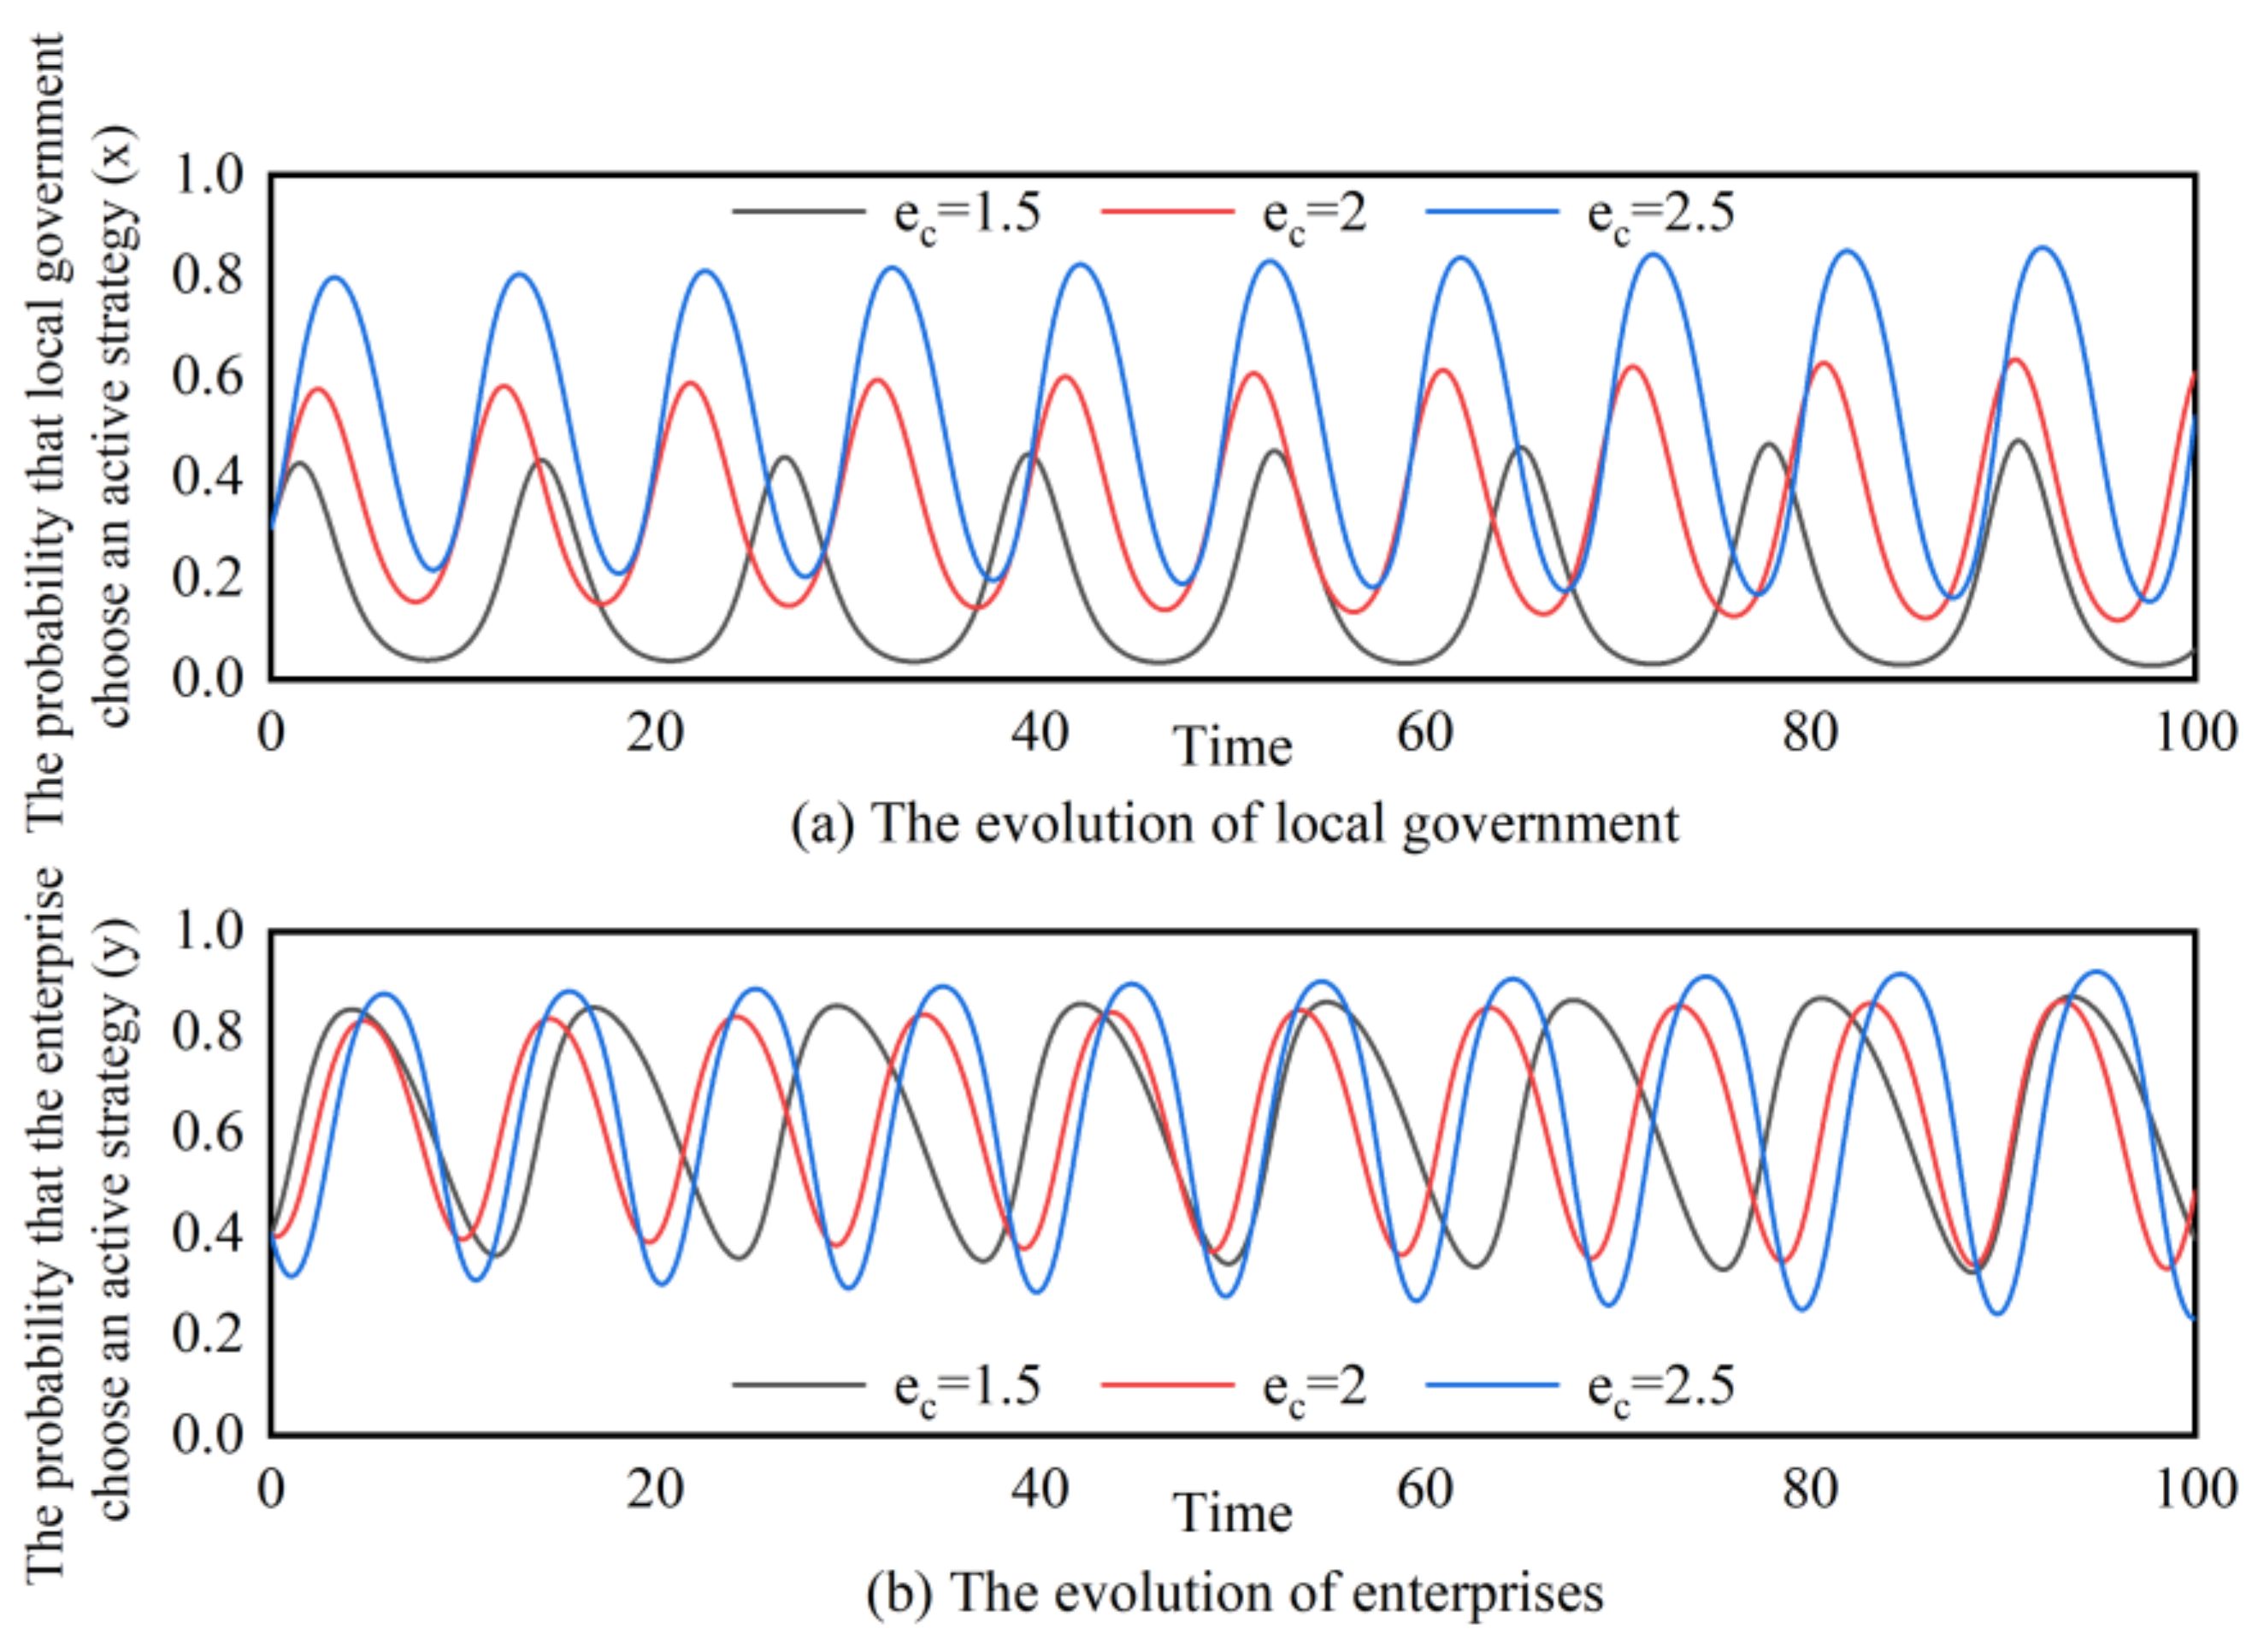
Figure 6 shows the impact of the cost paid by the enterprise on the evolutionary path. In Figure 6a, there are obvious differences among the three evolutionary paths. With the increase in , the wavelength becomes shorter, but the amplitude increases, and both the peak and trough of the wave increase significantly. It shows that with the increase in enterprise cost, the probability of the government choosing an active strategy increases. In Figure 6b, the peaks, troughs, and amplitudes of the three curves do not differ significantly, but the wavelength becomes slightly shorter as increases. It means that as the cost to an enterprise increases, the rate of evolution of the enterprise also increases slightly.
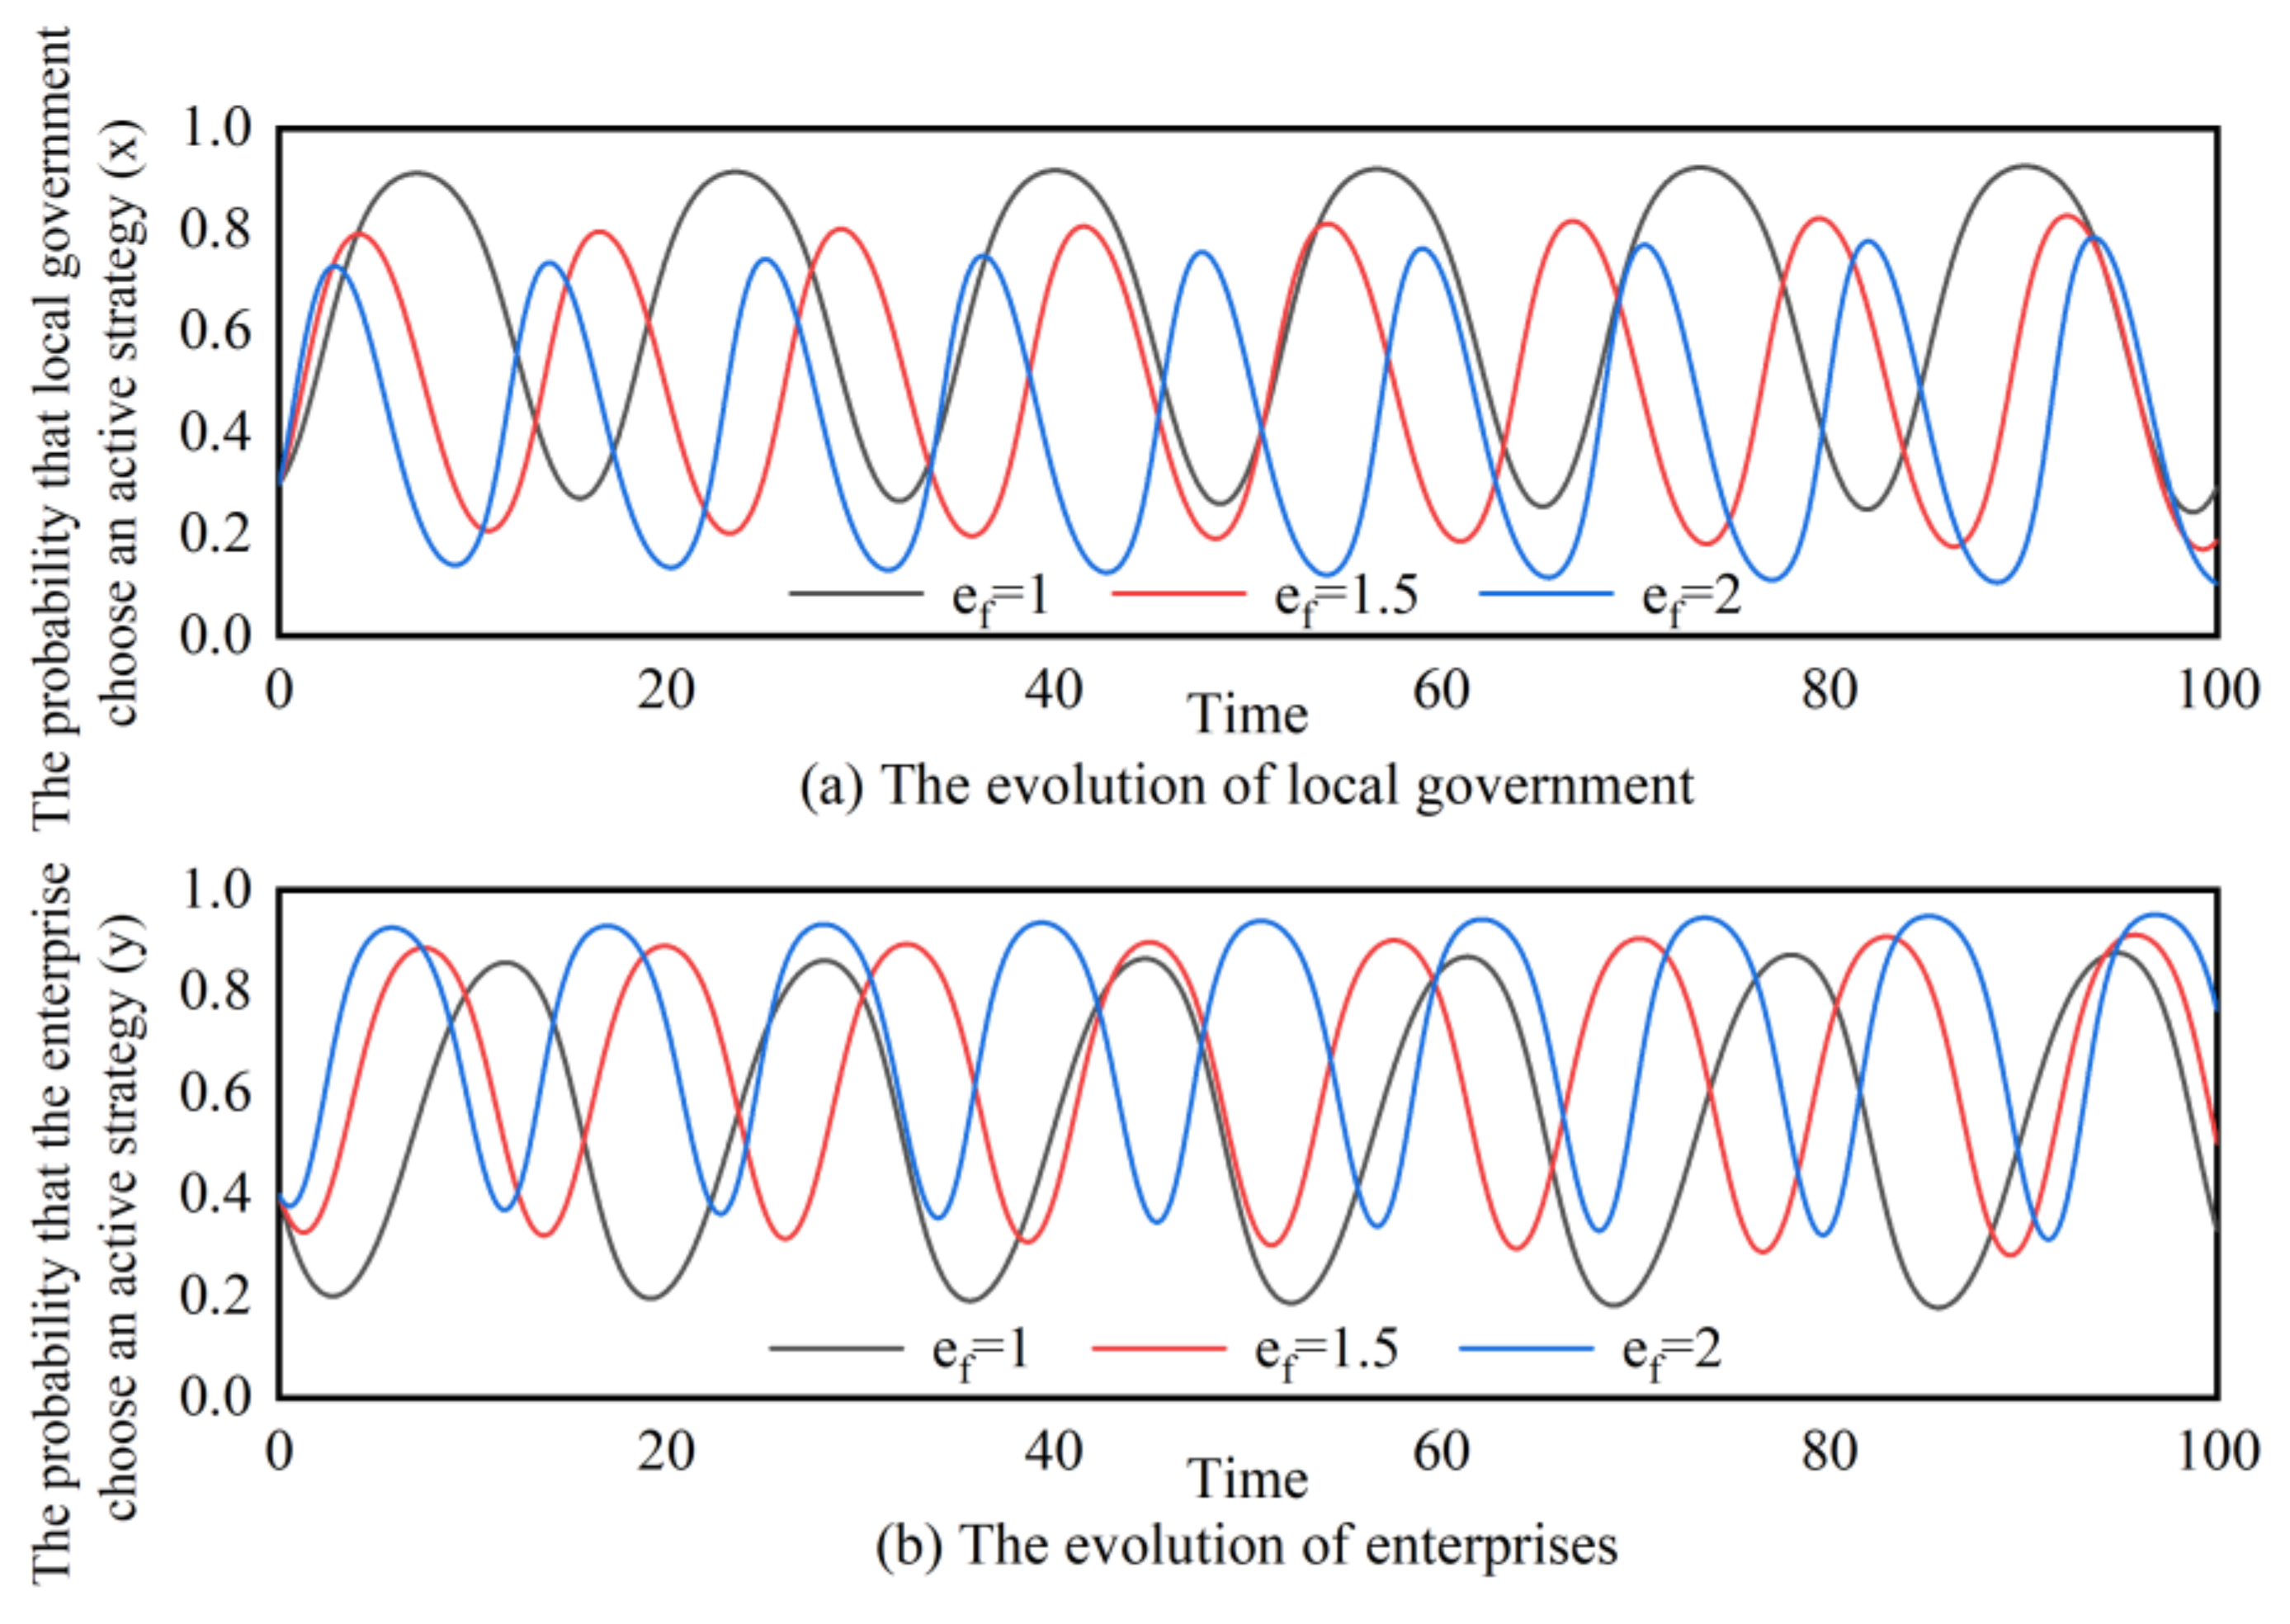
Figure 7 illustrates the impact of fines on the evolutionary path. In Figure 7a, as increases, the wavelength of the curve becomes smaller, and the curve moves downward as a whole. It shows that the increase in fines will increase the rate of government evolution and reduce the probability of active strategy. In Figure 7b, the wavelength of the curve becomes shorter with the increase in , but contrary to Figure 7a, the curve moves up as a whole. It implies that the increase in fines will accelerate the evolution of enterprises and increase the probability of enterprises choosing active strategies.
In general, with an increase in the government’s direct cost (), the enterprise’s indirect income () and fines () will accelerate the evolution rate of the government, while with a decrease in the government’s direct cost, the increase in the enterprise’s indirect income, the increase in the enterprise’s cost (), and the decrease in fines will increase the probability of the government choosing an active strategy. Concerning enterprises, the increase in the government’s direct cost, enterprise’s indirect profit, and enterprise’s cost and fines will improve the rate of the enterprise’s evolution, while the decrease in the government’s direct cost and the increase in fines will improve the probability of enterprises choosing active strategies. Although these four parameters affect the evolution path of both parties to some extent, these changes cannot make the system reach a stable and optimal state.
4.2. Dynamic Equilibrium Analysis
In the context of active aging, the above static evolutionary game assumes that the direct incentive cost of government expenditure and the fines received by enterprises are fixed. However, with such a static incentive and punishment system, the system cannot achieve stability. As a matter of fact, local governments will set different incentives based on relevant standards and the actual conditions of enterprises within their jurisdiction, and enterprises will adopt different behaviors to promote bridge employment. Therefore, the incentive behaviors of local governments and the fines received by enterprises should not be fixed. This section intends to analyze the behaviors of governments and enterprises from the perspective of dynamic incentives and punishments.
4.2.1. Dynamic Incentive Mechanism
When enterprises are unwilling to provide jobs for the elderly and choose passive strategies, the local government needs to take corresponding incentive measures to encourage enterprises to respond to the active aging strategy. Therefore, the direct cost of incentives paid by local governments should be directly proportional to the probability of enterprises adopting passive strategies, which can be expressed as , where is the incentive intensity of local governments to enterprises. Based on this dynamic incentive mechanism, the evolutionary game payment matrix of local governments and enterprises is shown in Table 4.
Substituting into Equations (5) and (9) to obtain the new replicated dynamic equations and based on the dynamic incentive mechanism,
Proposition 9.
The equilibrium points in the dynamic incentive system are as follows:
- (1)
- The dynamic incentive system always has three fixed equilibrium points, namely , , and .
- (2)
- For , are equilibrium points of the dynamic incentive system.
- (2)
- If and , the dynamic incentive system has another equilibrium point , where , .
Proof of Proposition 9.
If we set and at the same time, we can obtain the above equilibrium points. □
Proposition 10.
The replication dynamic equation under the dynamic incentive mechanism has asymptotic stability at the point , and the system has an evolutionary stability strategy.
Proof of Proposition 10.
Accordingly, the Jacobian matrix can be expressed as:
From the magnitude of and , we know that and are saddle points and and are unstable points. Substituting into the Jacobian matrix,
The characteristic roots are , where . Therefore, the characteristic roots of are a pair of characteristic complex roots with negative real parts, and the system has asymptotic stability. is the evolutionary stable point of the system, and the evolutionary trajectory is a spiral curve tending to the equilibrium point .
Proposition 10 shows that under a dynamic incentive mechanism, the system has an evolutionary stability strategy. The probability that the government will implement an active policy is , and the probability that the enterprises will choose an active strategy is . □
Proposition 11.
The probability of government and enterprises choosing active strategies has the following relationship with relevant parameters:
- (i)
- , , and .
- (ii)
- and .
Proposition 11 (i) shows that the probability of local government implementing an active bridge employment policy is positively correlated with enterprises’ cost, negatively correlated with enterprises’ indirect income, and negatively correlated with government incentive intensity.
Proposition 11 (ii) shows that the probability of enterprises actively promoting bridge employment is positively correlated with the fines received by enterprises and negatively correlated with the government incentive intensity.
4.2.2. Dynamic Punishment Mechanism
If the proportion of enterprises choosing to passively implement bridge employment policies increases, the local government will reverse incentives by raising fines for violations. Therefore, we assume that the fines imposed by the local government on the enterprise are proportional to the probability of the enterprise choosing the passive strategy, then the fines under the dynamic punishment mechanism can be expressed as , where is the severity of the penalty imposed on the enterprises. Based on this dynamic punishment mechanism, the evolutionary game payment matrix of local governments and enterprises is shown in Table 5.
Substituting into Equations (5) and (9) to obtain the new replicated dynamic equations and based on the dynamic punishment mechanism,
Accordingly, we can obtain the following propositions:
Proposition 12.
There are five equilibrium points in the dynamic punishment system:
- (1)
- The system always has four fixed equilibrium points, namely , , , and .
- (2)
- If and , the system has another equilibrium point , where , .
Proof of Proposition 12.
If we set and at the same time, we can obtain the above equilibrium points. □
Proposition 13.
The replication dynamic equation under the dynamic punishment mechanism has asymptotic stability at the point , and the system has an evolutionary stability strategy.
Proof of Proposition 13.
The Jacobian matrix of the system at equilibrium point can be expressed as:
The characteristic roots are , where . In the same way as Proposition 10, the differential equation system has asymptotic stability at , which is the evolutionary stable point, and the evolutionary trajectory of the system is a spiral curve tending to the equilibrium point . □
Proposition 14.
The probability of government and enterprises choosing active strategies has the following relationship with relevant parameters:
- (i)
- , , , and .
- (ii)
- and .
Proposition 14 (i) indicates that the probability of the local government actively implementing the bridge employment policy is positively correlated with enterprises’ cost, negatively correlated with enterprises’ indirect income, negatively correlated with the government’s direct cost, and negatively correlated with punishment intensity.
Proposition 14 (ii) indicates that the probability of enterprises actively promoting bridge employment is negatively correlated with the direct cost to the government and positively correlated with the intensity of punishment.
4.2.3. Dynamic Incentive and Punishment Mechanism
Considering dynamic incentive and dynamic punishment comprehensively, we can obtain the payment matrix in Table 6.
Likewise, substituting and into Equations (5) and (9), we can obtain new replicated dynamic equations and three propositions:
Proposition 15.
There are five equilibrium points in the dynamic incentive and punishment system:
- (1)
- The system always has four fixed equilibrium points, namely , , , and .
- (2)
- If and , the system has another equilibrium point , where , .
Proposition 16.
The replication dynamic equation under dynamic incentive and punishment has asymptotic stability at the point , and the system has an evolutionary stability strategy.
Proof of Proposition 16.
The Jacobian matrix of the system at equilibrium point can be expressed as:
The characteristic roots are , where . In the same way as Proposition 10 and Proposition 13, the differential equation system has asymptotic stability at , which is the evolutionary stable point, and the evolutionary trajectory of the system is a spiral curve tending to the equilibrium point . □
Proposition 17.
The probability of government and enterprises choosing active strategies has the following relationship with relevant parameters:
- (i)
- , , and .
- (ii)
- and .
Proposition 17 (i) indicates that the probability of local government actively implementing bridge employment policy is positively correlated with enterprises’ cost, negatively correlated with enterprises’ indirect income, and negatively correlated with incentive intensity.
Proposition 17 (ii) shows that the probability of enterprises actively responding to bridge employment policies is negatively correlated with incentive intensity and positively correlated with punishment intensity.
4.2.4. Simulation Analysis
In order to visually compare the evolution paths of local government and enterprises under the four different mechanisms, we set the initial values , , , and .
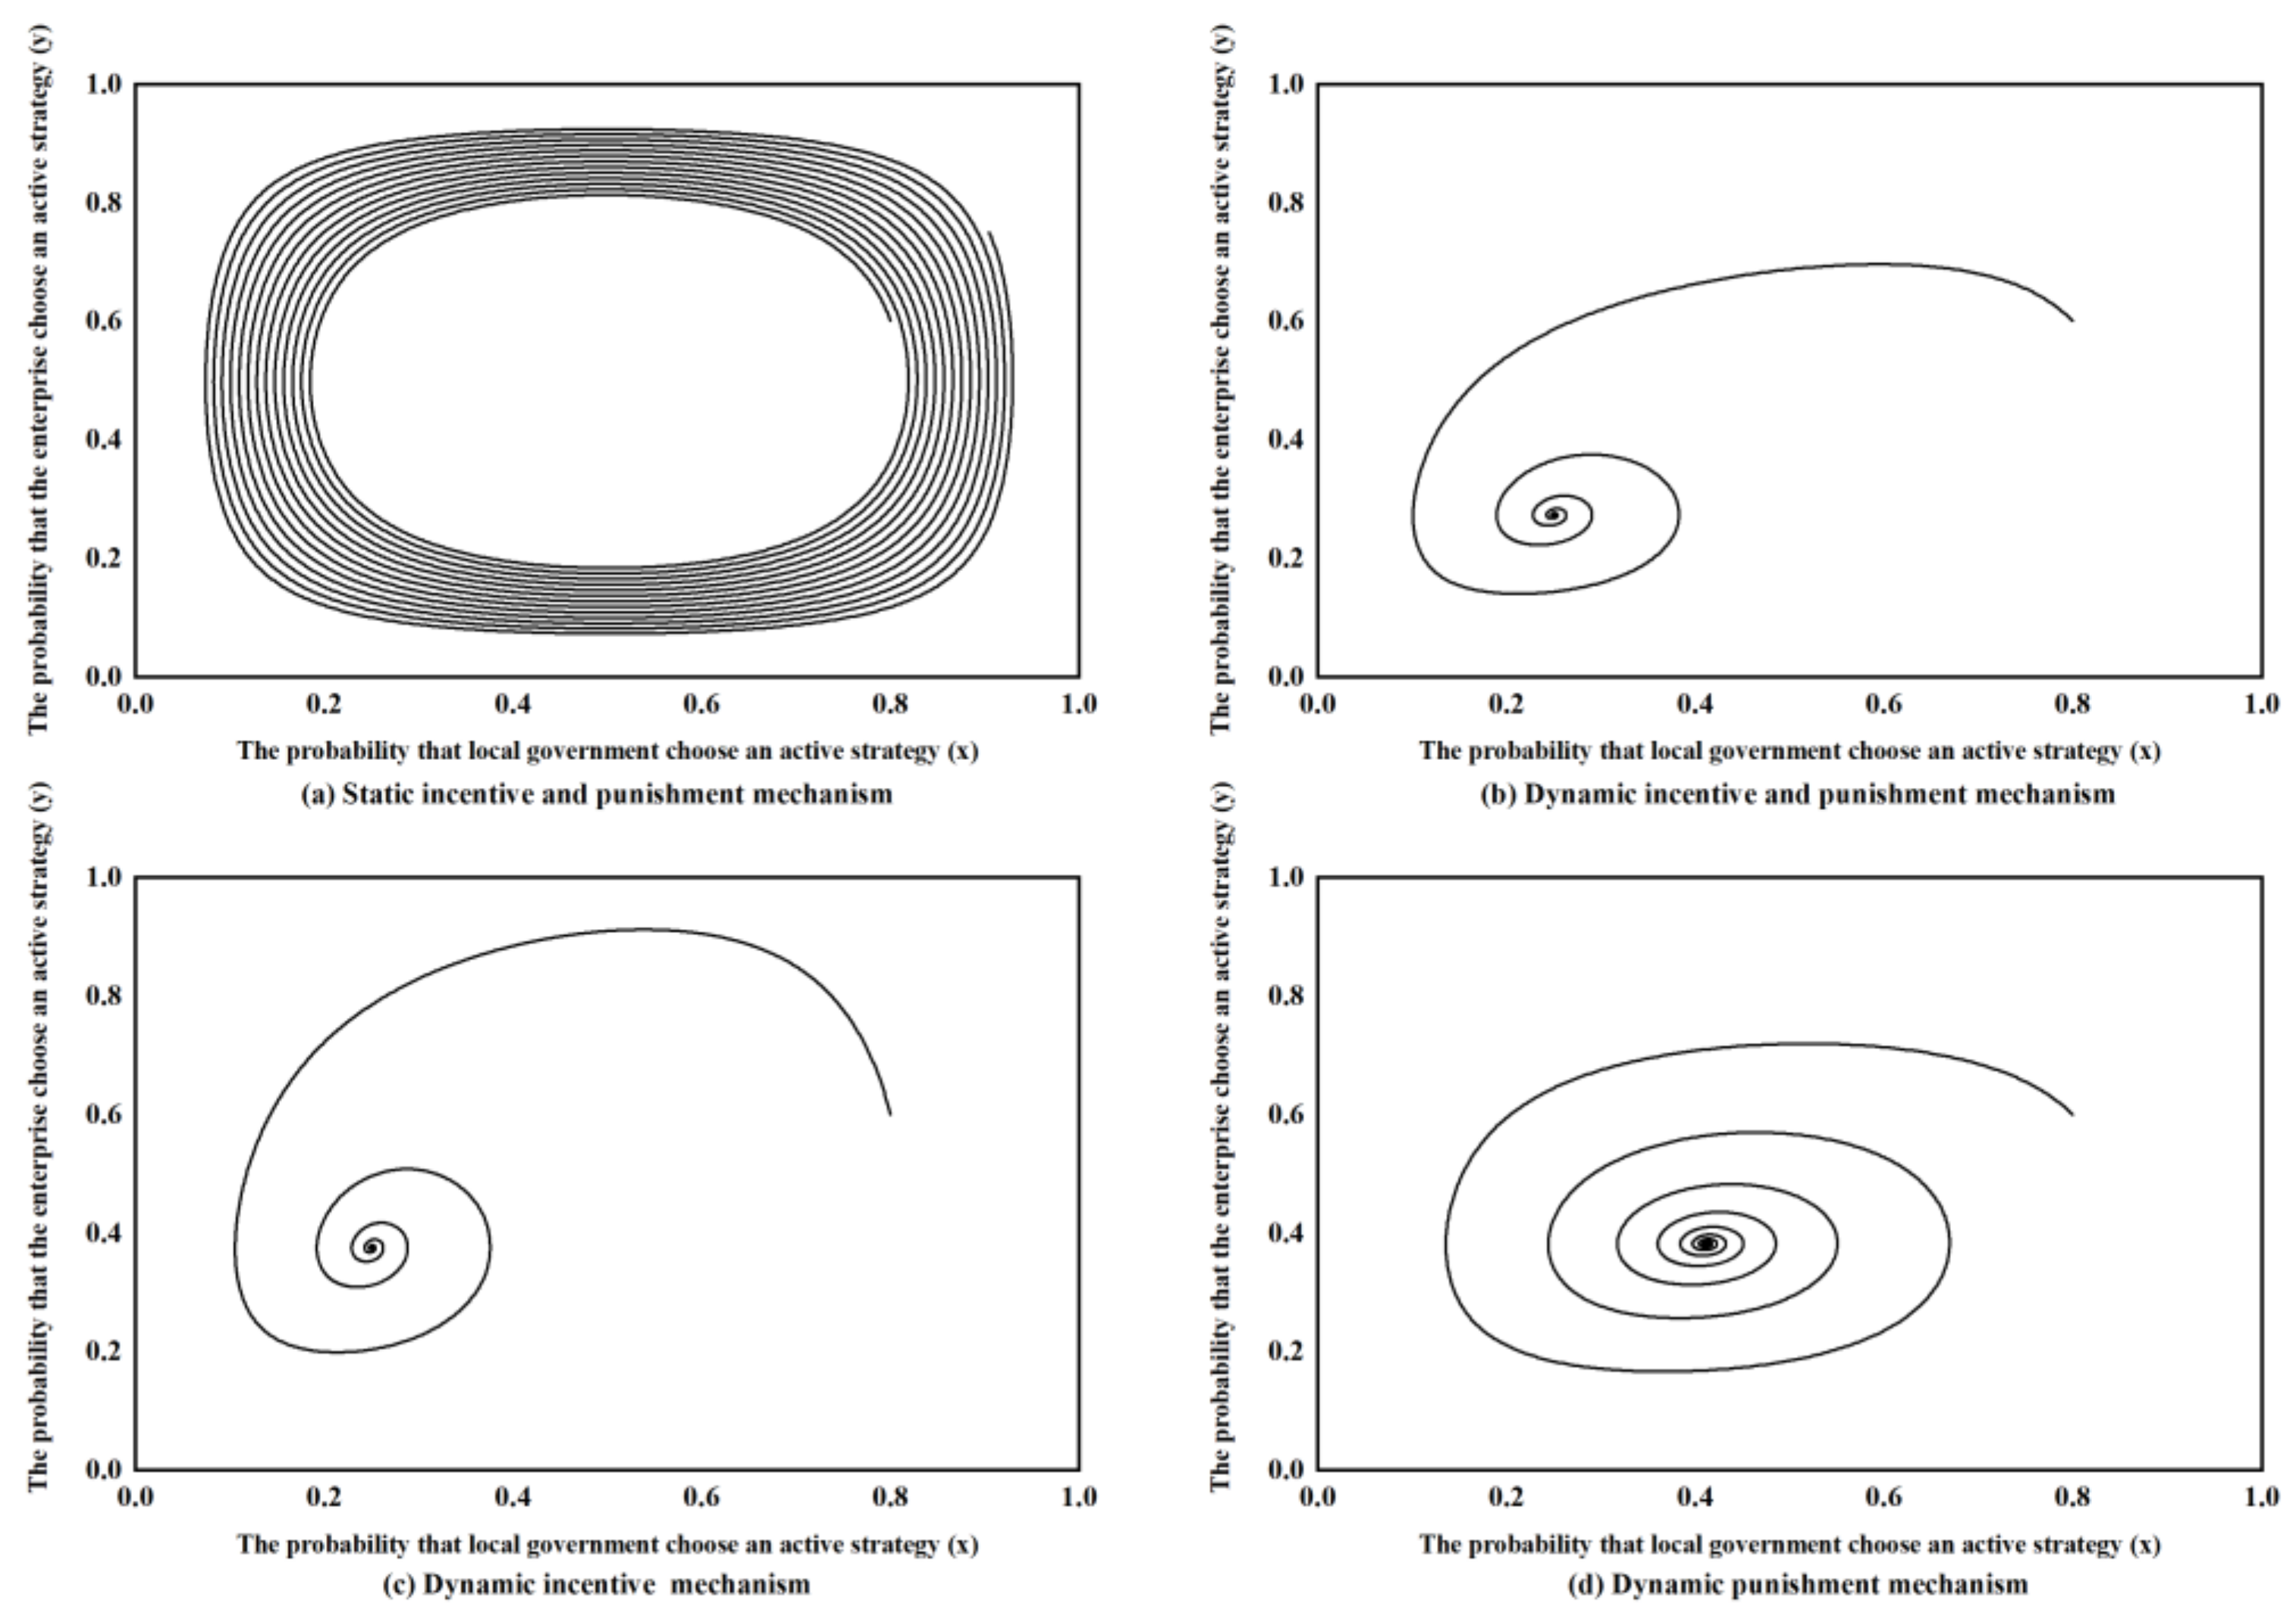
In Figure 8a, we set and . Under the mechanism of static incentive and static punishment, the game evolution process of the system is a closed track loop that moves periodically around the stability center. In Figure 8b, we set and ; the equilibrium point is . In Figure 8c, we set and ; the equilibrium point is . In Figure 8d, we set and ; the equilibrium point is . Under these three dynamic incentive and dynamic punishment mechanisms, the evolutionary trajectory of the active strategy adopted by the government and the active strategy adopted by the enterprise shows a spiral convergence trend and finally stabilizes at respective equilibrium points.
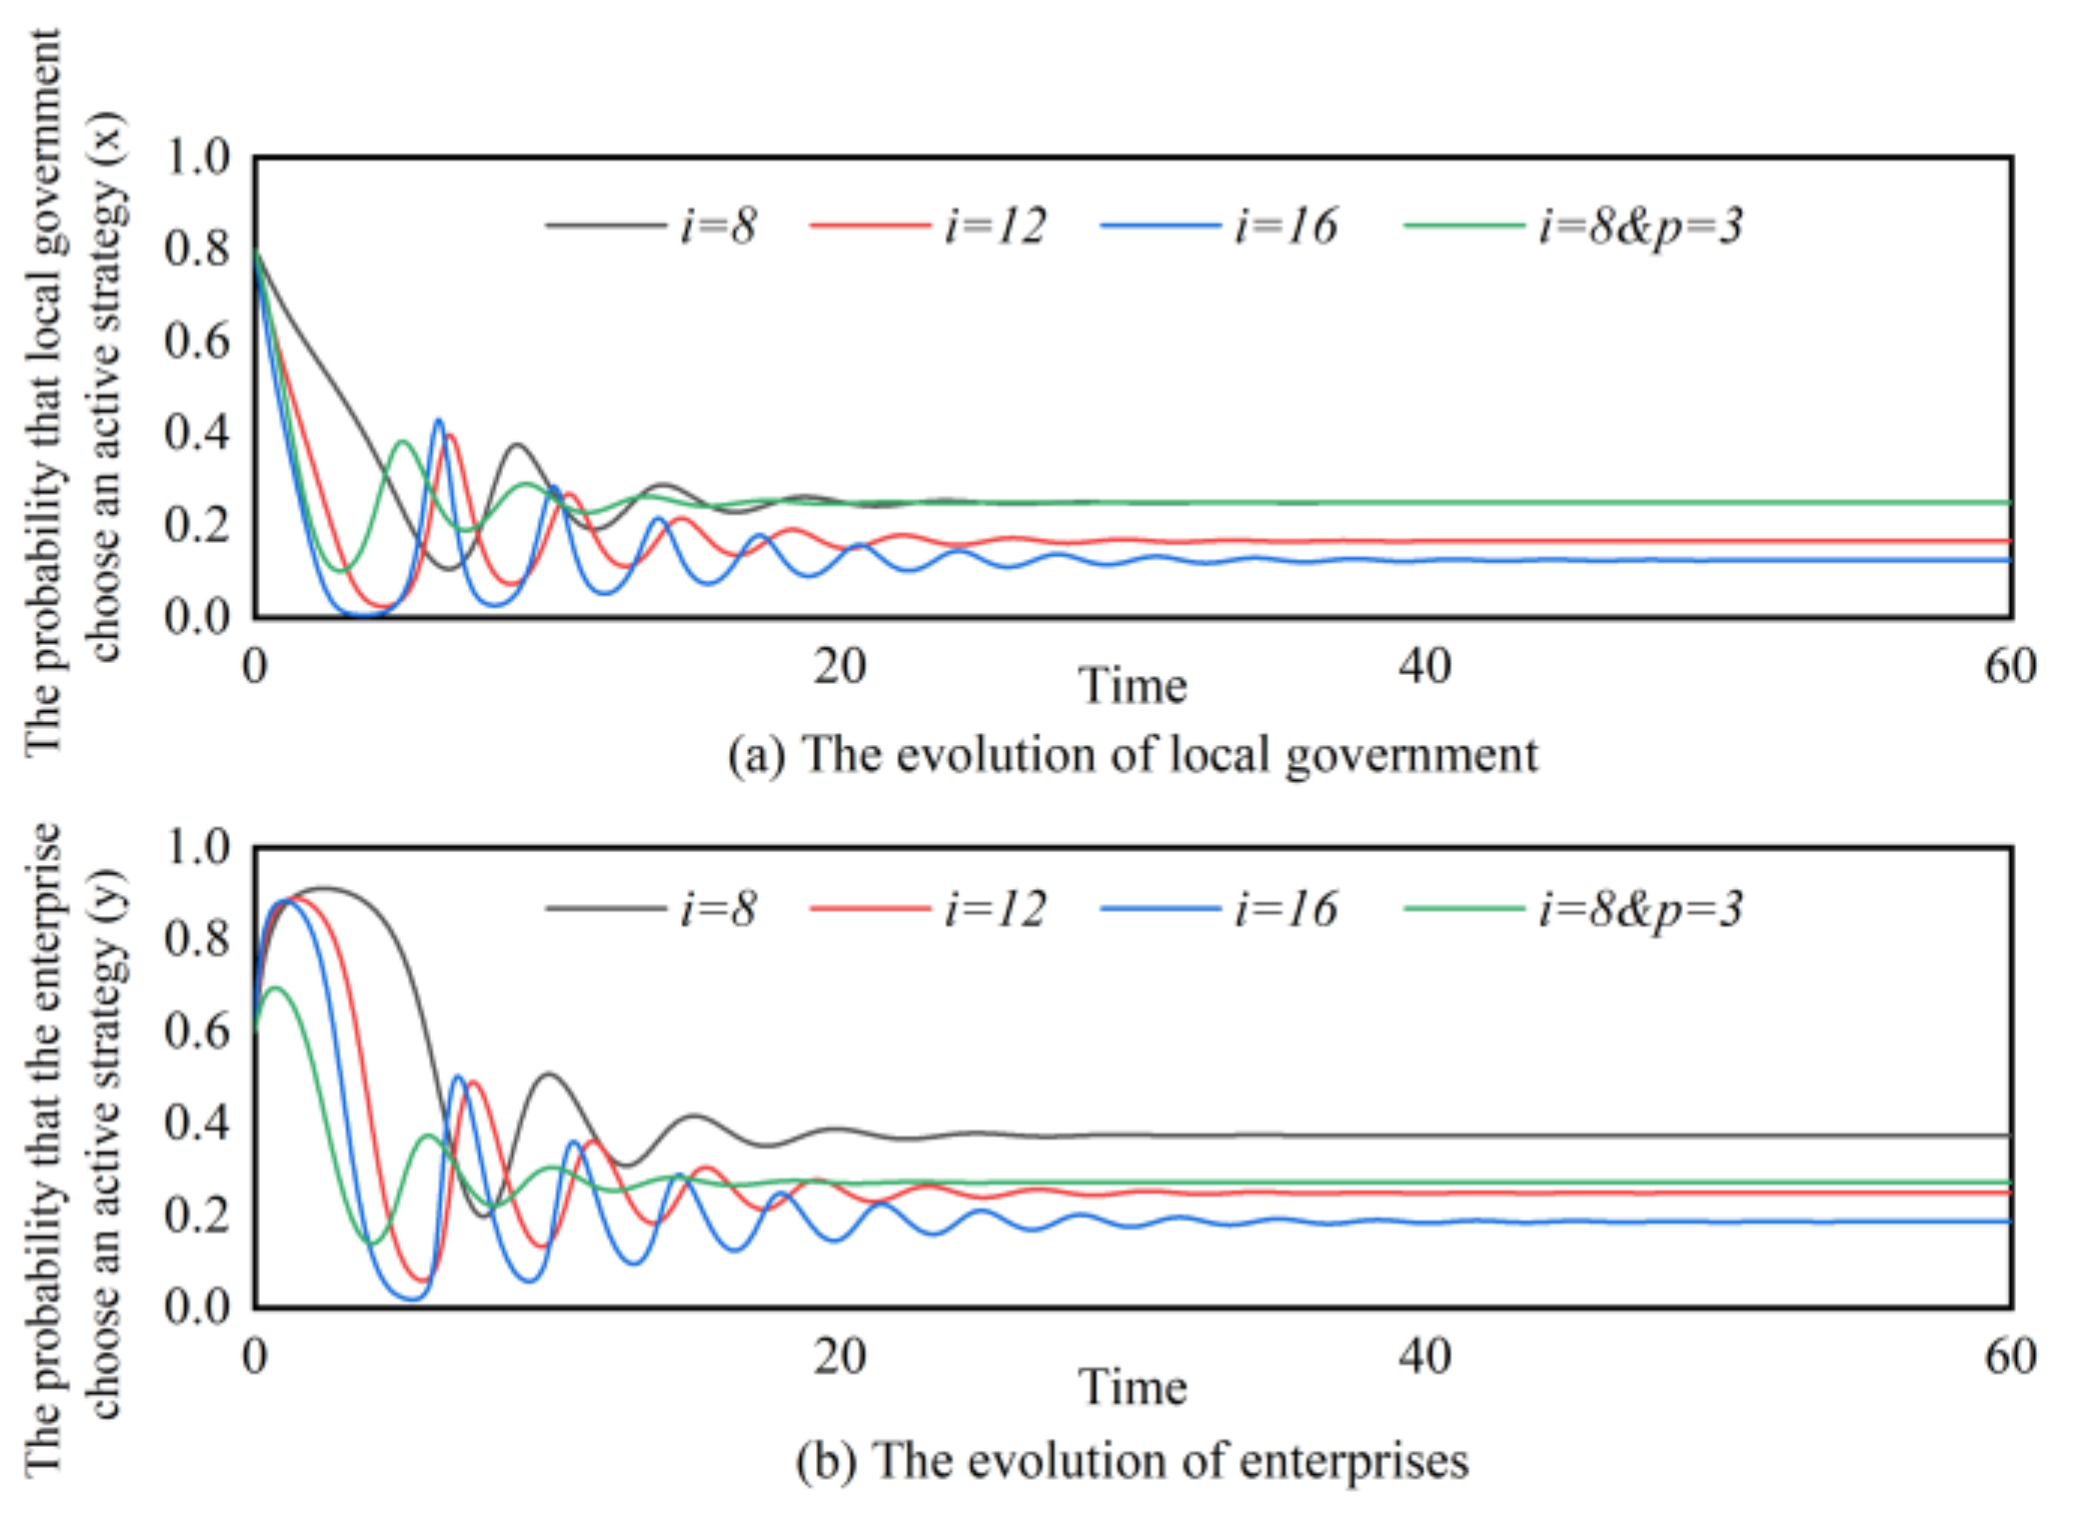
Figure 8 depicts the evolutionary path of the probability that local governments and enterprises choose to actively implement bridge employment based on a dynamic incentive mechanism. With the increase in incentive intensity, the evolution speed of both parties slows down, and finally, both parties tend to choose the passive strategy. With the same incentive intensity, the addition of a dynamic punishment mechanism has little impact on the government, and the two curves almost overlap. For enterprises, the addition of a dynamic punishment mechanism can accelerate the evolution rate and make enterprises more inclined to choose passive strategies.
Figure 9 depicts the evolutionary path of the probability that local governments and enterprises choose to actively implement bridge employment based on a dynamic incentive mechanism. With the increase in incentive intensity, the evolution speed of both parties slows down, and finally, both parties tend to choose the passive strategy. With the same incentive intensity, the addition of a dynamic punishment mechanism has little impact on the government, and the two curves almost overlap. For enterprises, the addition of a dynamic punishment mechanism can accelerate the evolution rate and make enterprises more inclined to choose passive strategies.
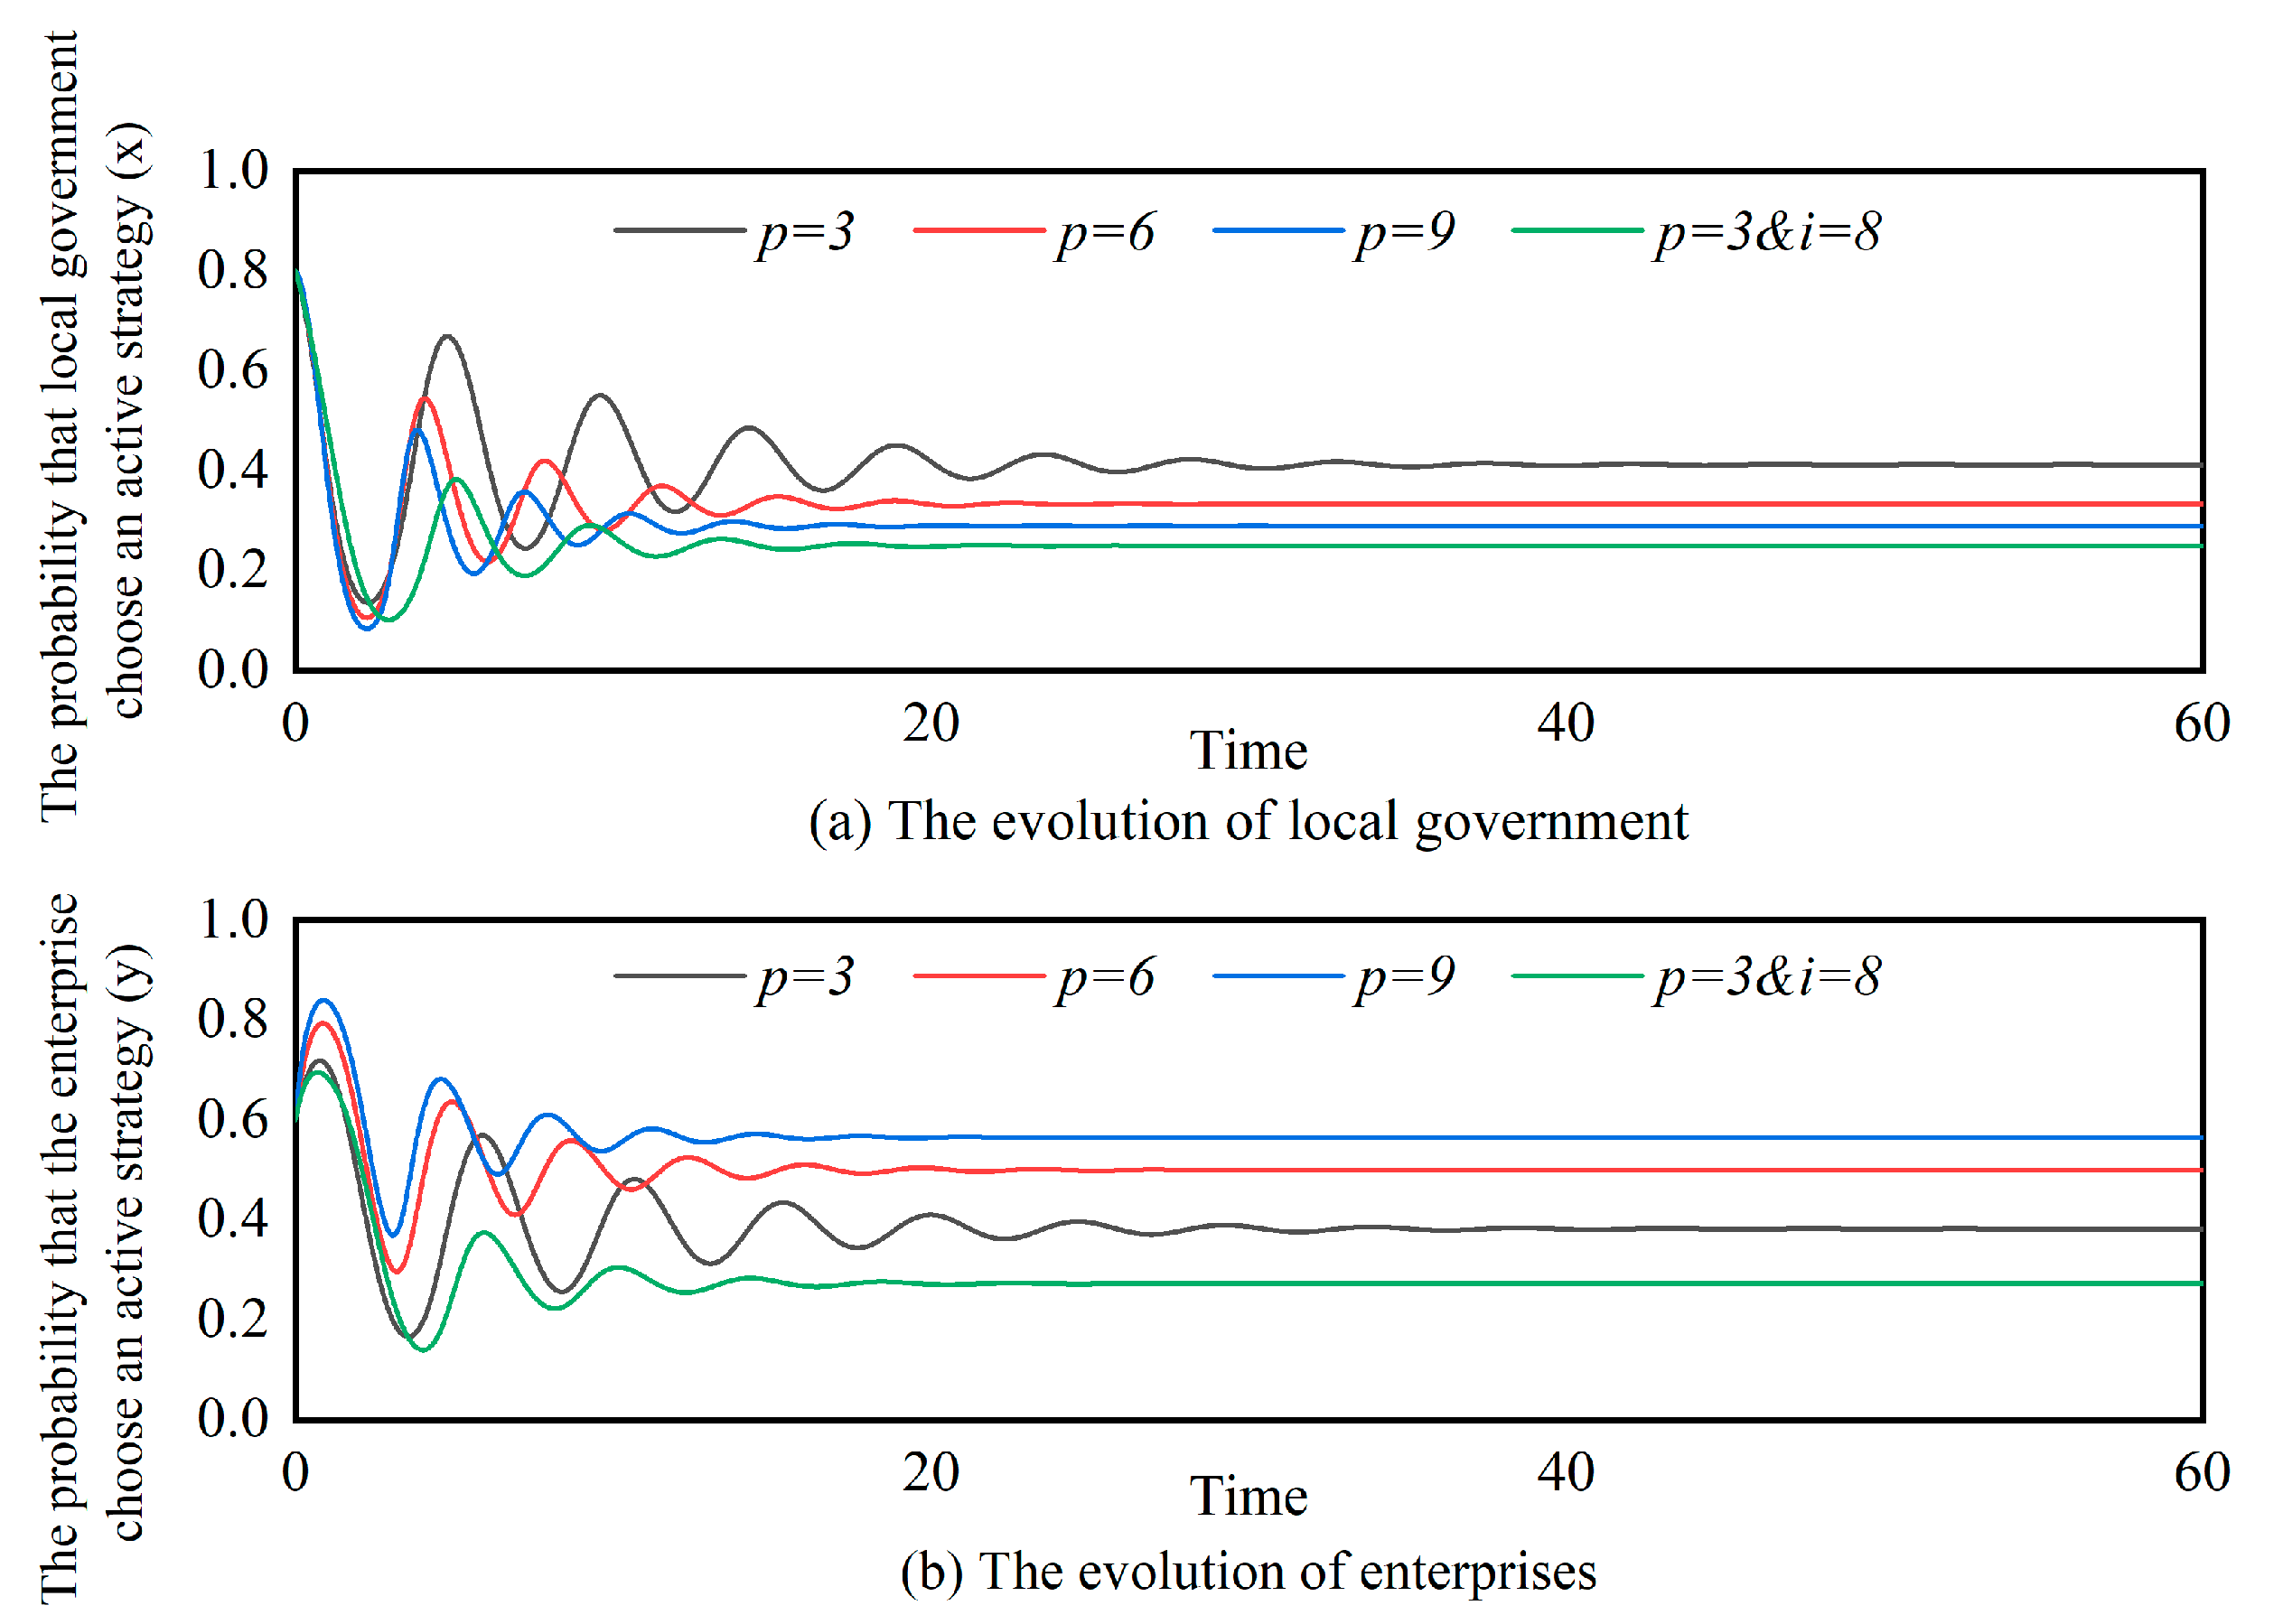
Figure 10 describes the evolutionary path based on the dynamic punishment mechanism. For the local government, the increase in punishment intensity will accelerate the evolution rate, making the government inclined to choose the passive strategy. Maintaining the same punishment intensity and adding a dynamic incentive mechanism will significantly accelerate the evolution rate of local government and increase the probability of choosing passive strategies. For enterprises, the increase in punishment intensity will improve the rate of evolution and the probability of active strategy selection. However, the effect of adding a dynamic incentive mechanism is not as obvious as the increase in punishment intensity.
In conclusion, under the dynamic low punishment intensity mechanism, the government is more inclined to choose the active strategy. Under dynamic high punishment intensity mechanisms, enterprises are more likely to actively respond to bridge employment policies. A dynamic incentive mechanism can help the system to achieve stability, but it cannot promote both parties to achieve the optimal strategy. Therefore, the combination of dynamic punishment and static incentive is the way to realize the optimal strategy of the system.
5. Discussion
This research combined evolutionary game theory with system dynamics to model and simulate the behavior of local government and enterprises on the problem of bridge employment. Considering the main factors influencing the behavioral decisions of both parties in the process of the game, and comparing the evolutionary path curves of static incentive and punishment with dynamic incentive and punishment in three different situations, the main conclusions of this research are as follows:
When the incentives and penalties are fixed, changing the model parameters can only affect the evolution path of the system, but cannot make the system reach the equilibrium state. The behavior of enterprises promoting bridge employment is affected by the government’s incentive and punishment strategy. On the premise that the government implements an active strategy, increasing the direct cost of government expenditure and the penalty can prompt the probability of enterprises choosing an active strategy.
Different dynamic incentive and punishment mechanisms of the government will have different effects on the behavior of enterprises. Under the dynamic incentive mechanism, the evolution process of the system gradually converges and finally stabilizes to the equilibrium value, but the increase in incentive intensity will make both sides of the game choose negative strategies, reducing the efficiency of implementing bridge employment. Under the dynamic punishment mechanism, there are evolutionarily stable strategies between the government and enterprises, and appropriately increasing the punishment intensity can promote enterprises to choose positive strategies.
This research discussed three different dynamic incentive and punishment mechanisms: dynamic incentive and static punishment mechanism, static incentive and dynamic punishment mechanism, dynamic incentive and dynamic punishment mechanism. Among them, the mode combining static incentive and dynamic punishment is optimal because the probability of the government and enterprises choosing the active strategy is the highest. Therefore, moderate punishment is more effective than incentive measures to promote the implementation of the bridge employment strategy.
5.1. Management Implications
Combined with the practical experience of bridge employment in various countries and the research conclusions of this paper, the following management recommendations can be obtained:
Delay the retirement age and innovate the payment mechanism. We can learn from the concept of wage peak in South Korea to encourage enterprises to provide jobs for the elderly. On the one hand, the government needs to provide financial subsidies for enterprises, and on the other hand, enterprises need to adopt a new compensation mechanism to reduce labor costs and change the traditional concept of age discrimination.
Build an information platform for the elderly. By connecting with enterprises, families, and individuals, communities can build a shared job search platform similar to Japan’s Silver Human Resources Center to gain a comprehensive understanding of the needs of older job seekers. The government should also regulate the information platform to create a fair employment environment.
Construct a dual mechanism based on incentive and punishment to increase the employment rate of the elderly. In terms of punishment, we can learn from the policies of Germany to implement an unemployment insurance reform, including reducing the level of unemployment insurance benefits and shortening the duration of unemployment insurance benefits. The incentive mechanism includes the implementation of active labor market policies, wage subsidies, and vocational training for elderly job seekers.
5.2. Strengths, Limitations, and Future Research
Different from the existing literature, this paper no longer focused on the factors of the bridge employees but studied the factors affecting bridge employment by simulating the behaviors of the government and enterprises. Evolutionary game theory helps to construct the dynamic evolutionary model of government and enterprise, and system dynamics helps to simulate the evolutionary path of the model. However, this study only studied how to promote the popularization of bridge employment from the perspective of government incentives and punishments. Follow-up studies can also be conducted from the perspectives of law, social security, and social welfare since these are also important components of bridge employment.
6. Conclusions
In the context of active aging, this research highlighted the importance of government and enterprise in promoting bridge employment. Although the existing literature has made research achievements in various aspects of bridge employment, most of them focus on the psychology and behavior of bridge employees, and few focus on the behavior of government and enterprises. In addition, this research innovatively applied evolutionary game theory to quantify the behavior of government and enterprise into a specific mathematical model and analyzed the effectiveness of different incentive and punishment mechanisms in promoting bridge employment. Results show that moderate punishment is more effective than incentives; specifically, the dynamic mechanism combining low incentive intensity and high punishment intensity is better than other mechanisms. This research verified that the government’s appropriate incentive and punishment measures will have an impact on enterprise behavior. The popularization of bridge employment not only needs the elderly job seekers to improve their employability but also needs the cooperation of the government and enterprises.
Author Contributions
Conceptualization, J.D.; methodology, J.D.; software, J.D.; validation, J.D., S.Y. and X.Y.; formal analysis, J.D.; data curation, J.D.; writing—original draft preparation, J.D.; writing—review and editing, J.D., S.Y. and X.Y.; visualization, J.D.; funding acquisition, S.Y. All authors have read and agreed to the published version of the manuscript.
Funding
This research was funded by the National Natural Science Foundation of China under grant number 71872130.
Data Availability Statement
Not applicable.
Conflicts of Interest
The authors declare no conflict of interest.
References
- WHO. Active Ageing: A Policy Framework; World Health Organization: Geneva, Switzerland; Madrid, Spain, 2002. [Google Scholar]
- Boulton-Lewis, G.M.; Buys, L.; Lovie-Kitchin, J. Learning and Active Aging. Educ. Gerontol. 2006, 32, 271–282. [Google Scholar] [CrossRef]
- Doeringer, P.B. Bridges to Retirement: Older Workers in a Changing Labor Market; Cornell University Press: Ithaca, Greece, 1990. [Google Scholar]
- Gobeski, K.T.; Beehr, T.A. How retirees work: Predictors of different types of bridge employment. J. Organ. Behav. 2009, 30, 401–425. [Google Scholar] [CrossRef]
- Yaohui, Z.; John, S.; Gonghuan, Y. China Health and Retirement Longitudinal Study; Institute of Social Science Survey, Peking University: Peking, China, 2015. [Google Scholar] [CrossRef]
- Platts, L.G.; Corna, L.M.; Worts, D.; McDonough, P.; Price, D.; Glaser, K. Returns to work after retirement: A prospective study of unretirement in the United Kingdom. Ageing Soc. 2017, 39, 439–464. [Google Scholar] [CrossRef]
- Settels, J.; McMullin, J. Gender and Relationship Status Interaction and Likelihood of Return to Work Post-Retirement. Can. J. Aging 2017, 36, 366–385. [Google Scholar] [CrossRef]
- Maestas, N. Back to work expectations and realizations of work after retirement. J. Hum. Resour. 2010, 45, 718–748. [Google Scholar] [CrossRef]
- Quinn, J. Work, retirement, and the encore career: Elders and the future of the American workforce. Generations 2010, 34, 45–55. [Google Scholar]
- Beehr, T.A.; Bennett, M.M. Working After Retirement: Features of Bridge Employment and Research Directions. Work. Aging Retire. 2014, 1, 112–128. [Google Scholar] [CrossRef]
- You, M.; Li, S.; Li, D.; Cao, Q.; Xu, F. Evolutionary game analysis of coal-mine enterprise internal safety inspection system in China based on system dynamics. Resour. Policy 2020, 67, 101673. [Google Scholar] [CrossRef]
- Fan, R.; Wang, Y.; Lin, J. Study on Multi-Agent Evolutionary Game of Emergency Management of Public Health Emergencies Based on Dynamic Rewards and Punishments. Int. J. Environ. Res. Public Health 2021, 18, 8278. [Google Scholar] [CrossRef]
- Meng, Q.; Liu, Y.; Li, Z.; Wu, C. Dynamic reward and penalty strategies of green building construction incentive: An evolutionary game theory-based analysis. Environ. Sci. Pollut. Res. 2021, 28, 44902–44915. [Google Scholar] [CrossRef]
- Shultz, K.S. Bridge Employment: Work after Retirement; Springer: New York, NY, USA, 2003; pp. 214–241. [Google Scholar]
- Feldman, D.C. The Decision to Retire Early: A Review and Conceptualization. Acad. Manag. Rev. 1994, 19, 285–311. [Google Scholar] [CrossRef]
- Ulrich, L.B.; Brott, P.E. Older Workers and Bridge Employment: Redefining Retirement. J. Employ. Couns. 2005, 42, 159–170. [Google Scholar] [CrossRef]
- Wang, M. Profiling retirees in the retirement transition and adjustment process: Examining the longitudinal change patterns of retirees’ psychological well-being. J. Appl. Psychol. 2007, 92, 455–474. [Google Scholar] [CrossRef]
- Björklund Carlstedt, A.; Jacobsson, G.; Bjursell, C.; Nystedt, P.; Sternäng, O. Staffing agency: A bridge to working during retirement. Work 2022, 72, 529–537. [Google Scholar] [CrossRef]
- Kim, E. Korean baby boomer retirees’ bridge employment experiences in community service jobs. Educ. Gerontol. 2021, 47, 151–159. [Google Scholar] [CrossRef]
- Peng, Y. A two-study examination of age discrimination, work meaningfulness, and bridge employment intentions. Career Dev. Int. 2022, 27, 391–407. [Google Scholar] [CrossRef]
- Lorenz, S.; Zwick, T.; Bruns, M. Beware of the employer: Financial incentives for employees may fail to prolong old-age employment. J. Econ. Ageing 2022, 21, 100363. [Google Scholar] [CrossRef]
- Mazumdar, B.; Warren, A.; Dupré, K.; Brown, T. Employment expectations: Examining the effect of psychological contract fulfillment on bridge employees’ personal and work attitudes. Pers. Rev. 2022. ahead-of-print. [Google Scholar] [CrossRef]
- Raymo, J.M.; Liang, J.; Sugisawa, H.; Kobayashi, E.; Sugihara, Y. Work at Older Ages in Japan: Variation by Gender and Employment Status. J. Gerontol. Ser. B 2004, 59, S154–S163. [Google Scholar] [CrossRef]
- Jones, D.A.; McIntosh, B.R. Organizational and occupational commitment in relation to bridge employment and retirement intentions. J. Vocat. Behav. 2010, 77, 290–303. [Google Scholar] [CrossRef]
- Kerr, G.; Armstrong-Stassen, M. The Bridge to Retirement: Older Workers’ Engagement in Post-Career Entrepreneurship and Wage-and-Salary Employment. J. Entrep. 2011, 20, 55–76. [Google Scholar] [CrossRef]
- Wang, M.; Adams, G.A.; Beehr, T.A.; Shultz, K.S. Bridge Employment and Retirement; Information Age Publishing: Charlotte, NC, USA, 2009. [Google Scholar]
- Mariappanadar, S. Do retirement anxieties determine bridge employment preference? Pers. Rev. 2013, 42, 176–204. [Google Scholar] [CrossRef]
- Zhan, Y.; Wang, M.; Yao, X. Domain specific effects of commitment on bridge employment decisions: The moderating role of economic stress. Eur. J. Work. Organ. Psychol. 2013, 22, 362–375. [Google Scholar] [CrossRef]
- Garcia, P.R.J.M.; Amarnani, R.K.; Bordia, P.; Restubog, S.L.D. When support is unwanted: The role of psychological contract type and perceived organizational support in predicting bridge employment intentions. J. Vocat. Behav. 2021, 125, 103–120. [Google Scholar] [CrossRef]
- Wang, M.; Zhan, Y.; Liu, S.; Shultz, K.S. Antecedents of bridge employment: A longitudinal investigation. J. Appl. Psychol. 2008, 93, 818–930. [Google Scholar] [CrossRef]
- Yin, R.; Xin, Y.; Bhura, M.; Wang, Z.; Tang, K. Bridge Employment and Longevity: Evidence From a 10-Year Follow-Up Cohort Study in 0.16 Million Chinese. J. Gerontol. Ser. B 2022, 77, 750–758. [Google Scholar] [CrossRef]
- Zhan, Y.; Wang, M.; Liu, S.; Shultz, K.S. Bridge employment and retirees’ health: A longitudinal investigation. J. Occup. Health Psychol. 2009, 14, 374–389. [Google Scholar] [CrossRef]
- Kim, S.; Feldman, D.C. Working in retirement: The antecedents of bridge employment and its consequences for quality of life in retirement. Acad. Manag. J. 2000, 43, 1195–1210. [Google Scholar] [CrossRef]
- Cahill, K.E.; Giandrea, M.D.; Quinn, J.F. Bridge employment. In The Oxford Handbook of Retirement; Oxford University Press: Oxford, UK, 2013. [Google Scholar] [CrossRef]
- Mazumdar, B.; Warren, A.M.; Brown, T.C. Bridge employment: Understanding the expectations and experiences of bridge employees. Hum. Resour. Manag. J. 2021, 31, 575–591. [Google Scholar] [CrossRef]
- Zhan, Y.; Wang, M.; Shi, J. Retirees’ motivational orientations and bridge employment: Testing the moderating role of gender. J. Appl. Psychol. 2015, 100, 1319–1331. [Google Scholar] [CrossRef]
- Lahlouh, K.; Lacaze, D.; Huaman-Ramirez, R. Bridge employment and full retirement intentions: The role of person-environment fit. Pers. Rev. 2019, 48, 1469–1490. [Google Scholar] [CrossRef]
- Peng, Y.; Xu, X.; Jex, S.M.; Chen, Y. The Roles of Job-Related Psychosocial Factors and Work Meaningfulness in Promoting Nurses’ Bridge Employment Intentions. J. Career Dev. 2020, 47, 701–716. [Google Scholar] [CrossRef]
- Loretto, W.; White, P. Employers’ attitudes, practices and policies towards older workers. Hum. Resour. Manag. J. 2006, 16, 313–330. [Google Scholar] [CrossRef]
- Conen, W.S.; Henkens, K.; Schippers, J. Employers’ attitudes and actions towards the extension of working lives in Europe. Int. J. Manpow. 2012, 33, 648–665. [Google Scholar] [CrossRef]
- Oude Mulders, J.; van Dalen, H.P.; Henkens, K.; Schippers, J. How Likely are Employers to Rehire Older Workers after Mandatory Retirement? A Vignette Study among Managers. Economist 2014, 162, 415–431. [Google Scholar] [CrossRef]
- Karpinska, K.; Henkens, K.; Schippers, J. The recruitment of early retirees: A vignette study of the factors that affect managers’ decisions. Ageing Soc. 2011, 31, 570–589. [Google Scholar] [CrossRef]
- Templer, A.; Armstrong-Stassen, M.; Cattaneo, J. Antecedents of older workers’ motives for continuing to work. Career Dev. Int. 2010, 15, 479–500. [Google Scholar] [CrossRef]
- Feldman, D.C.; Kim, S. Bridge Employment During Retirement: A Field Study of Individual and Organizational Experiences with Post-Retirement Employment. Hum. Resour. Plan. 2000, 23, 14–25. [Google Scholar]
- Mazumdar, B.; Warren, A.M.; Dupré, K.E. Extending the understanding of bridge employment: A critical analysis. Pers. Rev. 2018, 47, 1345–1361. [Google Scholar] [CrossRef]
- Alcover, C.-M.; Topa, G.; Parry, E. Bridge Employment: Lessons Learned and Future Prospects for Research and Practice; Routledge: Oxford, UK, 2014; pp. 295–316. [Google Scholar]
- Ashford, S.J.; George, E.; Blatt, R. Old assumptions, new work: The opportunities and challenges of research on nonstandard employment. Acad. Manag. Ann. 2007, 1, 65–117. [Google Scholar] [CrossRef]
- Smith, J.M.; Price, G.R. The logic of animal conflict. Nature 1973, 246, 15–18. [Google Scholar] [CrossRef]
- Taylor, P.D.; Jonker, L.B. Evolutionary stable strategies and game dynamics. Math. Biosci. 1978, 40, 145–156. [Google Scholar] [CrossRef]
- Smith, J.M. The theory of games and the evolution of animal conflicts. J. Theor. Biol. 1974, 47, 209–221. [Google Scholar] [CrossRef]
- Zhiwen, Z.; Yujun, X.; Junxing, L.; Limin, G.; Long, W. Supply Chain Logistics Information Collaboration Strategy Based on Evolutionary Game Theory. IEEE Access 2020, 8, 46102–46120. [Google Scholar] [CrossRef]
- Pan, X.Y.; Gelfand, M.; Nau, D. Integrating Evolutionary Game Theory and Cross-Cultural Psychology to Understand Cultural Dynamics. Am. Psychol. 2021, 76, 1054–1066. [Google Scholar] [CrossRef]
- Krapohl, S.; Ocelík, V.; Walentek, D.M. The instability of globalization: Applying evolutionary game theory to global trade cooperation. Public Choice 2021, 188, 31–51. [Google Scholar] [CrossRef]
- Dong, J.; Yan, S. Evolutionary game analysis between employees and employers about working overtime from the perspective of information asymmetry. BMC Psychol. 2022, 10, 95–108. [Google Scholar] [CrossRef]
- Friedman, D. On economic applications of evolutionary game theory. J. Evol. Econ. 1998, 8, 15–43. [Google Scholar] [CrossRef]
Figure 1.
System dynamics model of the evolutionary game between local government and enterprises.

Figure 2.
Evolution simulation trajectory of local government and enterprises.

Figure 3.
Evolution curves of local government and enterprises with different initial values.

Figure 4.
The influence of on the evolution of local government and enterprises.

Figure 5.
The influence of eb on the evolution of local government and enterprises.

Figure 6.
The influence of ec on the evolution of local government and enterprises.

Figure 7.
The influence of ef on the evolution of local government and enterprises.

Figure 8.
Evolution simulation trajectory of the system under four different mechanisms.

Figure 9.
The evolution of local government and enterprises under dynamic incentive mechanism.

Figure 10.
The evolution of local government and enterprises under dynamic punishment mechanism.


Table 1.
Descriptions of each parameter.
| Parameters | Descriptions | Notes |
|---|---|---|
| The probability that the government actively implements rewards and punishments. | ||
| Additional benefits for the government. | ||
| Direct cost to the government. | ||
| Indirect cost to the government. | ||
| Additional cost to the government. | ||
| The probability that enterprises actively respond to government policies. | ||
| Profits earned by the enterprise. | ||
| Indirect benefits to the enterprise. | ||
| The cost consumed by the enterprise. | ||
| Fines imposed on enterprises. |
Table 2.
Payment matrix of local government and enterprises.
| Local Government | Enterprises | |
|---|---|---|
| Active (y) | Pasive (1 − y) | |
| Active (x) | ||
| Passive (1 − x) | ||
Table 3.
System stability analysis under the static mechanism.
| Equilibrium Points | DetJ | Sign | TrJ | Sign | Result |
|---|---|---|---|---|---|
| Uncertain | Saddle point | ||||
| Uncertain | Saddle point | ||||
| Uncertain | Saddle point | ||||
| Uncertain | Saddle point | ||||
| 0 | 0 | Central point |
Table 4.
Payment matrix of local government and enterprises based on dynamic incentive mechanism.
| Local Government | Enterprises | |
|---|---|---|
| Active (y) | Passive (1 − y) | |
| Active (x) | ||
| Passive (1 − x) | ||
Table 5.
Payment matrix of local government and enterprises based on dynamic punishment mechanism.
| Local Government | Enterprises | |
|---|---|---|
| Active (y) | Passive (1 − y) | |
| Active (x) | ||
| Passive (1 − x) | ||
Table 6.
Payment matrix of local government and enterprises based on dynamic incentive and punishment mechanism.
Table 6.
Payment matrix of local government and enterprises based on dynamic incentive and punishment mechanism.
| Local Government | Enterprises | |
|---|---|---|
| Active (y) | Passive (1 − y) | |
| Active (x) | ||
| Passive (1 − x) | ||
Publisher’s Note: MDPI stays neutral with regard to jurisdictional claims in published maps and institutional affiliations. |
© 2022 by the authors. Licensee MDPI, Basel, Switzerland. This article is an open access article distributed under the terms and conditions of the Creative Commons Attribution (CC BY) license (https://creativecommons.org/licenses/by/4.0/).
Share and Cite
MDPI and ACS Style
Dong, J.; Yan, S.; Yang, X. Evolutionary Game Analysis between Local Government and Enterprises on Bridge Employment from the Perspective of Dynamic Incentive and Punishment. Systems 2022, 10, 115. https://doi.org/10.3390/systems10040115
AMA Style
Dong J, Yan S, Yang X. Evolutionary Game Analysis between Local Government and Enterprises on Bridge Employment from the Perspective of Dynamic Incentive and Punishment. Systems. 2022; 10(4):115. https://doi.org/10.3390/systems10040115
Chicago/Turabian StyleDong, Junjie, Shumin Yan, and Xiaowei Yang. 2022. "Evolutionary Game Analysis between Local Government and Enterprises on Bridge Employment from the Perspective of Dynamic Incentive and Punishment" Systems 10, no. 4: 115. https://doi.org/10.3390/systems10040115
Note that from the first issue of 2016, this journal uses article numbers instead of page numbers. See further details here.