3.1. Database Description
In our experiments, we use a public database for evaluating the performance of our system, called PAL database [
42,
43]. The updated PAL database contains the face images of 580 persons according to gender, facial expression (neutral, annoyed, happy,
etc.), and race (Caucasians, Africa-Americans, and others). The age of the people used for the PAL database ranges from 18 to 93 years old. For each person, several images were captured with different types of facial expressions, including neutral and additional non-neutral expressions (happy, angry, annoyed,
etc.). We randomly divided the PAL database into learning and testing databases twice (database parts 1 and 2, as listed in
Table 3) in order to perform two-fold cross-validation to evaluate the performance of the age estimation system. At each trial, half of the images were assigned to the learning database, and the other half were assigned to the testing database. Images from the same person were not included in both the learning and testing databases. Detailed descriptions of the PAL database and the learning and testing databases used in our experiment are listed in
Table 3. Some sample images from the PAL database are shown in
Figure 11.
Table 3.
Description of PAL database and division into sub-databases.
Table 3.
Description of PAL database and division into sub-databases.
| Database | Number of Learning Images | Number of Testing Images | Total |
|---|
| Database Part 1 | 291 | 289 | 580 |
| Database Part 2 | 291 | 289 | 580 |
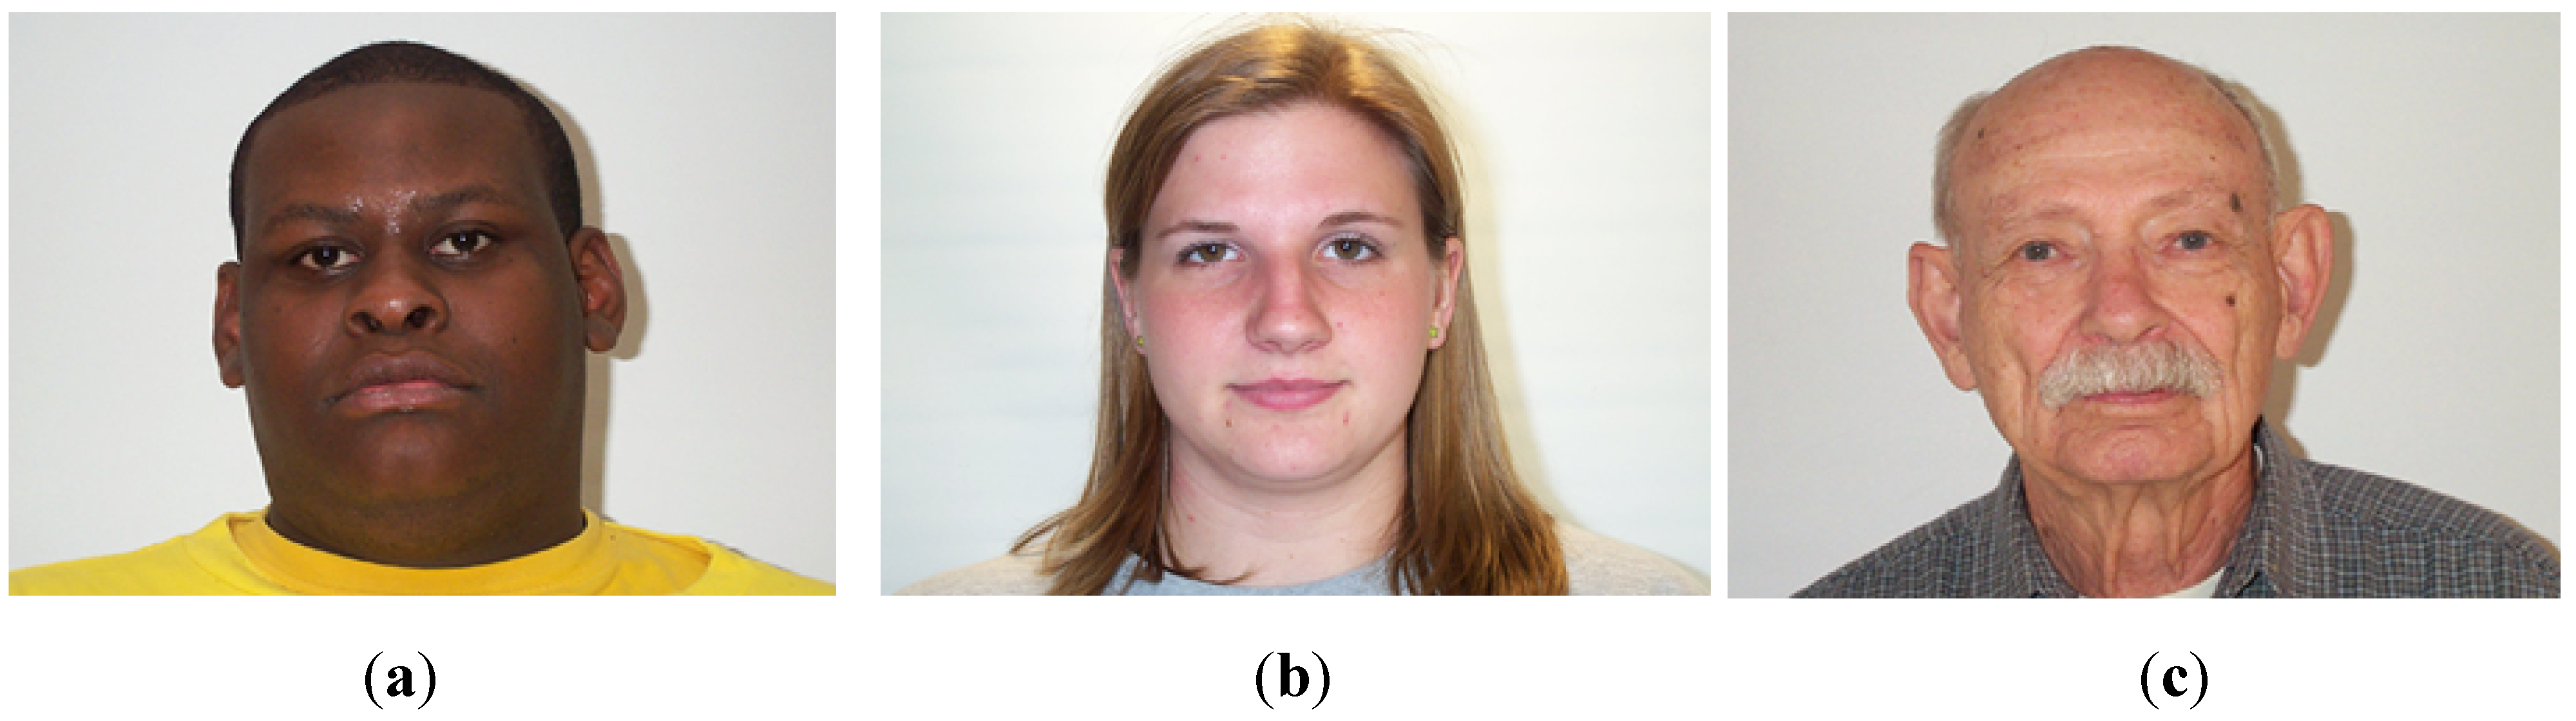
Figure 11.
Examples of images in PAL database: (a) male age 22; (b) female age 21; and (c) male age 76.
Figure 11.
Examples of images in PAL database: (a) male age 22; (b) female age 21; and (c) male age 76.
There is no open database for age estimation that includes images with a blurring effect. Therefore, for our purpose of estimating age under the effects of image blurring, we created a blurring database from the original PAL database by applying the Gaussian blurring function to the original face images. The reason for using the Gaussian function is that PSF for optical blurring is usually defined as a Gaussian function [
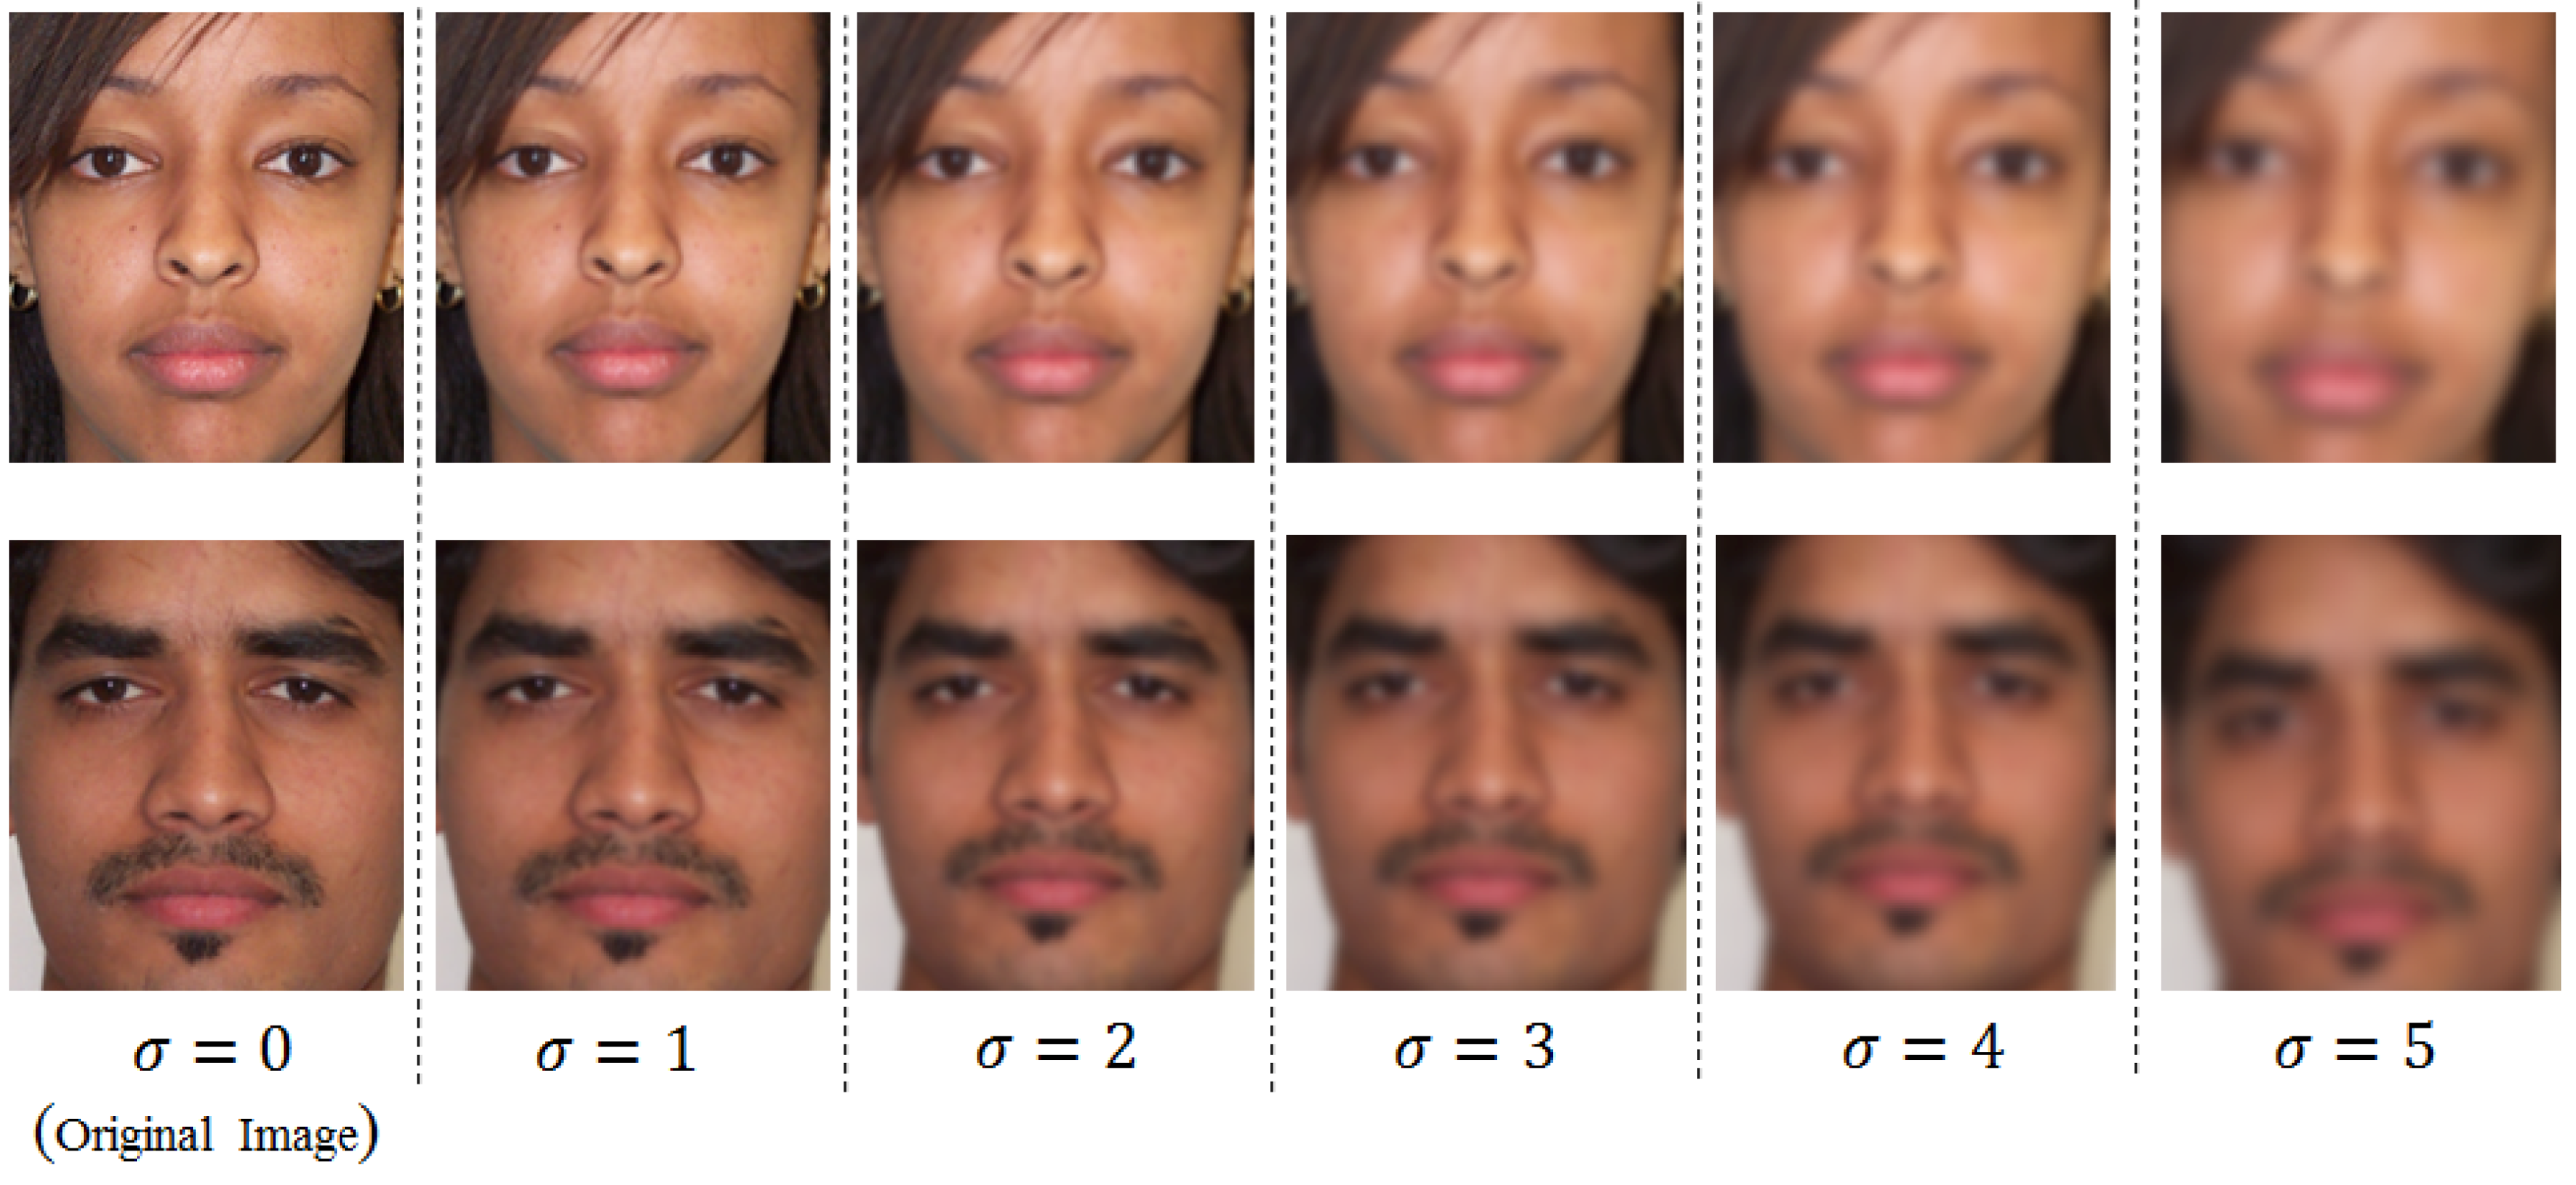
44]. In details, each original face image is blurred using five Gaussian kernels with different sigma values that range from one to five. With a larger sigma value of the Gaussian function, a more blurred image is obtained. Consequently, each person in the PAL database has six face images, including one original focused image and five blurred images. Therefore, we used a total of 3480 images (580 original images + 2900 images generated by the five Gaussian kernels) for our experiments. As explained before, we divided these images into learning and testing databases twice (database parts 1 and 2 as listed in
Table 4) in order to perform two-fold cross-validation to evaluate the performance of our age estimation system. From the six face images of each person, we classified three groups according to blurring degree, including the focused groups that contain the original image and the blurred image with sigma value one; the slightly blurred group that contains the blurred image with sigma 2; and the blurred group that contains the other blurred images with sigma from three to five. We performed various experiments based on the different cases of grouping with training data, and the optimal grouping determined by the best classification performance of the blurring images was achieved through our focus assessment method, as explained in
Section 2.3 and
Figure 5.
Table 4.
Description (number of images) of the databases used in our experiments.
Table 4.
Description (number of images) of the databases used in our experiments.
| Database | Focused Database (DB1) | Slightly Blurred Database (DB2) | Blurred Database (DB3) | Total |
|---|
| Learning/Testing (Database Part 1) | 582/578 | 291/289 | 873/867 | 1746/1734 |
| Learning/Testing (Database Part 2) | 582/578 | 291/289 | 873/867 | 1746/1734 |
Finally, we obtained the blurred databases that correspond to the three groups (DB1, DB2, and DB3) according to blurring degree as listed in
Table 4. In
Figure 12, we show some sample images according to the sigma value of the Gaussian blurring function.
MAE is used widely as the criterion for measuring the accuracy of age estimation systems [
1,
13,
14,
30], and we use MAE in our experiments. Mathematically, MAE is the measure of the average error of the estimated ages (
ak) compared with the ground-truth ages (
ak′) as shown in Equation (12) [
14,
30].
In Equation (12), N is the number of testing data. A smaller value of MAE shows better estimation accuracy of the age estimation system.
Figure 12.
Examples of original and blurred face images produced by the Gaussian blurring function at various sigma values (σ) of the Gaussian function.
Figure 12.
Examples of original and blurred face images produced by the Gaussian blurring function at various sigma values (σ) of the Gaussian function.
3.3. Performance Evaluation of Our Method
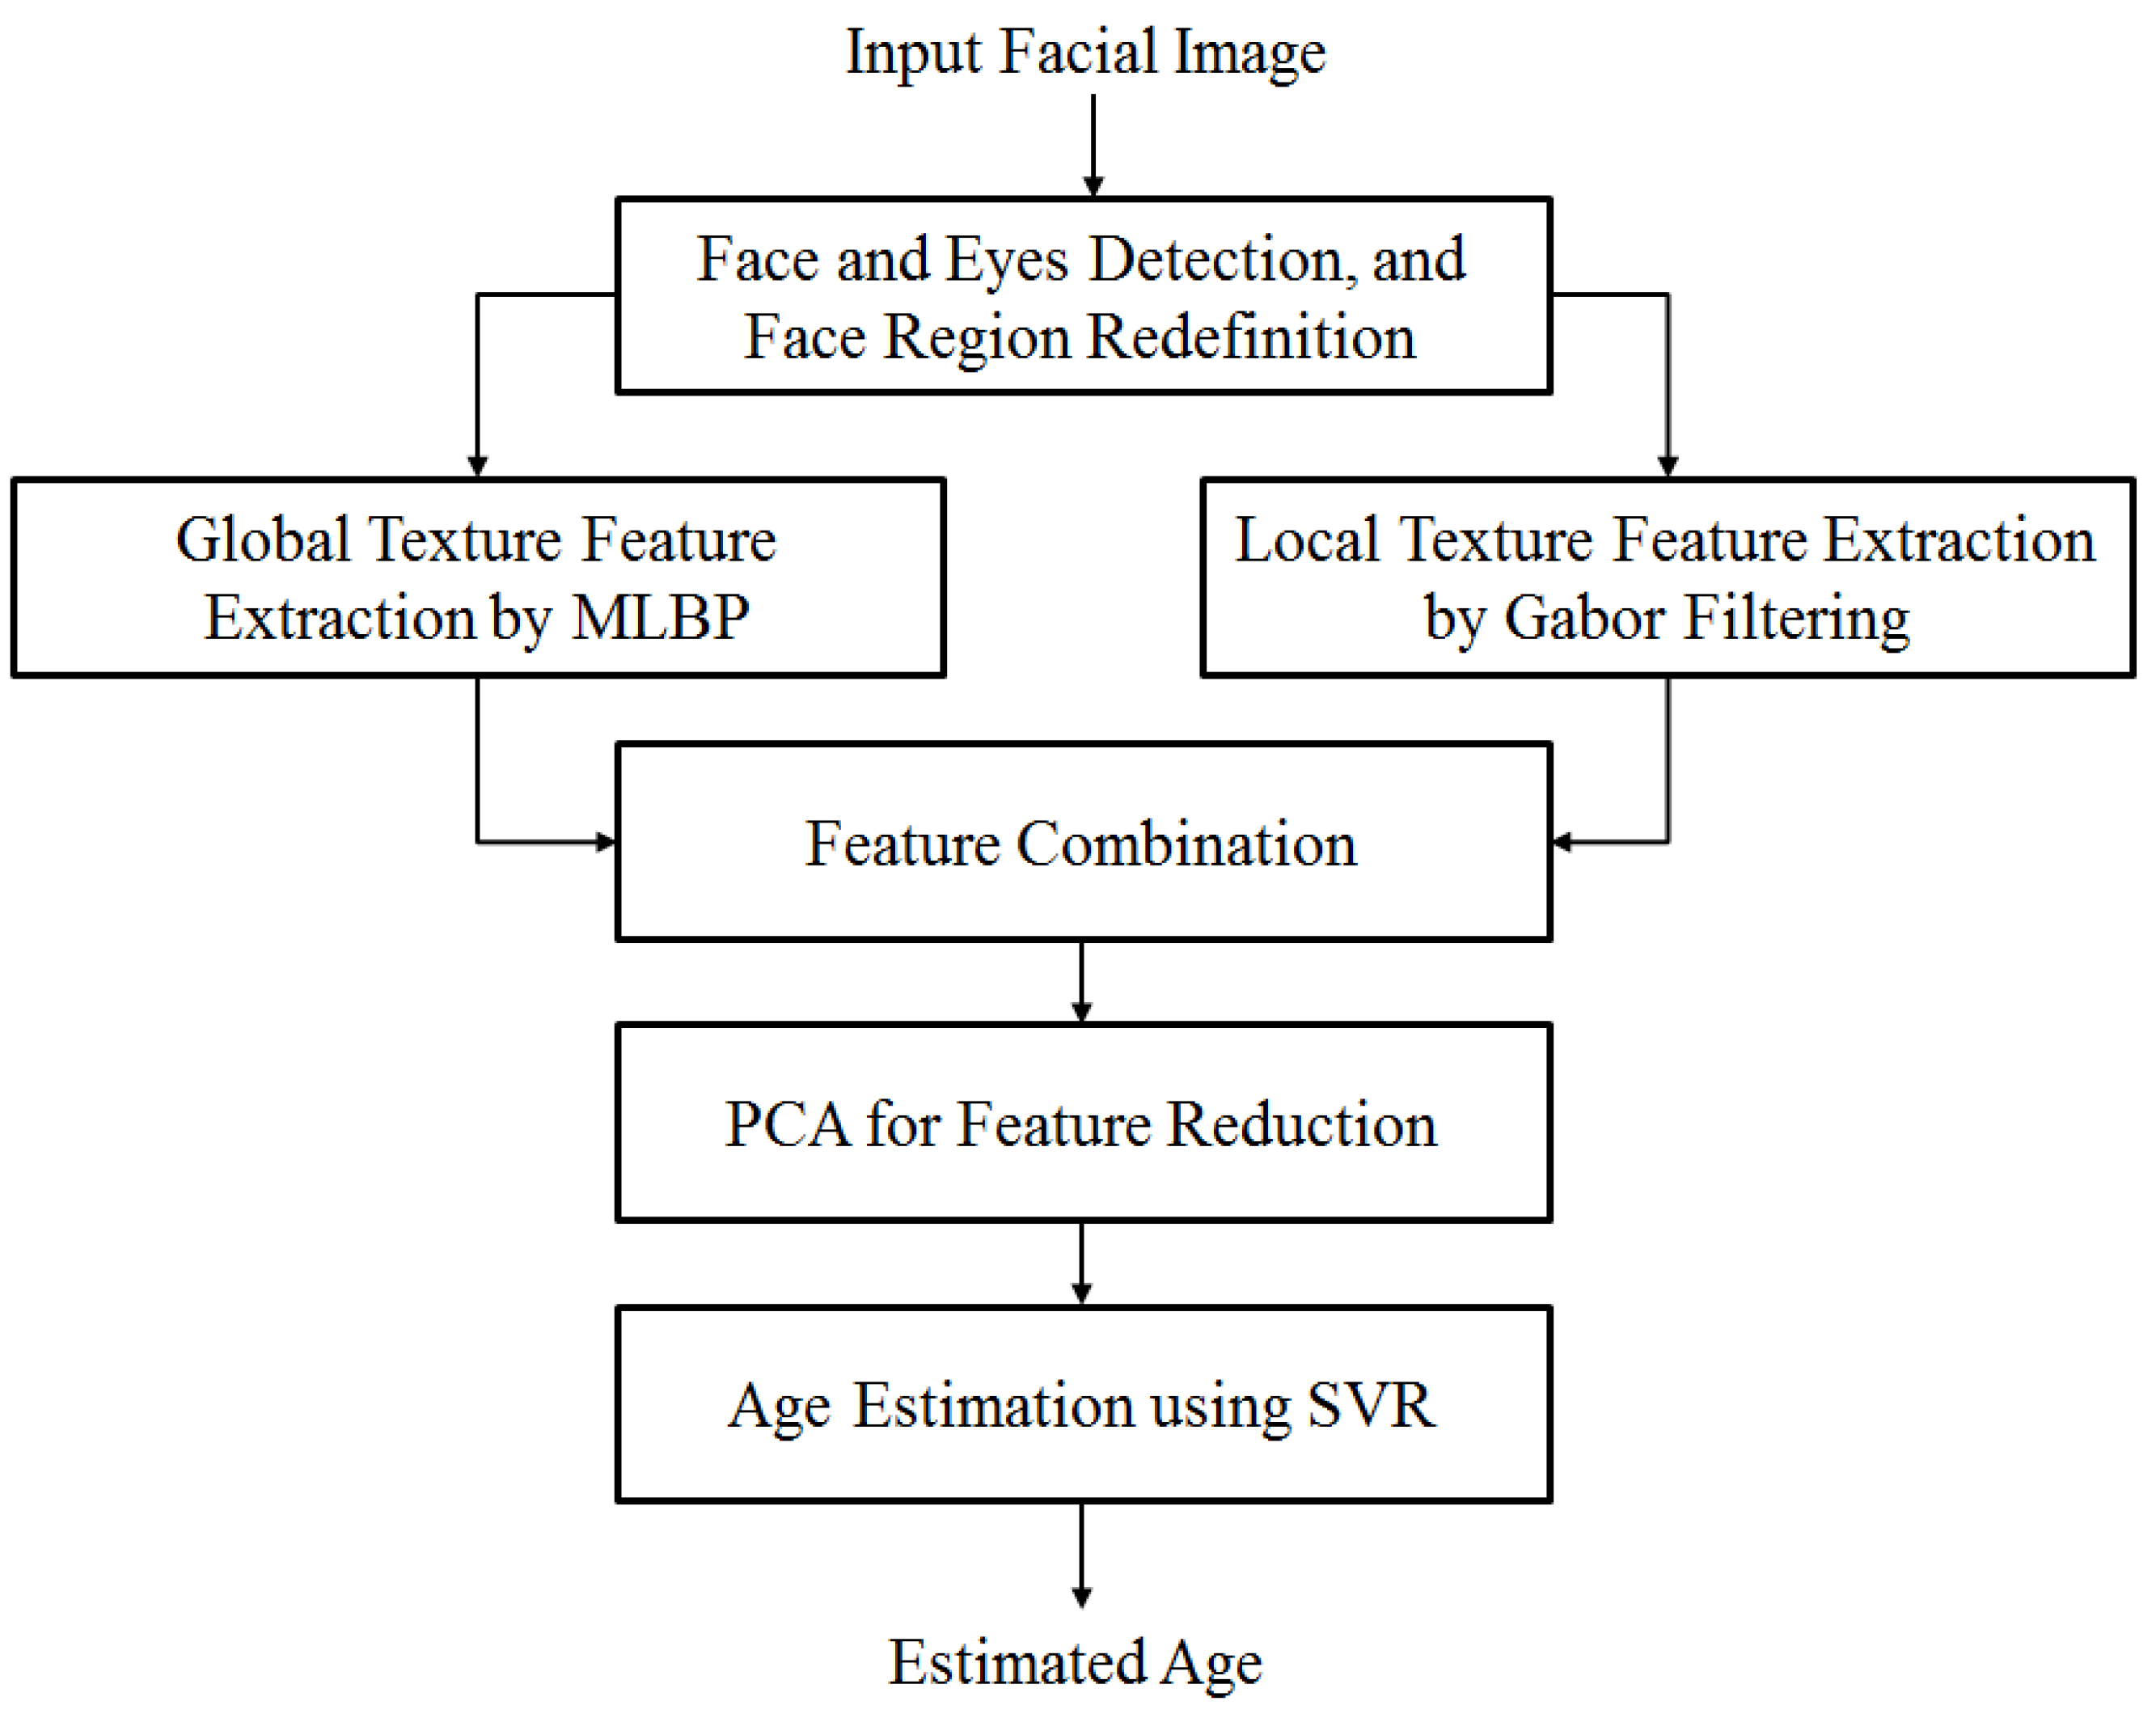
In this section, we show the experiment results of the performance of our age estimation system. As explained in
Section 2.4, one of the problems of the previous age estimation system [
14] based on a combination of MLBP, Gabor filtering, and SVR is the high dimension of the age feature. This problem can be solved by applying the PCA method on the extracted feature before inputting to SVR in order to estimate human age. To evaluate the efficiency of the PCA method on feature dimension reduction and performance enhancement, we measured the estimation performance (MAE) of the age estimation system with and without the PCA method. Because the focused database (DB1) contains both the original focused PAL images and very slightly blurred images (blurred images with σ one), in this experiment, we measure the performance of the age estimation system with and without PCA for three blurred databases, including DB1, DB2, and DB3, as listed in
Table 7. As indicated in this table, the system that does not apply the PCA method produces MAE of 7.194 years. With PCA, MAE is reduced to 6.845 years. In details, all the MAE values for DB1, DB2, and DB3 with the PCA method are reduced compared with those without the PCA method. Through these experiment results, the PCA method is proven to be useful for reducing feature dimension and enhancing the performance of age estimation systems. In
Table 7, the pre-classification of DB1, DB2, and DB3 is performed manually because we want to check only the effects of feature extraction by PCA on the performance of age estimation.
Table 7.
Estimation performance (MAE) of the age estimation system with and without applying PCA using three databases, including DB1, DB2, and DB3 (unit: years).
Table 7.
Estimation performance (MAE) of the age estimation system with and without applying PCA using three databases, including DB1, DB2, and DB3 (unit: years).
| Database | With PCA | Without PCA |
|---|
| Testing Database 1 | Testing Database 2 | Average |
|---|
| DB1 | 6.114 | 6.420 | 6.267 | 6.630 |
| DB2 | 6.882 | 6.900 | 6.891 | 7.240 |
| DB3 | 7.173 | 7.257 | 7.215 | 7.556 |
| Average with Entire Database | 6.771 | 6.918 | 6.845 | 7.194 |
For the next experiment, we evaluate the performance of the classification of blurred images into blurring groups using the MLBP measurement as explained in
Section 2.3 and
Figure 5. For this purpose, we use the three blurred databases (DB1, DB2, and DB3). As explained in
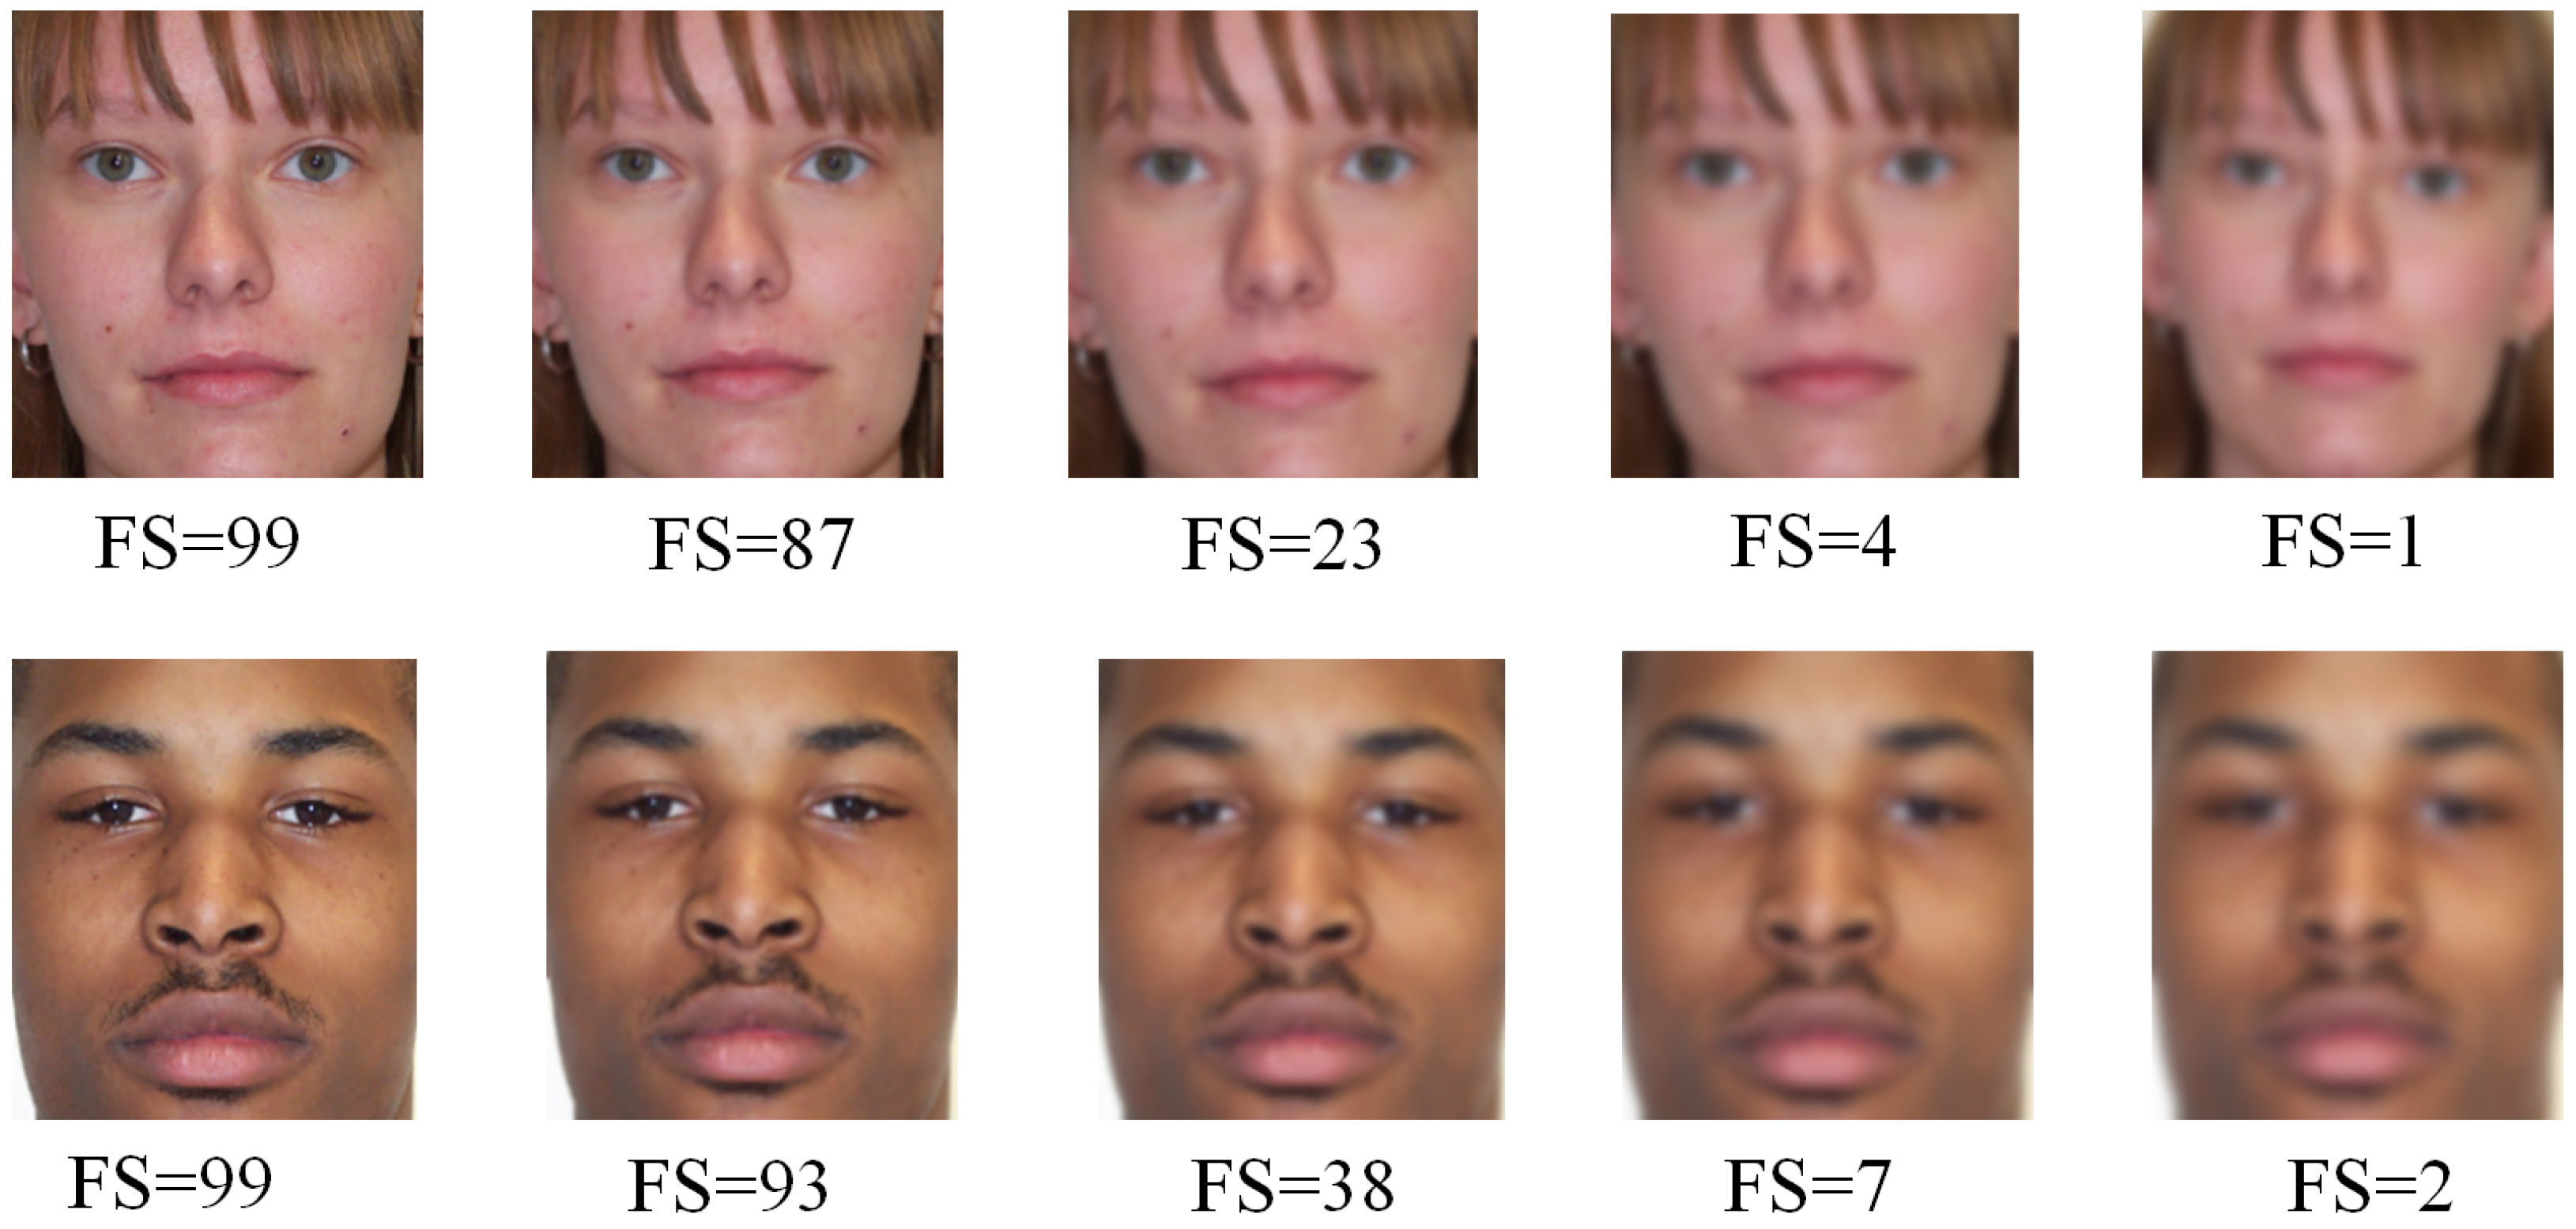
Section 3.1, DB1 contains the images of the PAL database and very slightly blurred images with sigma value one. This characteristic causes high FSs of images in DB1 (close to 100). DB2 contains the blurred images of the images in the PAL database with sigma value two. This database represents the class of slightly blurred images. Therefore, the FSs of the images in this database are expected to be lower than those for DB1. Finally, DB3 contains the blurred images of the images in the PAL database with larger sigma values (sigma values three, four, and five). The images in this database are blurred significantly, as shown in
Figure 12. Consequently, the FSs of the images in the DB3 database are expected to be extremely small.
As explained in
Section 2.3 and
Figure 5, in order to classify the images into one of the groups according to the blurring degree, we determine the classification thresholds where misclassification is smallest. The classification results that use two-fold cross-validation with the testing databases are provided in
Table 8. Note that because the blurring degree of DB3 is too high, two images in the testing database of DB3 failed for face detection. Consequently, in
Table 8, the total number of images in DB3 is 865, instead of 867, as indicated in
Table 4. Using the thresholds obtained from the learning databases, the classification results for the testing database are provided in
Table 8. On average, the correct classification of the testing database is approximately 97.69%. From these results, we conclude that our focus assessment method can be used for classification of image blurring.
Table 8.
Classification results when classifying the input images into one of three groups according to blurring degree for the testing databases.
Table 8.
Classification results when classifying the input images into one of three groups according to blurring degree for the testing databases.
| Number of Images (Classification Rate) | Correct Classification | Incorrect Classification |
|---|
| DB1 → DB2 | DB2 → DB1 | DB1 → DB3 | DB3 → DB1 | DB2 → DB3 | DB3 → DB2 |
|---|
| DB1 | Testing Database 1 | 576 (99.65%) | 2 (0.35%) | – | 0 (0%) | – | – | – |
| Testing Database 2 | 576 (99.65%) | 2 (0.35%) | – | 0 (0%) | – | – | – |
| DB2 | Testing Database 1 | 267 (92.39%) | – | 5 (1.73%) | – | – | 17 (5.88%) | – |
| Testing Database 2 | 256 (88.58%) | – | 12 (4.15%) | – | – | 21 (7.27%) | – |
| DB3 | Testing Database 1 | 856 (98.96%) | – | – | – | 0 (0%) | – | 9 (1.04%) |
| Testing Database 2 | 853 (98.61%) | – | – | – | 0 (0%) | – | 12 (1.39%) |
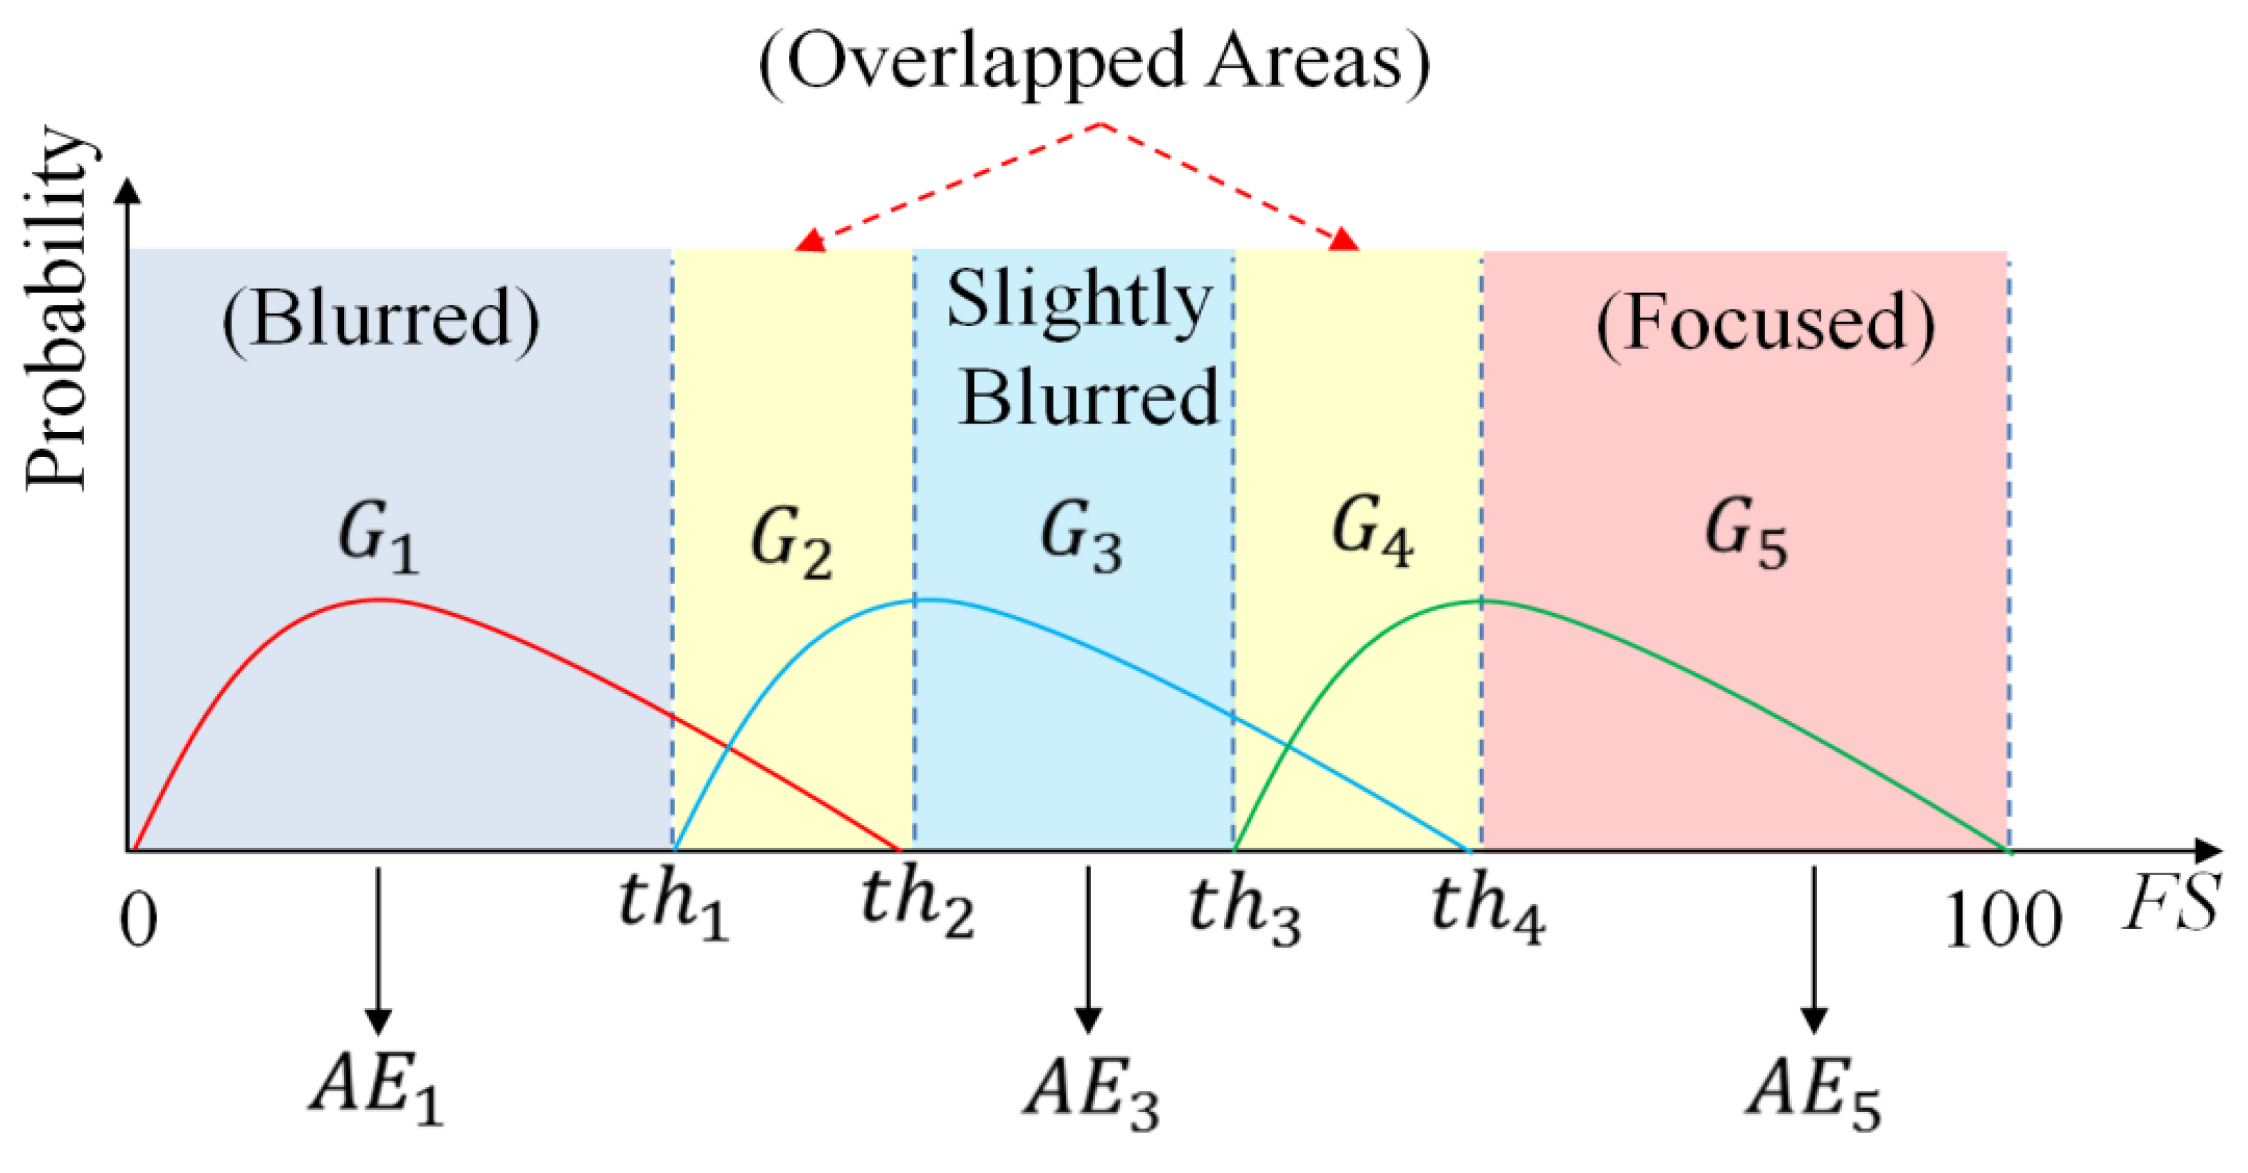
As explained in
Section 2.3, our method uses the age estimator optimized by the corresponding data of each group. Therefore, the misclassification error in
Table 8 can cause an error in age estimation. Therefore, in order to reduce the effects of the misclassified images from
Table 8, we classify the face images into one of the five groups according to blurring degree. Among the five groups in
Figure 5, the two groups called
G2 and
G4 are the overlapped groups. If the images are determined as belonging to the overlapped groups
G2 and
G4, the age of the face image is obtained by combining the two estimated ages by the age estimators of the two neighboring groups. For example, if the FS of an image belongs to
G4, the final age of the face image is obtained by combining the two estimated ages from the two age estimators
AE3 and
AE5. We performed the classification into one of the five groups with the testing database, and the results are listed in
Table 9. Because two images in DB3 failed for face detection as a result of excessive blurring, the total number of images in the testing database is 1732 (instead of 1734 images as shown in
Table 4). In the experiment indicated in
Table 9, the entire data for DB1, DB2, and DB3 are used.
Table 9.
Classification results of the images placed into one of the five groups according to blurring degree and considering overlapped groups.
Table 9.
Classification results of the images placed into one of the five groups according to blurring degree and considering overlapped groups.
| Number of Images | G1 | G2 | G3 | G4 | G5 | Total |
|---|
| Testing Database 1 | 660 | 348 | 108 | 61 | 555 | 1732 |
| Testing Database 2 | 656 | 359 | 95 | 69 | 553 | 1732 |
For the images in the three groups, including
G1,
G3, and
G5 of
Figure 5, age is estimated directly using the age estimators
AE1,
AE3, and
AE5, respectively. For the images in the other two groups,
G2 and
G4, because we employed two neighborhood age estimators to estimate the age, the final estimated age of the image is obtained by the combination of the two estimated ages.
For our experiments, we compare the accuracies of age estimation using three different combination methods, including MIN, MAX, and SUM rule. In details, suppose that using the two neighboring age estimators, we obtain the estimated age of a face image in group
G2 (or
G4) as
Age1 and
Age2. The MIN rule indicates that the combined age is produced by taking the minimum value of the two estimated ages. Similarly, the MAX rule takes the maximum value of two estimated ages as the combined age. Finally, the age estimated by the SUM rule is calculated by the average value of the two age values. The formula for these rules can be expressed in Equations (13) to (15) as follows:
The experiment results of these experiments are provided in
Table 10,
Table 11 and
Table 12. As indicated in these tables, the best estimation performance is obtained using the SUM rule, and the estimated MAE with the entire database (DB1, DB2, and DB3) is 6.91 years. If no error occurs in the blurred image classification steps, MAE for the age estimation system is 6.845 years, as indicated in
Table 7. However, in real systems, errors can occur. Therefore, the performance of the age estimation system can degrade. From the two estimation results, we can see that, although some errors occurred during the blurred image classification step, the performance of the age estimation system is reduced slightly (6.91 years
versus 6.845 years). Compared with the results of the previous methods listed in
Table 6, we can conclude that our method is more efficient at making age estimation systems robust to blurring effects, compared with previous methods [
14,
16].
Table 10.
Performance of our method using MIN rule on G2 and G4 groups (unit: years).
Table 10.
Performance of our method using MIN rule on G2 and G4 groups (unit: years).
| MAE | G1 | G2 | G3 | G4 | G5 |
|---|
| Testing Database 1 | 7.423 | 8.620 | 6.083 | 6.459 | 6.083 |
| Testing Database 2 | 7.206 | 8.652 | 6.400 | 5.797 | 6.452 |
| Average | 7.315 | 8.636 | 6.231 | 6.108 | 6.267 |
| Average MAE with the Entire Database | 7.141 |
Table 11.
Performance of our method using MAX rule on G2 and G4 groups (unit: years).
Table 11.
Performance of our method using MAX rule on G2 and G4 groups (unit: years).
| MAE | G1 | G2 | G3 | G4 | G5 |
|---|
| Testing Database 1 | 7.423 | 7.704 | 6.083 | 13.279 | 6.083 |
| Testing Database 2 | 7.206 | 7.903 | 6.400 | 11.957 | 6.452 |
| Average | 7.315 | 7.805 | 6.231 | 12.577 | 6.267 |
| Average MAE with the Entire Database | 7.214 |
Table 12.
Performance of our method using SUM rule on G2 and G4 groups (unit: years).
Table 12.
Performance of our method using SUM rule on G2 and G4 groups (unit: years).
| MAE | G1 | G2 | G3 | G4 | G5 |
|---|
| Testing Database 1 | 7.423 | 7.319 | 6.083 | 8.574 | 6.083 |
| Testing Database 2 | 7.206 | 6.797 | 6.400 | 8.580 | 6.452 |
| Average | 7.315 | 7.054 | 6.231 | 8.577 | 6.267 |
| Average MAE with the Entire Database | 6.91 |
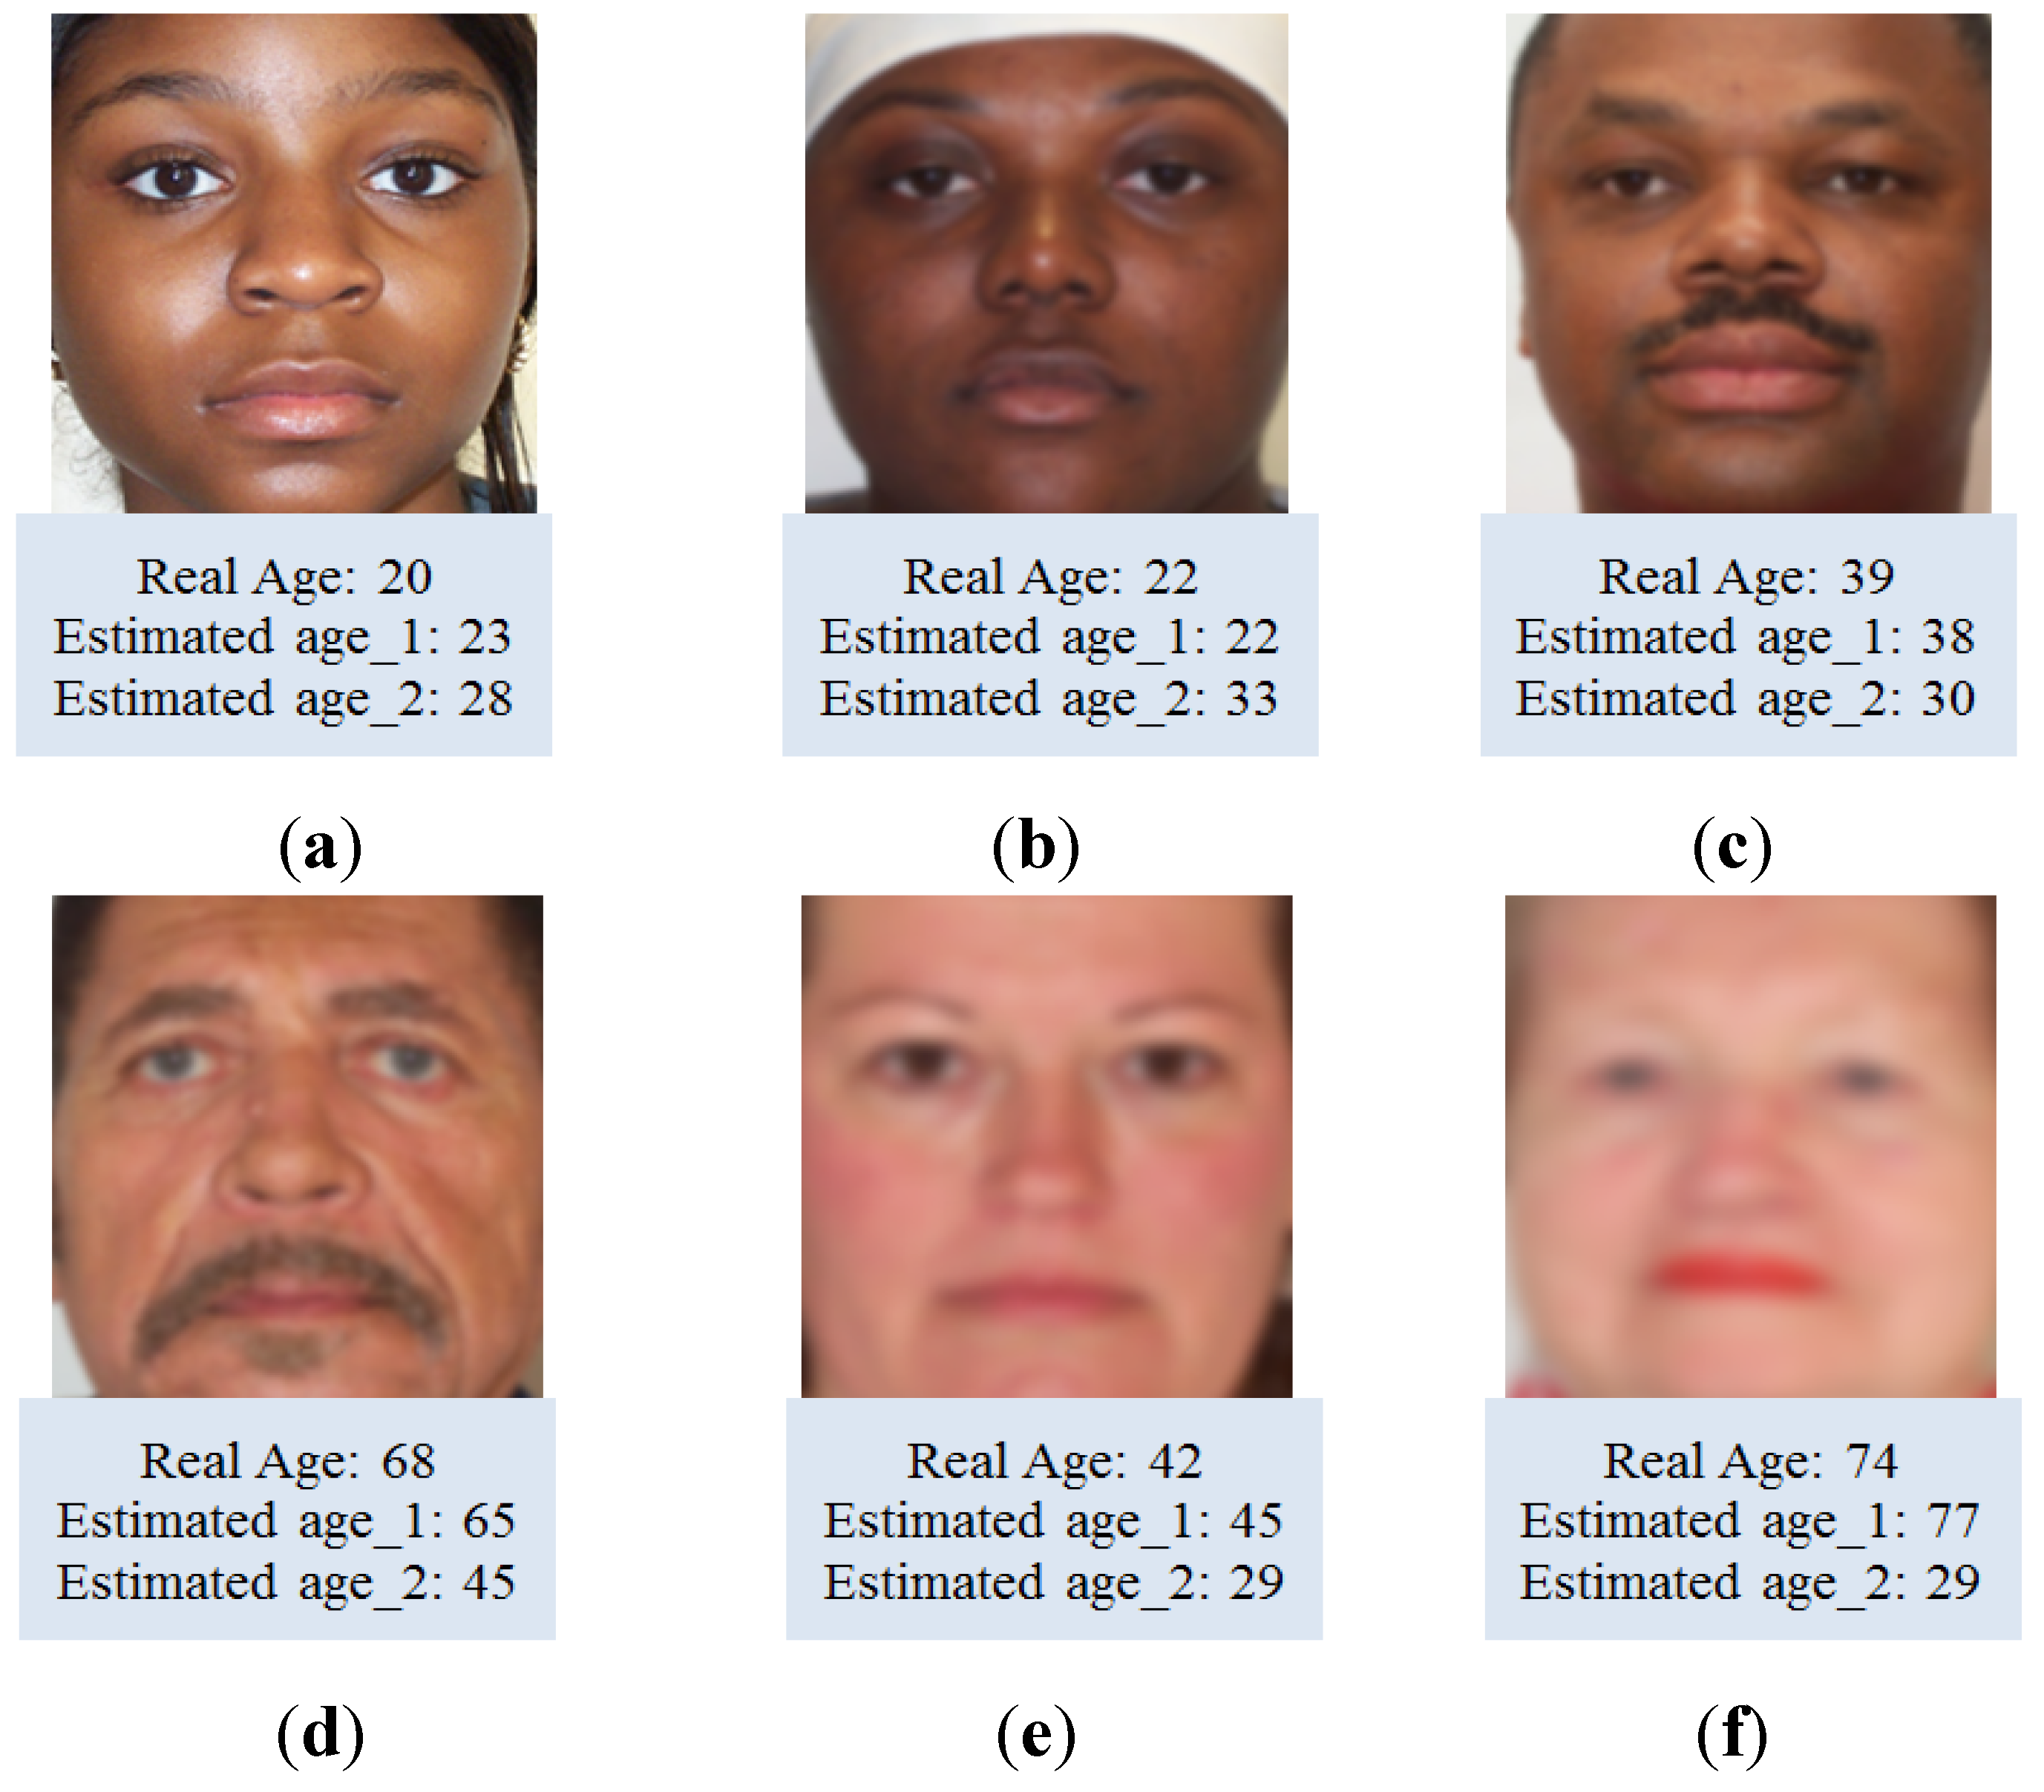
In
Figure 13, we show some examples of the age estimation results obtained through the proposed and previous methods [
14]. In these examples, “Estimated age _1” and “Estimated age_2” indicate the ages estimated using the proposed and previous methods [
14], respectively. The estimation error is smaller with the system that uses our method. It can be observed from these examples that, although the images are focused (
Figure 13a), slightly blurred (
Figure 13b,c), or significantly blurred (
Figure 13d–f), the estimation results through our method are still good. Therefore, we can conclude that our method is efficient for estimating age of human in images at different blurring degrees.
Figure 13.
Comparisons of age estimation results with the proposed (using SUM rule) and previous methods [
14].
Figure 13.
Comparisons of age estimation results with the proposed (using SUM rule) and previous methods [
14].
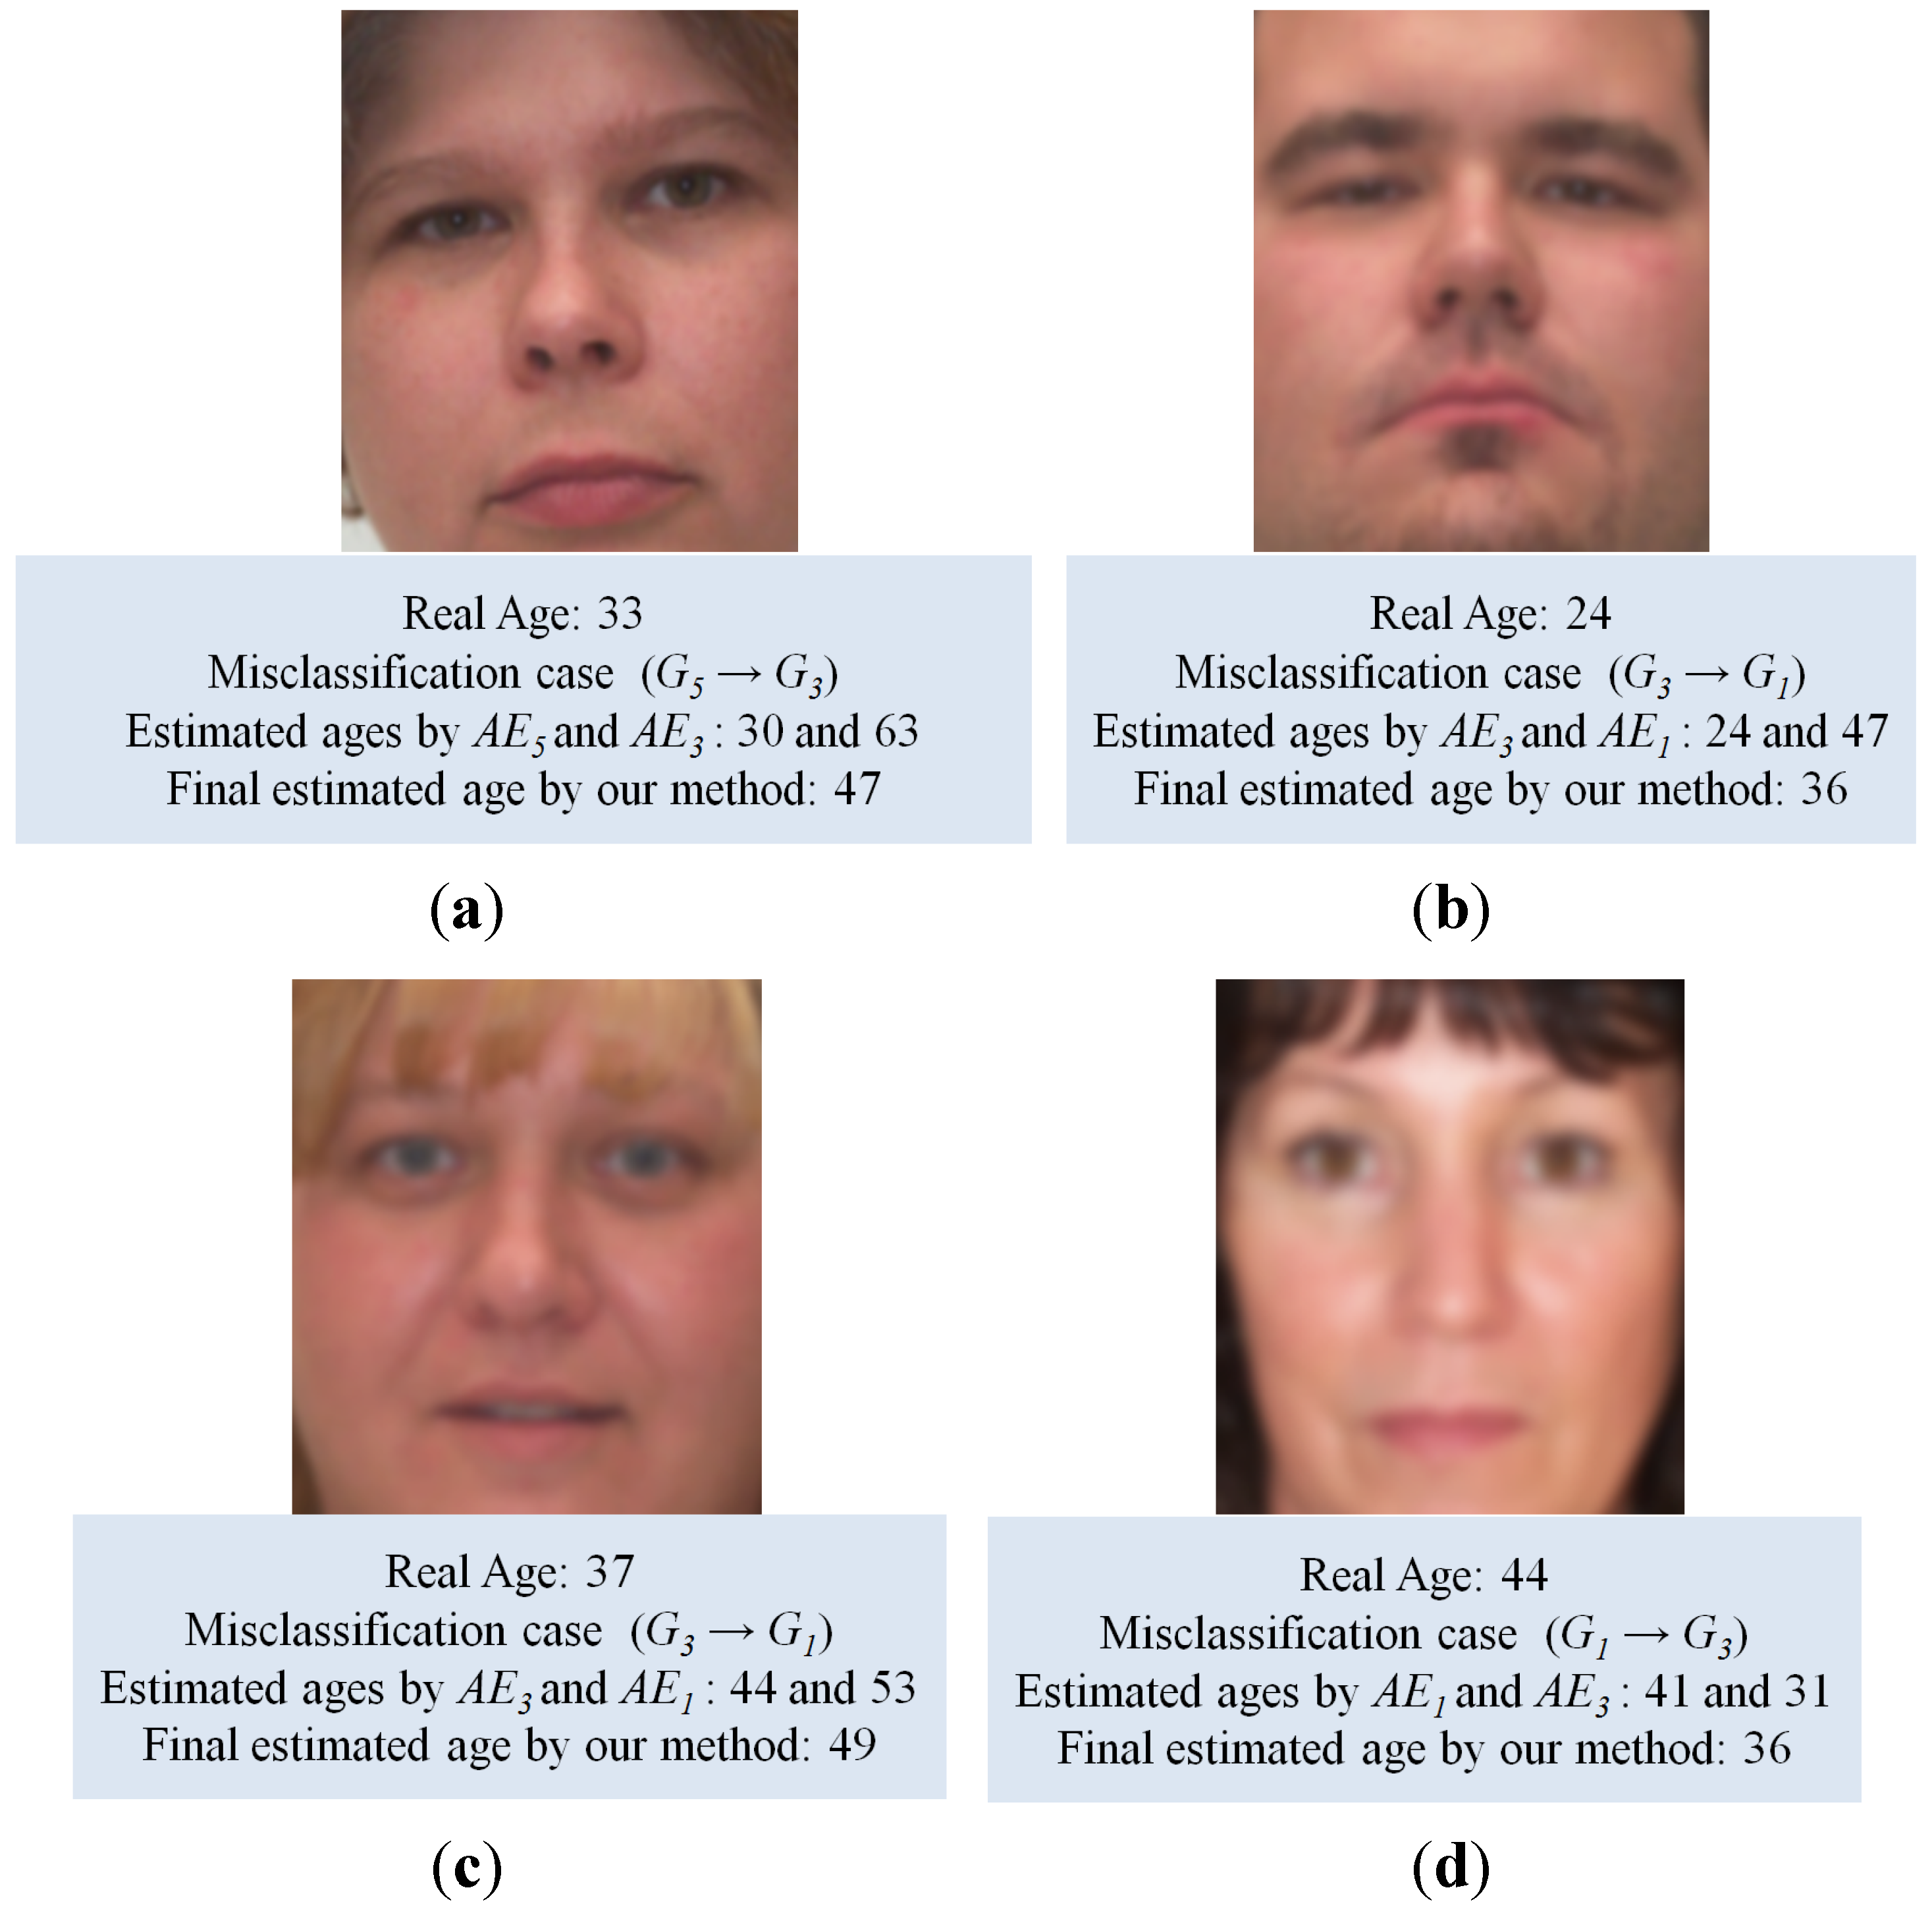
In
Figure 14, we show some examples of age estimation results of images which are incorrectly classified into one of the blurring group (
G1, …,
G5 of
Figure 5) using FS. As shown in
Figure 14a–d, the misclassification of images into one of the blurring group causes the significantly errors on estimation results. For example of
Figure 14a, because it is misclassified into
G3 of
Figure 5, the estimated age by
AE3 becomes 63, and the error between the real and estimated ages is large as 30 (63–33). However, by using our method considering the overlapped area of
Figure 5, the final estimated age comes to 47 based on the SUM rule of Equation (15) with two estimated ages by
AE5 (30) and
AE3 (63), and the consequent error of the age estimation is reduced as 14 (47–33). Like the
Figure 14a, in other cases of
Figure 14b–d, we can reduce the error of the age estimation caused by the misclassification of images into one of the blurring group based on our method. In addition, through these examples, we can find that the blurring effect has significantly effects on age estimation.
Figure 14.
Examples of age estimation results with misclassification of blurring group, and the accuracy enhancement by our method with these error cases: misclassification of (a) G5 → G3; (b,c) G3 → G1; and (d) G1 → G3.
Figure 14.
Examples of age estimation results with misclassification of blurring group, and the accuracy enhancement by our method with these error cases: misclassification of (a) G5 → G3; (b,c) G3 → G1; and (d) G1 → G3.
As the next experiments, we repeat the experiments using another dataset. For this purpose, we use the MORPH database in the new experiments [
45]. The MORPH database (album 2) contains 55,134 facial images of 13,617 individuals. From this database, we randomly select 1000 images at different ages, genders and individuals for our new experiments. The description of the selected database is given in
Table 13. Totally, we perform experiments using 6000 images (1000 original focused images and 5000 optical blurring images), including 3000 images for training and 3000 images for testing. We repeat the experiments twice to perform two-fold cross-validation scheme. Like the previous experiments on PAL database, we divide the optical blurring into three sub-databases, including focused database (DB4), slightly database (DB5) and blurred database (DB6) as shown in
Table 13. The detail experiment results of the new experiments are shown from
Table 14,
Table 15,
Table 16,
Table 17,
Table 18,
Table 19 and
Table 20. As shown in
Table 14, without optical blurring effects, the estimation performance (MAE) using the MORPH database is about 6.254 years. In
Table 15, by presenting the optical blurring on face images, the MAE becomes to 9.026 years that is much higher than 6.254 years in system without optical blurring effects. This result, one again, confirms that the optical blurring has very strong effects on age estimation system. By using our proposed method, the MAE is reduced from 9.026 years to 6.607 years using SUM rule, as shown in
Table 20, which is similar to that (6.91) with PAL database in
Table 12. From this result, we can conclude that our proposed method is sufficient for age estimation system robust to optical blurring effects. In addition,
Table 16 gives the classification results of blurred images into three groups of focused, slightly blurred and blurred group. On average, we obtain the classification accuracy of 97.217%, which is similar to that (97.69%) with PAL database in
Table 8.
These results show that the performances by our method are less affected by the kinds of databases.
Table 13.
Description of the selected database.
Table 13.
Description of the selected database.
| Database | Focused Database (DB4) | Slightly Blurred Database (DB5) | Blurred Database (DB6) | Total Number of Images |
|---|
| Learning/Testing (Database Part 1) | 1000/1000 | 500/500 | 1500/1500 | 3000/3000 |
| Learning/Testing (Database Part 2) | 1000/1000 | 500/500 | 1500/1500 | 3000/3000 |
Table 14.
Estimation performance using original selected database (unit: years old).
Table 14.
Estimation performance using original selected database (unit: years old).
| Testing Database 1 | Testing Database 2 | Average MAE |
|---|
| 6.162 | 6.346 | 6.254 |
Table 15.
Comparisons of the performance (MAE) of previous age estimation system with the blurred images (unit: years).
Table 15.
Comparisons of the performance (MAE) of previous age estimation system with the blurred images (unit: years).
| MAE | Original Selected Database (σ = 0) | Focused Database (σ = 0,1) | Slightly Blurred Database (σ = 2) | Blurred Database (σ = 3,4,5) |
|---|
| Testing Database 1 | 6.162 | 6.621 | 8.600 | 10.577 |
| Testing Database 2 | 6.346 | 6.757 | 8.882 | 10.781 |
| Average MAE | 6.254 | 6.689 | 8.741 | 10.679 |
| 9.026 |
Table 16.
Classification results when classifying the input images into one of three groups according to blurring degree for testing databases.
Table 16.
Classification results when classifying the input images into one of three groups according to blurring degree for testing databases.
| Number of Images (Classification Rate) | Correct Classification | Incorrect Classification |
|---|
| DB4 → DB5 | DB5 → DB4 | DB4 → DB6 | DB6 → DB4 | DB5 → DB6 | DB6 → DB5 |
|---|
| DB4 | Testing Database 1 | 979 (97.9%) | 21 (2.1%) | – | 0 (0.0%) | – | – | – |
| Testing Database 2 | 982 (98.2%) | 18 (1.8%) | – | 0 (0.0%) | – | – | – |
| DB5 | Testing Database 1 | 443 (88.6%) | – | 35 (7.0%) | – | – | 22 (4.4%) | – |
| Testing Database 2 | 450 (90.0%) | – | 29 (5.8%) | – | – | 21 (4.2%) | – |
| DB6 | Testing Database 1 | 1488 (99.2%) | – | – | – | 0 (0.0%) | – | 12 (0.8%) |
| Testing Database 2 | 1491 (99.4%) | – | – | – | 0 (0.0%) | – | 9 (0.6%) |
Table 17.
Classification results of the images placed into one of five groups according to blurring degree and considering overlapped groups.
Table 17.
Classification results of the images placed into one of five groups according to blurring degree and considering overlapped groups.
| Number of Images | G1 | G2 | G3 | G4 | G5 | Total Number of Images |
|---|
| Testing Database 1 | 1361 | 165 | 332 | 199 | 943 | 3000 |
| Testing Database 2 | 1360 | 164 | 330 | 204 | 942 | 3000 |
Table 18.
Performance of our proposed method using MIN rule on G2 and G4 groups (unit: years).
Table 18.
Performance of our proposed method using MIN rule on G2 and G4 groups (unit: years).
| MAE | G1 | G2 | G3 | G4 | G5 |
|---|
| Testing Database 1 | 7.182 | 7.079 | 6.557 | 6.744 | 6.098 |
| Testing Database 2 | 6.865 | 6.829 | 6.427 | 7.025 | 6.088 |
| Average | 7.024 | 6.954 | 6.492 | 6.886 | 6.093 |
| Average MAE with the Entire Database | 6.660 |
Table 19.
Performance of our proposed method using MAX rule on G2 and G4 groups (unit: years).
Table 19.
Performance of our proposed method using MAX rule on G2 and G4 groups (unit: years).
| MAE | G1 | G2 | G3 | G4 | G5 |
|---|
| Testing Database 1 | 7.182 | 6.824 | 6.557 | 7.015 | 6.098 |
| Testing Database 2 | 6.865 | 6.927 | 6.427 | 6.990 | 6.088 |
| Average | 7.024 | 6.875 | 6.492 | 7.002 | 6.093 |
| Average MAE with the Entire Database | 6.663 |
Table 20.
Performance of our proposed method using SUM rule on G2 and G4 groups (unit: years).
Table 20.
Performance of our proposed method using SUM rule on G2 and G4 groups (unit: years).
| MAE | G1 | G2 | G3 | G4 | G5 |
|---|
| Testing Database 1 | 7.182 | 6.552 | 6.557 | 6.302 | 6.098 |
| Testing Database 2 | 6.865 | 6.634 | 6.427 | 6.485 | 6.088 |
| Average | 7.024 | 6.593 | 6.492 | 6.395 | 6.093 |
| Average MAE with the Entire Database | 6.607 |
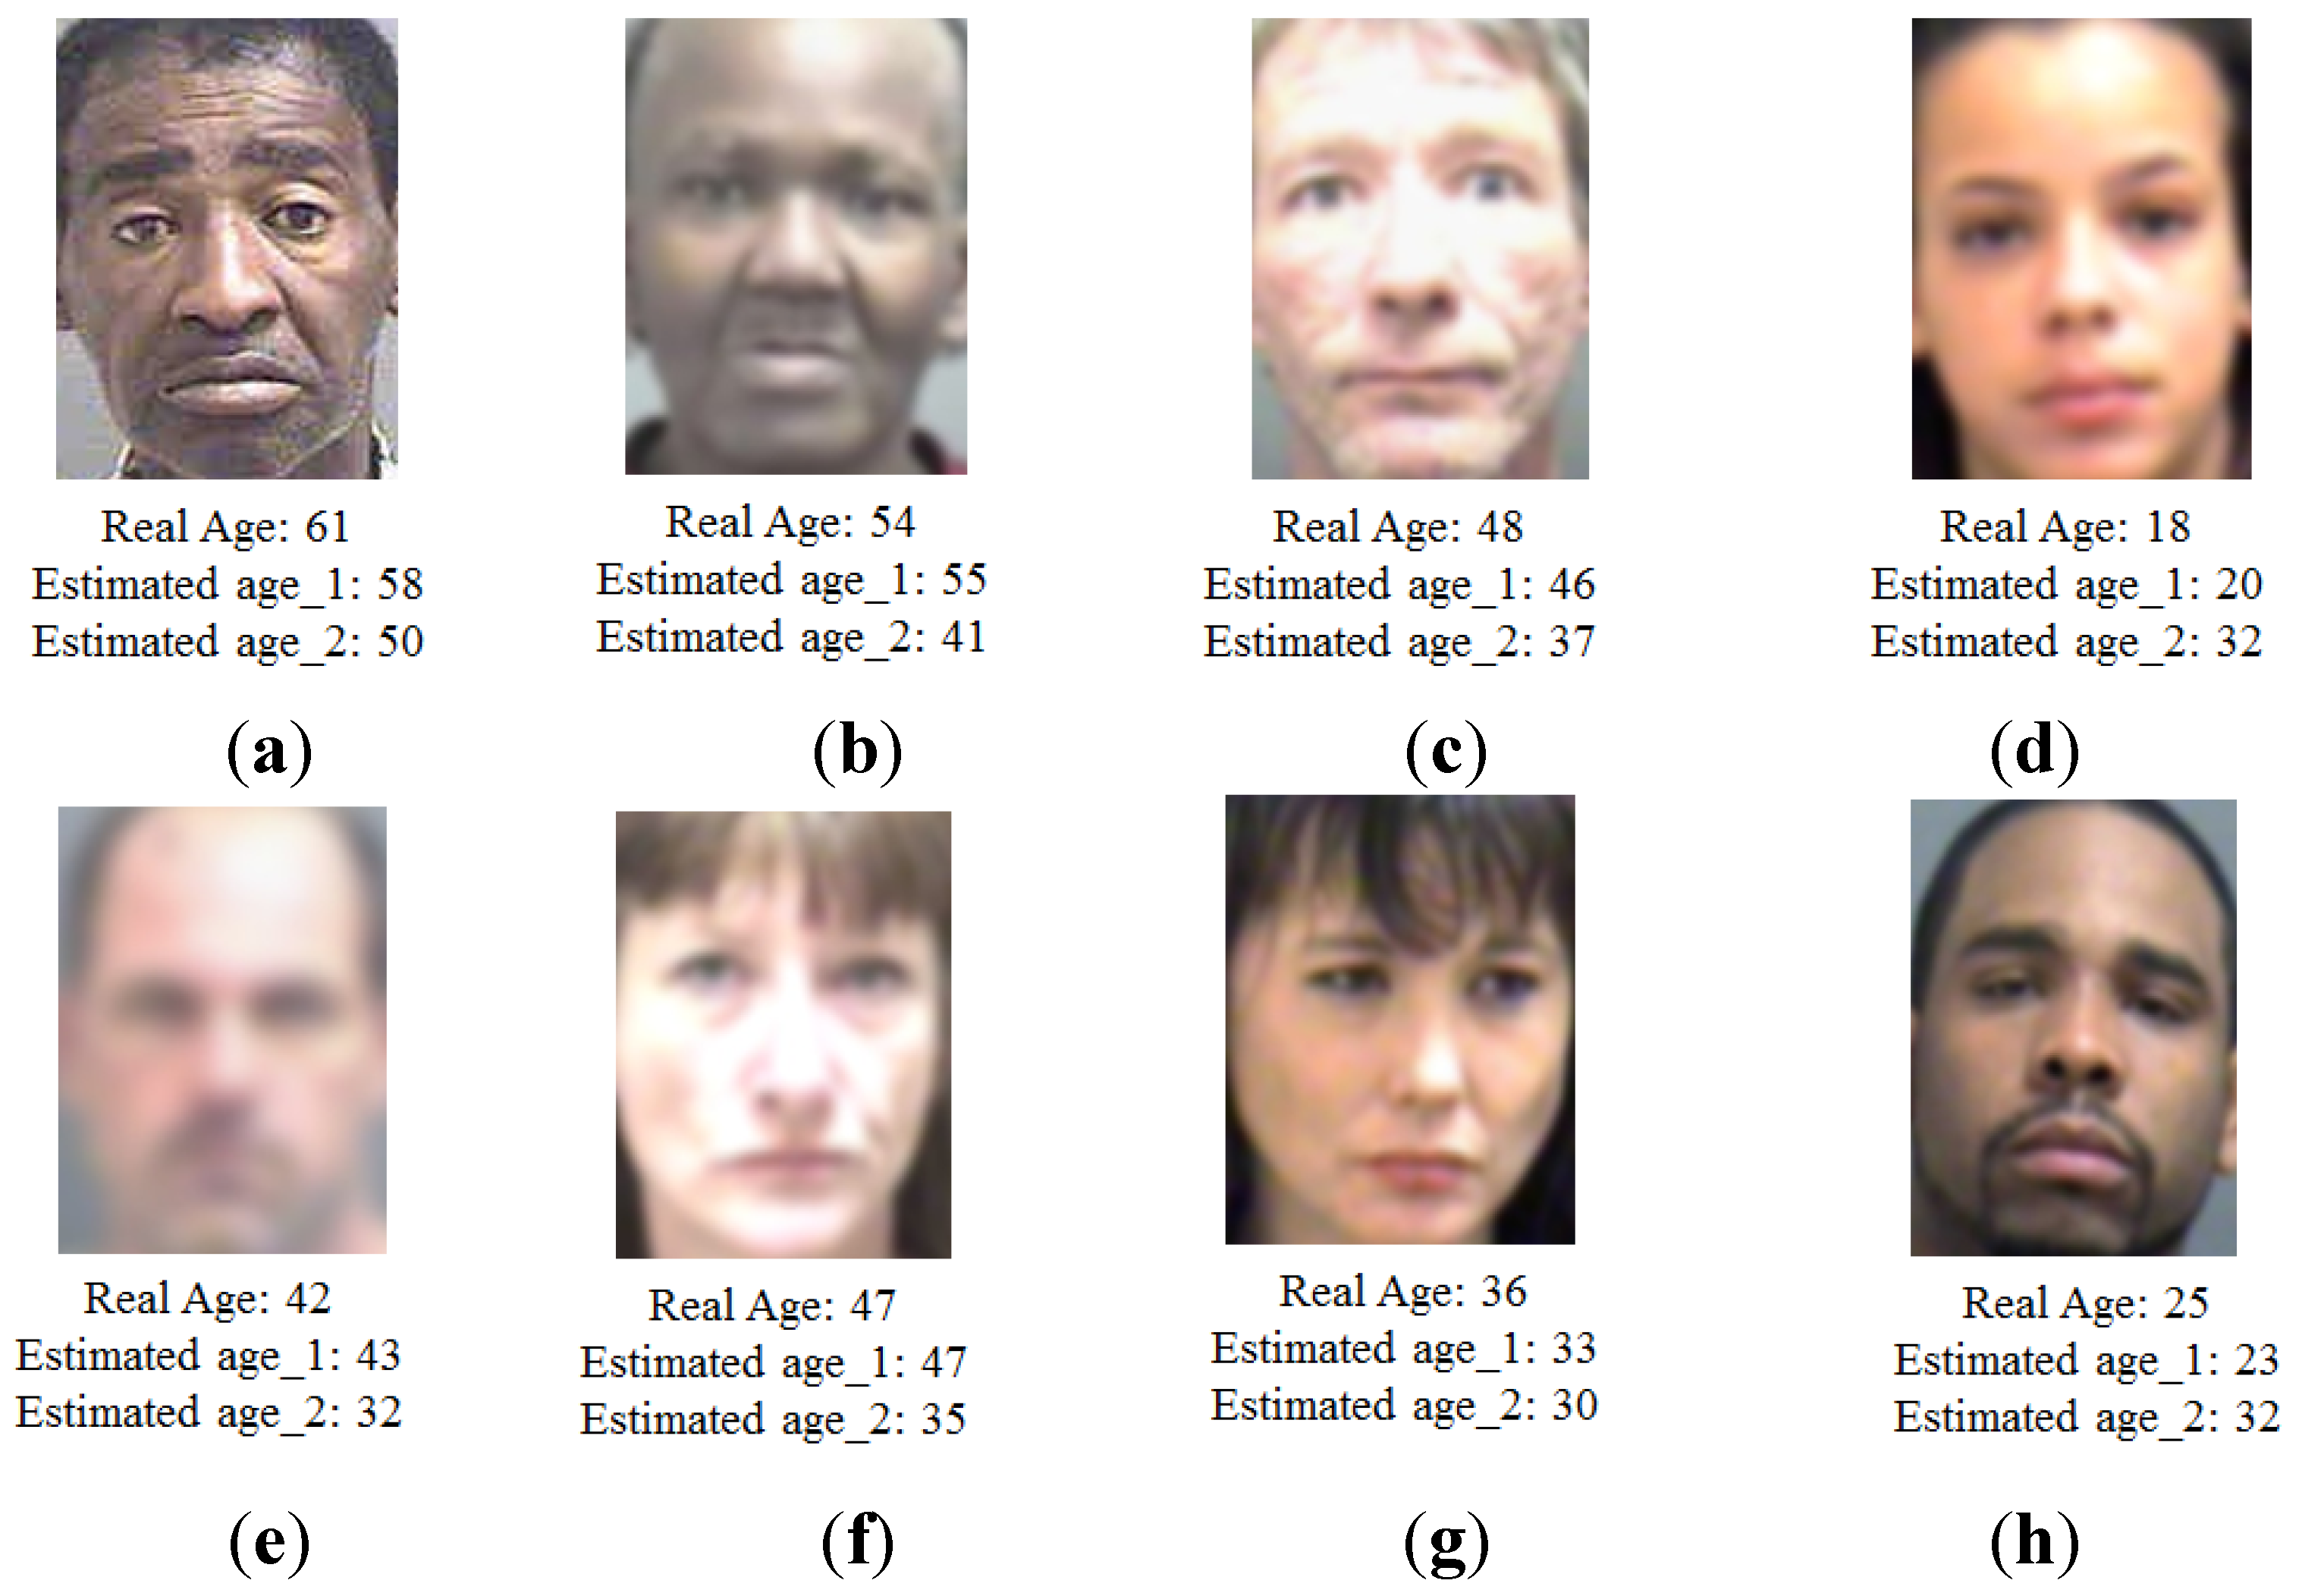
We show some examples estimation results with MORPH database in the
Figure 15. Similar to
Figure 13, our proposed method produces the better estimation result compared to previous method [
14]. In this figure, “Estimated age_1” and “Estimated age_2” indicate the ages estimated using the proposed and previous methods [
14], respectively. In addition,
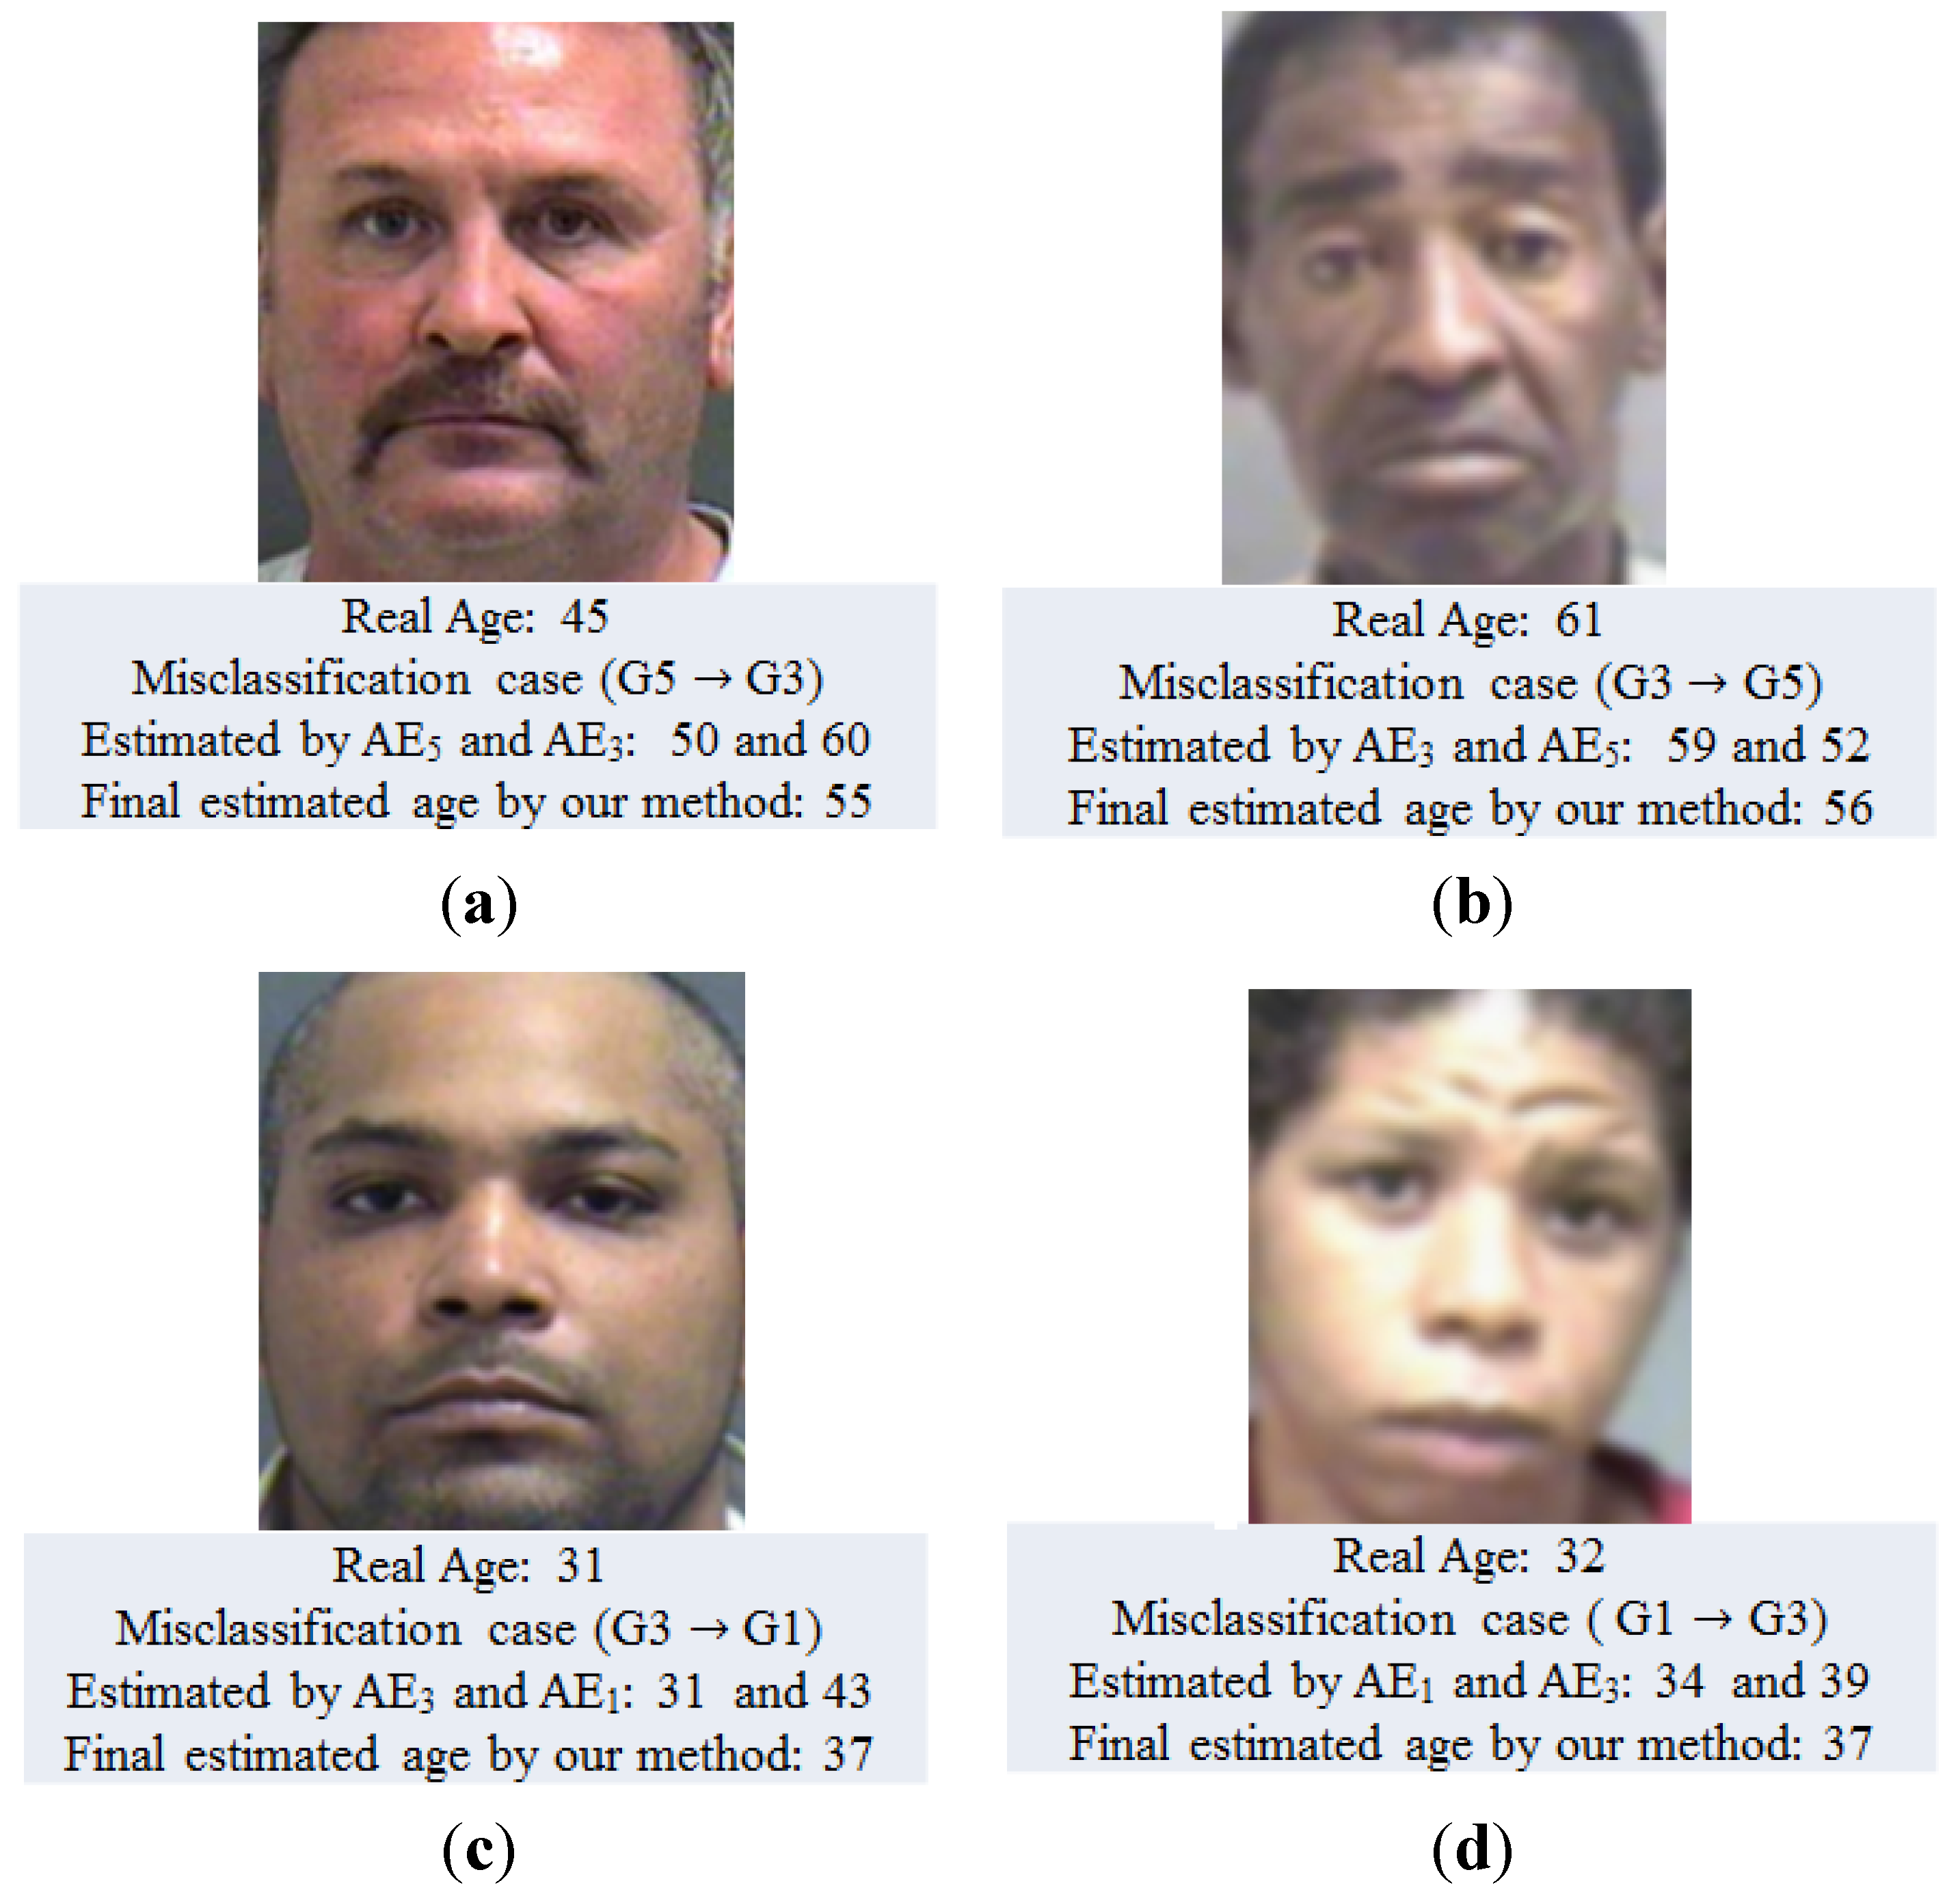
Figure 16 shows some examples of estimation results of images in overlapped area (G
2 and G
4). By taking the average estimation results of two neighbor groups, the final estimation results of images in overlapped areas are enhanced compared to estimation results of system without considering the overlapped areas.
Finally, in order to confirm the effects of optical blurring on age estimation systems, we performed additional experiments using an open age estimation program, called OpenBR [
46]. For this purpose, we used all the blurred images of PAL database with the sigma value of Gaussian blurring kernel from 1 to 5, as shown
Table 4. The consequent experiment results of these experiments are given by
Table 21. As shown in the table, the average MAE using the OpenBR-age-estimation method was about 14.35 years. Compared to our method, which produced MAE of 6.91 years (
Table 12), we can conclude that our method outperforms the OpenBR-age-estimation method on age estimation problem. In addition, the MAEs in
Table 21 are increased according to the degree of optical blurring (the sigma value of Gaussian blurring). This result demonstrates that the optical blurring has strong effects on the age estimation system.
Figure 15.
Comparisons of age estimation results with the proposed (using SUM rule) and previous method [
14] using MORPH database.
Figure 15.
Comparisons of age estimation results with the proposed (using SUM rule) and previous method [
14] using MORPH database.
Figure 16.
Examples of age estimation results with misclassification of blurring group, and the accuracy enhancement by our method with these error cases: misclassification of (a) G5 → G3; (b) G3 → G5; (c) G3 → G1; and (d) G1 → G3.
Figure 16.
Examples of age estimation results with misclassification of blurring group, and the accuracy enhancement by our method with these error cases: misclassification of (a) G5 → G3; (b) G3 → G5; (c) G3 → G1; and (d) G1 → G3.
Table 21.
The estimation result (MAE) of OpenBR-age-estimation method using blurred PAL database (unit: years).
Table 21.
The estimation result (MAE) of OpenBR-age-estimation method using blurred PAL database (unit: years).
| MAE | Blurred Images with Sigma of 1 | Blurred Images with Sigma of 2 | Blurred Images with Sigma of 3 | Blurred Images with Sigma of 4 | Blurred Images with Sigma of 5 |
|---|
| Testing Database 1 | 13.92 | 14.04 | 14.18 | 14.48 | 14.76 |
| Testing Database 2 | 13.89 | 14.26 | 14.35 | 14.68 | 14.87 |
| Average MAE | 13.91 | 14.15 | 14.27 | 14.58 | 14.82 |
| 14.35 |
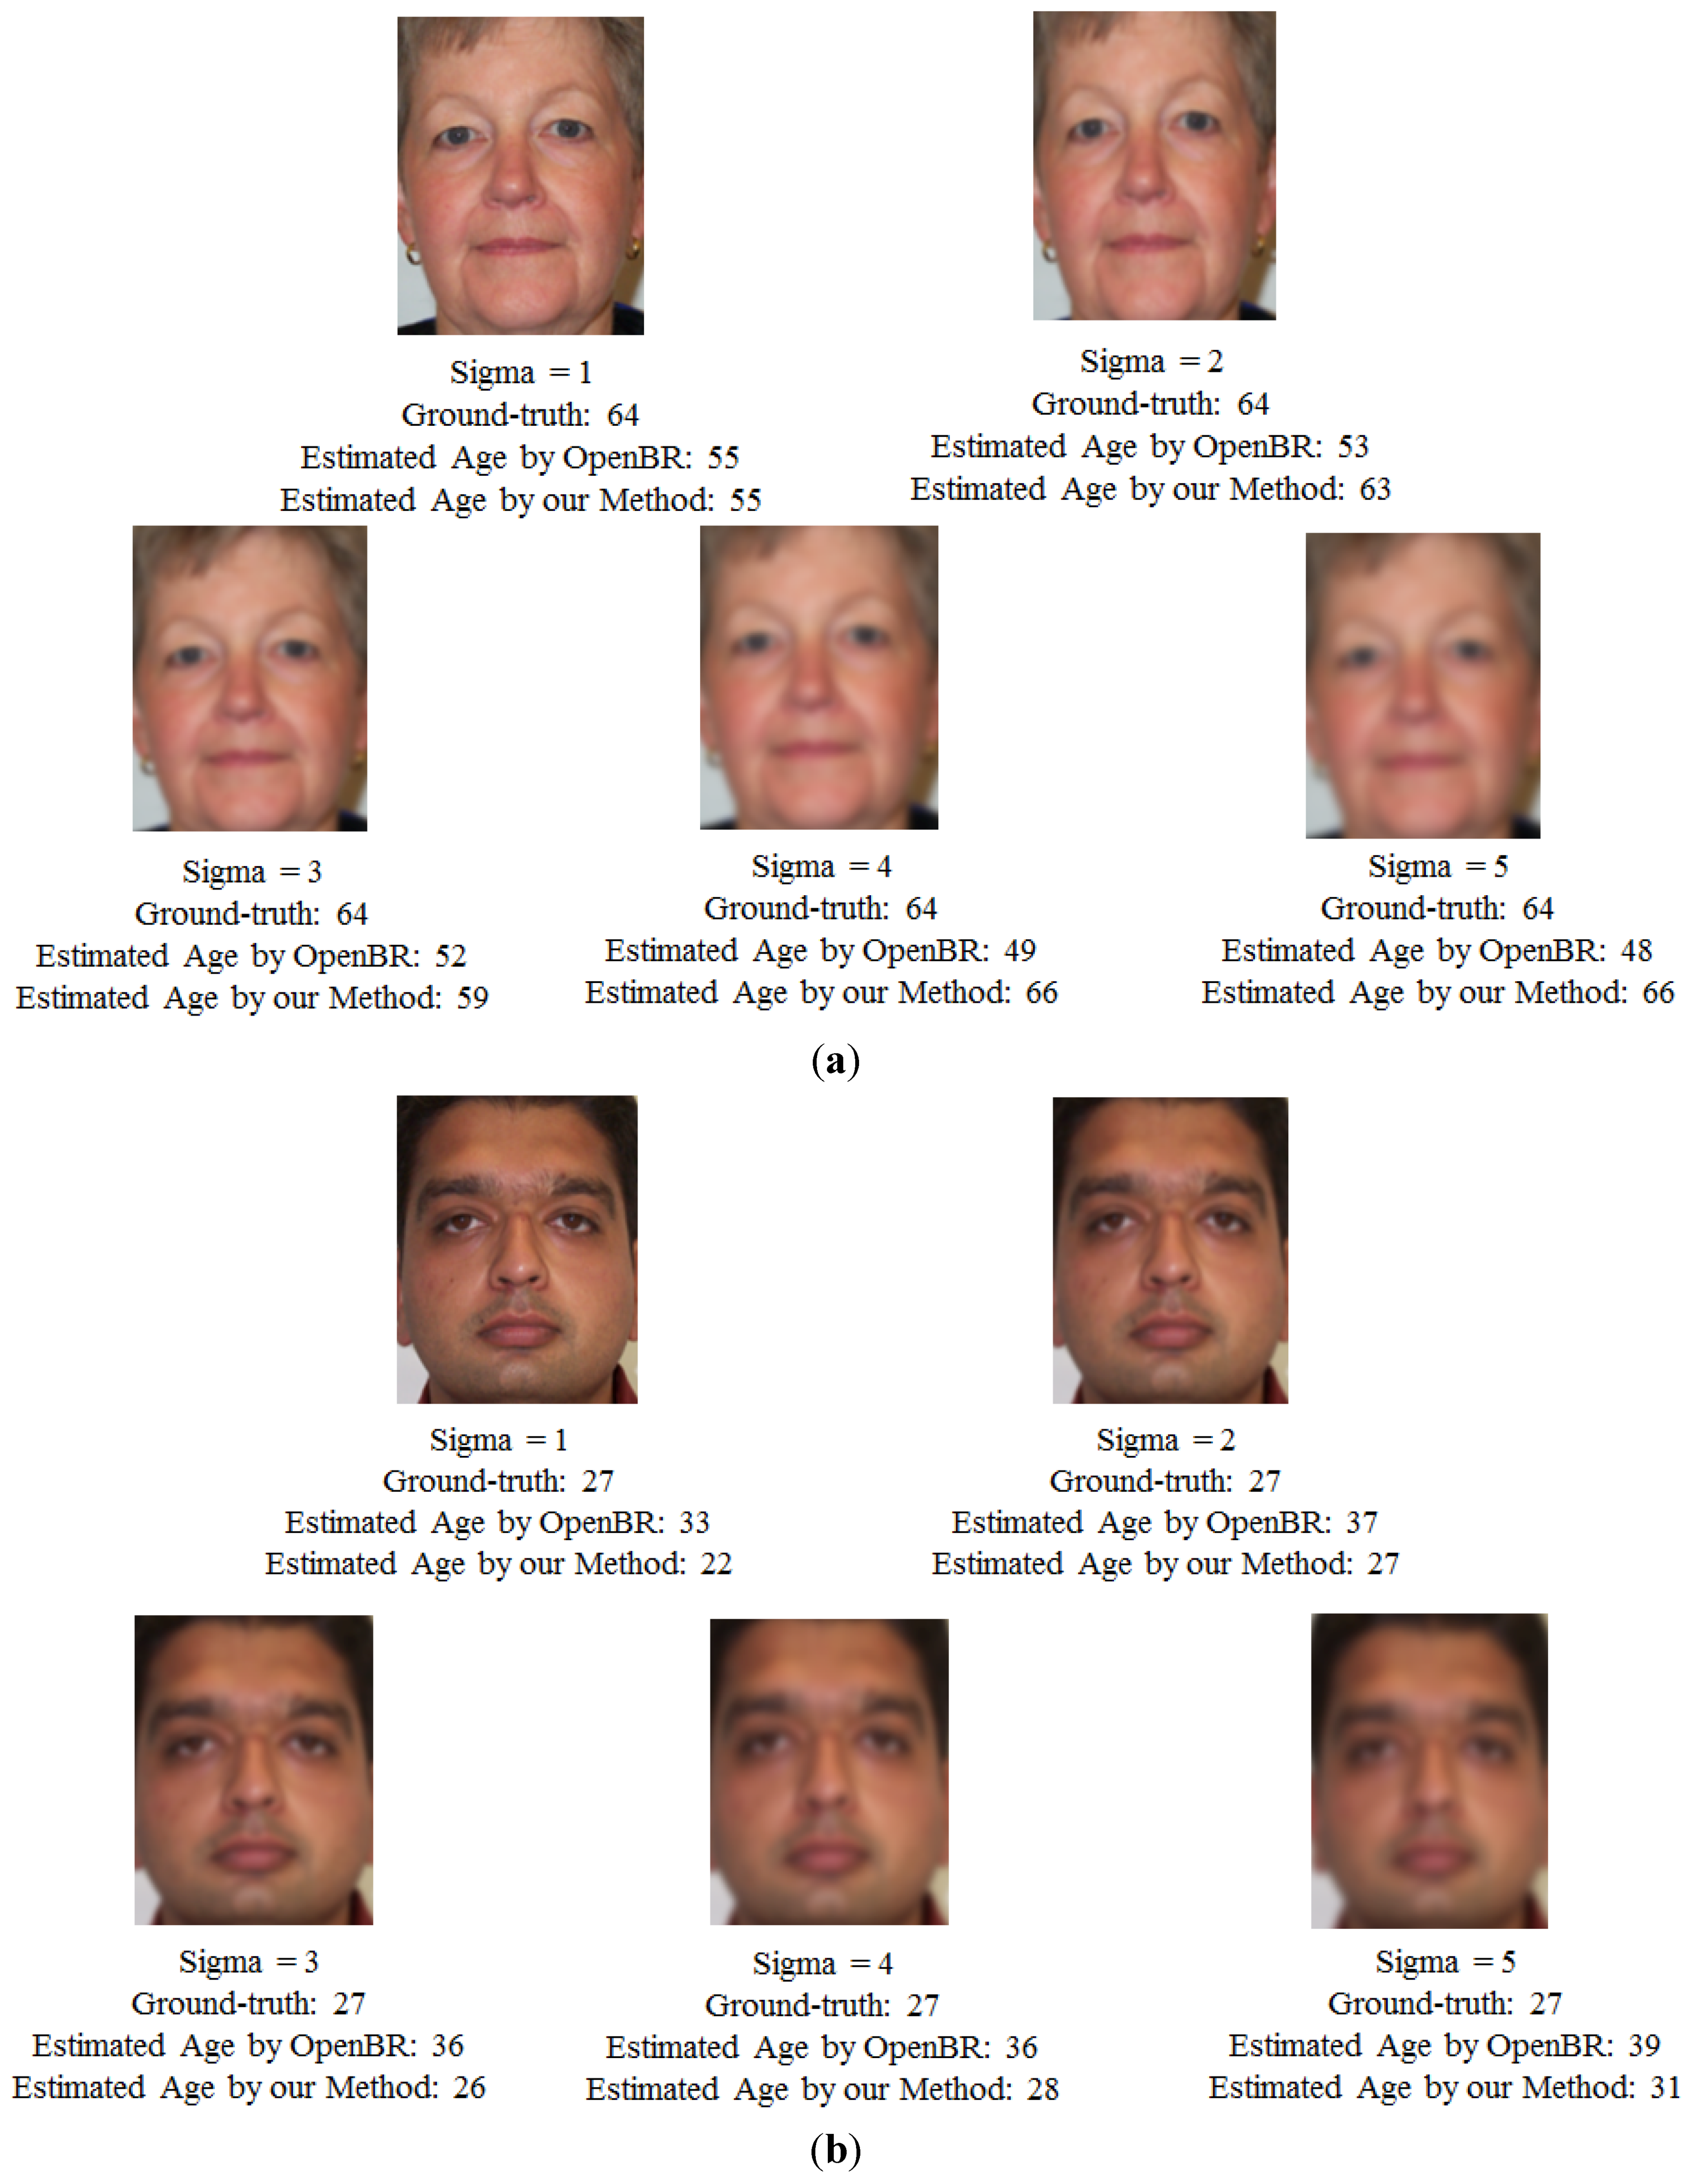
In
Figure 17, we show some estimation results using our proposed method and OpenBR-age-estimation method. As shown in the figure, the estimated ages by our proposed method is closer to the ground-truth age than those by OpenBR method. The reason why our method outperforms the OpenBR-age-estimation system is that our proposed method assesses the blurring degree before performing the estimation step. Consequently, an appropriate age estimator is used for age estimation instead of using a global age estimator for all input images.
Figure 17.
Comparison of estimation results using OpenBR-age-estimation method and our proposed method using optical blurring images: (a) the estimation results of a female at the age of 64 with different values of optical blurring degree (sigma value of Gaussian kernel); and (b) the estimation results of a male at the age of 27 with different values of optical blurring degree.


