
Evaluating Polishability of Zirconia Impregnated PMMA Nanocomposite for Denture Base Application
by
 , , ,
, , ,
Saleh Zidan
1,2,*, 
Nikolaos Silikas
2,
Julfikar Haider
2,3 ,
,
Javad Jahantigh
2,
Ahmed Alhareb
4 and
Julian Yates
2 1
Department of Dental Materials, Faculty of Dentistry, Sebha University, Sebha 18758, Libya
2
Division of Dentistry, School of Medical Sciences, Faculty of Biology, Medicine and Health, University of Manchester, Manchester M13 9PL, UK
3
Department of Engineering, Manchester Metropolitan University, Manchester M1 5GD, UK
4
Department of Dental Material, Faculty of Medical Technology, Elmergib University, Elmergib 40414, Libya
*
Author to whom correspondence should be addressed.
Symmetry 2021, 13(6), 976; https://doi.org/10.3390/sym13060976
Submission received: 23 April 2021
/
Revised: 12 May 2021
/
Accepted: 21 May 2021
/
Published: 31 May 2021
(This article belongs to the Section Life Sciences)
Abstract
:Artificial biomaterials are being developed for use in denture base with symmetrical properties to restore the aesthetics and functionalities. The rough surface of denture base resin promotes the adhesion of microorganisms and plaque accumulation. This study aimed to explore the consequences of polishing times on the surface roughness of high-impact (HI) heat-polymerized PMMA denture base acrylic resin reinforced with zirconia nanoparticles (nanocomposite). Thirty specimens (25 ± 0.50 mm in diameter and 2 ± 0.10 mm thickness) were fabricated from HI PMMA by adding zirconia nanoparticles at different concentrations of (0 wt.%, 1.5 wt.%, 3 wt.%, 5 wt.%, 7 wt.%, and 10 wt.%). Specimens were divided into six groups (n = 5) and surface roughness (Ra) was measured before and after polishing with a standard protocol for one and two minutes. The addition of zirconia in PMMA at low concentrations (1.5 wt.%, 3 wt.%, and 5 wt.%) did not negatively affect the surface finish of the denture base composites following conventional polishing and remained below the clinically acceptable limit (0.2 µm). After one minute of polishing, only the 10 wt.% zirconia (0.17 ± 0.03 µm) demonstrated a substantial rise in median surface roughness, in comparison with the control group (0.11 ± 0.01 µm). It is concluded that the group containing 3 wt.% (0.10 ± 0.01 µm) of zirconia is the optimum concentration to obtain the best symmetrical surface finish after two minutes of polishing.
1. Introduction
Polymethyl methacrylate (PMMA) has found wider acceptance as the most common denture base material [1,2,3,4,5,6,7]. In recent years, acrylics such as PMMA modified with certain fillers (including rubber) have shown improved strength [8]. They have been successfully used for denture bases, for removable partial or complete dentures [9], implant overdentures, and maxillofacial prosthesis [10], because of the ease of processing [11]. Dentures are used as a replacement for lost tissues or residual alveolar ridges and divert the forces generated by chewing from the denture to residual alveolar ridges [9,10].
A well-polished and smooth surface with symmetrical characteristics is a fundamental requirement for fabricating successful dental prostheses to obtain optimal aesthetics and to maintain good oral hygiene [12]. Surface roughness (Ra) measures microscopic undulations and/or irregularities present on the surface of an object [4]. The Ra values of denture base resins can affect patient satisfaction, staining, and ultimately, aesthetics [13,14]. Several studies have demonstrated that rough denture base surfaces promote the adhesion of plaque and bacteria when compared to a smooth surface [9,15,16,17]. Attachment to roughened surfaces is necessary for the survival of these microorganisms [18] that can cause bacterial and fungal infections [19] as well as caries and periodontal infections [20]. Moreover, these microorganisms can cause respiratory tract infections, particularly among elderly people [21].
The material structure, polishing techniques, reinforcement, polymerization time, and dental hygiene habits of users all affect the denture base Ra [13,14]. Therefore, a denture with symmetrical surface characteristics is vital for maintaining appropriate oral health [1]. A surface finish higher than the acceptable value increases wear rates and plaque formation on the denture [22]. Therefore, effective methods for polishing acrylic resin denture bases should be employed by dental technicians [9]. The initial finishing procedure should include pre-polishing with water and a pumice slurry, followed by a high-shine polishing compound or silicone polishers, and finally with a fine polish using paste or liquid containing fine aluminum oxide particles [9,23]. Various in vivo studies have recommended a maximum surface roughness value of 0.2 µm in order to inhibit plaque accumulation and colonization of microorganisms [6,9,13,14].
Oliveira et al. [24] reported that mechanical polishing was more effective in reducing the surface roughness of PMMA denture bases than the chemical polishing. However, surface roughness was also influenced by dental brushing procedures. Gungor et al. [12] and Kuhar et al. [9] found that conventional laboratory polishing resulted in a smoother denture surface, thereby achieving a higher clinical quality of the dental prostheses, when compared to polishing with chairside polishing kits. Abuzar et al. [25]. demonstrated that the surface of PMMA resin for denture base was smoother than polyamide after polishing with conventional laboratory technique. Some disinfectant solutions have been found to increase the roughness of acrylic resin surfaces after immersion for 7 days [21]. Gad et al. [26] evaluated surface roughness (Ra) of glass-fiber-reinforced PMMA denture base resins using autoclave polymerization and they found that the addition of glass fibers also increased roughness.
The development of nanomaterials has led to significant improvements in dental composites. This technology produces a smoother surface with higher translucency and polishability [27]. Fouda et al. [28] found that the incorporation of nanodiamonds to PMMA significantly decreased surface roughness and the lowest values were found at concentrations between 0.5% and 1.0 wt.%. However, the incorporation of silica and prepolymer nanoparticles (1% and 5 wt.%) to PMMA denture base resin increased surface roughness [29].
In recent years, studies have investigated the physical and mechanical characteristics of nanocomposites made of conventional heat-cured denture base acrylic resin and zirconia nanoparticles. The properties of the nanocomposite are dependent on the nanoparticles incorporated; their concentration, size, shape, distribution, and contact condition with the polymer matrix all affect the resultant material [20]. No information is available in the existing literature with regards to the surface roughness of high-impact (HI) heat-polymerized PMMA after adding zirconia nanoparticles. This study evaluated the effect of polishing times on HI PMMA reinforced with zirconia nanoparticles (0%, 1.5%, 3%, 5%, 7%, and 10 wt.%) in vitro by measuring their surface roughness. The research hypothesis assumed that surface roughness between HI PMMA specimens (control) and HI PMMA zirconia nanocomposites after polishing would not be significantly different. Furthermore, it was assumed that an increase in polishing time (one minute and two minutes) would make no difference in reducing surface roughness.
2. Materials and Methods
2.1. Materials and Preparation of Specimens
Materials used for fabricating high-impact heat-polymerized (HI PMMA)-Zirconia nanocomposite specimens for denture base are presented in Table 1. Silanization of the zirconia nanoparticle surfaces was carried out according to a previously described protocol [30]. In this study, the chosen concentrations of zirconia nanoparticles for the manufacture of specimens were 0.0% (control, G1), 1.5 wt.% (G2), 3.0 wt.% (G3), 5.0 wt.% (G4), 7.0 wt.% (G5), and 10.0 wt.% (G6). The details of mixing raw materials, molding, polymerizing, and shaping of specimens are also presented in a previous study [30].
2.2. Specimen Surface Polishing
Surface roughness was measured before and after polishing. All polishing conformed with the British Standard Specification for denture base polymers (BS EN ISO 1567; 2000) [31]. The dimensions were 25 ± 1.0 mm (diameter) × 2 ± 0.10 mm (thickness). Specimens were polished for one minute; the surface roughness was measured and then polished further for another minute (two minutes in total) to achieve a highly smooth surface. The roughness was then measured again. Thirty specimens were prepared, five for each experimental group.
In order to remove any excess acrylic on the surface, the specimen surface was ground by a diamond bur followed by a tungsten carbide bur (Dental Sky, UK) at 1500 rpm. Surface roughness was then measured. Surface polishing was conducted by a lathe bristle brush at the same speed for one minute in the presence of pumice slurry. During the second stage polishing, a muslin buff wheel was used with a primary polishing compound (Chaperlin & Jacobs Ltd., UK) at the same speed for one minute. However, at the third stage, a muslin buff wheel was used for polishing at a slower speed of 500 rpm with a fine polishing compound (secondary). Before measuring surface roughness, the specimens were cleaned with water and dried. After measurements were taken, the specimens underwent the polishing cycle a second time and the final measurement was taken. Figure 1 shows the specimens from different groups after polishing for two minutes.
2.3. Surface Roughness Measurements
Ra measurement for all the specimen groups was conducted by using a non-contact high-resolution measurement profilometer (Talysurf CLI 1000, Ametek Taylor Hobson Precision, Leicester, UK) (Figure 2). Before measuring the Ra, the specimen was placed over a flat surface above the cross-slides of the instrument and scanned by applying a beam of white light through a lens with a chromatic length aberration (CLA 300 µm gauge) focusing on the area of surface measured (1 × 1 mm) with 0.25 mm cut-off length. The mode of measurement was bi-directional with a sampling rate of 500 Hz and a maximum spacing of 1 µm. Three measurements of surface roughness were completed per specimen. The surface roughness results were analyzed with TalyMap software (Ametek Taylor Hobson Precision, Leicester, UK) to create two-dimensional (2D) and three-dimensional (3D) surface profiles. Average roughness values of the specimens from each group were calculated and used for the analysis [32].
2.4. Particle and Surface Morphology Analysis Procedure
Size and shape distribution of the PMMA powder and zirconia nanoparticles were analyzed by a scanning electron microscope (SEM) (Carl Zeiss Ltd., 40 VP, Smart SEM, Cambridge, UK). The SEM was also used to characterize the surfaces of the unpolished and polished specimens. Specimens from each group were mounted onto slotted aluminum stubs that were positioned into a specimen holder and placed into the SEM. A secondary electron detector was employed for imaging at an acceleration voltage of 2.0 kV and a magnification of ×25 k.
2.5. Statistical Analyses
The recorded surface roughness values were statistically analyzed using statistical software (SPSS 23, IBM, New York, NY, USA). The Shapiro-Wilk test exhibited that the data of the surface roughness test were not normally distributed. Therefore, the results were analyzed with a Kruskal–Wallis test at a pre-set alpha value of 0.05. In addition, a Friedman two-way analysis of variance was conducted to find any significant difference between the Ra of polished and unpolished specimens (p < 0.05).
3. Results
3.1. Analysis of Surface Roughness
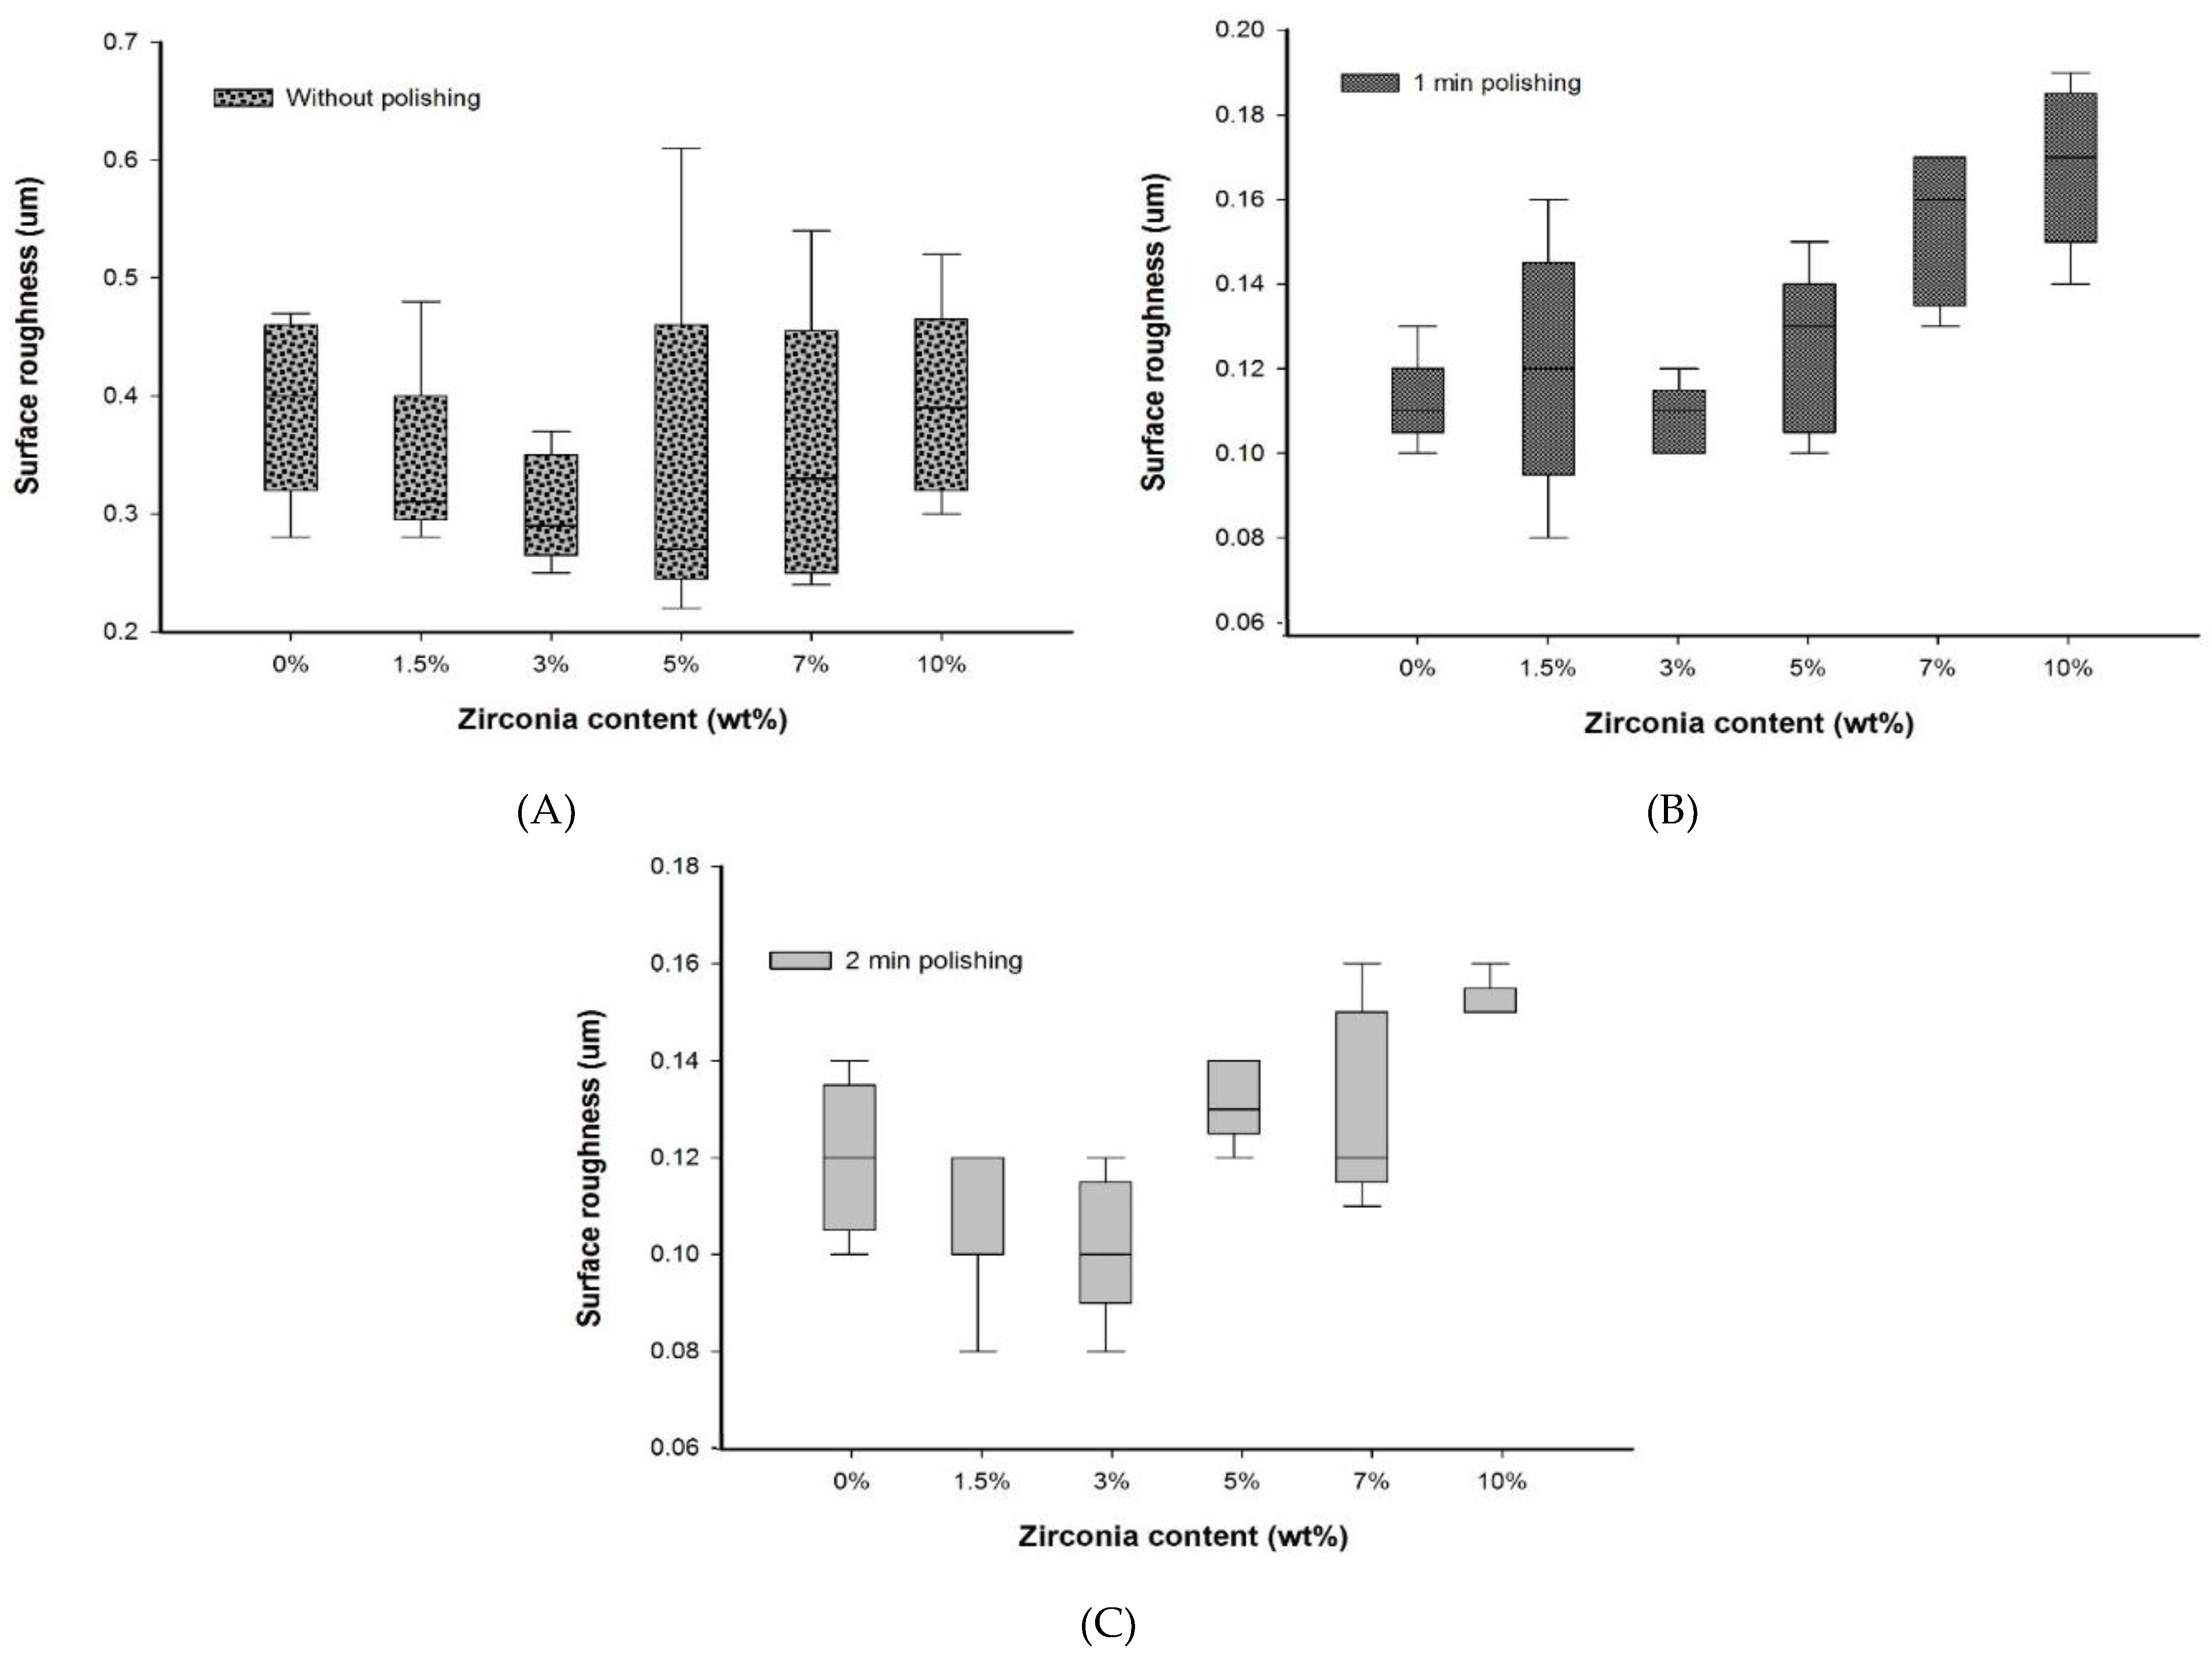
No significant difference (p > 0.05) in Ra was found between the nanocomposite specimen groups and the control group without polishing. Furthermore, without polishing, the G3 and G4 groups containing 3 wt.% (0.29 ± 0.08 µm) and 5 wt.% (0.27 ± 0.21 µm) of zirconia showed the lowest roughness compared to the control group, G1 (0.40 ± 0.14). In addition, the lowest mean surface roughness values were observed in G3 and G4 groups after both polishing times. All Ra measurements are presented in Table 2 (2D), Table 3 (3D), and Figure 3 (2D).
No significant difference in Ra values was found after a one-minute polishing between the G1 group and the groups containing up to 7 wt.% of zirconia, but the G1 group showed Ra value significantly lower than the G6 (10 wt.%) group. However, among the nanocomposites, only the G3 group showed an Ra value significantly lower than the G6 group and equal to the Ra value of the G1 group with polishing for one minute.
After two minutes of polishing, no significant difference in Ra values between the control and the nanocomposite groups was found. The lowest surface roughness was recorded for the G3 group (0.10 ± 0.02) after polishing for two minutes. This was significantly different (p < 0.05) to the G6 group (0.15 ± 0.01).
No significant difference was found between the polishing times for all groups. Overall, the nanocomposite groups showed a constant value or a decrease in surface roughness with an increase in polishing time. However, the G5 and G6 groups displayed a slightly higher decreasing trend in the Ra values.
3.2. Analysis of Particle and Specimen Surfaces
According to SEM analysis, the particle size of the PMMA powder ranged from 10 to 100 µm with an average of approximately 50 µm, as seen in Figure 4A. Also visible within the powder were rubber particles, again with an average size of 50 µm. Individual zirconia nanoparticles ranged from 30 to 60 nm whereas particle cluster size ranged between 200 and 300 nm, as seen in Figure 4B [30].
Figure 5 shows representative 2D and 3D surface images for selected groups (0% and 3% of Zirconia) before and after polishing. The images show the color bar representing the average surface roughness (Ra) values. The color bar ranged from the bottom with blue (darker shade) to the top with red (lighter shade). The red color demonstrated the high peaks of the rough surface, while the blue represented the valley depth and the interlinked colors in between show areas between the peaks and valleys. Before polishing both in the control and 3 wt.% groups (A, B, C, D), the surface profile images showed rough areas as indicated by the red colors. Again, the changes in color were not smooth across the measured area, instead patches of different colors were noticed. This provided the indication of a rougher surface without any polishing. On the other hand, after polishing, the images (E, F, G, H) showed a visibly smooth surface. The smooth transition from one color to another across the measured area also indicated the transformation to a polished smooth surface from the unpolished rougher surface. Other nanocomposite surfaces also showed similar patterns before polishing. Only the 3 wt.% surface is shown here as this group produced the best finish among the nanocomposites.
Figure 6 and Figure 7 present SEM micrographs of the specimen surfaces before and after polishing. Before polishing, the particles of PMMA are visible on the specimen surface in the control group with evidence of some micropores and a rougher surface while after polishing for one minute, surface roughness decreased with a few particles remaining on the surface. The G2 (1.5 wt.%) group showed tiny zirconia nanoparticles on the surface even after polishing. The G3 and G4 groups showed a smooth surface with uniform distribution of particles after polishing. At higher zirconia concentrations (G5 and G6), a rougher surface was noticed before polishing. However, after polishing, the surface clearly showed an indication of nanoparticle clustering particularly for the G6 group.
4. Discussions
The first research hypothesis was rejected as the G6 group showed a significant difference in comparison with the G1 group for both the one-minute and two-minute polishing times. The second hypothesis was accepted, as the two different polishing times did not significantly affect Ra for all groups.
The nanocomposite specimens from each group showed a roughness value higher than the clinically accepted value (0.2 µm) before polishing, as evidenced by the measured values, surface profiles, and SEM images. Without polishing, the highest Ra value was found in the control group whereas the G4 group showed the lowest value. These values could have been affected by the mold surface under the pressure of the hydraulic press machine during compression. Additionally, the mold surface may have suffered some disintegration when exposed to the high temperatures of the curing process [25].
It is highly doubtful that meaningful direct comparisons can be made with Ra values in other studies owing to procedural differences and variance in polishing methods and surface roughness measuring techniques [25]. The surface roughness values of acrylic resin from previous studies ranged from 0.03 to 1.06 µm, depending on the finishing and polishing techniques employed [1,9,12,14,20,28,29].
In the present study, all groups showed roughness values less than the clinically accepted limit of 0.2 µm [13] with conventional polishing for both one minute and two minutes. After the one-minute polishing, the median Ra values of the nanocomposites ranged from 0.11 (G1) to 0.12 µm (G3) and then to 0.17 µm (G6) which were all clinically acceptable [6,13,14]. At this level, the chances of various micro-organisms adhering to the surface of a denture would be minimized. An increase in polishing time up to 2 min further decreased the Ra values for the G5 and G6 groups, though not statistically significant. This indicated that at lower zirconia concentrations (G3 and G4), increasing polishing time did not make any difference. At both polishing times, the G3 group produced the best surface with the lowest Ra value among all groups. Therefore, a one-minute polishing would be sufficient to produce a clinically acceptable level of Ra in the nanocomposites.
A similar study by Ergun et al. [20] found that adding nano-fillers (5 wt.%, 10 wt.%, and 20 wt.% of zirconia) to conventional PMMA denture base acrylic resin demonstrated higher surface roughness (Ra) than those in the present study. The authors reported a significant increase with 20 wt.% of zirconia compared to the control and the group with 5 wt.% of zirconia. Other studies showed results consistent with the present study such as those by Al-Harbi et al. [14] and Fouda et al. [28] who evaluated the effect of adding nanodiamonds (NDs) on surface roughness at various concentrations (0.5 wt.%, 1.0 wt.%, and 1.5 wt.%) to the conventional PMMA denture base acrylic resin. The finding showed that the use of nanodiamonds reduced Ra with the lowest value found in the 0.5 wt.% NDs and were also clinically acceptable. They reported that the reason for this reduction in surface roughness could be due to the use of small-size particles with a low concentration and a reasonable nanoparticle distribution throughout the resin matrix. Furthermore, the nanoparticles filled interspaces and pores in the polymeric chains leading to a smooth surface [4,20,28]. In the current study, G2, G3, and G4 groups presented uniform distribution with a few nanoparticles appearing on the surface as seen in Figure 6 and Figure 7.
A possible explanation for the increase in Ra of the nanocomposite specimens with the G6 group in this study could be related to the higher concentration of the nanoparticles added to the PMMA matrix causing a non-homogenous distribution. According to Ergun et al., the surface energy, high specific surface area, and chemical activity cause the nanoparticles to aggregate [20]. In this study, the clustering of nanoparticles was evident particularly on the surface of G6 when compared to the groups containing lower zirconia concentrations as seen in SEM micrographs in Figure 7. The clustered particles on surfaces can be displaced during finishing and polishing, creating voids that could increase the surface roughness [14]. Therefore, at higher nanoparticle concentrations, particle clustering created a nonsymmetrical surface with higher roughness values and increased the possibility of patient discomfort and microorganism attachment. Gad et al. [26] also reported that the addition of glass fiber to PMMA acrylic resin increased Ra values as the glass fiber concentration was increased (2.5 wt.% and 5 wt.%) in all tested groups when compared to the control group. The increase in surface roughness was credited to the random alignment of the glass fibers and the protrusion of glass fibers from the surface.
In this study, the reduction in Ra values after polishing could be related to a combination of conventional polishing techniques applied by using pumice followed by different high shine polishing compounds. Kuhar et al. [9] reported that the smoothest denture base surface (Ra below 0.2 µm) was generated by traditional laboratory polishing methods. Gungor et al. [12] and Berger et al. [23] compared conventional polishing to three different polishing kits, recommending that the conventional polishing method using pumice was the most effective method.
In all nanocomposites, either a reduction or no alteration in Ra values was observed when polishing time increased from one to two minutes. However, interestingly for the control group, a slightly increased Ra value (by 0.01 µm) was found when the polishing time was increased. At the longer polishing time, surfaces at slightly higher depths would appear with voids or unreacted bigger polymer particles that might slightly increase the Ra value. Furthermore, the longer polishing time could generate more waviness on the surface, which could be responsible for the increased roughness.
In this study, an experienced dental technician conducted the polishing of the specimens in order to ensure the standardization of the applied force/strength/pressure of the polisher and to minimize the variability in the results. The limitations of this study included the smaller number of specimens in each group (n = 5), which could be increased to ten specimens for obtaining a better statistical distribution. Further research needs to be conducted to investigate the effect of other chemicals, such as denture cleaners and artificial saliva, on surface roughness. Antimicrobial studies can also be conducted on optimization of zirconia concentration to minimize the microbial activities on the surface.
5. Conclusions
All experimental groups (PMMA and zirconia reinforced nanocomposites) demonstrated a clinically acceptable smooth surface (Ra < 0.2 µm) with symmetrical characteristics after both one-minute and two-minute polishings. Lower concentrations of zirconia (1.5, 3, and 5 wt.%) in PMMA providing the lowest roughness values not significantly different to the control group (0.11 ± 0.01 µm) are recommended. A higher concentration of zirconia (10 wt.%) in PMMA could significantly increase the surface roughness (0.17 ± 0.03 µm) compared to the control group and thus should be avoided. For all experimental groups, an increase in polishing time did not significantly reduce the surface roughness. However, for both polishing times, the nanocomposite with 3 wt.% of zirconia produced the best surface finish (0.10 ± 0.01 µm).
Author Contributions
Conceptualization, J.Y. and S.Z.; methodology, J.Y., S.Z., N.S., J.J., A.A., and J.H.; validation, S.Z.; formal analysis, S.Z., J.H., N.S., A.A., and J.Y.; investigation, S.Z; data curation, S.Z., A.A., and J.H.; writing—original draft preparation, S.Z., A.A., and J.H.; writing—review and editing, N.S., J.Y., J.H., and S.Z; visualization, S.Z. and J.H.; supervision, J.Y., N.S., and J.H.; project administration, J.Y. All authors have read and agreed to the published version of the manuscript.
Funding
This research received no external funding.
Institutional Review Board Statement
Not applicable.
Informed Consent Statement
Not applicable.
Data Availability Statement
The data presented in this study are available within the article.
Acknowledgments
The authors would like to thank the ministry of higher education of Libya for providing financial support for the Ph.D. study; Brian Daber from Department of Dental Biomaterial, University of Manchester; Paul Murphy from University Dental Hospital of Manchester; Michael Green and Hayley Andrews from the Faculty of Science and Engineering, Manchester Metropolitan University and Gary Pickles from School of Materials, University of Manchester, for supporting the experimental work.
Conflicts of Interest
The authors declare no conflict of interest.
References
- Onwubu, S.C.; Mdluli, P.S.; Singh, S. The effect of colloidal silica and diamond suspensions on the surface roughness of automatically finished heat-polymerized acrylic resin. J. Prosthet. Dent. 2018, 120, 485.e1–485.e5. [Google Scholar] [CrossRef] [PubMed]
- Santos, M.; Soo, S.; Petridis, H. The effect of Parylene coating on the surface roughness of PMMA after brushing. J. Dent. 2013, 41, 802–808. [Google Scholar] [CrossRef] [Green Version]
- Moussa, A.R.; Dehis, W.M.; Elboraey, A.N.; ElGabry, H.S. A Comparative Clinical Study of the Effect of Denture Cleansing on the Surface Roughness and Hardness of Two Denture Base Materials. Open Access Maced. J. Med. Sci. 2016, 4, 476–481. [Google Scholar] [CrossRef] [Green Version]
- Sofya, P.A.; Rahmayani, L.; Purnama, R.R.C. Effect of soft drink towards heat cured acrylic resin denture base surface roughness. Padjadjaran J. Dent. 2017, 29, 58–63. [Google Scholar] [CrossRef] [Green Version]
- Consani, R.L.X.; Folli, B.L.; Nogueira, M.C.; Correr, A.B.; Mesquita, M.F. Effect of polymerization cycles on gloss, roughness, hard-ness and impact strength of acrylic resins. Braz. Dent. J. 2016, 27, 176–180. [Google Scholar] [CrossRef] [Green Version]
- Al-Dwairi, Z.N.; Tahboub, K.Y.; Baba, N.Z.; Goodacre, C.J.; Özcan, M. A Comparison of the Surface Properties of CAD/CAM and Conventional Polymethylmethacrylate (PMMA). J. Prosthodont. 2019, 28, 452–457. [Google Scholar] [CrossRef] [Green Version]
- Cierech, M.; Wojnarowicz, J.; Szmigiel, D.; Bączkowski, B.; Grudniak, A.M.; Wolska, K.I.; Łojkowski, W.; Mierzwińska-Nastalska, E. Preparation and characterization of ZnO-PMMA resin nanocomposites for denture bases. Acta Bioeng. Biomech. 2016, 18, 31–41. [Google Scholar]
- Abdulwahhab, S.S. High-impact strength acrylic denture base material processed by autoclave. J. Prosthodont. Res. 2013, 57, 288–293. [Google Scholar] [CrossRef] [PubMed]
- Kuhar, M.; Funduk, N. Effects of polishing techniques on the surface roughness of acrylic denture base resins. J. Prosthet. Dent. 2005, 93, 76–85. [Google Scholar] [CrossRef]
- Kim, S.-K.; Park, J.-M.; Lee, M.-H.; Jung, J.-Y.; Li, S.; Wang, X. Effects of chairside polishing and brushing on surface roughness of acrylic denture base resins. J. Wuhan Univ. Technol. Sci. Ed. 2009, 24, 100–105. [Google Scholar] [CrossRef]
- Vojdani, M.; Bagheri, R.; Khaledi, A.A.R. Effects of aluminum oxide addition on the flexural strength, surface hardness, and roughness of heat-polymerized acrylic resin. J. Dent. Sci. 2012, 7, 238–244. [Google Scholar] [CrossRef] [Green Version]
- Gungor, H.; Gundogdu, M.; Duymus, Z.Y. Investigation of the effect of different polishing techniques on the surface roughness of denture base and repair materials. J. Prosthet. Dent. 2014, 112, 1271–1277. [Google Scholar] [CrossRef] [PubMed]
- Alp, G.; Johnston, W.M.; Yilmaz, B. Optical properties and surface roughness of prepolymerized poly(methyl methacrylate) denture base materials. J. Prosthet. Dent. 2019, 121, 347–352. [Google Scholar] [CrossRef]
- Al-Harbi, F.A.; Abdel-Halim, M.S.; Gad, M.M.; Fouda, S.M.; Baba, N.Z.; AlRumaih, H.S.; Akhtar, S. Effect of nanodiamond addition on flex-ural strength, impact strength, and surface roughness of PMMA denture base. J. Prosthodont. 2019, 28, e417–e425. [Google Scholar] [CrossRef] [Green Version]
- Izumida, F.E.; Ribeiro, R.C.; Giampaolo, E.T.; Machado, A.L.; Pavarina, A.C.; Vergani, C.E. Effect of microwave disinfection on the surface roughness of three denture base resins after tooth brushing. Gerodontology 2011, 28, 277–282. [Google Scholar] [CrossRef]
- Ayaz, E.A.; Altintas, S.H.; Turgut, S. Effects of cigarette smoke and denture cleaners on the surface roughness and color stability of different denture teeth. J. Prosthet. Dent. 2014, 112, 241–248. [Google Scholar] [CrossRef]
- Ozyilmaz, O.Y.; Akin, C. Effect of cleansers on denture base resins’ structural properties. J. Appl. Biomater. Funct. Mater. 2019, 17, 1–9. [Google Scholar] [CrossRef] [Green Version]
- Hiramatsu, D.A.; Moretti-Neto, R.T.; Ferraz, B.F.R.; Porto, V.C.; Rubo, J.H. Roughness and porosity of provisional crowns. RPG Revista de Pós-Graduação 2011, 18, 108–112. [Google Scholar]
- Ozyegin, L.; Yesilbek, B.; Bayrak, O.; Oktar, F.N. The Effect of Five Polishing Materials on the Surface Roughness of Acrylic and Composite Denture Resins. In Key Engineering Materials; Trans Tech Publications Ltd.: Bäch SZ, Switzerland, 2012; Volume 493, pp. 661–665. [Google Scholar]
- Ergun, G.; Sahin, Z.; Ataol, A.S. The effects of adding various ratios of zirconium oxide nanoparticles to poly(methyl methacry-late) on physical and mechanical properties. J. Oral Sci. 2018, 60, 304–315. [Google Scholar] [CrossRef] [Green Version]
- Machado, A.L.; Breeding, L.C.; Vergani, C.E.; da Cruz Perez, L.E. Hardness and surface roughness of reline and denture base acrylic resins after repeated disinfection procedures. J. Prosthet. Dent. 2009, 102, 115–122. [Google Scholar] [CrossRef]
- Reis, A.F.; Giannini, M.; Lovadino, J.R.; Ambrosano, G.M. Effects of various finishing systems on the surface roughness and stain-ing susceptibility of packable composite resins. Dent. Mater. 2003, 19, 12–18. [Google Scholar] [CrossRef]
- Berger, J.C.; Driscoll, C.F.; Romberg, E.; Luo, Q.; Thompson, G. Surface Roughness of Denture Base Acrylic Resins After Processing and After Polishing. J. Prosthodont. 2006, 15, 180–186. [Google Scholar] [CrossRef] [PubMed]
- Oliveira, L.V.; Mesquita, M.F.; Henriques, G.E.P.; Consani, R.L.X.; Fragoso, W.S. Effect of Polishing Technique and Brushing on Surface Roughness of Acrylic Resins. J. Prosthodont. 2008, 17, 308–311. [Google Scholar] [CrossRef] [PubMed]
- Abuzar, M.A.; Bellur, S.; Duong, N.; Kim, B.B.; Lu, P.; Palfreyman, N.; Surendran, D.; Tran, V.T. Evaluating surface roughness of a polyamide denture base material in comparison with poly(methyl methacrylate). J. Oral Sci. 2010, 52, 577–581. [Google Scholar] [CrossRef] [Green Version]
- Gad, M.M.; Rahoma, A.; Al-Thobity, A.M. Effect of polymerization technique and glass fiber addition on the surface roughness and hardness of PMMA denture base material. Dent. Mater. J. 2018, 37, 746–753. [Google Scholar] [CrossRef] [Green Version]
- Rahim, T.; Mohamad, D.; Ismail, A.R.; Akil, H.M. Synthesis of nanosilica fillers for experimental dental nanocomposites and their characterisations. J. Phys. Sci. 2011, 22, 93–105. [Google Scholar]
- Fouda, S.M.; Gad, M.M.; Ellakany, P.; Al-Thobity, A.M.; Al-Harbi, F.A.; Virtanen, J.I.; Raustia, A. The effect of nanodiamonds on candida albicans adhesion and surface characteristics of PMMA denture base material—An in vitro study. J. Appl. Oral Sci. 2019, 27, e20180779. [Google Scholar] [CrossRef] [Green Version]
- Cevik, P.; Yildirim-Bicer, A.Z. The Effect of Silica and Prepolymer Nanoparticles on the Mechanical Properties of Denture Base Acrylic Resin. J. Prosthodont. 2018, 27, 763–770. [Google Scholar] [CrossRef] [PubMed]
- Zidan, S.; Silikas, N.; Alhotan, A.; Haider, J.; Yates, J. Investigating the Mechanical Properties of ZrO2-Impregnated PMMA Nanocomposite for Denture-Based Applications. Materials 2019, 12, 1344. [Google Scholar] [CrossRef] [PubMed] [Green Version]
- Standard, I. European Standard EN ISO 1567:2000 for Dentistry-Denture Base Polymers; British Standards Institution: London, UK, 2000; p. 27. [Google Scholar]
- Precision, T.H. Talysurf CLI 1000/2000 Operator’s Handbook; Taylor Hobson: Leicester UK, 2009. [Google Scholar]
Figure 1.
Photograph of the specimens HI PMMA acrylic resin with different wt.% of zirconia after polishing for two minutes.
Figure 1.
Photograph of the specimens HI PMMA acrylic resin with different wt.% of zirconia after polishing for two minutes.

Figure 2.
Photograph demonstrating the surface profile measurement of the denture base specimens with Talysurf CLI 1000 surface profiling system.
Figure 2.
Photograph demonstrating the surface profile measurement of the denture base specimens with Talysurf CLI 1000 surface profiling system.

Figure 3.
Box plot graph showing surface roughness of denture base materials (A) without polishing, (B) with polishing for one minute, and (C) with polishing for two minutes.
Figure 3.
Box plot graph showing surface roughness of denture base materials (A) without polishing, (B) with polishing for one minute, and (C) with polishing for two minutes.

Figure 4.
Particle surface morphologies of (A) PMMA and (B) Zirconia.

Figure 5.
Representative 2D and 3D surface images for tested specimens in groups containing 0 wt.% and 3 wt.% of zirconia before and after polishing (two minutes). Note: Color bar for the 2D images also represents the 3D images.
Figure 5.
Representative 2D and 3D surface images for tested specimens in groups containing 0 wt.% and 3 wt.% of zirconia before and after polishing (two minutes). Note: Color bar for the 2D images also represents the 3D images.

Figure 6.
Representative SEM micrographs of tested specimens in groups containing (0 wt.%, 1.5 wt.%, and 3 wt.% of zirconia) before and after polishing (two minutes).
Figure 6.
Representative SEM micrographs of tested specimens in groups containing (0 wt.%, 1.5 wt.%, and 3 wt.% of zirconia) before and after polishing (two minutes).

Figure 7.
Representative SEM micrographs of tested specimens in groups containing (5 wt.%, 7 wt.%, and 10 wt.% of zirconia) before and after polishing (two minutes).
Figure 7.
Representative SEM micrographs of tested specimens in groups containing (5 wt.%, 7 wt.%, and 10 wt.% of zirconia) before and after polishing (two minutes).


Table 1.
Materials used in the making of PMMA-zirconia nanocomposites.
| Materials | Trade Name | Manufacturer | Lot. Number |
|---|---|---|---|
| High impact heat-curing acrylic denture base resin | HI Metrocryl | Metrodent Limited, Huddersfield, UK | Powder (22828) Liquid (103/4) |
| Yttria-stabilized zirconium oxide | Zirconium oxide | Sky Spring Nano Materials, Incs., Houston, TX, USA | 8522-120315 |
Table 2.
Two-dimensional surface roughness values for different denture base materials before and after polishing at different polishing times.
Table 2.
Two-dimensional surface roughness values for different denture base materials before and after polishing at different polishing times.
| Experimental Groups | Surface Roughness Ra (µm) | ||
|---|---|---|---|
| Without Polishing | Polishing for 1 min | Polishing for 2 min | |
| Median (IQR) | Median (IQR) | Median (IQR) | |
| G1 (Control) | 0.40 (0.14) A,a | 0.11 (0.01) A,b | 0.12 (0.03) A,B,a,b |
| G2 (1.5 wt.%) | 0.31 (0.10) A,a | 0.12 (0.05) A,B,a | 0.12 (0.02) A, a |
| G3 (3.0 wt.%) | 0.29 (0.08) A,a | 0.11 (0.01) A,b | 0.10 (0.02) A,b |
| G4 (5.0 wt.%) | 0.27 (0.21) A,a | 0.13 (0.04) A,B,b | 0.13 (0.02) A,B,b |
| G5 (7.0 wt.%) | 0.33 (0.21) A,a | 0.16 (0.04) A,B,a,b | 0.12 (0.04) A,B,b |
| G6 (10.0 wt.%) | 0.39 (0.14) A,a | 0.17 (0.03) B,a,b | 0.15 (0.01) B,b |
Note: For each group, the same uppercase letter within a column represents no significant difference (p > 0.05), while the same lowercase letter within the same row represents no significant difference (p > 0.05).
Table 3.
Three-dimensional Surface roughness values for different denture base materials after polishing at different polishing times.
Table 3.
Three-dimensional Surface roughness values for different denture base materials after polishing at different polishing times.
| Experimental Groups | Surface Roughness Sa (µm) | |
|---|---|---|
| Polishing for 1 min | Polishing for 2 min | |
| Mean (SD) | Mean (SD) | |
| G1 (Control) | 5.27 (1.55) | 7.25 (2.35) |
| G2 (1.5 wt.%) | 7.32 (1.51) | 5.48 (2.55) |
| G3 (3.0 wt.%) | 3.92 (1.45) | 4.78 (1.90) |
| G4 (5.0 wt.%) | 3.34 (1.69) | 4.74 (2.18) |
| G5 (7.0 wt.%) | 7.23 (3.07) | 5.50 (1.54) |
| G6 (10.0 wt.%) | 7.43 (3.03) | 6.50 (1.19) |
Publisher’s Note: MDPI stays neutral with regard to jurisdictional claims in published maps and institutional affiliations. |
© 2021 by the authors. Licensee MDPI, Basel, Switzerland. This article is an open access article distributed under the terms and conditions of the Creative Commons Attribution (CC BY) license (https://creativecommons.org/licenses/by/4.0/).
Share and Cite
MDPI and ACS Style
Zidan, S.; Silikas, N.; Haider, J.; Jahantigh, J.; Alhareb, A.; Yates, J. Evaluating Polishability of Zirconia Impregnated PMMA Nanocomposite for Denture Base Application. Symmetry 2021, 13, 976. https://doi.org/10.3390/sym13060976
AMA Style
Zidan S, Silikas N, Haider J, Jahantigh J, Alhareb A, Yates J. Evaluating Polishability of Zirconia Impregnated PMMA Nanocomposite for Denture Base Application. Symmetry. 2021; 13(6):976. https://doi.org/10.3390/sym13060976
Chicago/Turabian StyleZidan, Saleh, Nikolaos Silikas, Julfikar Haider, Javad Jahantigh, Ahmed Alhareb, and Julian Yates. 2021. "Evaluating Polishability of Zirconia Impregnated PMMA Nanocomposite for Denture Base Application" Symmetry 13, no. 6: 976. https://doi.org/10.3390/sym13060976
Note that from the first issue of 2016, this journal uses article numbers instead of page numbers. See further details here.