
Non-Destructive Fast Estimation of Tree Stem Height and Volume Using Image Processing
by
 , , and
João Coelho
1,2, 
Beatriz Fidalgo
3,
Manuel M. Crisóstomo
1,
Raúl Salas-González
3,*,
A. Paulo Coimbra
1 and
Mateus Mendes
1,2,* 1
ISR, Departamento de Engenharia Electrotécnica e de Computadores da UC, University of Coimbra, 3004-531 Coimbra, Portugal
2
Instituto Superior de Engenharia de Coimbra, Polytechnic of Coimbra, 3004-531 Coimbra, Portugal
3
School of Agriculture of Coimbra, Polytechnic of Coimbra, 3004-531 Coimbra, Portugal
*
Authors to whom correspondence should be addressed.
Symmetry 2021, 13(3), 374; https://doi.org/10.3390/sym13030374
Submission received: 31 December 2020
/
Revised: 20 February 2021
/
Accepted: 22 February 2021
/
Published: 25 February 2021
Abstract
:Measuring biometric tree characteristics to estimate the volume of wood in a forest area is a time consuming task. It is usually performed by a team of two or more people, who measure the diameter and height of several trees in sampling plots. The results are then extrapolated for the forest stand. The present paper describes a method which facilitates estimating tree biometric parameters using computational techniques. A camera takes two pictures of each sample tree, with an especially designed target placed close to the tree, to facilitate image processing and camera calibration steps. Taking advantage of the trees’ natural shape and assuming a symmetric stem, the diameter and height of the tree stems are estimated from the images and the volumes of the tree stems are calculated. Experimental trials show promising results, exhibiting errors similar to the traditional methods used currently, in the range of 10%, showing that the method is suitable for forest inventory.
1. Introduction
Forest planning and management is undertaken at strategic, tactical, and operational levels. Although interconnected, each of these levels has its own objectives and information needs. The collection of forest information (known as forest inventory) is done for different purposes, at different spatial scales, involving different actors and resources allocated. Forest inventory is a task which needs to be done periodically. Therefore, it is desirable that the process of measuring the trees is fast, cost effective, and accurate.
1.1. The Problem of Forest Inventory
Kangas et al. [1] distinguish two fundamental levels of forest inventory. The first, is the inventory undertaken at national level (National Forest Inventory (NFI)) carried out by governmental institutions in association, in the case of Portugal, with industrial pulp production companies. These NFI are the fundamental basis for formulation, monitoring and evaluation of forest policies as well as to produce national and international forest resources statistics. The second level of forest inventory takes place at the forest holding level, or forest stands, and is carried out by forest owners in their holdings (Non Industrial Forest Owners (NIFO)). In Portugal, small nonindustrial forest owners are the main players in forest management. They hold over 90% of the forest area, with holdings of up to 5 ha, often subdivided into several stands [2].
NFI results published at national and regional level are not sufficiently detailed to guide management decisions at the holding or stand level [1]. Consequently, at the holding level (NIFO), new inventories have to be made in order to support forest owners in their strategic and operational management decisions, for example to decide what stand to harvest or which silvicultural treatment to apply. Wood supply is of primary interest for forest owners, and estimates of growing stock or the conception of stand management alternatives involve detailed information gathered also by using stand field inventories [3].
1.2. Modern Methods of Forest Inventory and Method Proposed
The use of a camera and image processing methods can be extremely useful because it has the potential to greatly reduce the time necessary to estimate the DBH, total height and volume of a tree [4,5,6], compared to traditional methods which require several manual measurements of key tree points and tree volumes individual calculations. These image processing method allow automatically calculating all the necessary values, such as the diameter of the tree trunk, tree height, and volume estimation.
Previous research on automating the forest inventory process was proposed in [7,8]. However, the methods described in the present paper allow calculating the diameter and the total height, even in cases where the view of the tree is partial. The methods used are based on proportion transformations and hypsometric functions, as they are described in [9,10].
The present paper proposes new methods to automatically estimate tree diameter, height and volume based on computer vision and digital image processing techniques. The software application developed allows estimating these tree characteristics using any device equipped with a camera. A special symmetric target was designed, which has chessboard targets stamped on a large red board. This special target is placed behind the tree and one or two pictures of the tree are taken. Using computer vision methods, the camera is calibrated to minimize perspective and lens distortions. Afterwards, the visible part of the tree stem is extracted from the background using object detection methods [11]. The diameter of the tree stem is then calculated by comparison with the known dimensions of the especially designed target. The non-visible part of the stem is estimated using line projections, tree shape formulae or hypsometric relations.
2. Traditional Methods
Forest inventory requires the use of specialized human resources and traditionally, the use of mechanical or optical instruments, such as callipers, hypsometers and measuring tapes, to measure biometric parameters in field plots. Landowners with small holdings cannot afford to make these field inventories and they base their decisions on visual inspections of the stands, frequently without field measurements and no major concerns with data accuracy. This practice is not exclusive to Portugal, and has been documented for small forest owners even in countries with a long tradition of forest management such as the Nordic countries [1,12]. Information needs for forest management at the holding level are increasing because forest certification schemes require, as a prerequirement, the existence of a recent forest management plan for the holdings [3]. The preparation of a management plan requires relatively detailed information, usually collected and processed on stand-by-stand basis for each forest species [13].
The traditional methods for collecting forest data needed for forest management, such as diameter at breast height (DBH) and total height, commonly recorded in a subsample of these trees, are time-consuming, very costly and cannot directly measure some tree attributes with great interest for forest owners, such as stem volume. These trends place great pressure on the development of new, fast and cheaper approaches that allow the estimation of the standing wood volume of a single tree, and then, they can also be used to estimate the volume of a forest stand by extrapolation from the inventory plots [14,15,16].
Estimation of the volume of wood in the tree stems remains an essential task for forest management decisions, because of the stems’ commercial value. Therefore, an error as small as possible is desirable, for more confidence in management decisions. In recent years, modern technology such as ground observation technology, remote sensing, photogrammetry technology and 3D laser scanning technology have been used to extract various biometric forest attributes [17]. However, data acquisition with these technologies is limited by the time and cost involved, difficult data processing, and lack of trained personal and equipment. Thus, these approaches are more convenient for forest inventories in a larger scale [4]. Moreover, at the stand level, these technologies present a lower versatility and they are still less reliable than those obtained by traditional inventories based on tree measurements in sampling plots [1].
Currently, several manual methods are used to measure the DBH and total height of a tree. Hypsometers are used for measuring tree height. The volume of the stem is then estimated using a binary equation based on the DBH and tree height [18,19]. Alternatively, a non-destructive method for volume tree estimation may be applied using upper-stem diameters. Then the Smalian’s and Newton’s formulae are applied for each stem section separately, in order to estimate the volume of each section and therefore the tree volume [10,18,20]. However, this method is too laborious—and therefore costly—for general use. So a new non-destructive, economical, user friendly and efficient method is necessary [21].
3. Literature Review
Estimating tree dimensions from pictures has been researched before. The following subsections describe previous work in object detection, dimension estimation and their application for tree measurement estimation.
3.1. Tree Measurement from Images
In previous work, Varjo et al. [22] propose a method of estimating tree height and volume from digital pictures. The main difficulties pointed out by the authors are the quality of the images and the problem of separating tree from background. Part of the problem might have been already solved by the quality of the cameras available now. The problem of separating tree from the background we propose to solve using the especially designed target.
Zhang and Huang propose a method to estimate a tree’s height from an image, using digital image processing methods [7]. Han and Wang propose a similar method, although applied to a mobile device [8].
These methods have both the same foundation. First an image of a tree with two red markers (at a known distance between them) is obtained (using an edited picture, as used by Zhang and Huang, or by using a real life target with red accents, as used by Han and Wang). These images are then converted to the HSV (Hue, Saturation, Value) color space, and processed in order to locate/extract the two red markers. After the extraction, a triangle similarity method is applied, in order to find the tree height, knowing the distance between the two markers.
In both cases, the tree’s height calculation method uses image processing with an image where the full tree is visible. While both methods are similar, they differ essentially in the fact that the second proposes the use of a mobile phone and the first uses a larger computer to perform the target extraction. In both cases the authors claim an error of 4% in estimating the tree height.
Also a relatively simple approach to calculate the volume was proposed in [19], where the idea is to use a truncated cone. The method is an alternative to more traditional approaches, such as the Smalian’s and Newton’s formulae.
3.2. Object Detection and Dimension Estimation in Images
Recent advances in hardware processing power make computer vision a viable method for different tasks, such as robot navigation [23], object identification, or object measurement.
Ali et al. compare the performance of HSV and RGB (Red, Green, Blue) images for colour segmentation and object extraction, applied to road signs [24]. Xie and Lu also summarize the process for object detection, applied in the detection/identification of the number of copper ores in a wire [25]. Othman et al. propose an algorithm to detect the dimensions of an object in real time, using OpenCV library [26]. Hussin et al. propose also an algorithm to detect an object in real time, in this case a mango, using MATLAB [27].
The process of extracting objects from images is usually based on the concepts of erosion and dilatation of image areas [28], methods which will be further explained in Section 5.2. Those methods are widely used to remove visual noise on image extractions [29]. After applying erosion and dilatation to an image, the contours of the objects are easier to determine using OpenCV contour detection functions. For better results extracting information from images, it is important to correct perspective and lens distortions. The process of correcting the distortions is camera calibration. Camera calibration can be done from a target of known dimensions, which is usually a chessboard of black and white squares of known dimensions [9,30].
4. Experimental Setup
The experimental setup developed in order to test the method consisted of: (i) a novel especially designed target; and (ii) a python application. Both are briefly explained below.
4.1. Specially Designed Target
To be able to extract real dimensions of objects from an image, using a two dimensional photo, it is necessary to use an object of known dimensions as “scale”. A popular target is a rectangle with a chessboard pattern, as mentioned in Section 3.2.
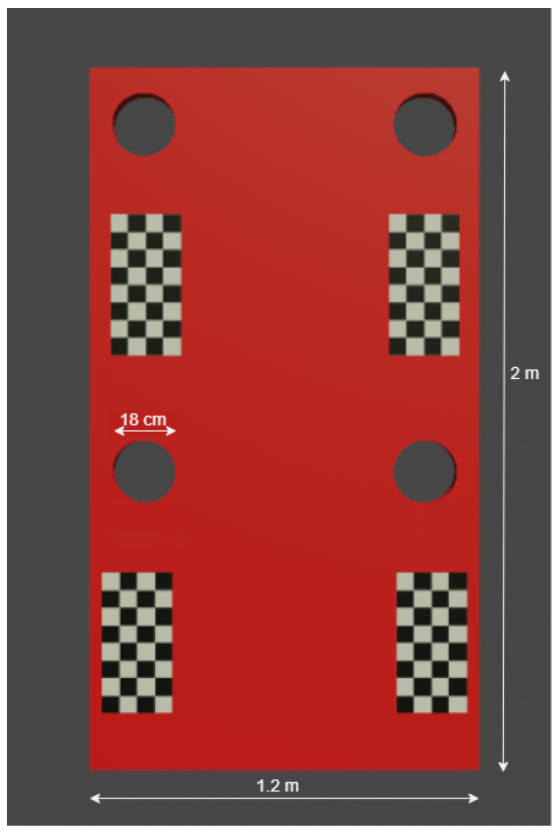
In the present project, a special target was designed. It consists of a red rectangle target with circular holes and four chessboard patterns, as represented in Figure 1. The red color was chosen because it is uncommon in nature. Therefore, the area of the rectangle can be easily identified from the image. The circular holes are used as a scale (their real size is 18 cm of diameter) since the circular shape is easy to identify and extrapolate precise measurements. The chessboard pattern is used for camera distortion calibration. The complete target is 1.2 m wide and 2 m high, being sufficiently large to be easily detected and measured with precision in the pictures. For example, for a tree with 20 m of height, the target is 10% of its height. Nonetheless, the target is still lightweight, foldable, and easy to carry and position in place.
The target is to be positioned behind the tree. It should be visible in both sides of the tree, have at least one of the circular holes visible and have at least one of the chessboard patterns visible, for optimal results when applied to estimate the height, DBH and wood volume of a tree.
For testing purposes, a virtual target was also used. In the tree images, the target was positioned behind the tree, using image edition software, before the picture was saved and used for calculation. This was possible, since some pictures of the trees taken in real forest areas contained white circles or rectangles of known size, which were placed in front of the trees before the pictures were taken. Those circles and rectangles were then used to determine the position and size of the virtual target.
4.2. Virtual Environment
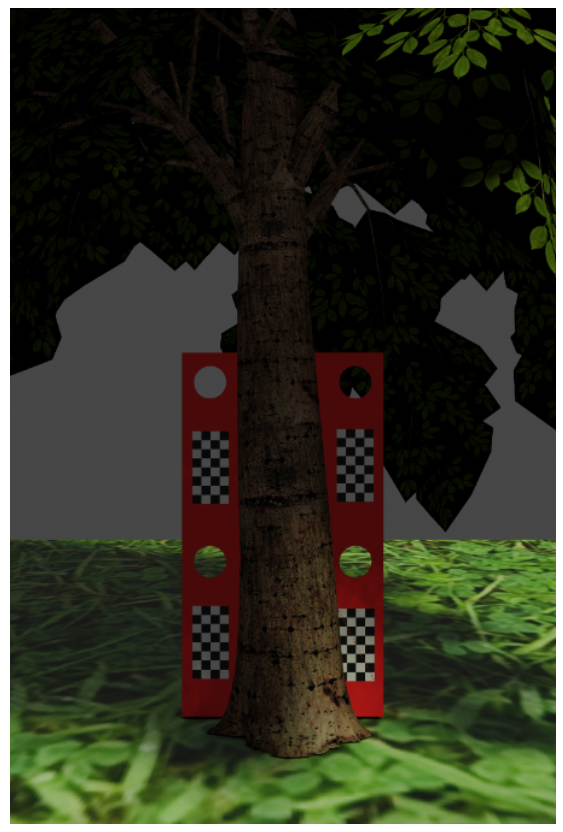
The traditional methods used to calculate trees’ height and wood volume present an error, which is usually up to 10%, or even 15% to 29% for trees 5–10 m high [31]. To test the accuracy of the algorithms developed, a virtual environment was designed, using the 3D modelling program Blender. In the virtual environment, it is possible to observe the trees in any chosen angle, as well as to create different tree models and know their measures with high precision. Figure 2 shows an example of a virtual tree with a special target behind the stem. In the simulation environment, the point of view was changed and different pictures were taken to debug and test the algorithms.
5. Pre-Processing
For better results estimating the dimensions, the images were pre-processed. That included camera calibration and conversion to HSV for better precision extracting the target.
5.1. Image Pre-Processing and Camera Calibration
To improve the images’ quality, correcting perspective and lens distortions, the first step performed in the proposed algorithm is camera calibration. The chessboard pattern is searched for in the images and if it is detected, the camera is calibrated and the images pre-processed to correct the above mentioned distortions.
If the chessboard pattern is not detected, no camera calibration is performed. If one or more patterns are visible, camera calibration is performed. Ideally, more than one pattern should be used, since the bigger the number of patterns detected, the better the results. Also, the algorithm proposed can still work without camera calibration, but confidence in the results is lower in that case.
When a chessboard pattern is detected in the image, some camera parameters such as distortion coefficients and rotation vectors can be calculated. In the present project they were calculated using the OpenCV calibration methods, which use the pinhole camera model [32]. When the calibration results are available, they are applied to change the image in order to remove the lens distortion.
5.2. Target Extraction
After the image is calibrated, the specially designed target must be automatically identified, for the system to be able to get the information needed to calculate the height and volume.
To extract the target, the image is converted to HSV (Hue, Saturation, value) color model. The more popular RGB could have been used instead of HSV. However, since the RGB color model only takes in consideration the color values, different lighting conditions may affect the accuracy. A color range of accepted colors is then defined, which in the present case is the red color of the target background, and the visible part of the target is identified and extracted, as can be seen in Figure 3. To reduce any noise after the extraction, the target/mask is processed using erosion and dilatation methods [28]. The erosion method causes the selected areas from the image to shrink. The dilatation method is similar to erosion; however it spreads the selected image areas. The contour of the extracted target is then calculated, and processed in order to determine the convex hull. The convex hull will reduce any “noise” on the contour detection. The convex hull process works by finding the extremes of different points in the contour, reducing the detected lumps of the tree. After the contour is found, it is now possible to obtain the values needed for the methods explained next. Figure 3 shows the results of target extraction.
6. Height Calculation Methods
Different methods can be used to calculate a tree height. Some of them require that the full tree is in the field of view. Other methods give an estimate even when only a partial view of the tree is available, relying more on the symmetry and other natural geometric relations between parts of the tree.
6.1. Image Pixel Scale
To estimate dimensions of any objects visible in the image, the first step is to calculate a scale factor. The scale factor can be calculated from the dimensions of any known object, selected as reference object. The scale is then calculated according to Equation (1).
is the dimension, or real life size of the reference object, in meters or other unit. is the pixel size of the reference object, as measured in the image, in pixels. Hence, the relation is the scale factor which can be applied, to convert pixels to meters. The conversion can then be made applying Equation (2).
In the equation, is the estimated dimension, or real life size, of the object, as calculated from the image, in meters. is the pixel size of the object, in pixels, as measured in the image.
In the present project, the circular holes with 18 cm of diameter are the preferred reference object. Smaller objects could cause too big errors when measuring the number of pixels. With larger reference objects is more difficult to avoid occlusion by large trees.
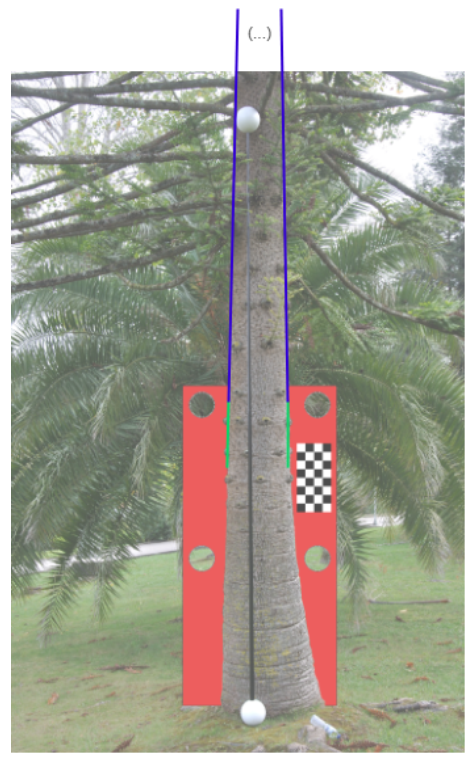
6.2. Line Projection
Line projection is a method to calculate the tree’s height from the image. Figure 4 is a visual representation of the method. The process starts by selecting two points in the border of the tree stem. Ideally the points are at the same height, which is as high as possible, within the area of the red rectangle. Following the contours of the stem, towards the tree root, two other points are selected, below those two previously selected. The two points on each side of the tree stem determine small line segments, the green lines shown in the figure. Determining the slope of the line segments on each side of the tree and calculating the point of intersection of the two lines, allows determining the tree trunk top. With this point is possible to obtain the tree height.
6.3. Proportion Transformation
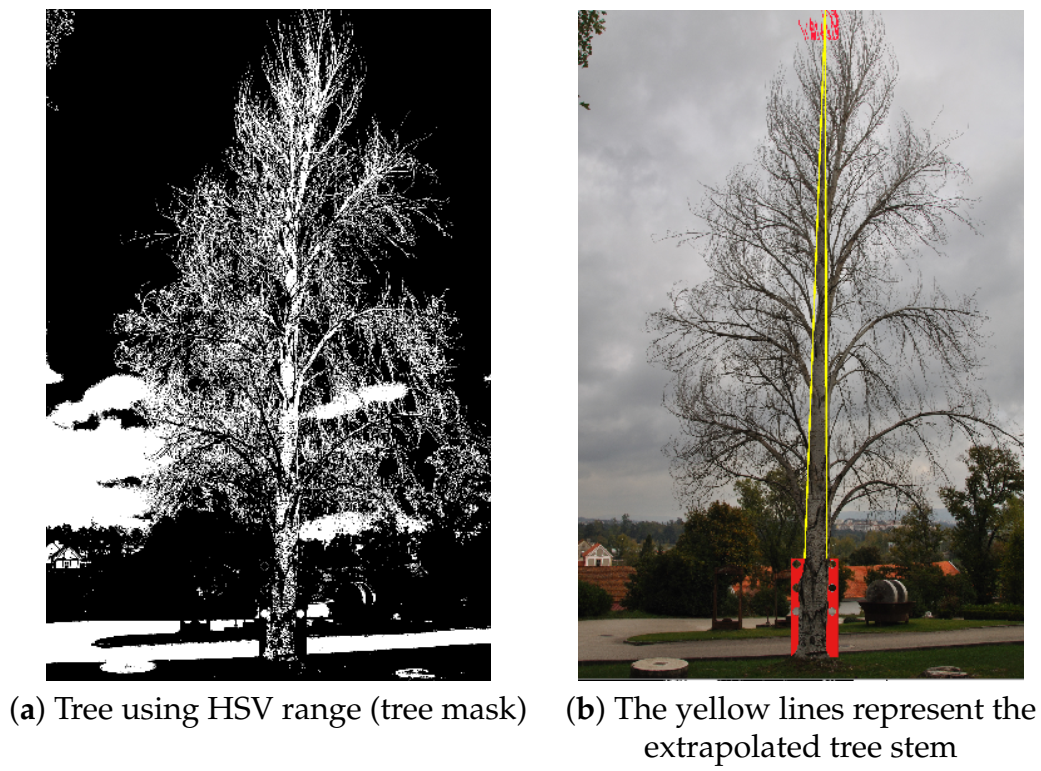
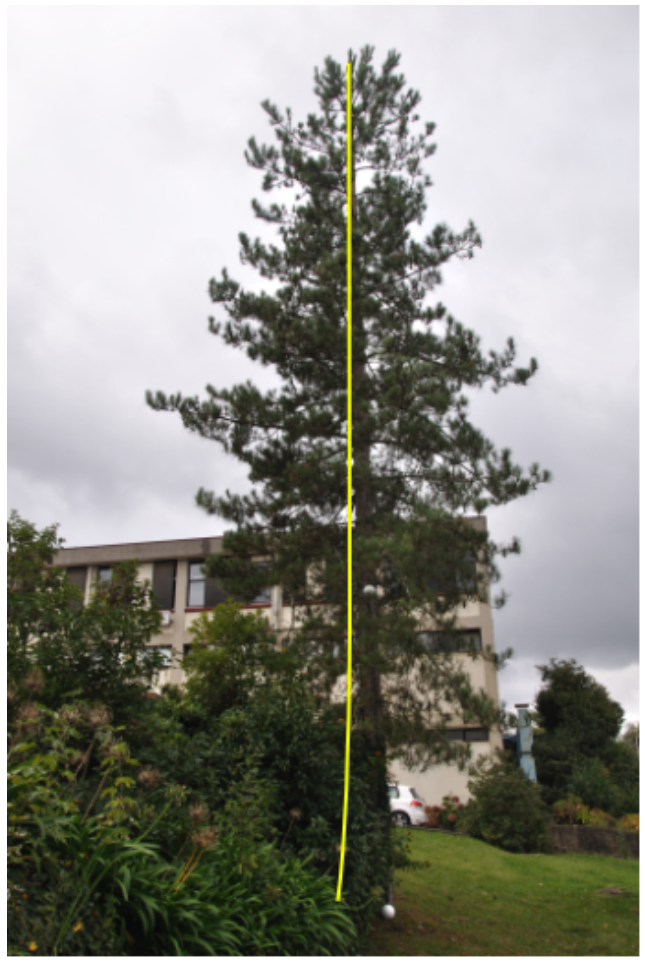
The proportion transformation method was especially developed to estimate the tree height if the image shows the full tree. It is based on the methods used in [7,8]. The first step of the method is to determine the highest point found in the tree, using image processing methods similar to the ones applied in Section 5.2 for target extraction. The lowest point of the tree image is also detected, using the red target as a guide line to find the tree bottom. The height of the tree in pixels is then calculated, as the distance from the top to the bottom. This distance is then scaled to real world values, using Equation (2). Figure 5 illustrates the concept. Figure 5a shows one image of the tree contrasted against the background. The tree is binarized and the top and bottom points are then easier to find in the binary image. Figure 5b shows the original colour image, but with the yellow lines showing the approximate cone of the tree stem.
One limitation of the proportion transformation method is that it calculates the highest point of the tree, and not the height of the tree stem. The perceived stem height may be affected by the foliage in the tree top. Therefore, the height of the tree stem may have a significant error.
6.4. Tree Shape Function
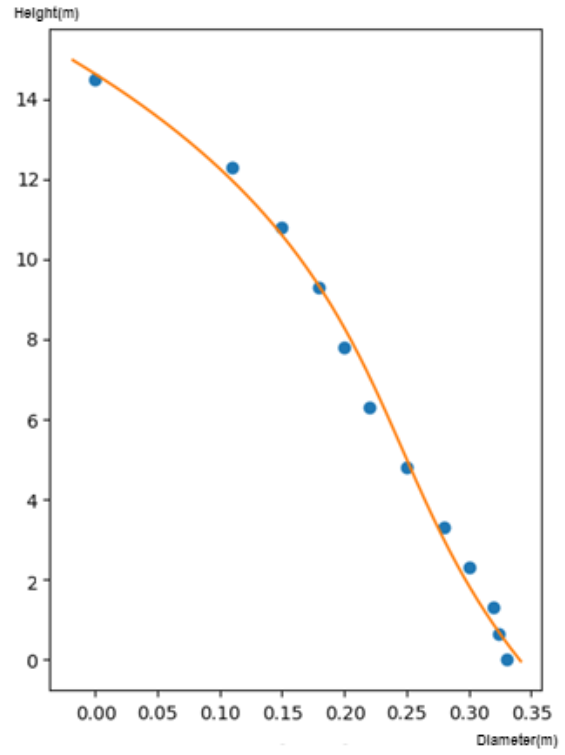
The methods used above assume that the tree shape is straight. However, in real life that is not the case. To mitigate this problem, a method was developed using tree shape functions. Tree shape functions are mathematical functions that describe a relation between the tree’s height and diameter at different sections of the tree stem [33]. They are an auxiliary method to determine with more accuracy the tree height and the stem volume.
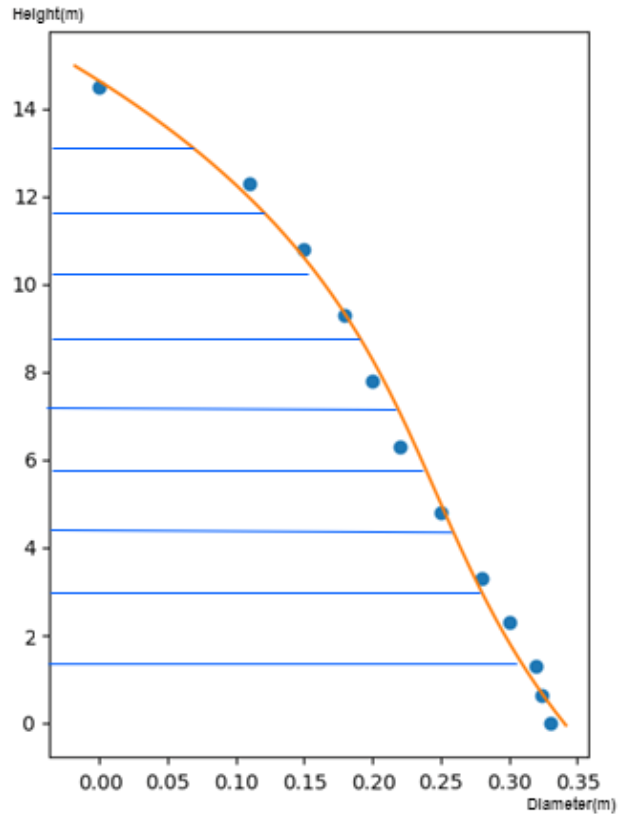
Figure 6 shows a shape function, this plot of the height of the tree stem as a function of the tree diameter of a pine tree with approximately 14.4 m height and a stem that starts at 0.33 m diameter. To determine a shape function, it is necessary to have some reference values, such as the blue dots in the figure. The more dots are given, the higher the chances of calculating a precise shape function. These mathematical functions are known from forest engineering for different tree species [34,35,36]. Hence, with just a few points it is in general possible to determine an approximate shape function with good accuracy.
A shape function can be calculated measuring the diameter of a tree at different heights, and using these values to determine a cubic function that represents the tree shape. A cubic function is used, instead of a linear or quadratic function, since it more accurately represents the natural shape of the tree [34]. Different tree species and regions need different tree shape functions.
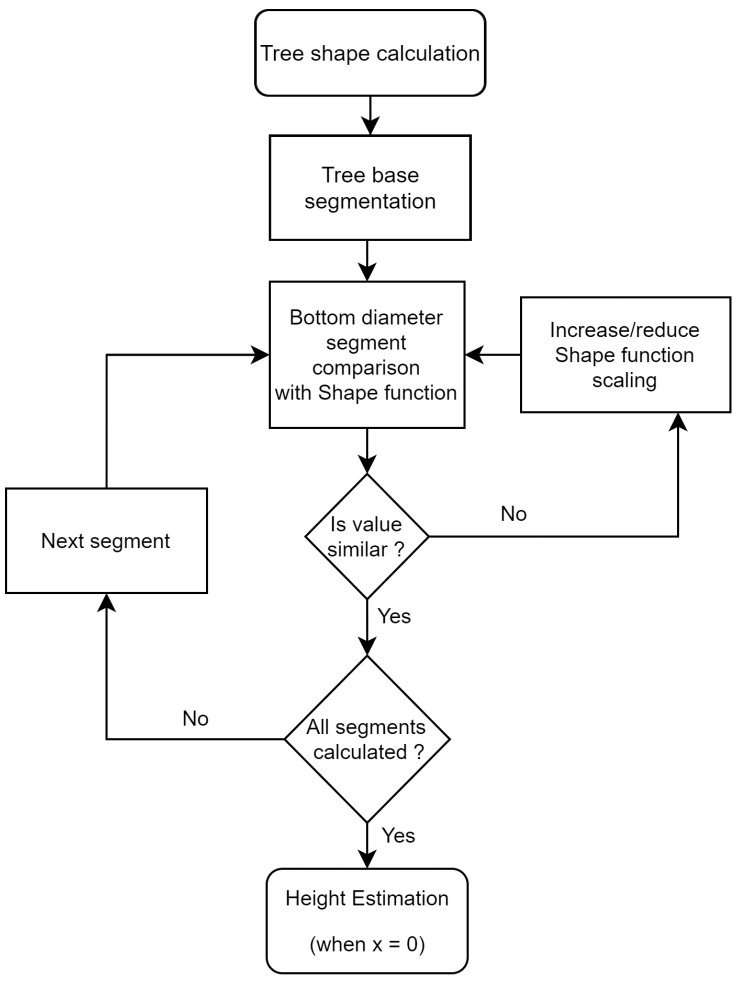
Figure 7 shows a shape function applied over the image of a pine tree. After the shape function is determined, this method can be used to calculate the height of any tree of the same species. To determine the height, the base of the tree is divided in four stem segments. Then, each segment bottom diameter is compared individually to the equivalent values of the shape function. The shape function is successively re-scaled, until the value of the stem segment bottom diameter is similar to the diameter of the shape function at that height. This process is then repeated for each tree stem. The shape function determined, represents a good approximation of the shape function of that tree. Now, it is possible to estimate the tree height, where the diameter is equal to zero in the shape function previously calculated. The flowchart in Figure 8 summarizes the process.
6.5. Hypsometric Relation
Hypsometric models represent tree height-diameter relationships, using data obtained from a population of trees. These models relate the DBH measured at 1.3 m in the tree with the total height of the tree. Using a significant number of trees (more than 30 for an accurate result), a function can be calculated that represents the tree DBH in function of the tree height. Usually, a potential function is used [37].
This method is faster and more precise than all the other described methods; however this requires that an hypsometric function is determined for each tree species, site productivity and other factors. Accuracy is highly improved when increasing the number of trees used to calculate the parameters of the function. After the hypsometric function is established, the method determines the unknown height of the selected tree knowing its DBH. An example of an hypsometric function is shown in Figure 9 using values from a pine tree population.
7. Volume Calculation Methods
Different methods can be used to calculate the tree wood volume. In the present research, three methods were explored, as described below.
7.1. Tree Segmentation
Trees do not have a linear relation between the diameter of the stem and the height, as shown in Figure 6. For better accuracy determining the volume of the tree stem, the calculation of the volume must be done summing the volume of short sections one after the other [19]. Each section is easier to approximate as a solid regular geometric shape, such as a truncated cone or cylinder.
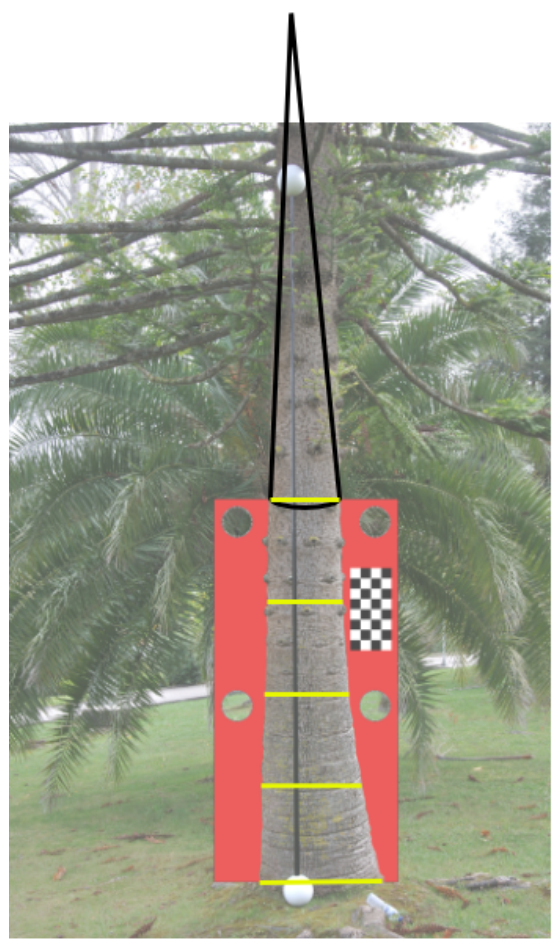
The method implemented consists in dividing the base of the tree (the base here is defined as the area within the red rectangle) in four equal sections, as shown in Figure 10. Each section is then individually processed using the truncated cone volume Equation (3) where h is the height, the radius of the base of the truncated cone and the radius of its top.
The volume of the remaining stem is then calculated applying the cone volume formula. This part of the stem is not sectioned. It is assumed as being a cone, for it is very difficult to accurately calculate the contour of the remaining tree stem. This method could be refined, for example using the neiloid formula for the first section, and a better approximation for the last section. However, that was not done in the present work considering that other methods showed to be far superior, as explained below.
7.2. Huber’s, Smalian’s and Newton’s Methods
Huber’s, Smalian’s and Newton’s methods [10,18,20,38] are the state of the art methods used to calculate the volume of a tree stem. The Huber’s method is the fastest and the easiest to use; however, it is also the least accurate of the three. In contrast, Newton’s method is the most accurate, but it needs more diameter mensuration by stem section [18,33].
To test these methods, an algorithm was developed to adapt them to the stem information extracted from the images. This algorithm has the core elements similar to the “tree segmentation” algorithm, on which the tree is segmented into different sections. However, instead of using the truncated cone volume formula, one of the three formulae is used (Huber’s, Smalian’s or Newton’s).
The Huber’s equation is Equation (4). The Smalian’s equation is Equation (5). In addition, the Newton’s equation is Equation (6).
In the equations, V is the tree volume, the diameter of the bottom part of the tree stem section, the diameter of the upper part of the section, the diameter of the middle part of the section, and h the length of this section of the tree.
As in the tree segmentation method, the remaining stem is assumed as a cone. However, the diameter of the middle of the cone is multiplied by a constant factor, which in the present research was experimentally found to be 10%. This constant factor was determined empirically, after testing different values and finding out that 10% gives the most accurate result in general. This allows more accurately representing the assumed shape of the tree, increasing the accuracy.
7.3. Newton’s Method Using Tree Shape Function
In this method, in order to more accurately determine the volume of the stem, instead of using the values obtained from the red target (such as the diameter and others), the calculated tree shape function is used to estimate the diameters at different heights, as shown in Figure 11. The shape function is divided into ten segments, and each segment volume is then calculated using the Newton’s Formula (6).
Since this method is heavily dependent of the tree shape function, any errors in the shape function calculation are noticeable in the volume. Therefore, it is necessary that the shape function is correctly calculated to reach an accurate volume.
7.4. Volume Estimation Using a Shape Coefficient
In this method, the calculation of the wood volume can be divided in two different steps. The first step is the volume calculation of the tree base (until 2 m height, which is the height of the red target). For this, the Newton’s method is used, as described in Section 7.3. In the second step is calculated the volume of the remaining tree stem (above 2 m) considering it as a cone. It is calculated using Equation (7), where V is the volume, D the diameter in meters at 2 m height, H is the height of the remaining tree and is the shape coefficient determined for the tree species. The total volume of wood in the tree is the sum of the two volumes calculated.
The shape coefficient purpose is to correct the volume estimation considering that the shape of the tree remaining stem (above 2 m) is not a cone and depends on some factors such as the tree species, age, and local conditions. The shape coefficient is defined as the relation between the measured volume of a reference tree and the volume of the same reference tree calculated using height and diameter data.
A shape coefficient can be determined using Equation (8), where is the shape coefficient, is the measured volume of the reference tree, is the diameter of the base of the reference tree and is the height of the reference tree (above 2 m).
To estimate the volume of each tree, the algorithm implemented uses shape coefficients, which are previously calculated for reference trees with different height/age. To determine which shape function is to be used in each tree, Equation (9) is applied. Using this relation, the value obtained can be compared to the values of the references trees, choosing the shape coefficient with the closer R.
In Equation (9), H is the height of the tree and D is the diameter at the same height used in the shape coefficient calculation (in the present case, 2 m).
8. Experimental Results
To test the developed target and algorithms in a real life scenario a physical target was built, using styrofoam panels covered with colour plastic. Initially the target was supposed to be all red, as described in previous sections. However, during the construction of the target, one of the faces was covered in red and the other side was covered in pink. After some testing, it was determined that the red target usually gets more accurate results. The pink target is very effective in the shade; however in direct sun light the result is very inaccurate, mainly by the fact that in direct sunlight the color is faded into a white tone, increasing the inaccuracy of the target extraction.
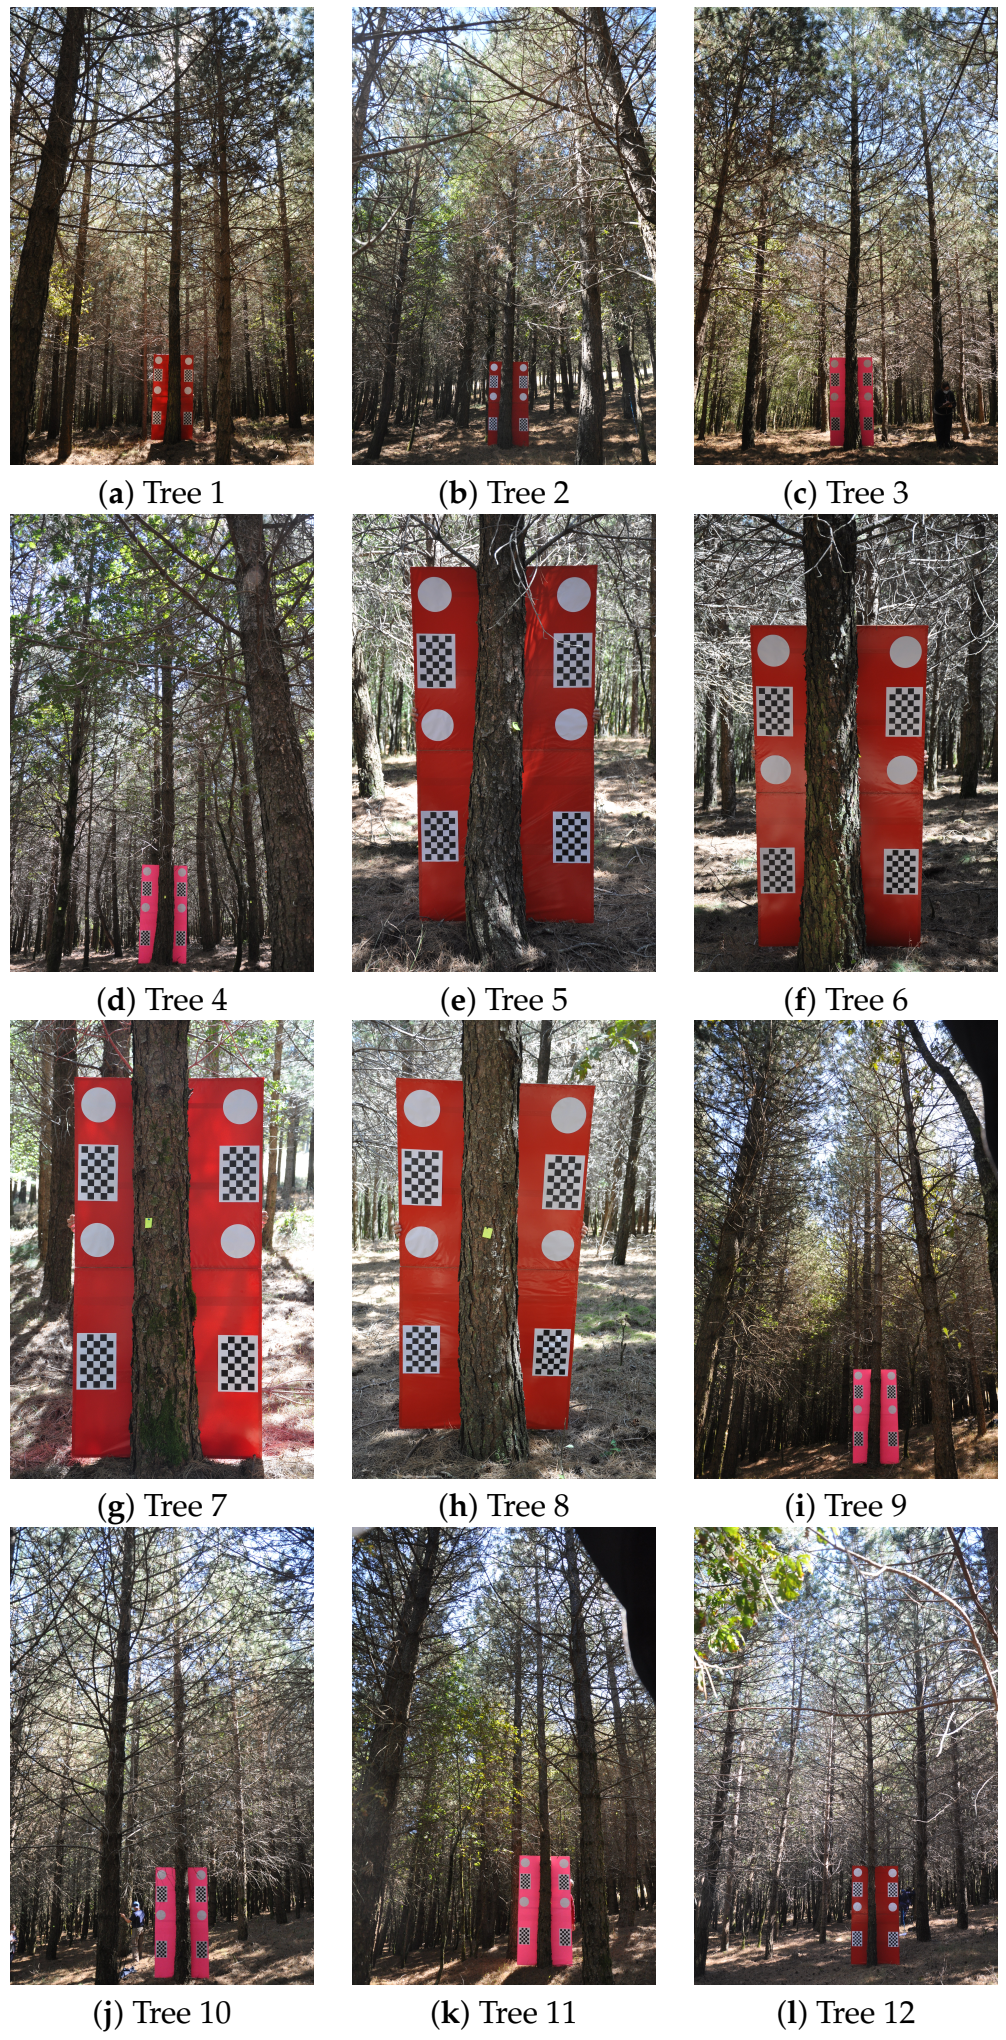
For testing the different algorithms, several pictures were taken in two different inventory plots. Two pictures per tree were taken whenever possible, only one when lighting or space restrictions existed. Some of the taken pictures are shown in Figure 12.
Table 1 and Table 2 show the results obtained with pictures of the 12 real Pinus nigra trees shown in Figure 12.
The best algorithm to calculate the height is the hypsometric relation. As for the volume, the shape coefficient and the Newton’s method both present a more accurate value than the other methods.
9. Discussion
The results presented show that these methods can successfully estimate the height and wood volume of different trees, with error margins approximately in the same range as the traditional methods, which are also just approximations. The tree height estimations presented by Zhang et al. [7] and Han et al. [8] have smaller errors. Zhang et al. have a relative error of 4% and Han et al. have a relative error of 3.62%. However, that difference in accuracy may happen, at least in part, because both papers use pictures taken in apparently optimal conditions. The pictures they used were taken at an angle of 90 degrees and the image distortion is minimal. The authors also state that the developed algorithms are only viable in non complex scenarios. The present paper proposes a method which achieves an average error of 12.18% for height and 10.90% for volume. However, the method was applied and tested in non-ideal field conditions, and is capable of producing results in more complex scenarios.
In the present research, the main goal was to optimize volume calculation and not height. Some of the pictures used are also very challenging. For example, tree2 was photographed at a very wide angle and several tree crowns were superposed. The results show that the method is robust enough to be used even by lay people, which might be the case for small forest owners. Nonetheless, the results also show that some training and experience may be necessary for learning how to take the best pictures and minimize the errors. For better results the picture must be of good quality and the tree being measured must take a considerable part of the image. Also, we expect to have similar results in both low and high stand density, since methods such as the hypsometric function (for the height estimation) only take into account the base of the tree, which is not much affected by the stand density.
The procedures followed in the present research may also require some optimization for the future. Namely the physical target, made of styrofoam covered with plastic sheets and paper checkerboards, was flimsy and difficult to position when the tree has branches near the soil. A better target can give better results.
Compared to the state of the art, the present approach offers more possibilities and novel contributions. It allows automatically estimating the volume of wood in a forest area by taking pictures of the trees in the sampling plots. Important characteristics are highlighted as follows:
- Knowledge from Forest Engineering is embedded into the models, offering more precise results with less information.
- The use of hypsometric functions allows a good estimation of the height of the trees even when only a partial view of the tree stem is available.
- The use of a specially designed target allows easily calibrating the camera, thus correcting image distortions and working with pictures taken at different angles. It also facilitates the process of extracting the tree stem from several different backgrounds. This leads to more precise results in a wider range of camera positions and angles, making the method adequate even for small forest owners who cannot use expensive or complex equipment.
10. Conclusions
Calculating the volume of wood in a tree using non-destructive methods is very important for forest management. The present research proposes methods to automatically calculate the tree diameter, height and wood volume, based on a picture with a partial or complete view of a tree. Thus, the proposed non-destructive method, compared to traditional methods is not only easier to use, but is also cheaper. The user only needs to load the software on any equipment that has camera and put the target on the tree. Also, the user will not need more time and other computer resources to calculate the volume. The errors measured in tree height and volume estimation are comparable to the traditional methods used by small land owners. The results show that the method based on the hypsometric function and shape coefficient is the most reliable and has an error of 10.90%.
One limitation is that some of the proposed methods, the ones based on hypsometric relations and tree shapes formulae, will only work for trees of known species. Another limitation is that a large physical target is still needed for better accuracy.
Future work includes further testing, possibly optimizing the physical target and algorithms to produce better results for Pinus nigra and other tree species. Other camera calibration algorithms and parameters can also be tested, for a more accurate calibration.
Author Contributions
Conceptualization, M.M., R.S., B.F., A.P.C.; data curation, all authors; methodology, all authors; software, J.C.; validation, all authors; formal analysis, all authors; writing—original draft preparation, J.C.; writing—all authors; visualization, all authors; supervision, A.P.C., M.M.C., M.M. All authors have read and agreed to the published version of the manuscript.
Funding
The authors acknowledge Fundação para a Ciêcia e a Tecnologia (FCT) for the financial support to the project UIDB/00048/2020.
Conflicts of Interest
The authors declare no conflict of interest.
References
- Kangas, A.; Astrup, R.; Breidenbach, J.; Fridman, J.; Gobakken, T.; Korhonen, K.T.; Maltamo, M.; Nilsson, M.; Nord-Larsen, T.; Næsset, E.; et al. Remote sensing and forest inventories in Nordic countries—Road map for the future. Scand. J. For. Res. 2018, 33, 397–412. [Google Scholar] [CrossRef] [Green Version]
- Coelho, S.I. Propriedade da Terra e Política Florestal em Portugal. Silva Lusit. 2003, 11, 185–199. [Google Scholar]
- Secco, L.; Masiero, M. Certification schemes and processes. In Forest Management Auditing, Certification of Forest Products and Services; Brotto, L., Pettenella, D., Eds.; Earthscan from Routledge: London, UK; New York, NY, USA, 2018; pp. 42–56. [Google Scholar]
- Fan, G.; Feng, W.; Chen, F.; Chen, D.; Dong, Y.; Wang, Z. Measurement of volume and accuracy analysis of standing trees using forest survey intelligent dendrometer. Comput. Electron. Agric. 2020, 169, 105211. [Google Scholar] [CrossRef]
- Liu, J.; Wang, X.; Wang, T. Classification of the tree species and stock volume estimation in ground forest images using Deep Learning. Comput. Electron. 2019, 166, 105012. [Google Scholar] [CrossRef]
- Marzulli, M.I.; Raumonen, P.; Greco, R.; Persia, M.; Tartarino, P. Estimating tree stem diameters and volume from smartphone photogrammetric point clouds. For. Int. J. For. Res. 2020, 93, 411–429. [Google Scholar] [CrossRef]
- Zhang, J.; Huang, X. Measuring Method of Tree Height Based on Digital Image Processing Technology. In Proceedings of the First International Conference on Information Science and Engineering, Nanjing, China, 26–28 December 2009; pp. 1327–1331. [Google Scholar]
- Han, D.; Wang, C. Tree height measurement based on image processing embedded in smart mobile phone. In Proceedings of the International Conference on Multimedia Technology, Hangzhou, China, 26–28 July 2011; pp. 3293–3296. [Google Scholar]
- Mallon, J.; Whelan, F. Which pattern? Biasing aspects of planar calibration patterns and detection methods. Pattern Recognit. Lett. 2007, 28, 921–930. [Google Scholar] [CrossRef] [Green Version]
- Cruz de Leon, G.; Uranga-Valencia, L.P. Theoretical evaluation of Huber and Smalian methods applied to tree stem classical geometries. Bosque (Valdivia) 2013, 34, 311–317. [Google Scholar] [CrossRef] [Green Version]
- Ponce, J.; Forsyth, D. Computer Vision: A Modern Approach; Pearson: London, UK, 2011. [Google Scholar]
- Koivuniemi, J.; Korhonen, K. Inventory by compartments. In Forest Inventory, Methodology and Applications. Managing Forest Ecosystems; Kangas, A., Maltamo, M., Eds.; Springer: Dordrecht, The Netherlands, 2006; Volume 10, pp. 271–278. [Google Scholar]
- Bettinger, P.; Boston, K.; Siry, J.P.; Grebner, D.L. Forest Management and Planning; Academic Press: Cambridge, MA, USA, 2016. [Google Scholar]
- van Laar, A.; Akça, A. Sampling for Forest Inventories. In Forest Mensuration. Managing Forest Ecosystems; Springer: Dordrecht, The Netherlands, 2007; Volume 13. [Google Scholar]
- Salas, R.; Houllier, F.; Lemoine, B.; Pierrat, J.C. Forecasting wood resources on the basis of national forest inventory data, Application to Pinus pinaster Ait in southwestern France. Ann. For. Sci. 2001, 58, 785–812. [Google Scholar] [CrossRef] [Green Version]
- Kangas, A.; Maltamo, M. Forest Inventory—Methodology and Applications; 1-4020-4379-1; Springer AA: Dordrecht, The Netherlands, 2006. [Google Scholar]
- White, J.C.; Coops, N.C.; Wulder, M.A.; Vastaranta, M.; Hilker, T.; Tompalski, P. Remote Sensing Technologies for Enhancing Forest Inventories: A Review. Can. J. Remote. Sens. 2016, 42, 619–641. [Google Scholar] [CrossRef] [Green Version]
- West, P.W. Tree and Forest Measurement, 2nd ed.; Springer: Berlin/Heidelberg, Germany, 2009. [Google Scholar] [CrossRef]
- Cailliez, F. Forest Volume Estimation and Yield Prediction Vol.1—Volume Estimation; Centre Technique Forestier Tropical: Nogent-sur-Marne, France, 1980. [Google Scholar]
- Lisboa, S.N.; Guedes, B.S.; Ribeiro, N.; Sitoe, A. Biomass allometric equation and expansion factor for a mountain moist evergreen forest in Mozambique. Carbon Balance Manag. 2018, 13, 1–16. [Google Scholar] [CrossRef]
- Liu, Y.; Kumar, M.; Katul, G.G.; Porporato, A. Reduced resilience as an early warning signal of forest mortality. Nat. Clim. Chang. 2019, 9, 880–885. [Google Scholar] [CrossRef]
- Varjo, J.; Henttonen, H.; Lappi, J.; Heikkonen, J.; Juujärvi, J. Digital horizontal tree measurements for forest inventory. In Working Papers of the Finnish Forest Research Institute; Finnish Forest Research Institute: Joensuu, Finland, 2006; Volume 40. [Google Scholar]
- Mendes, M.; Paulo Coimbra, A.; Crisóstomo, M.M. Assis—Cicerone Robot With Visual Obstacle Avoidance Using a Stack of Odometric Data. IAENG Int. J. Comput. Sci. 2018, 45, 219–227. [Google Scholar]
- Mohd Ali, N.; Rashid, N.K.; Mustafah, Y.M. Performance comparison between RGB and HSV color segmentations for road signs detection. Appl. Mech. Mater. 2013, 393, 550–555. [Google Scholar] [CrossRef]
- Xie, G.; Lu, W. Image Edge Detection Based On Opencv. Int. J. Electron. Electr. Eng. 2013, 1, 104–106. [Google Scholar] [CrossRef]
- Othman, N.; Salur, M.; Karakose, M.; Aydin, I. An Embedded Real-Time Object Detection and Measurement of its Size. In Proceedings of the 2018 International Conference on Artificial Intelligence and Data Processing (IDAP), Malatya, Turkey, 28–30 September 2018. [Google Scholar] [CrossRef]
- Hussin, R.; Juhari, M.R.; Kang, N.W.; Ismail, R.C.; Kamarudin, A. Digital Image Processing Techniques for Object Detection From Complex Background Image. Procedia Eng. 2012, 41, 340–344. [Google Scholar] [CrossRef] [Green Version]
- Morphological Transformations. Available online: https://opencv-python-tutroals.readthedocs.io/en/latest/py_tutorials/py_imgproc/py_morphological_ops/py_morphological_ops.html (accessed on 24 February 2021).
- Oliveira, V.A.; Conci, A. Skin detection using HSV color space. Workshops of Sibgrapi. Available online: https://journals.plos.org/plosone/article?id=10.1371/journal.pone.0134828 (accessed on 24 February 2021).
- Minichino, J.; Howse, J. Learning OpenCV 3 Computer Vision with Python; Packt Publishing Ltd.: Birmingham, UK, 2015. [Google Scholar]
- Sterenczak, K.; Mielcarek, M.; Wertz, B.; Bronisz, K.; Zajaczkowki, G.; Jagodzinki, A.M.; Ochal, W.; Skorupski, M. Factors influencing the accuracy of ground-based tree-height measurements for major European tree species. J. Environ. Manag. 2019, 231, 1284–1292. [Google Scholar] [CrossRef] [PubMed]
- Gerum, R.C.; Winterl, A.; Fabry, C.; Zitterbart, D.P. CameraTransform: A Python package for perspective corrections and image mapping. SoftwareX 2019, 10, 100333. [Google Scholar] [CrossRef]
- Husch, B.; Beers, T.W.; Kershaw, J.A., Jr. Forest Mensuration, 4th ed.; Wiley: Hoboken, NJ, USA, 2002. [Google Scholar]
- Křepela, M.; Petráš, R. Comparison of Norway spruce (Picea abies [L.] Karst.), Scots pine (Pinus sylvestris L.) and European larch (Larix decidua Mill.) stem shape by means of geometrical methods. J. For. Sci. 2006, 52, 337–347. [Google Scholar] [CrossRef] [Green Version]
- Kärki, T.; Maltamo, M.; Eerikäinen, K. Diameter distribution, stem volume and stem quality models for grey alder (Alnus incana) in eastern Finland. New For. 2000, 20, 65–86. [Google Scholar] [CrossRef]
- Hjelm, B. Stem taper equations for poplars growing on farmland in Sweden. J. For. Res. 2013, 24, 15–22. [Google Scholar] [CrossRef]
- Santos, M.; Rodrigues, R.; Lima, M.; Martins, W.; Costa, B.; Suzuki, P. Hypsometric models for a clonal plantation of Tectona grandis Linn F. subjected to selective thinning. Rev. Agro@ Mbiente Line 2019, 13, 35–45. [Google Scholar] [CrossRef]
- Hugh, B.; Shongming, H.; Derek, S. Wood fibre value simulation model: A new tool to assist measuring changes in forest landscapes by evaluating forest inventory. Landsc. Ecol. 2017, 32, 1517–1530. [Google Scholar]
Figure 1.
Red rectangular target specially designed to facilitate image processing and camera calibration.
Figure 1.
Red rectangular target specially designed to facilitate image processing and camera calibration.

Figure 2.
Target positioned behind a tree in a virtual environment.

Figure 3.
Detection of the specially designed target and its contours extracted from the image.

Figure 4.
Line projection method to determine the tree’s height. The green lines represent the line segments determined, the blue lines represent the linear projection of the tree stem up to the top of the tree, where the lines intersect.
Figure 4.
Line projection method to determine the tree’s height. The green lines represent the line segments determined, the blue lines represent the linear projection of the tree stem up to the top of the tree, where the lines intersect.

Figure 5.
Steps of the proportion transformation height calculation method.

Figure 6.
Typical pine tree shape function of a tree with approximately 14.4 m height.

Figure 7.
Typical pine tree shape contour, with an approximated shape function represented in yellow.
Figure 7.
Typical pine tree shape contour, with an approximated shape function represented in yellow.

Figure 8.
Steps of the method proposed to determine and apply the tree shape function.

Figure 9.
Hypsometric function, relating tree height to diameter in several trees.

Figure 10.
Tree segmentation method. The yellow lines represent four tree base sections approximated as truncated cones. The black lines represent the remaining tree stem, approximated as a cone (not to scale in the image).
Figure 10.
Tree segmentation method. The yellow lines represent four tree base sections approximated as truncated cones. The black lines represent the remaining tree stem, approximated as a cone (not to scale in the image).

Figure 11.
Tree segmentation method. The blue lines represent segments along the tree stem.

Figure 12.
Pictures of some trees tested. The pictures show young to mid age trees in a forest stand, with the target behind the tree being measured.
Figure 12.
Pictures of some trees tested. The pictures show young to mid age trees in a forest stand, with the target behind the tree being measured.


Table 1.
Results of the height calculation methods applied to pictures taken in a real forest scenario. Heights are in meters, errors as a% of the height estimated using the traditional method.
Table 1.
Results of the height calculation methods applied to pictures taken in a real forest scenario. Heights are in meters, errors as a% of the height estimated using the traditional method.
| Tree | Line Projection | Proportion Transformation | Shape Function | Hypsometric Relation | Traditional Method |
|---|---|---|---|---|---|
| tree1 | 12.24 (+24.44%) | 12.65 (+21.91%) | 18.54 (+14.44%) | 13.55 (+16.36%) | 16.20 |
| tree2 | 11.34 (+27.77%) | 11.64 (+25.86%) | 10.36 (+34.01%) | 13.96 (+11.08%) | 15.70 |
| tree3 | 10.83 (+27.80%) | 12.87 (+14.20%) | 14.93 (+0.47%) | 13.91 (+7.27%) | 15.00 |
| tree4 | 12.84 (+29.06%) | 13.76 (+23.98%) | 15.81 (+12.65%) | 14.16 (+21.77%) | 18.10 |
| tree5 | 12.47 (+11.87%) | - | 17.85 (−26.15%) | 13.84 (+2.19%) | 14.15 |
| tree6 | 6.67 (+58.05%) | - | 20.93 (−31.64%) | 13.16 (+17.23%) | 15.90 |
| tree7 | 12.86 (+19.63%) | - | 20.12 (−25.75%) | 14.02 (+12.38%) | 16.00 |
| tree8 | 11.86 (+26.34%) | - | 22.34 (−38.76%) | 13.07 (+18.82%) | 16.10 |
| tree9 | 10.23 (+36.06%) | 12.65 (+20.94%) | 19.23 (−20.19%) | 13.83 (+13.56%) | 16.00 |
| tree10 | 10.87 (+29.87%) | 12.74 (+17.81%) | 16.67 (−7.55%) | 13.23 (+14.65%) | 15.50 |
| tree11 | 12.34 (+14.31%) | 11.12 (+22.78%) | 18.32 (−27.22%) | 13.56 (+5.83%) | 14.40 |
| tree12 | 12.22 (+10.15%) | 11.87 (+12.72%) | 18.20 (−33.82%) | 14.29 (−5.07%) | 13.60 |
| Avg | 4.80 (26.28%) | 7.95 (46.68%) | 1.58 (22.72%) | 2.49 (12.18%) | - |
| StD | 1.71 (12.75%) | 6.14 (39.55%) | 3.13 (11.80%) | 0.40 (6.05%) | - |
Table 2.
Results of the volume calculation methods applied to pictures taken in a real forest scenario, Volumes are in cubic meters, errors as a% of the volume estimated using the traditional method.
Table 2.
Results of the volume calculation methods applied to pictures taken in a real forest scenario, Volumes are in cubic meters, errors as a% of the volume estimated using the traditional method.
| Tree | Tree Segmentation | Huber | Smalian | Newton | Newton/Shape Func. | Shape Coef. | Traditional Met. |
|---|---|---|---|---|---|---|---|
| tree1 | (+28.83%) | (+17.70%) | (+17.70%) | (+15.48%) | (+8.99%) | (+8.81%) | |
| tree2 | (+27.08%) | (+24.65%) | (+22.22%) | (+17.36%) | (+31.94%) | (+7.63%) | |
| tree3 | (+33.00%) | (+27.18%) | (+24.26%) | (+24.26%) | (−36.91%) | (+9.70%) | |
| tree4 | (+43.69%) | (+30.97%) | (+27.34%) | (+27.34%) | (−14.44%) | (+12.81%) | |
| tree5 | (+32.97%) | (+25.08%) | (+21.14%) | (+21.14%) | (−41.96%) | (+9.31%) | |
| tree6 | (+32.13%) | (+23.08%) | (+18.55%) | (+18.55%) | (−189.59%) | (+9.50%) | |
| tree7 | (+27.41%) | (+12.39%) | (+7.38%) | (+2.38%) | (−42.68%) | (−5.13%) | |
| tree8 | (+38.76%) | (+37.46%) | (+37.46%) | (+36.16%) | (+17.92%) | (+23.13%) | |
| tree9 | (+16.07%) | (+4.08%) | (+1.08%) | (+1.08%) | (−28.90%) | (−1.92%) | |
| tree10 | (+17.74%) | (+15.00%) | (+9.51%) | (+6.77%) | (−15.16%) | (+4.03%) | |
| tree11 | (+34.73%) | (+30.89%) | (+30.89%) | (+28.97%) | (+11.69%) | (+13.61%) | |
| tree12 | (+11.36%) | (+5.17%) | (+1.05%) | (+1.05%) | (−38.12%) | (−7.19%) | |
| Avg | 0.15 (28.39%) | 0.12 (20.85%) | 0.11 (17.92%) | 0.10 (16.41%) | −0.06 (40.35%) | 0.05 (10.90%) | - |
| StD | 0.09 (9.54%) | 0.09 (10.45%) | 0.09 (11.55%) | 0.10 (11.78%) | 0.12 (49.01%) | 0.11 (6.85%) | - |
Publisher’s Note: MDPI stays neutral with regard to jurisdictional claims in published maps and institutional affiliations. |
© 2021 by the authors. Licensee MDPI, Basel, Switzerland. This article is an open access article distributed under the terms and conditions of the Creative Commons Attribution (CC BY) license (http://creativecommons.org/licenses/by/4.0/).
Share and Cite
MDPI and ACS Style
Coelho, J.; Fidalgo, B.; Crisóstomo, M.M.; Salas-González, R.; Coimbra, A.P.; Mendes, M. Non-Destructive Fast Estimation of Tree Stem Height and Volume Using Image Processing. Symmetry 2021, 13, 374. https://doi.org/10.3390/sym13030374
AMA Style
Coelho J, Fidalgo B, Crisóstomo MM, Salas-González R, Coimbra AP, Mendes M. Non-Destructive Fast Estimation of Tree Stem Height and Volume Using Image Processing. Symmetry. 2021; 13(3):374. https://doi.org/10.3390/sym13030374
Chicago/Turabian StyleCoelho, João, Beatriz Fidalgo, Manuel M. Crisóstomo, Raúl Salas-González, A. Paulo Coimbra, and Mateus Mendes. 2021. "Non-Destructive Fast Estimation of Tree Stem Height and Volume Using Image Processing" Symmetry 13, no. 3: 374. https://doi.org/10.3390/sym13030374
Note that from the first issue of 2016, this journal uses article numbers instead of page numbers. See further details here.