1. Introduction
At present, the fundamental development mode of agricultural production lies in the realization of sustainable and stable development of agriculture through science to ensure the long-term effective supply of agricultural products. Therefore, agricultural scientific and technological innovation is the fundamental way for China to realize this development, and is also an important engine to realize the rural revitalization strategy. With the rapid development of agriculture, the innovation vigor of agricultural science and technology in China has been further released, and the innovation efficiency has been further improved. However, due to the differences in natural conditions, the economic development level, the urbanization level, and the poverty coverage rates among different regions, there is still a clear gap between agricultural science and the technology innovation development level in China and developed countries, which has become an important bottleneck restricting agricultural development in China. Therefore, improving the development level of agricultural science and technology innovation is an important path to achieving high-quality agricultural development in China [
1,
2].
The evaluation of the development level of agricultural science and technology innovation is important. The research of domestic and foreign scholars on the development of agricultural science and technology innovation mainly starts from two dimensions: first is the measurement at the macro level. For example, Spielman et al. [
3] designed and constructed a framework for determining national agricultural innovation indicators. Since innovation is a complex process, measurement typically requires a set of indicators to evaluate the efforts (i.e., national R&D or promotion expenditures), results (i.e., the number of patents and publications), and impacts (i.e., the total factor productivity growth) [
2]. The second is the measurement at the micro level. Ariza et al. [
4] and Karafilis et al. [
5] measured innovation through technology adoption and assessed the level of agricultural innovation on farms.
Läpple et al. [
6] extended the expert opinion and the farm level data, constructed the complex agricultural innovation index, and evaluated the farm innovation level. Ariza et al. [
4] designed an innovation matrix to calculate an innovation index to provide values for the innovation activities of each farm. This matrix divides innovation into major innovation, intermediate innovation, and secondary innovation according to the degree of technological progress of innovation. Both macro and micro studies showed that there was spatial heterogeneity in the development level of agricultural science and technology innovation; that is, there are great differences in agricultural innovation between different regions [
7,
8,
9], which can be explained by the differences in policies, institutional settings, infrastructure environment, or knowledge transfer systems among countries [
10,
11]. Although the performance of agricultural innovation varies from country to country, the distribution of innovation activities in different regions is generally uneven [
12,
13]. In other words, there may be regional dynamics that affect innovation efforts.
On this basis, scholars further studied the spatial differentiation degree of agricultural science and technology innovation development among different regions in China, and drew a conclusion: the innovation and development of agricultural science and technology in China has a large spatial differentiation and asymmetry [
14], and there is a significant spatial imbalance. With further research, scholars proposed that agricultural science and technology innovation has a spatial spillover effect [
15,
16], which is not only related to the level of agricultural development in the region itself, but also affected by agricultural development factors, economic factors, and social factors in the geographical neighboring regions [
17].
Spatial concentration has a positive impact on knowledge exchange among economic entities, which may lead to the adoption of spatially aggregated technologies [
18,
19]. Researchers also found that firms closer to the knowledge center had higher innovation performance than those far away from the knowledge center [
20,
21]. Breschi [
22] argued that, although innovation activities tend to gather in specific locations, there may be significant differences in the geographical concentration and spatial organizational strength of innovation processes among different sectors [
23,
24]. On the other hand, Boshma [
25] believed that other dimensions (such as cognition, organization, society, and institution) are equally important or even more important. Therefore, it is clear that the emergence of innovation has an important spatial dimension.
The above documents laid a foundation for research on the innovation and development of agricultural science and technology in China. Due to the complexity of the research problems and the limitations of the methods, while scholars have proved that the development of agricultural science and technology innovation has spatial differentiation characteristics based on attribute data, they lack in-depth consideration of the spatial correlation characteristics of agricultural science and technology innovation development based on relational data, and it is difficult to reveal the overall network structure characteristics of China’s agricultural science and technology innovation and development. As the innovation and development of agricultural science and technology is the comprehensive embodiment of the factors of technology, efficiency, policy, and system, these developments are not only affected by the local economic development level and other factors but also may be affected by the economic and social factors in other regions [
13].
With the continuous promotion of the national allocation of innovation elements, the spatial correlation of agricultural science and technology innovation development has become more common and extensive and has gone beyond the nearest neighbor relationship in the simple geographical sense and now presents a complex network structure with multiple correlations. To sum up, under the condition that the spatial correlation between provinces actually exists, each province and region should not only consider the situation of the region itself, but also fully consider and effectively borrow from the provinces and regions associated with it to grasp and improve the development level of agricultural science and technology innovation as a whole.
In view of this, we divided the process of agricultural science and technological innovation into two stage. We used a social network analysis method to construct and analyze the network structure characteristics of the network structures, and to determine the factors that affect the spatial relevance of China’s agricultural science and technology innovation and development. This study was designed to helpful to solve the problems existing in the development process of China’s agricultural science and technology innovation, with the hope to provide a policy reference for the research on the spatial correlation network structure and influencing factors of agricultural science and technology innovation development.
2. Research Design and Variable Description
2.1. Measurement of the Innovative Development Level of Agricultural Science and Technology
The improvement of efficiency has always been the key direction of China’s agricultural science and technology innovation development [
13], which can also be used as a comprehensive index to measure China’s agricultural science and technology innovation development. Because agricultural science and technology innovation is a complex process composed of multiple links, this paper divides the process of agricultural science and technology innovation into two stages: agricultural technology research and development and agricultural technology application, and uses a two-stage correlation DEA efficiency evaluation model [
26] to measure the development efficiency of agricultural science and technology innovation in 30 provinces and autonomous regions (excluding Tibet, Hong Kong, Macao, and Taiwan) in two stages.
In the DEA model, the input–output variables of the two stages are respectively: the input indicators of the stage of agricultural technology research and development adopt the regional research and experimental development of agricultural R&D personnel full-time equivalent and agricultural R&D expenditure indicators, and the output indicators are the number of agriculture-related patent applications and the number of agriculture-related patent authorizations. The input index in the application stage of agricultural technology is the output index in the research and development stage of agricultural technology; that is, the number of agriculture-related patent authorizations and agriculture-related patent applications. The output index is the total transaction amount of the agricultural technology market and the total agricultural output value.
2.2. Determination of the Spatial Relationship of the Agricultural Science and Technology Innovation and Development Network
The improved gravity modeling method, which is better than the Vector Autoregression Models (VAR) Granger testing method, was used to confirm the spatial correlation relationship of agricultural science and technology innovation development, and the spatial correlation matrix was obtained. The improved gravity model formula is as follows:
In Formula (1), Y_ij represents the correlation strength of innovation development between Regions I and J; E_i and E_j represent the years of education per capita in regions I and J; G_i and G_j represent the per capita GDP of regions I and J; M_i and M_j represent the innovation efficiency of region I and J, and D_ij represents the straight-line distance between the provincial capitals (municipalities directly under the Central government).
2.3. Characteristic Indexes of the Network Structure
For the characteristic indexes depicting the network structure, we used the social network analysis method to depict the spatial correlation network structure of agricultural science and technology innovation and development from three parts, the overall, local, and individual network characteristics. Among them, the overall network characteristics were mainly characterized by four indexes: the network density, network association number, network hierarchy, and network efficiency. The characteristics of local networks were mainly analyzed using the block model. The characteristics of individual networks are usually reflected by three indexes: relative centrality, intermediary centrality, and proximity centrality. The specific formula is shown in
Table 1:
2.4. Analysis of the Influencing Factors of Spatial Correlation of Agricultural Science and Technology Innovation Development in China
The spatial correlation network of agricultural science and technology innovation development is influenced by many factors. Through a literature review, we see that, first, the spatial correlation intensity of agricultural science and technology innovation development is significantly correlated with the geographical distance, and geographically close provinces may show more spillover of the agricultural science and technology innovation development level. Secondly, the spatial differentiation of geographical things is also affected by economic, social, environmental, and other factors. Therefore, we can infer that the spatial correlation of agricultural science and technology innovation development may be related to the size of the regional differences in agricultural economic development. The development level of the agricultural economy can be shown from four aspects, the scale structure difference, factor input difference, factors output difference, and sustainable level difference.
Thirdly, the agricultural science and technology market is the channel through which agricultural technology can be applied and diffused. The level of the agricultural science and technology market may be related to the spatial correlation of agricultural science and technology innovation and development. In addition, the level of agricultural human capital may also affect the spatial correlation of agricultural science and technology innovation development, which is mainly reflected by two aspects: the difference in agricultural labor quality and the difference in the number of years of education of employees.
Finally, differences in the degree of agricultural policy support may also affect the correlation degree of agricultural science and technology innovation development of different regions in China. In this paper, the difference in the degree of government support for agriculture is included in the consideration of the influencing factors of the spatial correlation network of China’s agricultural science and technology innovation and development. The specific measurement indicators of influencing factor are shown in
Table 2.
In this paper, Quadratic Assignment Procedure (QAP) regression analysis was used to measure the influencing factors. We assume that the dependent variable is the spatial correlation of China’s agricultural science and technology innovation and development and, then, express the five influencing factor groups with nine influencing factors. The independent variables are the total output value of agriculture, forestry, fishery, and animal husbandry; the proportion of the sown area of grain crops; the labor per crop sown area; the grain yield per unit sown area of grain crops; the fertilizer use per unit crop sown area; the pesticide usage per unit crop sown area; the difference in technical market turnover; the differences in the quality of the agricultural labor force; the number of employees with more than 15 years of education; the differences in the funds raised for agricultural science and technology; and the spatial adjacency matrix. The model can be established as follows:
Spatial incidence matrix; A, B, C, E, F, G, H, I, J, K are the regional difference matrix of each influencing factor in 2018, and D is the spatial adjacency matrix.
2.5. Data Sources
Considering the availability of data, this paper took data from 30 provinces and autonomous regions (excluding Tibet, Hong Kong, Macao, and Taiwan) in China from 2000 to 2018 as the research sample. The data used were from The Statistical Yearbook of High Technology Industries in China, The Statistical Yearbook of China, and the official website of the State Intellectual Property Office of the People’s Republic of China from 2000 to 2018.
3. Analysis of the Spatial Correlation Network Structure of Agricultural Science and Technology Innovation Development in China
3.1. Evolutionary Law of the Development Level of Agricultural Science and Technology Innovation in China
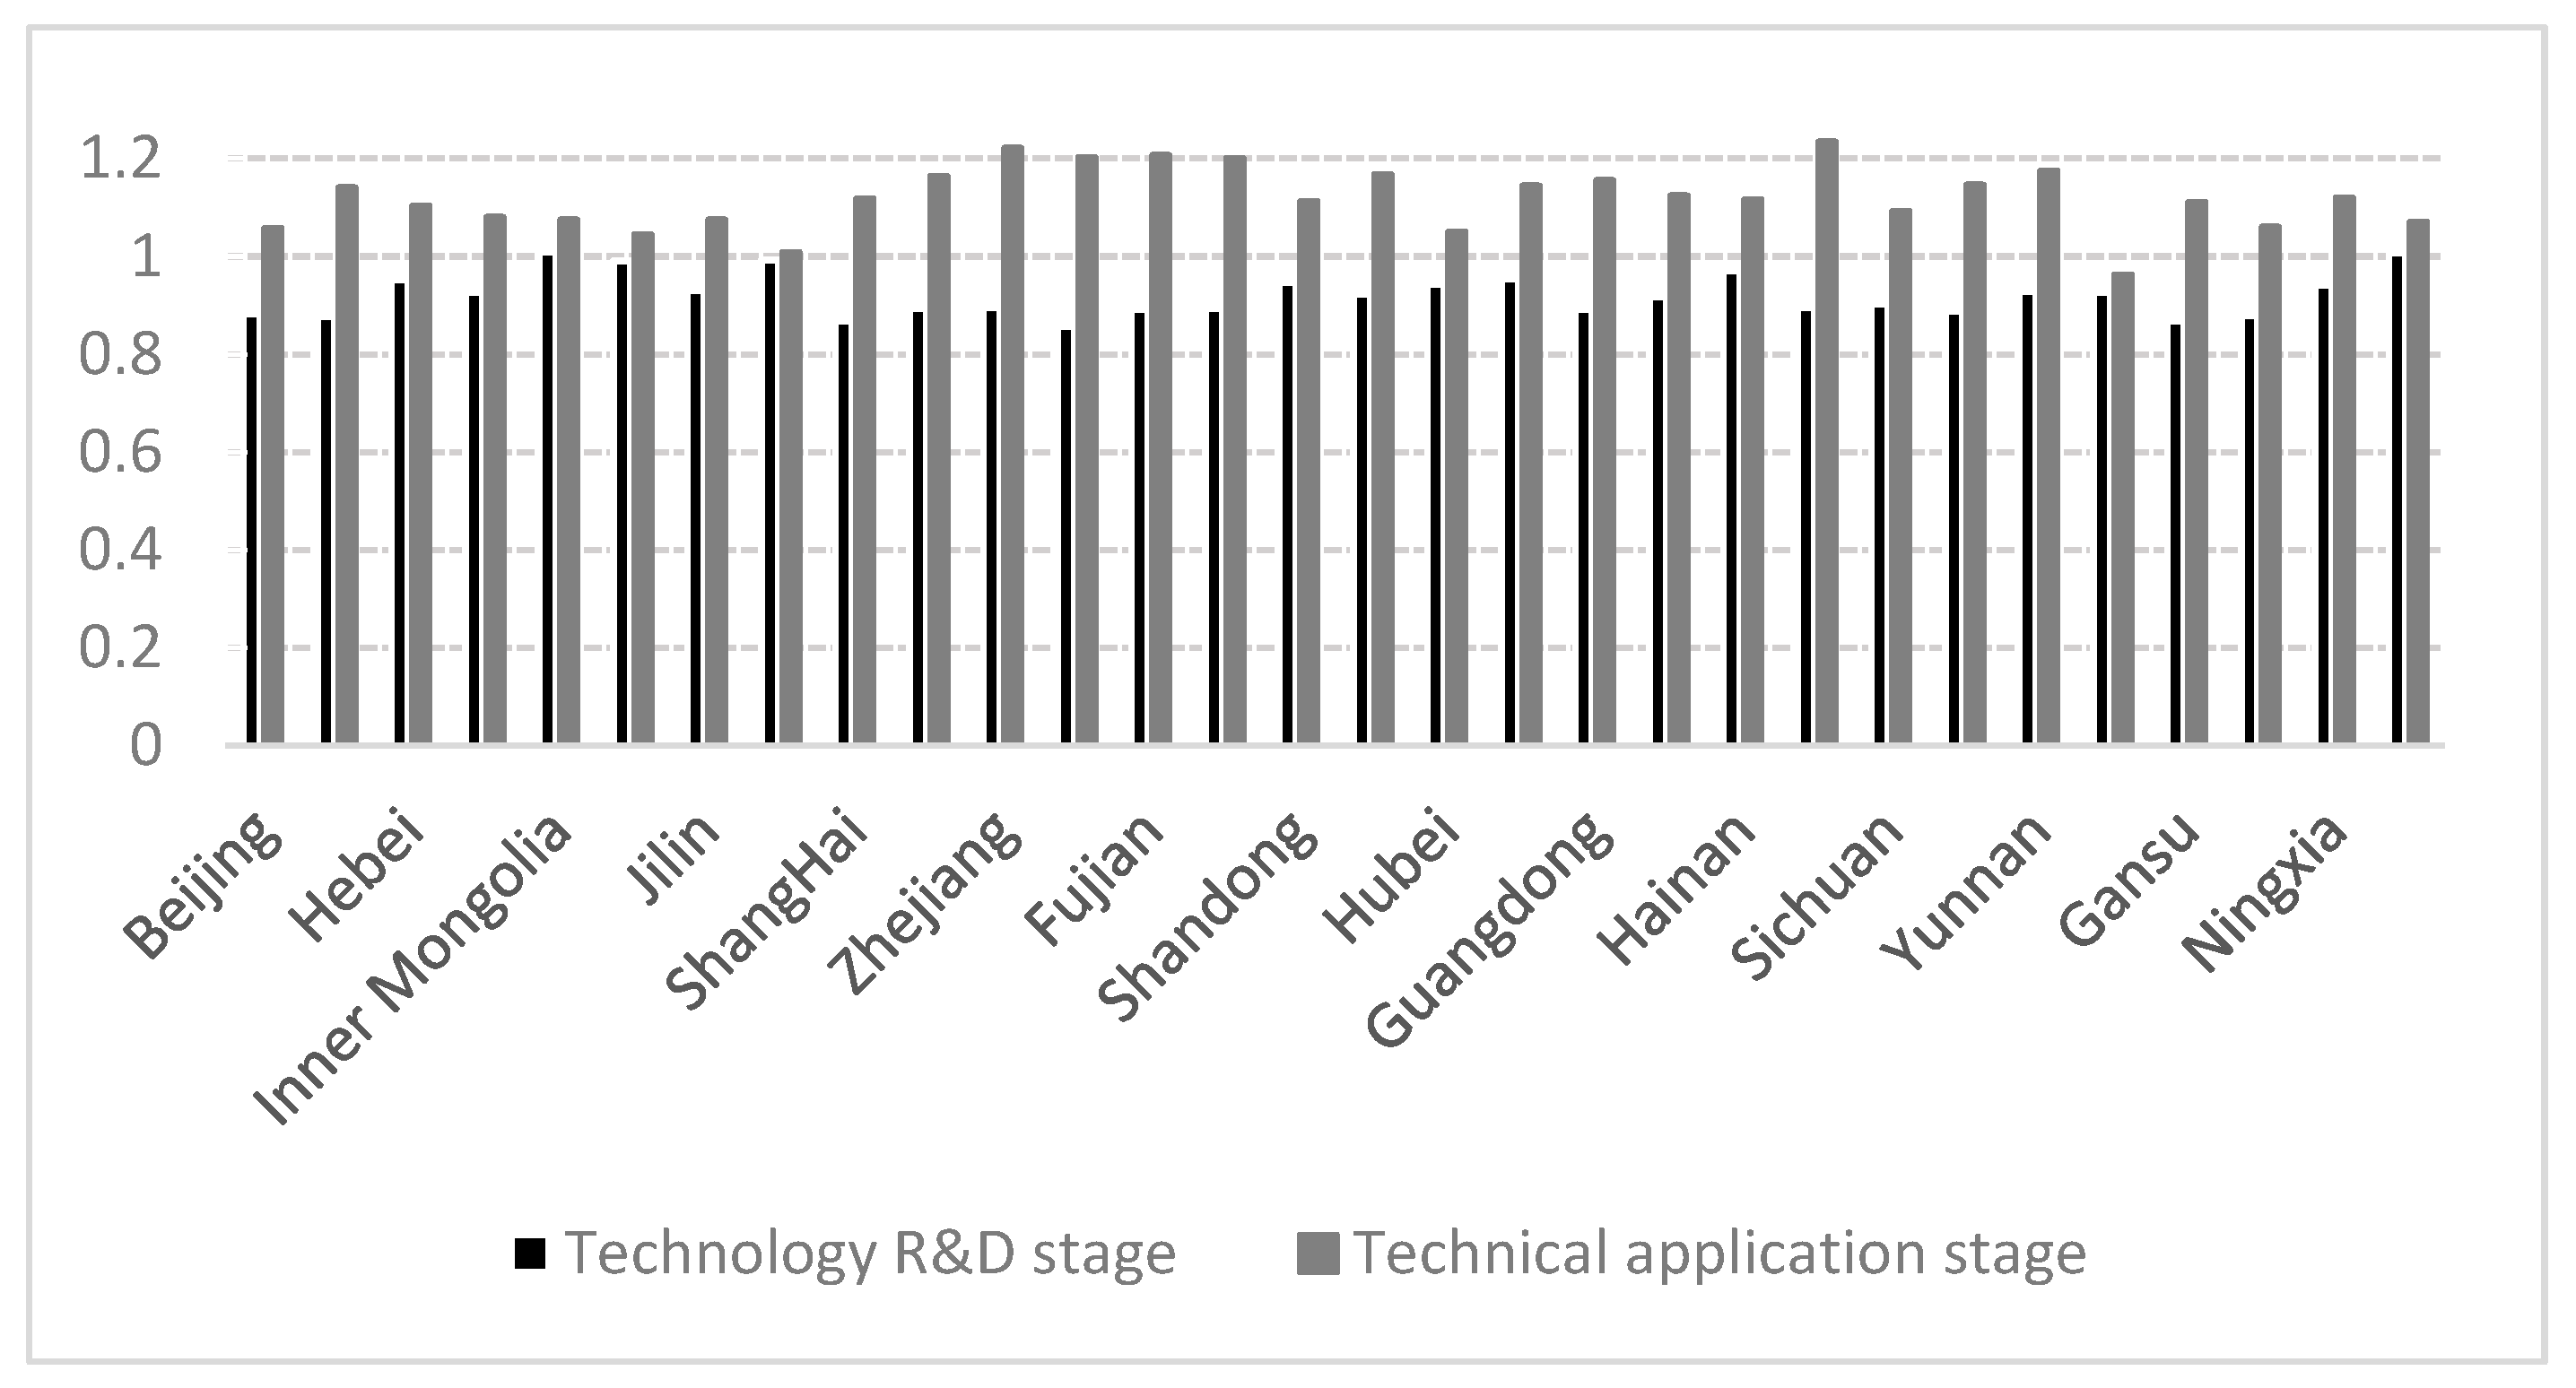
According to the measurement results of agricultural science and technology innovation efficiency from 2000 to 2018 in China, we draw
Figure 1 and
Figure 2. We take the measurement results of the agricultural technology innovation efficiency of 30 provinces in mainland China in 2018 as an example, as shown in
Figure 1.
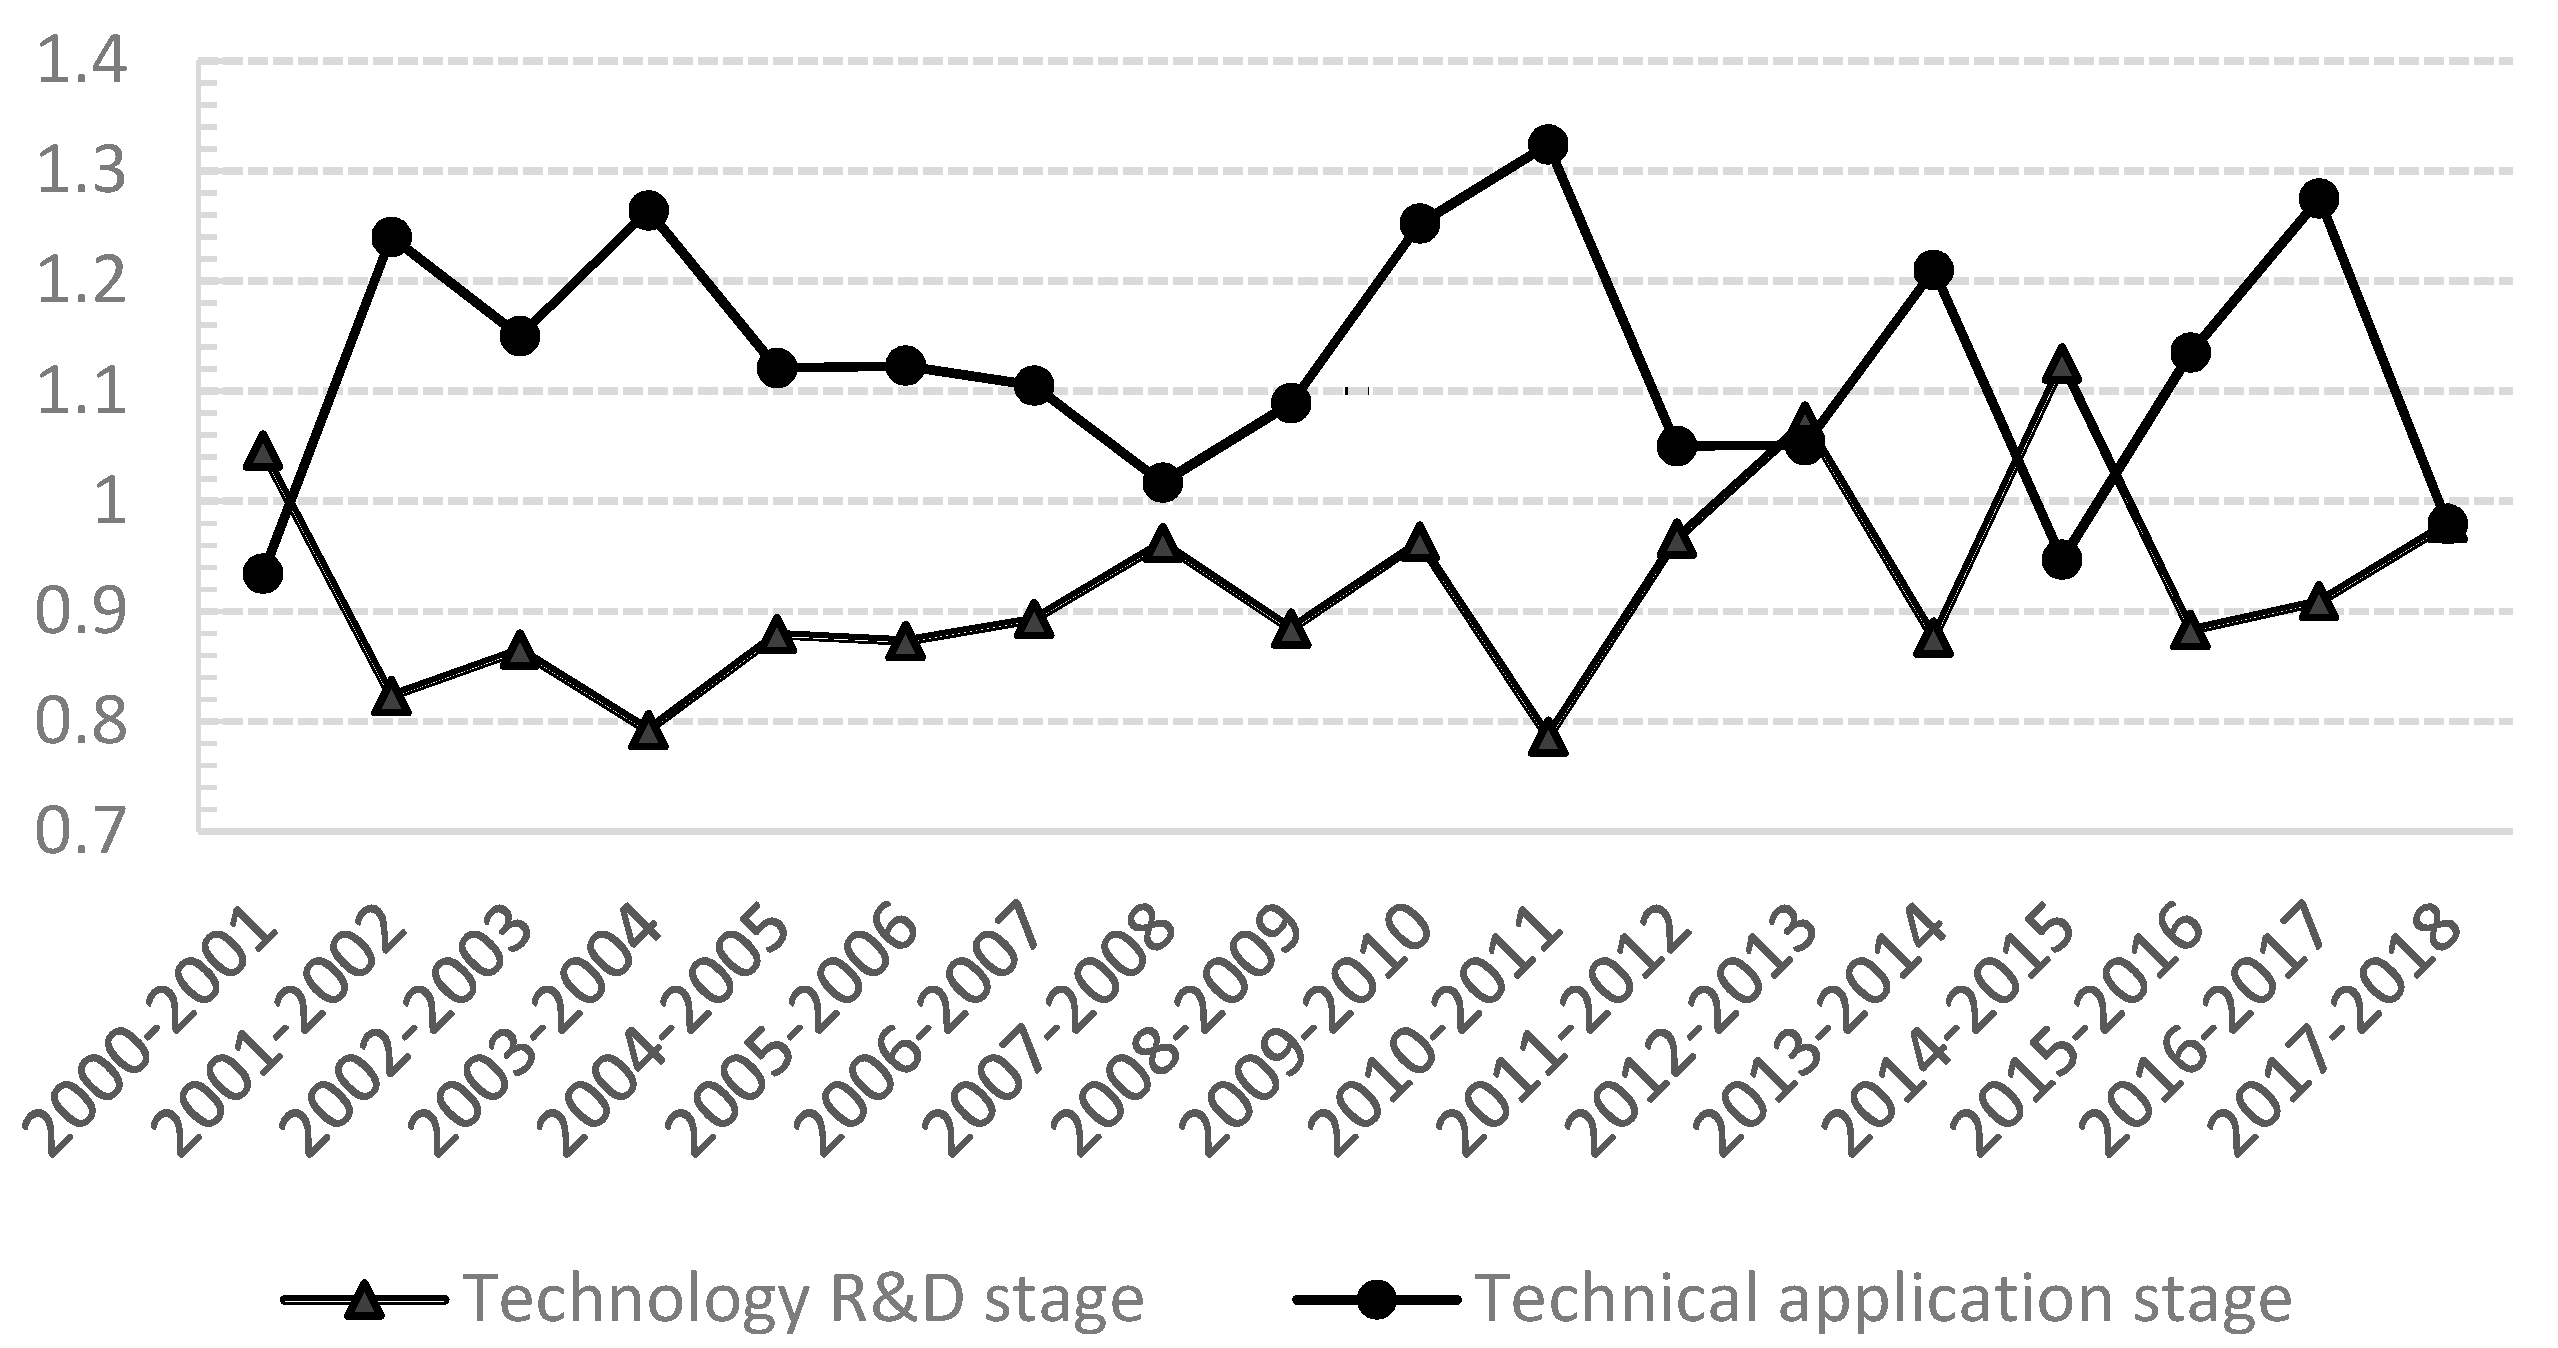
Figure 2 shows the evolutionary law of average agricultural science and technology innovation efficiency from 2000 to 2018 in China, that is, the change trend of the development level of agricultural science and technology innovation in 30 provinces in China from 2000 to 2018. It can be seen from
Figure 1 and
Figure 2: First, the development level of agricultural technology innovation in 30 provinces, municipalities, and autonomous regions in mainland China still has spatial differences, and the level of agricultural technology innovation development in different provinces at the two stages is quite different. Second, the development level of agricultural science and technology innovation shows a fluctuating trend in both the technology R&D stage and the technology application stage. Third, the development level of agricultural science and technology innovation in technology application stage is generally higher than that in Technology R&D stage.
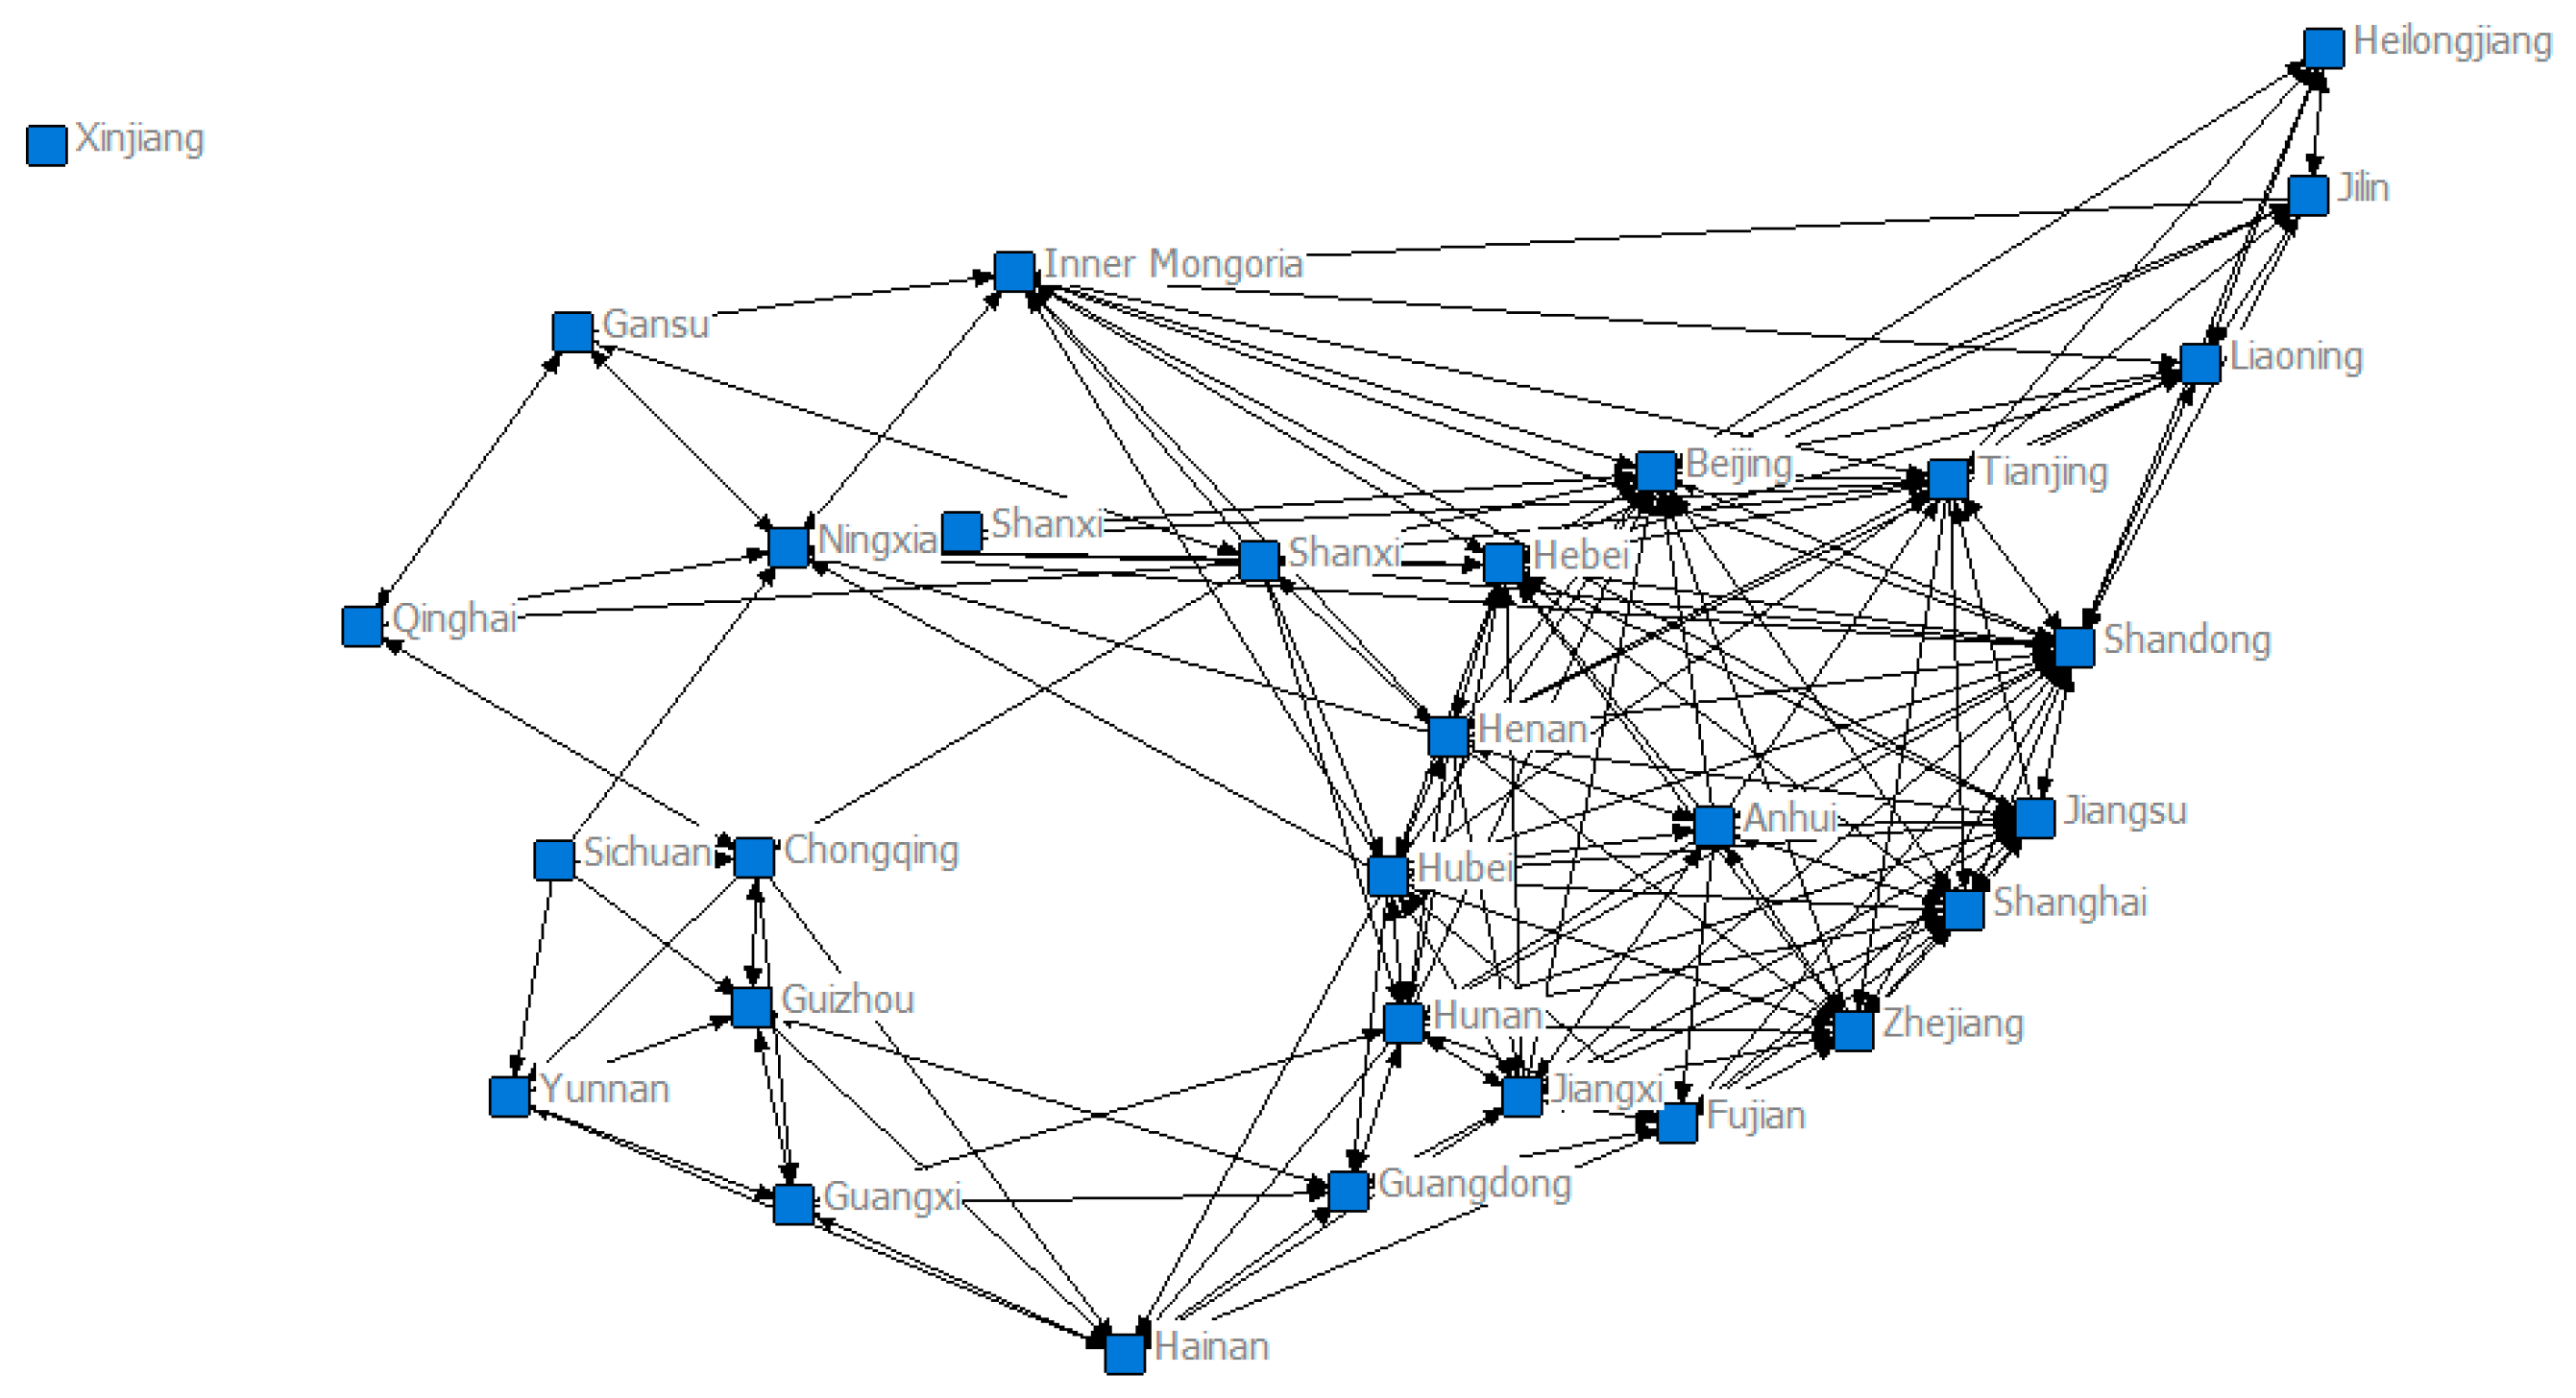
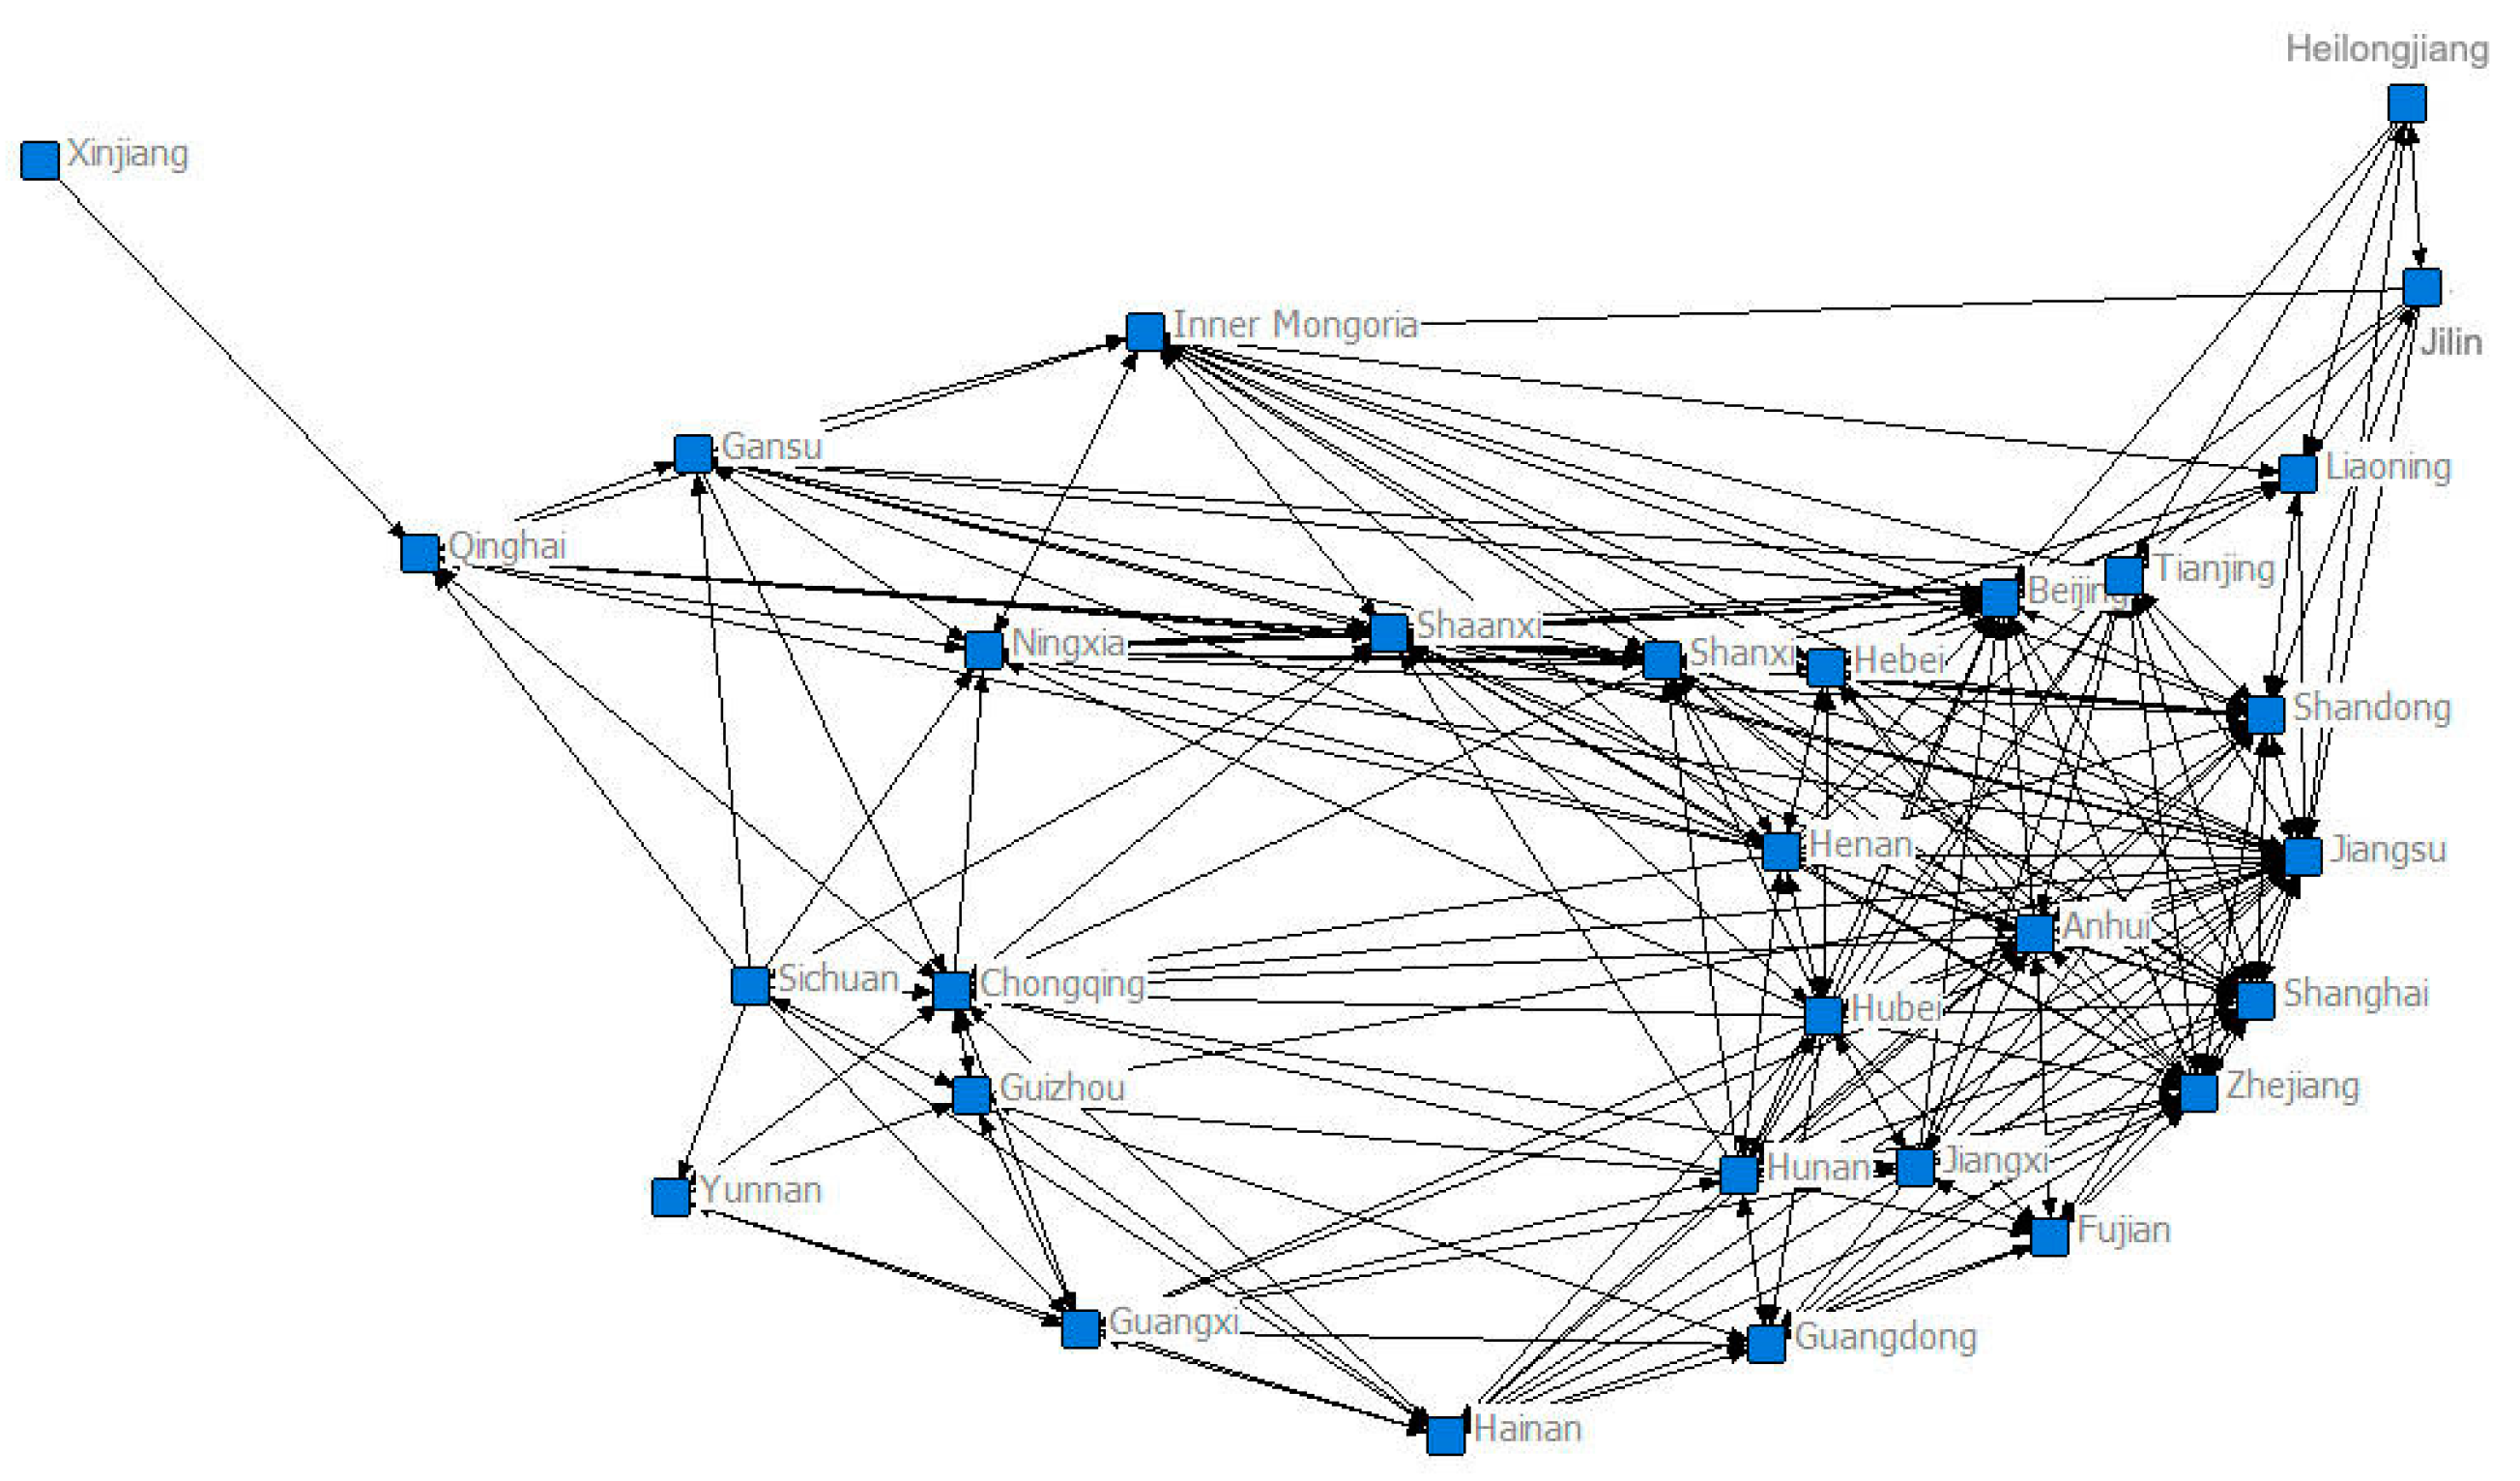
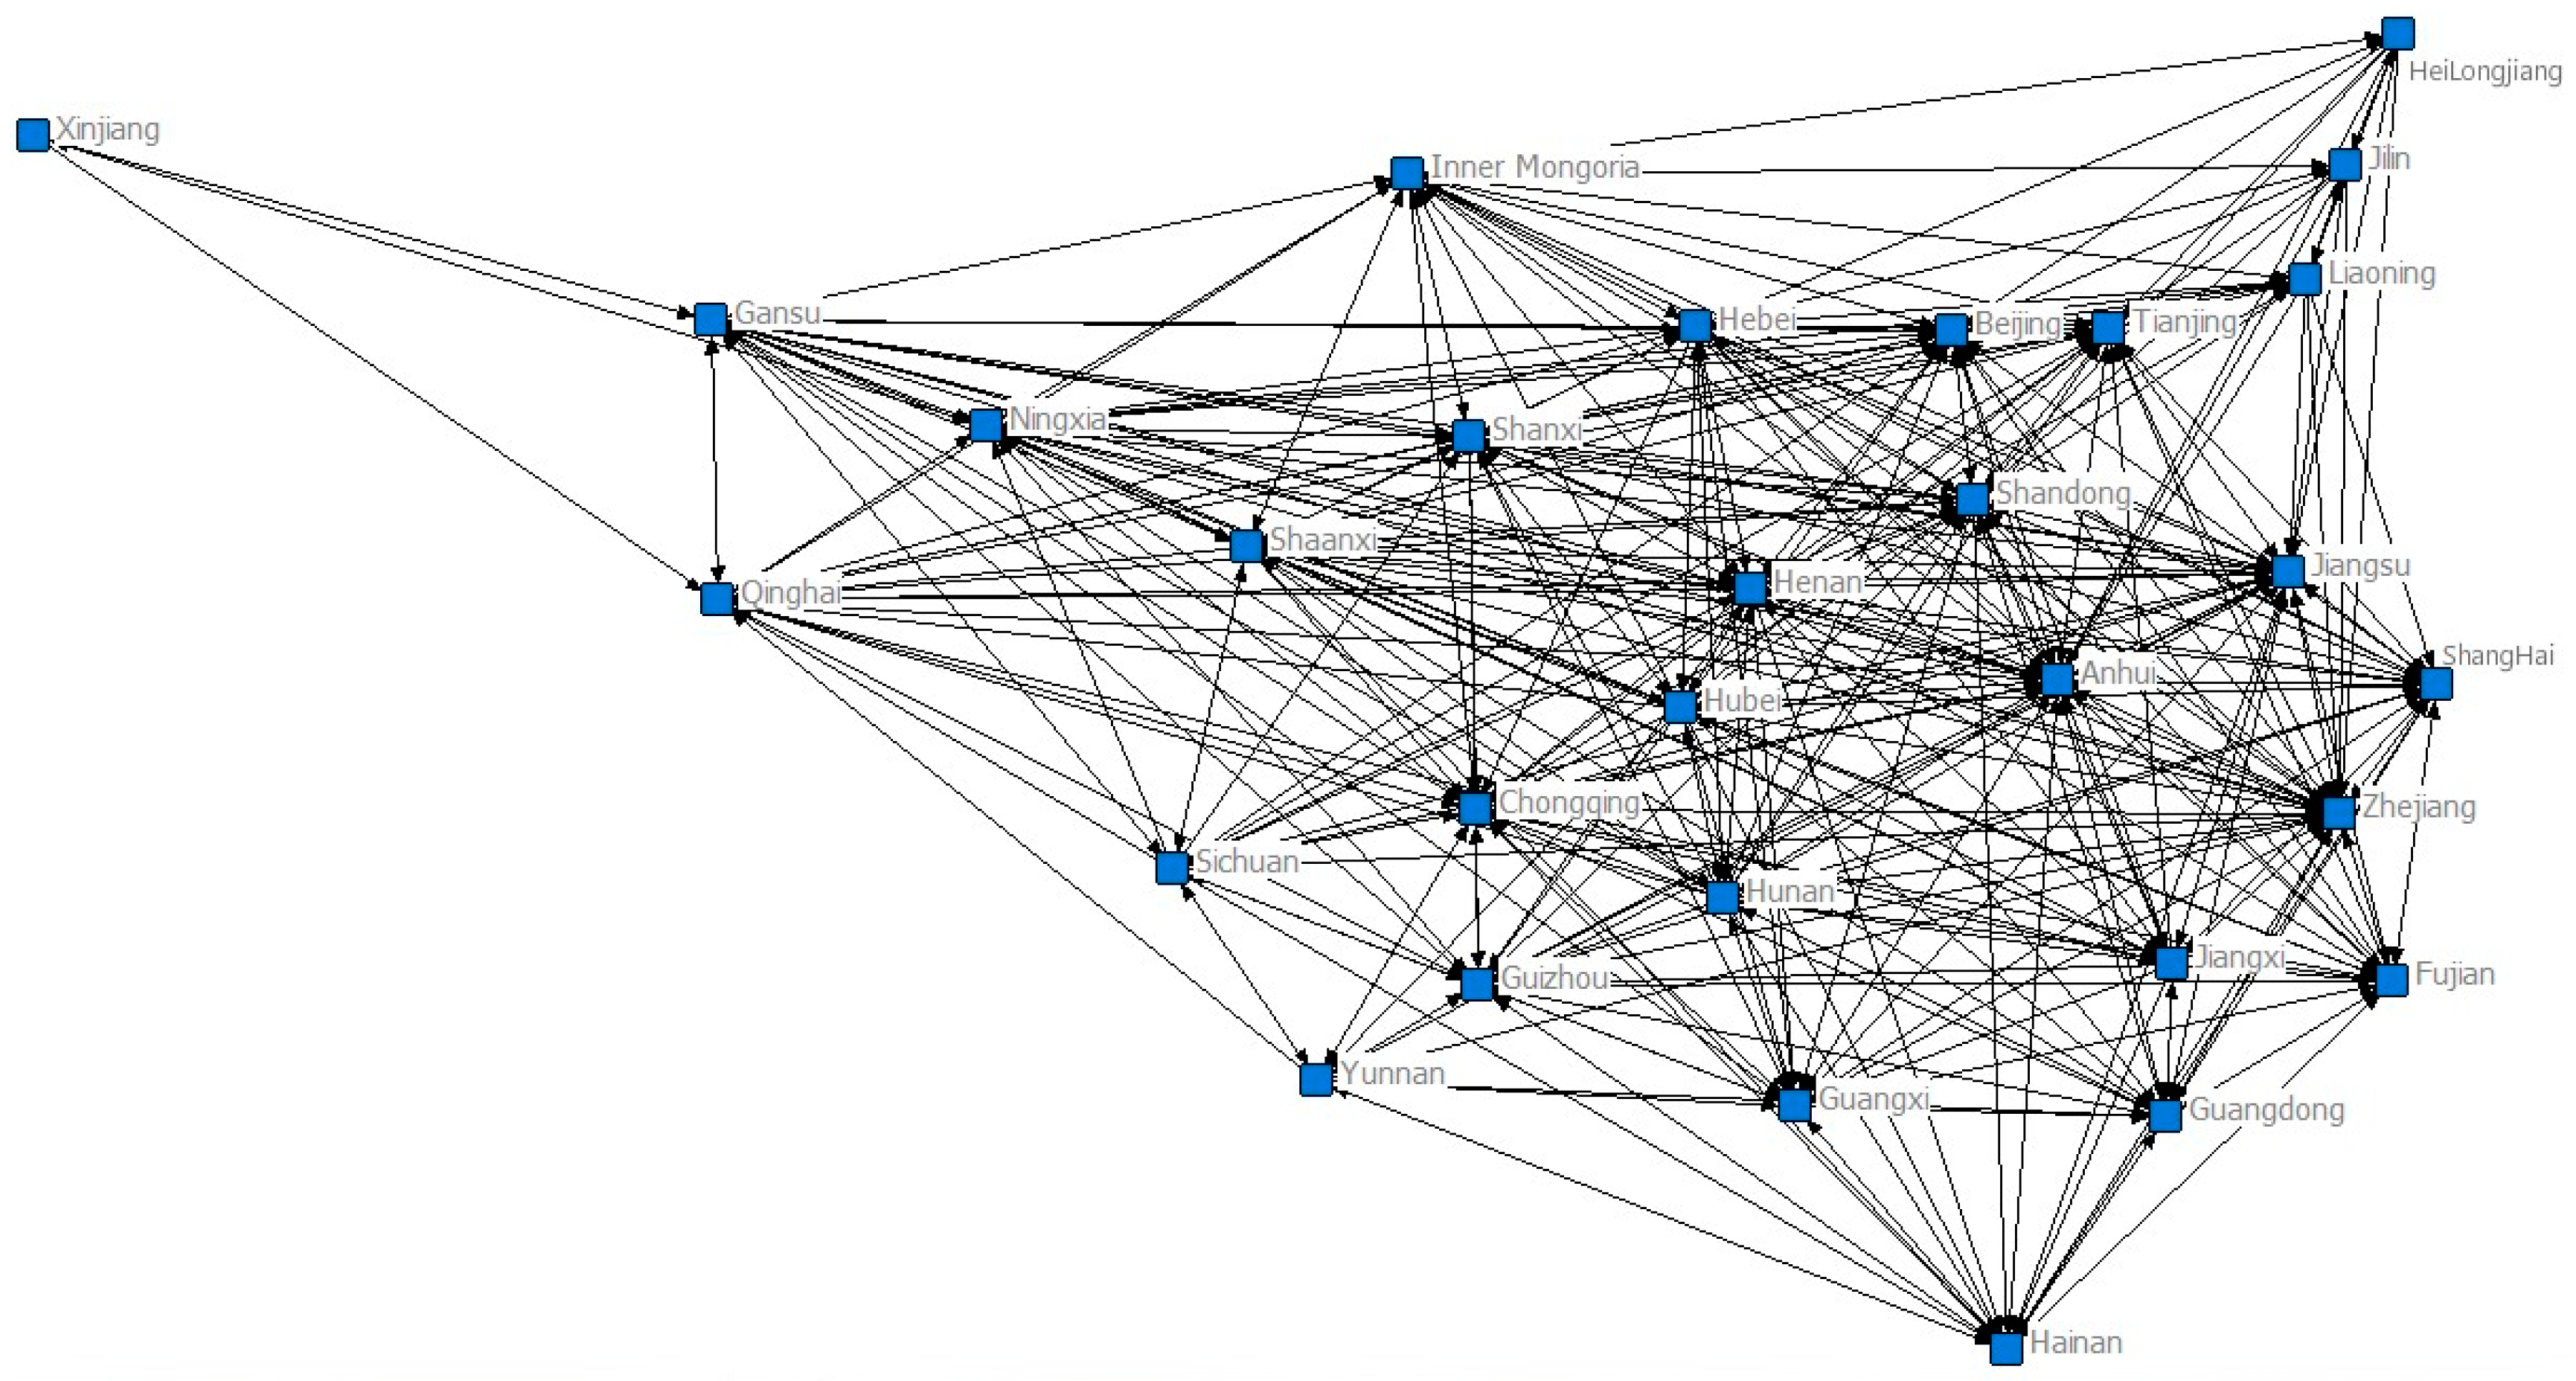
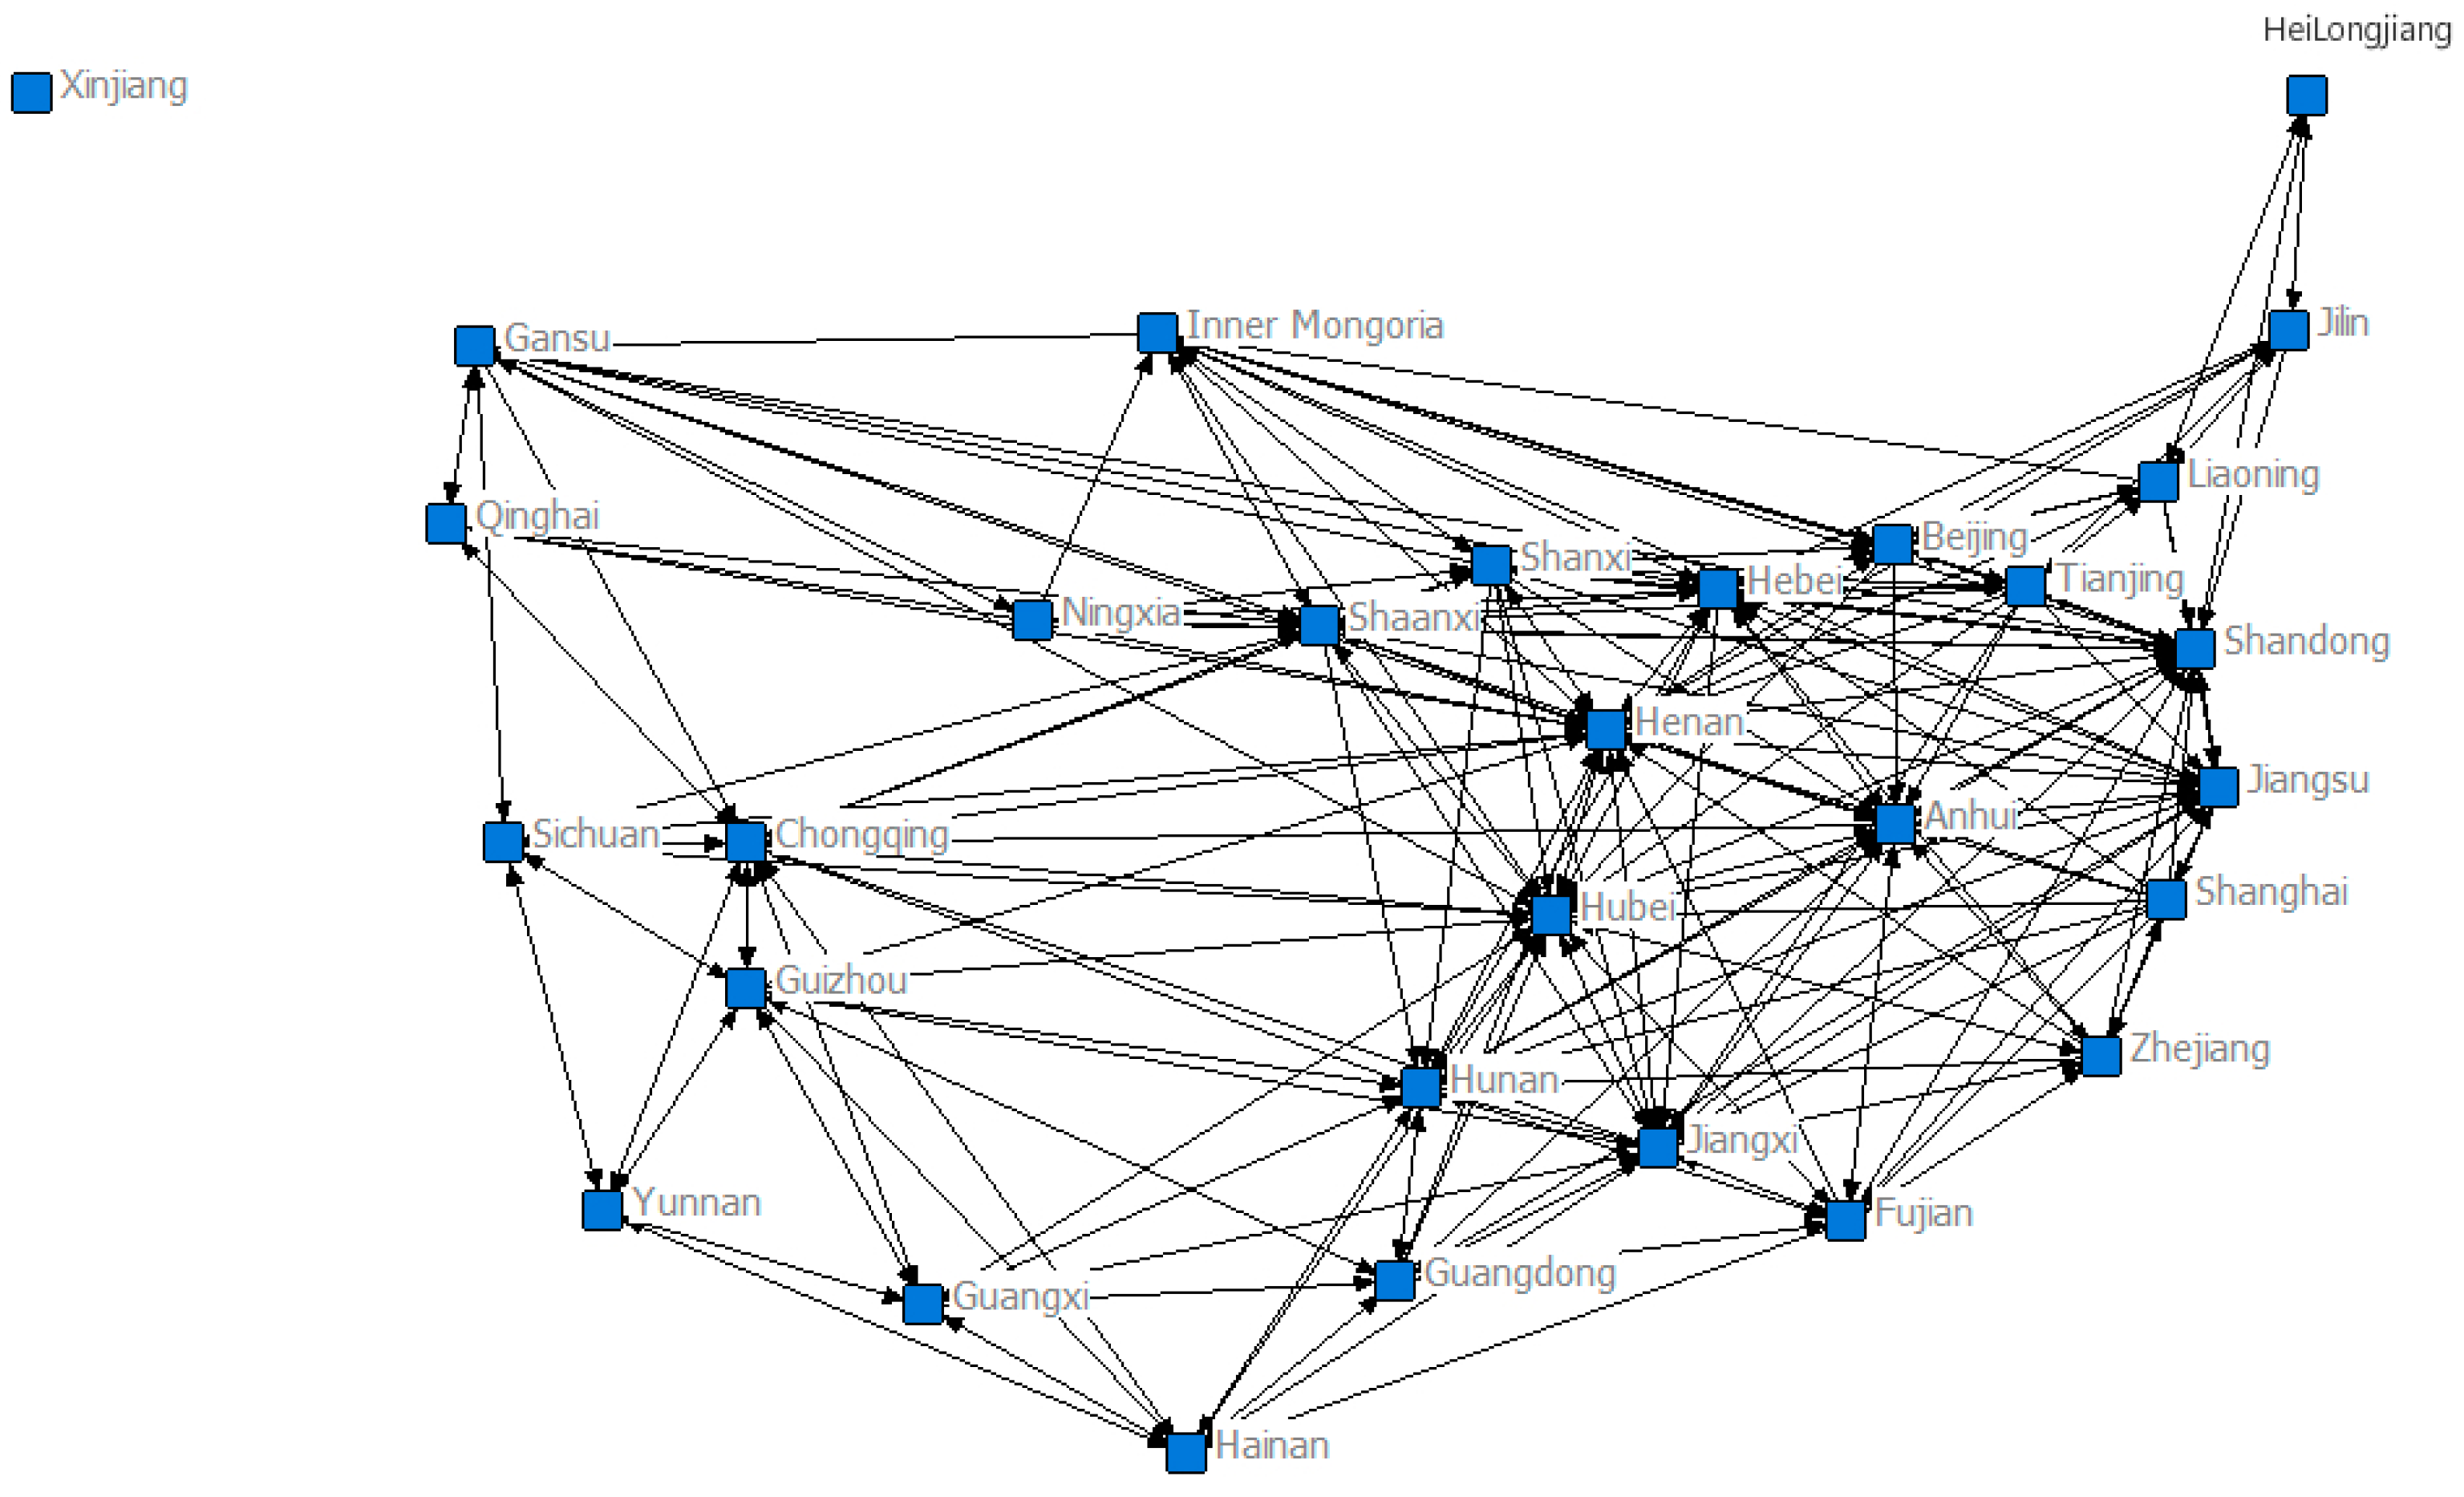
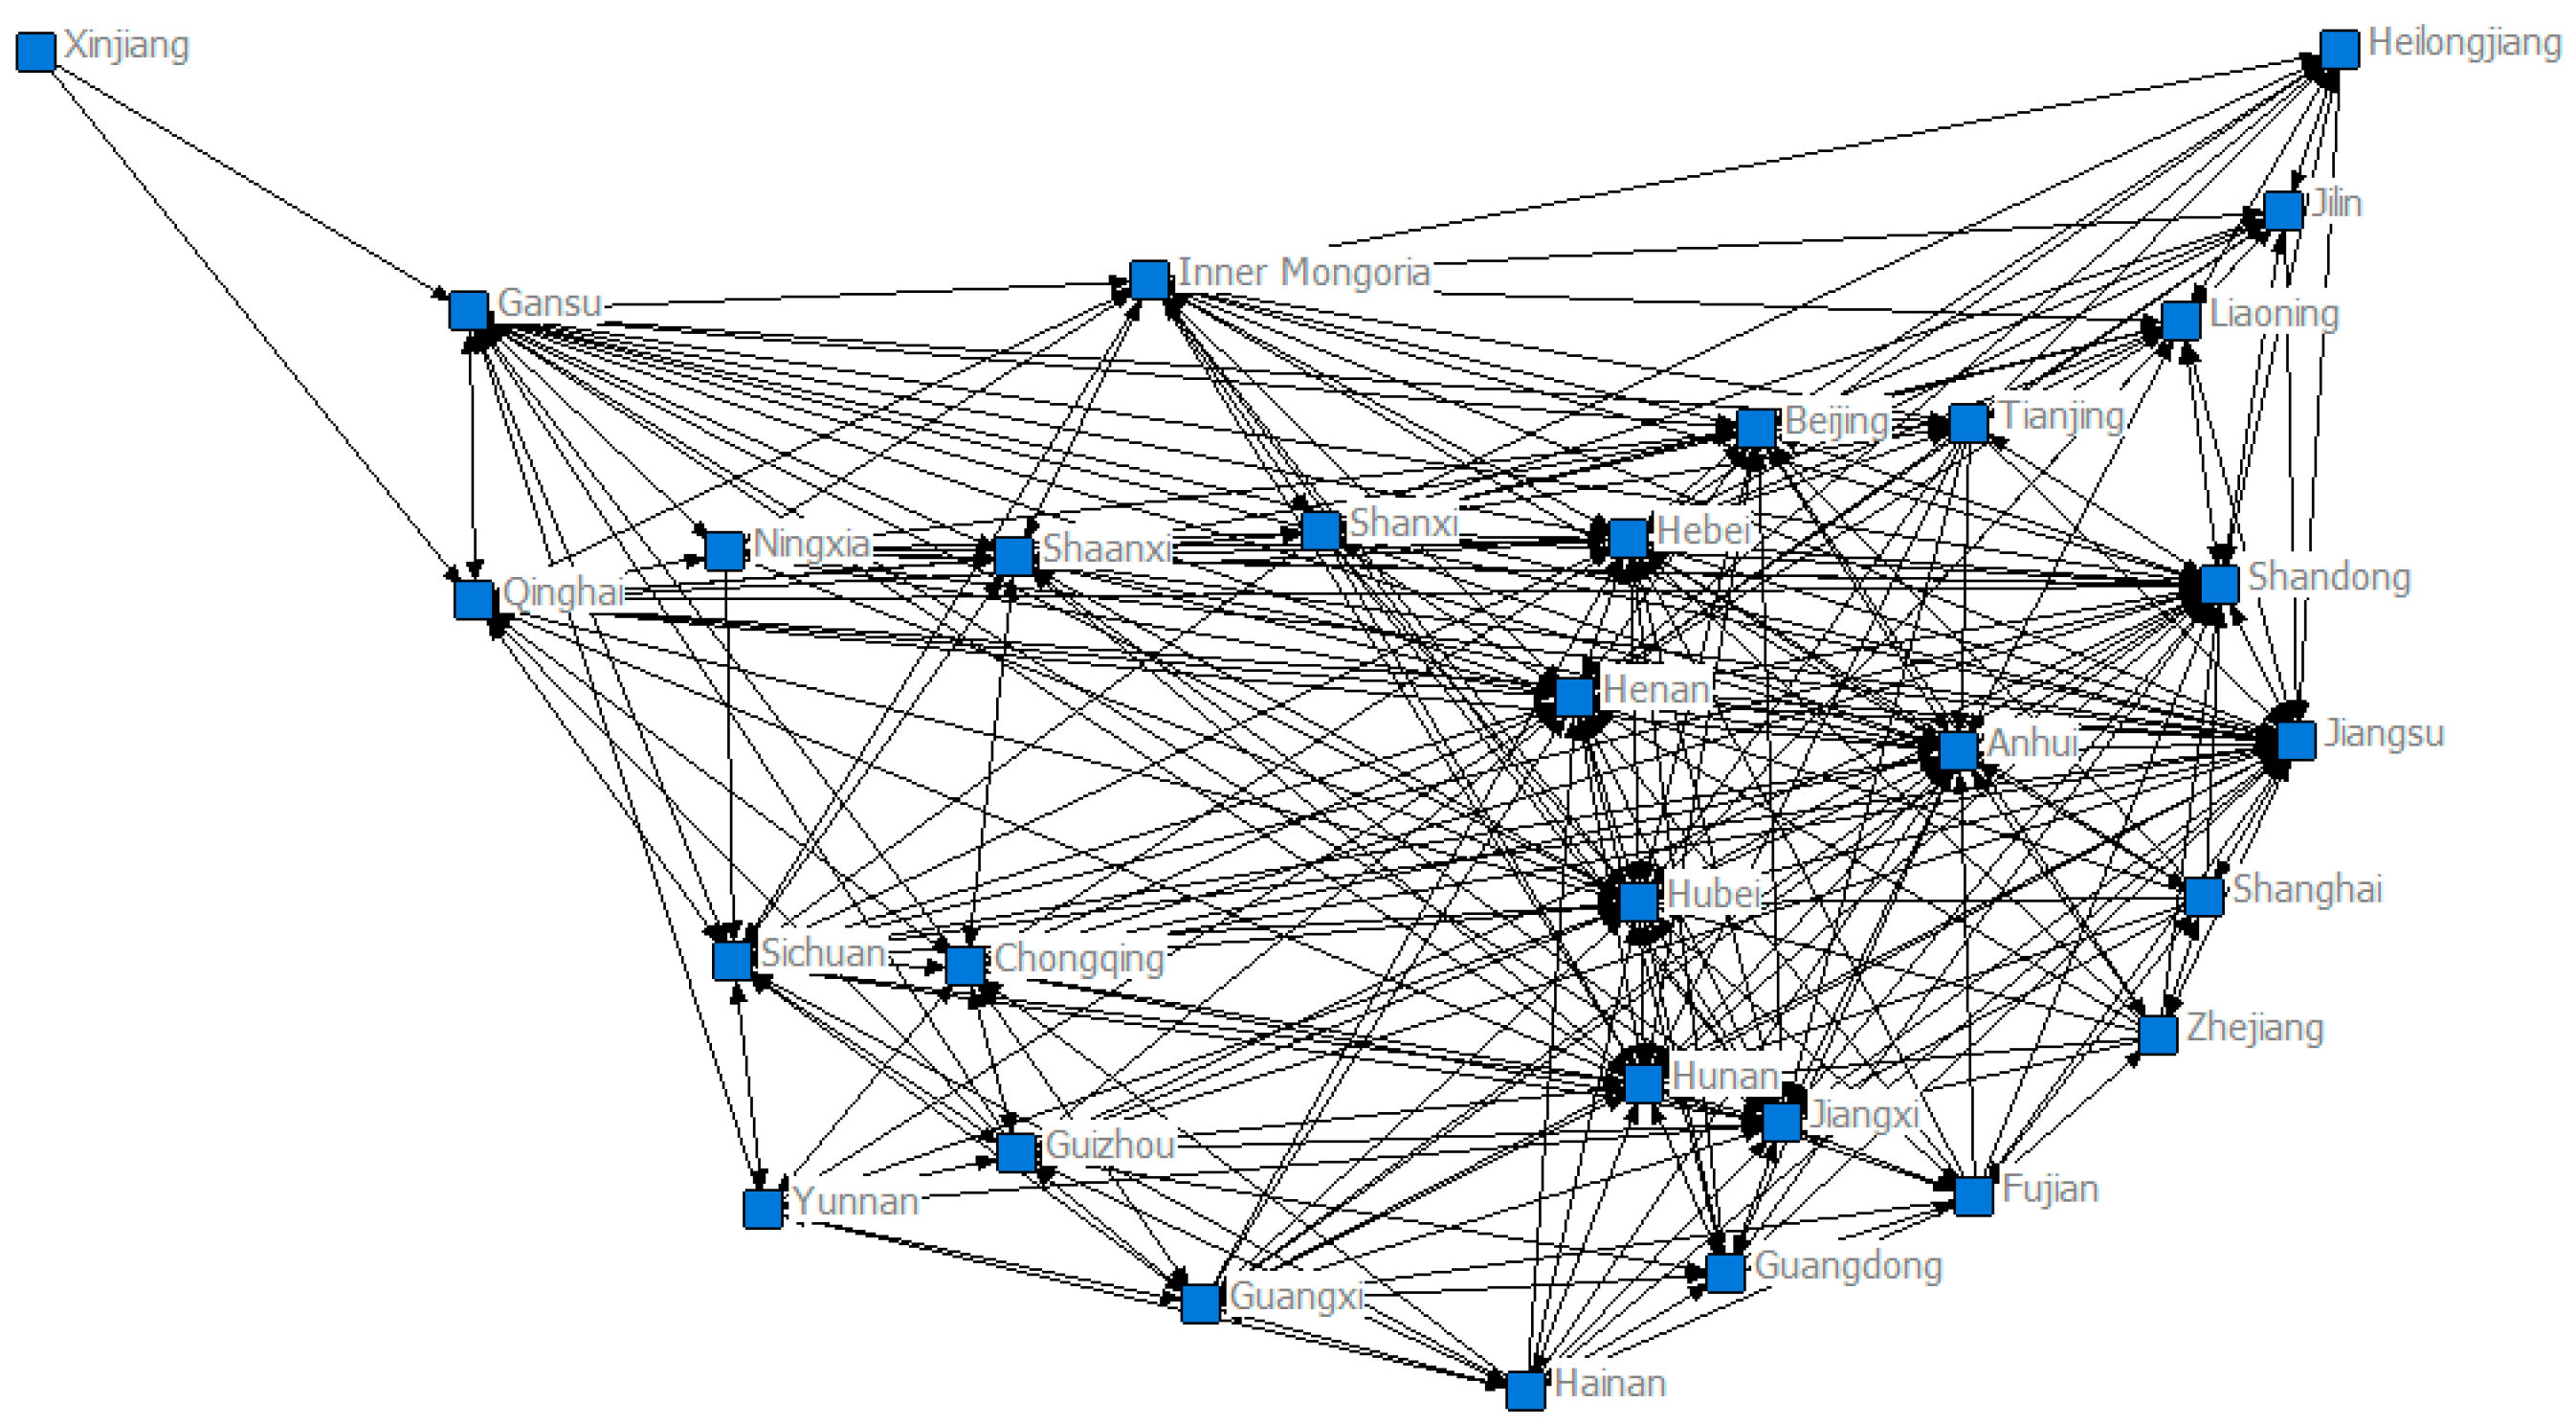
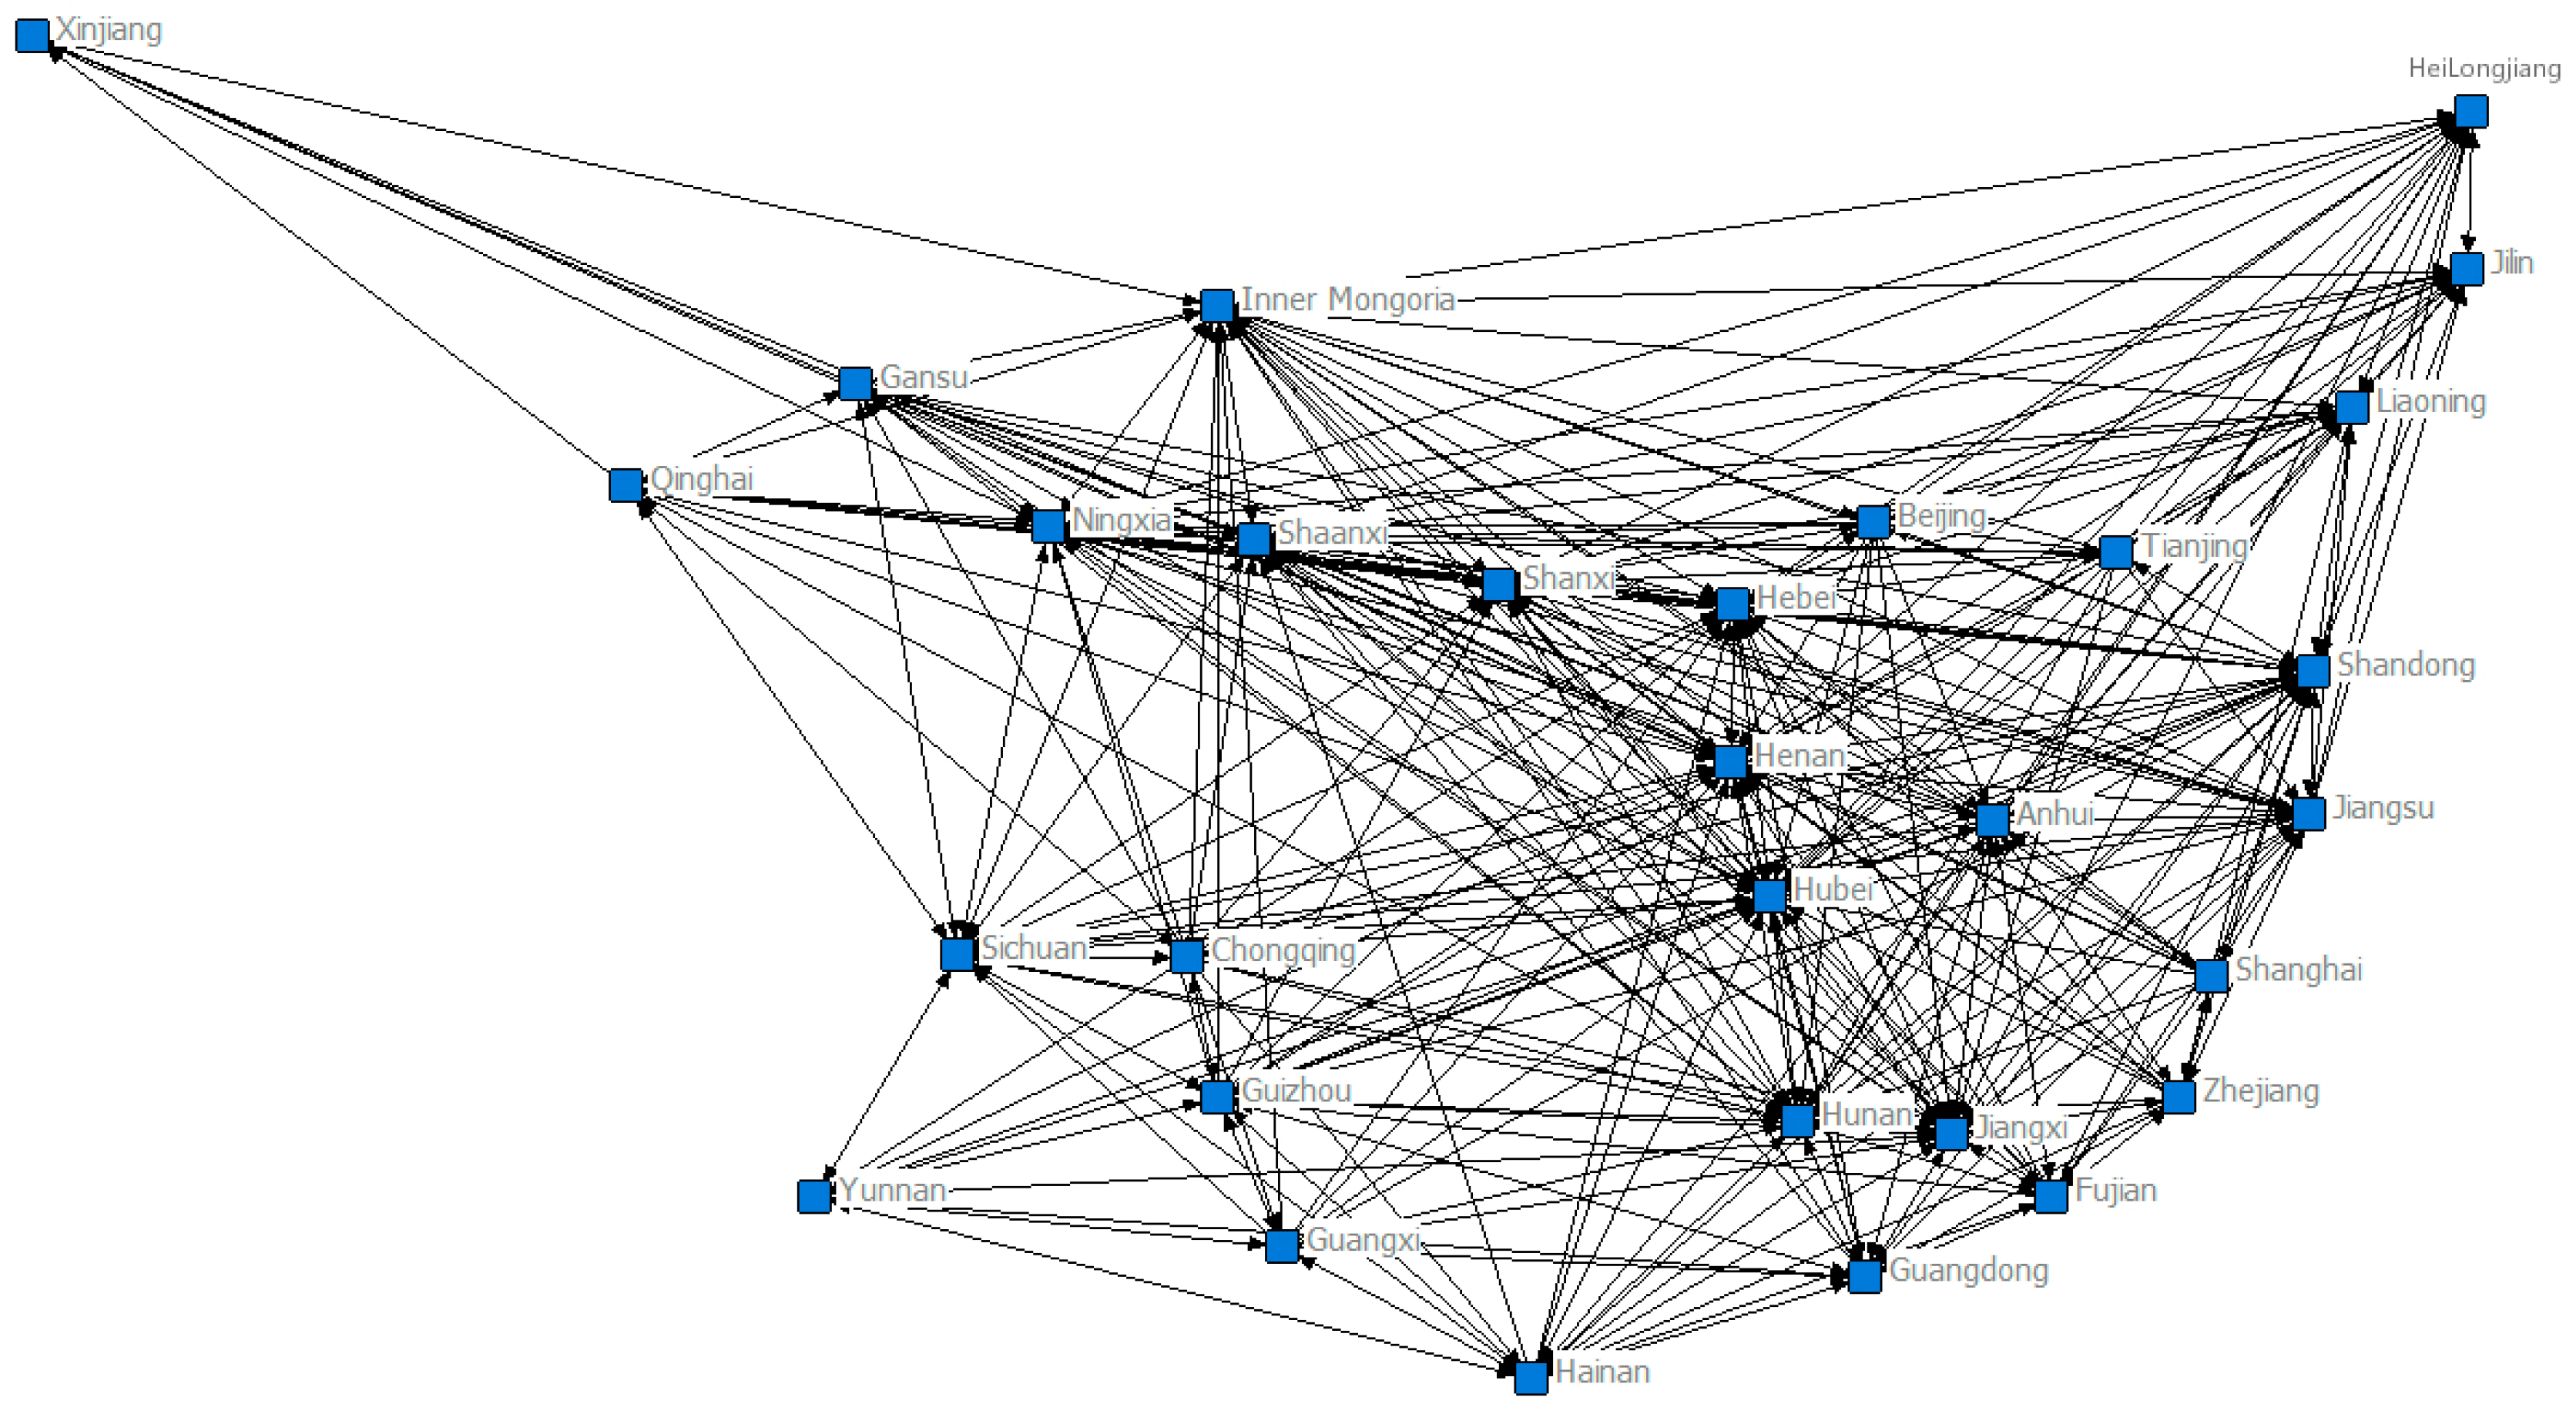
3.2. Evolution Characteristics of Spatial Correlation Network for Agricultural Science and Technology Innovation Development in China
Using the revised gravity model to determine the spatial correlation of agricultural science and technology innovation development among provinces and establish the correlation matrix, we can obtain the spatial correlation network of China’s agricultural science and technology innovation development in two stages of China’s agricultural technology research and development and agricultural technology application, as shown in
Figure 3,
Figure 4,
Figure 5,
Figure 6,
Figure 7 and
Figure 8. From
Figure 3 to
Figure 8, the spatial correlation network of China’s agricultural science and technology innovation and development in the two stages shows a complex network structure state, and, with the growth of time, the evolution trend of the spatial correlation network shows a more and more complex trend, and the number of networks gradually increases. This indicates that the innovative development of agricultural science and technology in each province has broken the traditional limitation of geographical proximity, and the non-geographical neighboring provinces have also established spatial correlation, which produced the linkage effect of the innovative development of agricultural science and technology among regions.
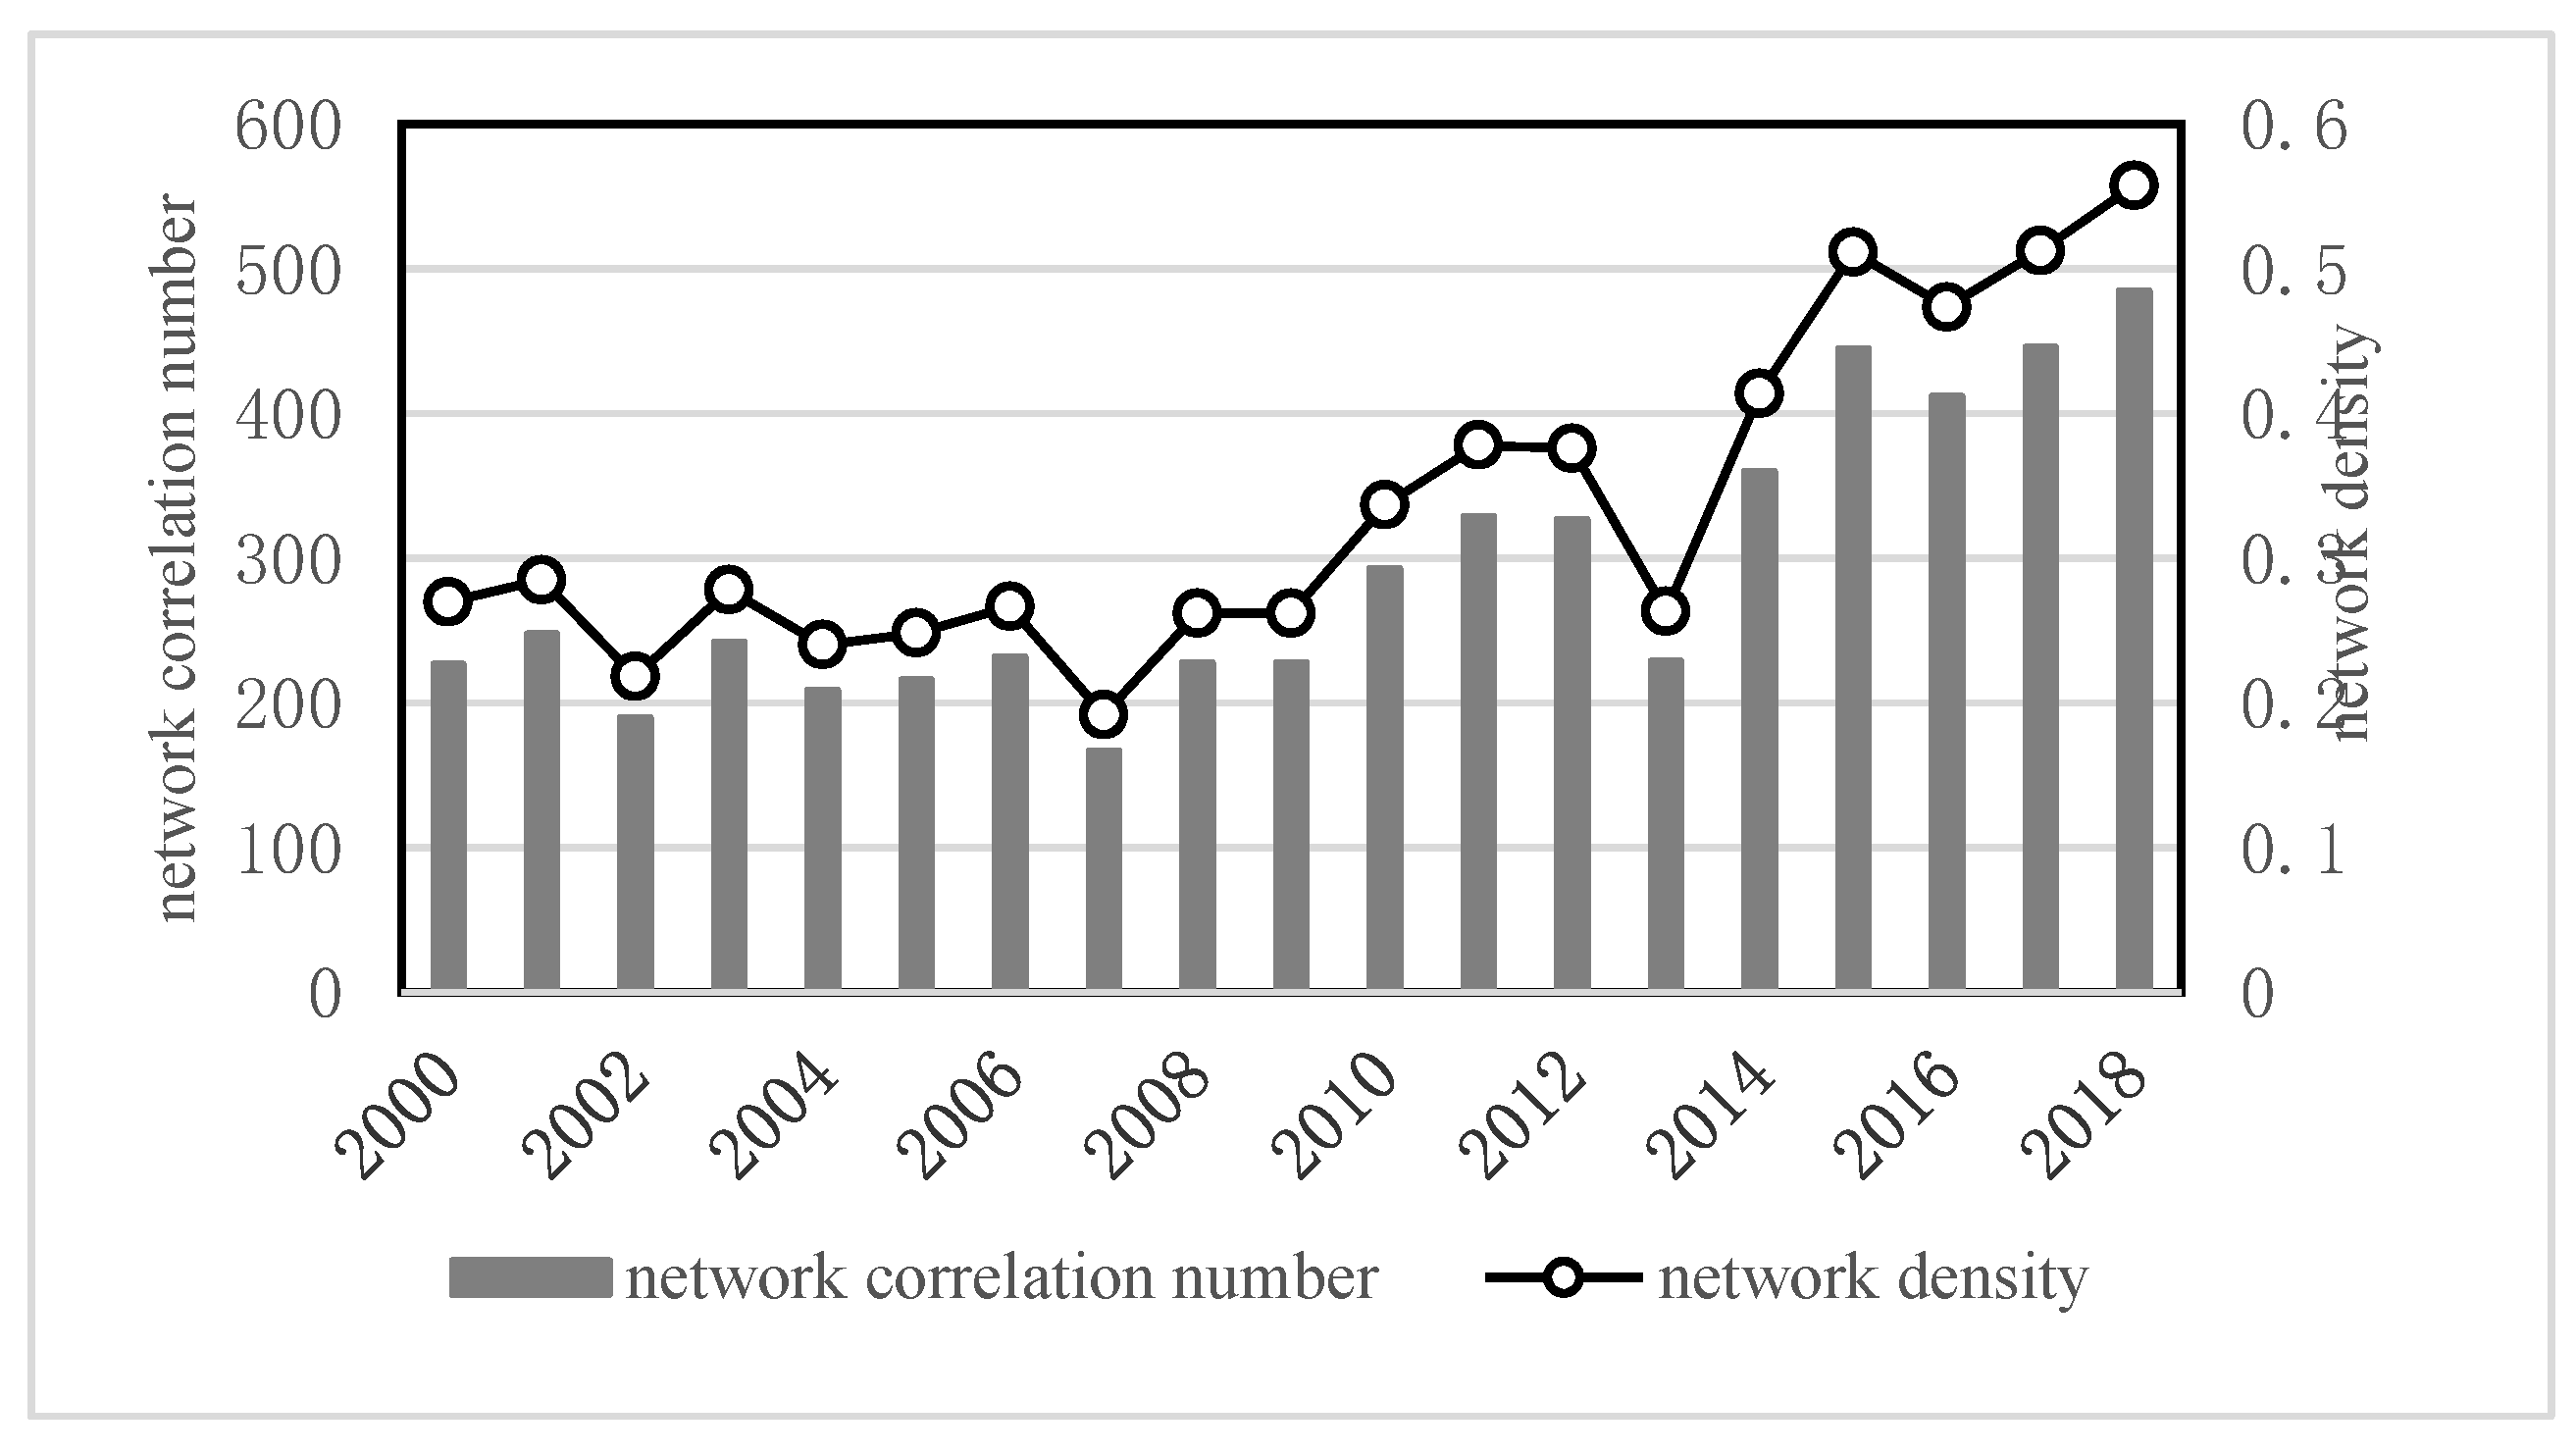
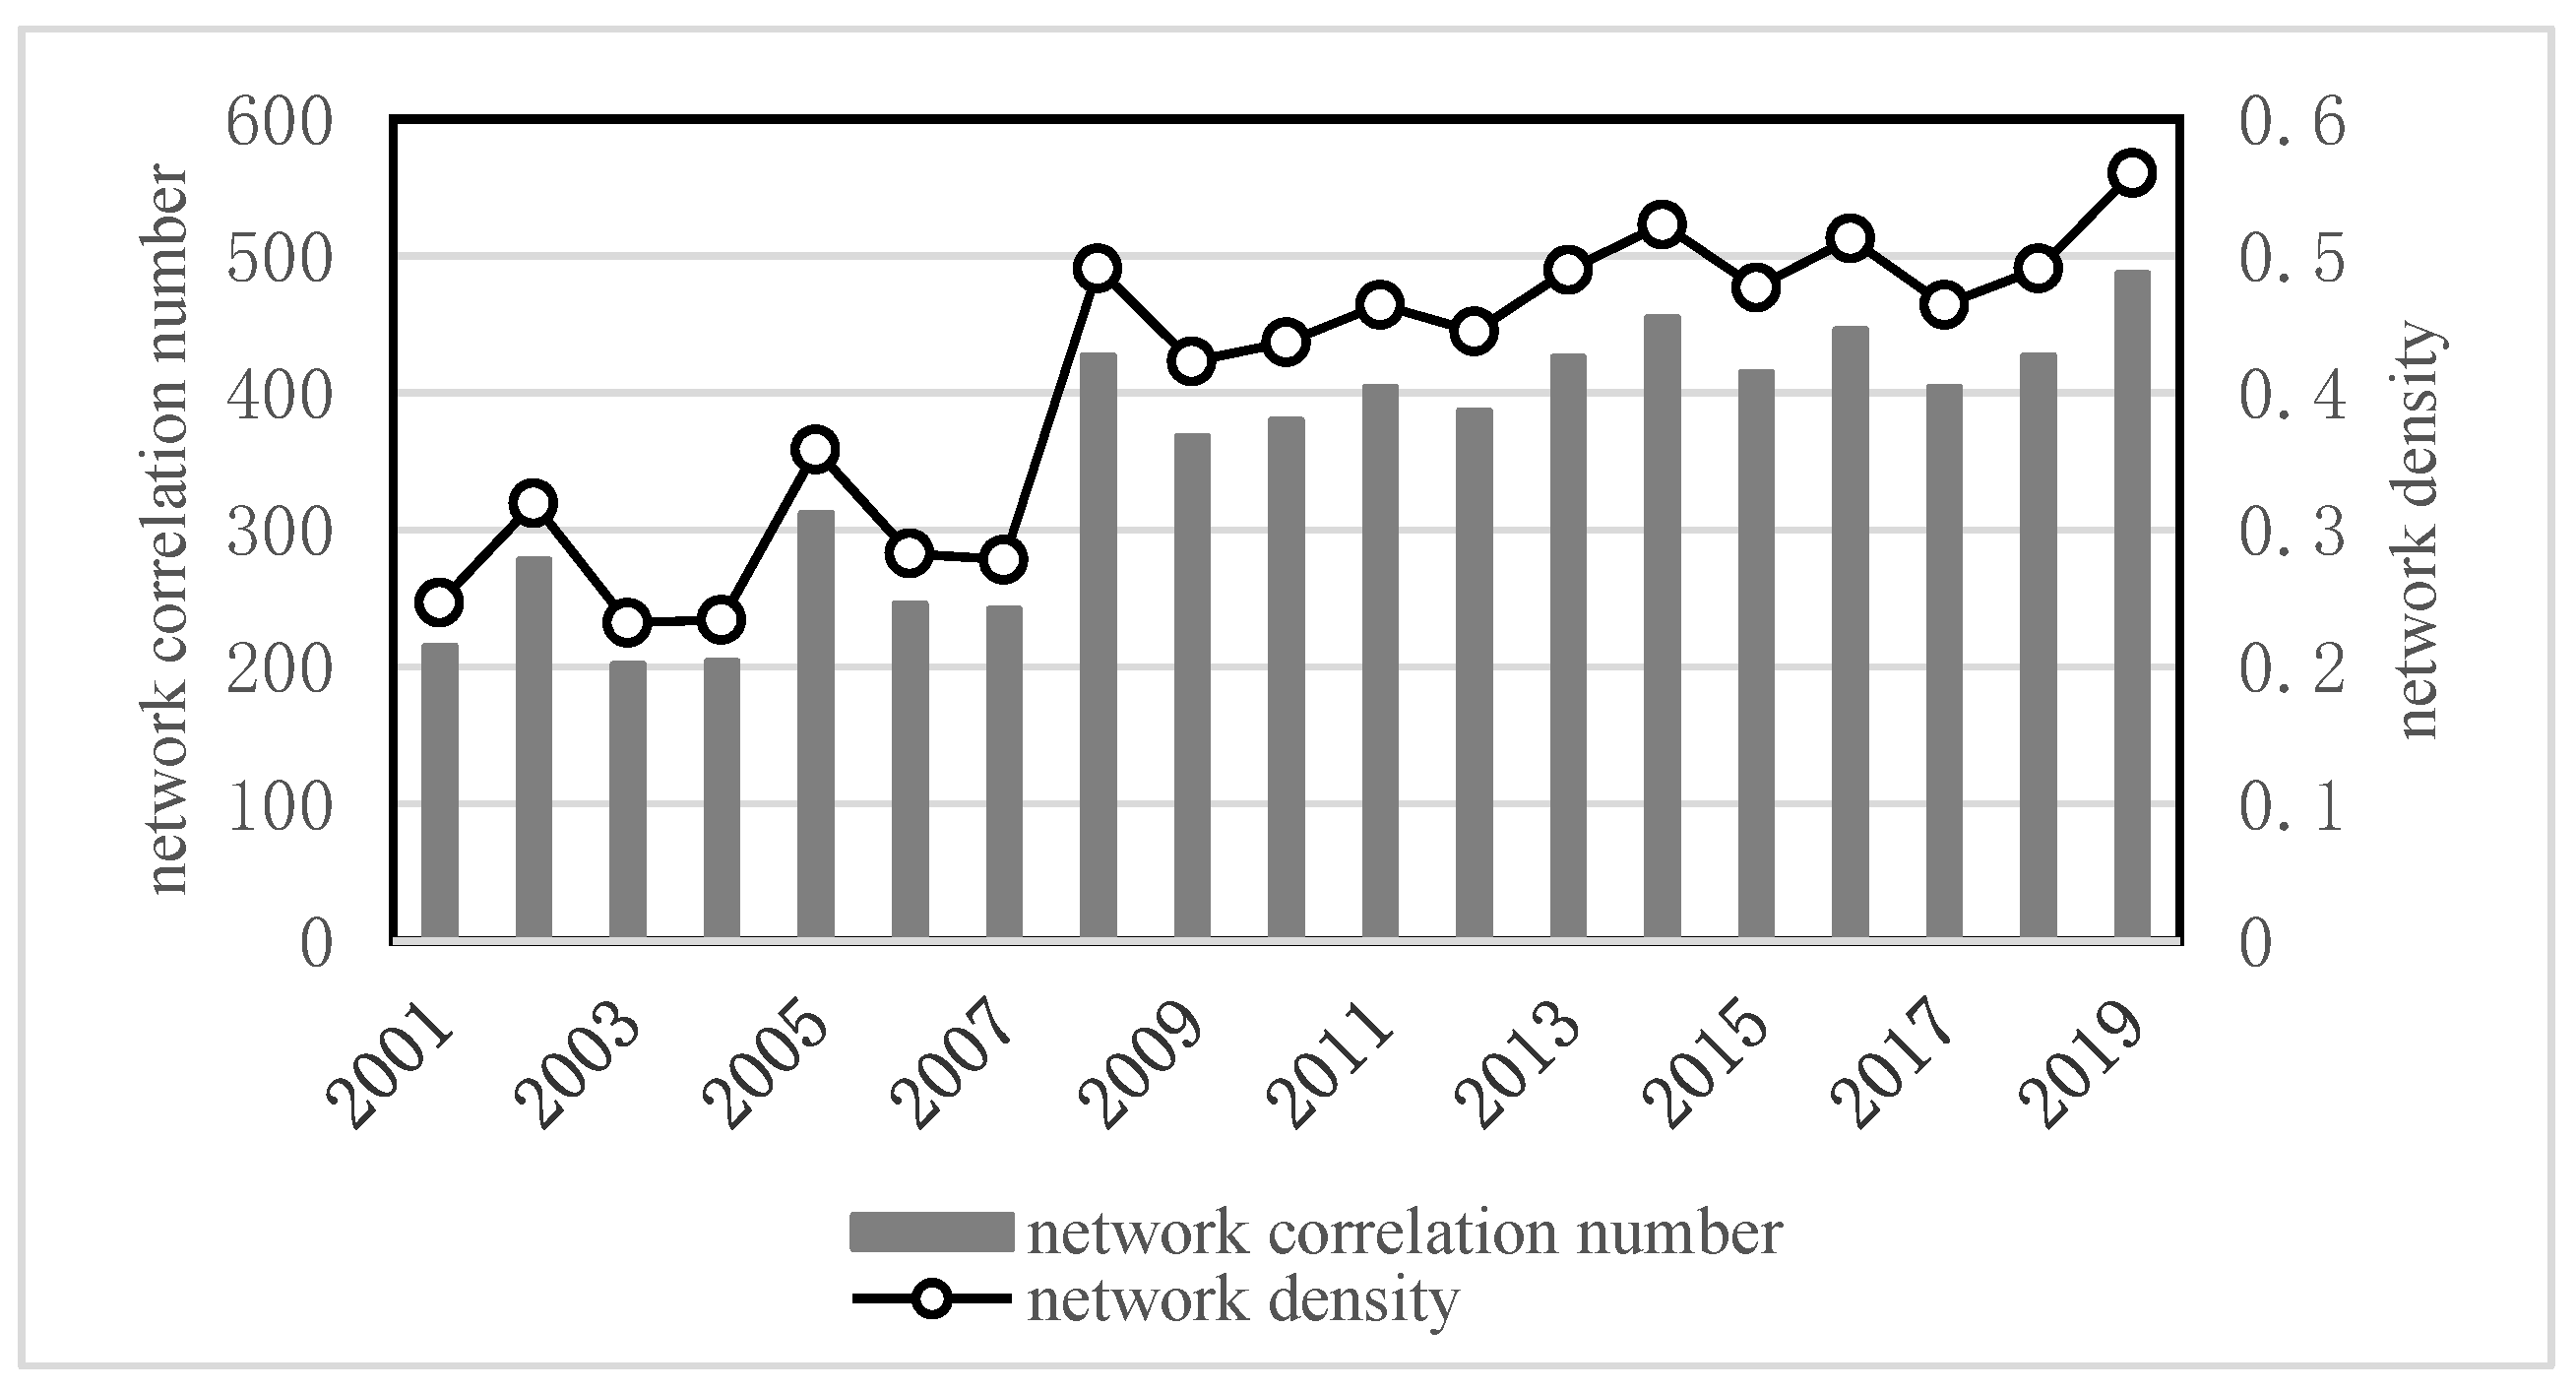
Figure 9 and
Figure 10 show the evolution trend of the network association number and network density of China’s agricultural science and technology innovation development spatial association network from 2000 to 2018. The network association number and network density of China’s agricultural science and technology innovation development spatial association network in the two stages show an overall upward trend, and the evolution trend can be divided into three periods.
The first period is before 2006, and the network density and network correlation number in the stage of agricultural technology research and development and technology application were not high. This is due to the continuous penetration of the market mechanism in the development of agricultural science and technology and the construction of an agricultural innovation system during this period. The rational allocation of agricultural science and technology innovation resources was only in the early stage of development, the rational flow of innovation subjects was still in the guiding period, and the spatial correlation between agricultural science and technology innovation in various provinces was still less established.
The second period is from 2006 to 2012, which is the stage of rapid growth of network density and network correlation number in the application stage of agricultural technology. This may be due to the fact that this period was a crucial period for China to promote the construction of a new countryside. In particular, the “No.1 Document” of the Communist Party of China (CPC) Central Committee in 2006 required that the innovation and transformation capacity of agricultural science and technology be greatly enhanced and that the reform and construction of agricultural technology popularization system be accelerated. The No. 1 central document released every year in the following years constantly emphasized the application and transformation of modern agricultural science and technology innovation. This series of policies promoted the flow and combination of innovation elements related to agricultural technology application in the market, increased the spatial correlation of all provinces, and greatly increased the number and density of network correlations.
The third period is from 2012 to 2018, which is the stage of rapid growth of the network density and network correlation number in agricultural technology research and development. This may be due to the comprehensive implementation of the innovation-driven development strategy after the 18th National Congress of the Communist Party of China (CPC), as well as due to unprecedented central financial input in agricultural technology research and development and significant innovation achievements in major technological fields, such as super rice. At the same time, a number of major policy measures were introduced including institutional reform.
Driven by the two-wheeled innovation of science and technology and the innovation of systems and mechanisms, all innovation subjects in China jointly bear risks and tackle key problems in coordination, thus significantly improving the collaborative innovation capability of agricultural research and development and effectively allocating the elements of agricultural innovation. The exchanges and cooperation among provinces and regions in the stage of agricultural technology research and development have resulted in increasing spatial correlation, and the construction of an agricultural science and technology innovation system has entered a new era of socialism with Chinese characteristics.
3.3. Overall Structural Characteristics of Spatial Correlation Network for Agricultural Science and Technology Innovation Development in China
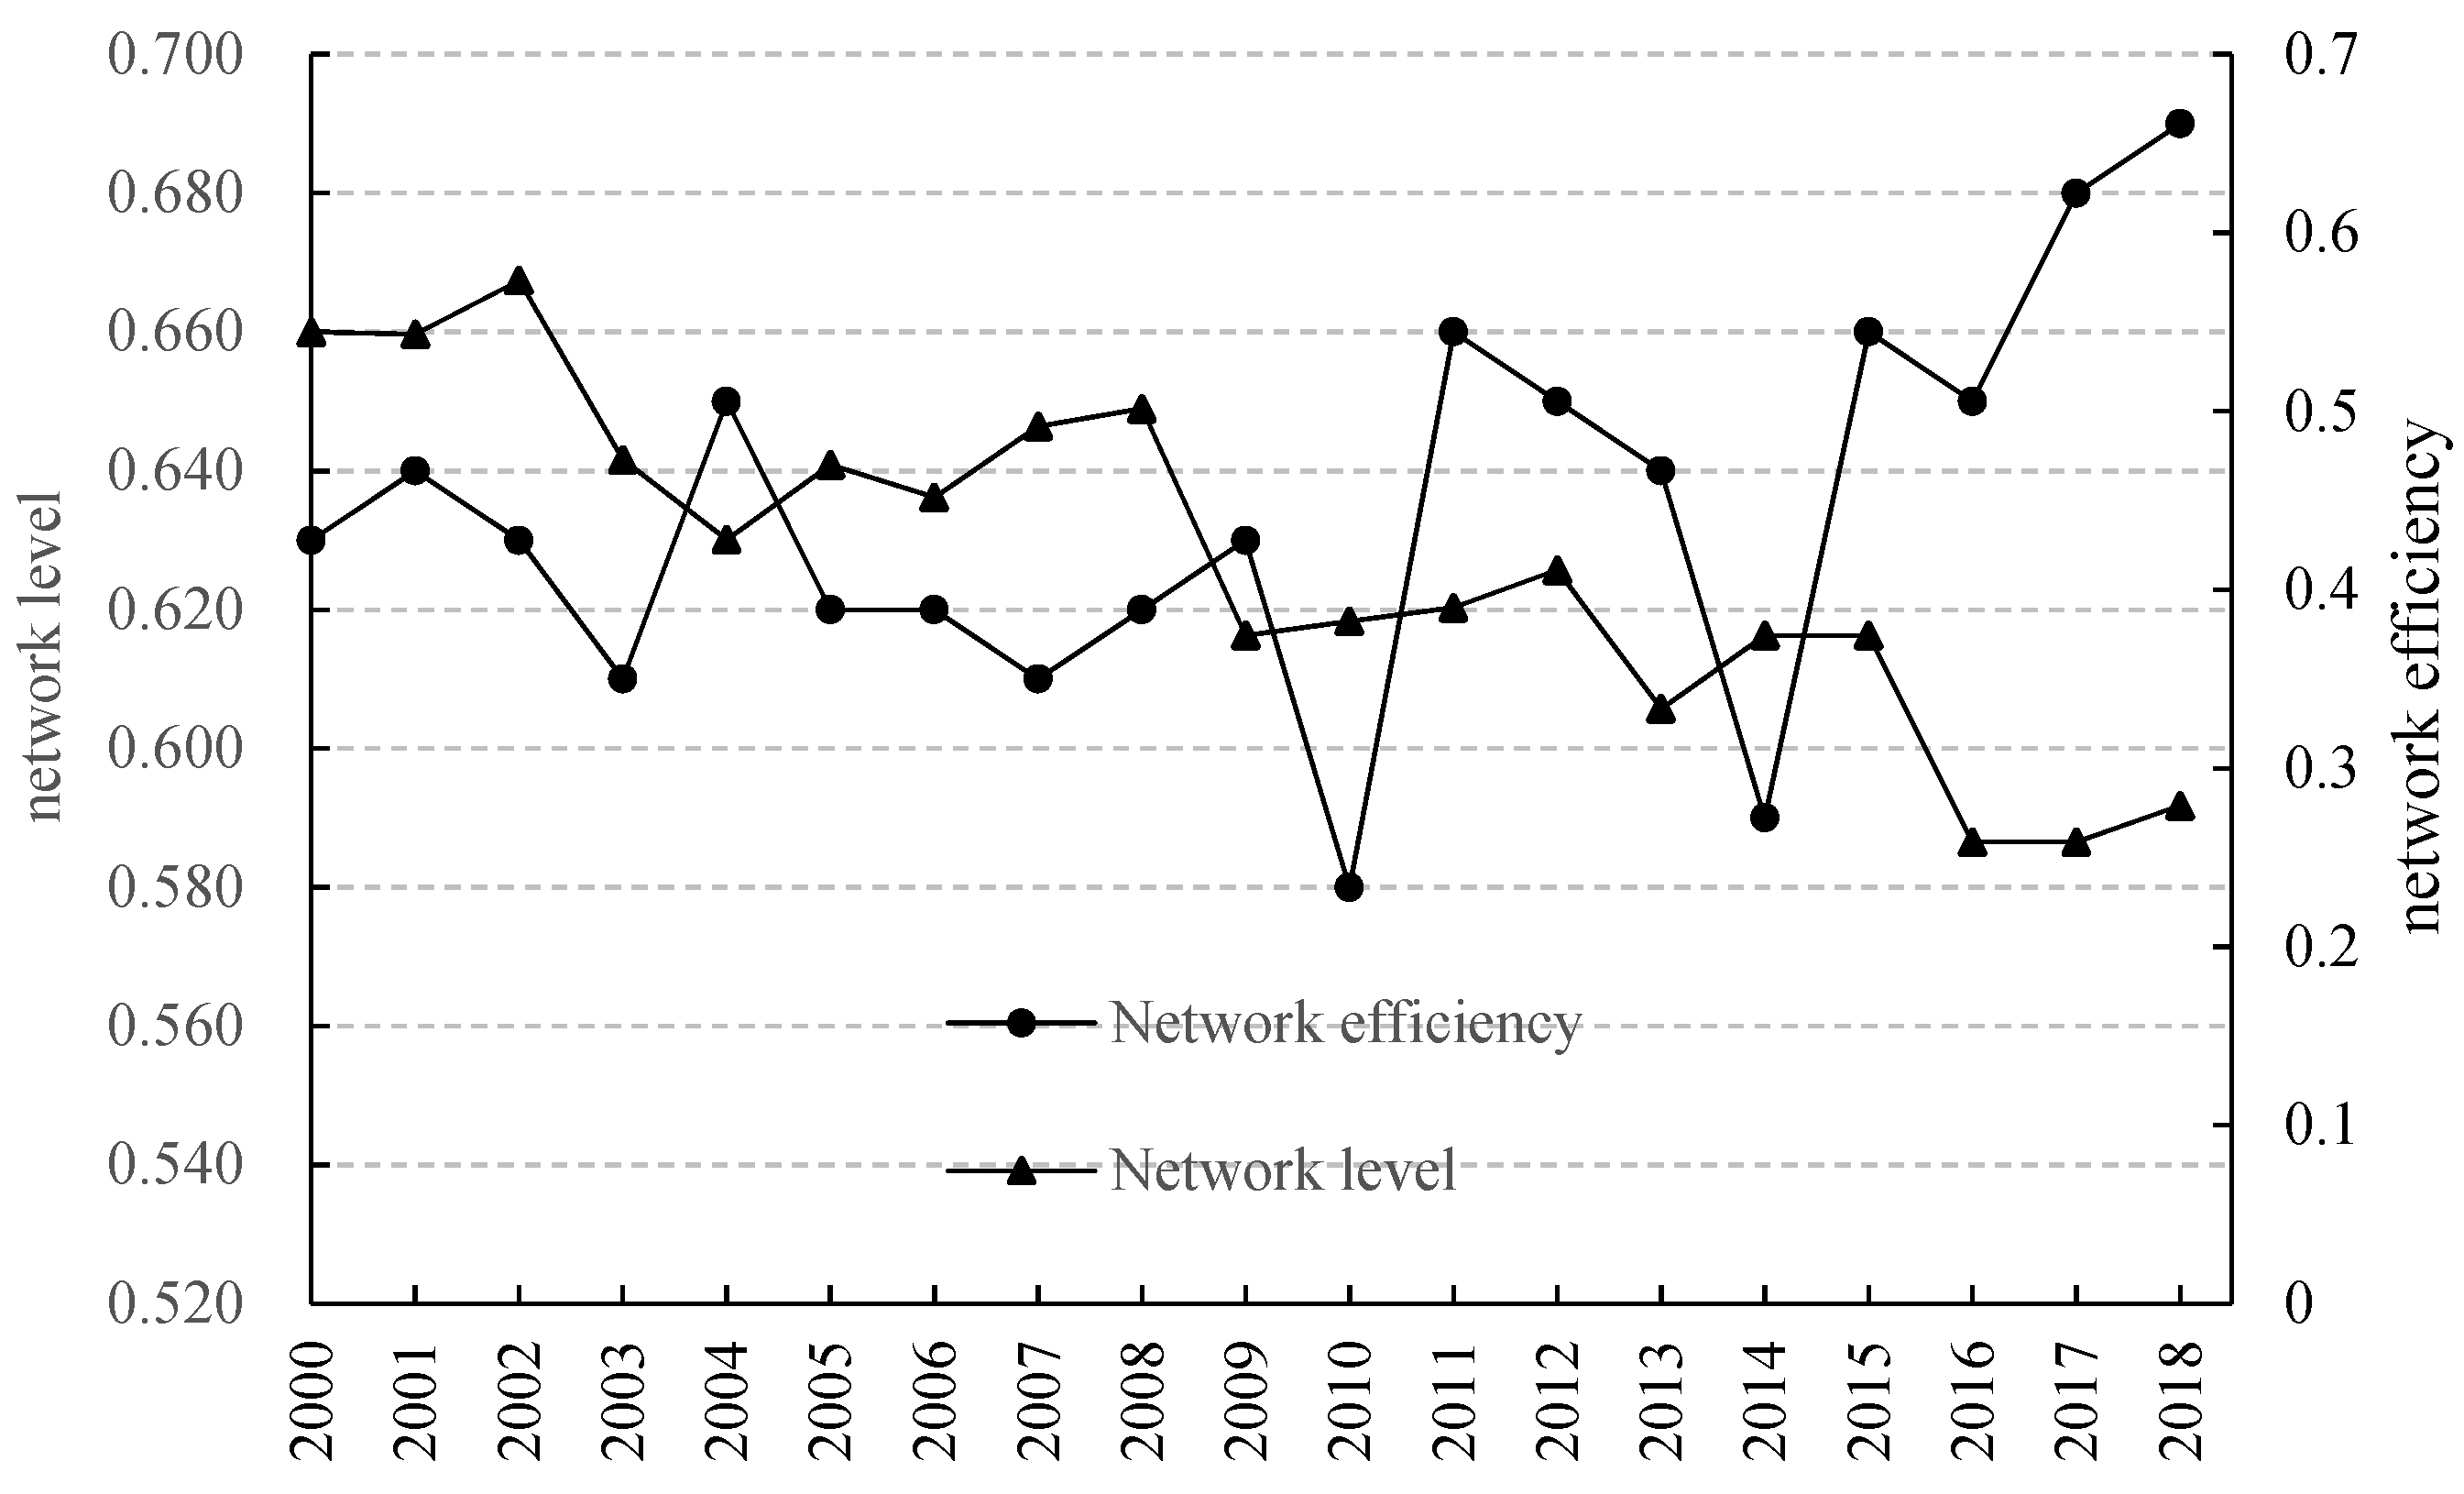
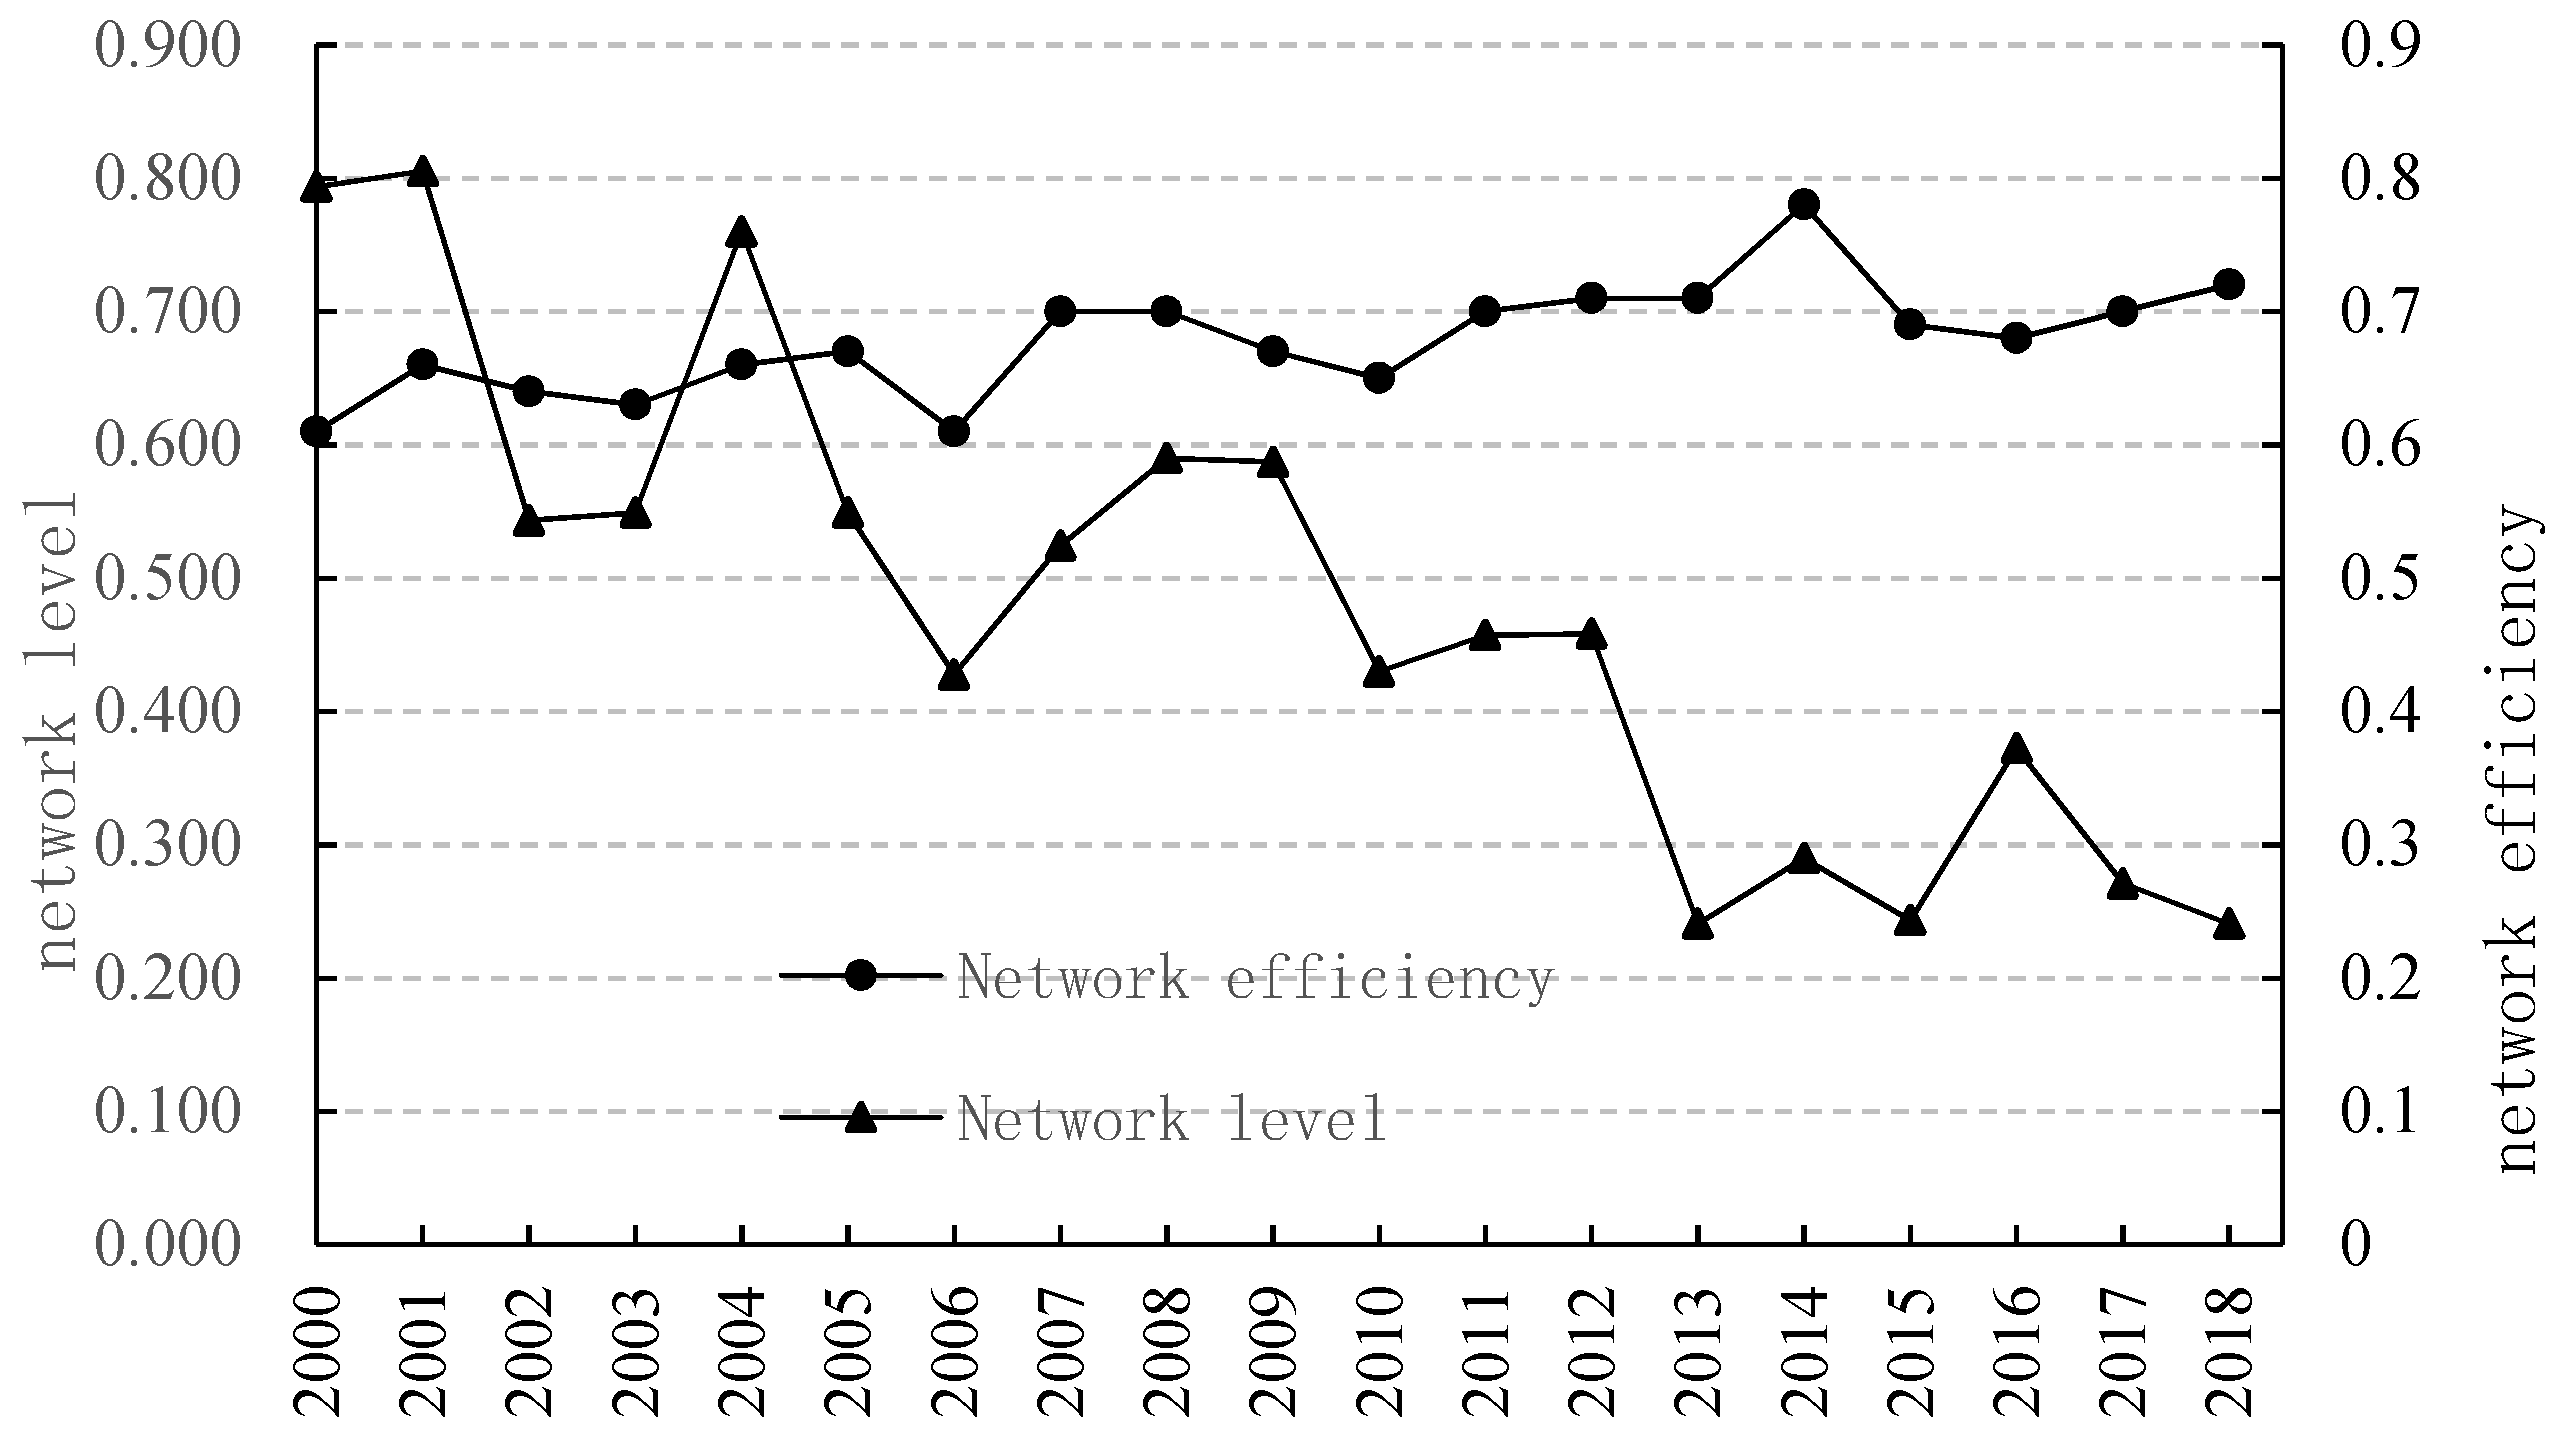
The spatial correlation characteristics of the agricultural science and technology innovation development spatial correlation network are mainly reflected in network hierarchy and network efficiency, as shown in
Figure 11 and
Figure 12.
The network grade of China’s agricultural science and technology innovation and development spatial association network decreased year by year. From 2000 to 2012, the network level in the application stage of agricultural technology was higher than in the research and development stage of agricultural technology. From 2012 to 2018, the level of the network in the application stage of agricultural technology decreased significantly and was lower than in the research and development stage of agricultural technology. After 2006, although China vigorously promoted the technology application transformation capability of agricultural science and technology innovation and promoted the flow of relevant innovation elements, the hierarchical characteristics of the spatial correlation network in the agricultural technology application stage were extremely significant, and the boundaries between the core provinces and marginal provinces are clear.
Since 2012, China’s Ministry of Agriculture has issued documents, such as “Opinions on Accelerating Innovation and Popularization of Agricultural Science and Technology” and “Opinions on Deepening the Reform of Agricultural Science and Technology System and Mechanism to Accelerate Implementation of Innovation-Driven Development Strategy”, which deeply grasped the laws of agricultural science and technology innovation with Chinese characteristics. With the improvement of the policy mechanism, the hierarchical structure of the members of each province in the spatial correlation network in the application stage of agricultural technology was broken, the spatial correlation was enhanced, and the role and position of the provinces that were originally in the subordinate marginal position in the network changed.
From the perspective of network efficiency, the network efficiency of the spatial correlation network in agricultural technology research and development showed great fluctuations. In 2010, the network efficiency increased significantly, and the phenomena of the multiple superposition of overflow channels in the spatial correlation network in the stage of agricultural technology research and development gradually weakened, and the stable structure of the spatial network was affected.
In 2013, the efficiency of the network decreased significantly, the number of space overflow channels increased, and the stability of the network improved. However, in 2014, the network efficiency increased significantly, the number of redundancy relationships in the network increased, the two-way overflow relationships decreased, and the network stability decreased. Compared with the large fluctuation of the network efficiency in the stage of agricultural technology research and development, the network efficiency in the stage of agricultural technology application basically remained unchanged, and the network presented strong stability.
3.4. The Individual Structural Characteristics of the Spatial Correlation Network of Agricultural Science and Technology Innovation Development in China
The centrality of the spatial correlation network for the development of agricultural science and technology innovation in China can clearly define the role and position of each province in the spatial correlation network for the development of agricultural science and technology innovation, which is mainly reflected in indicators, such as point discrepancy, relative centrality, intermediary centrality, and proximity centrality. We take the measurement results of 2018 as an example, as shown in
Table 3.
From the perspective of out-degree, the regions with a high out-degree in both stages were mainly concentrated in the Shandong, Henan, Hebei, Hunan, and Hubei provinces, indicating that these provinces had a large number of emission relations to other provinces, which produced a clear spatial spillover effect. Regions with a low out-degree in both stages were mainly concentrated in the Xinjiang, Qinghai, Hainan, Yunnan, Heilongjiang, Jilin, and Liaoning provinces, which have less spilt and contributed to the agricultural science and technology innovation and development of other provinces, and they were at the edge of the related network. From the perspective of in-degree, the regions with a high in-degree in both stages were mainly concentrated in the Shanxi, Shandong, Henan, Guizhou, Qinghai, and Ningxia provinces, which are highly dependent on the factors of other provinces and need other provinces to conduct agricultural science and technology innovation to provide spillover to these regions.
The regions with a low in-degree in both stages were mainly concentrated in Xinjiang and Yunnan, and the spatial correlation between them and other provinces was weak. Judging from the relative centrality, proximity centrality, and intermediary centrality, Shandong and Henan provinces were among the top indicators in the country, indicating that these two provinces were in the central position of the whole spatial correlation network and played a positive role in the development of the spatial correlation network for China’s agricultural science and technology innovation. The provinces with a lower index ranking were mainly concentrated in Xinjiang, Yunnan, and Jilin provinces, with insufficient agricultural science and technology innovation capability and the need for the “intermediary” role of core provinces.
In conclusion, as the central provinces, Shandong and Henan had much higher value in the spatial correlation network of agricultural science and technology innovation and development in China compared with the other provinces, and they demonstrated a strong ability to radiate to their neighbors. The western region and part of the northeast region of China were on the edge due to their remote location and weak economy, which made it difficult for them to establish spatial relations with other cities. Therefore, the agricultural science and technology innovation network formed a three-level system in China.
Shandong, Henan, and other central provinces and cities are the key provinces of agricultural science and technology innovation and development, and they drive the innovation and development of agricultural science and technology in the surrounding provinces and cities through the cooperation between industry, universities, and research institutes as well as the flow of talents. Xinjiang, Yunnan, and Jilin are marginal provinces and cities on the edge of the spatial correlation network for agricultural science and technology innovation. Other provinces and cities may be second-level provinces and cities, which can play the role of connecting first-level provinces and cities with third-level provinces and cities.
3.5. Local Structural Characteristics of Spatial Correlation Network for Agricultural Science and Technology Innovation Development in China
3.5.1. Plate Analysis at the Stage of Agricultural Technology R&D
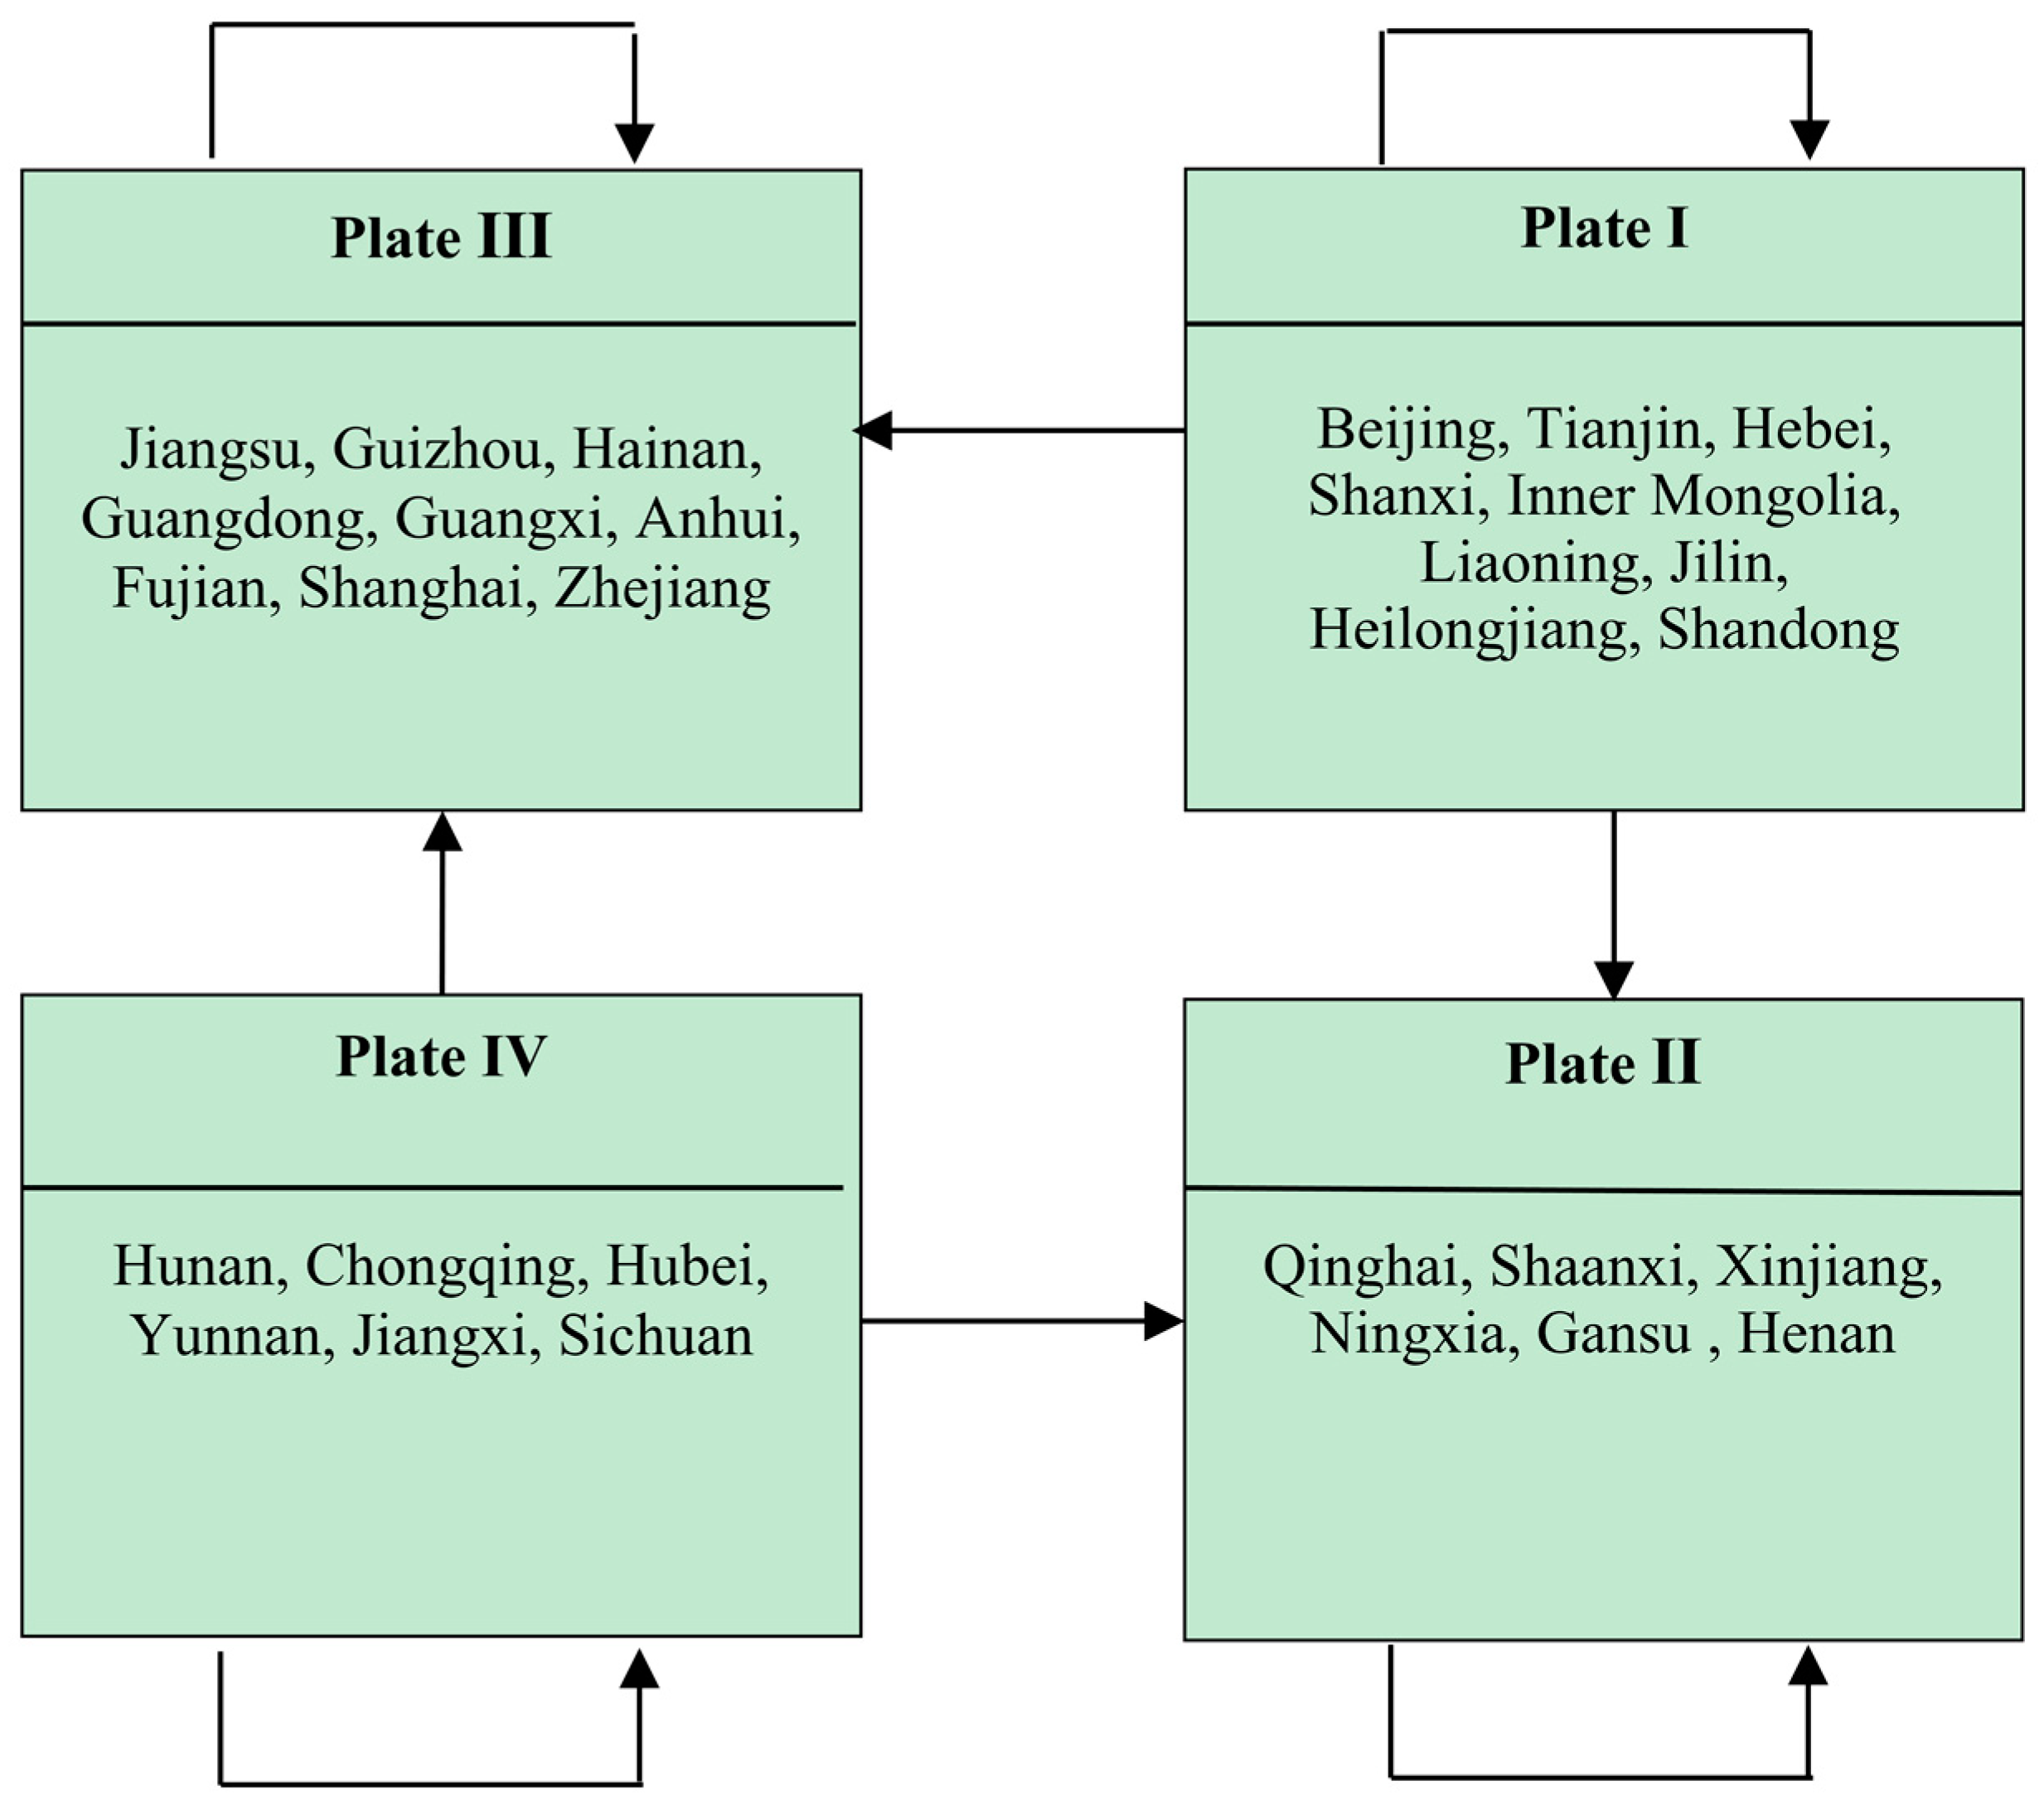
In this paper, plate model analysis was used to reveal the spatial clustering and relationship overflow path in the network. In the stage of agricultural technology research and development, there were a total of 515 correlation relationships in the network, of which the number of external relationships was 310, and the number of internal relationships was 205 in four plates. There were clear spatial relationships and spillover path effects among plates. Plate I members were mainly concentrated in north China and northeast China, including Beijing, Tianjin, Hebei, Shanxi, Inner Mongolia, Liaoning, Jilin, Heilongjiang, and Shandong. This plate was a two-way overflow plate, and there were many relationships (75 and 89) both inside and outside the plate.
Plate II members were mainly concentrated in the northwest and central individual provinces, Qinghai, Shaanxi, Xinjiang, Ningxia, Gansu, and Henan. This plate was a broker plate, which not only receives relationships from other plates (74), but also sends relationships to other plates (92), playing an intermediary role.
Plate III members were mainly concentrated in east China and south China, including Jiangsu, Guizhou, Hainan, Guangdong, Guangxi, Anhui, Fujian, Shanghai, and Zhejiang. The number of relationships outside the receiving plate (122) was much greater than the number of relationships spilling into the plate (61), which represents a typical net income plate that benefits more in the network.
Plate IV members were mainly concentrated in central and southwest China, including Hunan, Chongqing, Hubei, Yunnan, Jiangxi, and Sichuan. The number of relationships outside the receiving plate (50) was far fewer than the number of relationships spilling into the plate (95). On the basis of satisfying its own technical research and development needs, this also spills over members of other plates, which represents a net spillover plate.
3.5.2. Plate Analysis in the Application Stage of Agricultural Technology
According to the results in
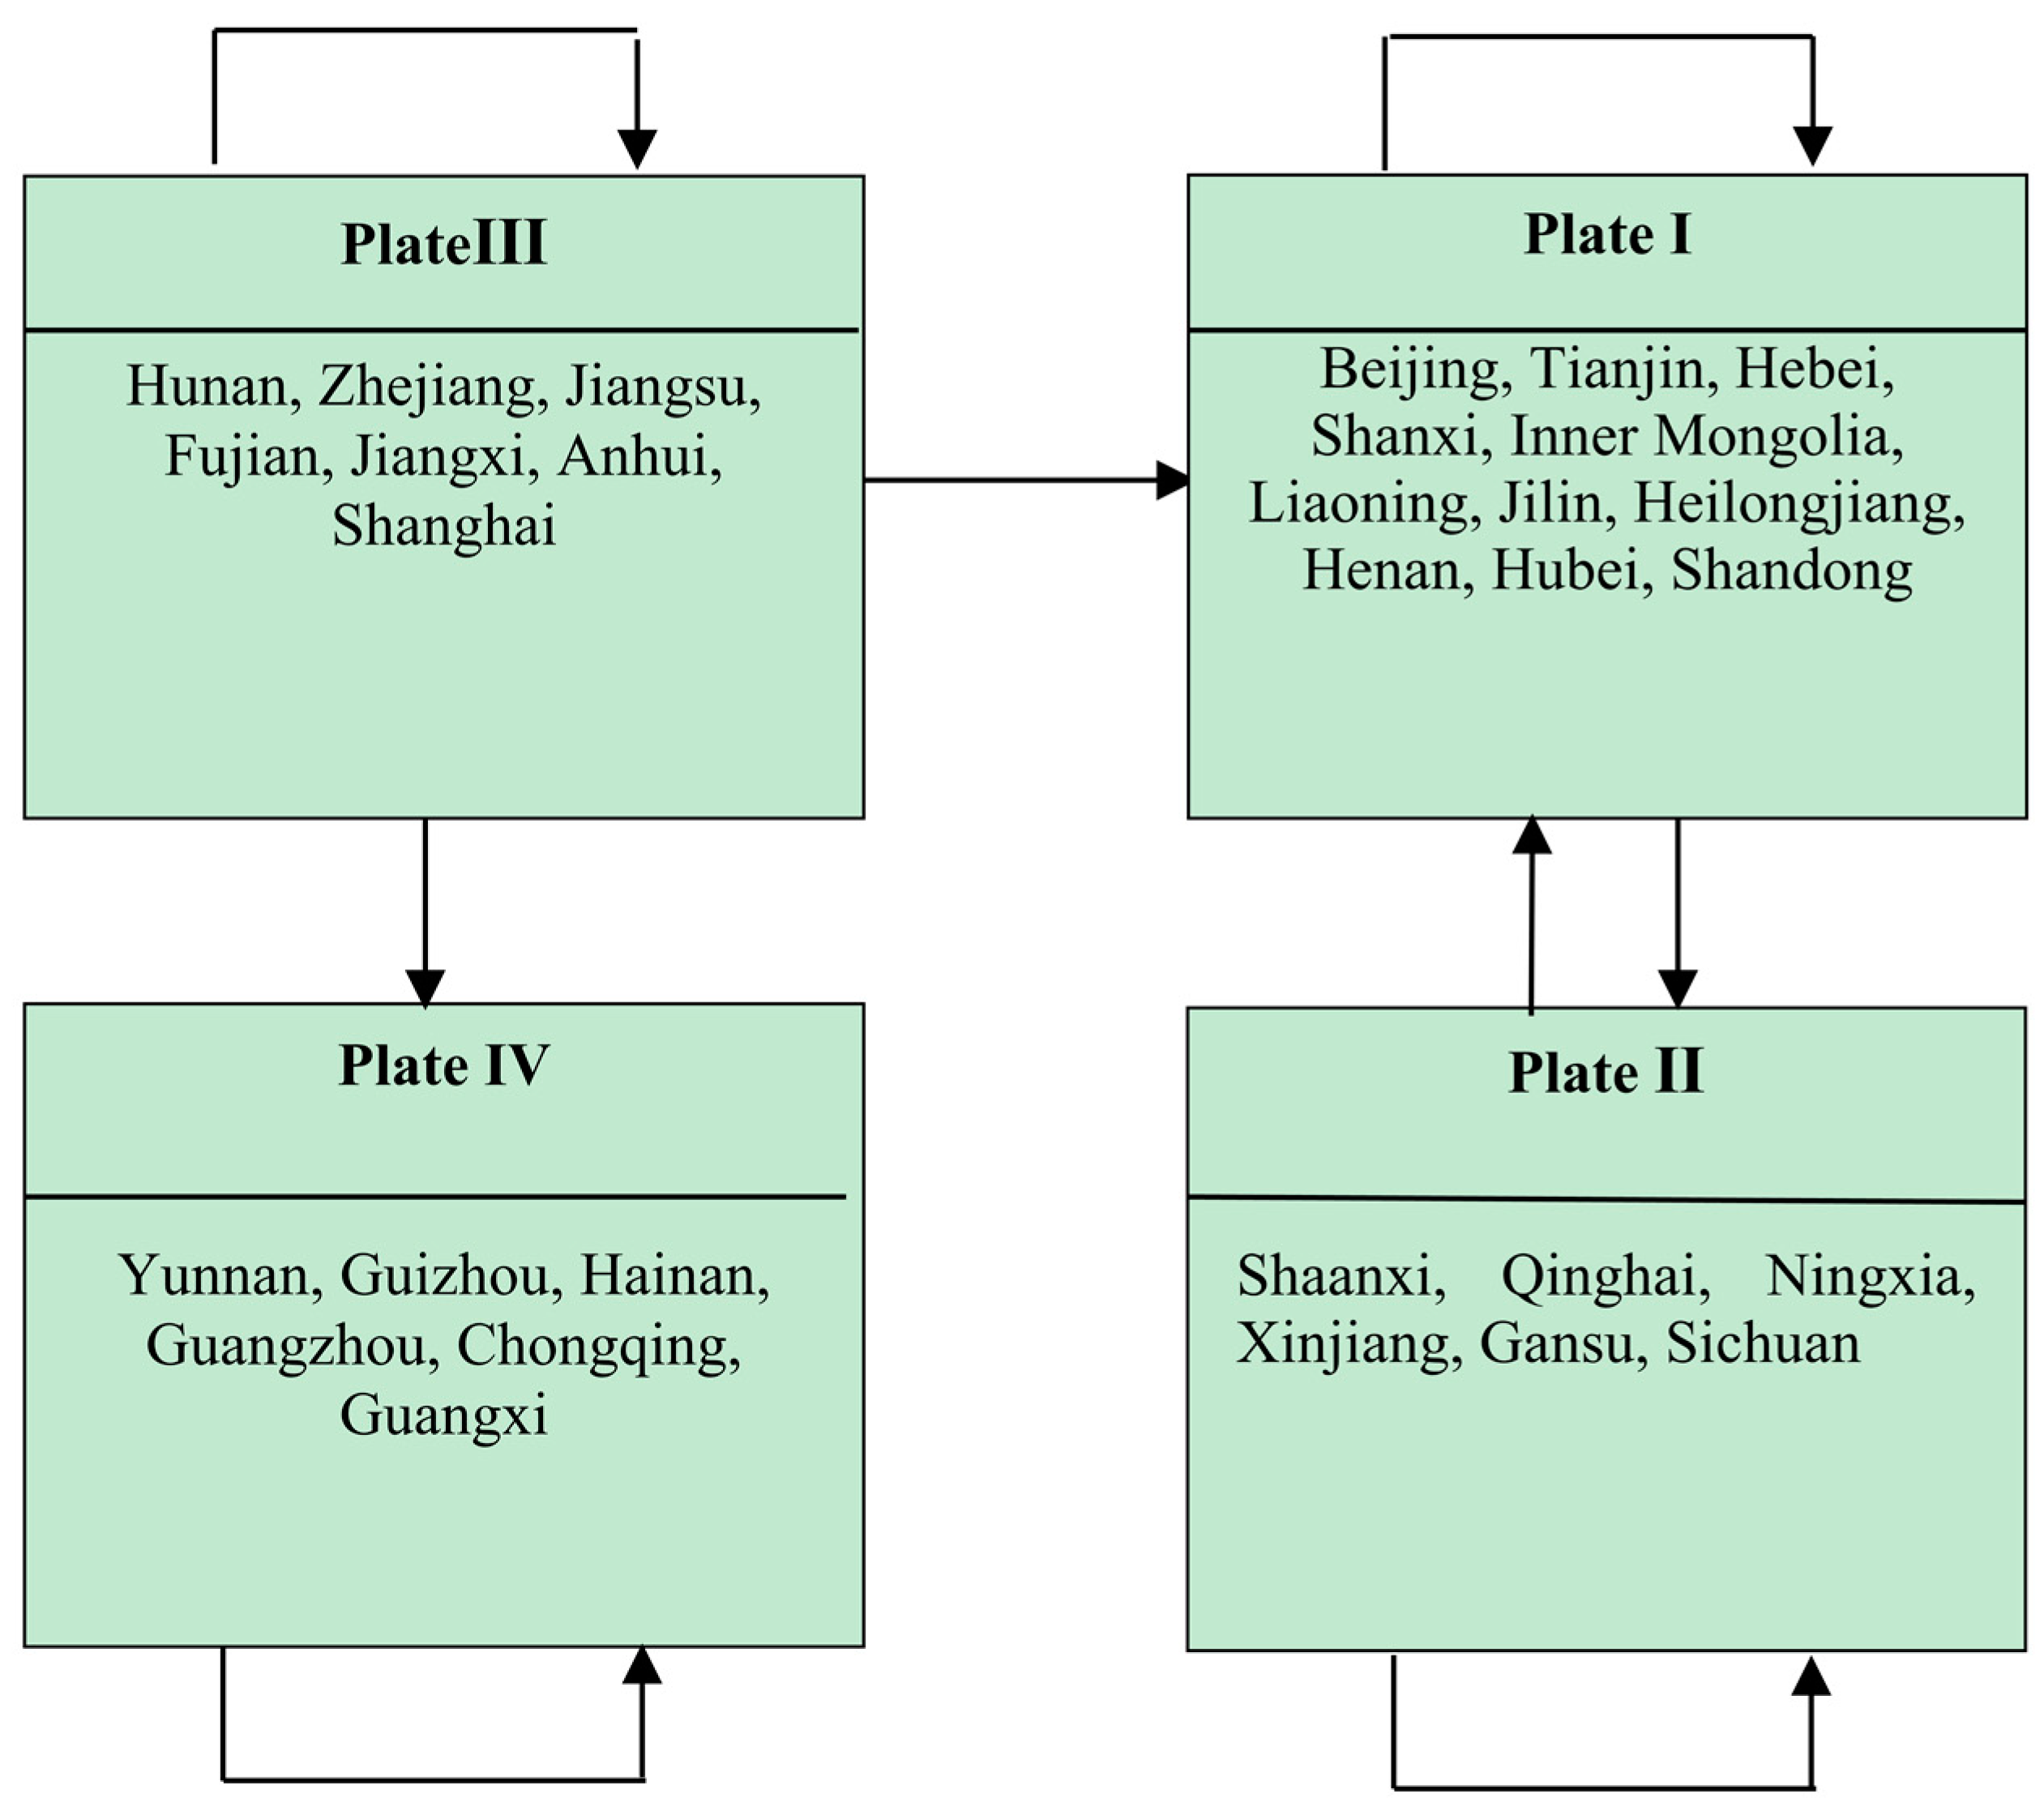
Table 4, there were a total of 489 correlation relations in the network in the application stage of agricultural technology, including 289 external relations and 200 internal relations among the four plates. There were still clear spatial correlation and spillover path effects among the plates. There were 11 members of Plate I, namely Beijing, Tianjin, Hebei, Shanxi, Inner Mongolia, Liaoning, Jilin, Heilongjiang, Henan, Hubei, and Shandong. There were six members of Plate II, namely Shaanxi, Qinghai, Ningxia, Xinjiang, Gansu, and Sichuan. There were seven members of Plate III, namely Hunan, Zhejiang, Jiangsu, Fujian, Jiangxi, Anhui, and Shanghai. There were six members of Plate IV, namely Yunnan, Guangzhou, Guizhou, Hainan, Chongqing, and Guangxi. According to the above analysis, we concluded that plateIwas a net income plate, plate II was a two-way overflow plate, plate III was a net overflow plate, and plate IV was a broker plate.
3.5.3. Analysis of Correlation between Plates
The network density matrix and image matrix of the plates as shown in
Table 5 can reveal the correlation relationship and overflow path between the blocks of the spatial correlation network of agricultural science and technology innovation development in China. Therefore, by drawing the relationship diagram of the four plates, we analyzed the action mechanism among the plates of the spatial correlation network of agricultural science and technology innovation development in China.
In the stage of technology research and development, as shown in
Figure 13, plate I and plate IV not only overflowed within the plate, but also sent out relations to plate II and plate III. Plate II and plate III overflowed within the plate and received relationships from the external plate at the same time. The development elements of agricultural technology innovation in north, northeast, central, and southwest China mainly flowed to the Yangtze River Delta, the Pearl River Delta, and the northwest region to provide support for agricultural technology research and development in these regions. The Yangtze River Delta, Pearl River Delta, and northwest China were the net income regions of the associated network of agricultural science and technology innovation and development in the stage of agricultural technology research and development, and also the terminal region of the transmission path of agricultural science and technology innovation and development elements.
In the technology application stage, as shown in
Figure 14, the four plates all demonstrated the phenomenon of internal plate overflow. Plate I and plate II received and sent out to each other, and plate III sent out relationships to plate I and plate IV. From this, we can see that the development factors of agricultural science and technology innovation in parts of north China, northeast China, and central China mainly flowed to northwest China at the stage of technology application, but also received a large number of innovation factors from northwest China, south China, and east China, thus realizing the innovation development and dynamic balance of their own regions.
The Beijing–Tianjin–Hebei region, in particular, occupies a leading position in the related network of agricultural science and technology innovation and development in the stage of technology application and demonstrated a strong capability of achievement transformation and technology application. East China and south China, as net spillover plates, continued to send out relationships to other regions, while southwest China, as net income plates, had a slightly insufficient ability to transform agricultural scientific achievements and apply technologies, and to a large extent depended on the support of factors in east and south China to realize innovative development.
Based on the plate correlation between the two stages, the relationship of sending and receiving between the plates was not symmetrical, and the plate correlations between the stage of technology research and development and the stage of technology application tended to be in opposite directions. For example, certain provinces of the net benefit plate in the technology research and development stage became two-way spillover plates in the technology application stage, while the two-way spillover plates in the technology research and development stage became net benefit plates in the technology application stage. This is related to the current situation of China’s agricultural science and technology innovation and development; that is, the relevant innovation elements of agricultural technology research and development and agricultural technology application are mastered in different regions, and their flow trends are also different.
4. Analysis of the Influencing Factors of the Spatial Correlation Network of Agricultural Science and Technology Innovation Development in China
As the differences in the average years of education of farmers in the stage of agricultural technology research and development and the differences in the proportion of the sown area of grain crops in the stage of technology application did not pass the correlation test, these two indexes were removed. QAP regression analysis was used to measure the influencing factors of the spatial correlation network. As shown in
Table 6 the results show that, in the research and development stage of agricultural technology, all other factors passed the test except the difference in the sown area per unit of crops, the difference in pesticide usage, and the difference in employees with more than 15 years of education.
Therefore, the difference in the agricultural science and technology market level, the government support for agriculture, the geographical proximity, and the factor input level and factor output level in the factor group of agricultural economic development level between the different regions were the important factors affecting the spatial correlation of agricultural science and technology innovation.
In the technical application stage, the regression coefficient of the total output value difference of the agriculture, forestry, fishery, and animal husbandry industries; the difference of the sown area of the crops per labor; and the geographical adjacency relation was 0.000, which is significant at the 1% level. This indicates that the difference in the scale structure (the total output value of the agriculture, forestry, fishery, and animal husbandry industries), the difference in the factor input level, and the geographical adjacency relationship in the level of agricultural economic development are the influencing factors of the spatial correlation of agricultural science and technology innovation.
However, the difference in the grain yield per unit grain crop sown area, the difference in the pesticide and fertilizer usage per unit of crop sown area, the difference in the technology market turnover, and the difference in the agricultural science and technology funds did not pass the significance test, indicating that the above factors had no significant impact on the spatial correlation of agricultural science and technology innovation at the stage of technology application.
5. Policy Implications
The above research shows that the level of agricultural science and technology innovation in China is not only related to individual provinces and cities but also related to the establishment of long-term, collaborative innovation mechanisms. Therefore, the following points should be considered when formulating relevant policies:
(1) The government department plans for the innovation and development of agricultural science and technology should be based on overall scientific planning, and cannot only consider the provinces themselves. It is necessary to fully understand and accurately grasp the structural characteristics of the spatial correlation network of agricultural science and technology innovation and development in China, to strengthen inter-provincial collaborative innovation, and to vigorously improve the system and mechanism of coordinated development of agricultural science and technology innovation in various regions to ensure the stability of the whole network and the balance of the relationship among provincial members.
The government should follow the principles of precise regulation and targeted policy, and formulate policies for the development of agricultural technology innovation in the regions of China. Make full use of the leading advantages of the central and eastern regions to strengthen the spillover effect of the innovative development elements within the palte, and actively transform its functions to make it an "incubator" and "gas station" of the development of agricultural science and technology innovation elements.
(2) The spatial correlation network for the innovative development of agricultural science and technology in China should be optimized, and the advantages of core provinces should be utilized to promote the correlation among various sectors. At the same time, the reaction mechanism of agricultural science and technology innovation and development should be established to realize the reverse overflow of innovation and development factors, thus narrowing the difference in agricultural science and technology innovation and the development level between plates, realizing balanced development inside and outside the plates and promoting the balanced improvement and sustainable development of the national agricultural science and technology innovation and development level.
(3) For the geographically adjacent areas, it is necessary to strengthen and maintain the cooperation and exchange of the neighboring areas and to conform to the strategic deployment of agricultural collaborative innovation in China, such as the “Beijing–Tianjin–Hebei Modern Agricultural Science and Technology Collaborative Innovation Community”, “Yangtze River Delta Agricultural Science and Technology Integration Joint Research”, and other regional agricultural science and technology innovation development strategies, and to construct an agricultural collaborative development network of adjacent areas.
For regions with large differences in the scale structure, factor input–output level, and government support, a cross-regional agricultural coordinated development platform should be established, and spatial connections should be established between intermediary regions in each “broker plate” of the platform and other advantageous provinces to thereby realize the cross-regional flow, sharing, and integration of agricultural science and technology innovation factor resources.
6. Conclusions
In this study, we proposed to study the spatial correlation network of development level of agricultural science and technology innovation from the perspective of spatial correlation, and took China as an example to study the evolution trend, structural characteristics and influencing factors of the spatial correlation network of development level of agricultural science and technology innovation. The results show that the development of China’s agricultural science and technology innovation has very obvious spatial correlation. The spatial correlation network of the development level of agricultural science and technology innovation is in a connected state and has the characteristics of ‘core-edge’. And factors such as the level of agricultural technology market can affect the spatial correlation of the spatial correlation network. This research can provide a policy reference to use the cross-regional coordinated development mechanism to solve the problem of uneven and asymmetry in the distribution of elements in various regions.
Although we studied the agricultural technology innovation network, future research could use the model of niche strength, width, and overlap to study the spatial correlation network of agricultural technological innovation based on the niche theory in favor of better explaining the regional gap and the spatial correlation in the agricultural technological innovation spatial correlation network.


