A Balance Interface Design and Instant Image-based Traffic Assistant Agent Based on GPS and Linked Open Data Technology

1
Department of Electrical Engineering, St. John’s University, New Taipei City 25135, Taiwan
2
Department of Information and Communication, St. John’s University, New Taipei City 25135, Taiwan
*
Author to whom correspondence should be addressed.
Symmetry 2020, 12(1), 1; https://doi.org/10.3390/sym12010001
Submission received: 16 October 2019
/
Revised: 4 December 2019
/
Accepted: 15 December 2019
/
Published: 18 December 2019
(This article belongs to the Special Issue Selected Papers from IIKII 2019 conferences in Symmetry)
Abstract
:Taiwan is a highly informational country, and a robust traffic network is not only critical to the national economy, but is also an important infrastructure for economic development. This paper aims to integrate government open data and global positioning system (GPS) technology to build an instant image-based traffic assistant agent with user-friendly interfaces, thus providing more convenient real-time traffic information for users and relevant government units. The proposed system is expected to overcome the difficulty of accurately distinguishing traffic information and to solve the problem of some road sections not providing instant information. Taking the New Taipei City Government traffic open data as an example, the proposed system can display information pages at an optimal size on smartphones and other computer devices, and integrate database analysis to instantly view traffic information. Users can enter the system without downloading the application and can access the cross-platform services using device browsers. The proposed system also provides a user reporting mechanism, which informs vehicle drivers on congested road sections about road conditions. Comparison and analysis of the system with similar applications shows that although they have similar functions, the proposed system offers more practicability, better information accessibility, excellent user experience, and approximately the optimal balance (a kind of symmetry) of the important items of the interface design.
1. Introduction
Within the context of the artificial intelligence, big data, and cloud computing (ABC) era, 2019 is the first year to have fifth generation (5G) mobile Internet service, meaning big data based on the cloud computing environment must rely on artificial intelligence technology for processing. Without solutions for the volume, velocity, variety, and veracity (4V) data characteristics, the problem of garbage in, garbage out (GIGO), which is often mentioned in computer science, would continue to occur. Therefore, open data can be a valuable tool to solve this problem. Taiwan is a densely-populated country with heavy traffic, especially in metropolitan areas; thus, an open traffic database provided by government units is very important. This study aims to solve the problem of “true” and “false” in big data floods, which are commonly found in cloud information systems, by using the linked open data (LOD) technology of government units.
Smart mobile devices have become prevalent in recent years. According to the eMarketer survey data of 2016 [1], Taiwan has the highest penetration rate of smartphones, as compared with Singapore and South Korea. According to the 2018 Household Digital Opportunity Survey Report of the National Development Council [2], the mobile Internet usage rate among Taiwanese grew from 41.9% in 2009 to 98.2% in 2018, and mobile Internet usage has long been the main trend of Taiwanese Internet usage. The survey also pointed out that 84.9% of Taiwanese people over 12 years old use mobile Internet, while more than 60% of Taiwanese people under sixty-five years old use mobile Internet; therefore, the use of information systems or applications on various mobile devices by Taiwanese people via the Internet is undoubtedly a fairly mature digital skill. Thus, appropriate, convenient, and correct mobile or cloud information systems or applications are in great demand.
Taiwan is a highly informational country, and transportation is one of the most important issues related to people on a daily basis. The transportation network is critical to the national economy, and is the benchmark index of public construction. Building a sound, smooth traffic network is an important infrastructure for the country’s economic development, while traffic has a negative association with a large influx of vehicles, road construction, and traffic accidents [3,4,5,6], which are the reasons for road congestion. However, Taiwan is a country with dense population and heavy traffic, which is one of the main causes of road congestion. Therefore, there is a growing demand for information systems that can facilitate real-time and dynamic queries, and present current traffic information, especially for mobile application users.
With the prevalence of smartphones, people have easy access to communication applications, such as LINE, WeChat, Telegram, and Skype. As of March 9, 2018, the monthly active users of LINE reached nineteen million in Taiwan, with an opening rate of about twenty times a day [7], which also represents the dependence of users on smartphones. In addition, the Taiwanese have a large number of private cars [8], and self-help travel is a common mode of transport [9]. Therefore, most of them rely on car navigation systems, resulting in a higher probability of road congestion [10], such as the problem mentioned by the Waze system—because there is no car owner feedback mechanism, this leads to a dilemma in avoiding the “A” road section, crowding drivers into the “B” road section, just like the problem caused by using only Google Maps [11]. For this reason, if users can use mobile devices to access the real-time traffic information on communication applications, they can be updated on the latest road conditions, and thus avoid traffic congestions. This study aims to develop a traffic assistant agent with a simplified reporting procedure on an intuition-based graphical interface for smartphone use.
Therefore, this study used LOD and global positioning system (GPS) technology to develop an intelligent traffic assistant agent with user-friendly interfaces and a user reporting mechanism to instantly check traffic flow. This study further explored the feasibility of developing a traffic assistant agent that does not require users to download the application, provides cross-platform services, saves system development costs, and has practicability, accessibility of information, excellent user experience, and approximately optimal balance of the important interface design.
2. Literature Review and Development Technologies
This study first reviewed the various traffic assistant information systems available in Taiwan, including Road Condition Autotoll [12], Real-Time Traffic Image—RoadCam [13], Police Broadcast Real-time Traffic [14], and New Taipei City Advanced Traveler Information System [15], as shown in Table 1. In summary, although those systems can use the responsive web design (RWD) technology to present the information page with the most suitable size and can automatically retrieve the users’ position, they still need improvement on providing the correct corresponding information, and most of them lack the user reporting function.
Open data, especially government open data, is a huge resource that has not been fully developed. Since 2011, Taiwan’s government has also started to actively promote open government and open data platforms to provide public access. The JavaScript Object Notation (JSON) format is most commonly used on the government open data platform, which can store and transmit data in plain text. For more complex types of data, transmission can be achieved through objects or arrays [16]. LOD is an applied open database that organizes the data set according to the principle of linked data, and there are many research studies related to open data or LOD in the literature. For example, Wang [17] combined common classification methods, K nearest neighbor (KNN), support vector machines (SVM), and decision trees to explore and link open data in order to achieve automatic classification of news articles. Yan [18] took the government open data platform as the database, and explored the technologies related to building the resource description framework (RDF) based on a prototype platform. Yu [19] studied Taipei City’s open data platform’s traffic parking lot, smiling bicycle (a public bicycle rental system in Taipei), and mass rapid transit (MRT, a rapid transit system in Taipei) data to explore relevant technologies for LOD applications. Albert et al. [20] presented the research project census data open linked (CEDAR) data set, which is the historical census of the Netherlands in LOD format, to explore a more accessible, better connected, and history-related integration technology. Alobaidi et al. [21] used LOD to enrich the query content to improve search effectiveness and ranking. Selvam et al. [22] proposed a systematic approach using ontology and LOD with significance to semantic links in the social event detection (SED) task. Pourhomayoun et al. [23] proposed an effective end-to-end system for traffic vision, detection, and counting on real-time traffic open data. Most of the above literature used LOD support to add and evaluate subsequent information services. This study used the Azure cloud platform support to extract appropriate corresponding LOD information (as detailed in Section 3.2 and Section 3.3) after referencing GPS position capture and conversion comparison, which supports the operation of the overall information system and enhances the correctness, authenticity, and integrity of location-based service (LBS) information service provision.
GPS is a satellite network that can measure satellite distance to accurately capture the position on earth by continuously transmitting coded information to satellites, thus providing corresponding information services. The GPS information is free and open to users around the world. There are many research studies on the GPS architecture and information systems in literature. For example, Juan [24] quoted GPS signals from mobile devices to explore relevant technologies to analyze the space–time data of office workers’ lives. Liou [25] integrated the GPS and Beidou satellite navigation system, put forward an adaptive multitime algorithm, and explored relevant technologies to achieve single-frequency, real-time, precise single-point positioning. Tu [26] connected the electronic collars of pets to smartphones as an invisible dog leash, and used the BLE (Bluetooth Low Energy) received signal strength indicator with GPS to explore the relevant technologies of real-time pet tracking. Fridman et al. [27] used styles, applications, web browsing, and GPS positioning to realize the related technologies of active authentication on mobile devices. Based on the survey of GPS-assisted travel in Beijing suburbs, Ta et al. [28] studied the related technologies of personal commuting efficiency according to the difference in commuting distance and route selection efficiency between the morning and evening peak traffic hours. Aliprantis et al. [29] described a concept with image identification and matching from the Europeana platform, which can link the LOD cloud from cultural institutes around Europe and mobile augmented reality applications for cultural heritage without accurate geo-based locations. Khaghani et al. [30] proposed a platform for dynamic performance assessment of roadway networks, leveraging coarse GPS data from probe vehicles, such as taxis, to quantify the resilience of road networks using a multidimensional approach. As discussed above, it is a development trend of contemporary information systems to quote GPS to explore corresponding information services (as detailed in Section 3.2). This study used GPS location acquisition and conversion to explore how to quote appropriate LOD and related technologies to provide corresponding value-added LBS information services.
In the age of the Internet, mobile devices have been widely used to deliver personalized services. For example, LBS can be integrated with various technologies, such as GPS positioning and mobile data, to provide comprehensive applications for services related to spatial location. In fact, LBS was first provided as a rescue service by an American operator in 1996, then called E911 [31]. Syu [32] used the message queuing telemetry transport protocol (MQTT) to carry out data transmission and realize mobile phone application push and broadcast function. They applied relevant technologies to calculate the value of taxi drivers’ LBS in the Taoyuan area of Taiwan. Chou [33] combined the Internet of Things (IoT) and LBS, using Arduino and mobile devices to identify the common causes of accidents in China, including not paying attention while driving, not keeping a safe distance, careless driving, drunk driving, etc. They also implemented various technologies to integrate sensors with government public data to provide suitable services. Sun et al. [34] used the location label to mark the sensitive and normal locations of mobile users, and designed an algorithm based on the location label to explore relevant technologies to protect users’ location privacy. Wang et al. [35] discussed the issues of location awareness and privacy protection, and explored technologies related to location-based services according to users’ requirements, as based on different locations. Ukrit et al. [36] proposed an LBS architecture PROFILER (a framework for constructing location centric profiles), which was centered on the discrete locations visited by users, and explored the related application technologies. Lin et al. [37] described the methods for efficiently finding the links across maps, converting the data into RDF, and querying the resulting knowledge graphs to solve the problem of how to convert vector data extracted from multiple historical maps into linked data. Sansonetti et al. [38] proposed a research study on integrating the recommendation process of nearby points of artistic and cultural interest (POIs) with related multimedia content, exploiting the potential offered by LOD by following semantic links in the LOD graph with the specific POI to provide personalized suggestions. As discussed above, location-based services, mobile positioning services, and location services can obtain the location information (geographic coordinates) of mobile users through the mobile operator’s radio communication network (e.g., GSM—Global System for Mobile Communications, network, CDMA—Code Division Multiple Access, network) or external location method (e.g., GPS). With the support of the back-end geographic information system (GIS) platform, it provides corresponding value-added information services. This study utilized the Azure cloud platform to explore how to intercept appropriate LOD information after referencing local GPS location acquisition and conversion to support the overall system operation, thus effectively adding value to the quality of cloud information consultation and the sharing function of this system.
Microsoft Azure [39,40] is Microsoft’s public cloud service platform. At present, Microsoft Azure can support up to 30 kinds of service contents, including computing, storage, analysis, network, management, and identification services. In addition, Microsoft Azure has data centers around the world, which have tens of thousands of servers to provide users with applications and research. If one server suddenly fails, another server can take its place to operate in real time to ensure the sustainability of website services. Many studies have used Azure as the research tool. Liou [41] proposed a set of air quality index (AQI) deterioration real-time early warning systems, as based on the Azure cloud computing platform, including a prediction model, evaluation model, and other system operation modules. Ho [42] used the decision tree model on the Microsoft Azure platform to analyze data, and produced a customer recommendation list with high purchase probability. Lin [43] developed an integrated entrance guard system using a face recognition system and Raspberry Pi 3 in combination with Microsoft Azure cloud services. Richard [44] introduced all information services provided on Microsoft Azure. Diaz and Freato [45] mentioned that Microsoft Azure has supported data administrators and developers to provide a rich platform for big data workloads, such as linked services with Azure data and Azure storage. Färber [46] presented the Microsoft Academic Knowledge Graph (MAKG), a large RDF data set with over eight billion triples with information about scientific publications and related entities, used to solve problems in the LOD cloud. Based on the above systems, and with the support of the Azure cloud platform, this study explored and developed relevant technologies for cloud information consultation and sharing in order to automatically balance system operation efficiency and corresponding system stability.
The Google Maps API (Application Programming Interface) is a copyrighted and chargeable development kit developed by the Google company. Users can use the application functions provided by Google Maps (e.g., JavaScript API) by typing the kit and serial key into the webpage program. The users receive the data through the mobile client or the webpage, which presents the map and positioning information. The use of Google Maps API as a map in the literature is quite extensive. Chang [47] combined Google Maps API with a generic algorithm to generate an approximate optimal solution, explored the mathematical vehicle route model, and provided an effective route guidance plan, thereby greatly shortening drive time. Wang [48] analyzed the data of the old 119 system and the new 119 system, explored the related issues and research, and developed technologies for shortening emergency rescue response time after the emergency rescue service data was imported into the geographic information system. Rahmi et al. [49] consolidated MySQL as the main data storage space, and used Firebase to store additional data, where Firebase’s real-time database processes chat data to provide corresponding notifications, along with Google Maps API to support GIS to explore and construct relevant technologies to meet the needs of mobile Android and web applications between doctors and patients. Xia et al. [50] introduced population grid data into a new gravity radiation model, used Google Maps API to obtain grid-level travel costs, and explored relevant technologies for population flow estimation. Tan et al. [51] adopted SPARQL (SPARQL Protocol and RDF Query Language) to query useful data from the DBpedia LOD database to acquire related data nodes and used the page rank algorithm to calculate the importance of each data node in order to build a concept map for awareness training in cybersecurity. Nyo and Hein [52] presented a technique for guiding and controlling autonomous vehicles by using the Google Maps API with GPS for localization of the vehicle on the Google Maps application via WiFi module. As mentioned above, the system also used Google Geolocation API to display the converted address information on the system page according to the location reported by the users’ device and WiFi signal. Furthermore, Google Traffic [53] was used to indicate color stratification as the congestion degree of road sections, thus presenting the authenticity of the proposed system by verifying road condition information in multiple ways.
In summary, this study used a service-oriented information service system, which integrates LOD and GPS to achieve a mobile information service system, with the aim of solving all of the aforementioned problems. The proposed system serves no borders and uses a cross-platform approach, meaning users do not have to repeat learning for different programs. With the integration of Google Maps, the proposed system allows users to obtain the current real-time traffic information according to their current location. In the case of traffic emergencies, they can also inform rear road users to pay special attention, suggesting diversions through the system’s registration form. The real-time information can be sent to the police units so the appropriate manpower can be deployed or other measures could be taken to reduce road congestion. In addition, the proposed system can facilitate user reporting of traffic conditions and can quickly check the nearest intersection monitor and sensors, so as to present the information on the most suitable page. Moreover, it can access cloud resources more quickly, and use and combine the open data provided by the government units to obtain the users’ first-hand information regarding traffic conditions. In summary, the proposed system has the advantages of real-time information, simple and convenient usage, cross-platform use-related information services, and optimal balance of the important items of the interface design, without the need to update applications,
3. Proposed System Architecture
This study used Visual Studio and ASP.NET to develop the web applications. The Microsoft SQL server was used as the system data storage space, and Microsoft Azure was especially used to set up the cloud servers. Government open data was screened and analyzed according to specific conditions by using the circulation method of R language, and then traffic monitoring data content was built in the corresponding cloud database. The R & D of hardware equipment included an ASUS MD710 computer mainframe and ACER E5-572G notebook computer, which were used for information system development and testing. Finally, the receiver was tested on an ASUS ZenFone 3 intelligent handheld device.
3.1. Overall System Architecture
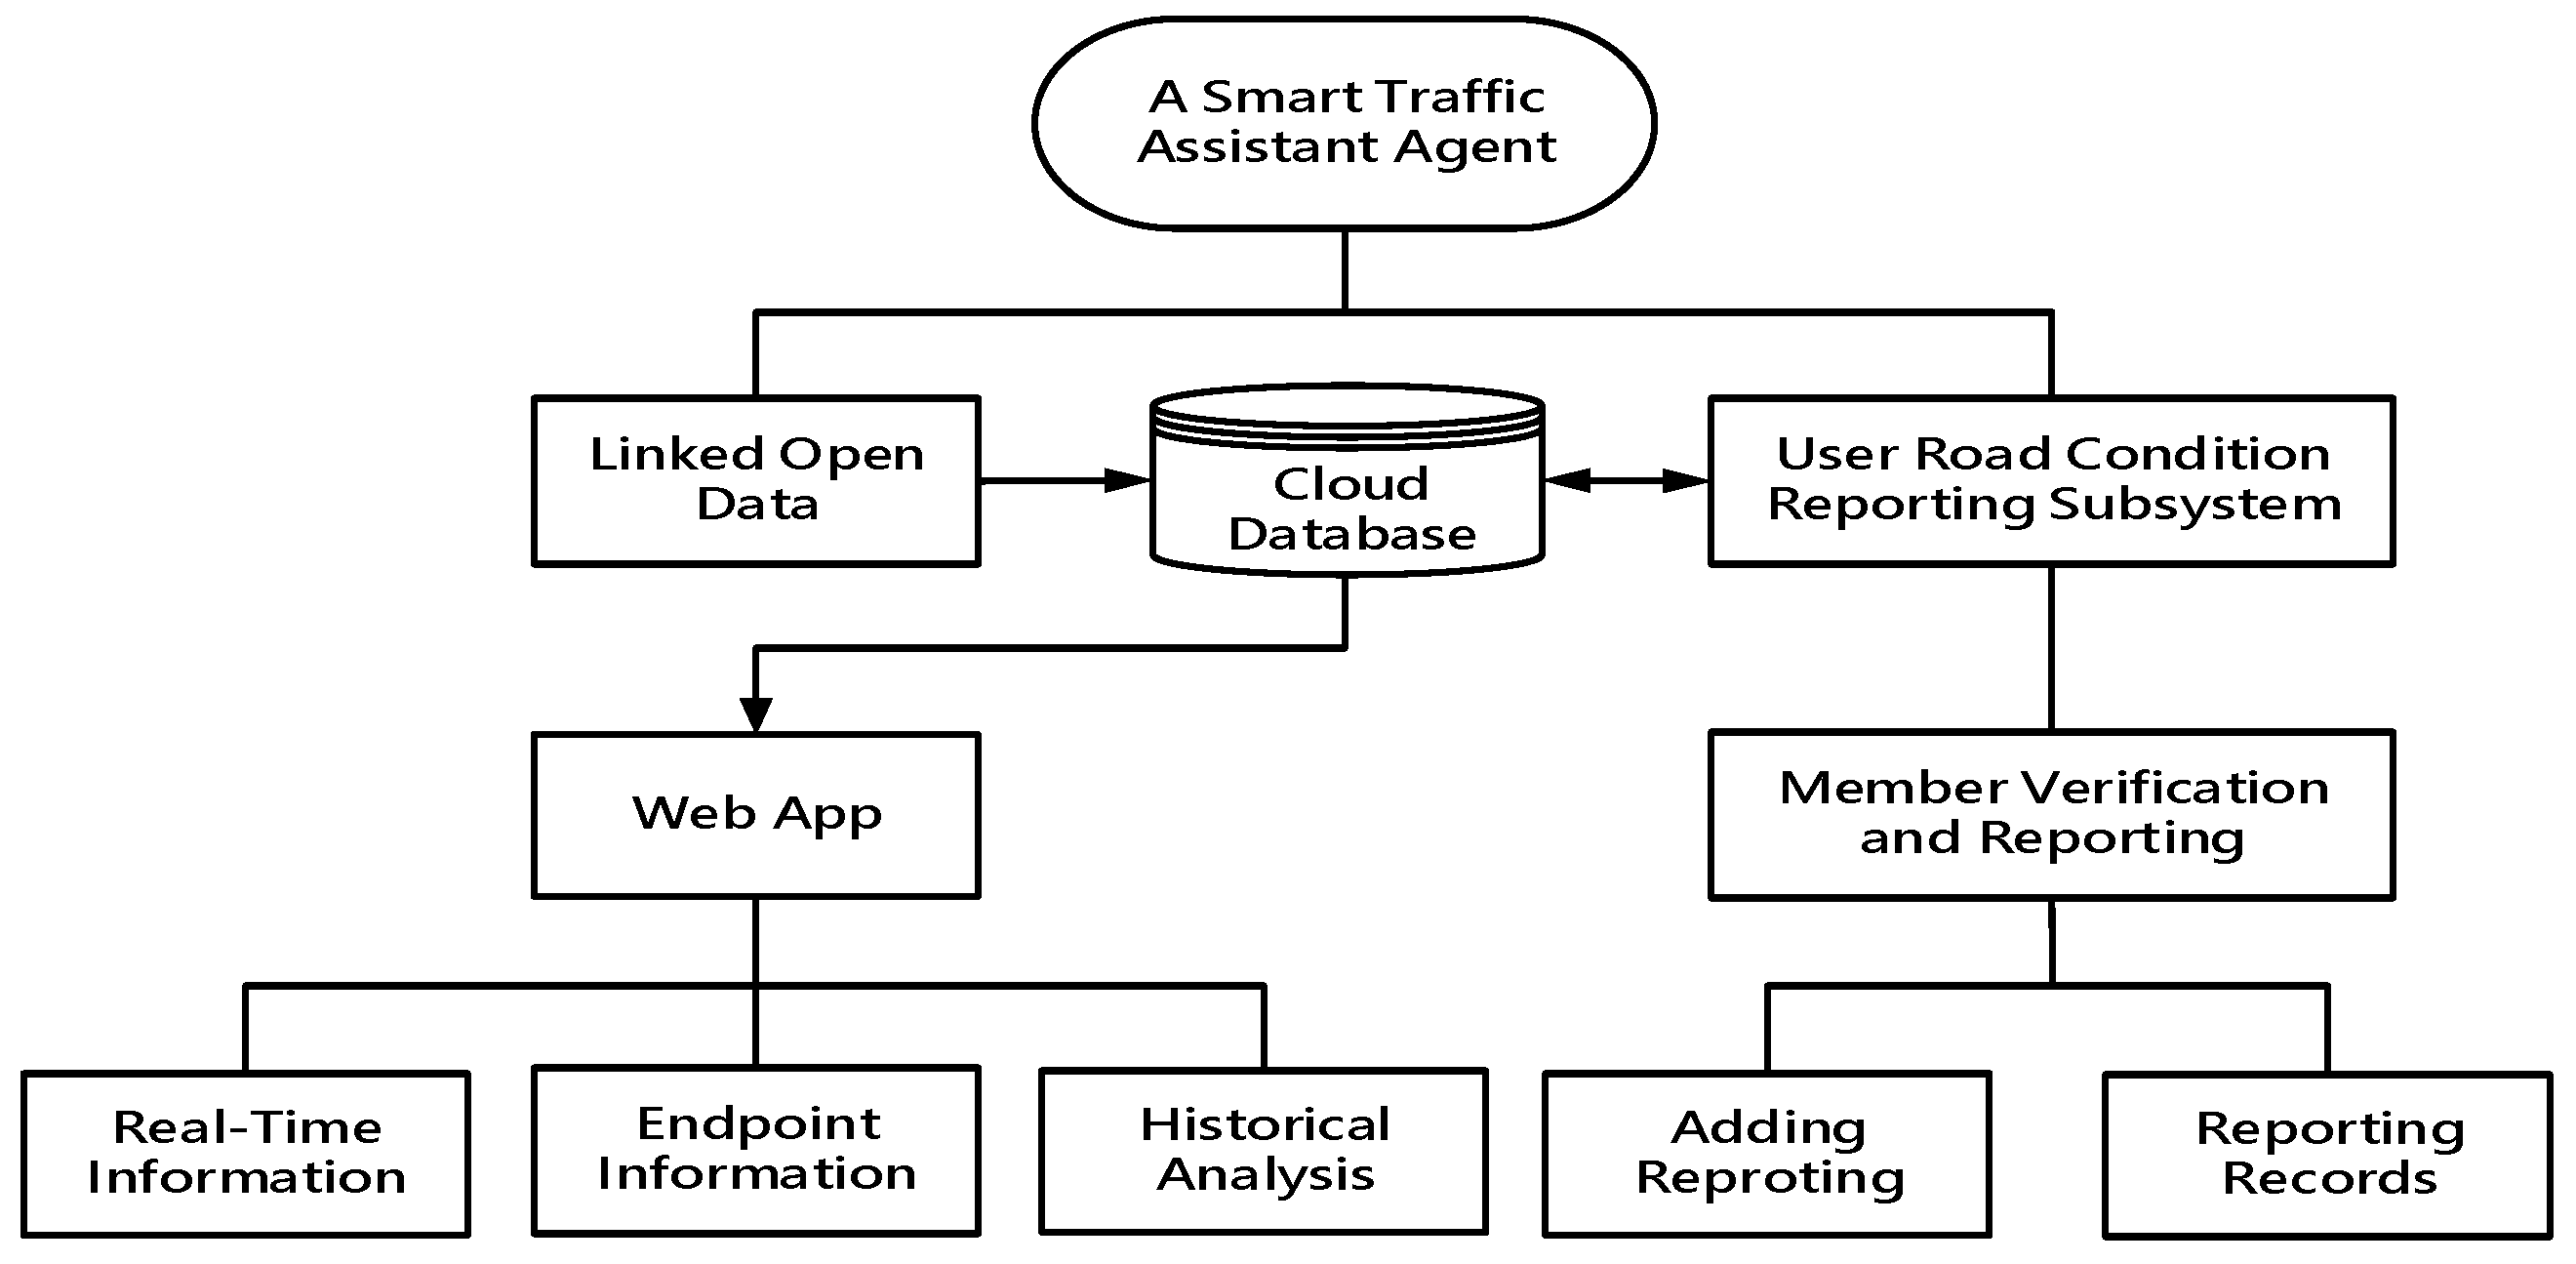
The intelligent traffic assistant agent is a comprehensive application with a location-based service as the main body, which includes a front-end agent web application (web app), a back-end database (SQL Server), and a corresponding cloud database (Azure SQL Database). The system architecture is shown in detail in Figure 1. The web application can present all of the operating functions of the proposed system: real-time information, endpoint information, and historical analysis. When a user opens the system through an intelligent networking handheld device, the system reads the longitude and latitude of the user’s location through the GPS function of the device and presents it on the map, which can display the current road condition data in color; for example, green means smooth and red means congestion. Drivers are reminded to obtain the latest road condition information through the graphical interface in advance. The user reporting subsystem provides up-to-date road condition information, including member verification, addition of reports, and report records.
3.2. LOD
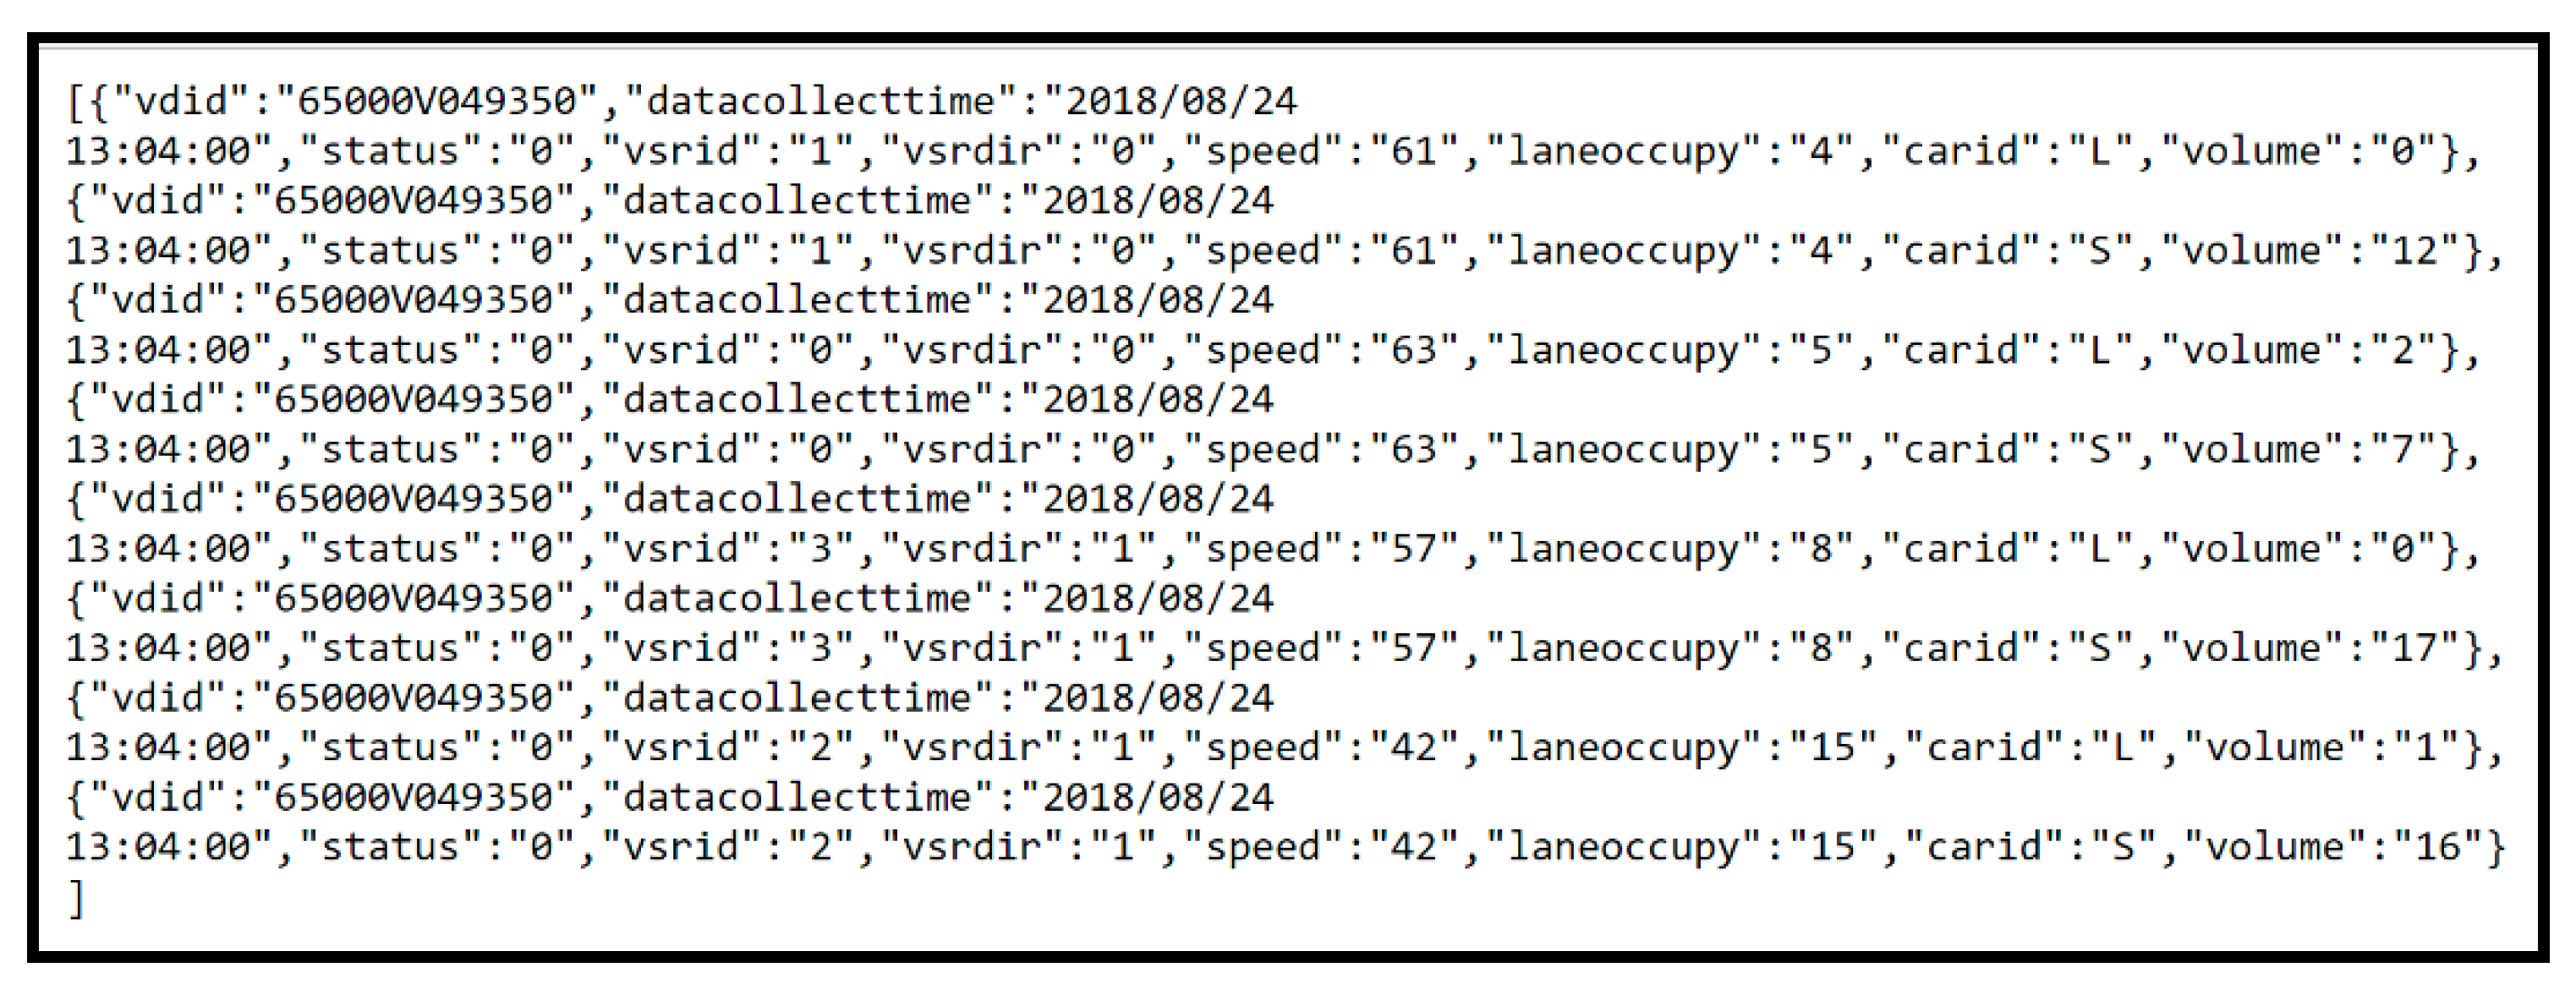
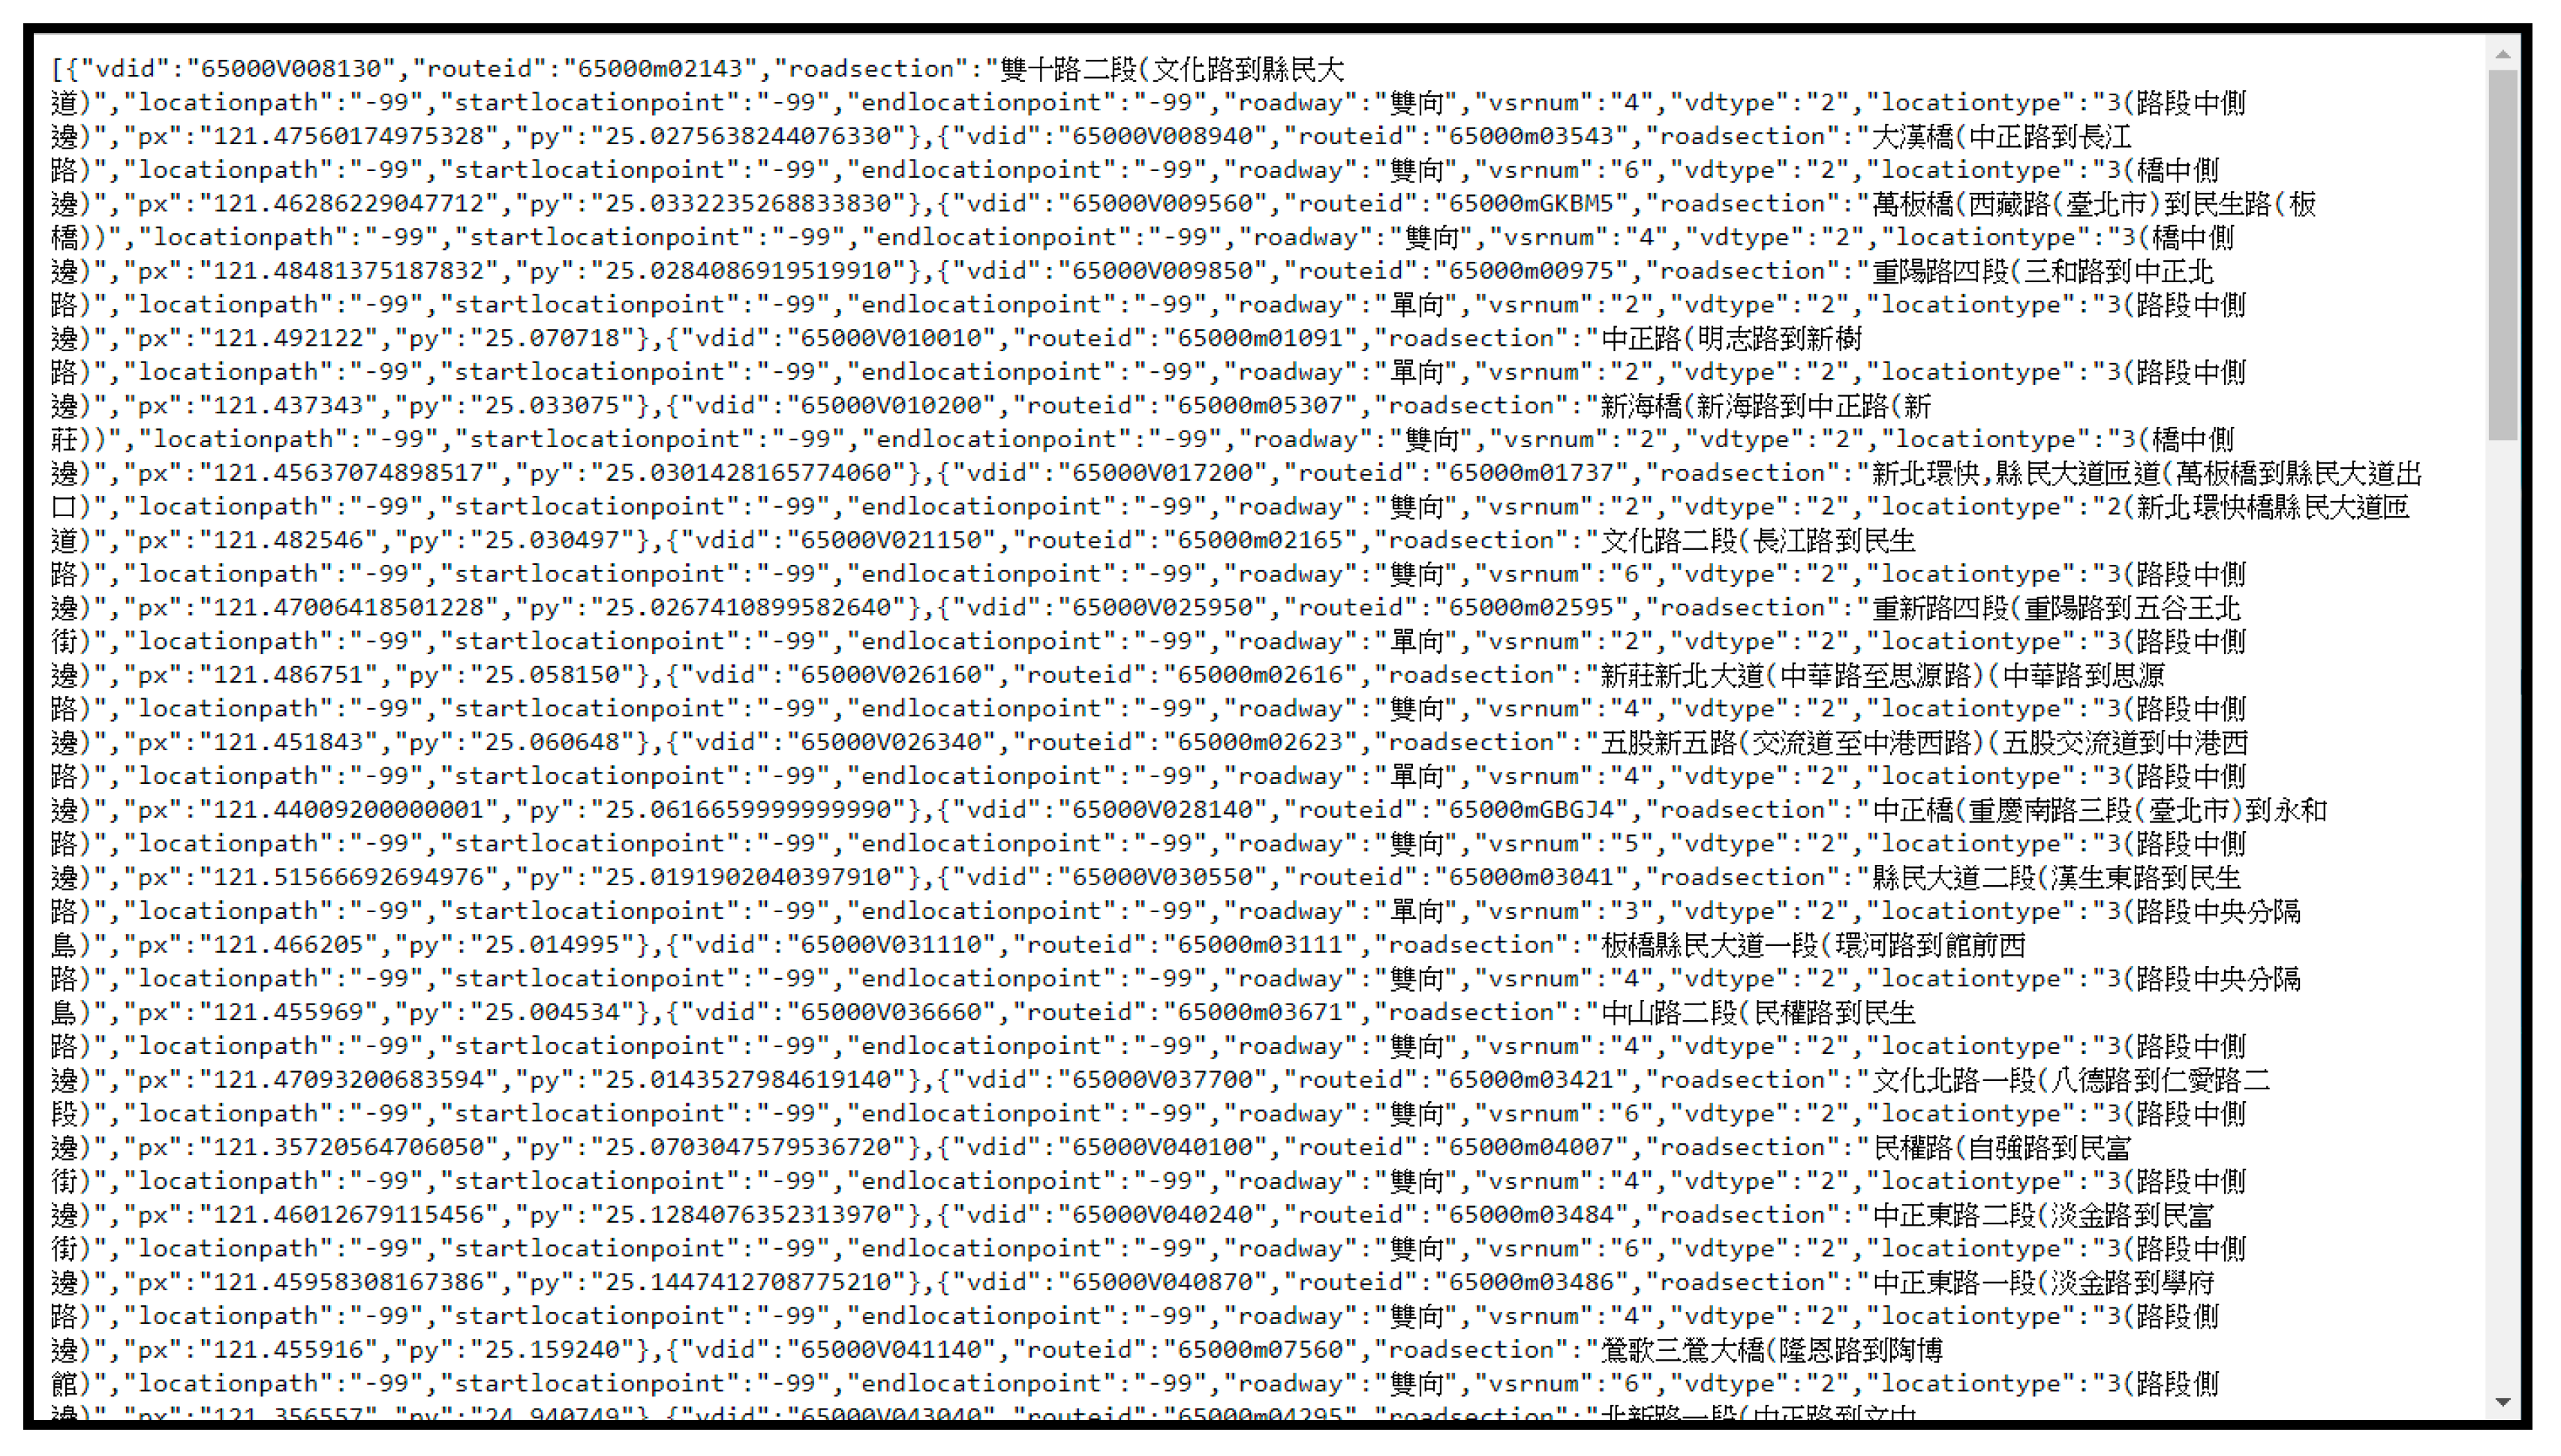
The dynamic vehicle information of the proposed system is retrieved via the API of the New Taipei City Government open data platform through R language. The API updates data once every five minutes, randomly returns a record with eight fields of real traffic data once at a single sensing point, and transmits data in the JSON format, as shown in Figure 2. Each field has the following corresponding meanings.
- vdid: endpoint number;
- datacollecttime: collection time;
- status: endpoint status;
- vsrid: road number;
- vsrdir: road direction;
- speed: detect the current speed;
- carid: detect the types;
- volume: detect the number of vehicles.
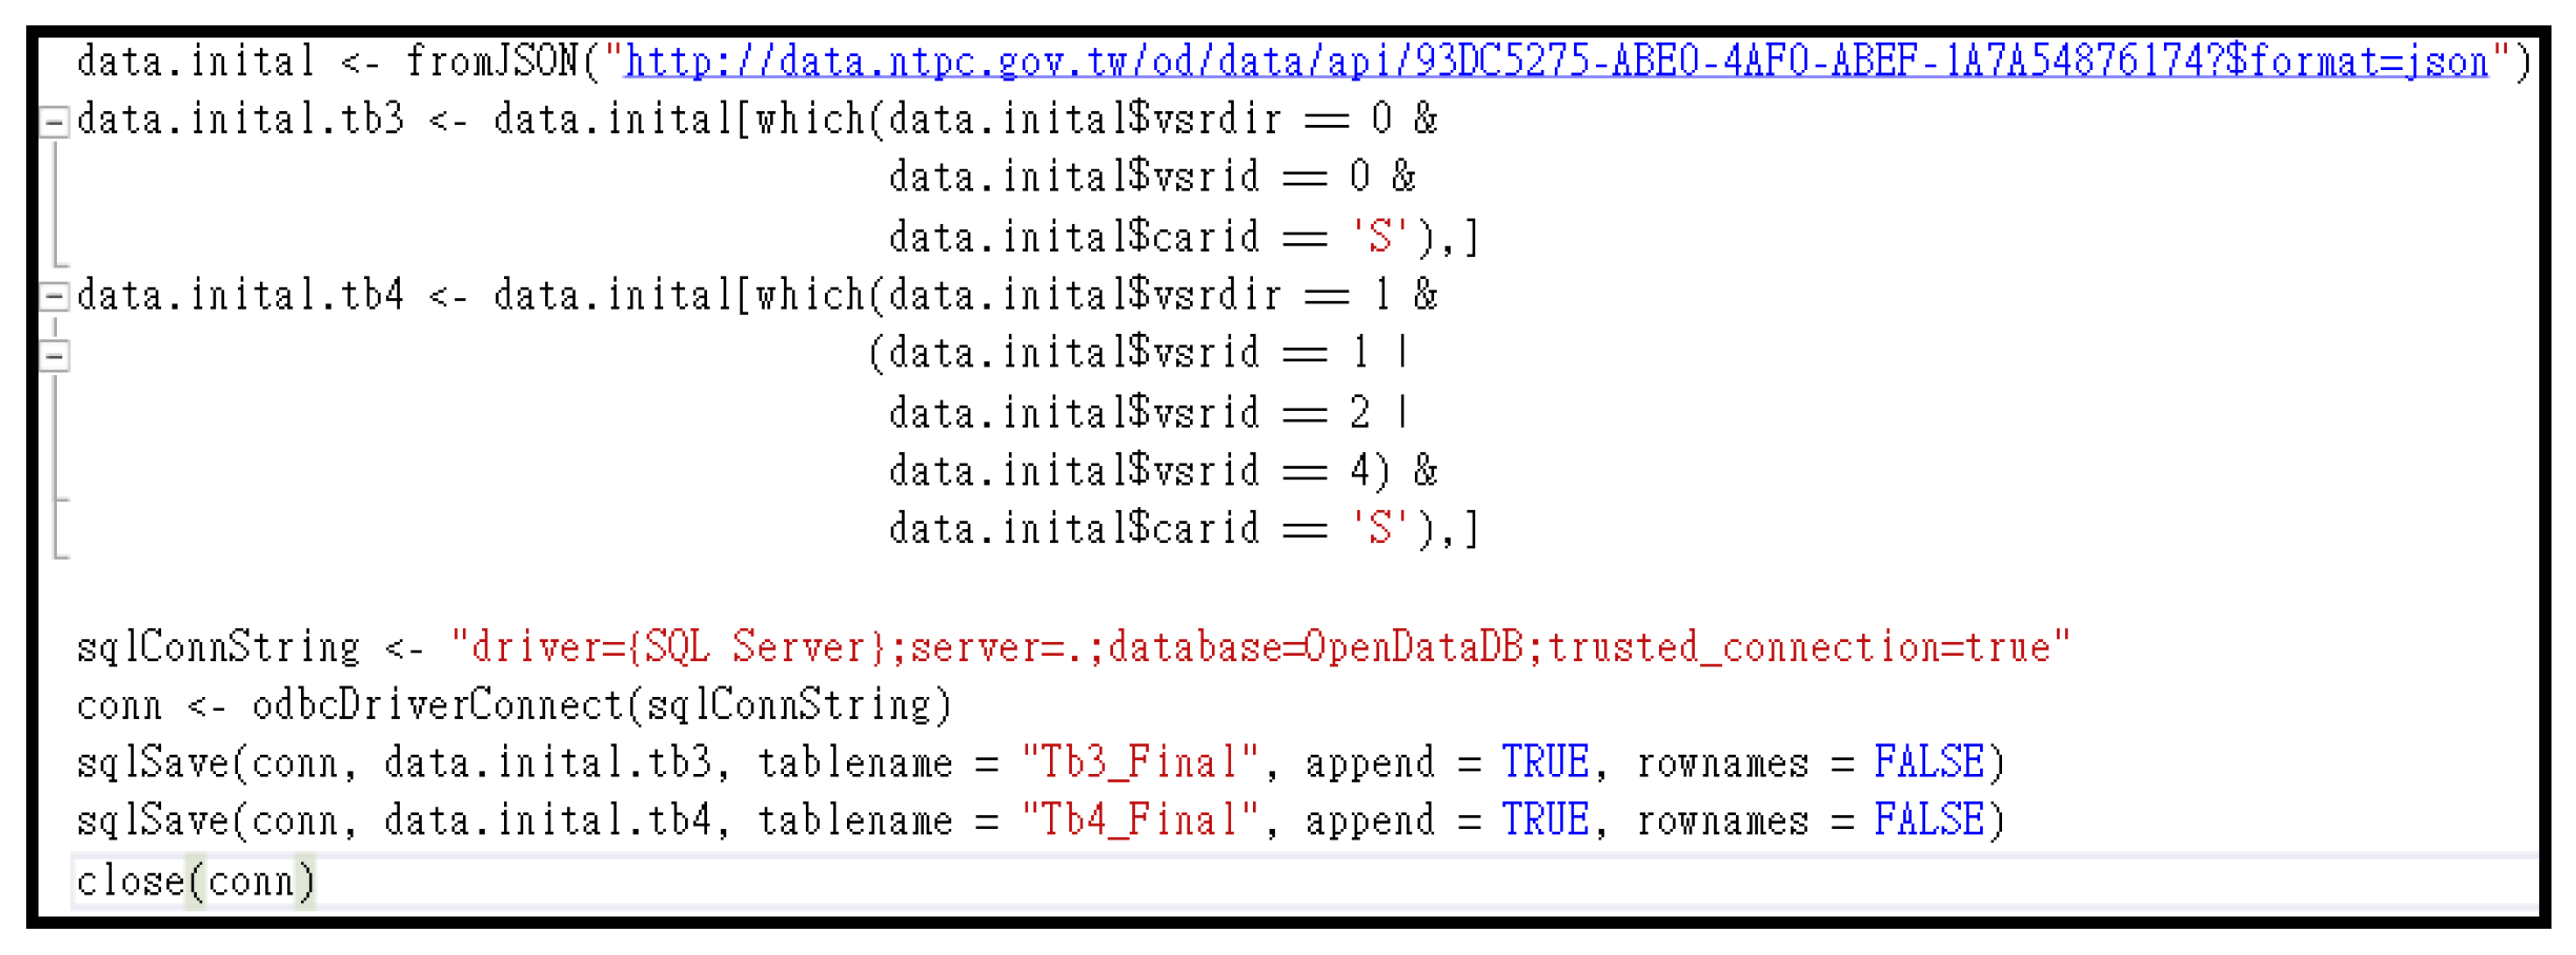
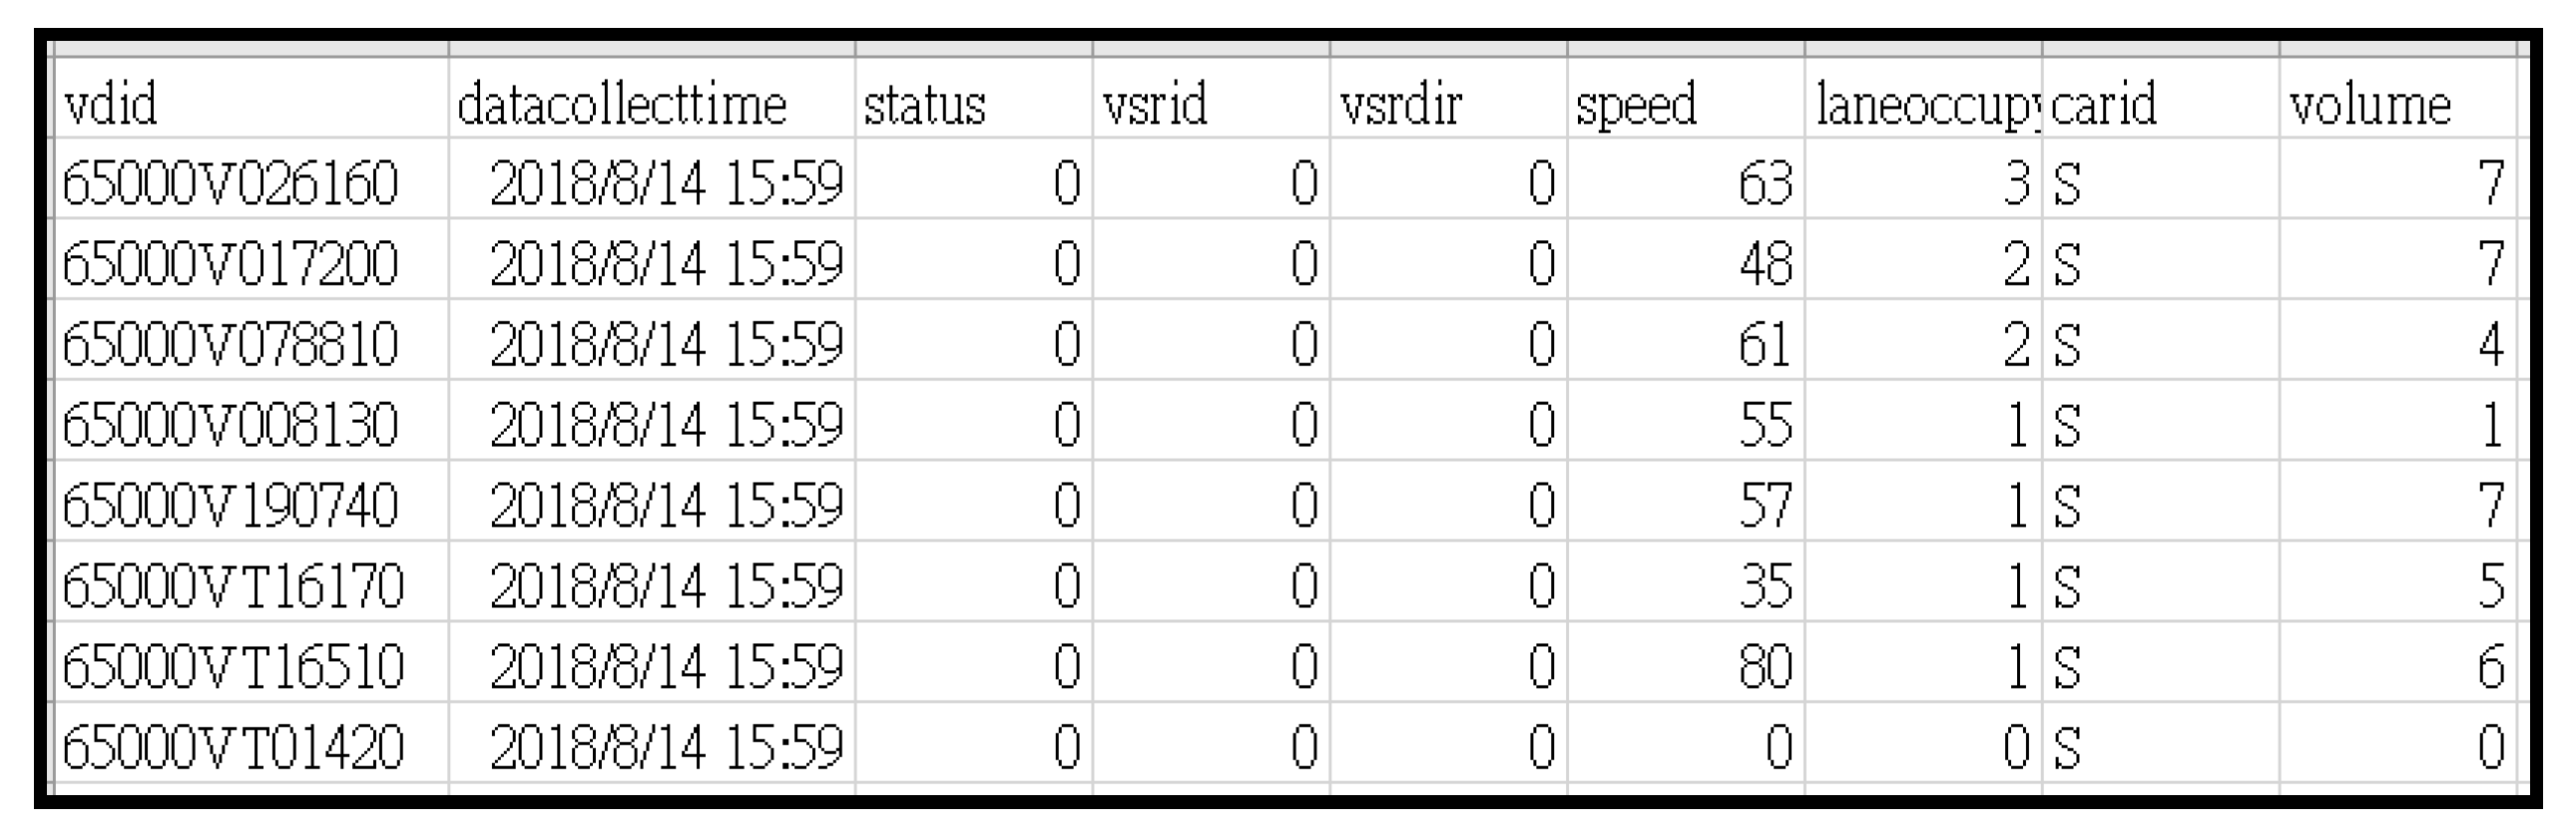
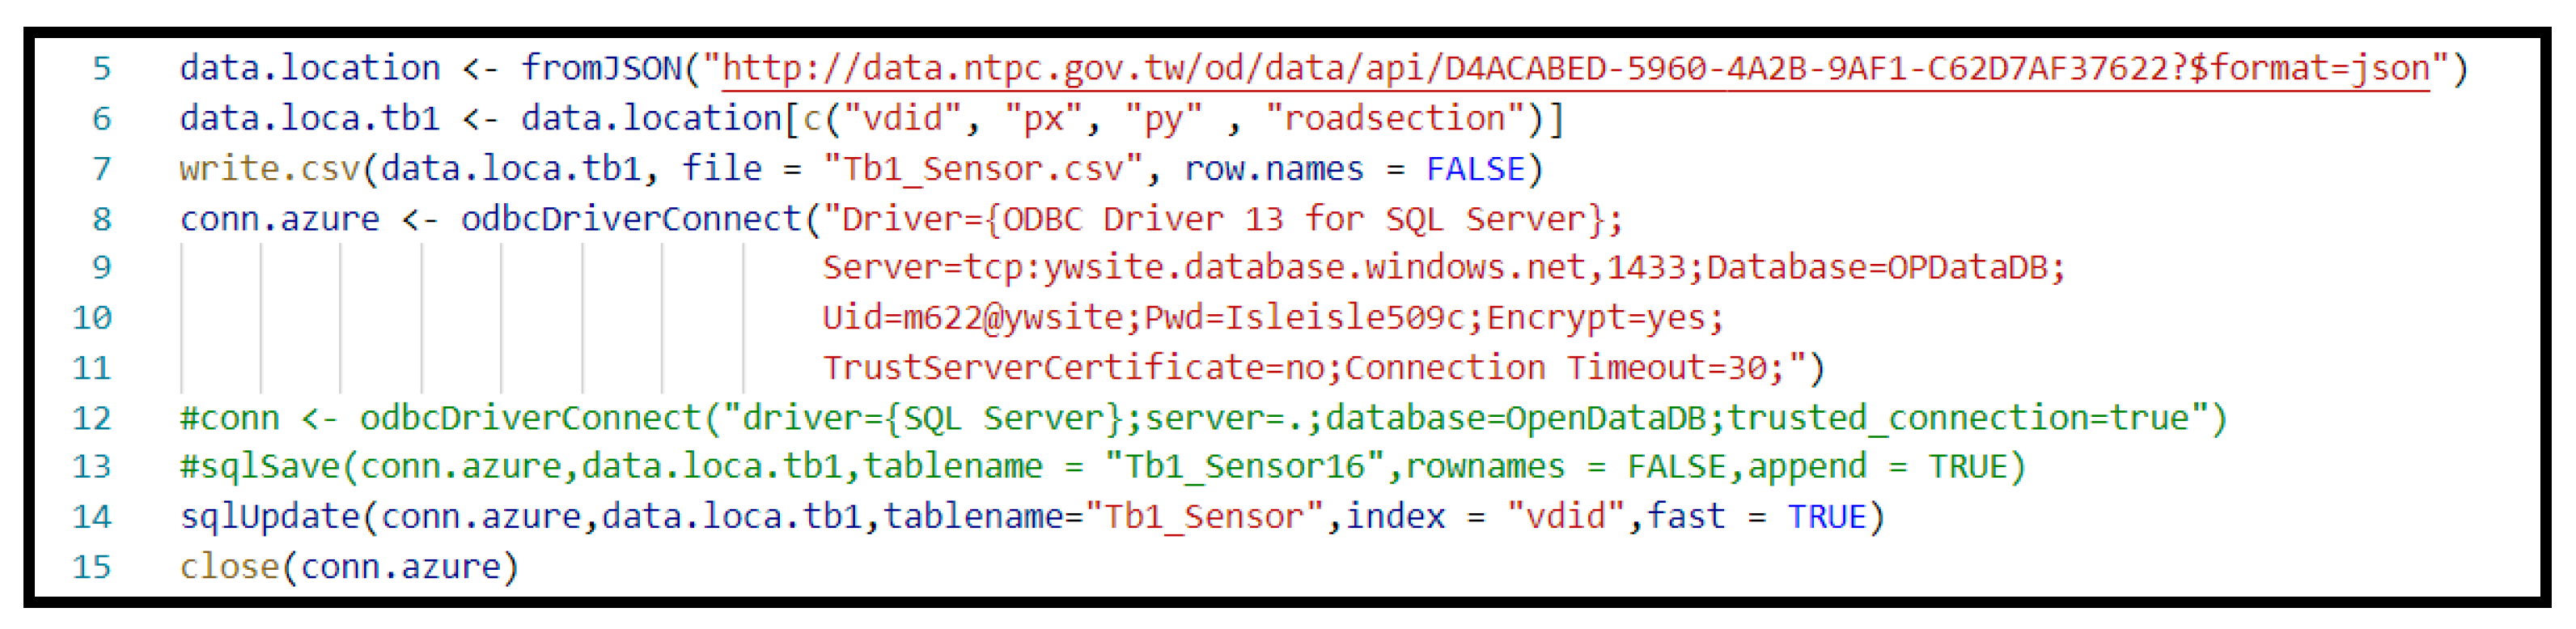
This study only stored the relatively important dynamic vehicle data. Figure 3 shows the traffic data extraction concept, as developed for the proposed LOD subsystem. It is mainly based on road direction (vsrdir) as the water shed, access to a single kind of vehicle (carid), and a single road (vsrid). The corresponding cloud database stores the LOD, based on the principle of low host load and saving database space. Figure 4 shows the open data captured by the subsystem at random time intervals. Based on the error message, meaning that the sensors cannot frequently read the traffic flow that occurs on the open data platform, the subsystem filters and analyzes the data through the program loop of R language, which captures and links the vdid, longitude, and latitude of the vehicle static data of the traffic sensing endpoint. Figure 5 illustrates the linked data content. The LOD are captured by the vehicle static information of the open information platform through R language and stored in the cloud database. Figure 6 shows the fragment program. The API updates data once a day. The web application automatically retrieves the database every five minutes and presents it on the webpage, thus greatly improving the real-time accuracy of the proposed system.
3.3. Establishment of Cloud Server and Corresponding Databases
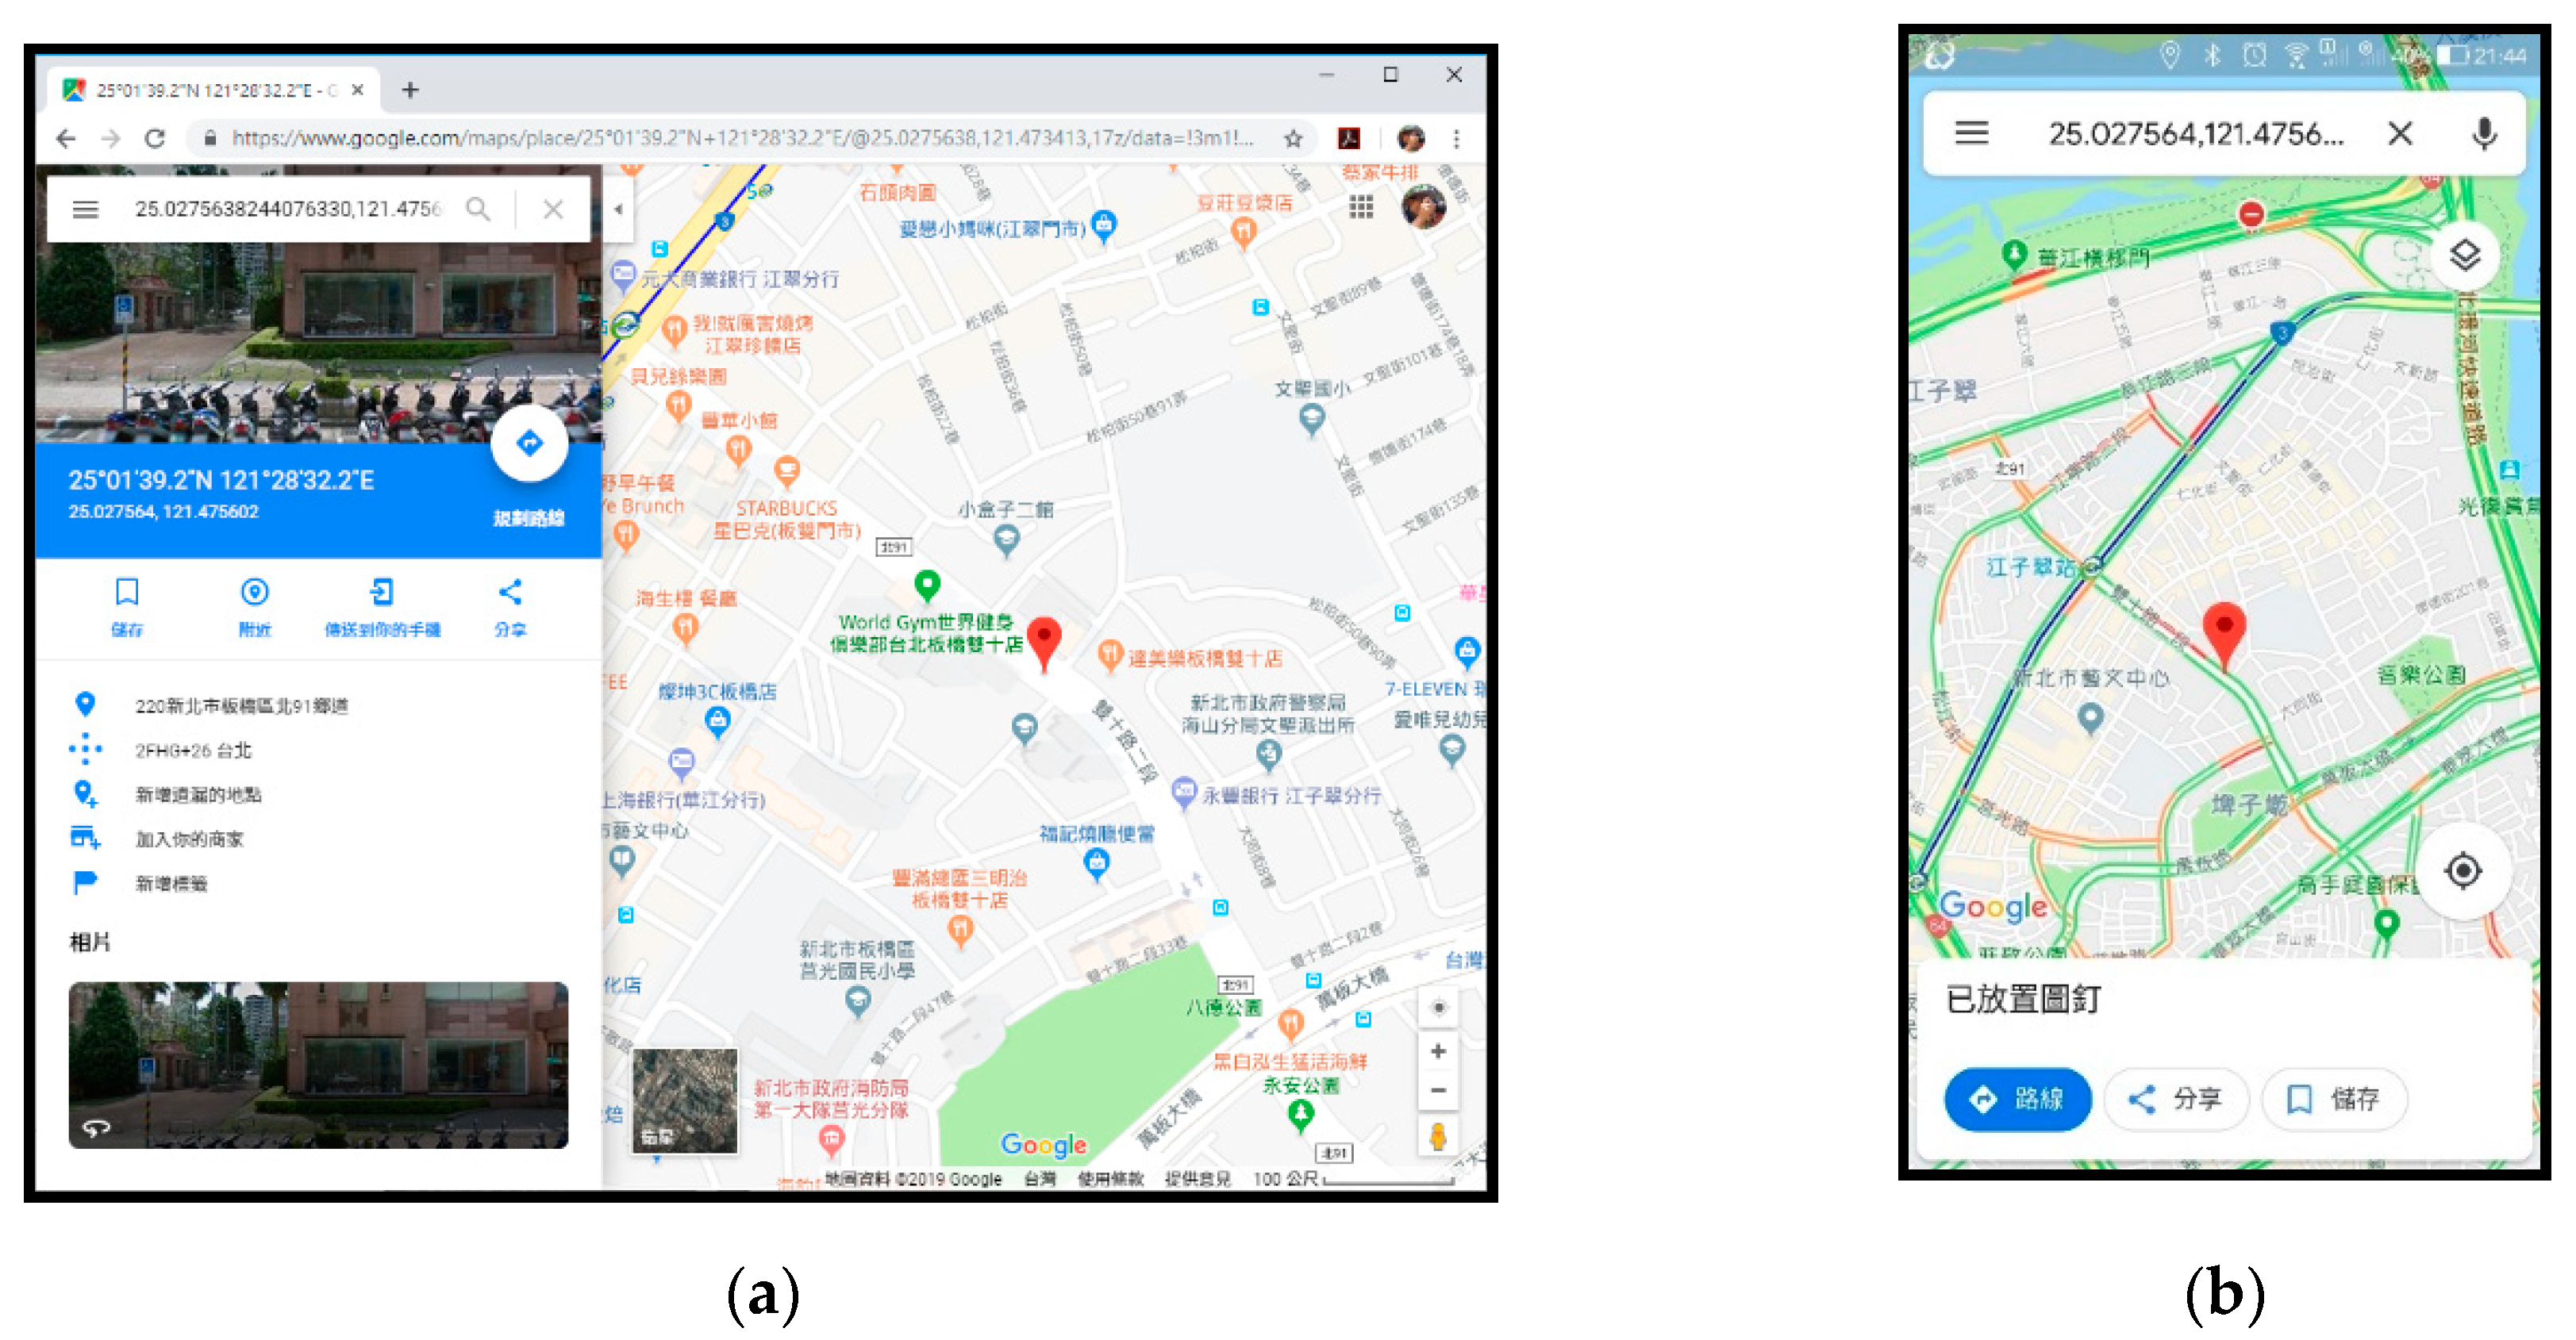
The proposed system uses Microsoft Azure cloud services to set up a web server, as installation in the cloud can reduce the consumption of physical equipment. The system service can be diversified and open, and the website server is not restricted by physical attacks, such as a power failure in the computer room, network interruption, etc. In the case of power failure and network interruption, it can also quickly switch to hosts in other regions through cloud services to continuously maintain the adequacy rate of this cloud system, thus improving the practicability and sustainability of the cloud system. The cloud database stores the data of the New Taipei City Government, including open information, report status information, reporter information, and related information used by the corresponding subsystem, such as web applications and the user road condition reporting subsystem. When the users open the system, the system displays their longitude and latitude, as obtained through the Google Geolocation API on the system webpage, and converts it to the corresponding physical address. When users want to report new road condition information, such as information regarding congestion status, they can log the current situation information through the user road condition reporting subsystem, and other drivers and police units can know the situation and take follow-up actions. The positioning function used in this subsystem adopts HTML 5 to obtain the position longitude and latitude. Table 2 presents the description of the main parameters of GetPosition. However, as a cloud database has the advantage of flexibility, it can select the most suitable service content according to the current requirements, thereby reducing costs. The disadvantage lies in the safety problem; however, as traffic information is not personal data and is part of public information, the information service can be taken as the first priority.
3.4. User Reporting Mechanism on Road Conditions
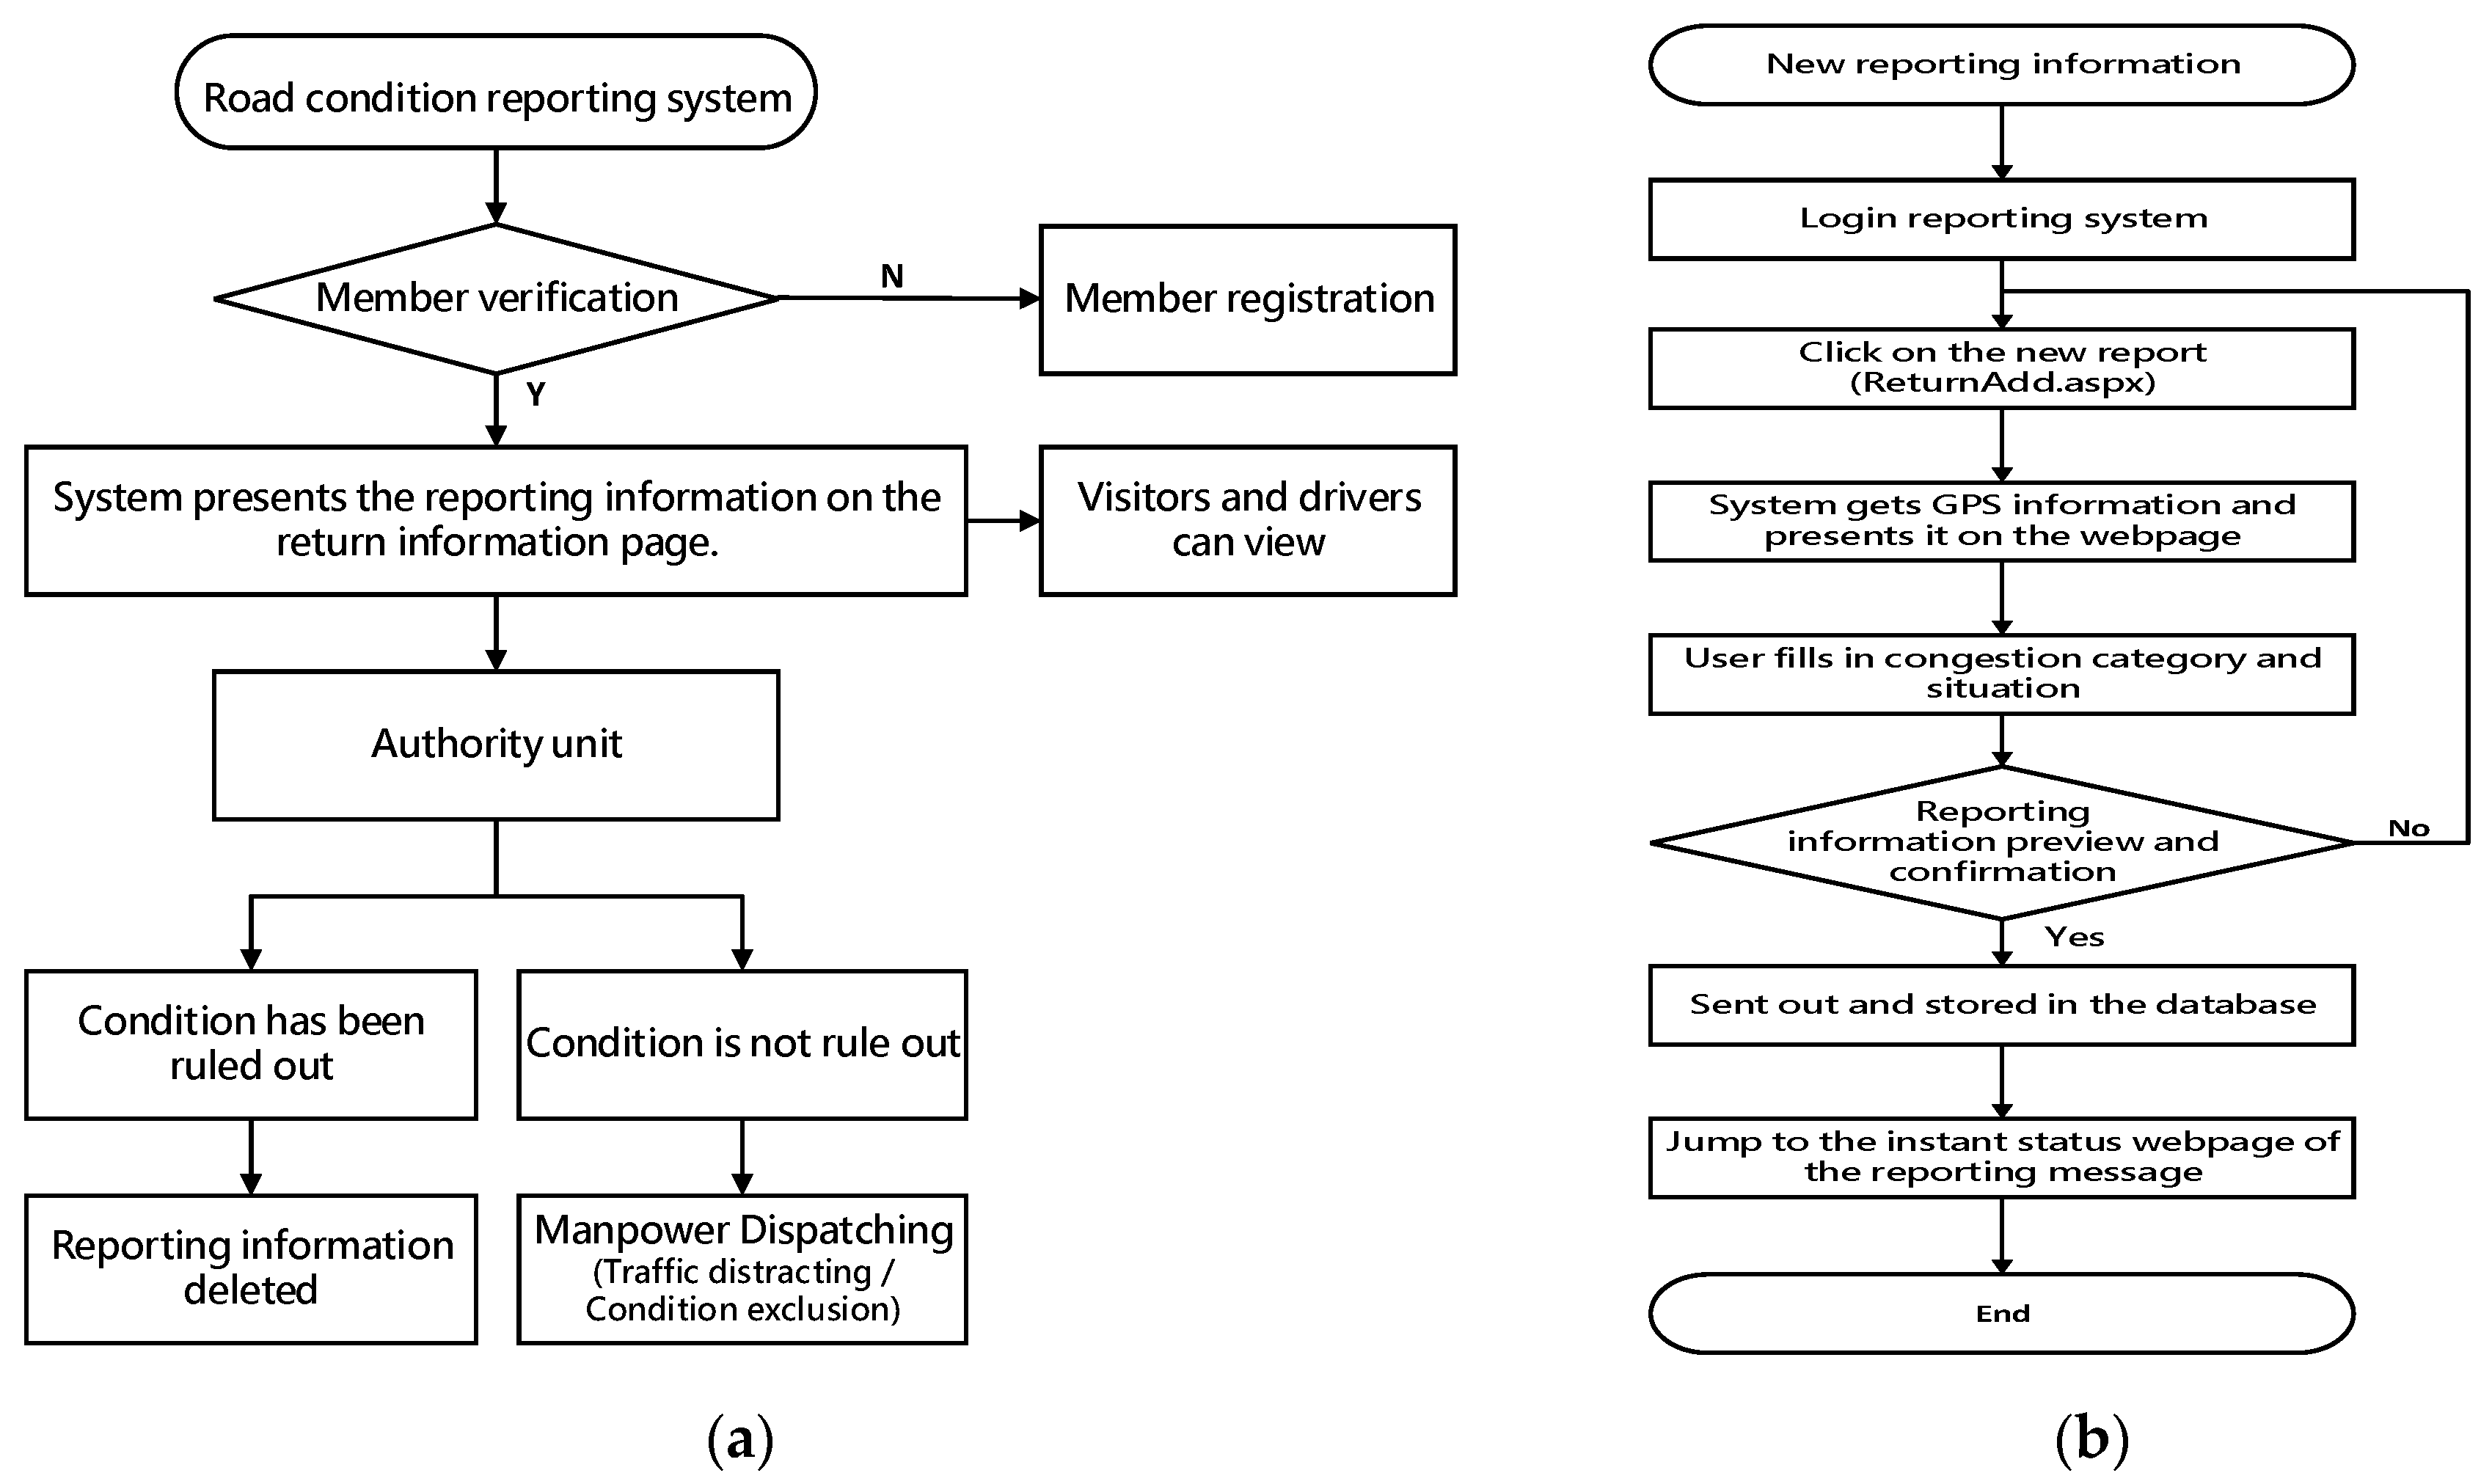
At present, when traffic-related information systems in Taiwan are confronted with traffic emergencies, most people would call the police broadcast hotline, while people on the national highway would call the 1968 traffic voice service line for traffic inquiries, traffic notifications, road rescues, and other services. In addition, some road users often use the Google Maps application to check traffic information. However, neither the system nor the mobile phone application has a real-time information user reporting function for traffic emergencies. The establishment of the road condition user reporting mechanism requires users to enter the member mode in order to check the identity of the reporter and ensure the accuracy of the reported data. This can improve the system’s ability to present the comprehensive real-time traffic data to other road users, and further improve the real-time information deficiency faced by government units in making decisions when considering road condition assessment. Figure 7a shows the operating flow of the road condition user reporting mechanism of the proposed system. First, member registration is required to ensure that the users are road users. As mentioned above, when users encounter road congestion (e.g., accidents, heavy traffic, processions, control, etc.) while driving on a road section and their path is blocked, the users can open the road condition reporting function of the system to add report information (e.g., congestion type and current situation). After completing the corresponding report form, the report form can be sent out and stored in the cloud database of the system. The processing flow of the added report information is shown in Figure 7b. Subsequent responsible units, such as police units and their related responsible units, receive the report information and then dispatch manpower to the location for road condition elimination in a more real-time and accurate manner, thereby solving the problems efficiently.
4. System Presentation and Efficiency Analysis
4.1. System Presentation
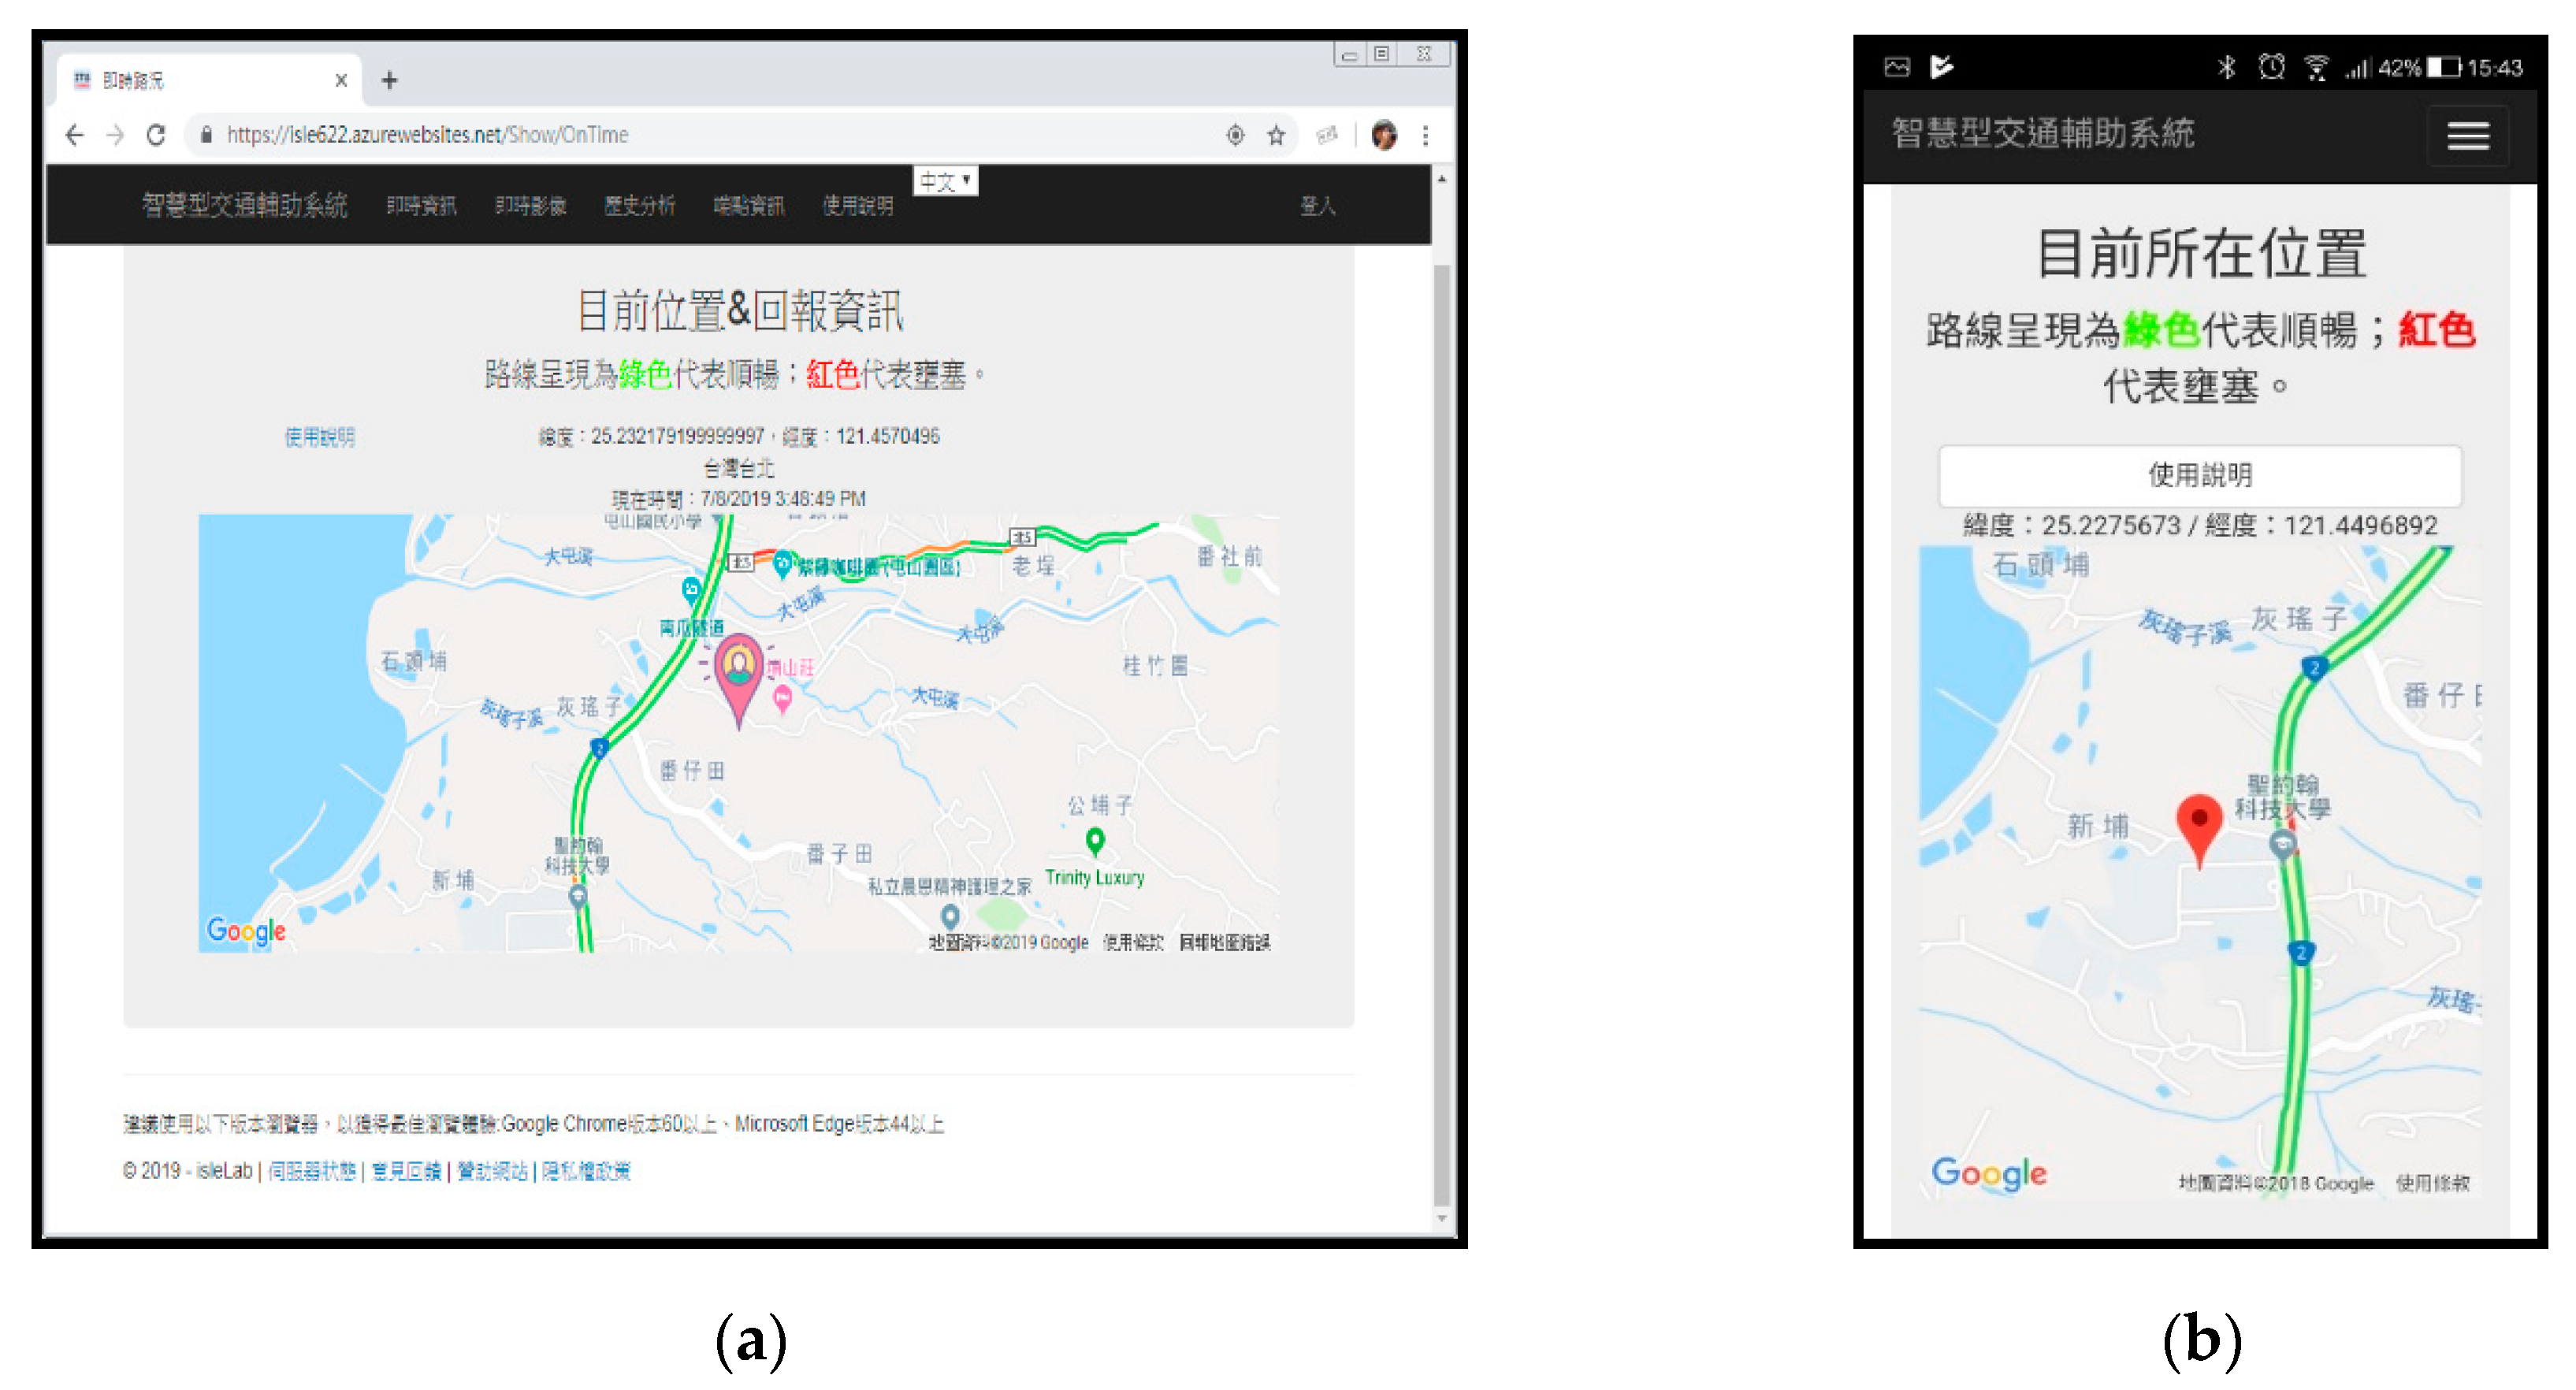
As mentioned above, the proposed system uses intelligent handheld devices and computer devices to present an intelligent traffic assistant agent using GPS and LOD technology with the optimal page size. The real-time display images include real-time information, a real-time image list, endpoint analysis information, and real-time reporting, which are listed and explained as follows. The web application of the agent presents all the operational functions of the proposed system. When the users turn on the system, the system takes the longitude and latitude of the users’ location and presents it on a map through the GPS function of the intelligent handheld device held by the users, and then displays the “real-time status” data, such as the green color indicating smooth conditions and red indicating congested road conditions. Figure 8 shows the system execution screens, as opened by a computer and a handheld device, respectively.
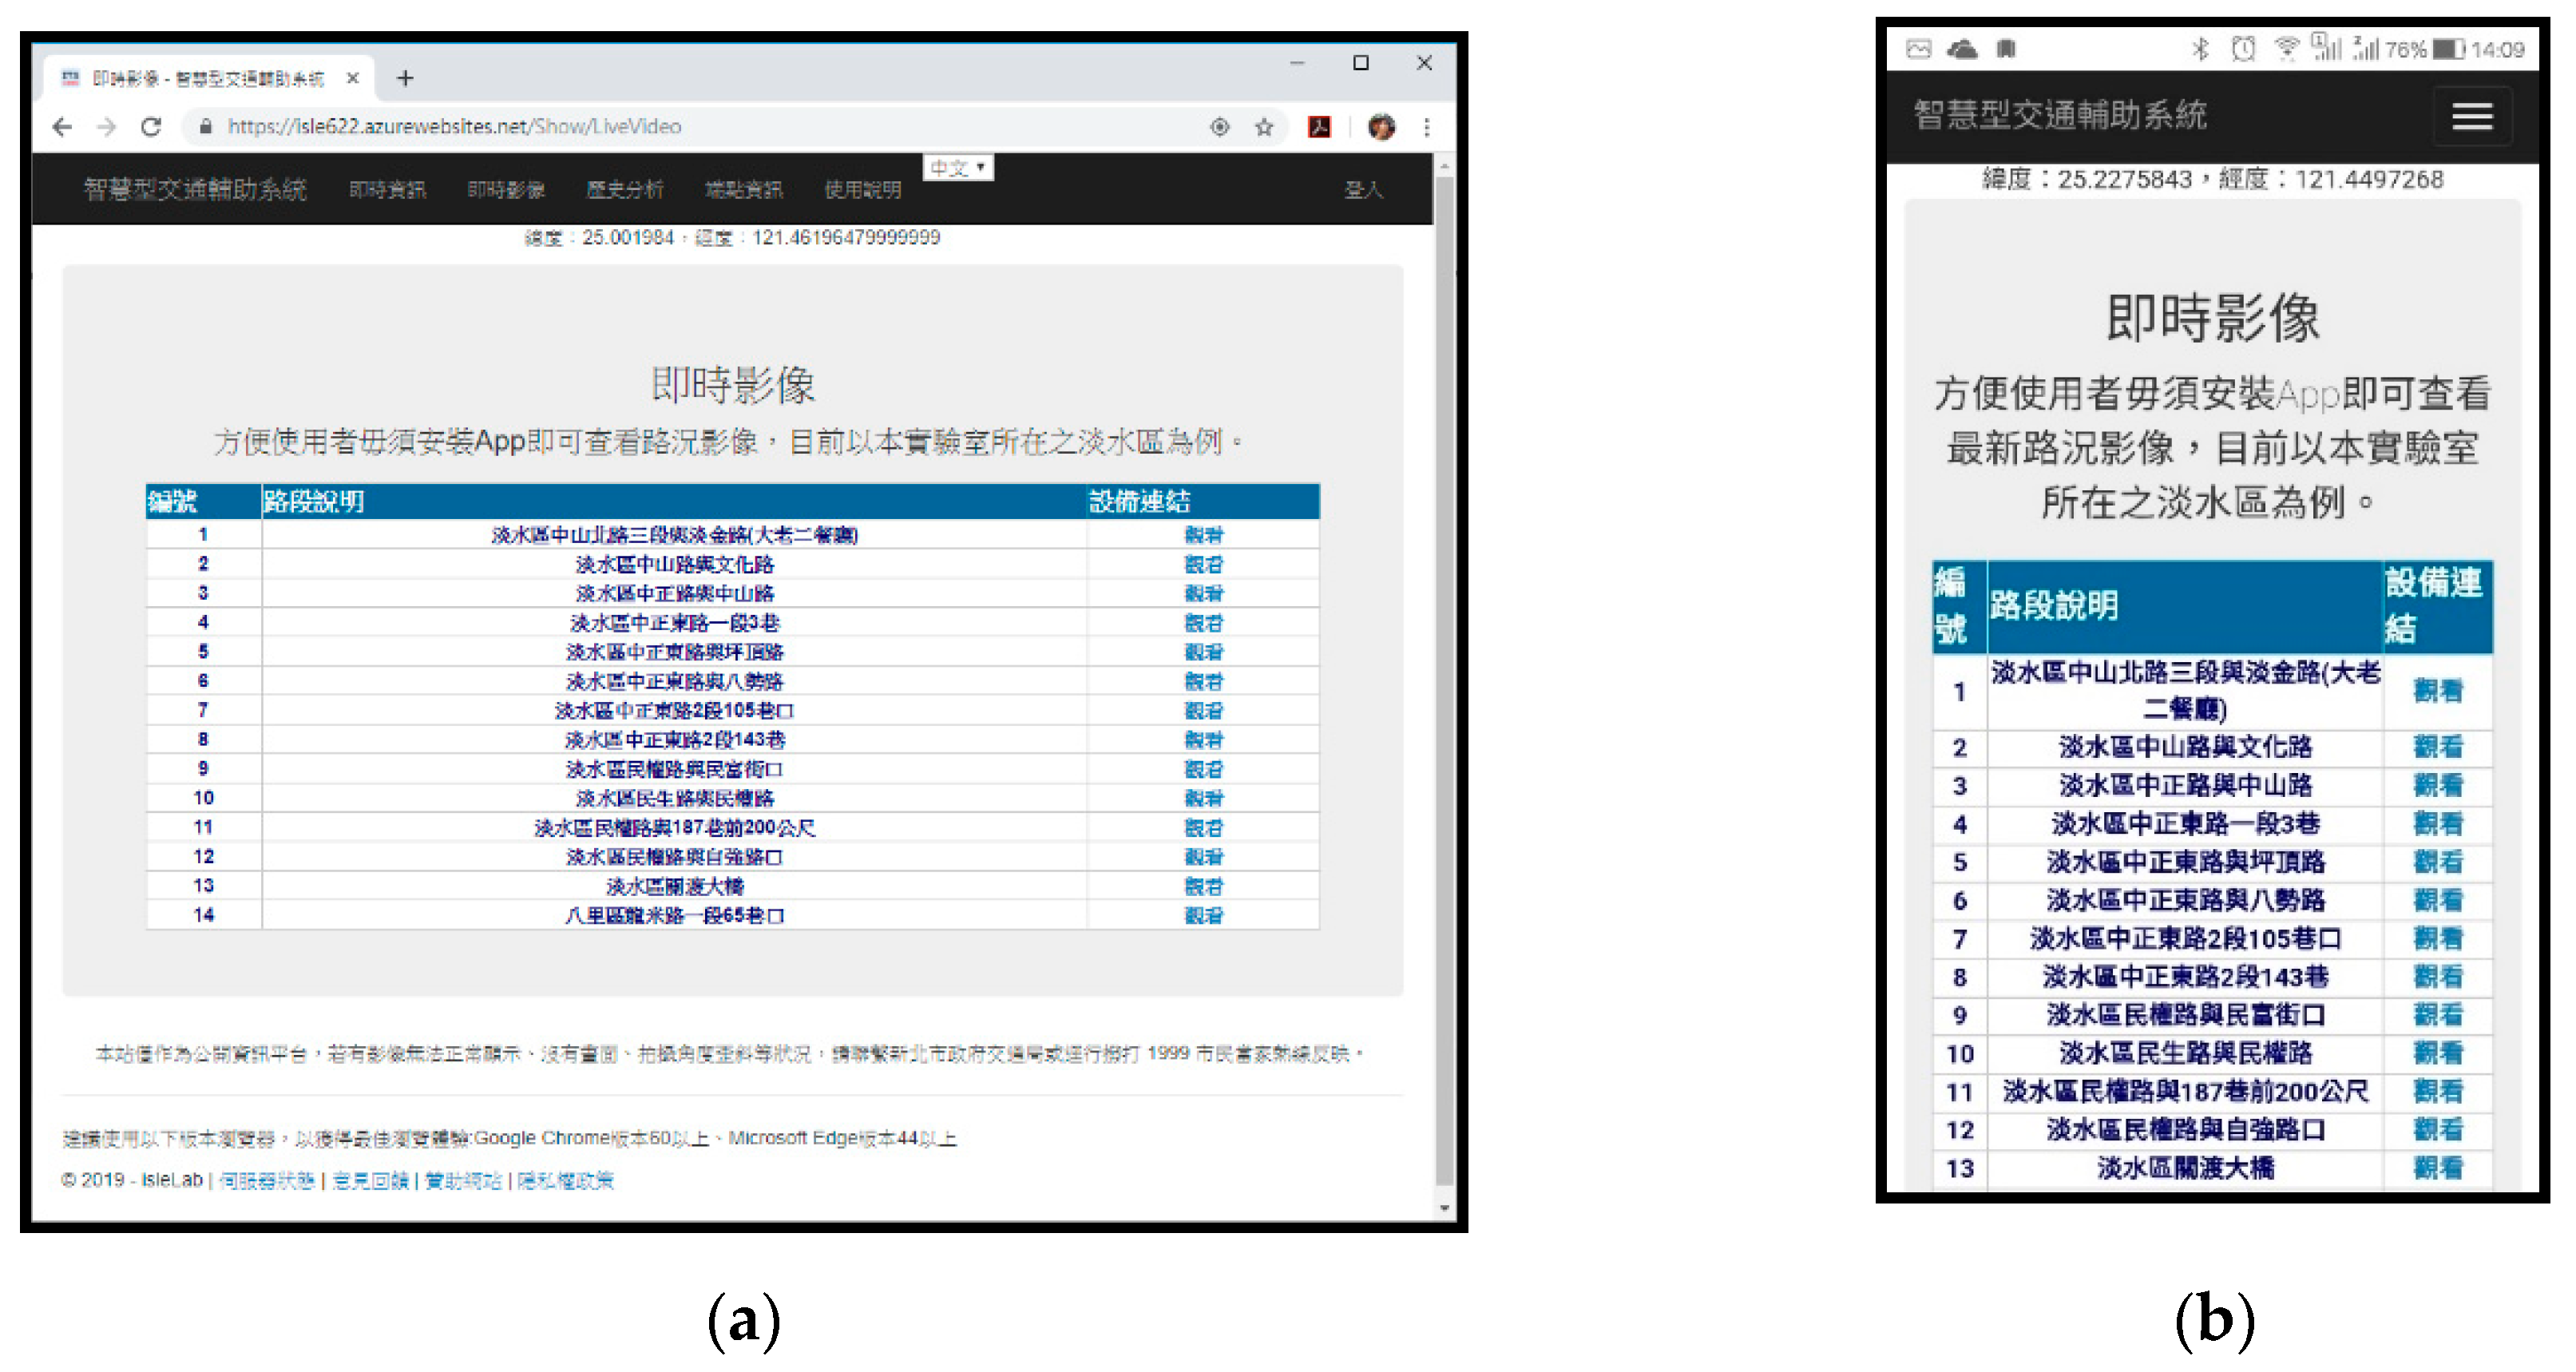
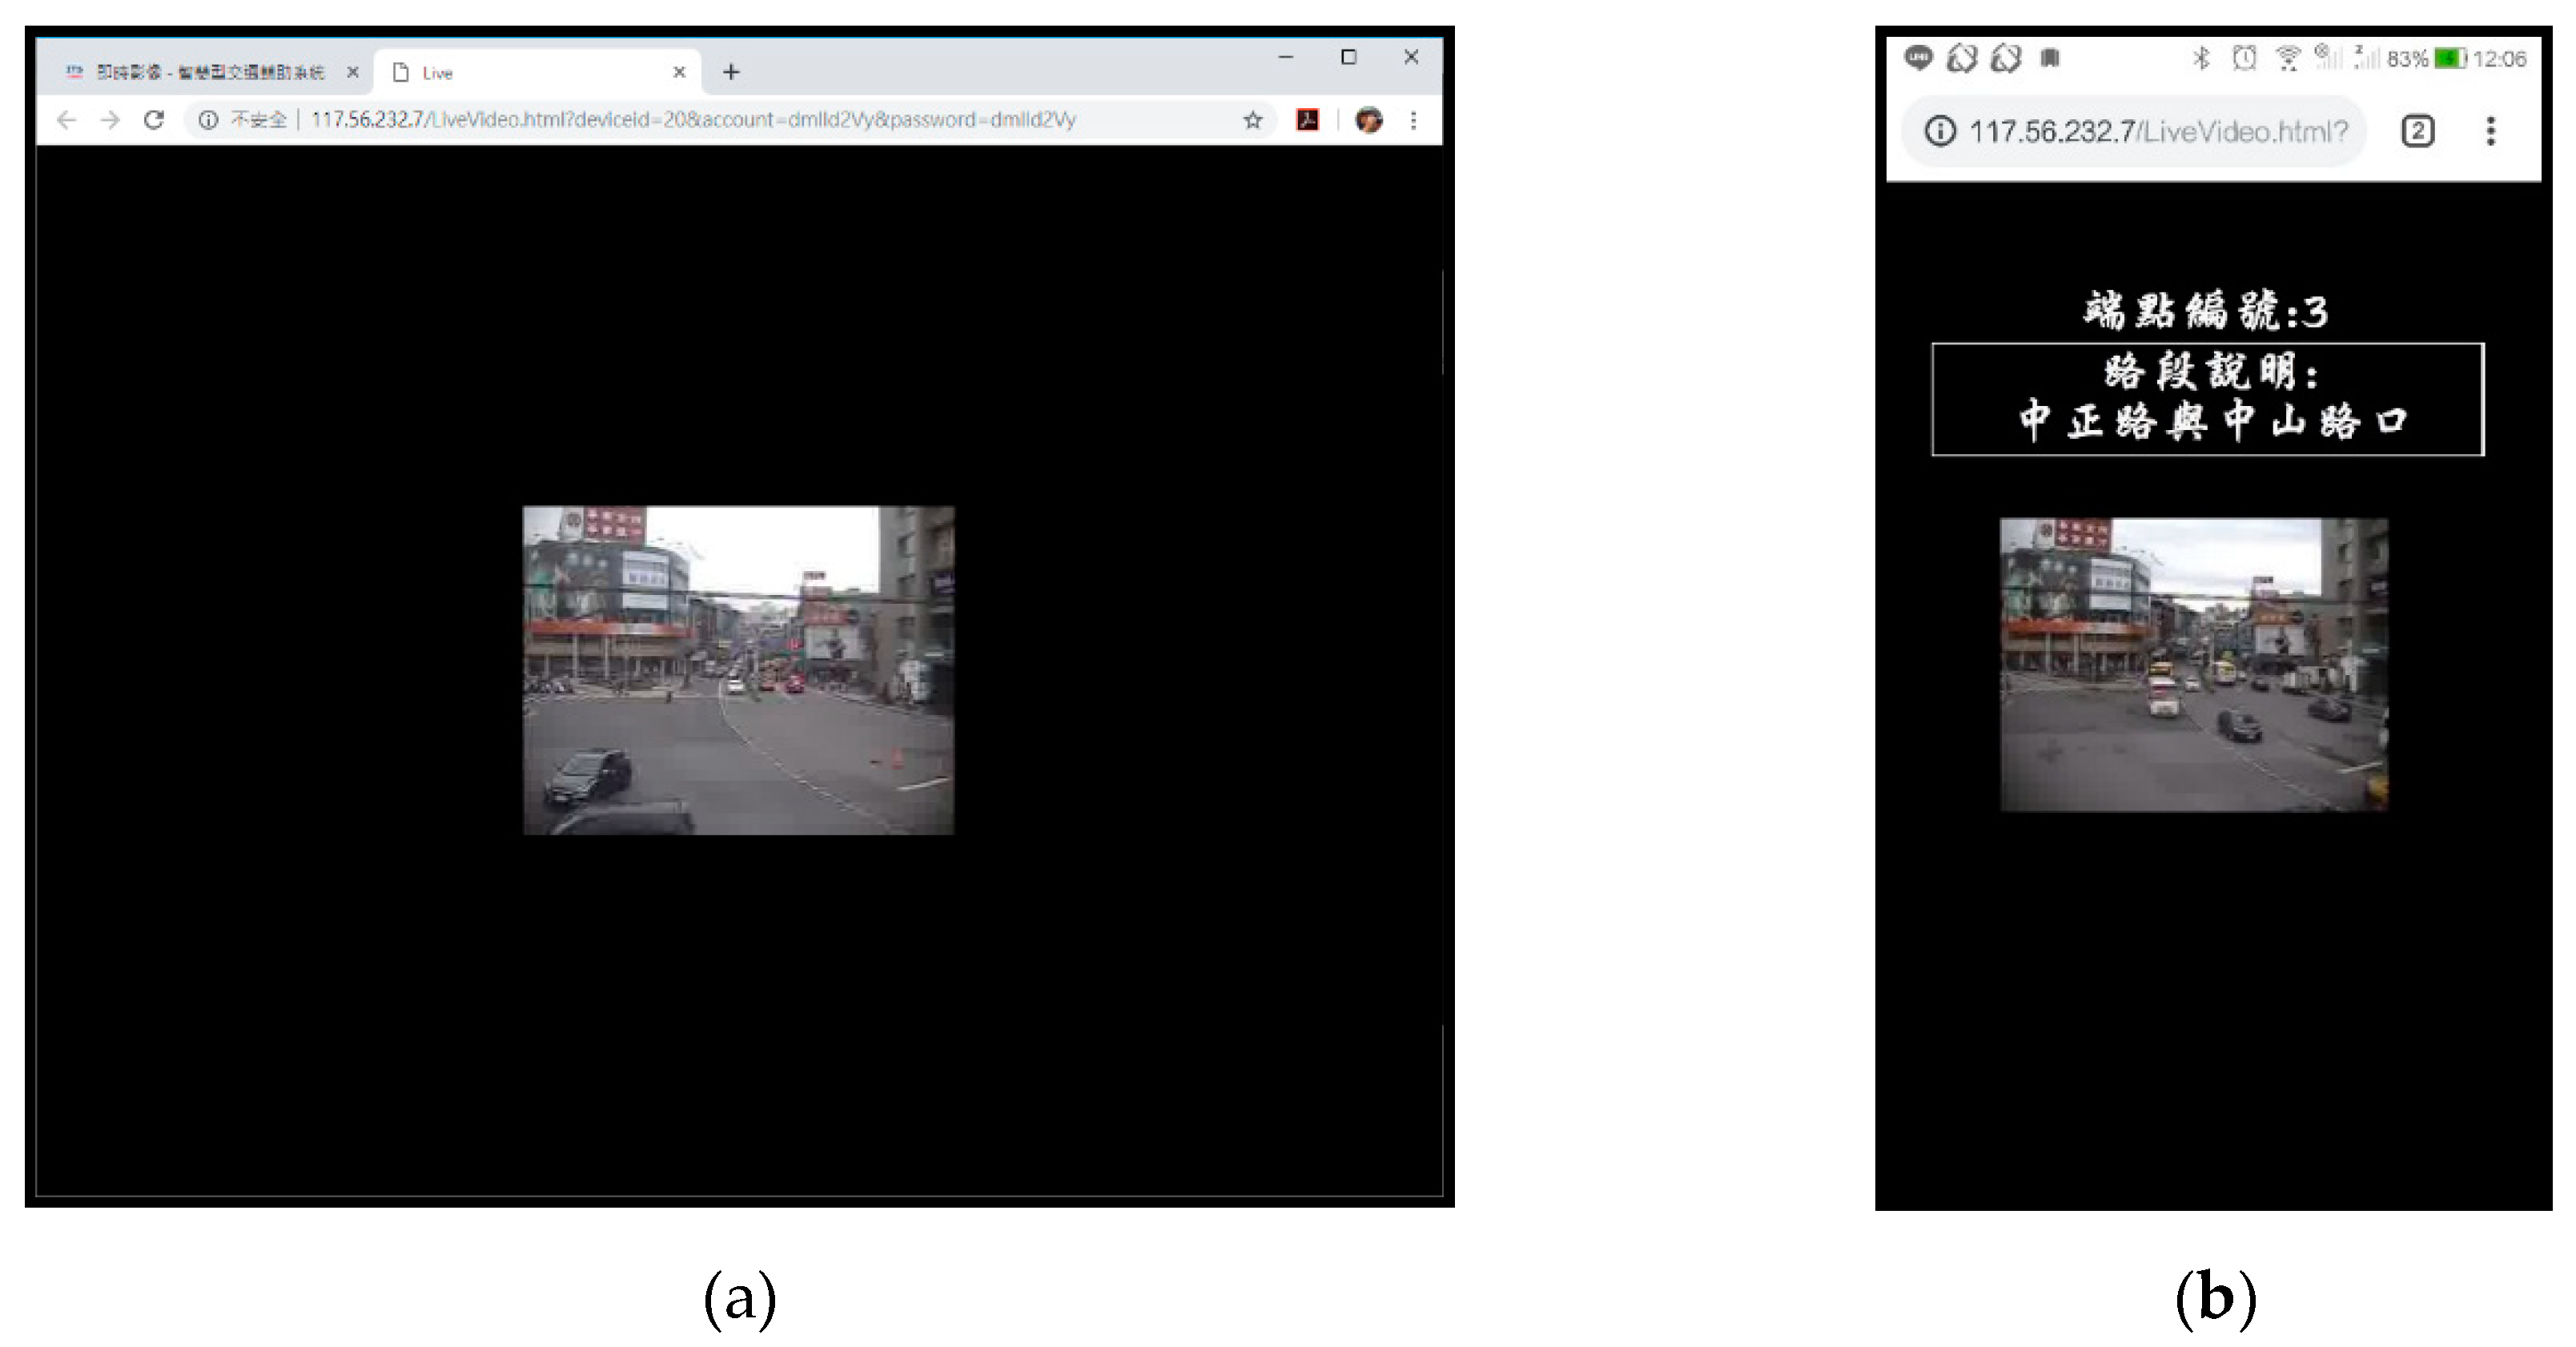
Regarding the traffic “real-time image” function, the proposed system combines many supported Google Chrome browsers and Apple Safari browsers and matches RWD web page technology for seamless connection to achieve a cross-platform and diversified traffic assistant agency system. When the users open this system, the system uses the GPS function of the intelligent handheld device held by the user, which reads the users’ location and displays the nearby monitor screen, and then verifies the road section. Figure 9 shows the execution screens of a computer and a handheld device, respectively; users can click the “view” hyperlink to display the real-time image of the endpoint; users can also click endpoint number 3 to show the real-time image of Zhongzheng Road and Zhongshan Road. The computer and handheld device displays are shown in Figure 10 (capture time: 7 April 2019).
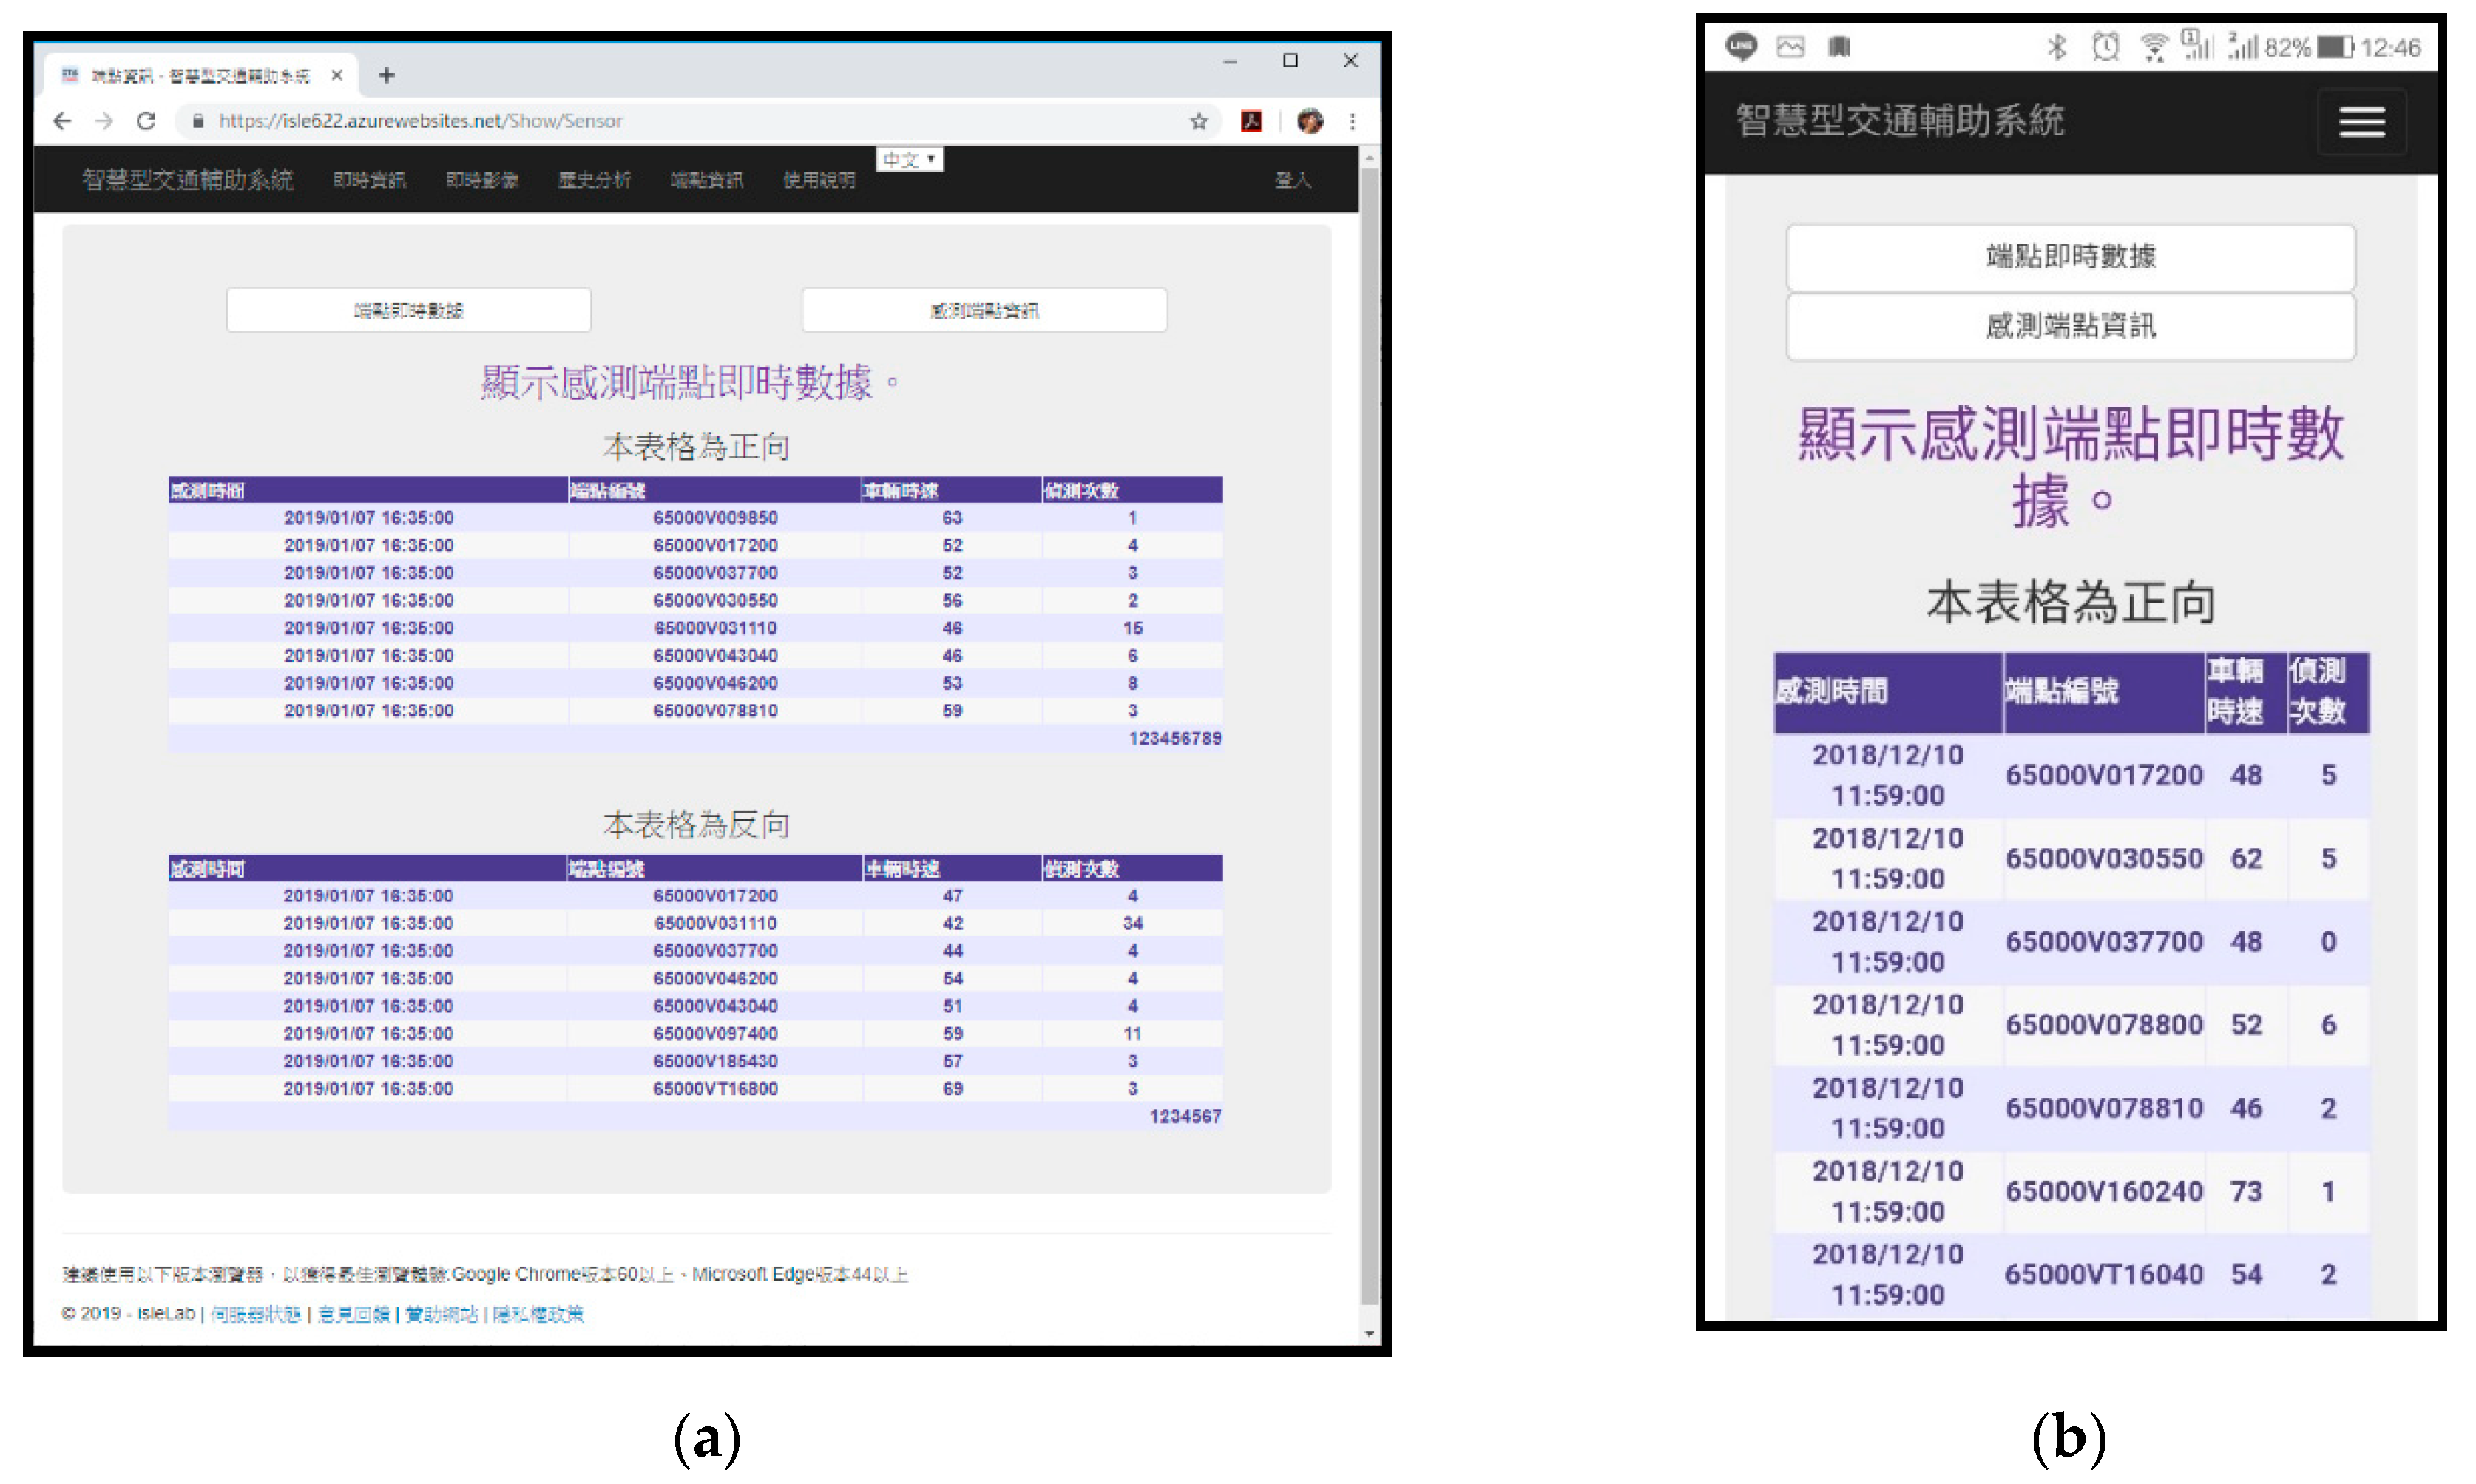
As mentioned above, the “endpoint information” of this system is extracted from the dynamic vehicle information of the New Taipei City open data platform as the real-time data of the sensing endpoint. Due to the poor contact of the reported data of some sensing endpoints, the inability to sense data, and other reasons, the data is incomplete. In this study, JSON is retrieved through R language and the data content required for screening is automatically retrieved and stored in the cloud database, which is then presented through the traffic assistance agent web application. Users can use the intelligent handheld devices to view the most real-time endpoint road condition information (including speed and vehicle detection). Figure 11 shows the execution screens of a computer and handheld device, respectively.
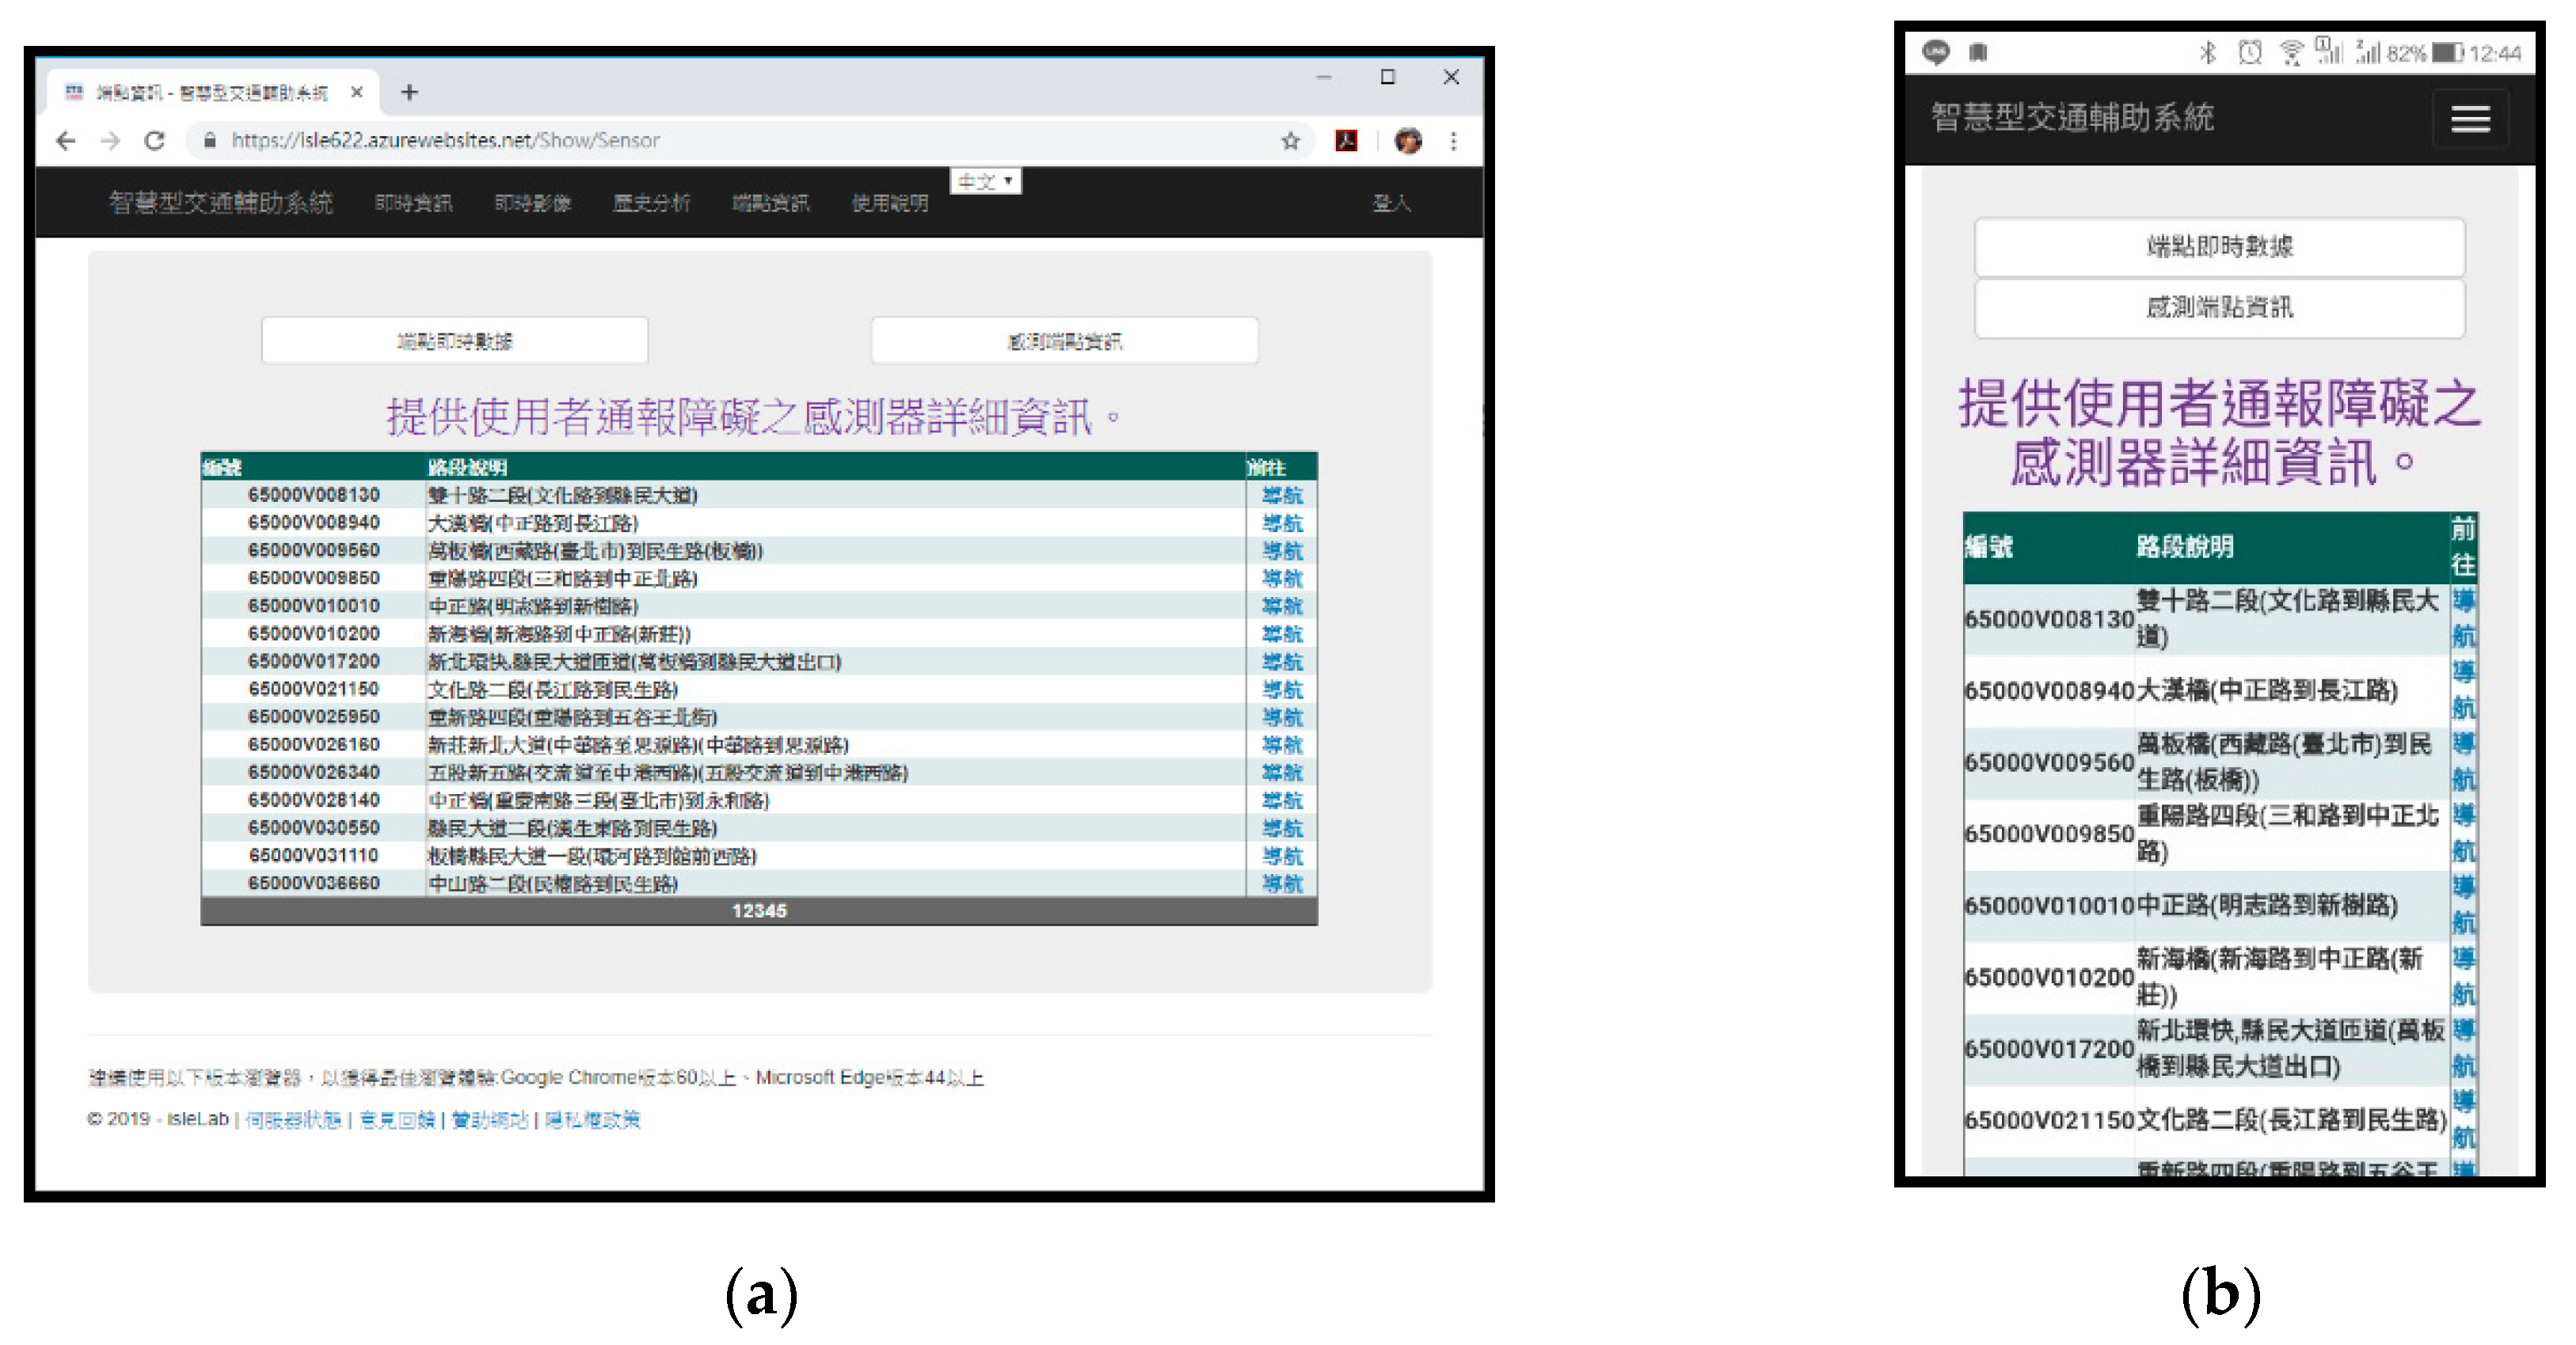
Based on the above, as sensing endpoints often fail to sense data and report error messages, the proposed system uses the longitude and latitude positions of the endpoints of the vehicles not in motion and the vdid of the sensing endpoints on the New Taipei City open data platform. The obtained data are filtered through R language, and the data of each sensing endpoint is updated in the system’s cloud database. If there are additional sensors, the system stores them in the cloud database. The users can view the “sensing endpoint information” of each sensed endpoint through the system, so that government information can be openly and transparently displayed. At that time, the users or government work units can use a smart handheld device to view and attend to the endpoint to carry out relevant work services, such as inspection and repair. Figure 12 shows the execution screen of the system opened by a computer and a handheld device, respectively. Users click the “navigation” hyperlink to open the icon of the Google Maps display endpoint. Taking endpoint number 65000V008130 as an example, the displays of the computer and handheld devices are shown in Figure 13.
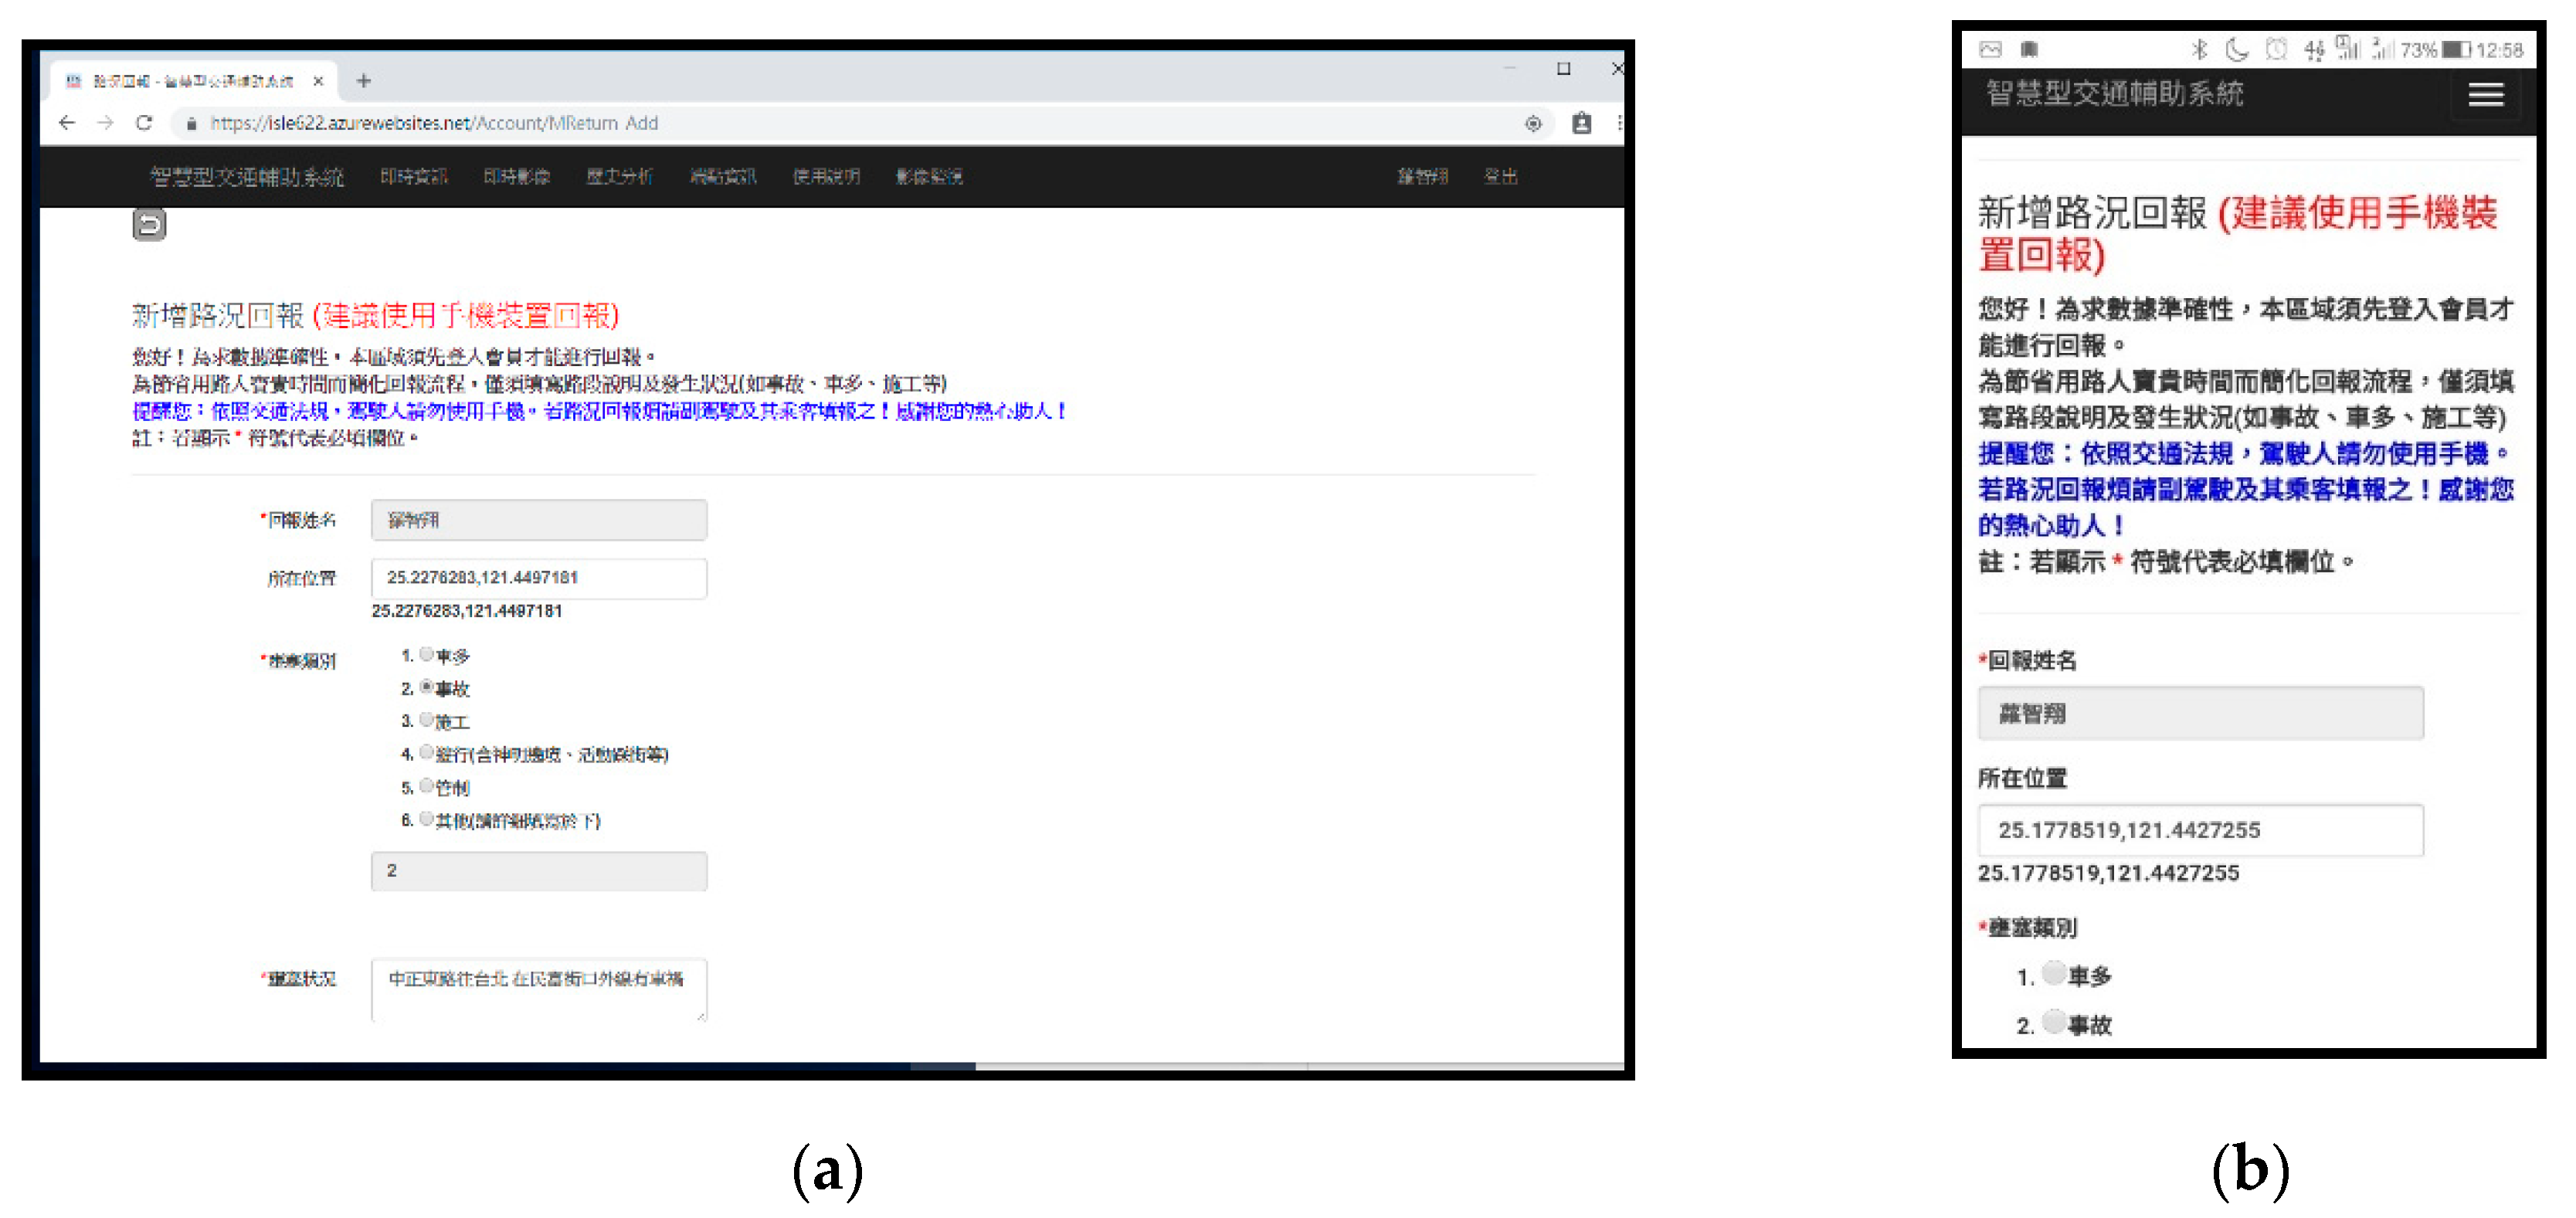
Regarding the “road condition reporting function”, after logging into the system, when users arrive at an accident emergency site, their intelligent handheld device can read the longitude and latitude of their location through the built-in GPS function and present it in real time on the reporting page. If the users click on the relevant information (e.g., category, event, date, and time) of the emergency site, the system will immediately store it in the cloud database, and road users behind them can see the information. The police and public works units can arrive at the site promptly to eliminate the reported traffic condition, thus shortening the congestion time of the traffic section. Figure 14 shows the execution screens opened for a computer and a mobile phone, respectively, to complete the “add road condition reporting information”.
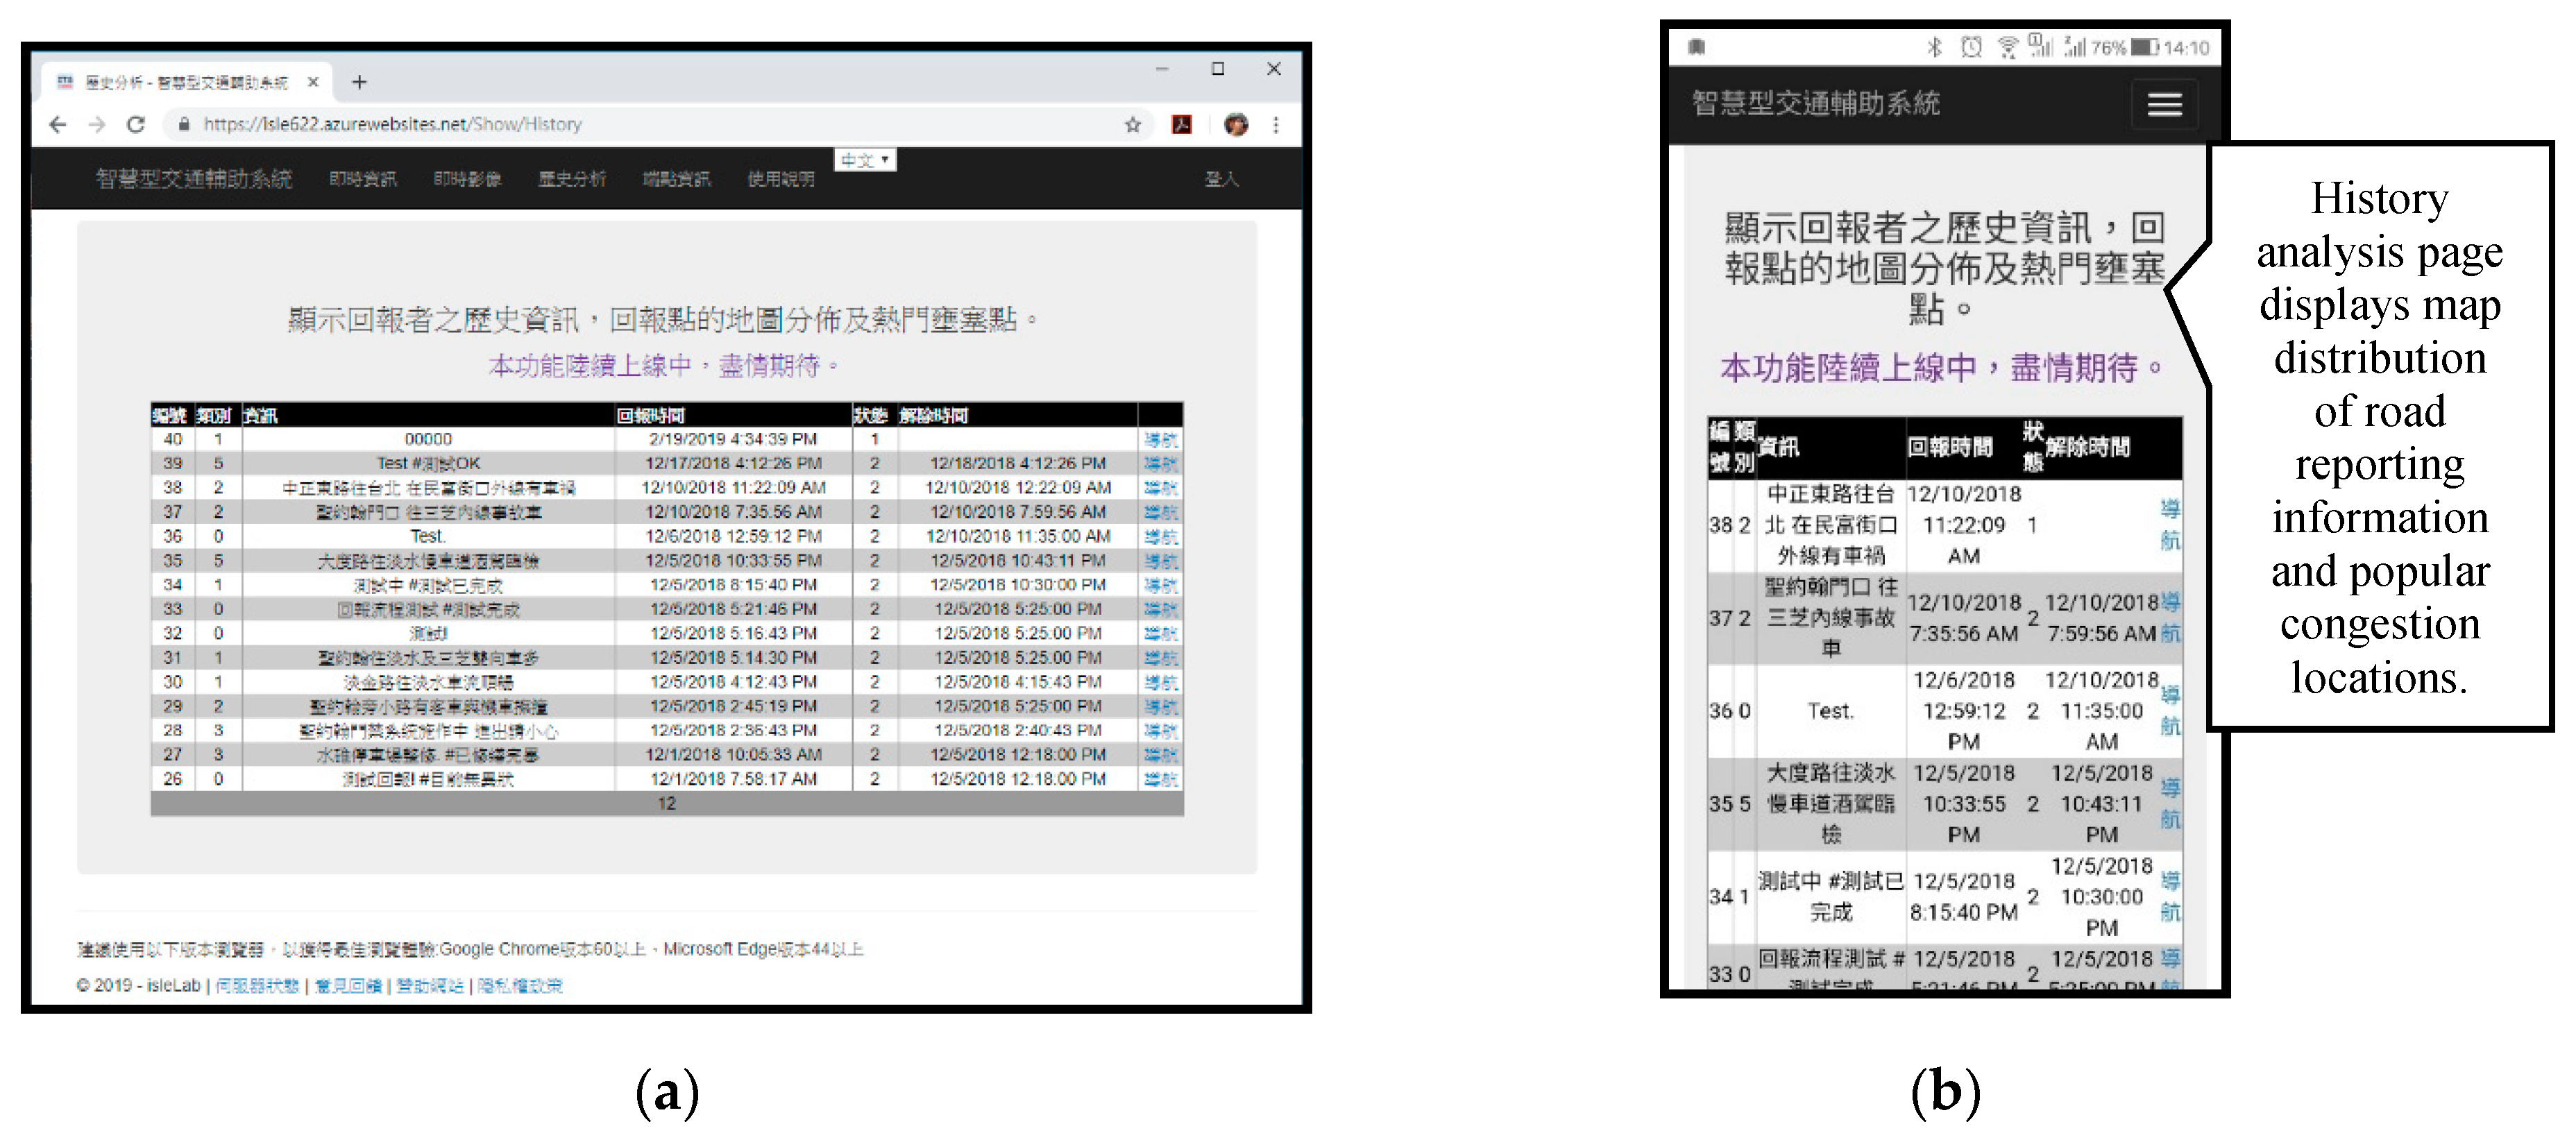
After being verified as a member and completing the “add road condition reporting information”, the “history analysis” page of the system obtains that reporting information through the cloud database, as shown in Figure 15; that is, clicking on the navigation function of the page will open the icon of the Google Maps display endpoint.
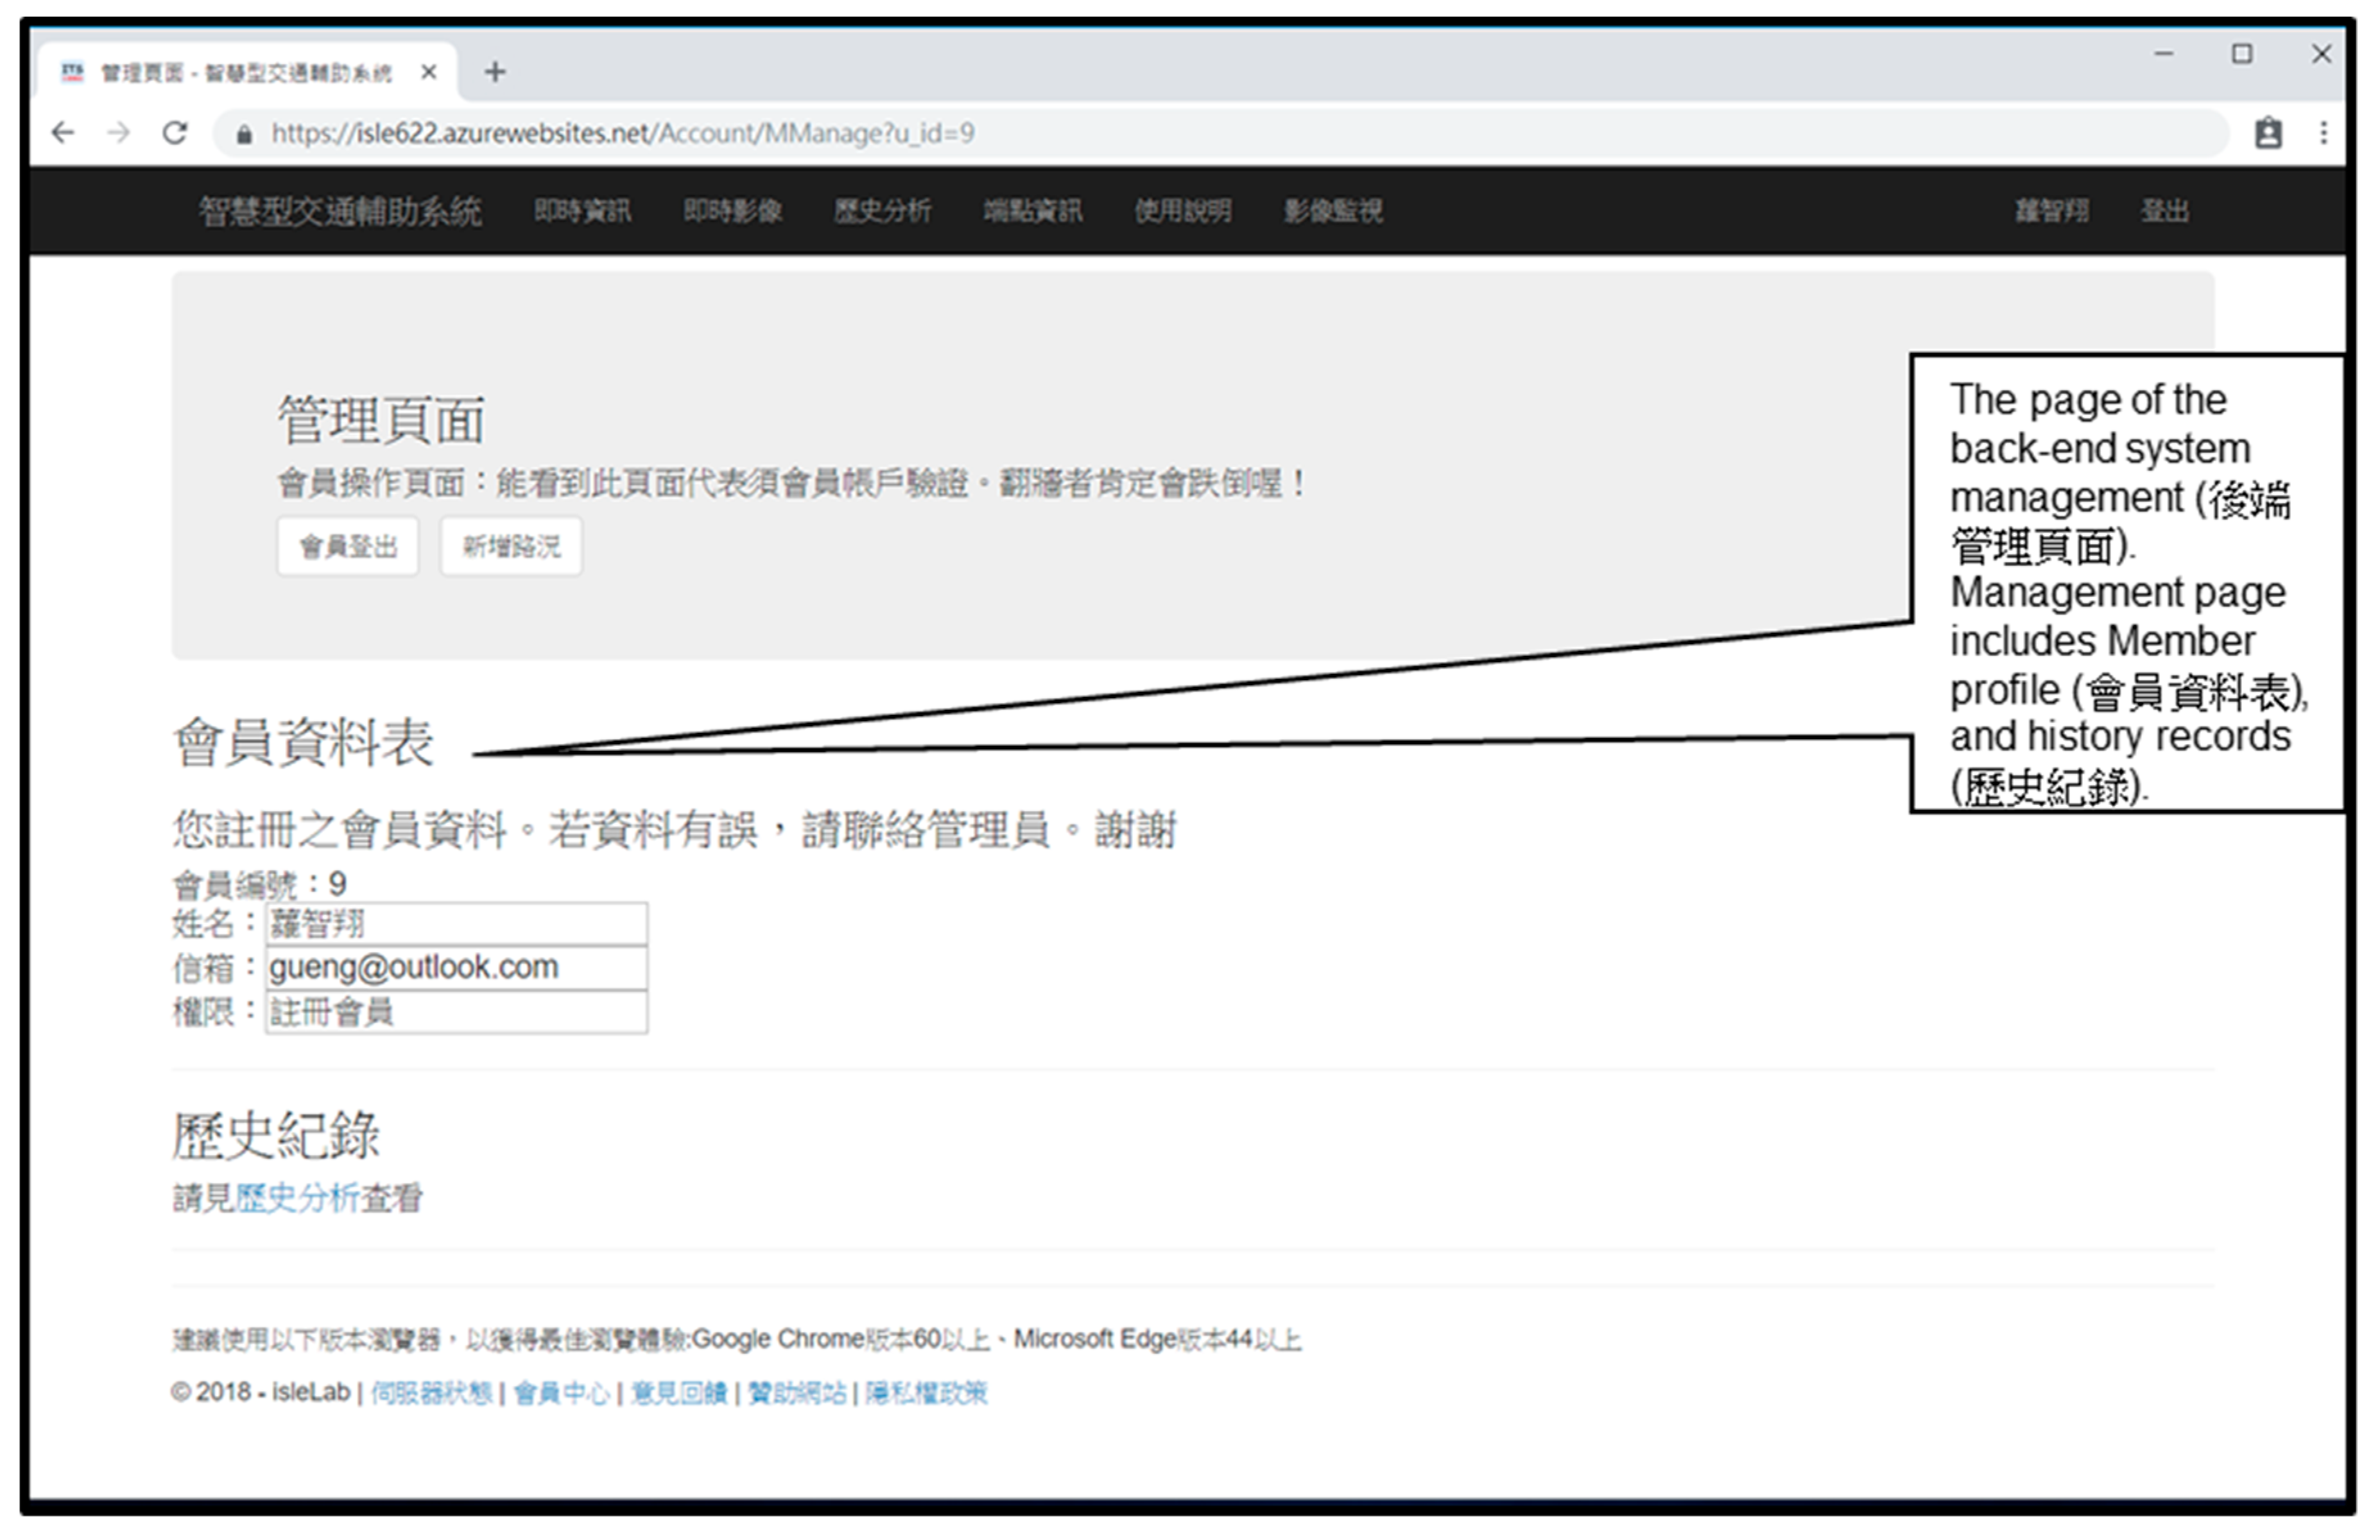
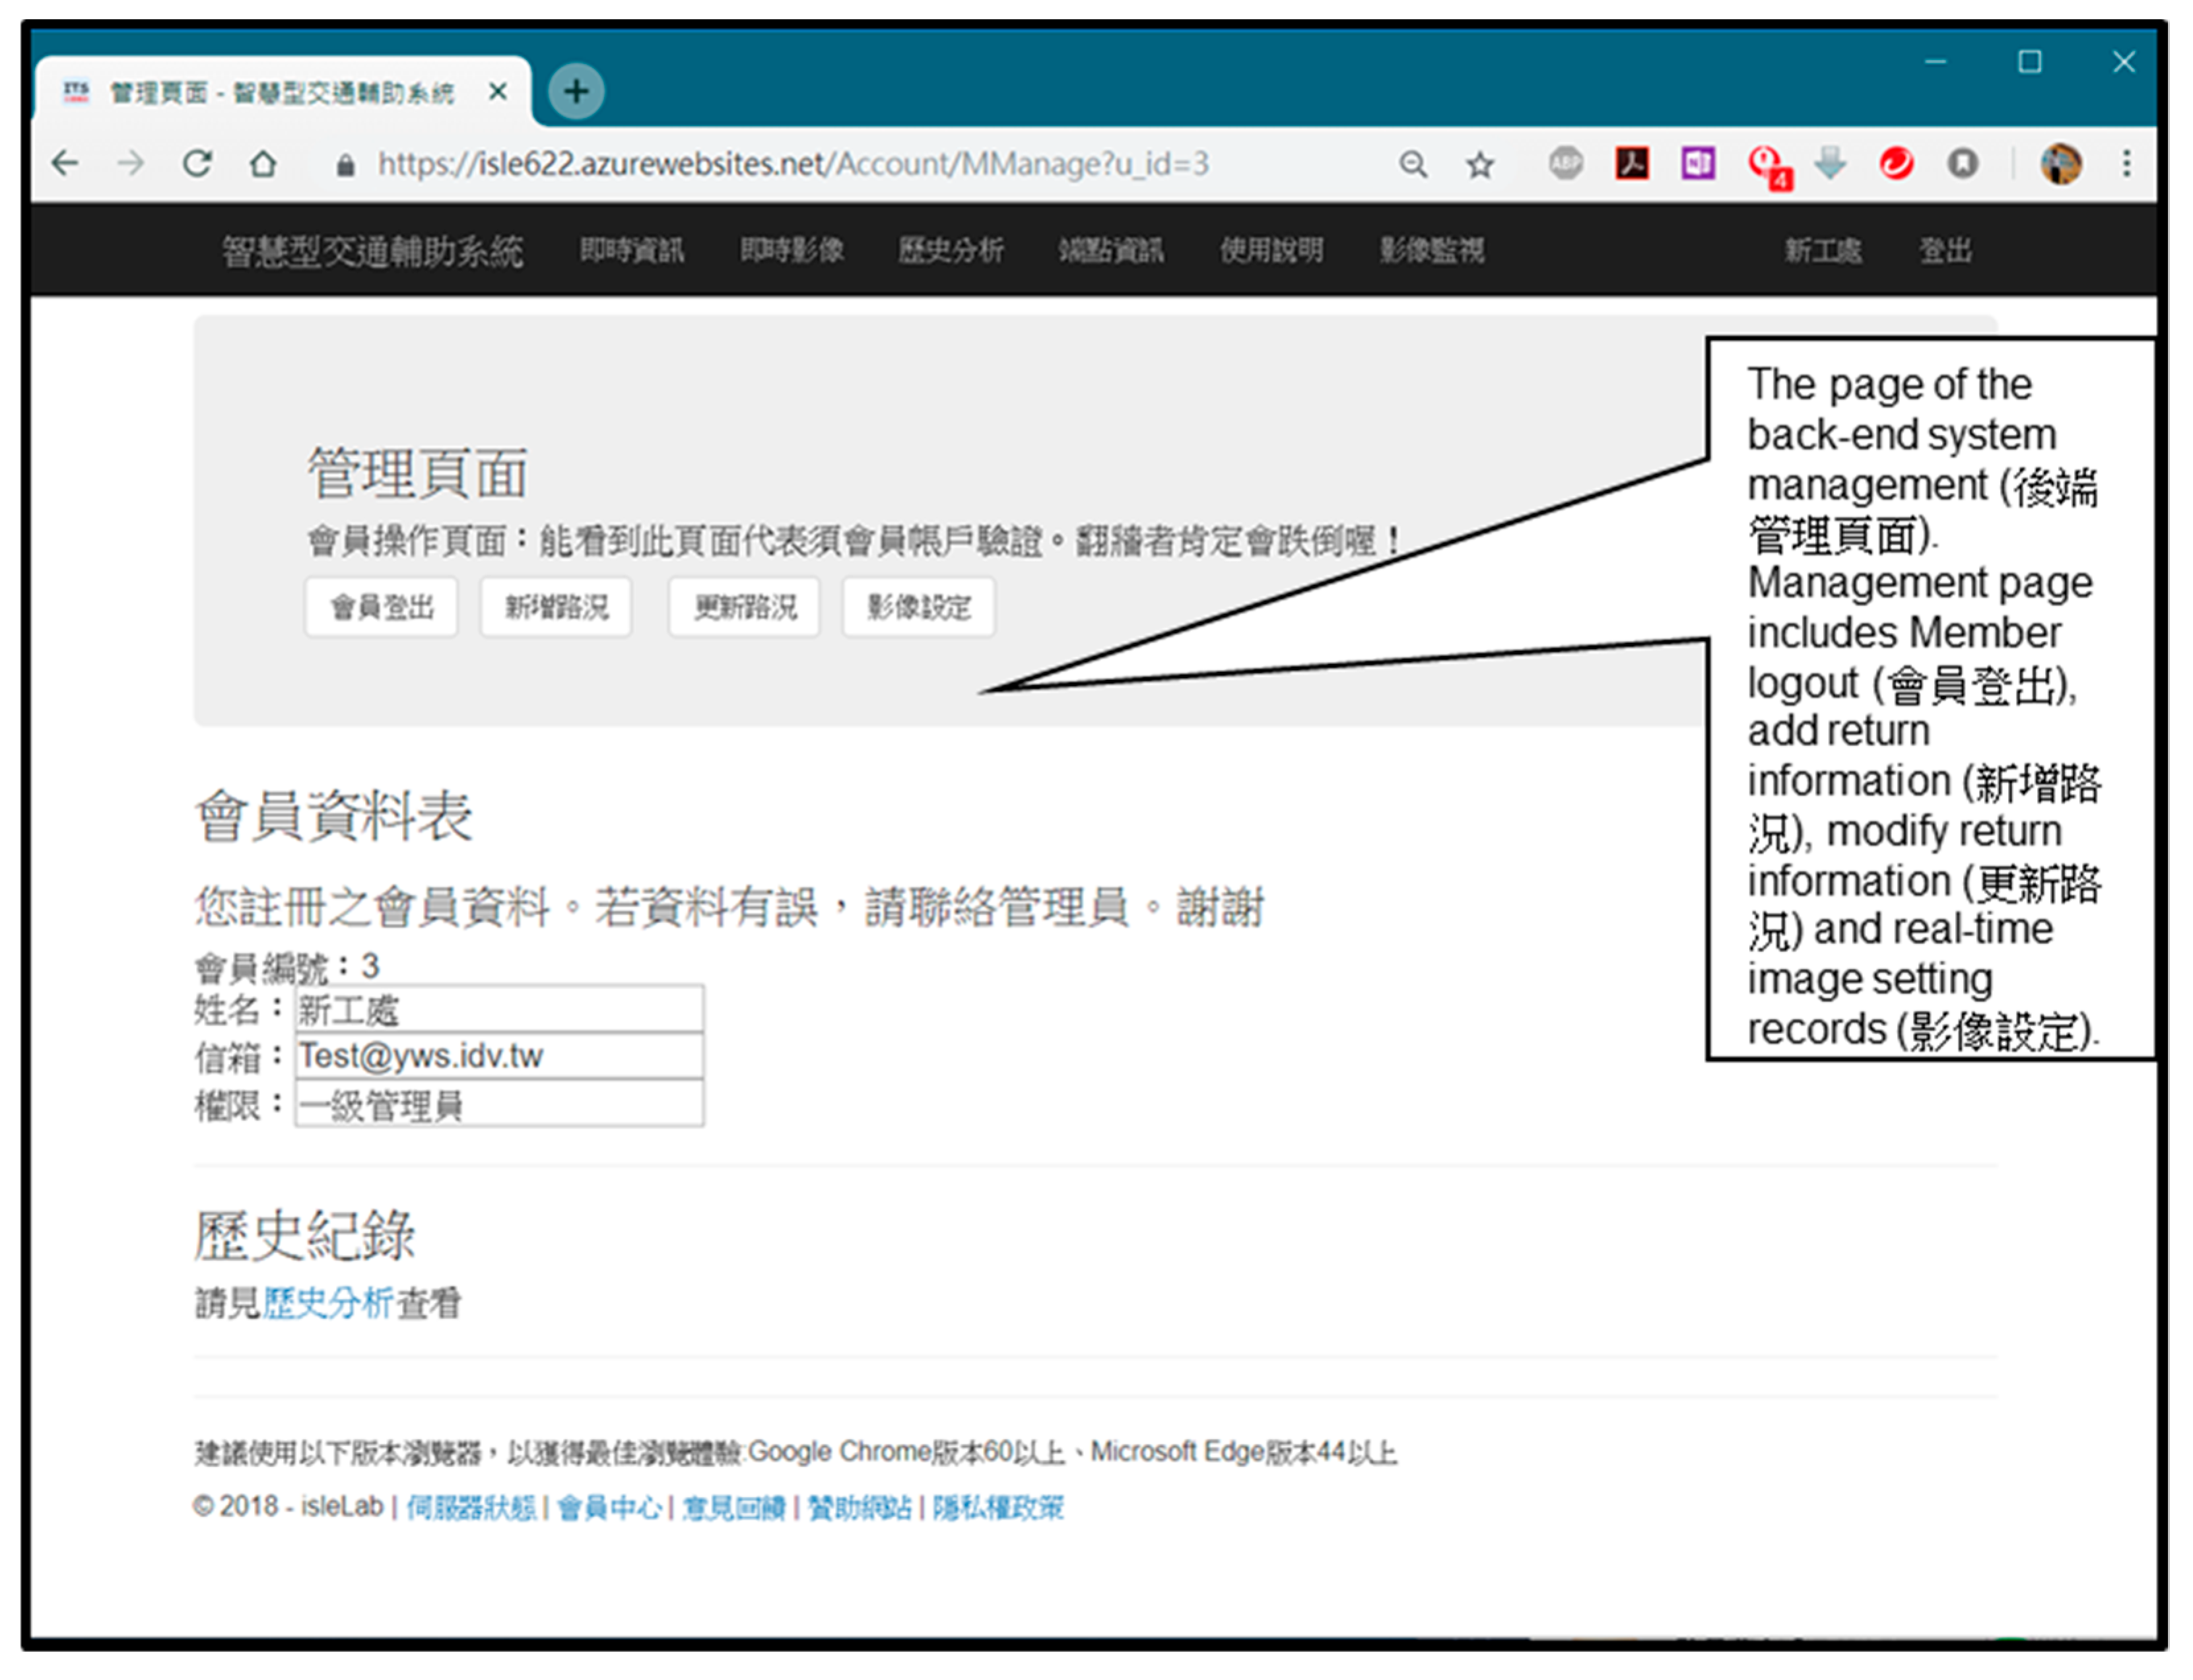
The proposed system establishes a back-end management system for user reporting information, which is mainly responsible for management, such as report information resolution, member management, real-time image settings, etc. The identities of users are visitors, registered members, and administrators. The hierarchical information of relevant identities is detailed in Table 3. Visitors only have the function of viewing information, and cannot use any of the reporting functions. Registered members can enter the member area to add new reporting information. Administrators can enter the management area, browse and modify all member data, and delete members. Figure 16 shows the page of the back-end system management.
The reason for the hierarchical management of the system’s modification of report information is that different authorities and responsible units (e.g., police units, public works units, etc.) have slightly different authority. For example, the real-time image setting is within the jurisdiction of police units. Table 4 and Figure 17 present the hierarchical authority table of power and the responsible units, the page of power, and responsible unit management area in the system. In addition, the public works unit, police unit, and back-end management can add and modify the information related to the road condition report. Police units and back-end management can add and modify settings related to real-time imaging devices. Finally, back-end management has all the rights of the system, and can delete additional settings, such as members.
4.2. Performance Analysis
The following comparisons and experiments involved users from related departments (Department of Information and Communication Engineering), unrelated departments (Department of Business Management), and users from the middle–high age group (over 45 years old). There were ten persons in each group, and the three groups were used as a reference frame for analysis. All comparisons and evaluation results were based on opinions, for which there was 75% or greater agreement in the three groups, showing that the majority of the subjects were in agreement.
The main comparison objects of this system are four traffic information systems related applications, namely Police Broadcast Real-Time Traffic, Road Condition Autotoll, Real-time Traffic Image—RoadCam, and New Taipei City Advanced Traveler Information System. The following experiment presents the analysis of data accessibility and system performance. This is the first condition for a user-friendly interface of information systems—rapid response information accessibility. The content of the first experiment is to explore the data accessibility analysis of the system, as well as its related systems. This study compared the following items: open real-time information, real-time images, road condition reporting, real-time weather, and other information for analysis and comparison. Table 5 presents the comparison between the proposed system and its related applications for the corresponding information, as obtained by the number of clicks with the same target. The “X” in the table indicates that the system does not have this function, while the numbers in the table means the number of clicks for the corresponding data. This study performed the click count experiment in real time, and recorded the data for analysis and comparison with other applications. This study developed a total of eight comparison items for the average number of clicks to perform experiments, and developed Equation (1), where S is the comparison system, K is the comparison system number, n is the number of system comparison items, Click is the number of clicks of the comparison item, x denotes that the comparison item of the system has no such function and is not included in the calculation, and Nx is the number of such functions available. In the end, the data acquisition clicks of the proposed system averaged 1.6 times, while both the RoadCam and New Taipei City Advanced Traveler Information System averaged 1.8 times, and the remaining Police Broadcast Real-Time Traffic and Autotoll both averaged more than 2 times. It is obvious that the proposed system exhibits excellent performance in the accessibility of the information acquisition interface, which is the first condition for building an effective information system with user-friendly interfaces.
The second experiment is the content of system operating environment and user experience analysis. This is also one of the important topics for constructing contemporary information systems with user-friendly interfaces. In order to explore the function test of this system, three categories are planned: positioning, multiplatform, and user experience, including eight items for function comparison (see Table 6 for details). The comparison objects of this experiment are the four systems mentioned above. Through experimental tests, the proposed system can accurately obtain the current location, both indoors and outdoors, with a handheld device with the GPS function, and the other two can also obtain the current location. The system can be used normally in multiplatform browsers. At present, there are only IOS and Android platforms in Autotoll, and there is no computer version. Finally, the user experience part of the comparison system is discussed. The proposed system uses the Microsoft Azure web server and database applications. The traffic can be automatically allocated to optimize the operation of the system, and the multiplatform RWD responsive webpage technology [54] is adopted. Thus, users do not have to repeatedly learn the webpage version or the mobile phone version of the proposed system.
The third experiment is the content and function balance of the important items of the interface design. The design preference to importance ratio (DIR) (Equation (2)), as proposed by Ha [55], is taken as the design principle of the human–machine interface (HMI) of this system. The HMI is ideal when combined with the balancing index (BI) (see Equation (3)) to define the user interface. In short, if BI is zero, all the HMI elements in the interface design are balanced and perfect. Its physical meaning is that the HMI design satisfies the principle of the design preference for importance, and the interface operation of the system is more consistent with user demand:
where DIRijk is the DIR of design attribute j and importance attribute k of HMI interface element i. DPij is the design preference of design attribute j of HMI interface element i. Iik denotes design importance k of the importance attribute of HMI interface element i. BIjk is the balance index of design attribute j and importance attribute k, while n is the total number of HMI interface elements.
A five-scale evaluation scheme is used to evaluate each design preference (DPij). The design preferences include very good, good, moderate, weak, and very weak, and their corresponding values are five, four, three, two, and one, respectively. Table 7 displays the evaluation of the HMI elements in our design attributes, as well as the corresponding informational importance of the proposed agents, as evaluated using the analytic hierarchy process [55]. Table 8 illustrates the evaluation results of DIR with average BI = 0.012534 (BI should approach zero for the best balance) of the proposed agents. “Needs to improve a little bit” means that the proposed system interface design must be slightly adjusted, but will not affect the operations of the proposed system. The verification results show that the human-machine interfaces of our proposed agents can meet important design preferences and provide approximately optimal balance.
Finally, this study did not analyze the correctness and satisfaction of the information provided by the proposed system because it adopted the LOD of government units, which provide accurate and reliable information. Moreover, this study developed an instant image-based information system that is user-friendly and offers nearly perfect design interfaces to present the LOD of government units. The answer to the above question is, hence, self-evident.
5. Conclusions and Discussions
Based on GPS and LOD technology, this study developed a multiplatform, cloud-based, and instant image-based traffic assistance agent with user-friendly interfaces, which provides various functions, including real-time information, real-time images, endpoint analysis information, and real-time user reporting. It also has quite good user experience in the system interface design, and the system files and required databases are cloud-based. On a smart handheld device with Internet connection, users can access the proposed system and the condition reporting system. The proposed system does not have any demand on the device capacity, as all systems are developed on a cloud-based smart traffic assistance system. The comprehensive system operation and presentation to performance comparison confirmed that the proposed system has excellent accessibility to the information acquisition interface and approximately optimal balance of the important items of the interface design. Moreover, due to the application of the Microsoft Azure web server and database, traffic can be automatically allocated to optimize system operation. In addition, this study adopted RWD responsive webpage technology, which makes it easier for users to use various devices without having to learn the relevant interfaces of the proposed system.
Although the proposed system has been successfully combined with Microsoft Azure cloud services to achieve cloud-based, instant image-based, and traffic LOD of government units, there are still many unfinished, missing, and yet to be improved areas, which are listed and described as follows:
- At present, the time for reporting road conditions is modified manually. In the future, a new system can be added to automatically judge the subsequent elimination time or cooperate with relevant government units, so that such units can carry out linked modification actions.
- Future studies can strengthen the introduction of the data analysis function, and present periodic analysis charts to facilitate exploration, planning, and overall review of traffic flows before being updated by cities in the future;
- Future studies can add an automatic reporting function for endpoint maintenance, where users can report sensor endpoint failures to relevant units;
- Multiple accounts (e.g., LINE login, Google login, etc.) can be authorized to save users’ login time before reporting road conditions.
- As mentioned above, Taiwan is narrow and crowded with people and cars. Depending on the navigation system, it is prone to the dilemma of avoiding road section “A” and entering the congested road section “B”. Therefore, the introduction of the proposed system is unique; however, Taiwan (including its capital city, Taipei) is an international tourist destination, and the interface version of future applications should adopt a multilingual model. In addition, future studies could explore how combining the proposed system with international traffic databases, such as a NoSQL database approach for processing traffic-related big data [56] and a real approach on open data and databases in analysis of traffic accidents [57]. Finally, further research can target the setting up of traffic information-related urban development strategies, data privacy rights, and urban data plans (e.g., four data-driven algorithms extracting useful information from high resolution traffic data [58], providing another level of automation in processing mechanisms and deserve more attention.
Author Contributions
The research article was completed by two authors, F.-H.C. and S.-Y.Y. F.-H.C. and S.-Y.Y. jointly designed the overall architecture and related algorithms, and also conceived and designed the experiments, however S.-Y.Y. coordinated the overall plan and direction of the experiments and related skills. F.-H.C. and S.-Y.Y. contributed analysis tools and also analyzed the data. F.-H.C. performed the experiments, and S.-Y.Y. wrote this paper and the related reply. All authors have read and agreed to the published version of the manuscript.
Funding
This research is partly sponsored under grants 106-2221-E-129-008 and 107-2632-E-129-001 by the Ministry of Science and Technology, Taiwan.
Acknowledgments
The authors would like to thank Yu-Wei Wu for his assistance in earlier system implementation and preliminary experiments. The authors feel deeply indebted to the Department of Electrical Engineering and Department of Information and Communication, St. John’s University, Taiwan, for all aspects of assistance provided. All authors have read and agreed to the published version of the manuscript.
Conflicts of Interest
The authors declare no conflict of interest.
References
- Sodano, D. Mobile Taiwan: A Look at a Highly Mobile Market. 2016. Available online: https://www.emarketer.com/Article/Mobile-Taiwan-Look-Highly-Mobile-Market/1014877 (accessed on 11 July 2019).
- National Development Council, Taiwan. Investigation Report on Individual and Household Digital Opportunity in 2018. Available online: https://ws.ndc.gov.tw/Download.ashx?u=LzAwMS9hZG1pbmlzdHJhdG9yLzEwL2NrZmlsZS81NzQyMWI3YS0xMjhmLTRmMzAtYTY0ZC04MzdiYTkzNmRkZDUucGRm&n=MTA35bm05YCL5Lq65a625oi25pW45L2N5qmf5pyD6Kq%2f5p%2bl5aCx5ZGKLnBkZg%3d%3d&icon=.pdf (accessed on 26 March 2019).
- He, W.Z. Taichung City Government Transcends Data Framework and Discovers Hidden Emotions to Make Traffic Management No Longer a Problem. 2017. Available online: https://www.ithome.com.tw/news/117280 (accessed on 11 July 2019).
- Ministry of the Interior Police Department, Taiwan. Traffic Accident Main Data Inquiry. 2018. Available online: http://stat.motc.gov.tw/mocdb/stmain.jsp?sys=100&funid=b3303 (accessed on 8 April 2018).
- Works Bureau of New Construction Office of the Taipei Municipal Government, Taiwan. Taipei City Road Management Center Promotes Road Construction Management Innovation Measures have Achieved Remarkable Results. 2018. Available online: https://nco.gov.taipei/News_Content.aspx?n=BB8CF6F431E10630&s=6F5661BD113EBD54 (accessed on 8 April 2018).
- New Taipei City Tourism Bureau, Taiwan. Annual Report of Tourism Bureau in 2017; New Taipei City Government: Taiwan, China, 2017. Available online: http://cdn.tour-ntpc.com/site/a3be84a9-7283-40a3-b4c7-758bf39c7828/Content/Upload/ContentPageFile/d4aebfd7-72ea-40d8-b87e-40c7e277e524.pdf (accessed on 26 March 2019).
- Su, W.B. The Number of Monthly Active Users in Line has Grown to 19 Million, and the Service Data has been Revealed! 2018. Available online: https://www.ithome.com.tw/news/121717 (accessed on 10 March 2018).
- Taiwan Ministry of Communications, China. Self-Use Passenger Car Usage Survey. 2019. Available online: http://ipgod.nchc.org.tw/dataset/315000000h-000004 (accessed on 24 November 2019).
- Taiwan Tourism Bureau, Ministry of Communications, China. Survey of Taiwanese Tourists in 2018. Available online: https://admin.taiwan.net.tw/FileUploadCategoryListC003340.aspx?CategoryID=7b8dffa9-3b9c-4b18-bf05-0ab402789d59&appname=FileUploadCategoryListC003340 (accessed on 24 November 2019).
- National Police Agency, Taiwan Ministry of Interior, China. Interior Information Open Platform: Historical Traffic Accident Information. 2019. Available online: https://data.moi.gov.tw/MoiOD/Data/DataDetail.aspx?oid=67781E29-8AAD-46A9-A2C8-C3F339592C27 (accessed on 24 November 2019).
- Flynn, D.B.; Gilmore, M.M.; Sudderth, E.A. Estimating Traffic Crash Counts Using Crowdsourced Data: Pilot Analysis of 2017 Waze Data and Police Accident Reports in Maryland; Technical Report: DOT-VNTSC-BTS-19-01; Bureau of Transportation Statistics: Washington, DC, USA, 2018.
- Chunghwa Telecom, Taiwan. Road Condition Quick Easy Pass Plus. 2018. Available online: https://play.google.com/store/apps/details?id=com.chttl.android.traffic.plus (accessed on 19 December 2018).
- Antyi, Taiwan. Real-Time Image of Traffic. 2018. Available online: https://play.google.com/store/apps/details?id=com.sy.twcctv (accessed on 19 October 2018).
- Lin, Z.Y. Police New. 2018. Available online: https://play.google.com/store/apps/details?id=tw.myself.oceanlin.newsbroadcast (accessed on 19 December 2018).
- New Taipei City Government, Taiwan. New Taipei City Instant Traffic Information Network. 2018. Available online: http://atis.ntpc.gov.tw/ (accessed on 9 November 2018).
- Cai, Y.H. Development of an Omni-Restaurant Information Consultation & Sharing Agent System with GPS & Linked Open Data Technologies. Master’s Thesis, Department of Information and Communication Engineering, St. John’s University, New Taipei City, Taiwan, 2015. [Google Scholar]
- Wang, Y.C. Automatic News Classification Using Machine Learning and Linked Open Data. Master’s Thesis, Department of Information Management, National University of Kaohsiung, Kaohsiung, Taiwan, 2018. [Google Scholar]
- Yan, Y.H. Building a Prototyping Platform of Open Government Linked Data. Master’s Thesis, Institute of Information Management, Chung Yuan Christian University, Taoyuan, Taiwan, 2018. [Google Scholar]
- Yu, C.Y. Research on Linked Open Data Applications Using Dynamic Context Data Analysis. Master’s Thesis, Department of Computer Science and Information Engineering, National Taiwan Normal University, Taipei, Taiwan, 2016. [Google Scholar]
- Albert, M.P.; Ashkan, A.; Christophe, G.; Stefan, S. CEDAR: The Dutch historical censuses as Linked Open Data. Semant. Web 2017, 8, 297–310. [Google Scholar]
- Alobaidi, M.; Mahmood, K.; Sabra, S. Semantic Enrichment for Local Search Engine using Linked Open Data. In Proceedings of the 25th International Conference Companion on World Wide Web, Montreal, QC, Canada, 11–15 April 2016; pp. 631–634. [Google Scholar]
- Selvam, S.; Balakrishnan, R.; Ramakrishnan, B. Social Event Detection-A Systematic Approach using Ontology and Linked Open Data with Significance to Semantic Links. Int. Arab J. Inf. Technol. 2018, 15, 729–738. [Google Scholar]
- Pourhomayoun, M.; Wang, H.; Vahedi, M.; Mazari, M.; Smith, J.; Owens, H.; Chernicoff, W. Real-Time Big Data Analytics for Traffic Monitoring and Management for Pedestrian and Cyclist Safety. In Proceedings of the Fifth International Conference on Big Data, Small Data, Linked Data and Open Data, Valencia, Spain, 24–28 March 2019; p. 33. [Google Scholar]
- Juan, Y.C. Analysis of Spatio-temporal Data of Office Workers Based on GPS Signals Collected from Mobile Device. Master’s Thesis, Department of Computer Science and Information Engineering, Feng Chia University, Taichung, Taiwan, 2018. [Google Scholar]
- Liou, G.T. A Multi-Epoch Algorithm for GPS/BDS Single Frequency Precise Point Positioning. Master’s Thesis, Institute of Applied Mechanics, National Taiwan University, Taipei, Taiwan, 2016. [Google Scholar]
- Tu, T.Y. Method of Monitoring and Locating Pets by GPS and BLE. Master’s Thesis, Institute of Electrical Engineering and Computer Science Master’s In-service Program, National Taipei University of Technology, Taipei, Taiwan, 2016. [Google Scholar]
- Fridman, L.; Weber, S.; Greenstadt, R.; Kam, M. Active Authentication on Mobile Devices via Stylometry, Application Usage, Web Browsing, and GPS Location. IEEE Syst. J. 2017, 11, 513–521. [Google Scholar] [CrossRef] [Green Version]
- Ta, N.; Zhao, Y.; Chai, Y. Built environment, peak hours and route choice efficiency: An investigation of commuting efficiency using GPS data. J. Transp. Geogr. 2016, 57, 161–170. [Google Scholar] [CrossRef] [Green Version]
- Aliprantis, J.; Kalatha, E.; Konstantakis, M.; Michalakis, K.; Caridakis, G. Linked Open Data as Universal Markers for Mobile Augmented Reality Applications in Cultural Heritage. Digit. Cult. Herit. Lect. Notes Comput. Sci. 2018, 10605, 79–90. [Google Scholar]
- Khaghani, F.; Rahimi-Golkhandan, A.; Jazizadeh, F.; Garvin, M.J. Urban Transportation System Resilience and Diversity Coupling Using Large-scale Taxicab GPS Data. In Proceedings of the 6th ACM International Conference on Systems for Energy-Efficient Buildings, Cities, and Transportation, New York, NY, USA, 13–14 November 2019; pp. 165–168. [Google Scholar]
- Bellavista, P.; Kupper, A.; Helal, S. Location-based services: Back to the Future. IEEE Pervasive Comput. 2008, 7, 85–89. [Google Scholar] [CrossRef]
- Syu, Y.C. The Framework of Location Based Service Using IoT Subscription Agreement—Taxi Service in Taoyuan Area as a Case. Master’s Thesis, Department of Computer Science and Information Engineering, Yuan Ze University, Taoyuan, Taiwan, 2018. [Google Scholar]
- Chou, C.C. The Study of Driving Safety Enhancement based on IoT and LBS. Master’s Thesis, Department of Information Communication, Chinese Culture University, Taipei, Taiwan, 2017. [Google Scholar]
- Sun, G.; Liao, D.; Li, H.; Yu, H.; Chang, V. L2P2: A location-label based approach for privacy preserving in LBS. Future Gener. Comput. Syst. 2017, 74, 375–384. [Google Scholar] [CrossRef] [Green Version]
- Wang, Y.; Xu, D.; Li, F. Providing Location-Aware Location Privacy Protection for Mobile Location-Based Services. Tsinghua Sci. Technol. 2016, 21, 243–259. [Google Scholar] [CrossRef]
- Ukrit, M.F.; Venkatesh, B.; Suman, S. Location Based Services with Location Centric Profiles. Int. J. Electr. Comput. Eng. 2016, 6, 3001–3005. [Google Scholar]
- Lin, C.; Su, H.; Knoblock, C.A.; Chiang, Y.Y.; Duan, W.; Leyk, S.; Uhl, J.H. Building Linked Data from Historical Maps. In Proceedings of the Second Workshop on Enabling Open Semantic Science Co-Located with 17th International Semantic Web Conference, Monterey, CA, USA, 8–12 October 2018; pp. 59–67. [Google Scholar]
- Sansonetti, G.; Gasparetti, F.; Micarelli, A. Cross-Domain Recommendation for Enhancing Cultural Heritage Experience. In Proceedings of the 27th Conference on User Modeling, Adaptation and Personalization, New York, NY, USA, 9–12 June 2019; pp. 413–415. [Google Scholar]
- Microsoft. The Developer’s Guide to Azure. 2018. Available online: https://go.microsoft.com/fwlink/?LinkId=862819&clcid=0x409 (accessed on 20 December 2018).
- Wikipedia. Microsoft Azure. 2018. Available online: https://en.wikipedia.org/wiki/Microsoft_Azure (accessed on 20 December 2018).
- Liou, W.X. An Azure ACES System for Air Quality Index Deteriorating Real-Time Early Warning. Master’s Thesis, Department of Information Management, National Yunlin University of Science and Technology, Yunlin, Taiwan, 2018. [Google Scholar]
- Ho, Y.C. A Case Study on Machine Learning for Customer Relationship Management in Service Industry. Master’s Thesis, Department of Management Information Systems, National Chengchi University, Taipei, Taiwan, 2018. [Google Scholar]
- Lin, Y.Z. Implementation of an Access Control System by Using Raspberry PI and Cloud Face Recognition Services. Master’s Thesis, Department of M-Commerce and Multimedia Applications, Asia University, Taichung, Taiwan, 2017. [Google Scholar]
- Richard, H. Check Out This Interactive Map of Azure Platform Services. 2016. Available online: https://www.itprotoday.com/microsoft-azure/check-out-interactive-map-azure-platform-services (accessed on 24 November 2018).
- Diaz, F.; Freato, R. Azure Data Lake Store and Azure Data Lake Analytics. In Cloud Data Design, Orchestration, and Management Using Microsoft Azure; Apress: Berkeley, CA, USA, 2018; pp. 327–392. [Google Scholar]
- Färber, M. The Microsoft Academic Knowledge Graph: A Linked Data Source with 8 Billion Triples of Scholarly Data. In Proceedings of the 18th International Semantic Web Conference, Auckland, New Zealand, 26–30 October 2019; pp. 113–129. [Google Scholar]
- Chang, W.C. Integration of Google Map API and Evolutionary Algorithm for Route Planning in Road Flatness Inspection. Master’s Thesis, Department of Civil Engineering, National Chung Hsing University, Taichung, Taiwan, 2016. [Google Scholar]
- Wang, J.W. Using Google Maps in Ambulance Dispatch—A Case Study of the 119 Emergency System of the New Taipei City Fire Department. Master’s Thesis, Department of Computer Science, National Taipei University of Education, Taipei, Taiwan, 2018. [Google Scholar]
- Rahmi, A.; Piarsa, I.N.; Buana, P.W. FinDoctor-Interactive Android Clinic Geographical Information System Using Firebase and Google Maps API. Int. J. New Technol. Res. 2017, 3, 8–12. [Google Scholar]
- Xia, N.; Cheng, L.; Chen, S.; Wei, X.; Zong, W.; Li, M. Accessibility based on Gravity-Radiation model and Google Maps API: A case study in Australia. J. Transp. Geogr. 2018, 72, 178–190. [Google Scholar] [CrossRef]
- Tan, Z.; Hasegawa, S.; Beuran, R. Concept Map Building from Linked Open Data for Cybersecurity Awareness Training. In Proceedings of the Japanese Society for Artificial Intelligence Special Interest Group on Advanced Learning Science and Technology Workshop, Ishikawa, Japan, 14 July 2018; pp. 1–6. [Google Scholar]
- Nyo, M.T.H.; Hein, W.Z. Design and Construction of Navigation Based Auto Self-Driving Vehicle using Google Map API with GPS. Int. J. Trend Sci. Res. Dev. 2019, 3, 65–68. [Google Scholar]
- Wikipedia. Google Traffic. 2018. Available online: https://en.wikipedia.org/wiki/Google_Traffic (accessed on 21 December 2018).
- Ryan, B. Responsive Web Design vs. Mobile App Development. 2013. Available online: https://www.techrepublic.com/blog/web-designer/responsive-web-design-vs-mobile-app-development/ (accessed on 15 December 2018).
- Ha, J.S. A Human-machine Interface Evaluation Method Based on Balancing Principles. Procedia Eng. 2014, 69, 13–19. [Google Scholar] [CrossRef] [Green Version]
- Kaur, M.; Singh, S.; Aggarwal, N. Study of NoSQL Databases for Storing and Analyzing Traffic Data. In Proceedings of the 2nd International Conference on Communication, Computing and Networking, NITTTR, Chandigarh, India, 29–30 March 2018; pp. 577–587. [Google Scholar]
- Gladović, P.V.; Deretić, N.N. Open data and databases in analysis of traffic accidents in Belgrade. Tehnika 2018, 73, 247–253. [Google Scholar] [CrossRef] [Green Version]
- Amini, Z. Data-Driven Approaches for Robust Signal Plans in Urban Transportation Networks. Ph.D. Thesis, Engineering-Civil and Environmental Engineering, Graduate Division, University of California, Berkeley, CA, USA, 2018. [Google Scholar]
Figure 1.
Overall system architecture.

Figure 2.
Dynamic vehicle data (Origin URL: https://data.ntpc.gov.tw/od/detail?oid=875D5555-A881-4561-8E9D-93B96C959384).
Figure 2.
Dynamic vehicle data (Origin URL: https://data.ntpc.gov.tw/od/detail?oid=875D5555-A881-4561-8E9D-93B96C959384).

Figure 3.
Vehicle dynamic data capture program segment.

Figure 4.
Example of reading real open data at a single time.

Figure 5.
Linked static vehicle data. “雙向” is two-way; “單向” is one-way; The rest of the Chinese characters are the addresses of the corresponding road sections.
Figure 5.
Linked static vehicle data. “雙向” is two-way; “單向” is one-way; The rest of the Chinese characters are the addresses of the corresponding road sections.

Figure 6.
Fragment program for storing linked open data (LOD) in the cloud database.

Figure 7.
Road condition user reporting mechanism and processing flow chart: (a) operation process of road condition user reporting mechanism; (b) processing flow chart of newly added information.
Figure 7.
Road condition user reporting mechanism and processing flow chart: (a) operation process of road condition user reporting mechanism; (b) processing flow chart of newly added information.

Figure 8.
Real-time traffic information displays for a (a) computer and (b) mobile phone. In this step we take the longitude and latitude of the user’s location and present it on a map through the GPS function of the intelligent handheld device held by the user, and then, display the “real-time status” data, such as the green color indicating the smooth conditions and red indicating congested road conditions.

Figure 9.
Real-time traffic image (Take the Tamsui District, New Taipei City, Taiwan as an example) displays for a (a) computer and (b) mobile phone. In this step we use the GPS function of the intelligent handheld device held by the user, which will read the user’s location and display the nearby monitor screen, and then, look at the road section.

Figure 10.
Real-time traffic image displays for endpoint number 3 for a (a) computer and (b) mobile phone. In this step we Click the “View” hyperlink to display the real-time image of the endpoint; for example, click endpoint number 3 to show the real-time image of Zhongzheng Road and Zhongshan Road.

Figure 11.
Real-time data displays of endpoint information for a (a) computer and (b) mobile phone. The “endpoint information” of this system is extracted from the dynamic vehicle information of the New Taipei City Open Data Platform as the real-time data of the sensing endpoint, including forward and reverse road information.

Figure 12.
Sensing information displays of endpoints for a (a) computer and (b) mobile phone. The user will view the “sensing endpoint information” of each sensed end through the system, at that time, the user or government work unit will hold an intelligent handheld device to view and attend the endpoint to carry out relevant work services.

Figure 13.
Navigating to endpoint number 65000V008130. Displays for a (a) computer-side and (b) mobile phone. The user will click the “navigation” hyperlink to open the icon of the Google Map display endpoint. Taking endpoint number 65000V008130 as an example.
Figure 13.
Navigating to endpoint number 65000V008130. Displays for a (a) computer-side and (b) mobile phone. The user will click the “navigation” hyperlink to open the icon of the Google Map display endpoint. Taking endpoint number 65000V008130 as an example.

Figure 14.
Road condition user reporting function displays for a (a) computer and (b) mobile phone. After logging into the system, when a user arrives at an accident emergency site, their intelligent handheld device can read the longitude and latitude of their location through the built-in GPS function, and present it in real time on the reporting page to complete add road condition reporting information.

Figure 15.
History analysis page displays map distribution of road reporting information and popular congestion locations for a (a) computer and (b) mobile phone. History analysis page of the system will obtain the return information through the cloud database; that is, clicking on the navigation function of the page will open the icon of the Google Maps display endpoint and go there.

Figure 16.
Back-end system management page.

Figure 17.
Authority unit management page.


Table 1.
Four traffic assistant information systems explored in this study.
| No | System Name | System Picture | Advantages | Disadvantages |
|---|---|---|---|---|
| 1 | Road Condition Autotoll (capture time: December 19, 2018) |  | Provide comprehensive applications for national expressways, hot spot areas, roads to and from airports, important urban roads, and scenic spots. | GPS function is still not perfect; often unable to read location information. Lack of user reporting function in this study. |
| 2 | Real-Time Traffic Image (capture time: October 19, 2018) |  | Provide real-time image application program for road conditions in the counties and cities of Taiwan, which is practical. | Lack of user reporting function in this study. |
| 3 | Police Broadcast Real-Time Road Conditions (capture time: October 18, 2018) |  | The website display includes date, time, road section description, category, etc. At this stage, it is still necessary to report road condition information by telephone or retrieve relevant government data to present relevant traffic information. | Lack of user reporting function in this study. |
| 4 | New Taipei City Advanced Traveler Information System (capture time: December 24, 2018) |  | The website uses responsive web design technology and can view relevant information pages in an optimal size on an intelligent handheld device. | The user position cannot be automatically obtained, and only the longitude and latitude positions originally set by the map are presented. Furthermore, entering the website still needs to be checked manually. Lack of user reporting function in this study. |
Table 2.
Description of main parameters and functions of GetPosition.
| Parameter | Function Description |
|---|---|
| Coords.Latitude | Latitude |
| Coords.Longitude | Longitude |
| Accuracy | Accuracy (error range between detected position and actual position) |
| Maximum Age | Time to reacquire location information |
Table 3.
Hierarchical authority list for system members.
| Authority Items | Visitor | Registered Member | Administrator |
|---|---|---|---|
| View real-time information | ✓ | ✓ | ✓ |
| View live images | ✓ | ✓ | ✓ |
| View reporting information | ✓ | ✓ | ✓ |
| Add reporting information | ✘ | ✓ | ✓ |
| Modify reporting information | ✘ | ✘ | ✓ |
| Real-time image setting | ✘ | ✘ | ✓ |
| Membership management | ✘ | ✘ | ✓ |
Legend: “✓” means to have this function; while “✘” means none.
Table 4.
Hierarchical authority list of power and responsible units.
| Administrative Rights Items | Public Works Unit | Police Unit | Back-end Management |
|---|---|---|---|
| Add reporting information | ✓ | ✓ | ✓ |
| Modify reporting information | ✓ | ✓ | ✓ |
| Real-time image setting | ✘ | ✓ | ✓ |
| Membership management | ✘ | ✘ | ✓ |
Legend: “✓” means to have this function; while “✘” means none.
Table 5.
Analysis results of data acquisition accessibility.
| Click | The Proposed System | Police Broadcast Real-Time Traffic | Road Conditions Autotoll | Real-Time Traffic Image: RoadCam | New Taipei City Advanced Traveler Information System |
|---|---|---|---|---|---|
| Open real-time information | 1 | 2 | 3 | 2 | 1 |
| Open real-time image | 1 | 2 | 3 | 2 | 2 |
| Open traffic report | 4 | 6 | X | X | X |
| Road conditions reporting content | 1 | 2 | X | X | X |
| Real-time weather information | X | 1 | X | 2 | 2 |
| Personalized subscription information | X | X | 1 | X | X |
| Disaster prevention monitoring information | X | X | X | 2 | 3 |
| Other information links | 1 | 1 | 1 | 1 | 1 |
| Average information acquisition | 1.6 | 2.3 | 2 | 1.8 | 1.8 |
Table 6.
Analysis results of system performance.
| Comparison Items | Comparison Items | The proposed System | Police Broadcast Real-Time Traffic | Road Conditions Autotoll | Real-Time Traffic Image: RoadCam | New Taipei City Advanced Traveler Information System |
|---|---|---|---|---|---|---|
| Positioning | Continuous positioning | ✓ | ✓ | ✓ | ✓ | ✓ |
| Outdoor positioning | ✓ | ✓ | ✓ | ✓ | ✓ | |
| Cross platform | Android | ✓ | ✓ | ✓ | ✓ | ✓ |
| iOS | ✓ | ✘ | ✓ | ✓ | ✓ | |
| Chrome/Safari | ✓ | ✓ | ✘ | ✘ | ✓ | |
| User experience | Easy to update | ✓ | ✓ | ✓ | ✓ | ✘ |
| Easy to operate | ✓ | ✓ | ✘ | ✘ | ✓ | |
| Graphical interface | ✓ | ✘ | ✓ | ✓ | ✓ |
Legend: “✓” means to have this function; while “✘” means none.
Table 7.
Evaluation of human–machine interface (HMI) elements and their corresponding importance.
| HMI Elements | Description | Design Preference | Informational Importance | Remarks |
|---|---|---|---|---|
| RTILL | Real-time information label | 5 | 0.204082 | Label in Text |
| ARTILT | A real-time image list | 3 | 0.265306 | List in Text |
| EAILL | Endpoint analysis information label | 3 | 0.265306 | Label in Text |
| RTTLL | Real-time reporting label | 3 | 0.265306 | Label in Text |
Table 8.
Evaluation results of design preference to importance ratio (DIR) where balancing index (BI) = 0.012534.
Table 8.
Evaluation results of design preference to importance ratio (DIR) where balancing index (BI) = 0.012534.
| HMI Elements | DIR | Description | BI |
|---|---|---|---|
| RTILL | 1.228055 | Needs to improve a little bit | 0.012534 |
| ARTILT | 0.939958 | Needs to improve a little bit | |
| EAILL | 0.944658 | Needs to improve a little bit | |
| RTTLL | 0.939958 | Needs to improve a little bit |
© 2019 by the authors. Licensee MDPI, Basel, Switzerland. This article is an open access article distributed under the terms and conditions of the Creative Commons Attribution (CC BY) license (http://creativecommons.org/licenses/by/4.0/).
Share and Cite
MDPI and ACS Style
Chen, F.-H.; Yang, S.-Y. A Balance Interface Design and Instant Image-based Traffic Assistant Agent Based on GPS and Linked Open Data Technology. Symmetry 2020, 12, 1. https://doi.org/10.3390/sym12010001
AMA Style
Chen F-H, Yang S-Y. A Balance Interface Design and Instant Image-based Traffic Assistant Agent Based on GPS and Linked Open Data Technology. Symmetry. 2020; 12(1):1. https://doi.org/10.3390/sym12010001
Chicago/Turabian StyleChen, Fu-Hsien, and Sheng-Yuan Yang. 2020. "A Balance Interface Design and Instant Image-based Traffic Assistant Agent Based on GPS and Linked Open Data Technology" Symmetry 12, no. 1: 1. https://doi.org/10.3390/sym12010001
Note that from the first issue of 2016, this journal uses article numbers instead of page numbers. See further details here.