Article

Ensemble Genetic Fuzzy Neuro Model Applied for the Emergency Medical Service via Unbalanced Data Evaluation

1
Department of Mechanical Engineering and Innovation Center for Big Data and Digital Convergence, Yuan Ze University, Taoyuan, Chung-Li 32003, Taiwan
2
Department of Anesthesiology, College of Medicine, National Taiwan University, Taipei 100, Taiwan
3
Department of Emergency Medicine, College of Medicine, National Taiwan University, Taipei 100, Taiwan
4
Department of Electronic and Computer Engineering, Brunel University London, Uxbridge UB8 3PH, UK
*
Author to whom correspondence should be addressed.
Symmetry 2018, 10(3), 71; https://doi.org/10.3390/sym10030071
Submission received: 11 January 2018 / Revised: 7 March 2018 / Accepted: 14 March 2018 / Published: 17 March 2018

Abstract

:
Equally partitioned data are essential for prediction. However, in some important cases, the data distribution is severely unbalanced. In this study, several algorithms are utilized to maximize the learning accuracy when dealing with a highly unbalanced dataset. A linguistic algorithm is applied to evaluate the input and output relationship, namely Fuzzy c-Means (FCM), which is applied as a clustering algorithm for the majority class to balance the minority class data from about 3 million cases. Each cluster is used to train several artificial neural network (ANN) models. Different techniques are applied to generate an ensemble genetic fuzzy neuro model (EGFNM) in order to select the models. The first ensemble technique, the intra-cluster EGFNM, works by evaluating the best combination from all the models generated by each cluster. Another ensemble technique is the inter-cluster model EGFNM, which is based on selecting the best model from each cluster. The accuracy of these techniques is evaluated using the receiver operating characteristic (ROC) via its area under the curve (AUC). Results show that the AUC of the unbalanced data is 0.67974. The random cluster and best ANN single model have AUCs of 0.7177 and 0.72806, respectively. For the ensemble evaluations, the intra-cluster and the inter-cluster EGFNMs produce 0.7293 and 0.73038, respectively. In conclusion, this study achieved improved results by performing the EGFNM method compared with the unbalanced training. This study concludes that selecting several best models will produce a better result compared with all models combined.

1. Introduction

Severely unbalanced cases are highly likely to appear in decisive problems. Equally distributed class data are supposedly mandatory in prediction to avoid misclassification [1]. However, this unbalanced phenomenon has been one of the main obstacles in prediction issues [2]. According to Wang et al. [3], substantially unbalanced datasets allegedly create imprecise classification models, especially for the minority classes. Furthermore, a study conducted by Provost et al. [4] stated that the dataset can be in a ratio of one to one hundred thousand from one class to another. Several previous studies on unbalanced data have been conducted. The effect of unbalanced data has appeared in studies on oil spills [5], telecommunication risk management [6], text recognition [7], fraud characteristics in cellular communication [8], and email spam problems [9].
Aiming to overcome the unbalanced data problem, several earlier studies have been conducted. Batista et al. [10] used a method reducing the dominant group and increasing the smaller ones. Cristianini et al. [11] did a fine-tuning of the weights of the classes. Chawla et al. [12] performed a study about the synthetic minority over-sampling technique.
Fuzzy c-Means clustering (FCM) is a widely used algorithm for the unbalanced data problem. According to Jain et al. [13], essentially, clustering has a fundamental target for achieving the phenomena from unspecified output problems. One study applied an FCM-based algorithm to the unbalanced data [14]. Further, a combination of FCM with Support Vector Machine (SVM) classification outperformed the model using only SVM classification [15]. Meanwhile, an FCM clustering-based algorithm for resampling the preprocessing method for unbalanced data was also applied before the classification step for a biomedical dataset [16].
Artificial Neural Networks (ANNs) are one the most commonly used classification algorithms [17,18]. However, they usually suffer from the generalization problem [19]. Some studies have used multiple classifiers as part of the solutions for solving the generalization problem, instead of the individual model. There is a relationship between diversity and generalization [20]. Furthermore, diversity can produce several alternatives to a specific issue and gives the possibility to select a decision [21]. An investigation into the importance of diversity to ensemble modelling has been made by applying an entropy-based algorithm [22], a regression model [23], and an evaluation of numbers of neural networks [24]. A study previously conducted by Tumer et al. [25] also remarkably revealed a strong relation between diversity and ensemble evaluation.
Several methods have been proposed for ensemble techniques. Averaging is one of the commonly used ensemble techniques. Averaging methods can be classified into simple or weighted averaging. However, according to earlier studies, weighted averaging is not remarkably better than a simple averaging method [26,27,28], where a simple averaging method works by directly taking the average value from the outputs generated by the classifiers. Furthermore, more advanced studies have been conducted on ensemble techniques [29,30,31].
Fundamentally, an ensemble of classifiers has the purpose of reaching a generalization of the aforementioned models. Further, combining several models produces a better generalization compared with combining all models [32]. In order to realize this condition, an optimization technique should be applied. The Genetic Algorithm (GA), based on natural selection and evolution, is one of the most robust optimizing algorithms that has been applied in huge optimization applications. Hornby et al. [33] applied GA for designing an antenna for aerospace applications. GA has also been applied to produce an ensemble of models. Padilha et al. [34] used GA to produce an ensemble from several SVM-based models. In a recent study, a combination of random sampling to balance classes using GA based on an ensemble of several classification methods was applied by Haque et al. [35].
The emergency medical service (EMS) is one of the most critical parts of healthcare. Furthermore, the pre-hospital EMS contributes to the decisive medical system [36]—the response and treatment from the EMS technicians is very decisive with regards to the patient’s survival rate [37].
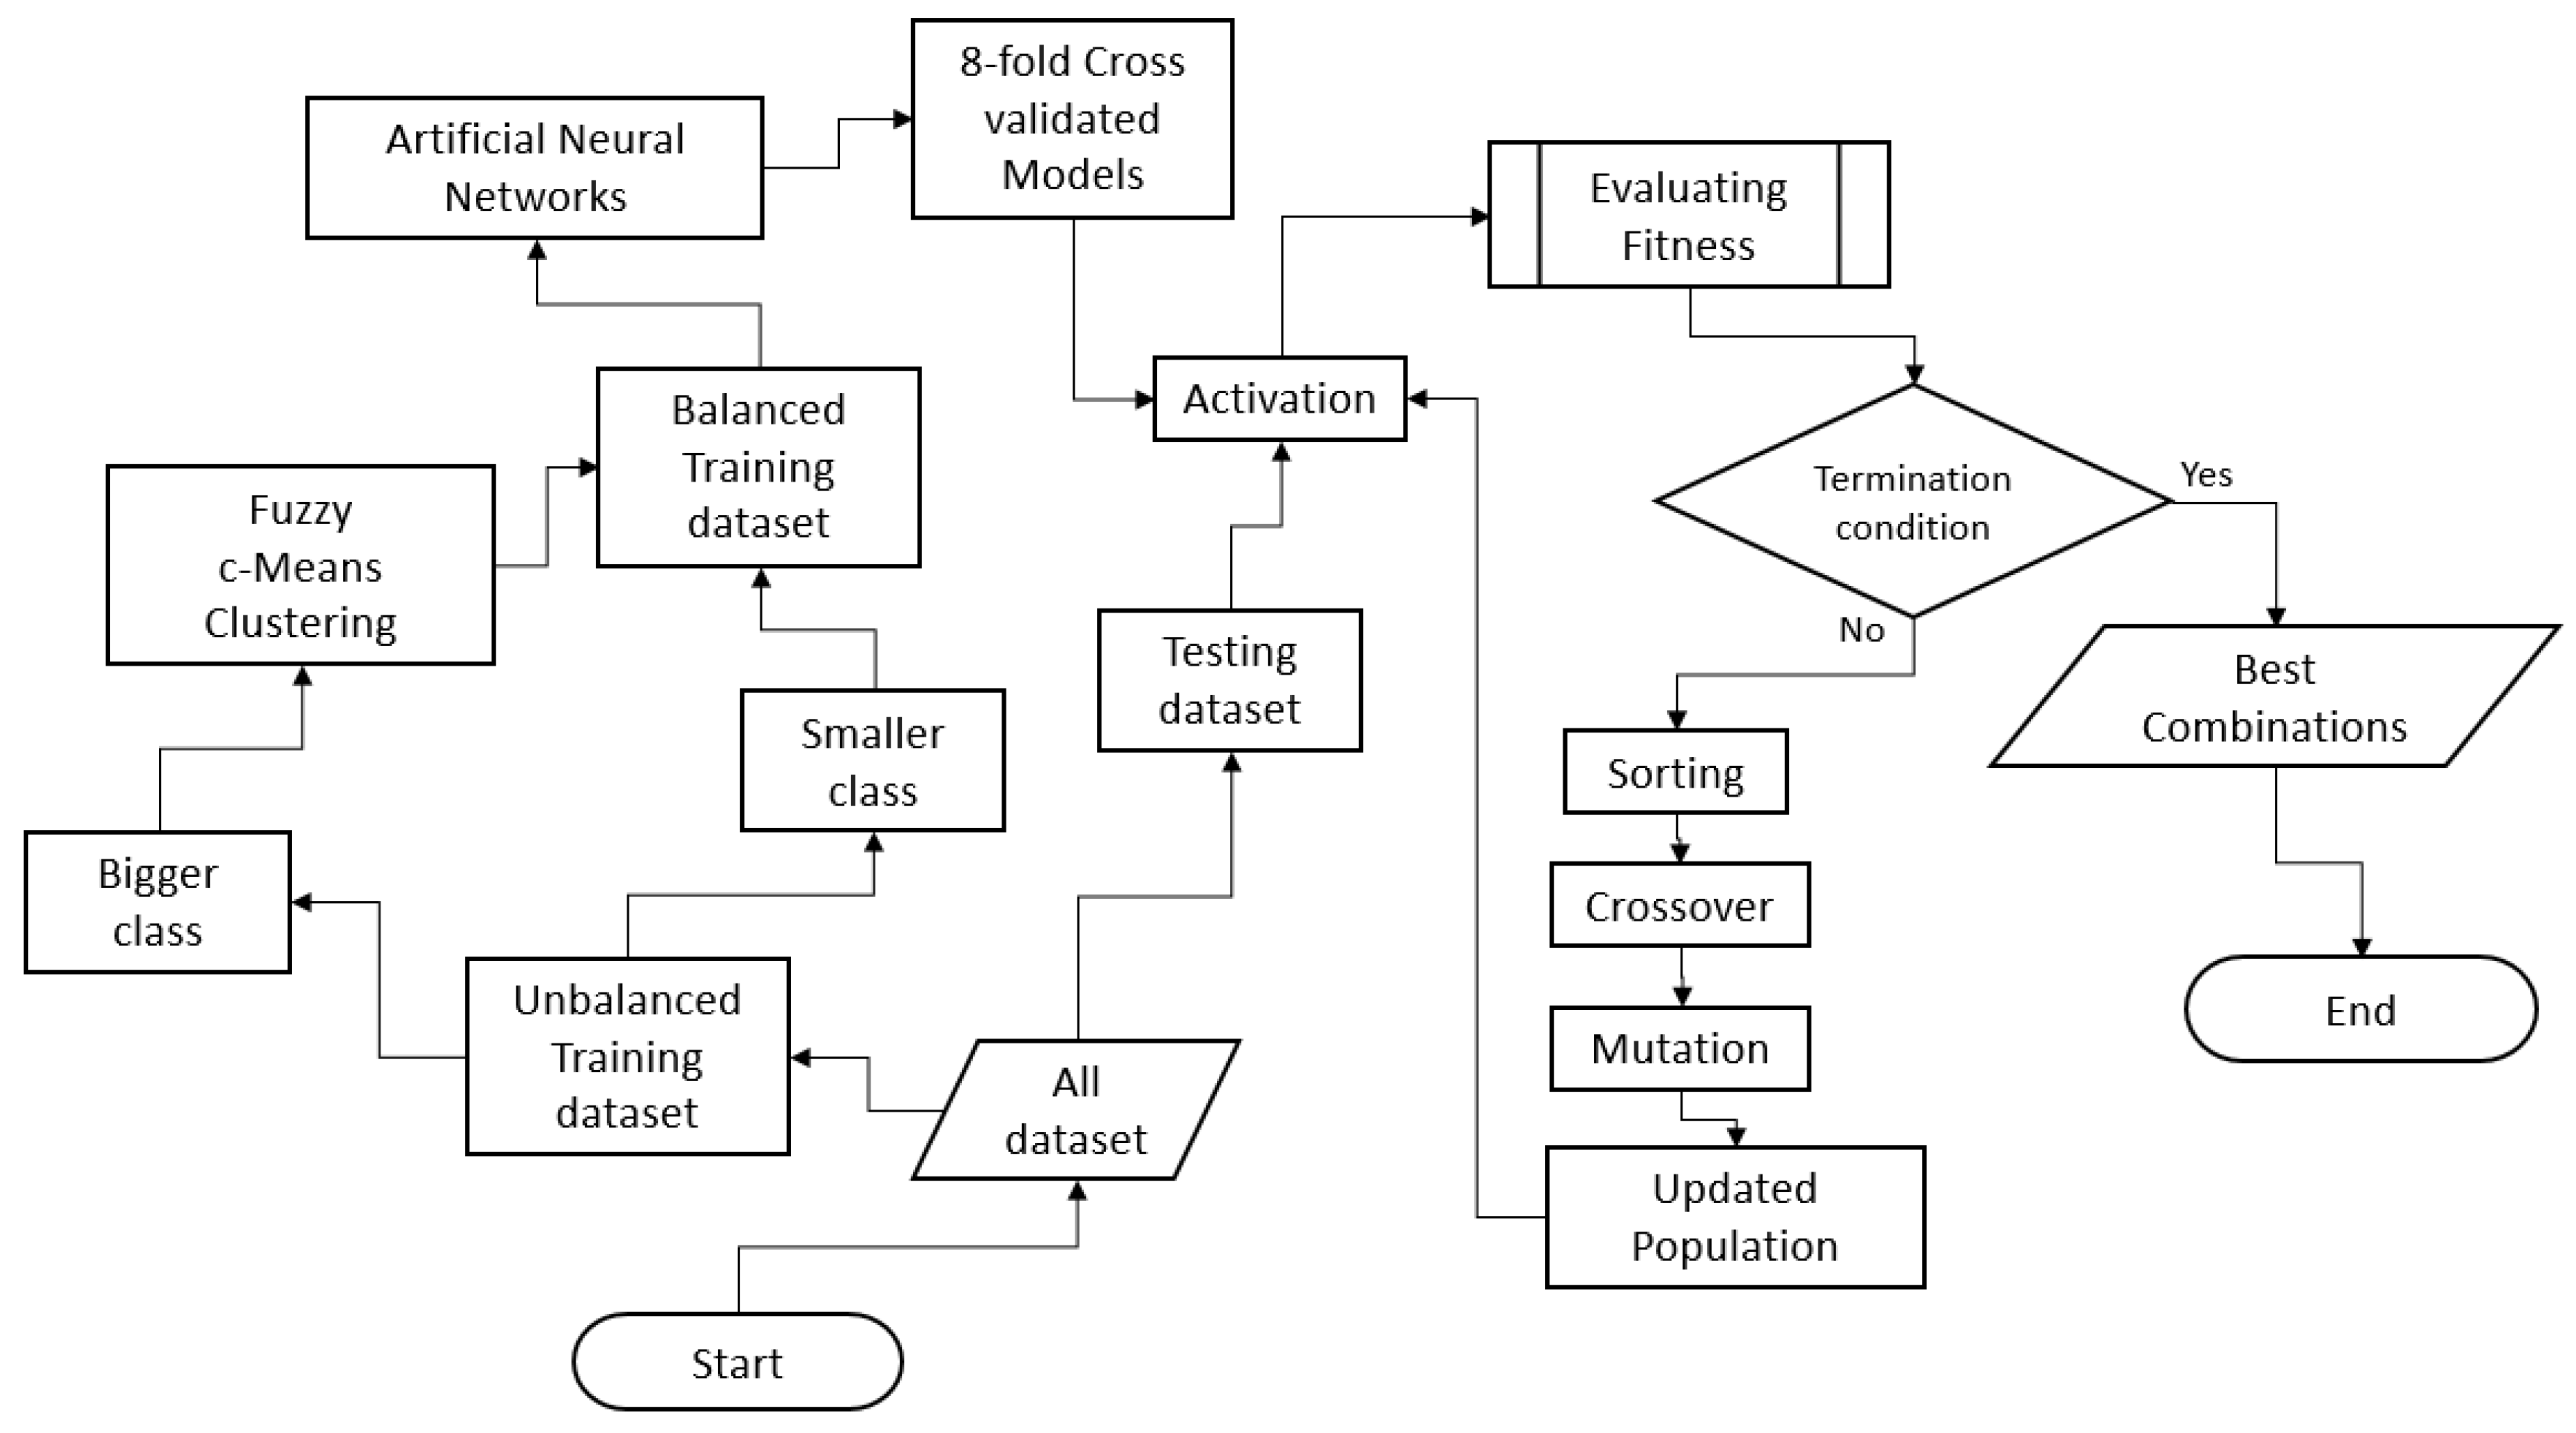
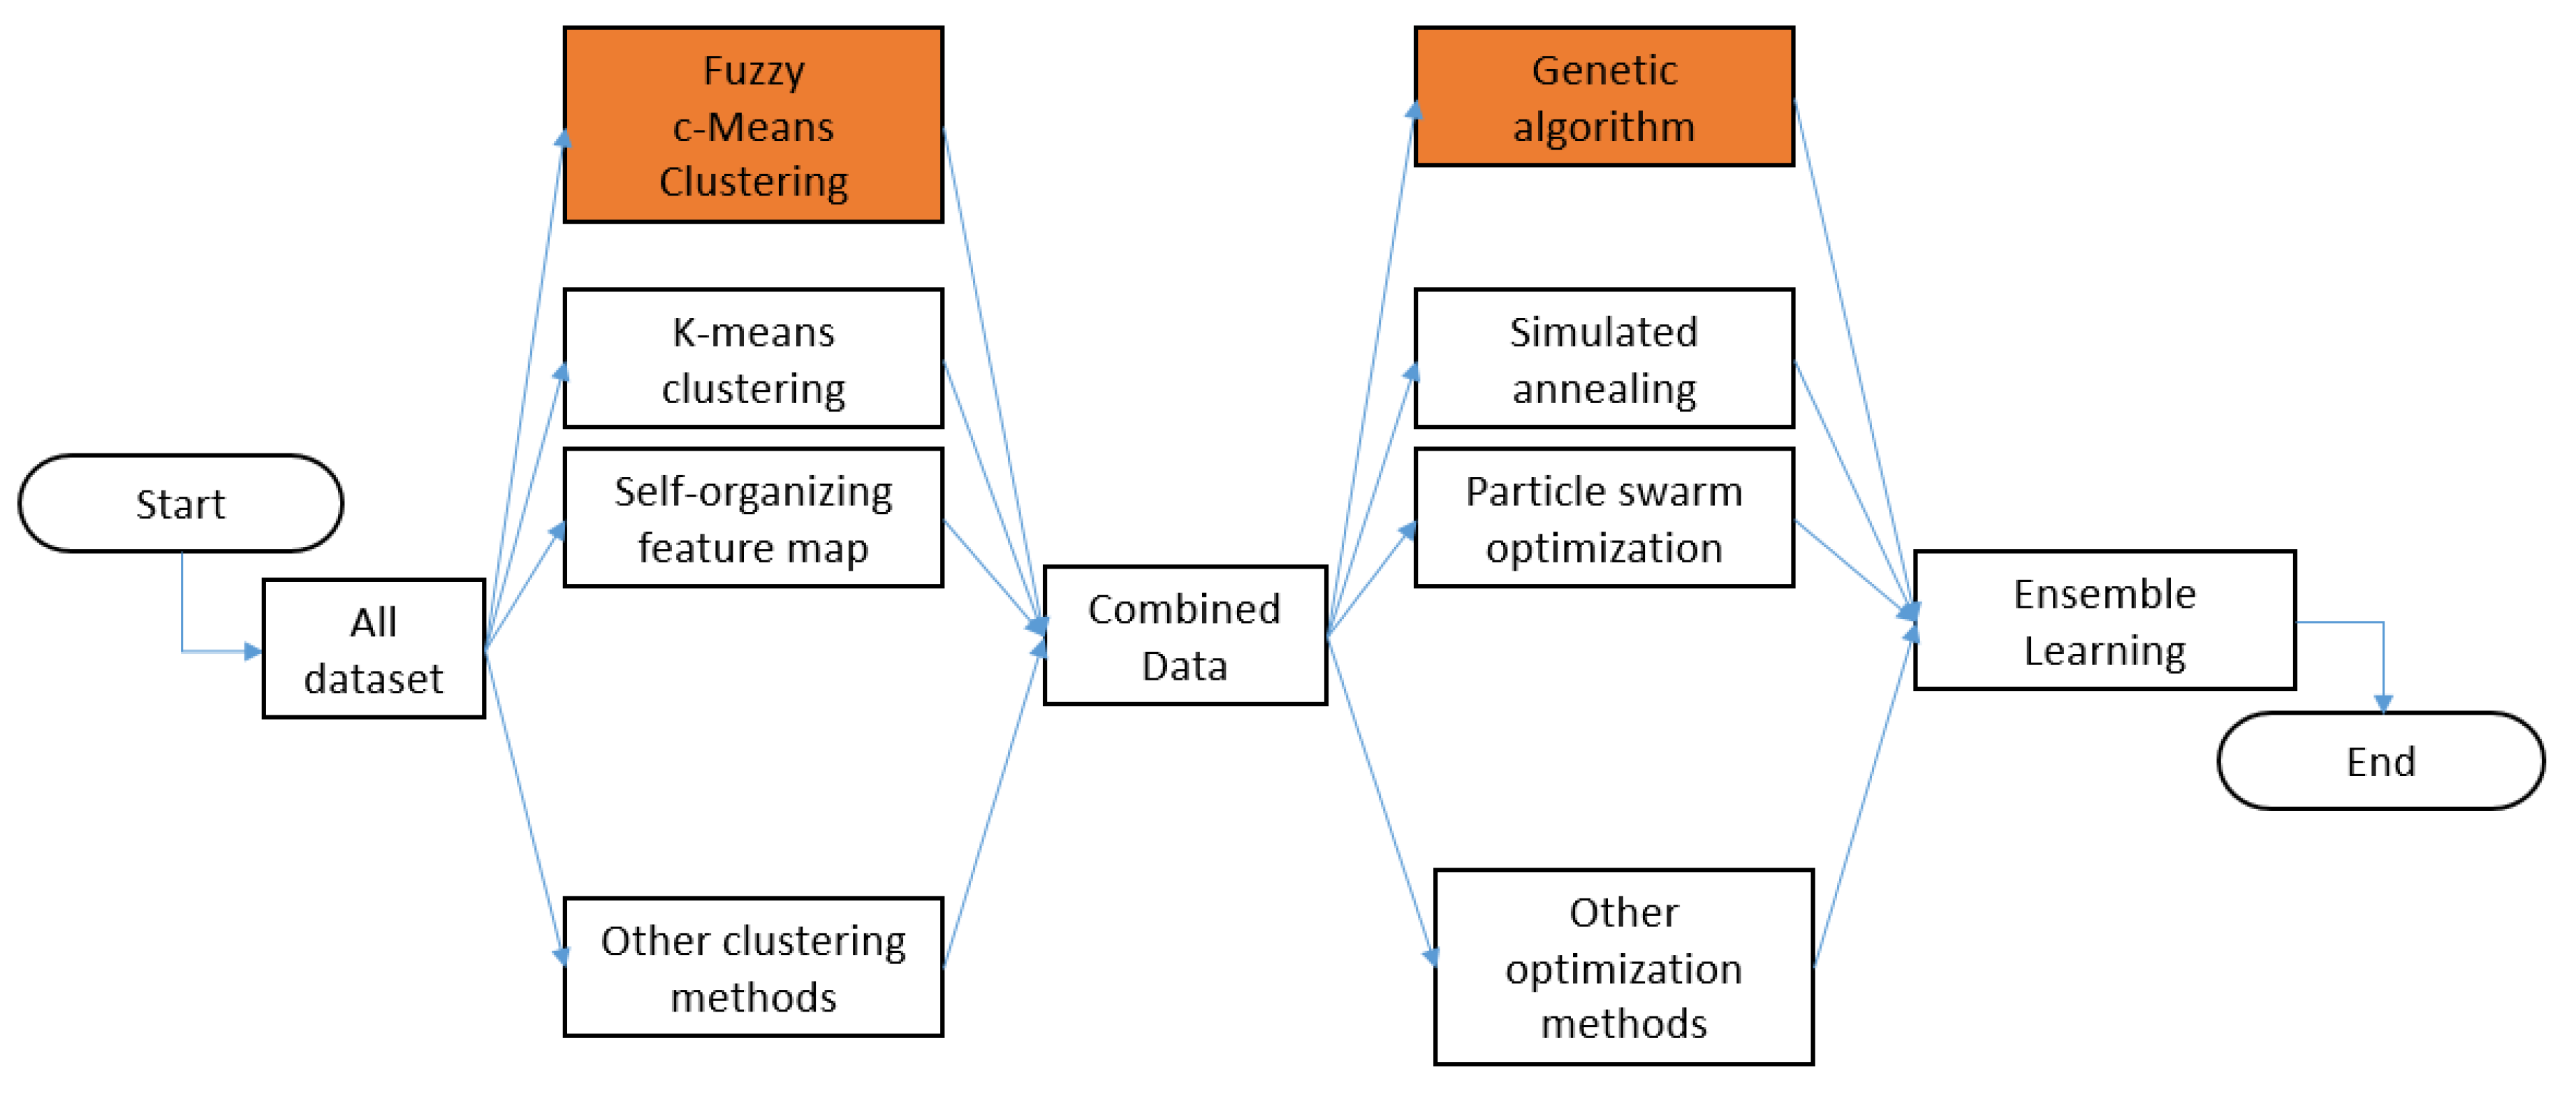
This study aims to predict the survival/nonsurvival rate from highly unbalanced emergency medical service data. An FCM algorithm is applied to equally separate the classes before the classification step. Furthermore, ANNs are utilized as a classifier in combination with a GA optimizer.

2. Materials and Methods

The utilized material is initially based on 4,552,880 cases from seven years—2007 to 2013—from the New Taipei city dataset. Important information is recorded by the EMS technicians. It contains the patient’s age, gender, time-interval-related information, trauma type, call reason, first aid, and injury type. However, in this study, only the age, gender, response time, on-scene time, and transportation time are used. The first preprocessing is done using data sorting. The age is sorted between 0 and 110 years old. The response time, on-scene time, and the transportation time are filtered according to a range of 1 to 180 min. The output is numbered either zero or one for nonsurvival and survival, respectively, upon arrival at the hospital. The data are divided into 50% for training and the remaining 50% for testing.

2.1. Fuzzy Clustering

According to Ross [38], FCM works based on the U matrix from a group of n datapoints to c classes using an objective function ( J m ) for the fuzzy c-partition.
J m ( U , V ) = k = 1 n i = 1 c ( μ i k ) m ( d i k ) 2
where
d i k =   d ( x k V i ) = [ j = 1 m ( x k j v i j ) 2 ] 1 / 2 .
The function μ i k is the membership function from the k th datapoint in the i th class. Meanwhile, d i k is the Euclidean distance from point xk to V i as the i th class center. It also can be described by the number of features ( m ) using the following:
v i j = k = 1 n μ i k m . x k j k = 1 n μ i k m
μ i k ( r + 1 ) = [ j = 1 c ( d i k ( r ) d j k ( r ) ) 1 / ( m 1 ) ] 1
where the stopping criterion is decided by the tolerance value ( ε L )
i f   || U ( r + 1 ) U ( r ) || ε L
where r is the iteration number.

2.2. Artificial Neural Network

ANN is one of the most well-known algorithms for classification. In this study, a backpropagation algorithm is utilized to train the ANN. The structure of the ANN is set for five inputs with three hidden layer units. The binary output is set for the classification to decide either the survival or the nonsurvival class. In order to generate diversity, the initial weights and the number of hidden layer neurons are set to be randomly selected numbers. The hyperbolic tangent sigmoid transfer function is set as the activation function of the ANN.

2.3. Genetic Algorithm

The GA works based on several steps. An initial random population containing chromosomes with a specific bit length is defined randomly. The most recent population can also be called the parent. A random population is evaluated using a fitness function that is usually used either for finding the minima or maxima. This procedure will rank the several best chromosomes to produce a better offspring by sorting their fitness values, either the lowest or the highest. This phenomenon works based on biological evolution.
After realizing better chromosomes, a one-point crossover is performed. This will separate the chromosome at one cutting point, dividing it into two portions. The best chromosomes will share their part with another half part from newly and randomly generated chromosomes. This will form other chromosomes with half from the selected chromosomes and another half with new sequence chromosomes. This procedure is applied to generate more diversity in the chromosomes to produce new generations. Further changes are made via mutation. Mutation is applied to shift the chromosome bits independently to others. The mutated bits are affected by the applied mutation rate.
The next step is to reapply the fitness function evaluation. These newly updated chromosomes act like initially and randomly defined chromosomes. The whole procedure will continue until the termination condition is accepted. A GA flowchart is shown in Figure 1.

2.4. Ensemble Model

The average ensemble method is used to combine the models’ predictions. The number of models activated is based on binary units. With the help of the confusion matrix shown in Table 1, the ensemble performance is investigated as illustrated in the following equations:
S e n s i t i v i t y   = T P ( T P + F N )
S p e c i f i c i t y   = T N ( T N + F P )
F a l s e   p o s i t i v e   r a t e = 1   S p e c i f i c i t y  
A U C = 1 + S e n s i t i f i t y F a l s e   p o s i t i v e   r a t e 2
A U C e = 1 n i = 1 n Y i
where A U C e is the ensemble area under the curve (AUC), n is the bit length, 1   < n < , and Y i is the output vector from which the models are activated.

2.5. Performance Evaluation

The performance evaluation is initiated by calculating the sensitivity and specificity. The sensitivity is a ratio of the survival class members correctly classified into the survival class to the total size of the survival class in the data. Similarly, the specificity is the ratio of the correctly classified nonsurvival class members into the nonsurvival class to the total size of the nonsurvival class. Meanwhile, with different threshold points to produce the sensitivity and specificity, the evaluation of the area under the curve (AUC) of the receiver operating characteristic (ROC) curve is estimated [39]. The calculations were conducted in MATLAB (MathWorks, Natick, MA, USA). The system was implemented using the following computational platform: Intel(R) Core(TM) i7-6700K CPU 4 GHz, 64-bit Operating System, and 32 GB DDR4 RAM.
In order to develop a high-quality model using the ensemble method, the models should be properly trained and evaluated. The ensemble genetic fuzzy neuro model (EGFNM) works by finding the optimum solution, evaluated by GA, by activating several single neural network models that are previously clustered by FCM; this can be seen in Figure 2. The EGFNM works by combining FCM for clustering, ANN for modelling, and GA for optimization. Starting with a severely unbalanced dataset, the training and the testing data are parted. The larger-sized class of the training dataset is clustered by FCM clustering. Then, the clustered data are selected randomly to form a new balanced dataset with the smaller class of data. Next, the balanced data are classified using ANN to form several models which are initiated with different ANN topologies. In order to form the ensemble, several models need to be activated. The activated models are used to produce the averaged result which is evaluated using the testing data set that is still in the severely unbalanced format. In addition, GA is utilized as an optimizer of the activation combination using the AUC as the fitness function.
The EGFNM can be classified into intra- and inter-cluster models. The intra-cluster EGFNM works by finding the best combination from several ANN models generated by different topologies in each cluster. This study uses eight randomly generated models from each cluster. This means that each cluster will have their own combination of the eight models as previously described to fit the testing data. On the other hand, the inter-cluster EGFNM has a slightly different working principle. In this method, the inter-cluster EGFNM of the nth cluster initially uses only the best model from the eight models from the nth cluster. This model will be one of the candidates to form the best combination from all of the cluster combinations. This process is similar to the intra-cluster EGFNM, except the models will correlate only to the best models from all of the clusters.

3. Results and Discussion

This study evaluates a big dataset relating to the emergency medical service. The first preprocessing step is to filter the age- and time-related parameters. The second filter is conducted using simple linguistic filtering. This filter is utilized to select data correlating the input and output based on how the input data correlates to the output results. Furthermore, an FCM clustering algorithm is performed in order to balance the dataset. The cross-validation-based ANN is selected as the classifier. The GA-based ensemble method is eventually performed to select the models based on the evaluation of the AUC.
Initially, this study evaluates highly unbalanced data from the emergency medical service. This system has about 100 to 1 data distribution from one class to another. The raw data after the first filter is used consists of 4,408,187 patient datapoints. Based on the data distribution, the second filter is applied. For the lower limit data, this works by removing the data less than the mean minus one standard deviation. Similarly, the higher limit data is also terminated by removing that which is more than the sum of the mean and three standard deviations. This second filter reduces the total amount of data to 3,129,733 cases. From the whole dataset, the portions corresponding to survival and nonsurvival are 3,103,387 and 26,346, respectively. The data is prepared for training and testing by taking half of each class (rounded)—1,551,693 datapoints from the survival class and 13,173 from the nonsurvival class are randomly selected. This strategy is utilized to investigate the performance of the ensemble technique after the training model.
In order to evaluate the behavior of the input parameters relative to the output from the large-set data class—the survival class—this study proposes simple linguistic terms by associating them with specific ranges of numbers. This evaluation uses five normalization units. For example, in the response time parameter, from having the original sequence between 3 and 20 min, the normalized unit will change to 1 to 5. The lowest to the highest units will be very short, short, normal, long, and very long. On other hand, for the age parameter, the linguistic terms are young, adult, middle-age, middle-old, and oldest-old. These linguistic terms are applied to normalize the training data with the purpose of avoiding unordinary input–output behavior.
After setting each linguistic parameter, the combination from all input parameters relating to the survival-only output is investigated. For example, how frequently will the combination of male middle-old patients with very short response time, short on-scene time, and normal transportation time result in survival? This algorithm will also filter the combinations that appear with low frequency. These possibilities are ranked based on the frequency with which they appear, as shown in Table 2. The best-ranked combination possibilities will correspond to the original dataset sequences. Furthermore, cumulative summation is performed to filter the data to about 95 percent of the original training data size for a total of 1,473,777 cases from the most frequent 328 combinations.
The clustering algorithm is performed sequentially for the best possibilities previously formed by the linguistic terms. In this study, the purpose of the data classification method is to make the bigger class close to the size of the smaller class—13,173 patient datapoints. For example, if the survival data is divided into ten clusters, each of the survival clusters will randomly send 1317 datapoints to make a total of 13,170 survival class members to form the new balanced training dataset.
For classification, the ANN is selected as the classifier. The structure of the ANN is designed to be a system with three hidden layers. In order to generate diversity, all of the hidden neurons are set randomly between five and fifty neurons with initial weights also randomly selected. Further, the backpropagation learning algorithm is applied. The output of the classification—either nonsurvival or survival—is normalized to zero or one, respectively.
The eight models are generated based on the cross-validation method. In this study, the testing data is held outside its evaluation for all the clusters. This benefits the ensemble performance estimator. As can be seen from Table 3, the 8-fold cross validation result performs with a relatively small standard deviation, showing good generalization.
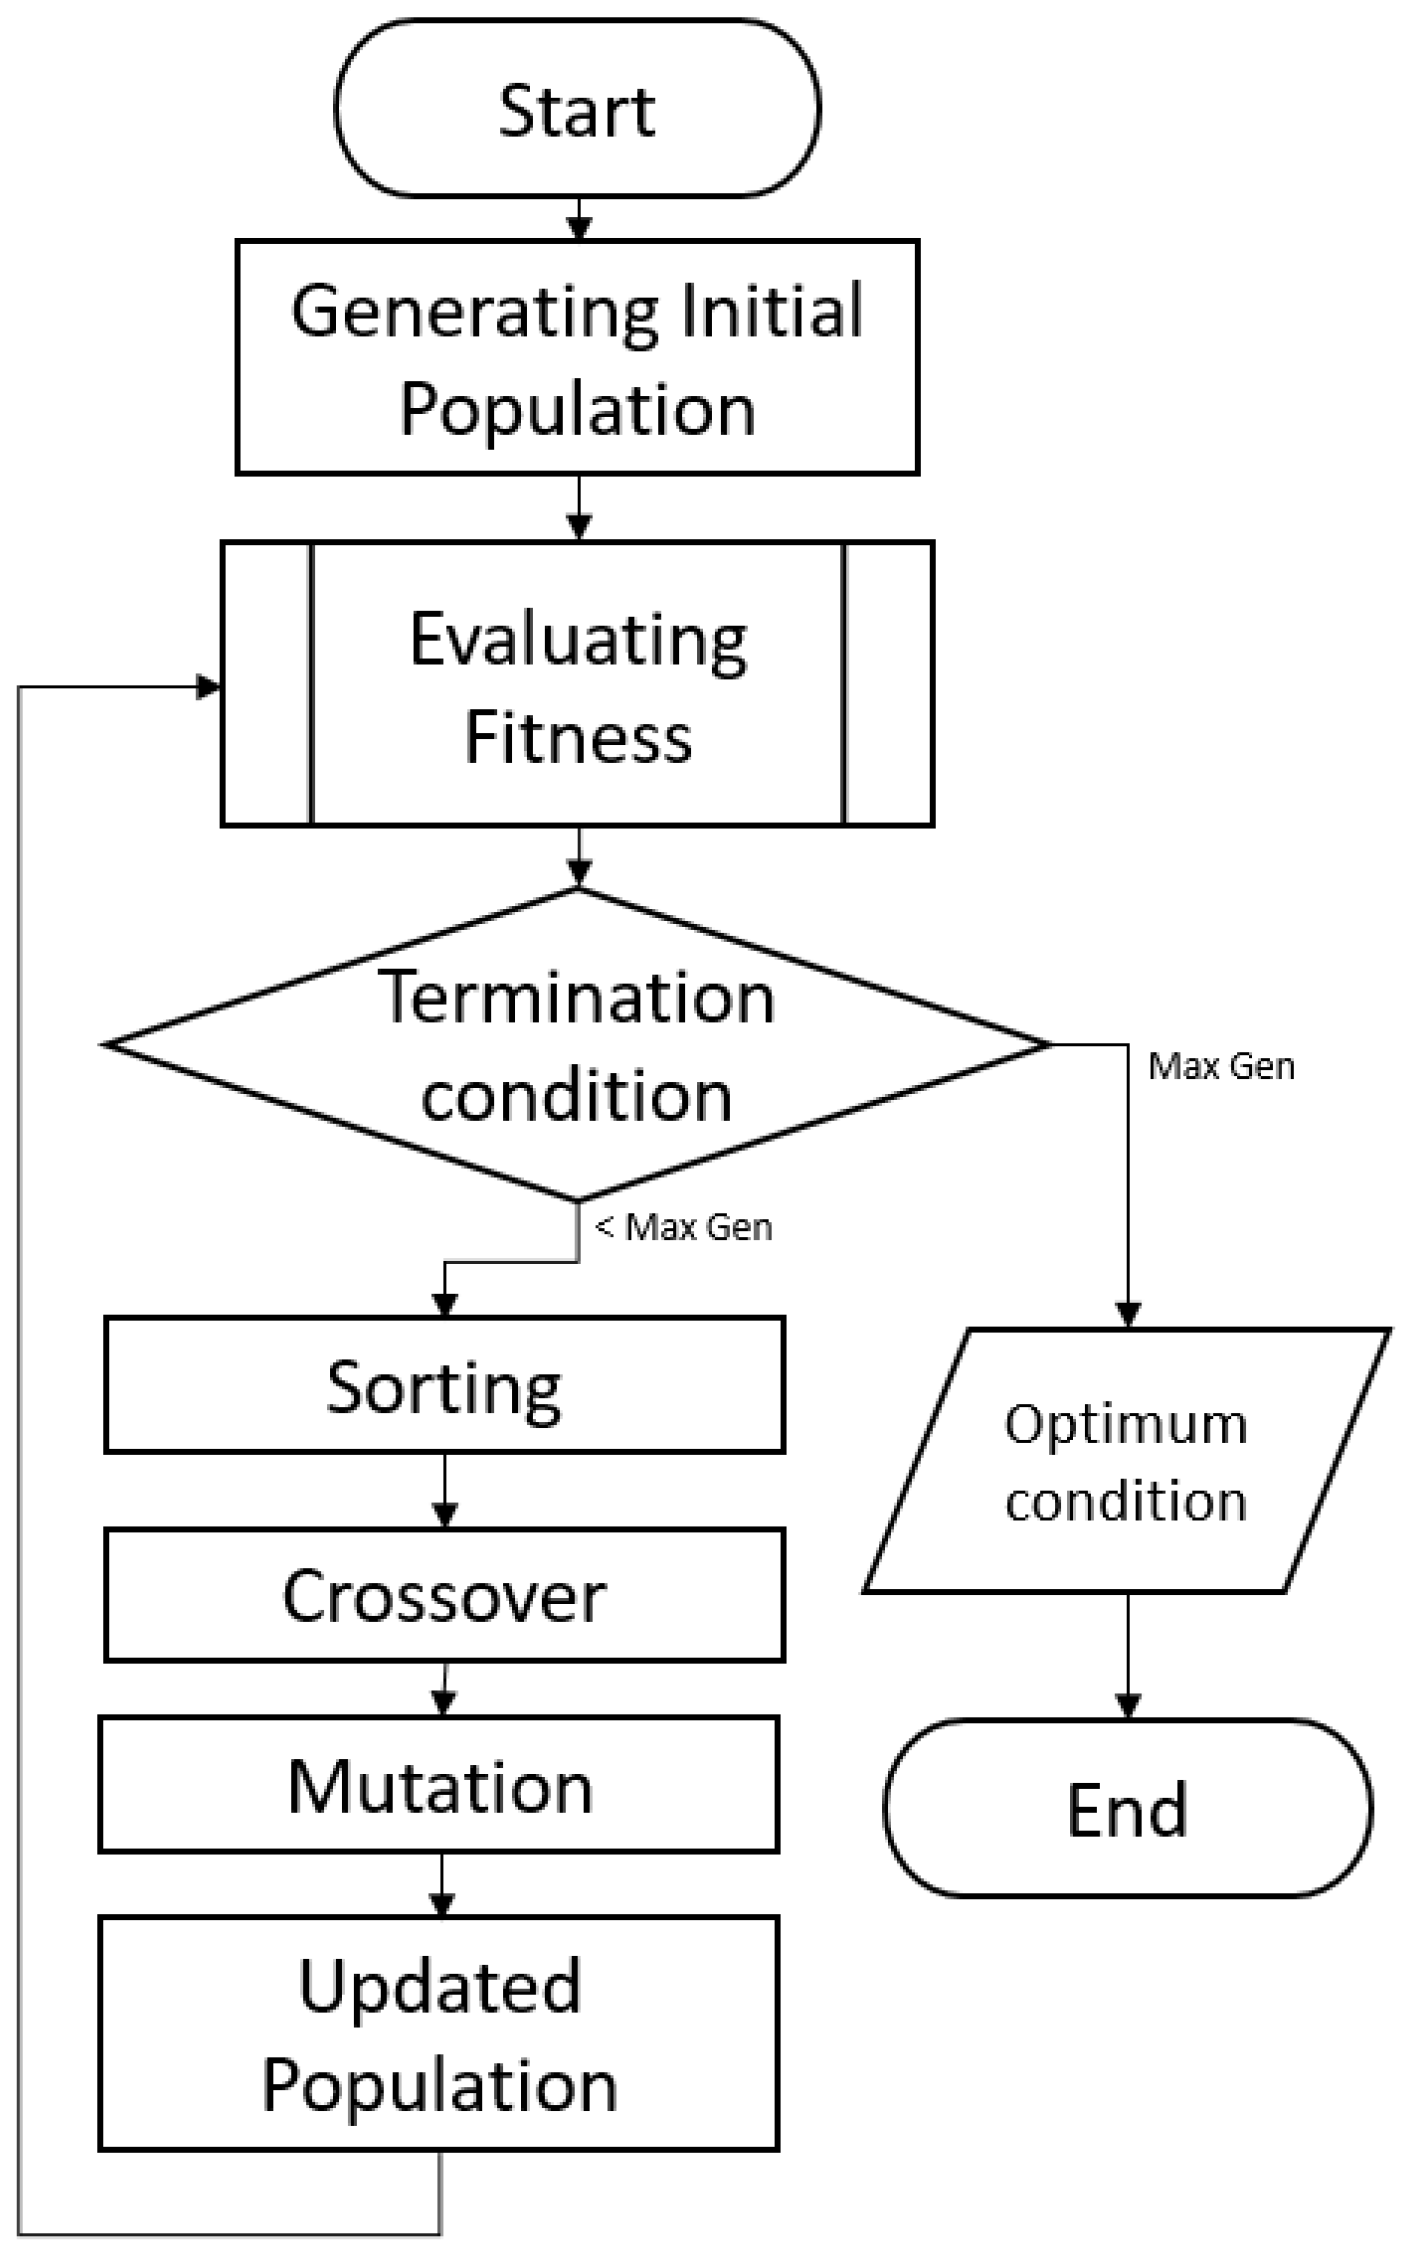
GA is applied with random initial activation of the models set as the chromosomes, generated by the single neural network. In this study, the chromosome length and the bit number are defined as the number of models. The AUC of the model is selected as the fitness function, with a higher AUC showing a better evaluation. The number of chromosomes is set to 4 for the reproduction. The highest and the second-highest AUC models will be stored for the crossover candidates. These two models will be the parents for the next new chromosomes with the addition of the randomly initiated chromosomes in the crossover step.
A single crossover point for the half part of the chromosome is used for the crossover system. In this study, this method will only change for the third and the fourth chromosomes—the randomly initiated chromosomes—for their half part. For example, the last four bits of the first chromosome will replace the first four bits of the third chromosome. Similarly, the last four bits from the second-best chromosome will replace the first four bits of the fourth-best chromosome.
After the crossover procedure, the mutation algorithm is applied. The mutation is generated by random integer, placing either a zero or one in the mutated chromosome bit. This method generates a chance for some bits to avoid being mutated bits. This study also evaluates two methods of mutation. The first one is the all chromosome mutation possibility, with a small mutation rate of 0.1, and another way is the leave-best-out mutation, which has a much greater mutation rate of 0.95.
The all chromosome mutation system works essentially with the possibility that all bits from all chromosomes can be mutated, whereas leave-best-out mutation works similar to the whole chromosome mutation with the exception of the best chromosome bits—those with the highest AUC—which withstand the mutation. This event will only be able to reshape the second to the last chromosome bits. This also means that no best chromosome bit will be mutated. This procedure has the purpose of holding the best chromosome as the highest ranking and also as the best parent for generating the next offspring.
The next procedure is the fitness function evaluation. If, after the crossover and mutation, there is any chromosome sorted by the AUC as better than the previous best chromosome, this new chromosome will be placed as the top chromosome and become a parent along with the second best; the second best can be the previous best model or one of the new randomly generated chromosomes. This situation highly likely generates a better offspring, due to the mating of the best parent chromosomes. The termination condition is set to 200 generations.
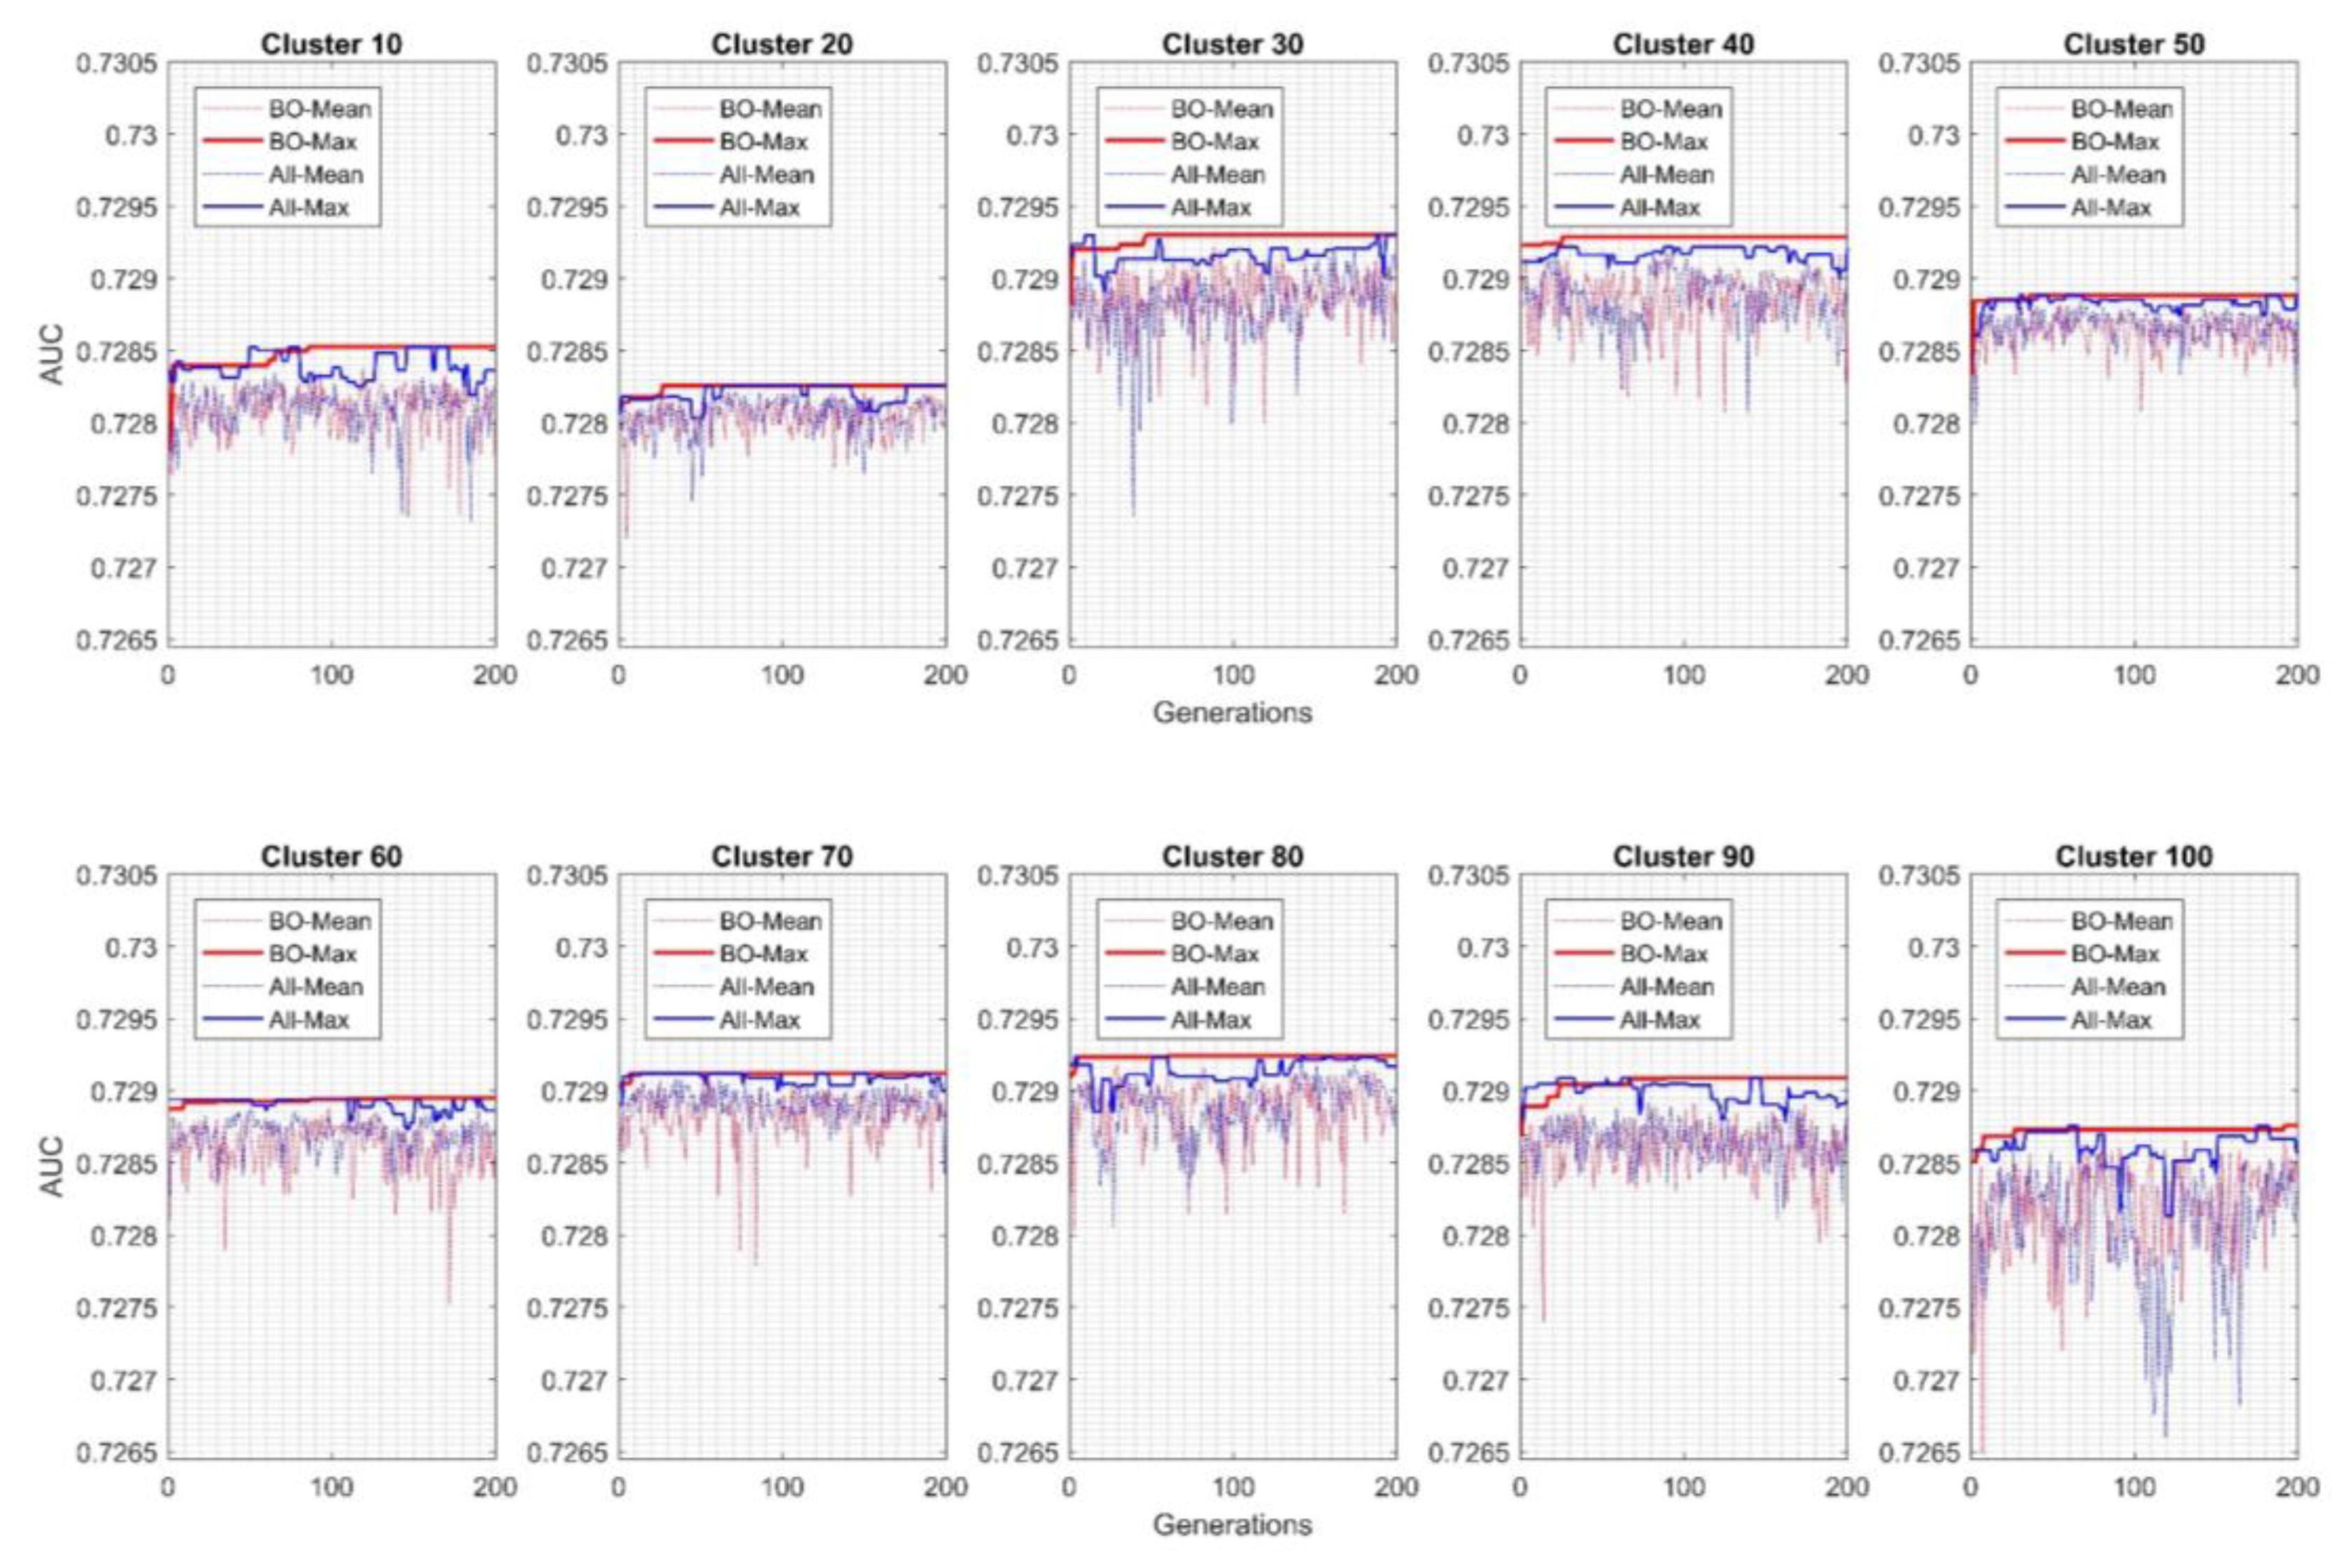
For results of intra-cluster EGFNM with different mutation rate systems are shown in Figure 3. The all chromosome mutation method in some clusters (10, 30, and 90) is faster in increasing the fitness function using the AUC compared with the leave-best-out method. However, the leave-best-out method provides better stability and accuracy for most of the cases. The cluster evaluation shows that Cluster 30 and Cluster 40 have the relative highest—yet similar—results. However, the AUC for Cluster 30 is slightly better.
Table 4 shows comparisons and details about the unbalanced, best single model, and the intra-cluster EGFNM results. It shows that the unbalanced AUC equals 0.67974, while the random cluster has 0.7177, and the best single model is a model for Cluster 40, marked in bold, with an AUC of 0.72806. Furthermore, the importance of applying GA as an optimizer is due to its ability to evaluate all possible solutions to decide which of them generates the best combination. For this study, the GA is set to have four population selections each with a chromosome length set to eight, an equal-part single-point crossover for the two highest AUC models, and a leave-best-out 95% mutation rate. As a result, the intra-cluster EGFNM, applying the GA-based method as the ensemble technique, produces the best result when four models from Cluster 30 are selected—namely, the second, third, fifth, and sixth out of eight models are activated—producing 0.7293 of the AUC, as shown underline in Table 4.
The evaluation of the inter-cluster EGFNM is described in the following. In order to have consistent evaluation, the inter-cluster EGFNM evaluation is also reduced to evaluate only eight clusters from the initial ten clusters. This means only the eight best clusters, excluding Clusters 10 and 20, are used in the ensemble models. The ANN structure of these models can be seen in Table 5.
Similarly, for the intra-cluster evaluation, the result shows that the combination of the best model from Clusters 30, 50, 60, 80, 90 and 100 produces the highest AUC of 0.73038. However, if all clusters are combined, the result is slightly reduced to 0.73037. This condition, as well the intra-cluster method, indicates that the best combination is not formed by combining the best models. Instead, some of the models will provide the best ensemble learner. This finding supports the study by Zhou et al., in 2002, which concluded that combining several models can generate a better result than combining all the models [32].
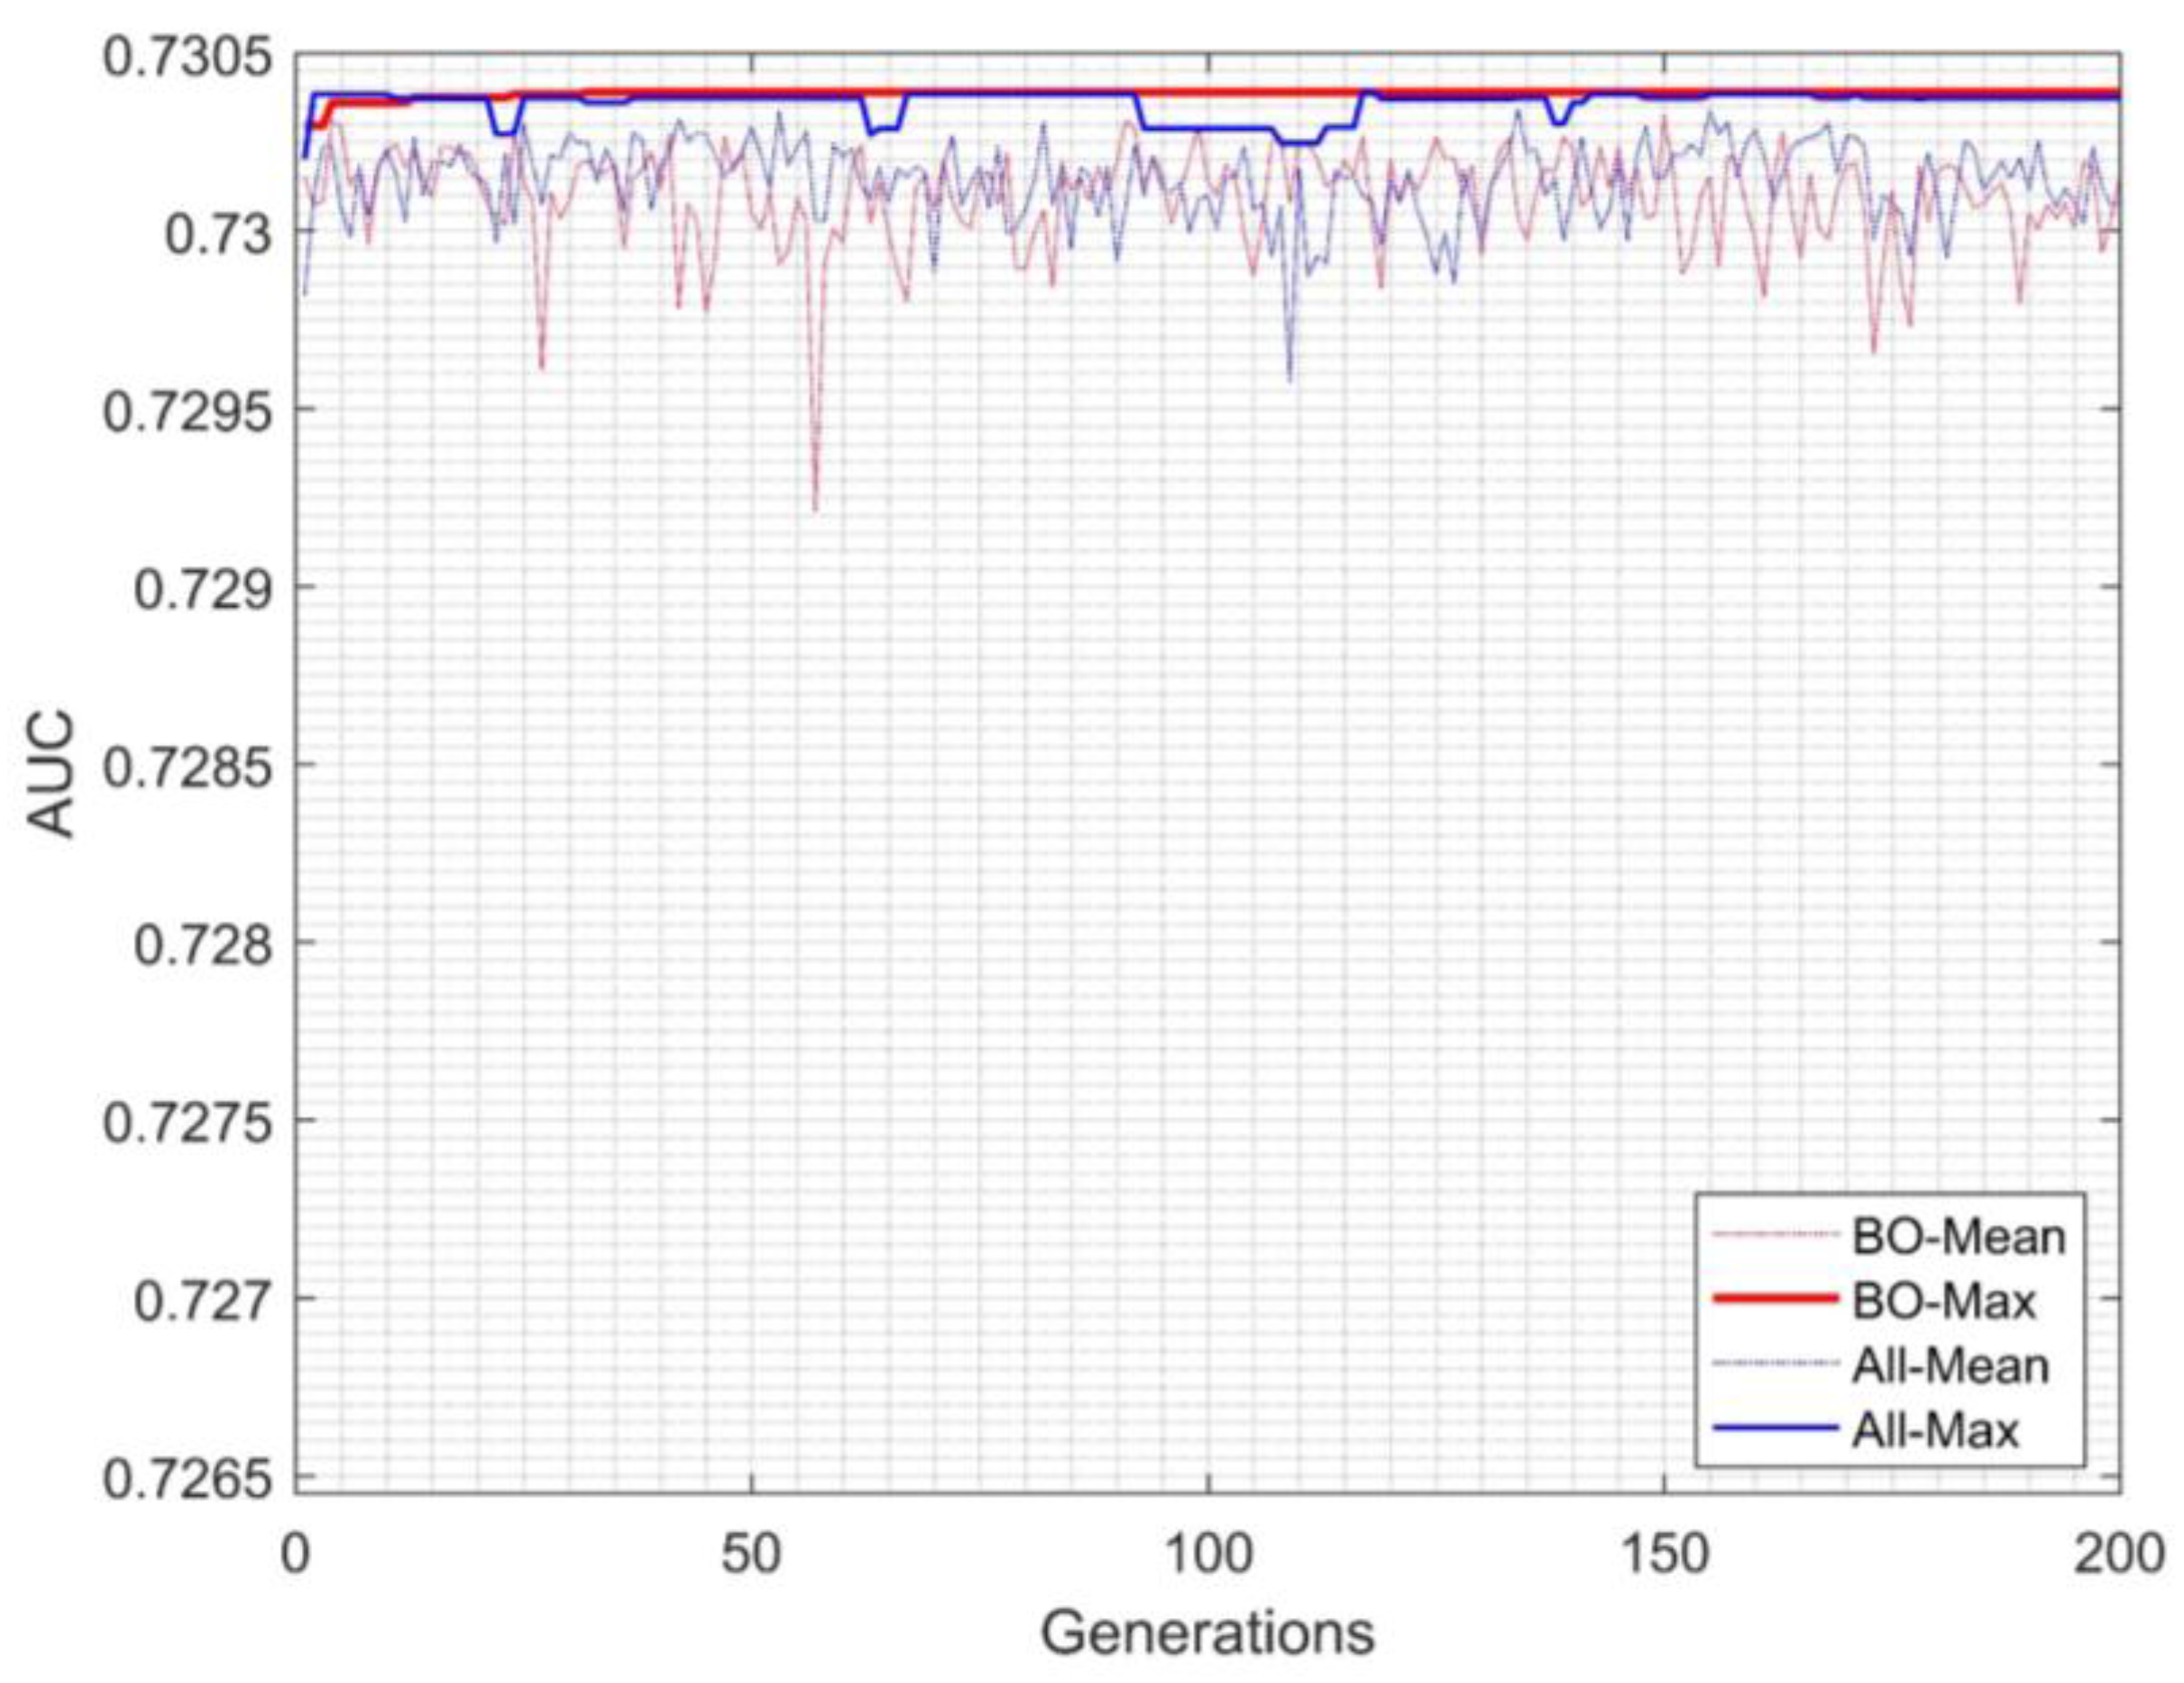
The inter-cluster EGFNM evaluation AUC for each generation with different mutation methods can be seen in Figure 4. As can be seen, the leave-best-out method also generates better accuracy and stability compared to the all chromosome mutation method.
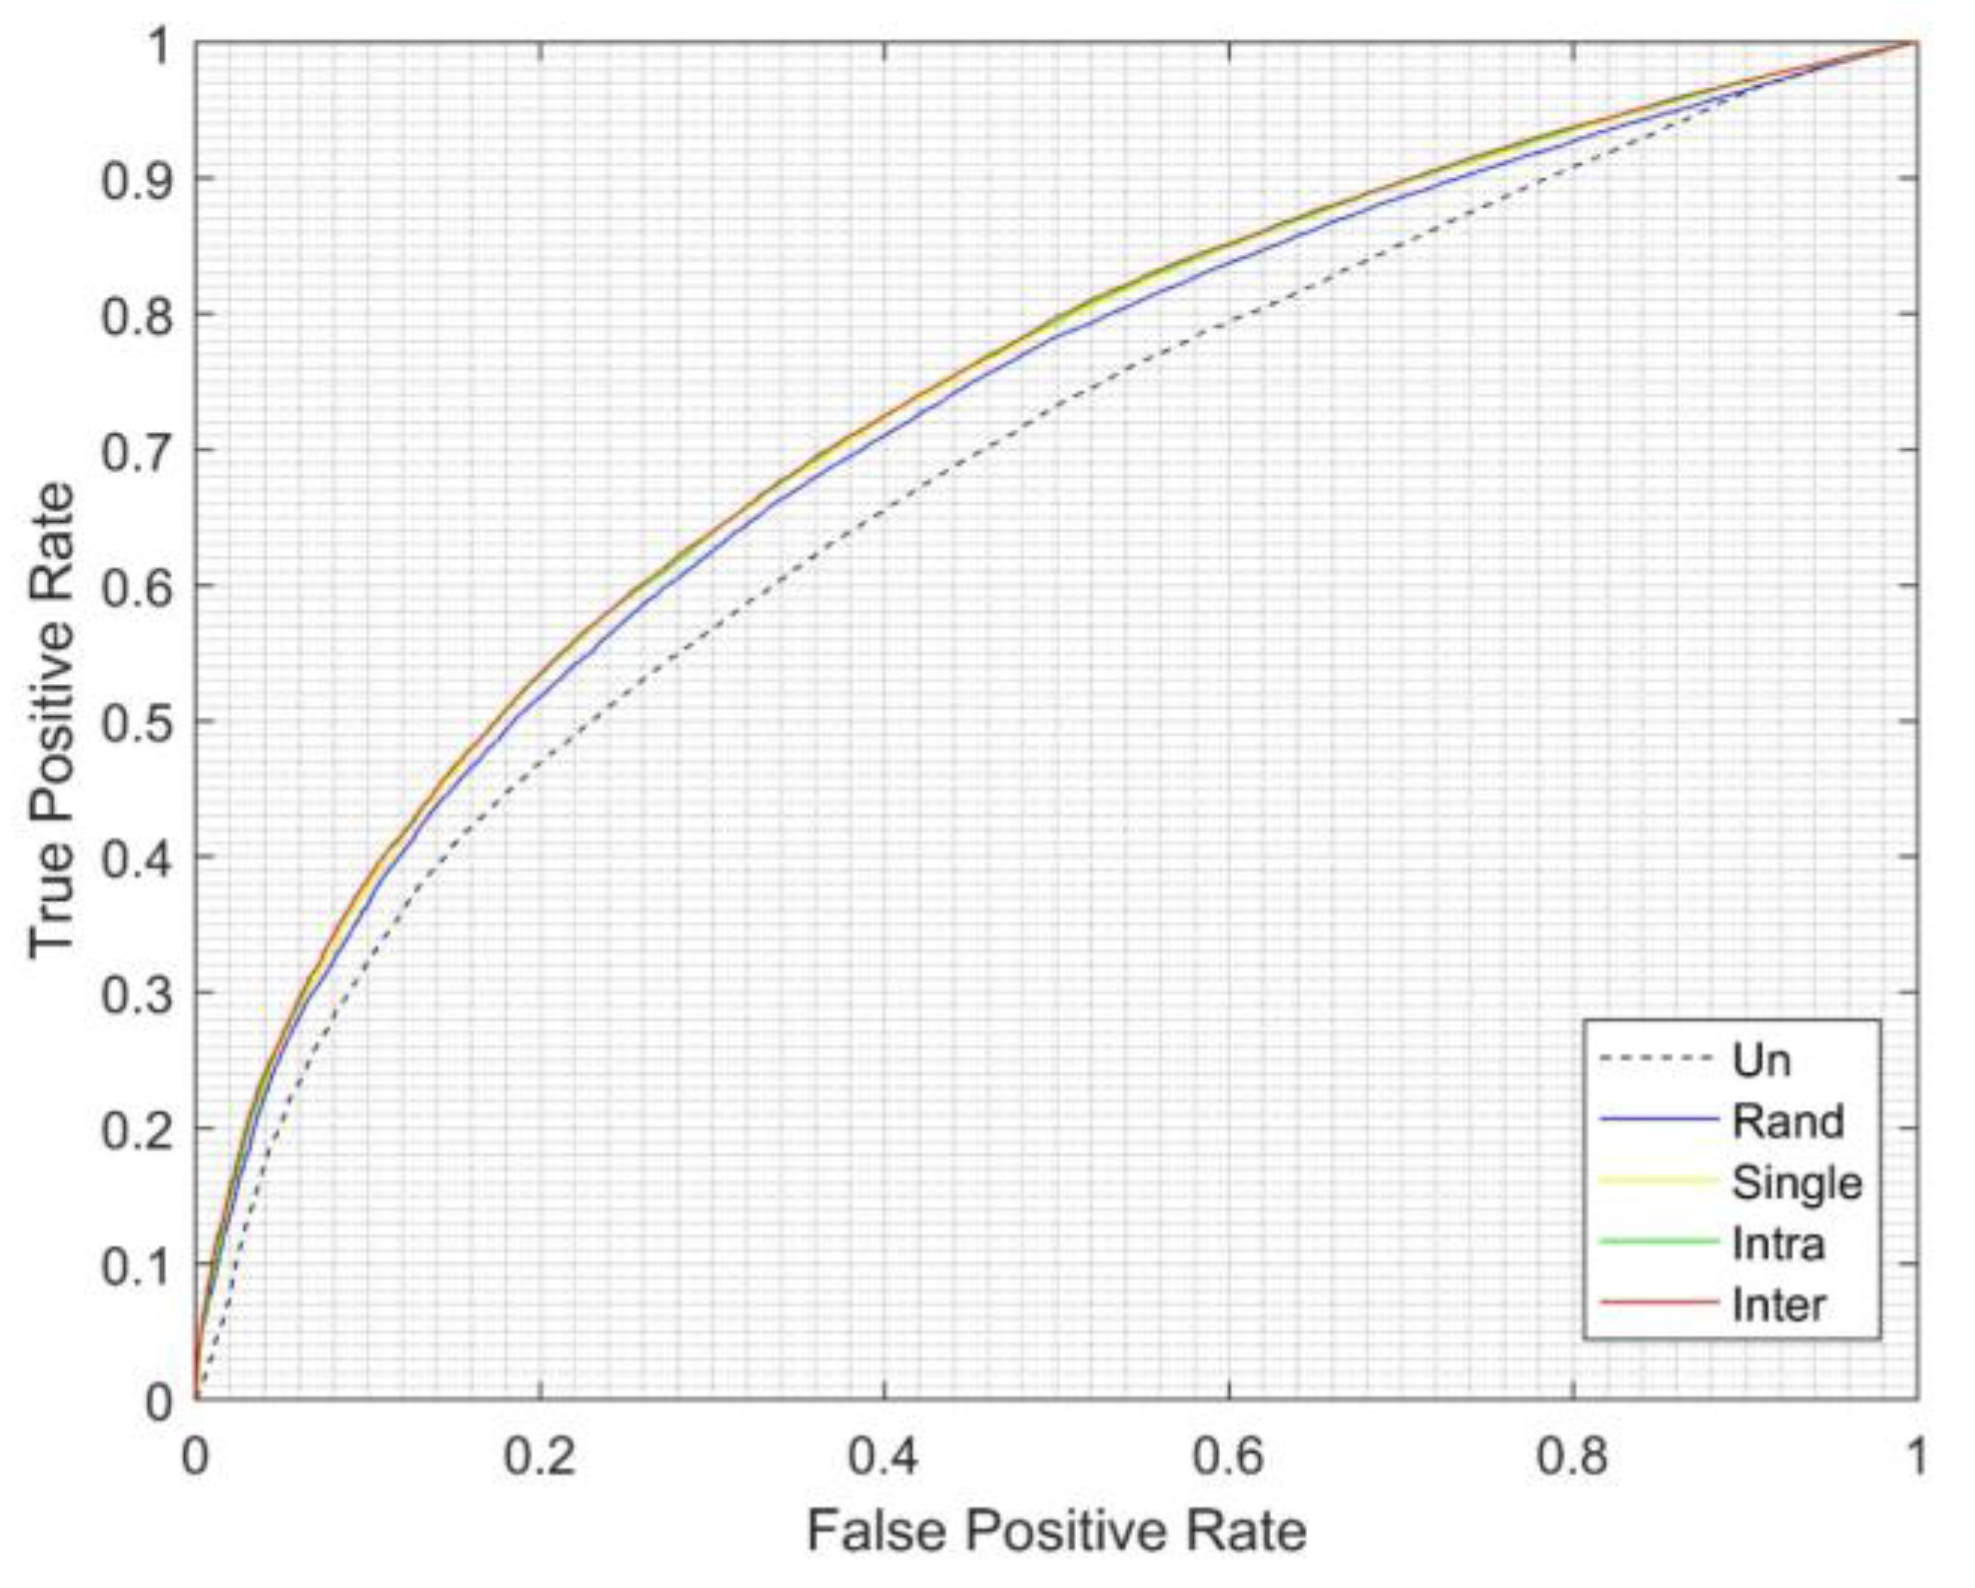
The entire ROC curves of the unbalanced, best single model, best intra-cluster EGFNM, and best inter-cluster EGFNM results are shown in Figure 5. The result shows that the clustering methods provide an improvement compared to the result from the unbalanced training. Further, the GA-based ensemble techniques show that inter-cluster EGFNM produces a better result compared with intra-cluster EGFNM.
In order to validate the optimum result produced by the EGFNM, a simple binary evaluation is created, called the binary-allocated model. This method will be used as the evaluation reference, due to the fact that the related method can evaluate all combination AUCs with no possibility of missing the best result. An evaluation of the binary system ensemble technique can be seen in Figure 6. For a simple visualization, a 5-bit combination system is shown. The activated model is marked by ‘1’, while the deactivated model marked by ‘0’. This system is similar to the EGFNM chromosome. As can be seen, there are 31 out of 32 possibilities for the ensemble models, excluding the first combination, ‘[0 0 0 0 0]’, where no model is activated. This figure also illustrates all combinations with the corresponding evaluation of the AUC results.
However, this method is computationally highly expensive when facing longer bit combinations. As shown in Figure 7, the trend of the line is increasing with longer combinations. This situation will consume huge amounts of physical computer memory in order to evaluate the best AUC possibility.
In this study, an 8-bit combination evaluation is used, and the validation procedure can be compared with 8-bit binary system ensemble evaluation. The EGFNM method is set to 200 generations. Table 6 shows the number of generations both for EGFNM intra- and inter-cluster models can reach the maximum AUC, as previously described in Table 2 for the intra-cluster EGFNM AUC, validating the results. It shows that within 100 generations, except for intra-cluster EGFNM Clusters 60 and 100, the models reach the optimum AUC achieved by the binary system evaluation. The inter-cluster evaluation uses only the eight best clustering models for the activation candidates.
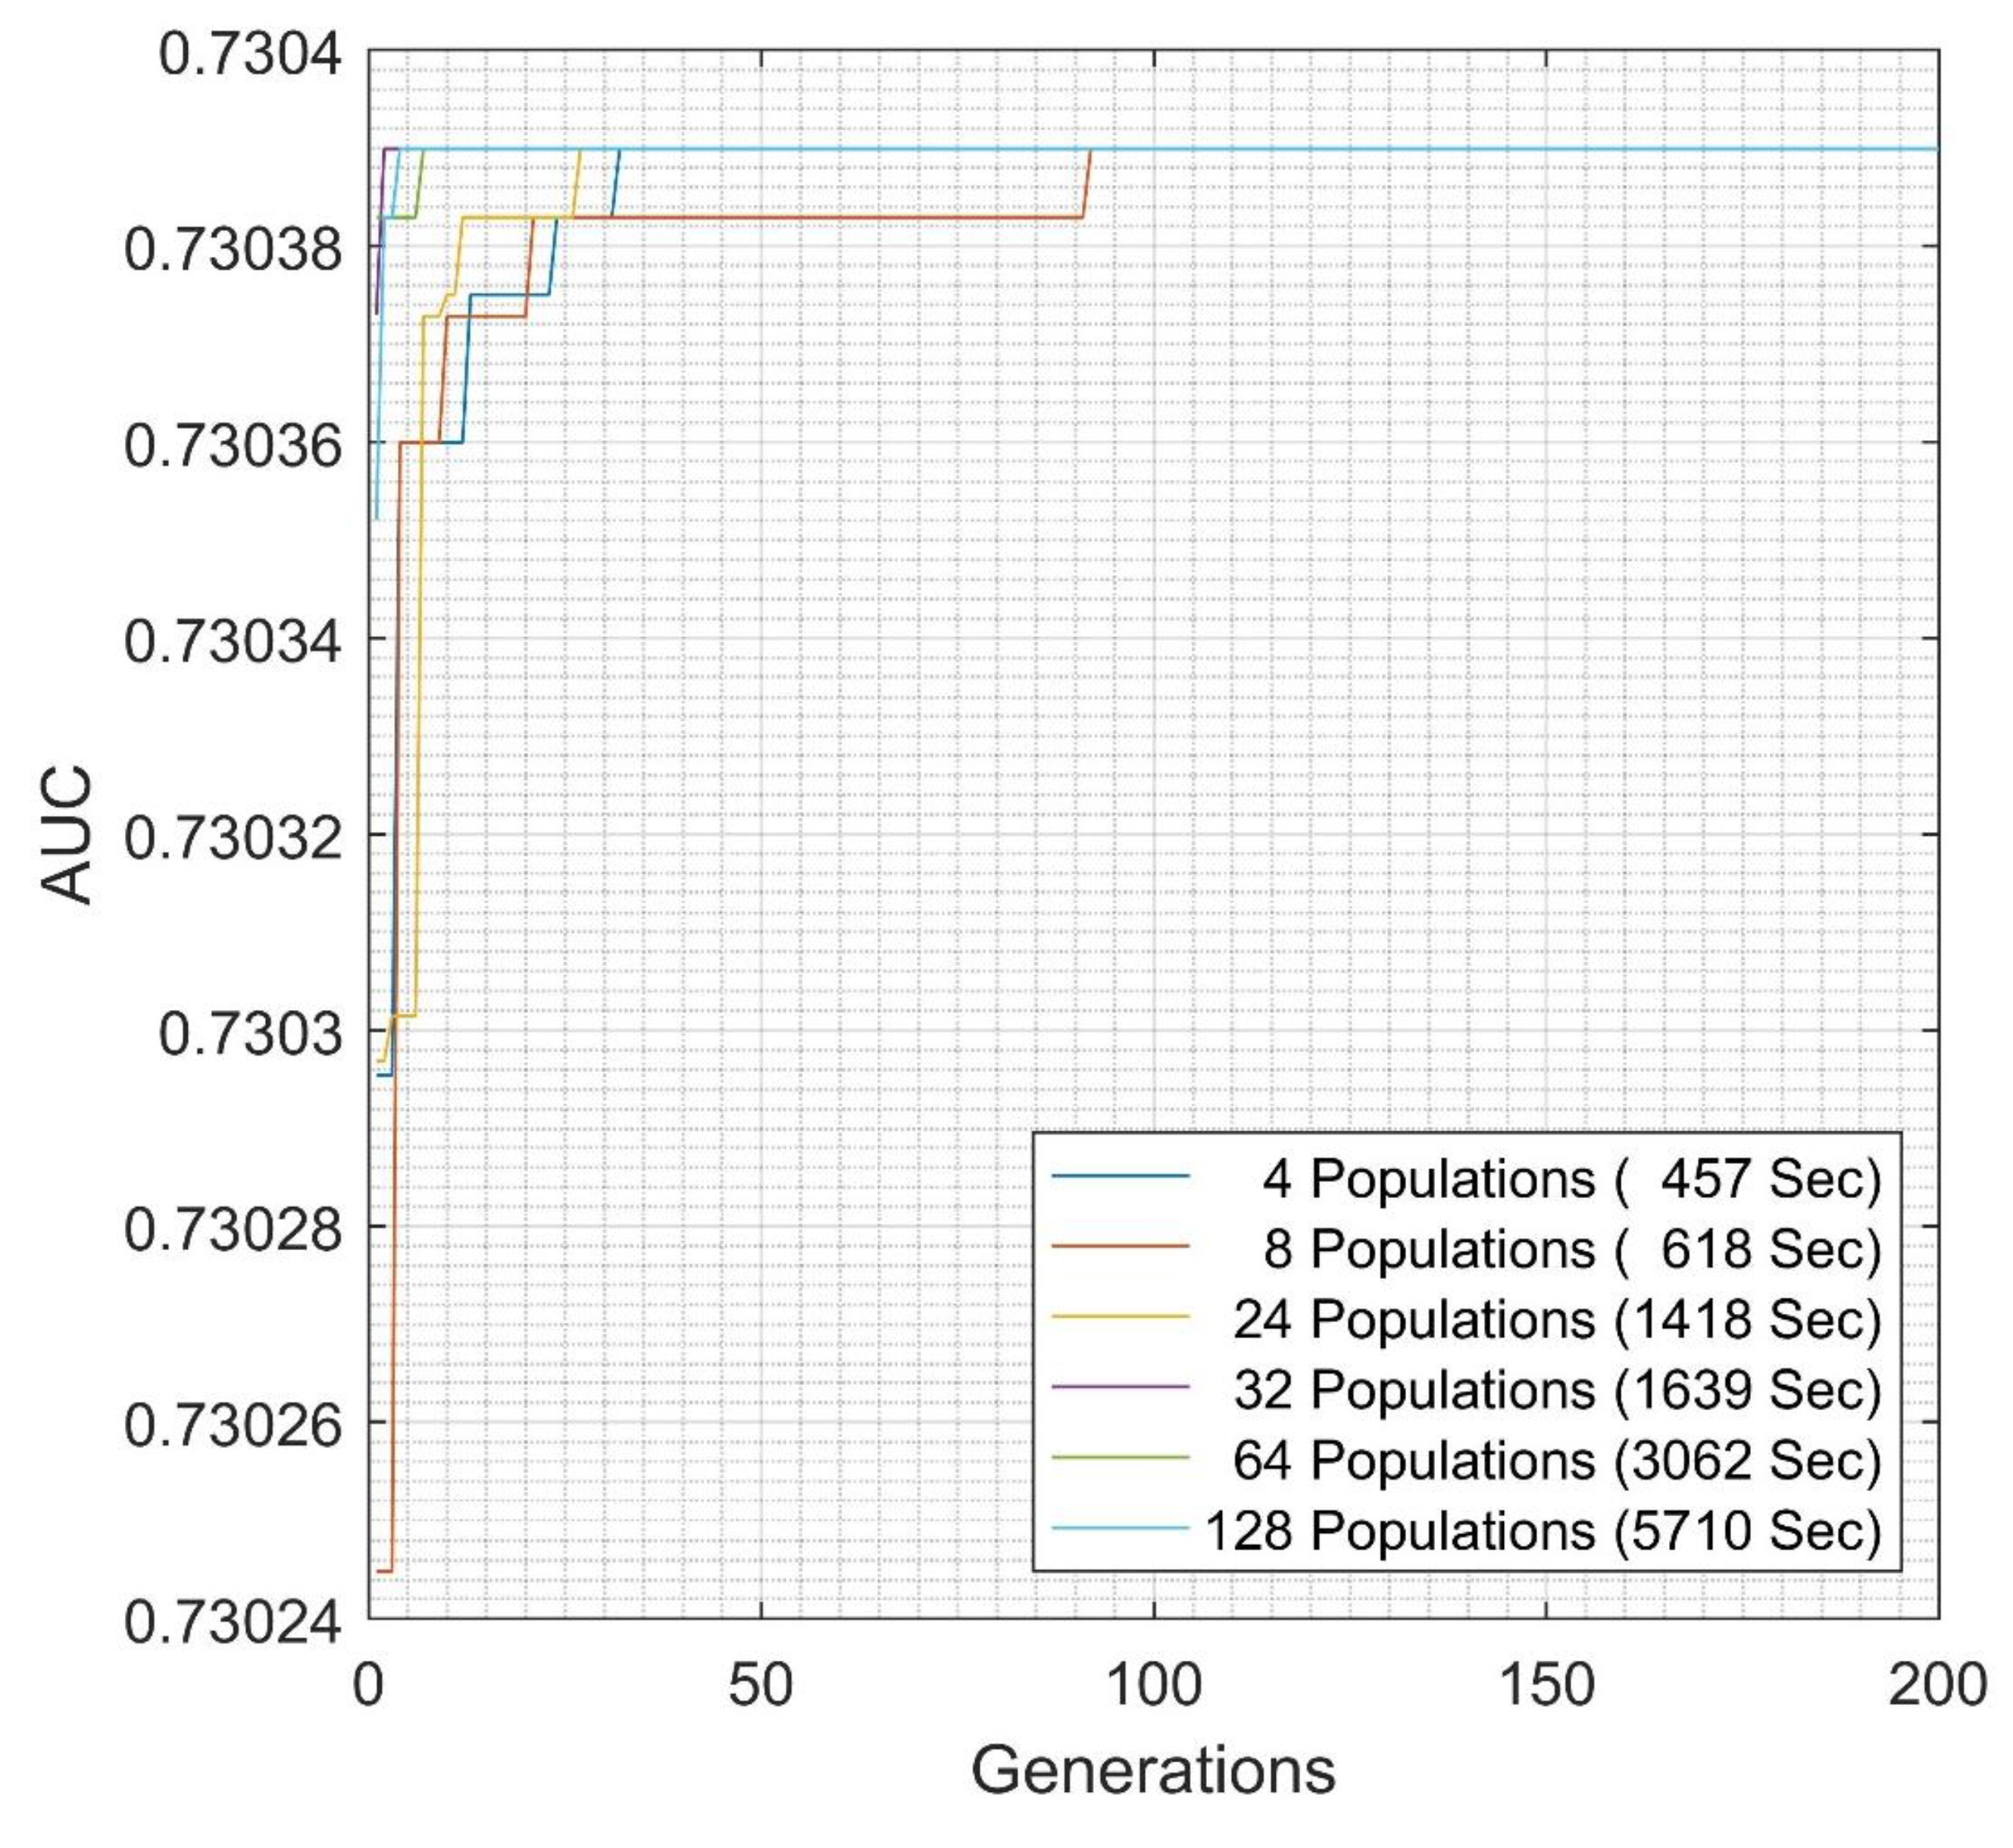
In order to evaluate the relationship between the population size, fitness function, and estimated time, several evaluations are conducted. As shown in Figure 8, it can be concluded that the higher populations in the evaluation give a higher chance to achieve the optimum fitness function with shorter generations. Preliminary population sizes of 32, 64 and 128 converge relatively earlier than when utilizing a population size of 4, 8, or 24. This condition will accelerate the model selection in the ensemble learning to the best combinations. Furthermore, the computational resources available will determine use of the binary system combination or ability to perform evaluation of larger populations. However, EGFNM works remarkably more efficiently in storing the data into memory compared with the binary combination when dealing with limited calculation resources.

4. Conclusions and Limitations

This study evaluates a highly unbalanced dataset relating to the emergency medical service. The FCM clustering algorithm improves the AUC of the classifier from the unbalanced training dataset. Further, the combination of FCM and GA-based ensemble techniques, the intra-cluster and inter-cluster EGFNM, has better results compared with the single best model. Finally, a comparison of the intra- and inter-cluster EGFNM shows that the inter-cluster EGFNM exceeds the intra-cluster EGFNM outcome. This study suggests that in an unbalanced data problem, different characteristics of the input that have the same output may need to be clustered before the training procedure. Further, the grouped data needs to be selected in order to produce the combination that gives the best generalization.
For practical application in the emergency medical service, based on the linguistic evaluation shown in Table 2, the time-related parameters are the most important to patient survival by as evaluated by frequency. However, with the relatively small amount of input parameters for predicting complex emergency medical service cases, further evaluations should be investigated.
Besides the small number of input parameters, this study has other limitations. A five-level stage system is used to normalize the original datasets. It may be better if the original data is normalized with a higher-level system. Another limitation is the cluster number classification. Even though this study tried several numbers of clusters, this way may not be the best way to decide the maximum clusters. Further, according to Wong et al. [40], an FCM-based algorithm has some disadvantages in selecting the amount of clusters and the initialization. Similar to GA, the selection of the population size may become another uncertainty, with the computational time increasing for higher population numbers.
The low evaluation result is another limitation, and may be the main limitation of this study. For comparison of survival rate prediction in the emergency medical service, a previous study conducted by Jiang et al., which utilized nearly four thousand datapoints with eleven parameters, shows that the accuracy varies from 68% to 89% [41]. The similarity to this study lies in the consideration of the on-scene time as their top four out of eleven parameters.
For future works, more advanced data filtering [42,43] should be applied. Furthermore, k-means clustering, self-organizing feature map, or other clustering methods can be utilized. Moreover, other optimization methods can be applied such as simulated annealing and particle swarm optimization in order to find the most efficient ANN ensemble algorithm selection, as shown in Figure 9.

Acknowledgments

This research is supported by Innovation Center for Big Data and Digital Convergence, Yuan Ze University, Taiwan. This research is also financially supported by the National Chung-Shan Institute of Science and Technology (NCSIST) (Grant number: XB06183P478PE-CS). We also acknowledge Chun-Yi Dai for his contribution in this paper.

Author Contributions

Muammar Sadrawi developed the algorithms and wrote the paper. Yu-Ting Yeh pre-processed the raw dataset, Wei-Zen Sun, Matthew Huei-Ming Ma, Maysam F. Abbod and Jiann-Shing Shieh evaluated and supervised the study.

Conflicts of Interest

The authors declare that there is no conflict of interest regarding the publication of this paper.

References

  1. He, H.; Garcia, E.A. Learning from imbalanced data. IEEE Trans. Knowl. Data Eng. 2009, 21, 1263–1284. [Google Scholar]
  2. Chawla, N.V.; Japkowicz, N.; Kotcz, A. Editorial: Special issue on learning from imbalanced data sets. ACM SIGKDD Explor. Newsl. 2004, 6, 1–6. [Google Scholar] [CrossRef]
  3. Wang, S.; Yao, X. Multi-class imbalance problems: Analysis and potential solutions. IEEE Trans. Syst. Man Cybern. Part B Cybern. 2012, 42, 1119–1130. [Google Scholar] [CrossRef] [PubMed]
  4. Provost, F.; Fawcett, T. Robust classification for imprecise environments. Mach. Learn. 2001, 42, 203–231. [Google Scholar] [CrossRef]
  5. Kubat, M.; Holte, R.C.; Matwin, S. Machine learning for the detection of oil spills in satellite radar images. Mach. Learn. 1998, 30, 195–215. [Google Scholar] [CrossRef]
  6. Ezawa, K.J.; Singh, M.; Norton, S.W. Learning goal oriented Bayesian networks for telecommunications risk management. In Proceedings of the ICML, Bari, Italy, 3–6 July 1996; pp. 139–147. [Google Scholar]
  7. Lewis, D.D.; Catlett, J. Heterogeneous uncertainty sampling for supervised learning. In Proceedings of the Eleventh International Conference on Machine Learning, New Brunswick, NJ, USA, 10–13 July 1994; pp. 148–156. [Google Scholar]
  8. Fawcett, T.; Provost, F. Adaptive fraud detection. Data Min. Knowl. Discov. 1997, 1, 291–316. [Google Scholar] [CrossRef]
  9. Zhou, B.; Yao, Y.; Luo, J. Cost-sensitive three-way email spam filtering. J. Intell. Inf. Syst. 2014, 42, 19–45. [Google Scholar] [CrossRef]
  10. Batista, G.E.; Prati, R.C.; Monard, M.C. A study of the behavior of several methods for balancing machine learning training data. ACM SIGKDD Explor. Newsl. 2004, 6, 20–29. [Google Scholar] [CrossRef]
  11. Cristianini, N.; Shawe-Taylor, J. An Introduction to Support Vector Machines; Cambridge University Press: Cambridge, UK, 2000. [Google Scholar]
  12. Chawla, N.V.; Bowyer, K.W.; Hall, L.O.; Kegelmeyer, W.P. SMOTE: Synthetic minority over-sampling technique. J. Artif. Intell. Res. 2002, 16, 321–357. [Google Scholar]
  13. Jain, A.K.; Murty, M.N.; Flynn, P.J. Data clustering: A review. ACM Comput. Surv. CSUR 1999, 31, 264–323. [Google Scholar] [CrossRef]
  14. Liu, Y.; Hou, T.; Liu, F. Improving fuzzy c-means method for unbalanced dataset. Electron. Lett. 2015, 51, 1880–1882. [Google Scholar] [CrossRef]
  15. Zhou, B.; Ha, M.; Wang, C. An improved algorithm of unbalanced data SVM. In Fuzzy Information and Engineering; Springer: Berlin/Heidelberg, Germany, 2010; pp. 549–555. [Google Scholar]
  16. Kocyigit, Y.; Seker, H. Imbalanced data classifier by using ensemble fuzzy c-means clustering. In Proceedings of the 2012 IEEE-EMBS International Conference on Biomedical and Health Informatics (BHI), Hong Kong, China, 5–7 January 2012; pp. 952–955. [Google Scholar]
  17. Yazdani-Chamzini, A.; Zavadskas, E.K.; Antucheviciene, J.; Bausys, R. A Model for Shovel Capital Cost Estimation, Using a Hybrid Model of Multivariate Regression and Neural Networks. Symmetry 2017, 9, 298. [Google Scholar] [CrossRef]
  18. Yazdani-Chamzini, A.; Yakhchali, S.H.; Volungevičienė, D.; Zavadskas, E.K. Forecasting gold price changes by using adaptive network fuzzy inference system. J. Bus. Econ. Manag. 2012, 13, 994–1010. [Google Scholar] [CrossRef]
  19. Geman, S.; Bienenstock, E.; Doursat, R. Neural networks and the bias/variance dilemma. Neural Comput. 1992, 4, 1–58. [Google Scholar] [CrossRef]
  20. Xie, B.; Liang, Y.; Song, L. Diverse Neural Network Learns True Target Functions. In Proceedings of the 20th International Conference on Artificial Intelligence and Statistics, Fort Lauderdale, FL, USA, 20–22 April 2017; pp. 1216–1224. [Google Scholar]
  21. Wang, S.; Yao, X. Diversity analysis on imbalanced data sets by using ensemble models. In Proceedings of the IEEE Symposium on Computational Intelligence and Data Mining (CIDM’09), Nashville, TN, USA, 30 March–2 April 2009; pp. 324–331. [Google Scholar]
  22. Cunningham, P.; Carney, J. Diversity versus quality in classification ensembles based on feature selection. In Proceedings of the European Conference on Machine Learning, Barcelona, Spain, 31 May–2 June 2000; Springer: Berlin/Heidelberg, Germany, 2000; pp. 109–116. [Google Scholar]
  23. Krogh, A.; Vedelsby, J. Neural network ensembles, cross validation, and active learning. Adv. Neural Inf. Process. Syst. 1995, 7, 231–238. [Google Scholar]
  24. Brown, G.; Wyatt, J.; Harris, R.; Yao, X. Diversity creation methods: A survey and categorization. Inf. Fusion 2005, 6, 5–20. [Google Scholar] [CrossRef]
  25. Tumer, K.; Ghosh, J. Theoretical Foundations of Linear and Order Statistics Combiners for Neural Pattern Classifiers. Available online: http://citeseerx.ist.psu.edu/viewdoc/download?doi=10.1.1.36.3954&rep=rep1&type=pdf (accessed on 10 January 2018).
  26. Xu, L.; Krzyzak, A.; Suen, C.Y. Methods of combining multiple classifiers and their applications to handwriting recognition. IEEE Trans. Syst. Man Cybern. 1992, 22, 418–435. [Google Scholar] [CrossRef]
  27. Ho, T.K.; Hull, J.J.; Srihari, S.N. Decision combination in multiple classifier systems. IEEE Trans. Pattern Anal. Mach. Intell. 1994, 16, 66–75. [Google Scholar]
  28. Kittler, J.; Hatef, M.; Duin, R.P.; Matas, J. On combining classifiers. IEEE Trans. Pattern Anal. Mach. Intell. 1998, 20, 226–239. [Google Scholar] [CrossRef]
  29. Galar, M.; Fernandez, A.; Barrenechea, E.; Bustince, H.; Herrera, F. A review on ensembles for the class imbalance problem: Bagging-, boosting-, and hybrid-based approaches. IEEE Trans. Syst. Man Cybern. Part C Appl. Rev. 2012, 42, 463–484. [Google Scholar] [CrossRef]
  30. Galar, M.; Fernández, A.; Barrenechea, E.; Herrera, F. EUSBoost: Enhancing ensembles for highly imbalanced data-sets by evolutionary undersampling. Pattern Recognit. 2013, 46, 3460–3471. [Google Scholar] [CrossRef]
  31. Sanz, J.; Paternain, D.; Galar, M.; Fernandez, J.; Reyero, D.; Belzunegui, T. A new survival status prediction system for severe trauma patients based on a multiple classifier system. Comput. Methods Programs Biomed. 2017, 142, 1–8. [Google Scholar] [CrossRef] [PubMed]
  32. Zhou, Z.H.; Wu, J.; Tang, W. Ensembling neural networks: Many could be better than all. Artif. Intell. 2002, 137, 239–263. [Google Scholar] [CrossRef]
  33. Hornby, G.S.; Globus, A.; Linden, D.S.; Lohn, J.D. Automated antenna design with evolutionary algorithms. In Proceedings of the AIAA Space, San Jose, CA, USA, 19–21 September 2006; pp. 19–21. [Google Scholar]
  34. De Araújo Padilha, C.A.; Barone, D.A.C.; Neto, A.D.D. A multi-level approach using genetic algorithms in an ensemble of Least Squares Support Vector Machines. Knowl. Based Syst. 2016, 106, 85–95. [Google Scholar] [CrossRef]
  35. Haque, M.N.; Noman, N.; Berretta, R.; Moscato, P. Heterogeneous ensemble combination search using genetic algorithm for class imbalanced data classification. PLoS ONE 2016, 11, e0146116. [Google Scholar] [CrossRef] [PubMed]
  36. Chen, A.Y.; Lu, T.Y.; Ma, M.H.M.; Sun, W.Z. Demand Forecast Using Data Analytics for the Preallocation of Ambulances. IEEE J. Biomed. Health Inform. 2016, 20, 1178–1187. [Google Scholar] [CrossRef] [PubMed]
  37. Shieh, J.S.; Yeh, Y.T.; Sun, Y.Z.; Ma, M.H.; Dia, C.Y.; Sadrawi, M.; Abbod, M. Big Data Analysis of Emergency Medical Service Applied to Determine the Survival Rate Effective Factors and Predict the Ambulance Time Variables. In Proceedings of the ISER 50th International Conference, Tokyo, Japan, 29 January 2017. [Google Scholar]
  38. Ross, T.J. Fuzzy Logic with Engineering Applications; John Wiley & Sons: Hoboken, NJ, USA, 2009. [Google Scholar]
  39. Bradley, A.P. The use of the area under the ROC curve in the evaluation of machine learning algorithms. Pattern Recognit. 1997, 30, 1145–1159. [Google Scholar] [CrossRef] [Green Version]
  40. Wong, C.C.; Chen, C.C.; Su, M.C. A novel algorithm for data clustering. Pattern Recognit. 2001, 34, 425–442. [Google Scholar] [CrossRef]
  41. Jiang, Y.J.; Ma, M.H.M.; Sun, W.Z.; Chang, K.W.; Abbod, M.F.; Shieh, J.S. Ensembled neural networks applied to modeling survival rate for the patients with out-of-hospital cardiac arrest. Artif. Life Robot. 2012, 17, 241–244. [Google Scholar] [CrossRef]
  42. Qiu, J.; Wei, Y.; Karimi, H.R.; Gao, H. Reliable control of discrete-time piecewise-affine time-delay systems via output feedback. IEEE Trans. Reliab. 2018, 67, 79–91. [Google Scholar] [CrossRef]
  43. Qiu, J.; Wei, Y.; Wu, L. A novel approach to reliable control of piecewise affine systems with actuator faults. IEEE Trans. Circuits Syst. II Express Briefs 2017, 64, 957–961. [Google Scholar] [CrossRef]
Figure 1. Flowchart of the genetic algorithm.
Symmetry 10 00071 g001
Figure 2. The flowchart of ensemble genetic fuzzy neuro ensemble model.
Symmetry 10 00071 g002
Figure 3. The intra-cluster ensemble genetic fuzzy neuro model (EGFNM) evaluation with comparison of the mutation methods. (BO-Mean = Best-Out chromosome mean, BO-Max = Best-Out chromosome maxima, All-Mean = All chromosome mean, All-Max = All chromosome maxima.)
Symmetry 10 00071 g003
Figure 4. Inter-cluster EGFNM evaluation. (BO-Mean = Best-Out chromosome mean, BO-Max = Best-Out chromosome maxima, All-Mean = All chromosome mean, All-Max = All chromosome maxima.)
Symmetry 10 00071 g004
Figure 5. The entire receiver operating characteristic (ROC) curves. (Un = Unbalanced, Rand = Random, Single = Best Single, Intra = Intra-cluster EGFNM, Inter = Inter-cluster EGFNM.)
Symmetry 10 00071 g005
Figure 6. Binary system combinations with the corresponding AUC evaluations.
Symmetry 10 00071 g006
Figure 7. Binary system evaluation of the AUC relative to the number of bits.
Symmetry 10 00071 g007
Figure 8. The population size effect on iteration number and AUC.
Symmetry 10 00071 g008
Figure 9. Future work using different clustering and optimization methods.
Symmetry 10 00071 g009
Table 1. Confusion matrix of two-class classification.
Prediction
Positive Negative
ReferencePositiveTrue Positive (TP)False Negative (FN)
NegativeFalse Positive (FP)True Negative (TN)
Table 2. The most frequent training dataset combinations from the linguistic evaluation.
Best Comb.AgeGenderReaction TimeOn-Scene TimeTransportation TimeFrequency
1Middle-AgeMaleVery ShortVery ShortVery Short65,039
2AdultMaleVery ShortVery ShortVery Short62,790
3AdultFemaleVery ShortVery ShortVery Short57,455
4Middle-OldMaleVery ShortVery ShortVery Short50,839
5Middle-AgeFemaleVery ShortVery ShortVery Short49,665
6YoungMaleVery ShortVery ShortVery Short39,142
7Middle-OldFemaleVery ShortVery ShortVery Short37,615
8YoungFemaleVery ShortVery ShortVery Short29,567
9Middle-AgeMaleVery ShortShortVery Short29,344
10AdultMaleVery ShortShortVery Short27,876
Table 3. The statistical result of cross-validation from ten clusters.
ClusterFoldMinMaxMeanSD
12345678
100.72730.72700.72630.72530.72530.72510.72460.72430.72430.72730.72560.0011
200.72580.72510.72750.72750.72660.72560.72620.72460.72460.72750.72610.0010
300.72660.72590.72670.72760.72690.72710.72730.72570.72570.72760.72670.0006
400.72810.72650.72650.72710.72680.72750.72540.72730.72540.72810.72690.0008
500.72610.72700.72750.72610.72650.72620.72530.72550.72530.72750.72630.0007
600.72490.72650.72670.72770.72780.72750.72710.72500.72490.72780.72660.0011
700.72480.72700.72610.72630.72670.72540.72500.72520.72480.72700.72580.0008
800.72640.72670.72680.72700.72770.72460.72570.72530.72460.72770.72630.0010
900.72670.72650.72760.72750.72570.72650.72650.72370.72370.72760.72630.0012
1000.72510.72080.72560.72360.72550.72540.72590.72340.72080.72590.72440.0017
Table 4. The unbalanced, single, and intra-cluster EGFNM area under the curve (AUC) results.
ClusterUnbalancedRandomSingleIntra-Cluster EGFNM
100.679740.71770.7272630.7285
200.7274830.7283
300.7276190.7293
400.7280610.72928
500.7274720.7289
600.727790.7289
700.7270020.7291
800.72770.7292
900.7276030.7291
1000.725930.7288
Table 5. The eight best clusters and artificial neural network (ANN) structure.
ClusterHidden Neuron on Layer
123
3071328
40302718
50191147
60194926
70213232
8054237
9084146
10018379
Table 6. The EGFNM model evaluations and the maximum AUC estimated generation.
MethodsClusterMaximum AUCEGFNM Generation
Intra-cluster EGFNM100.728589
200.728330
300.729350
400.7292829
500.728939
600.7289136
700.729111
800.729263
900.729170
1000.7288195
Inter-cluster EGFNMEnsemble0.7303827

