
Evaluating the Effects of Government Policy and Drought from 1984 to 2009 on Rangeland in the Three Rivers Source Region of the Qinghai-Tibet Plateau

Abstract
:1. Introduction
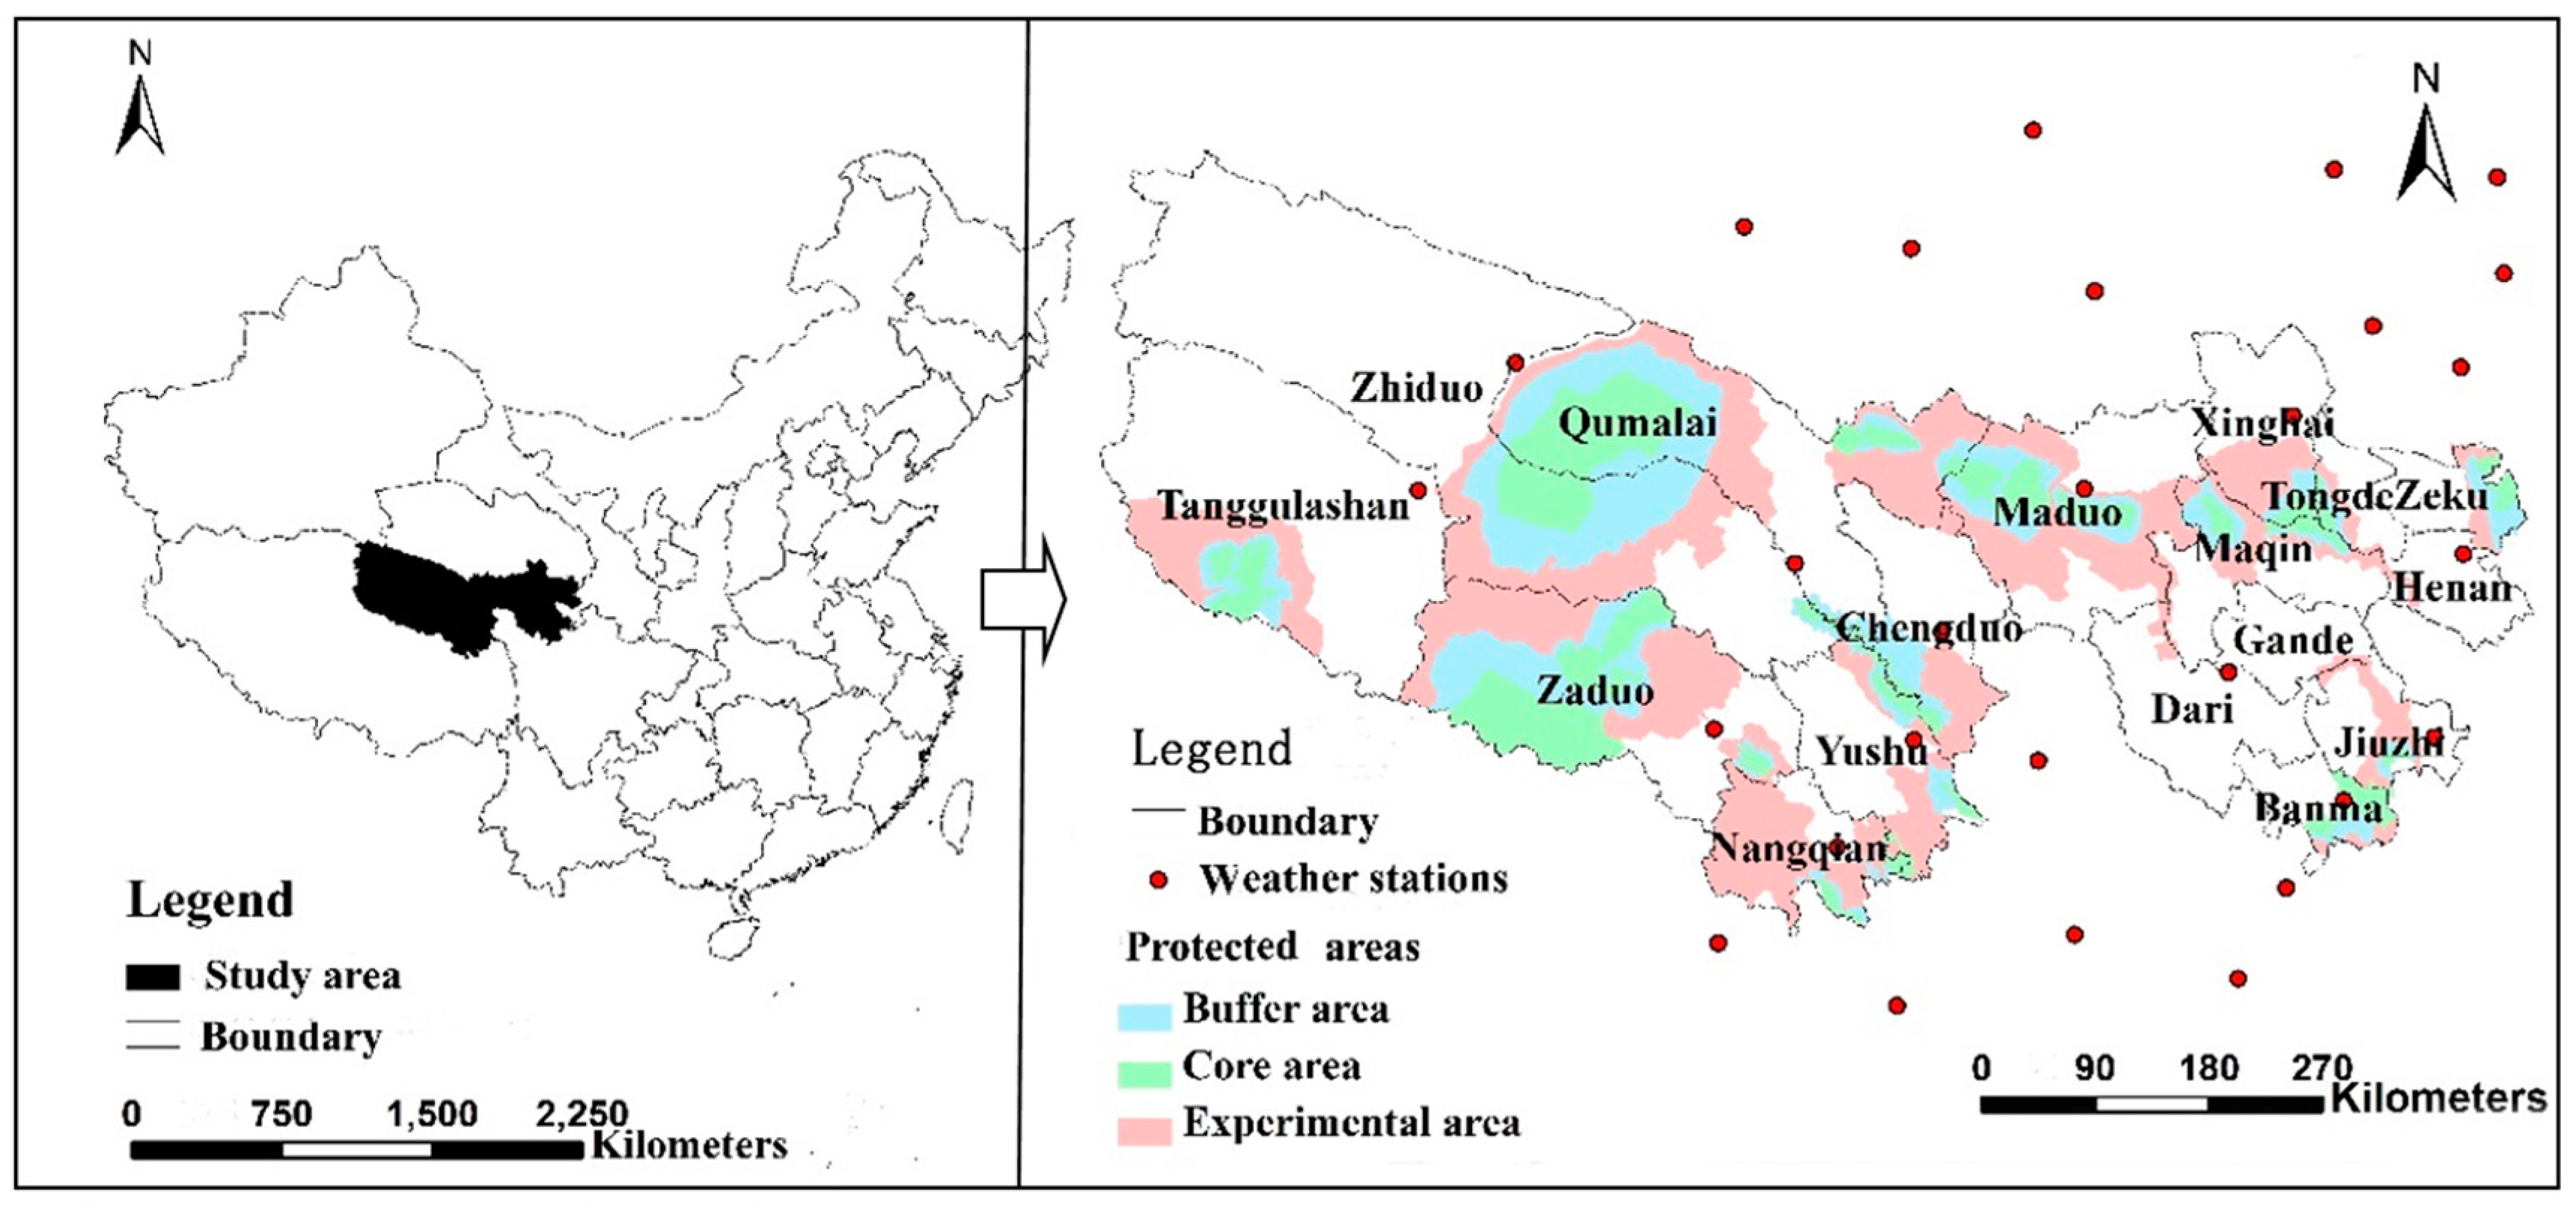
2. Study Area
3. Data and Methods
3.1. Data
3.2. Method
4. Results and Analysis
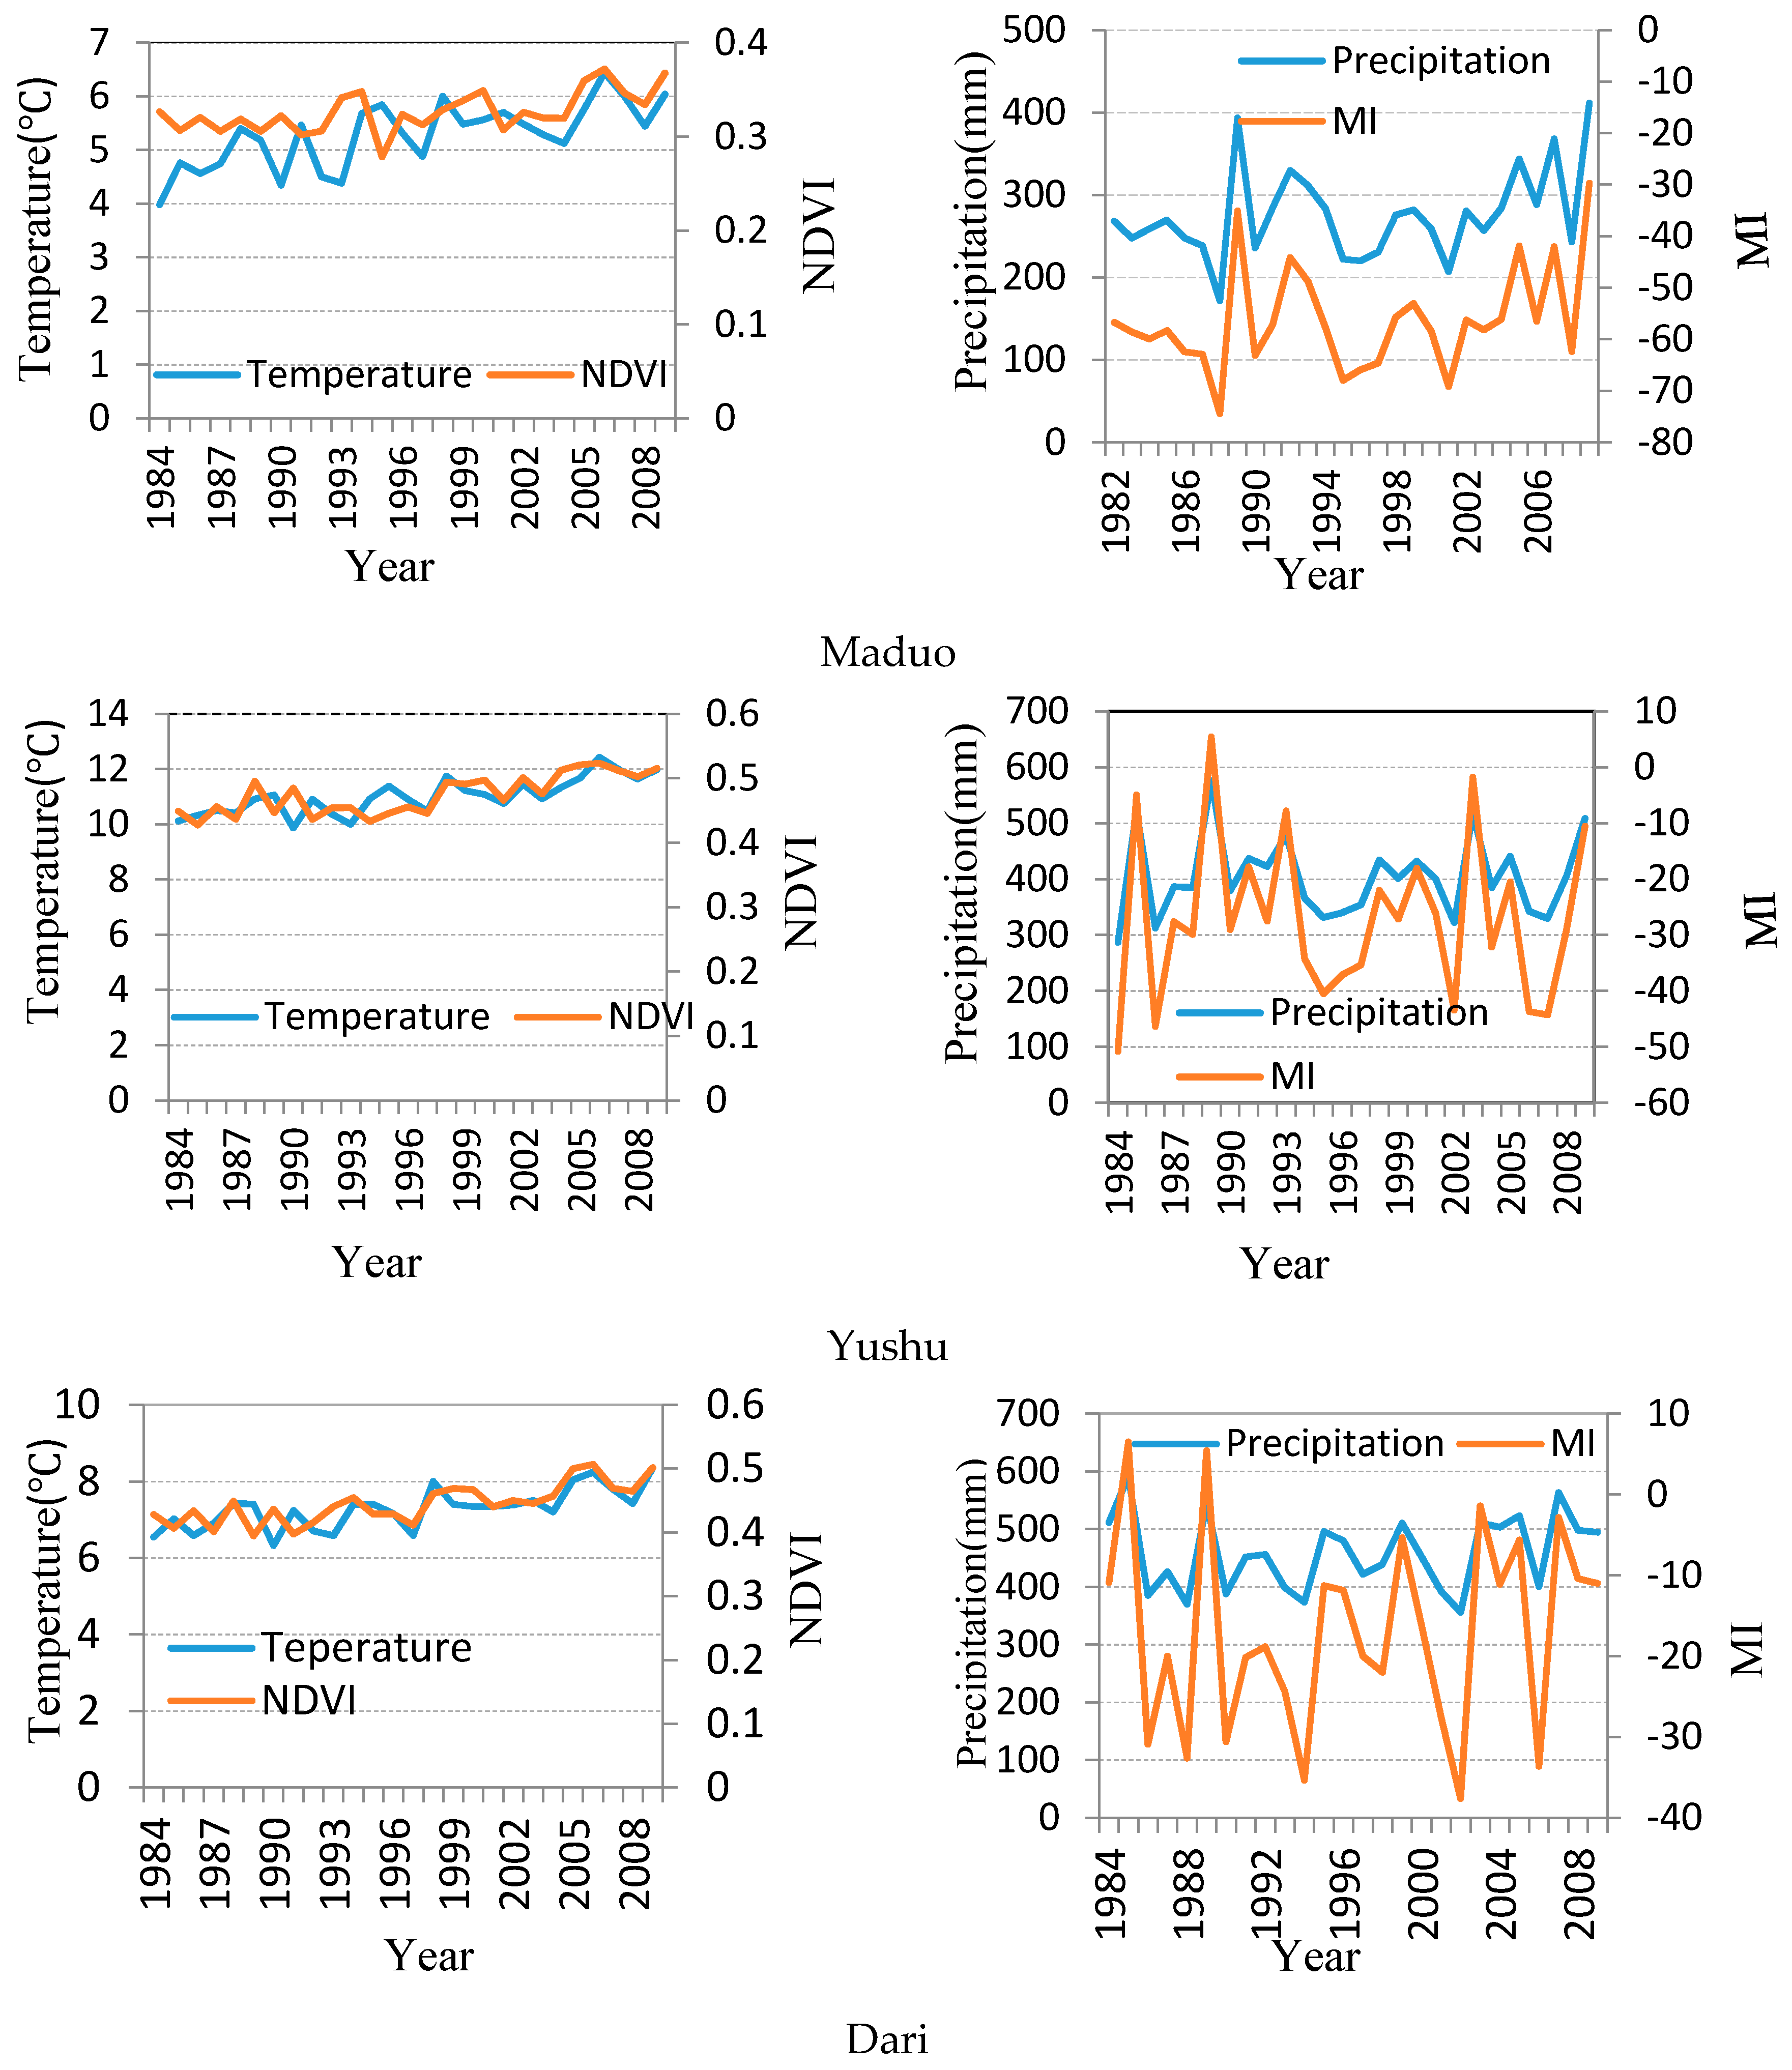
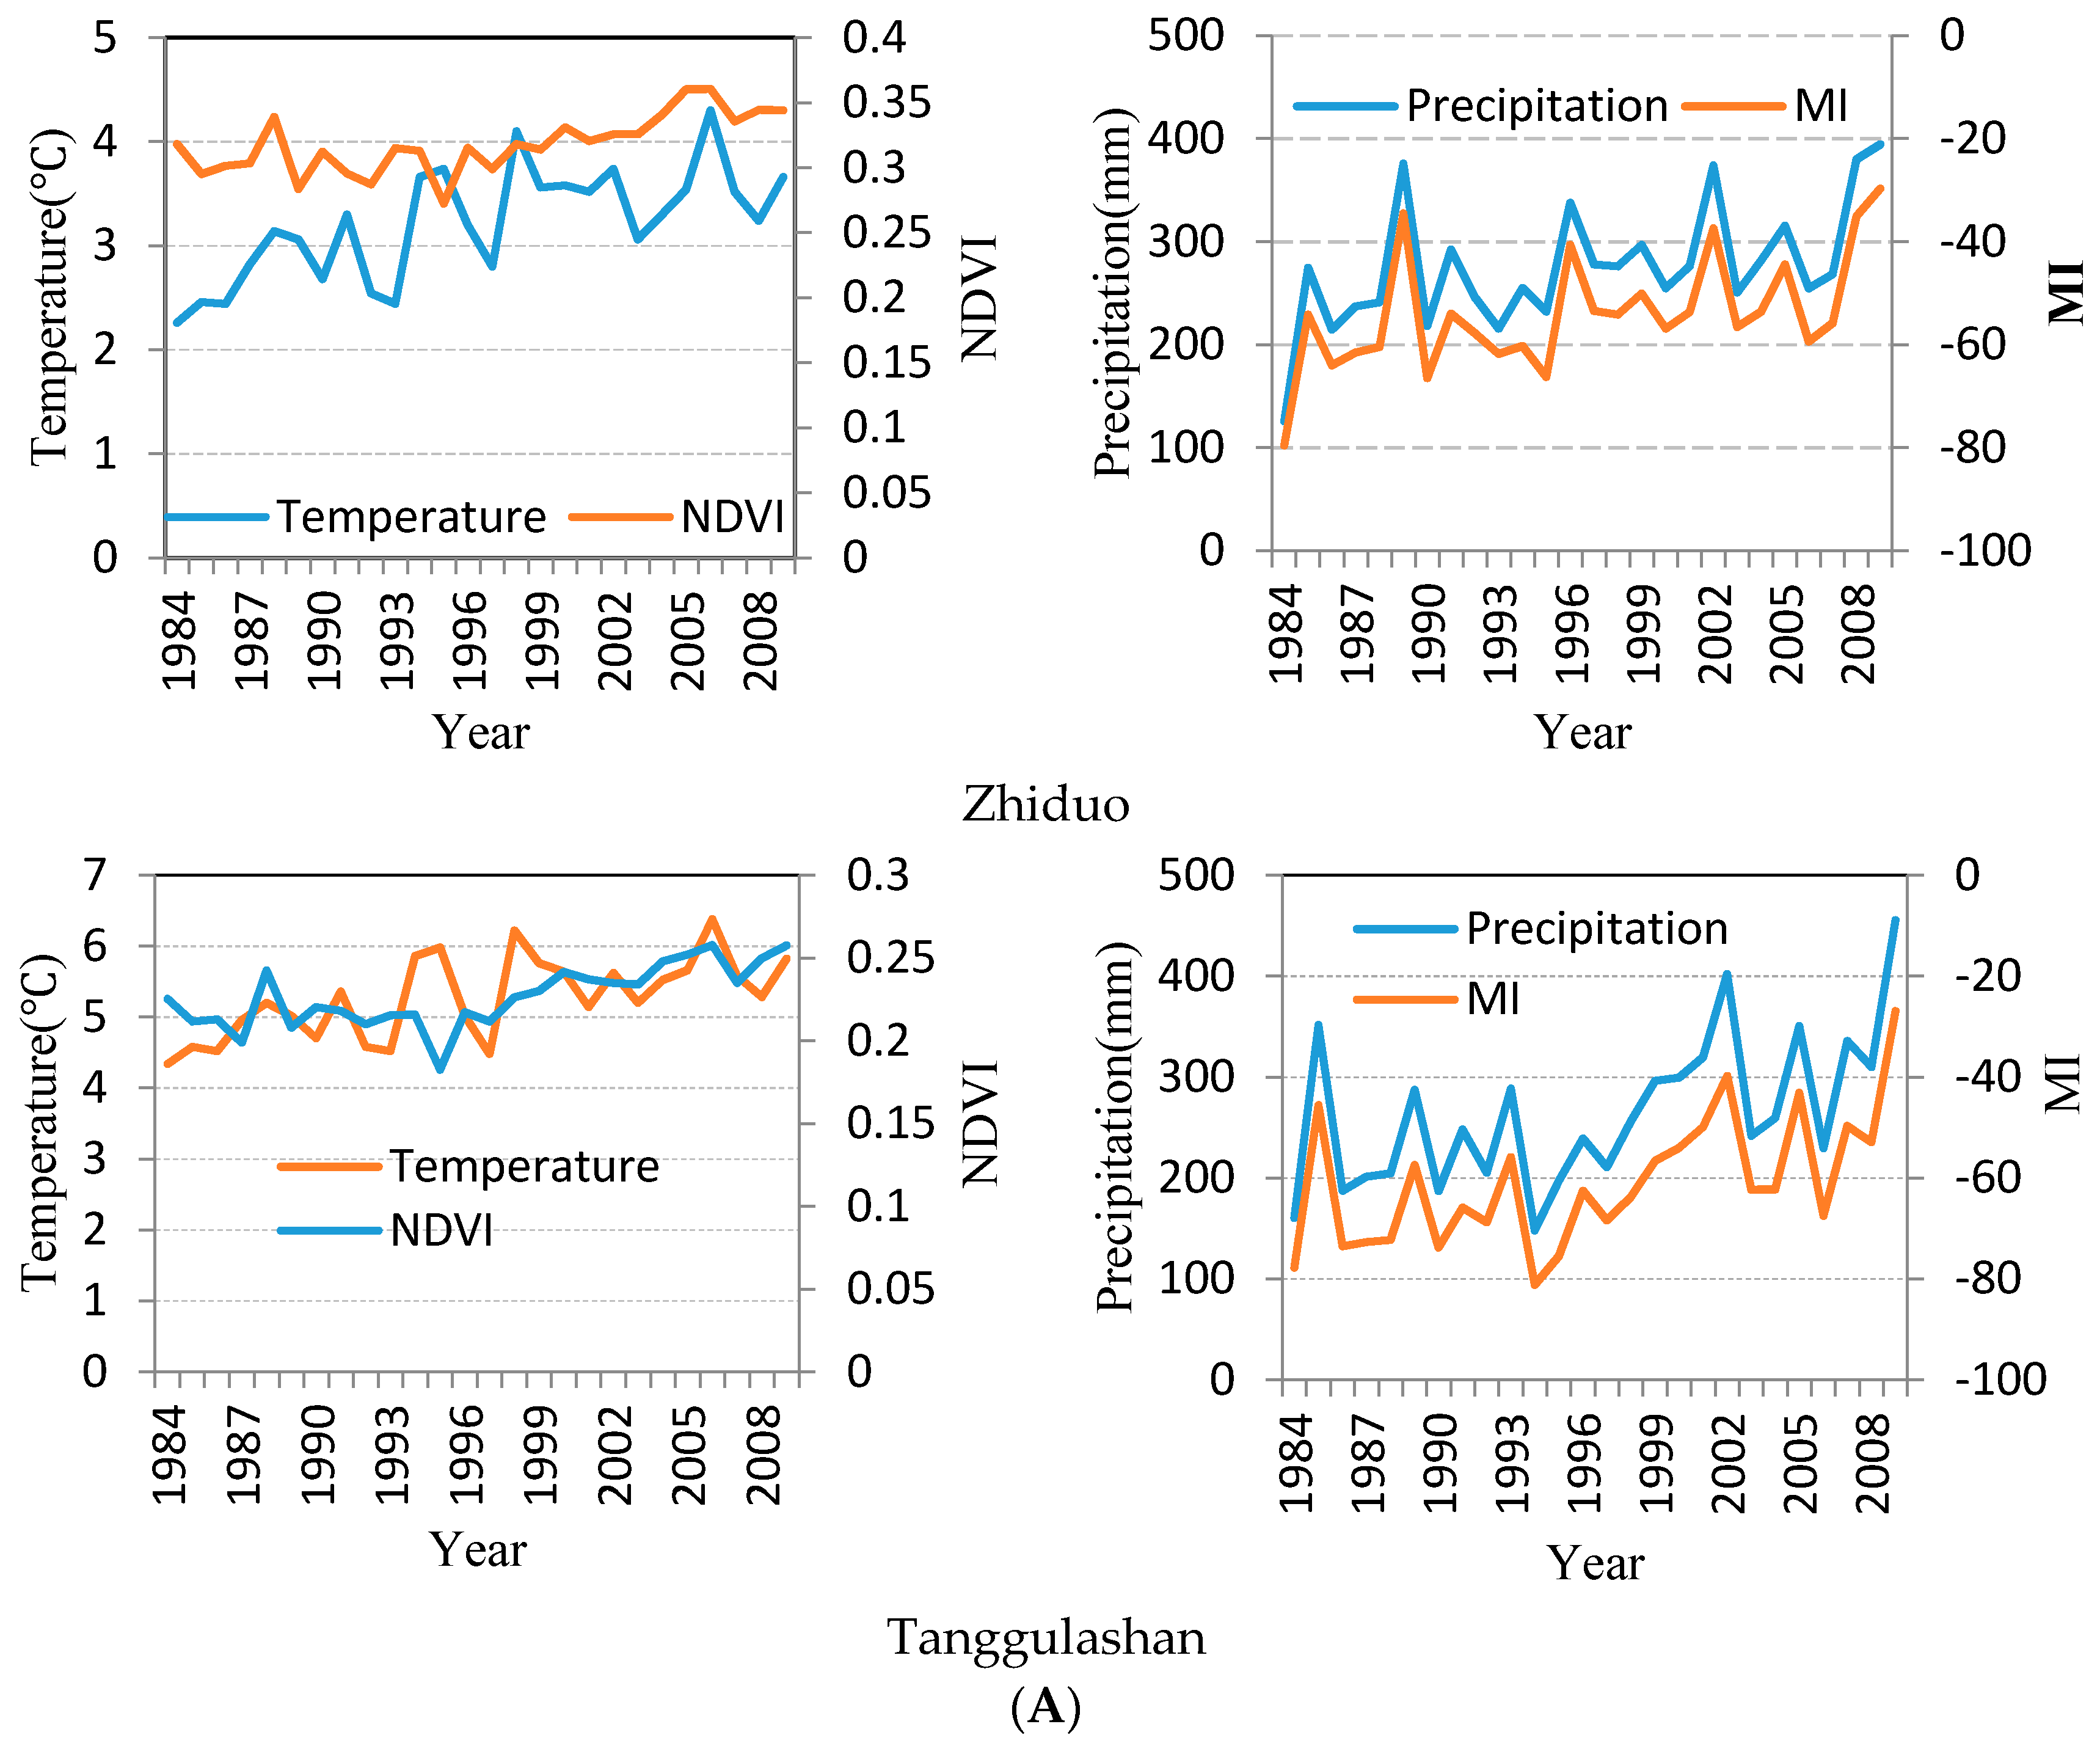
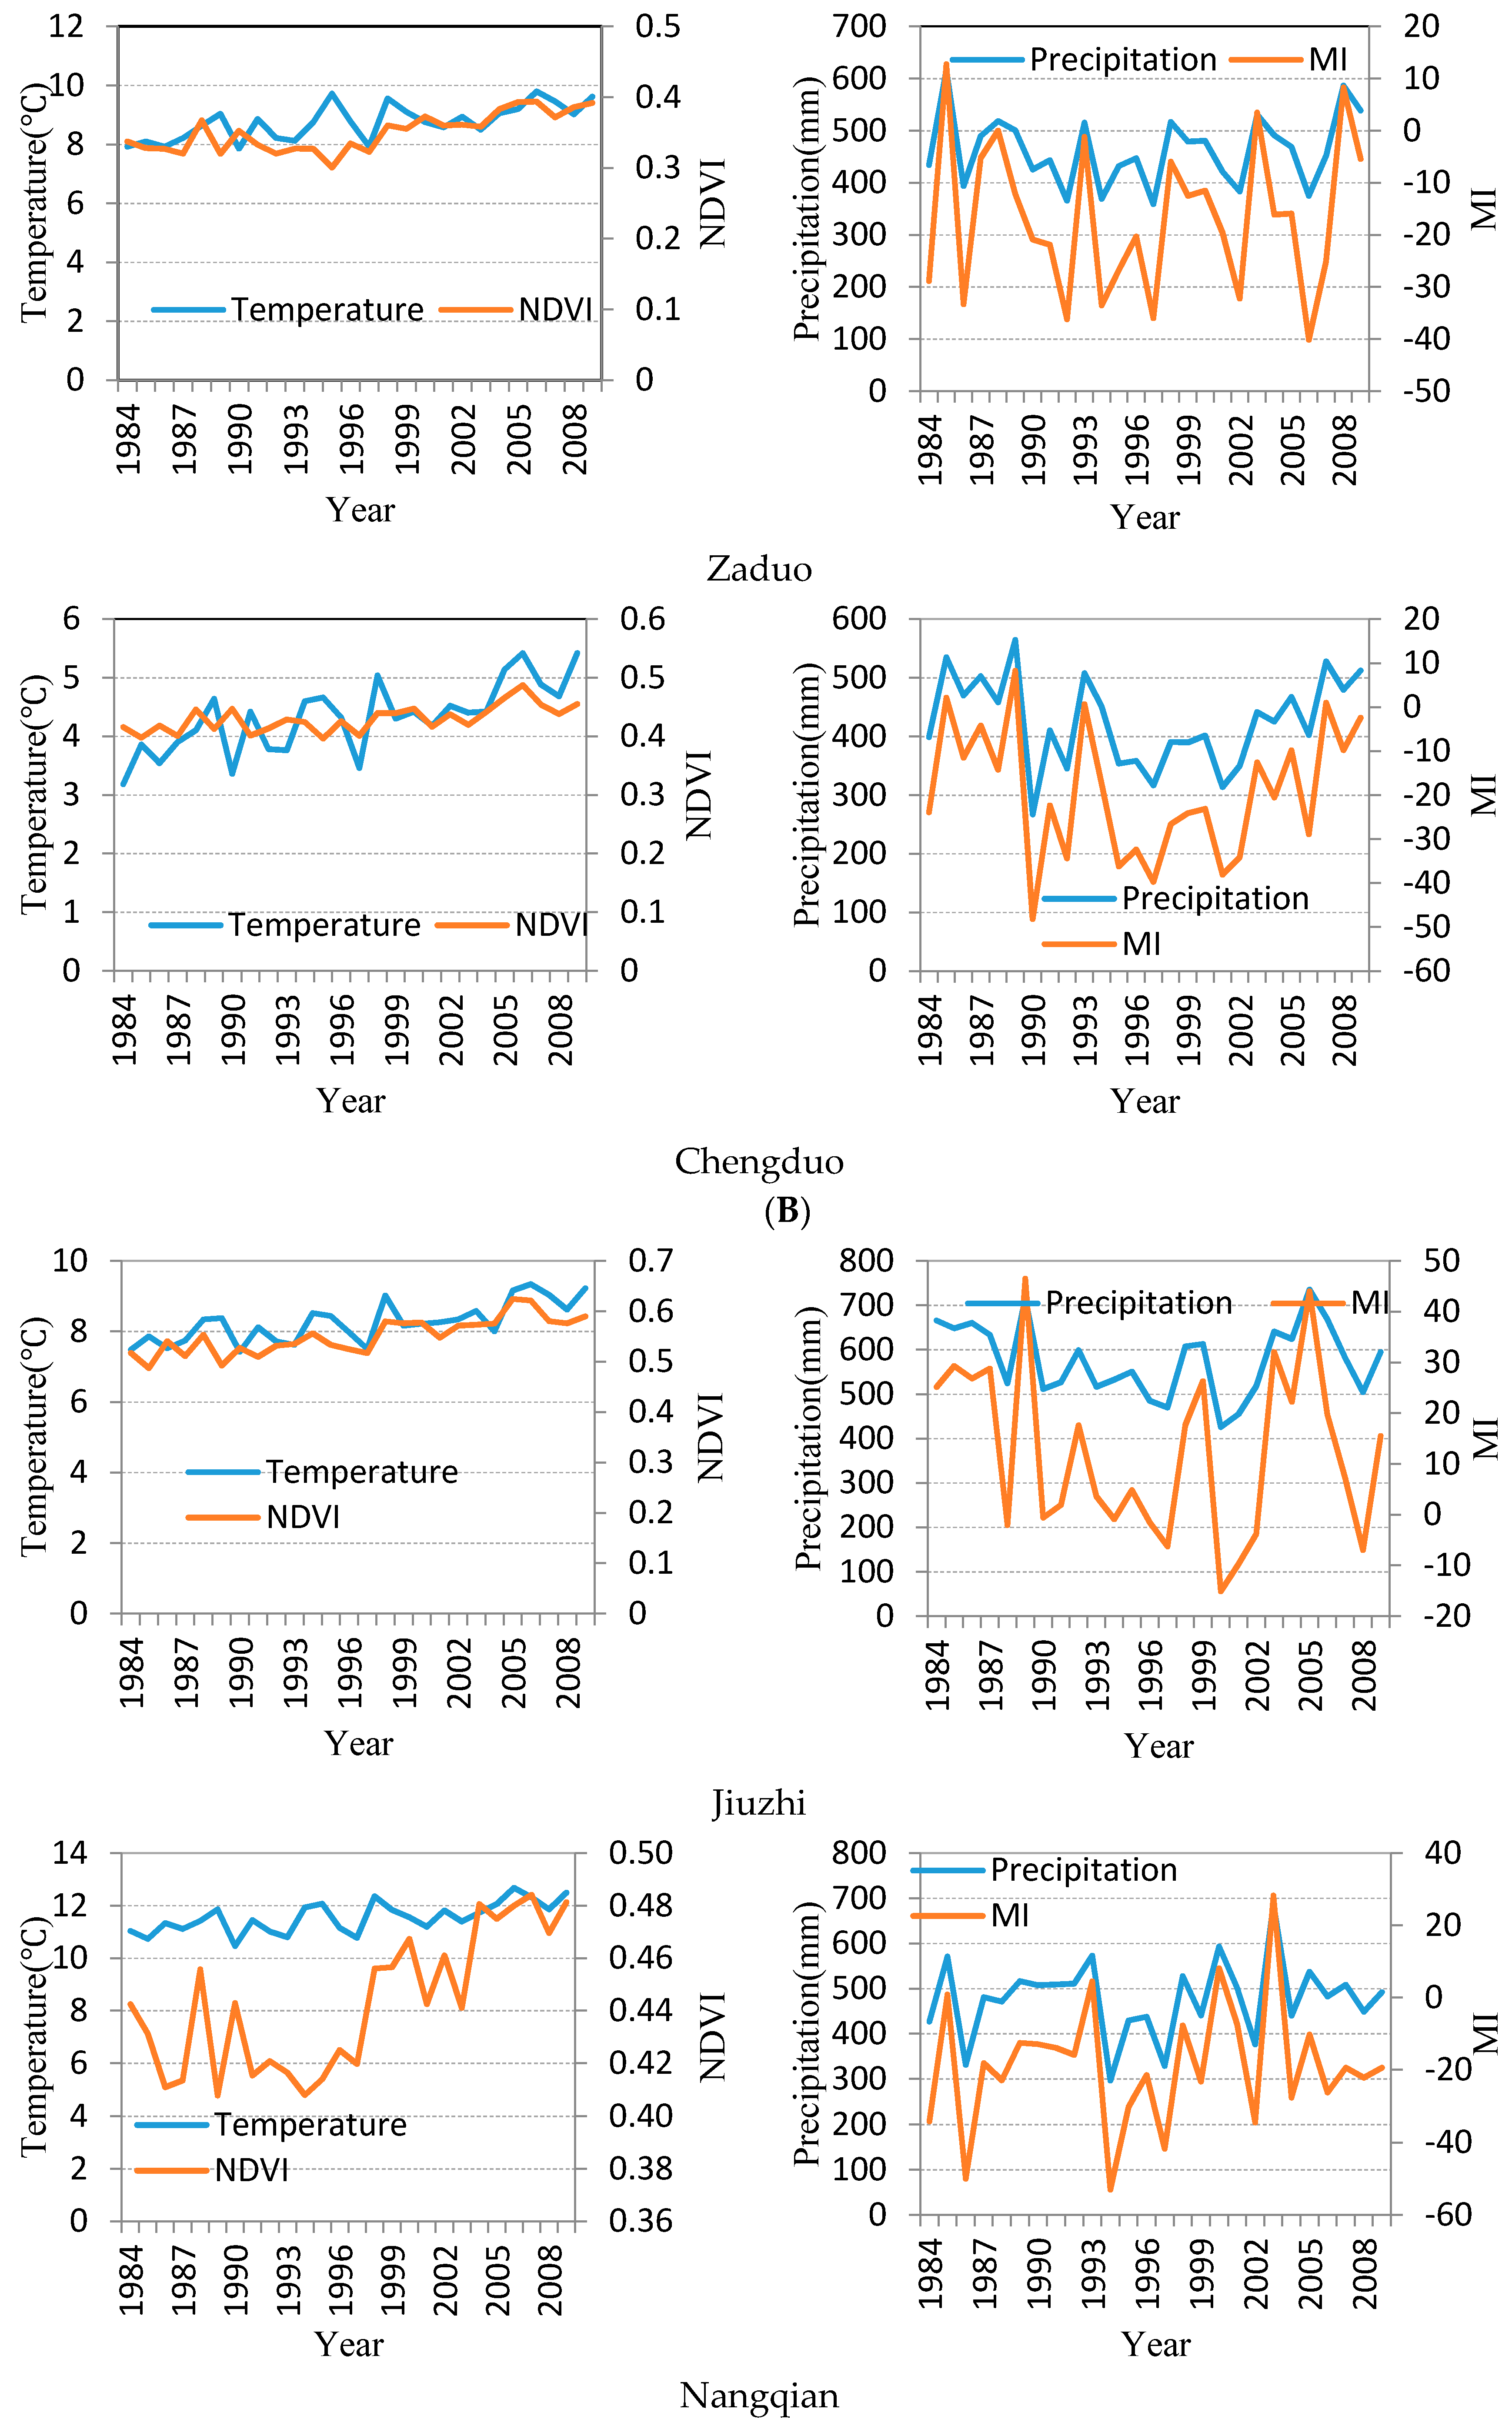
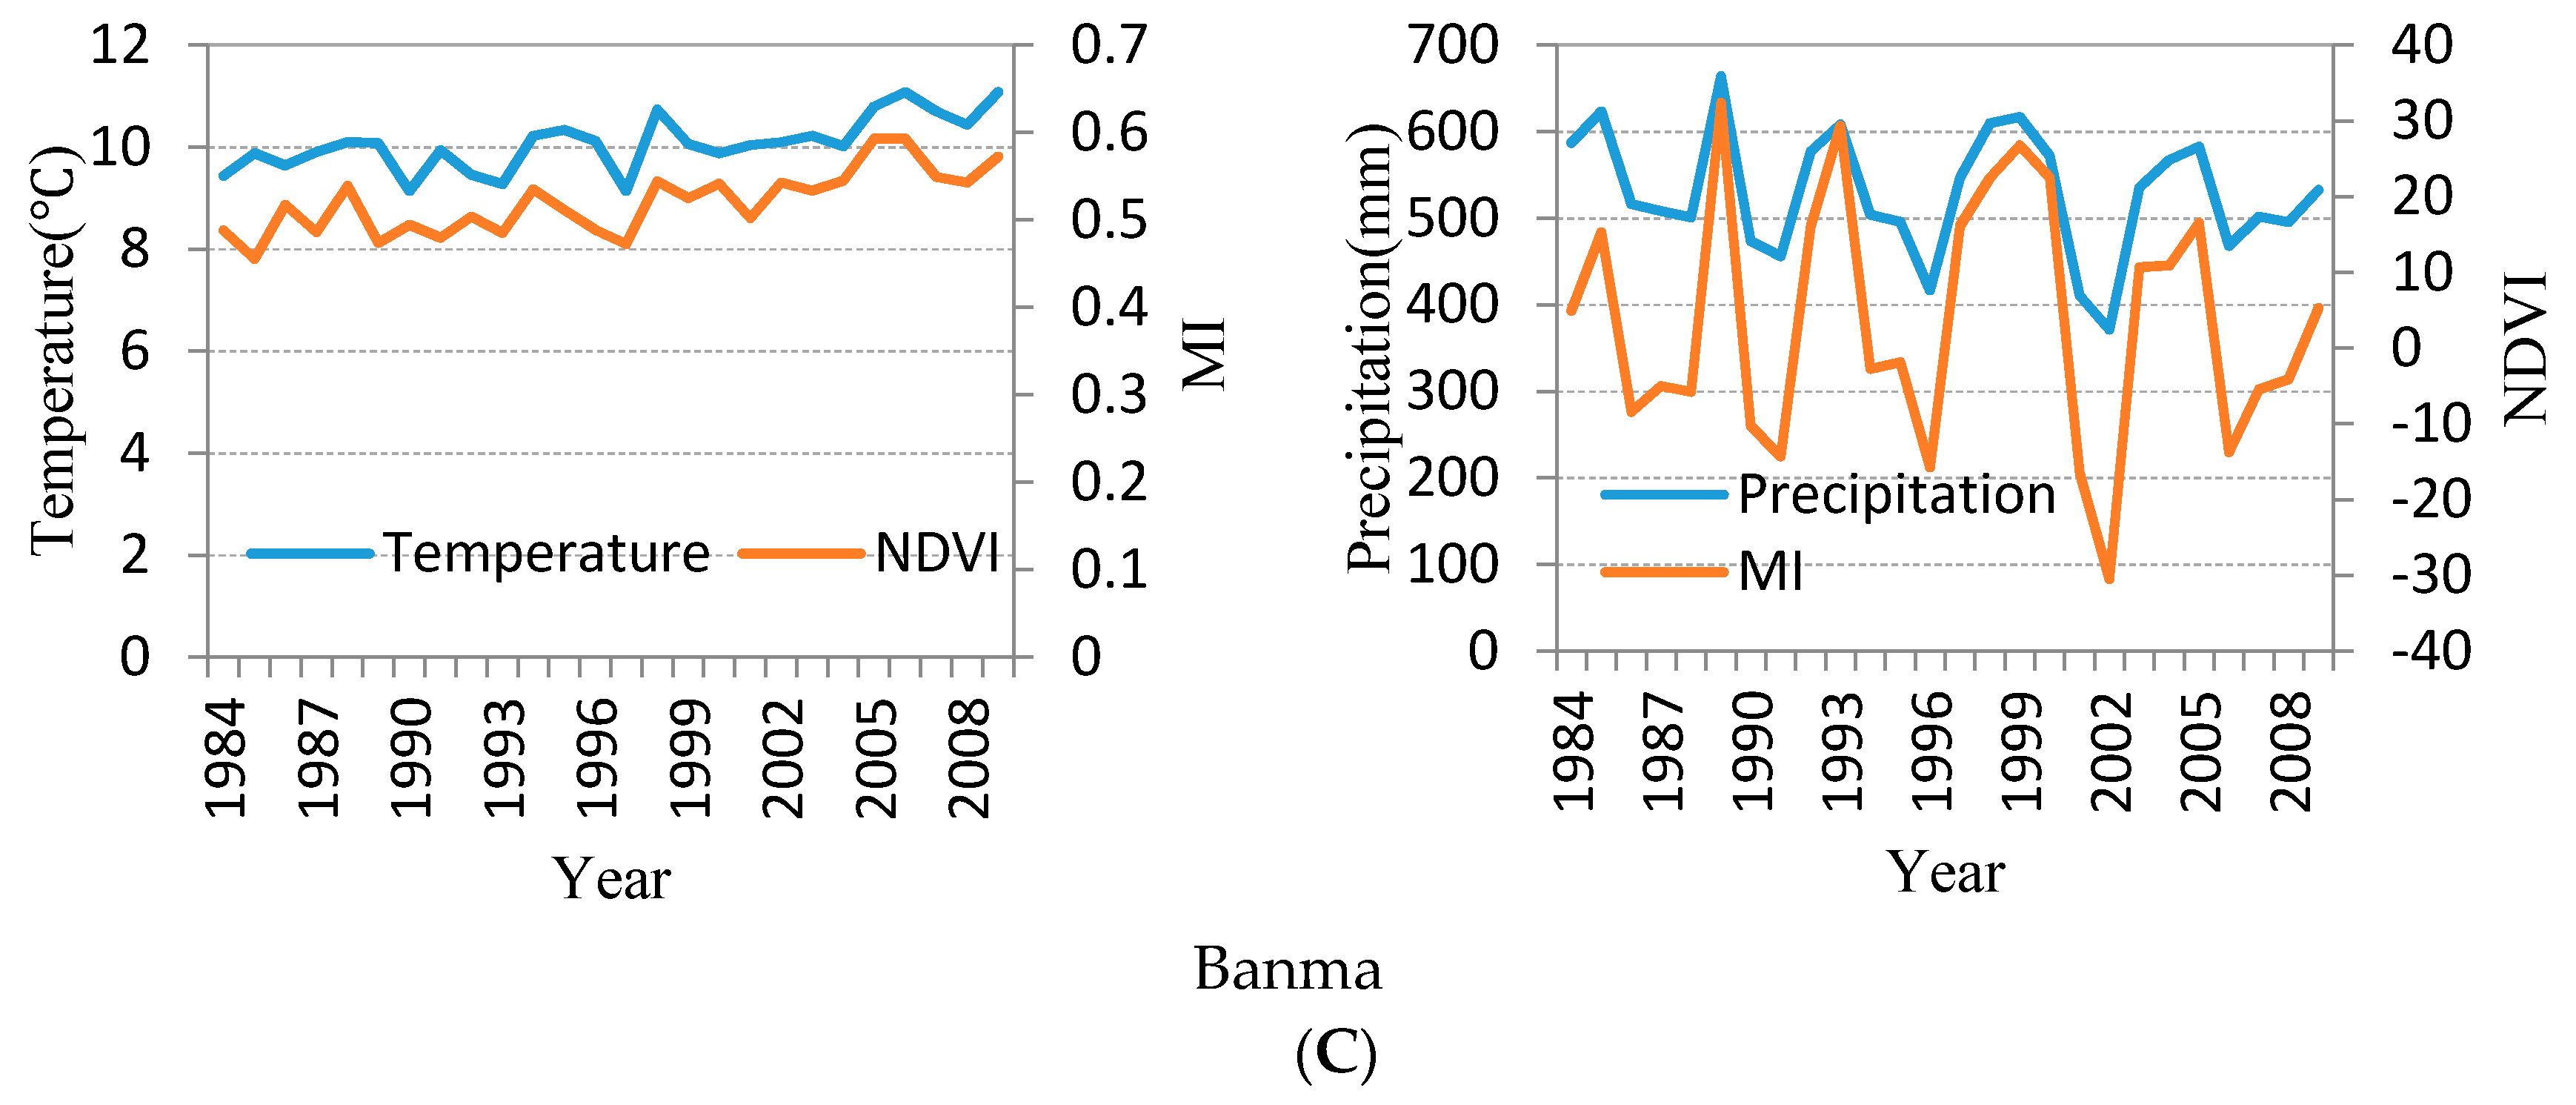
4.1. Temporal Trends of Dry
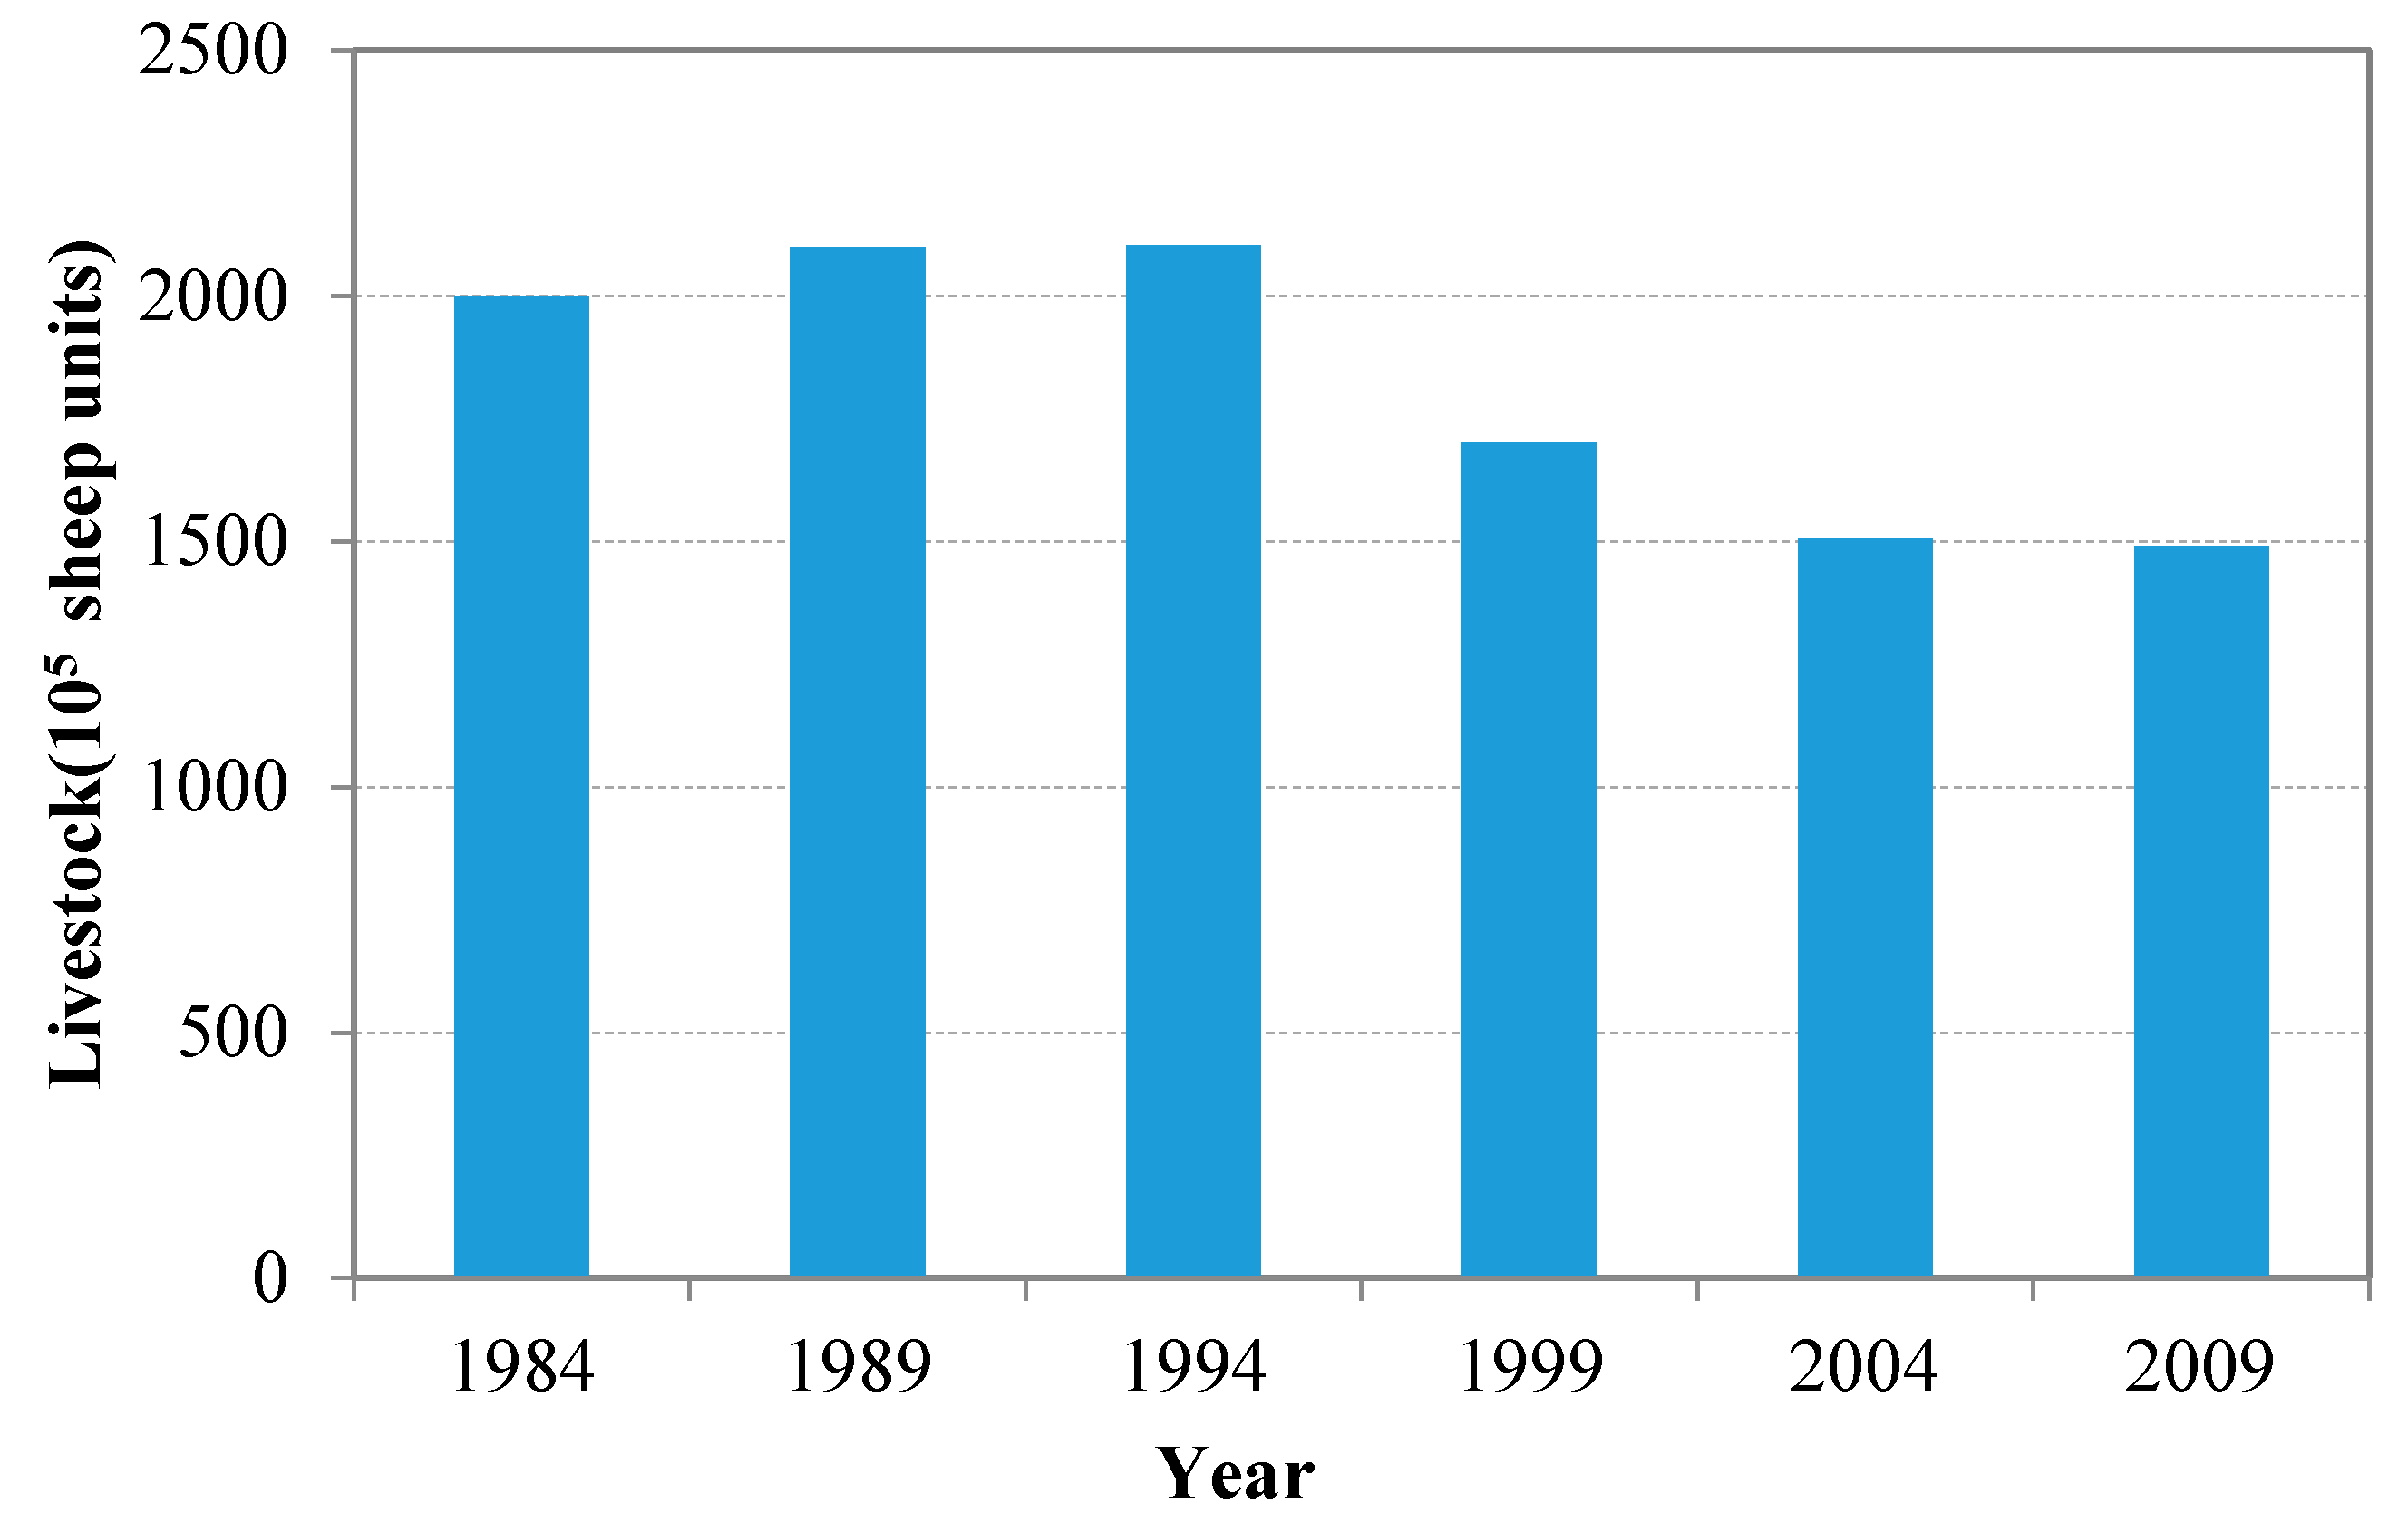
4.2. Government Policy and Rangeland NDVI
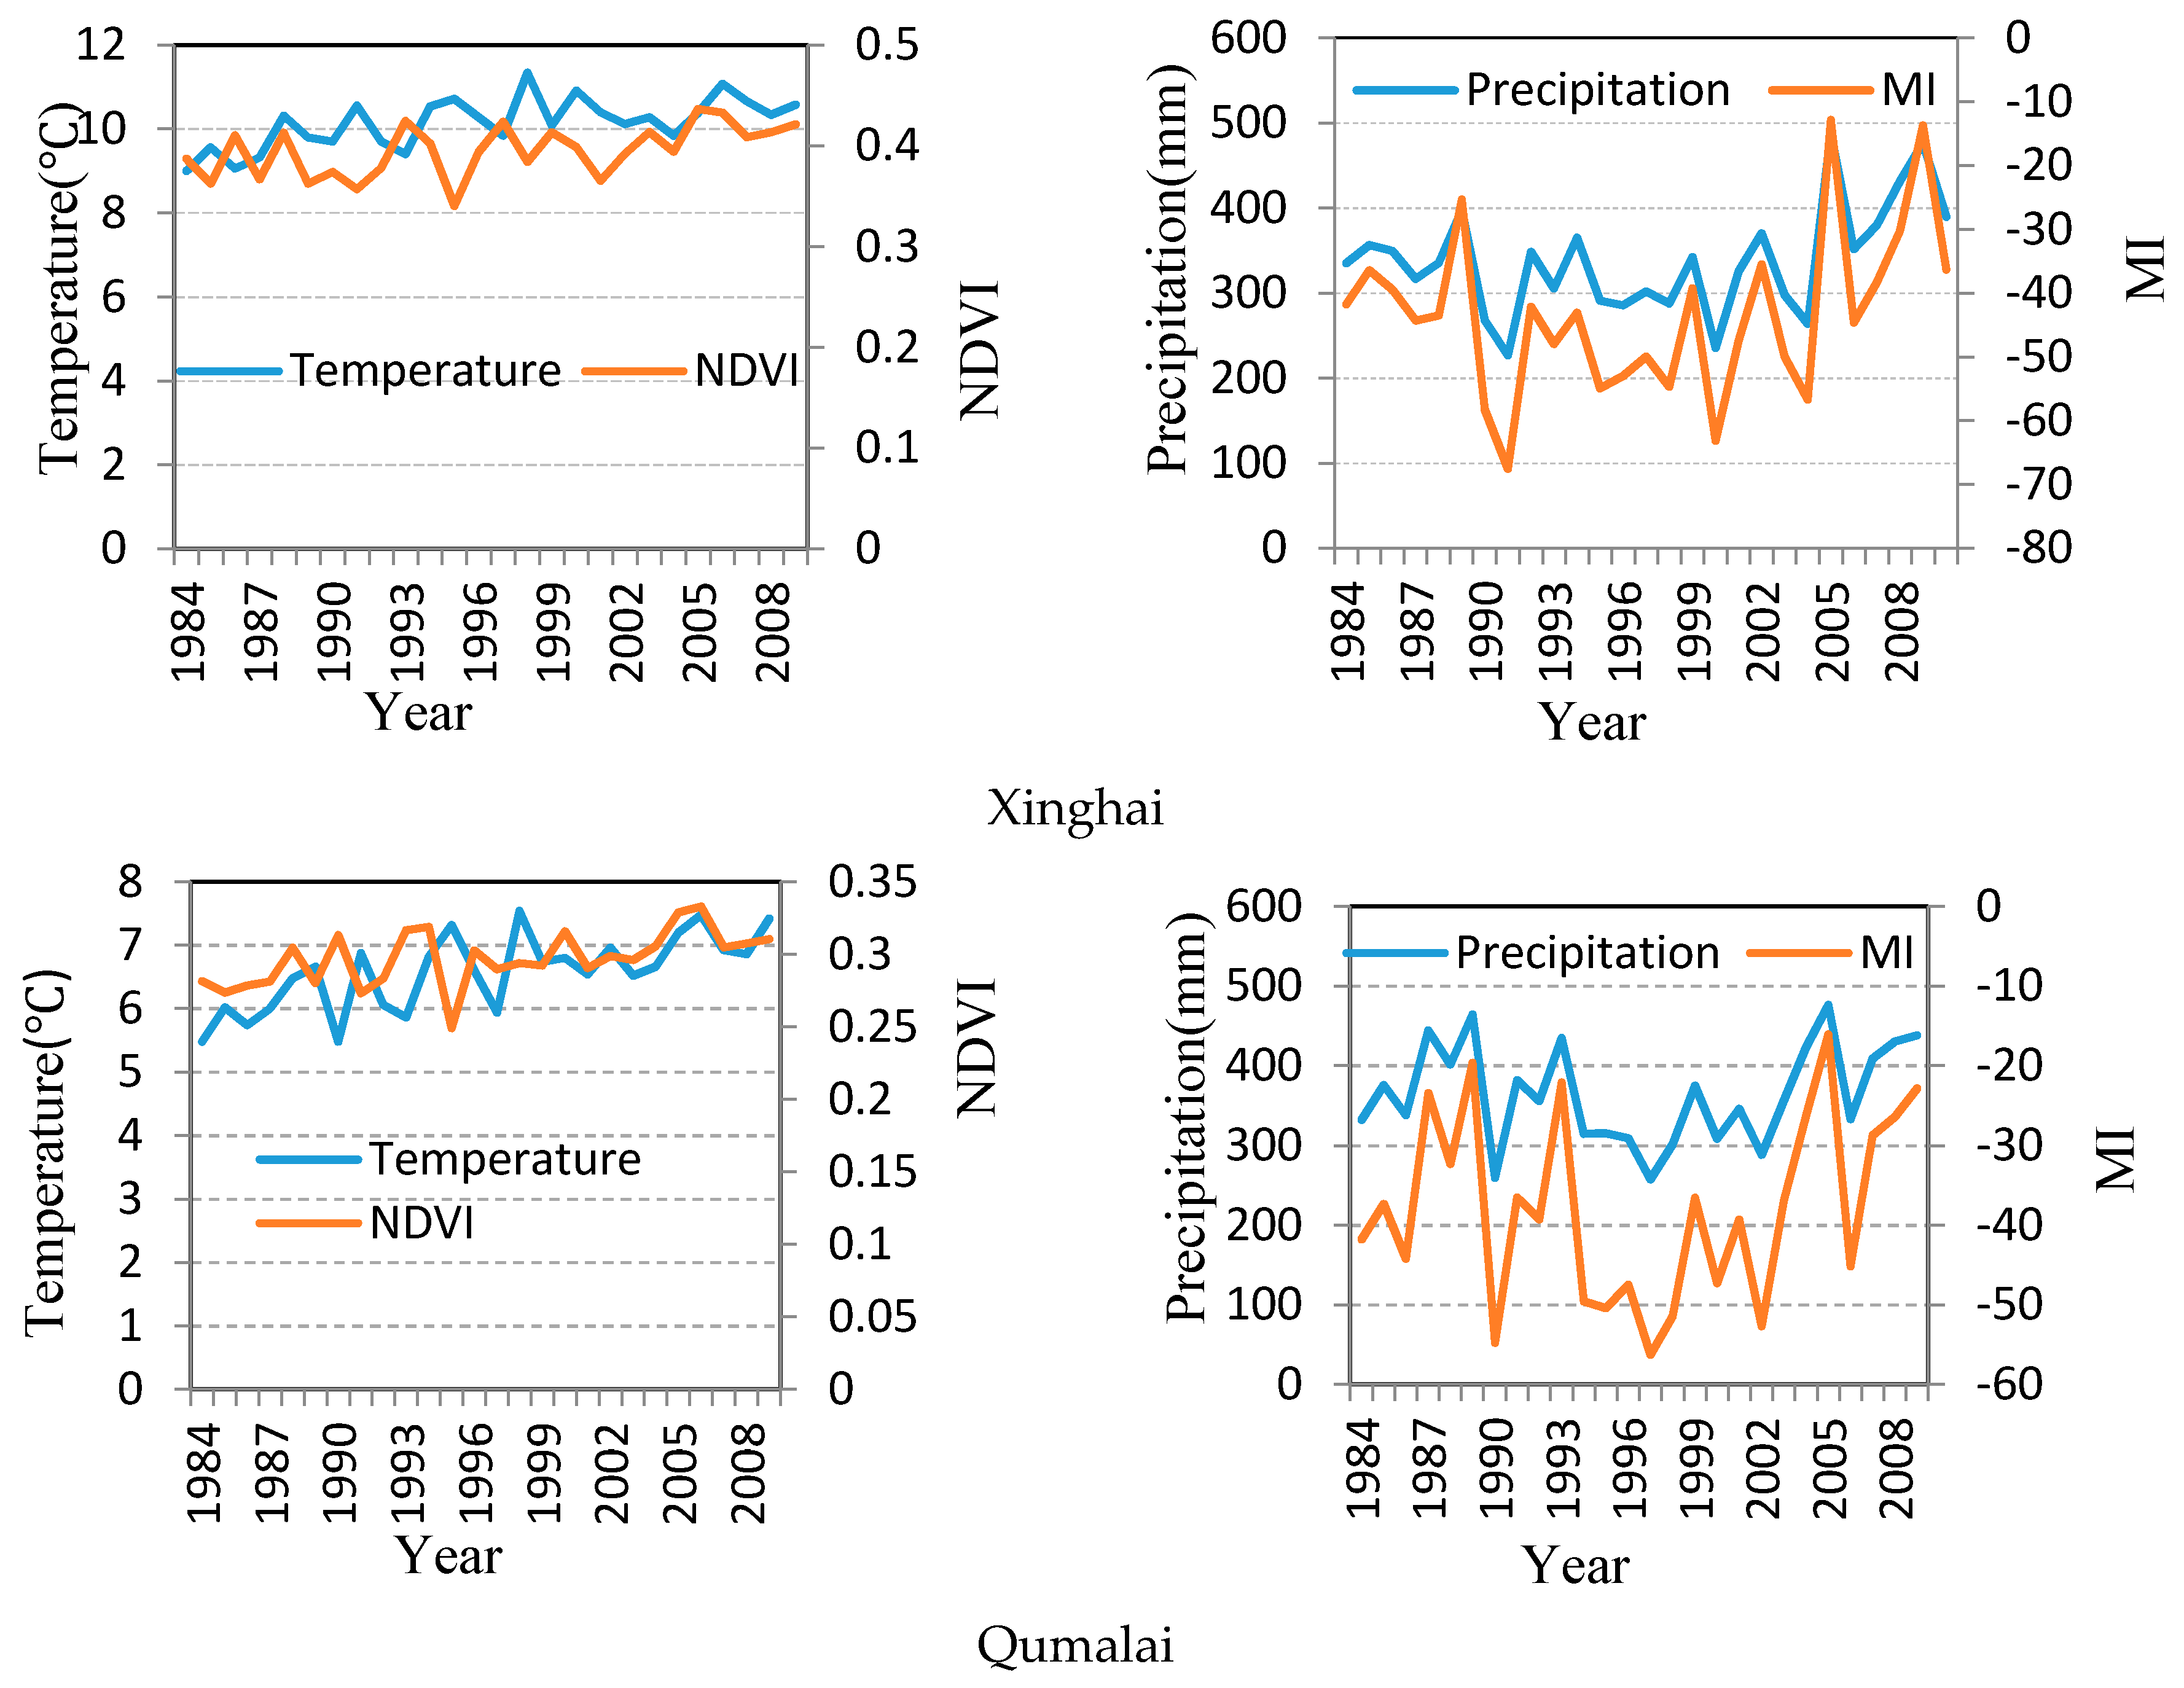
4.3. The Relationship between NDVI and Other Physical Factors
4.4. Consistency of NDVI Values from Two Sensor Types
5. Discussion
6. Conclusions
Acknowledgments
Author Contributions
Conflicts of Interest
Appendix A


References
- Wang, G.; Qian, J.; Cheng, G.; Lai, Y. Eco-environmental degradation and causal analysis in the source region of the Yellow River. Environ. Geol. 2001, 40, 884–890. [Google Scholar]
- Zhou, H.K.; Zhao, X.Q.; Zhou, L.; Liu, W.; Li, Y.N.; Tang, Y.H. A studv on Correlations between vegetation degradation and soil degradation in the alpine meadow of the Qinghai-Tibetan Plateau. Acta Prataculturae Sin. 2004, 14, 31–40. [Google Scholar]
- Wang, G.X.; Wang, Y.; Kubota, J. Land-cover changes and its impacts on ecological variables in the headwaters area of the Yangtze River, China. Environ. Monit. Assess. 2006, 120, 361–385. [Google Scholar] [CrossRef]
- Liang, S.H.; Chen, J.; Jin, X.M.; Wang, L.; Gong, B. Regularity of Vegetation Coverage Changes in the Tibetan Plateau over the Last 21 Years. Adv. Earth Sci. 2007, 22, 33–39, (In Chinese with English Abstract). [Google Scholar]
- Song, X.; Yang, G.X.; Yan, C.Z.; Duan, H.C.; Liu, G.Y.; Zhu, Y.L. Driving forces behind land use and cover change in the Qinghai-Tibetan Plateau: A case study of the source region of the Yellow River, Qinghai Province, China. Environ. Earth Sci. 2009, 59, 793–801. [Google Scholar] [CrossRef]
- Xue, X.; Guo, J.; Han, B.S.A.; Sun, Q.W.; Liu, L.C. The effect of climate warming and permafrost thaw on desertification in the Qinghai-Tibetan Plateau. Geomorphology 2009, 108, 182–190. [Google Scholar] [CrossRef]
- Gao, Q.Z.; Wan, Y.F.; Xu, H.M.; Li, Y.; Jiangcun, W.Z.; Borjigidai, A. Alpine grassland degradation index and its response to recent climate variability in Northern Tibet, China. Quat. Int. 2010, 226, 143–150. [Google Scholar] [CrossRef]
- Zhou, H.K.; Zhao, X.Q.; Wang, Q.J.; Zhao, L.; Zhou, L.; Zhang, Y. Current situation of grassland and strategies for sustainable animal husbandry in Tongde County, Qinghai Province. Grassl. Turf 2007, 4, 7–12, (In Chinese with English Abstract). [Google Scholar]
- Klein, J.A.; Harte, J.; Zhao, X.Q. Experimental warming, not grazing, decreases rangeland quality on the Tibetan Plateau. Ecol. Appl. 2007, 17, 541–557. [Google Scholar] [CrossRef]
- Shao, W.; Cai, X.B. Grassland degradation and its formation causes analysis in Tibetan Plateau. Sci. Soll Water Conserv. 2008, 6, 112–116, (In Chinese with English Abstract). [Google Scholar]
- Liu, L.; Zhang, Y.; Bai, W.; Yan, J.; Ding, M.; Shen, Z.; Zheng, D. Characteristics of grassland degradation and driving forces in the source region of the Yellow River from 1985 to 2000. J. Geogr. Sci. 2006, 16, 131–142. [Google Scholar] [CrossRef]
- Li, X.L.; Gao, J.; Brierley, G.; Qiao, Y.M.; Zhang, J.; Yang, Y.W. Rangeland degradation on the Qinghai-Tibet plateau: Implications for rehabilitation. Land Degrad. Dev. 2013, 24, 72–80. [Google Scholar] [CrossRef]
- Chen, B.; Zhang, X.; Tao, J.; Wu, J.; Wang, J.; Shi, P.; Yu, C. The impact of climate change and anthropogenic activities on alpine grassland over the Qinghai-Tibet Plateau. Agric. For. Meteorol. 2014, 189, 11–18. [Google Scholar] [CrossRef]
- Allen, R.G.; Pereira, L.S.; Raes, D.; Smith, M. Crop Evapotranspiration-Guidelines for Computing Crop Water Requirements; FAO Irrigation and Drainage Paper 56; FAO: Rome, Italy, 1998. [Google Scholar]
- Abramowitz, M.; Stegun, I.A. Handbook of Mathematical Functions; Dover: New York, NY, USA, 1965; Volume 1046. [Google Scholar]
- McKee, T.B.; Doesken, N.J.; Kleist, J. Drought monitoring with multiple time scales. In Proceedings of the 9th Conference on Applied Climatology, Dallas, TX, USA, 15–20 January 1995; pp. 233–236. [Google Scholar]
- McKee, T.B.; Doesken, N.J.; Kleist, J. The relationship of drought frequency and duration to time scales. In Proceedings of the 8th Conference on Applied Climatology, Boston, MA, USA, 17–22 January 1993; pp. 179–184. [Google Scholar]
- Nalbantis, I.; Tsakiris, G. Assessment of hydrological drought revisited. Water Resour. Manag. 2009, 23, 881–897. [Google Scholar] [CrossRef]
- Gocic, M.; Trajkovic, S. Spatiotemporal characteristics of drought in Serbia. J. Hydrol. 2014, 510, 110–123. [Google Scholar] [CrossRef]
- Zhang, G.L.; Zhang, Y.J.; Dong, J.W.; Xiao, X.M. Green-up dates in the Tibetan Plateau have continuously advanced from 1982 to 2011. Proc. Natl. Acad. Sci. USA 2013, 110, 4309–4314. [Google Scholar] [CrossRef] [PubMed]
- An, Y.Z.; Gao, W.; Gao, Z.Q.; Liu, C.S.; Shi, R.H. Trend analysis for evaluating the consistency of Terra MODIS and SPOT VGT NDVI time series products in China. Front. Earth Sci. 2015, 9, 125. [Google Scholar] [CrossRef]
- Zhang, Y.; Qi, W.; Zhou, C.; Ding, M.; Liu, L.; Gao, J.; Zheng, D. Spatial and temporal variability in the net primary production of alpine grassland on the Tibetan Plateau since 1982. J. Geogr. Sci. 2014, 24, 269–287. [Google Scholar] [CrossRef]
- Gao, Q.; Li, Y.; Wan, Y.; Qin, X.; Jiangcun, W.; Liu, Y. Dynamics of alpine grassland NPP and its response to climate change in Northern Tibet. Clim. Chang. 2009, 97, 515. [Google Scholar] [CrossRef]
- Zhang, L.; Guo, H.; Ji, L.; Lei, L.; Wang, C.; Yan, D.; Li, J. Vegetation greenness trend (2000 to 2009) and the climate controls in the Qinghai-Tibetan Plateau. J. Appl. Remote Sens. 2013, 7, 073572. [Google Scholar] [CrossRef]
- Wu, G.L.; Du, G.Z.; Liu, Z.H.; Thirgood, S. Effect of fencing and grazing on a Kobresia-dominated meadow in the Qinghai-Tibetan Plateau. Plant Soil 2009, 319, 115–126. [Google Scholar] [CrossRef]
- Zhang, Y.; Min, Q.; Zhao, G.; Jiao, W.; Liu, W.; Bijaya, G.C.D. Can Clean Energy Policy Improve the Quality of Alpine Grassland Ecosystem? A Scenario Analysis to Influence the Energy Changes in the Three-River Headwater Region, China. Sustainability 2016, 8, 231. [Google Scholar] [CrossRef]
- Dong, Q.M.; Zhao, X.Q.; Wu, G.L.; Shi, J.J.; Ren, G.H. A review of formation mechanism and restoration measures of “black-soil-type” degraded grassland in the Qinghai-Tibetan Plateau. Environ. Earth Sci. 2013, 70, 2359–2370. [Google Scholar] [CrossRef]
- Zhang, Y.; Gao, Q.; Dong, S.; Liu, S.; Wang, X.; Su, X.; Zhao, H. Effects of grazing and climate warming on plant diversity, productivity and living state in the alpine rangelands and cultivated grasslands of the Qinghai-Tibetan Plateau. Rangel. J. 2015, 37, 57–65. [Google Scholar] [CrossRef]
- Chen, H.; Zhu, Q.; Peng, C.; Wu, N.; Wang, Y.; Fang, X.; Kang, X. The impacts of climate change and human activities on biogeochemical cycles on the Qinghai-Tibetan Plateau. Glob. Chang. Boil. 2013, 19, 2940–2955. [Google Scholar] [CrossRef]
- Shi, X.M.; Li, X.G.; Li, C.T.; Zhao, Y.; Shang, Z.H.; Ma, Q. Grazing exclusion decreases soil organic C storage at an alpine grassland of the Qinghai–Tibetan Plateau. Ecol. Eng. 2013, 57, 183–187. [Google Scholar] [CrossRef]
- Shang, Z.H.; Deng, B.; Ding, L.M.; Ren, G.H.; Xin, G.S.; Liu, Z.Y.; Long, R.J. The effects of three years of fencing enclosure on soil seed banks and the relationship with above-ground vegetation of degraded alpine grasslands of the Tibetan plateau. Plant Soil 2013, 364, 229–244. [Google Scholar] [CrossRef]
- Lu, X.; Yan, Y.; Sun, J.; Zhang, X.; Chen, Y.; Wang, X.; Cheng, G. Short-term grazing exclusion has no impact on soil properties and nutrients of degraded alpine grassland in Tibet, China. Solid Earth 2015, 6, 1195–1205. [Google Scholar] [CrossRef]
- Cui, X.; Graf, H.F. Recent land cover changes on the Tibetan Plateau: A review. Clim. Chang. 2009, 94, 47–61. [Google Scholar] [CrossRef]


| Month (%) | January | February | March | April | May | Junne | July | August | September | October | November | December | Total |
|---|---|---|---|---|---|---|---|---|---|---|---|---|---|
| Banma | 96.7 | 70.0 | 30.0 | 0.0 | 0.0 | 0.0 | 0.0 | 0.0 | 0.0 | 0.0 | 90.0 | 96.7 | 31.9 |
| Nangqian | 96.7 | 93.3 | 76.7 | 26.7 | 0.0 | 0.0 | 0.0 | 0.0 | 0.0 | 6.7 | 83.3 | 100.0 | 40.3 |
| Jiuzhi | 96.7 | 80.0 | 20.0 | 0.0 | 0.0 | 0.0 | 0.0 | 0.0 | 0.0 | 3.3 | 76.7 | 100.0 | 31.4 |
| Henan | 90.0 | 80.0 | 30.0 | 3.3 | 0.0 | 0.0 | 0.0 | 0.0 | 0.0 | 3.3 | 93.3 | 100.0 | 33.3 |
| Dari | 83.3 | 80.0 | 16.7 | 3.3 | 0.0 | 0.0 | 0.0 | 0.0 | 0.0 | 0.0 | 86.7 | 96.7 | 30.6 |
| chengduo | 80.0 | 73.3 | 23.3 | 16.7 | 0.0 | 0.0 | 0.0 | 0.0 | 0.0 | 10.0 | 80.0 | 93.3 | 94.2 |
| Maduo | 86.7 | 66.7 | 30.0 | 26.7 | 3.3 | 0.0 | 0.0 | 0.0 | 0.0 | 10.0 | 86.7 | 93.3 | 33.6 |
| Yushu | 93.3 | 96.7 | 66.7 | 23.3 | 0.0 | 0.0 | 0.0 | 0.0 | 0.0 | 13.3 | 96.7 | 96.7 | 40.6 |
| Qumalai | 96.7 | 96.7 | 73.3 | 30.0 | 0.0 | 0.0 | 0.0 | 0.0 | 0.0 | 26.7 | 93.3 | 100.0 | 43.1 |
| Zaduo | 73.3 | 66.7 | 43.3 | 20.0 | 0.0 | 0.0 | 0.0 | 0.0 | 0.0 | 16.7 | 90.0 | 90.0 | 33.3 |
| Geermu | 93.3 | 90.0 | 90.0 | 43.3 | 0.0 | 0.0 | 0.0 | 0.0 | 0.0 | 43.3 | 93.3 | 96.7 | 45.8 |
| Xinghai | 86.7 | 90.0 | 56.7 | 23.3 | 0.0 | 0.0 | 0.0 | 0.0 | 0.0 | 16.7 | 90.0 | 93.3 | 38.1 |
| Zhiduo | 100.0 | 96.7 | 76.7 | 53.3 | 3.3 | 0.0 | 0.0 | 0.0 | 3.3 | 50.0 | 100.0 | 96.7 | 48.3 |
| 1984–1988 | 1989–1993 | 1994–1998 | 1999–2003 | 2004–2009 | |
|---|---|---|---|---|---|
| Nangqian | 0.431 | 0.421 | 0.425 | 0.454 | 0.478 |
| Banma | 0.497 | 0.487 | 0.510 | 0.529 | 0.566 |
| Yushu | 0.453 | 0.455 | 0.455 | 0.486 | 0.514 |
| Jiuzhi | 0.522 | 0.519 | 0.542 | 0.569 | 0.595 |
| Zaduo | 0.336 | 0.331 | 0.329 | 0.362 | 0.387 |
| Dari | 0.424 | 0.417 | 0.437 | 0.454 | 0.483 |
| Henan | 0.598 | 0.597 | 0.620 | 0.628 | 0.659 |
| Chengduo | 0.416 | 0.420 | 0.417 | 0.432 | 0.457 |
| Maduo | 0.315 | 0.315 | 0.318 | 0.328 | 0.350 |
| Qumalai | 0.284 | 0.293 | 0.291 | 0.299 | 0.315 |
| Zhiduo | 0.311 | 0.299 | 0.303 | 0.323 | 0.348 |
| Xinghai | 0.388 | 0.379 | 0.389 | 0.397 | 0.418 |
| Tanggulashan | 0.218 | 0.214 | 0.211 | 0.235 | 0.250 |
| Tongde | 0.551 | 0.536 | 0.556 | 0.564 | 0.598 |
| Zeku | 0.553 | 0.560 | 0.562 | 0.561 | 0.605 |
| Maqin | 0.436 | 0.441 | 0.467 | 0.461 | 0.486 |
| Gande | 0.522 | 0.525 | 0.551 | 0.543 | 0.568 |
| Mean | 0.427 | 0.424 | 0.434 | 0.448 | 0.475 |
| Stations | Mean Precipitation (mm) | Correlation Coefficients with NDVI | ||
|---|---|---|---|---|
| Precipitation | MI | Temperature | ||
| Tanggulashan | 266.7 | 0.436 * | 0.448 * | 0.412 * |
| Zhiduo | 273.4 | 0.313 | 0.331 | 0.432 * |
| Maduo | 275.4 | 0.440 * | 0.442 * | 0.403 * |
| Xinghai | 336.7 | 0.420 * | 0.368 * | 0.107 |
| Qumalai | 367.8 | 0.183 | 0.197 | 0.233 |
| Yushu | 408.1 | −0.128 | −0.216 | 0.711 * |
| Chengduo | 427.2 | 0.118 | 0.077 | 0.564 * |
| Dari | 457.2 | 0.057 | −0.051 | 0.701 * |
| Zaduo | 466 | 0.129 | 0.192 | 0.483 * |
| Nangqian | 477.4 | 0.228 | 0.168 | 0.547 * |
| Banma | 534.3 | −0.107 | −0.143 | 0.755 * |
| Jiuzhi | 577.7 | 0.059 | −0.076 | 0.743 * |
| Country | 1998 | 1999 | ||||
|---|---|---|---|---|---|---|
| AVHRR | SPOT | Change | AVHRR | SPOT | Change | |
| Zeku | 0.43 | 0.40 | 0.03 | 0.27 | 0.27 | 0.00 |
| Henan | 0.47 | 0.45 | 0.02 | 0.40 | 0.38 | 0.02 |
| Tongde | 0.39 | 0.38 | 0.01 | 0.28 | 0.26 | 0.02 |
| Xinghai | 0.26 | 0.23 | 0.03 | 0.18 | 0.16 | 0.02 |
| Maqin | 0.29 | 0.29 | 0.01 | 0.23 | 0.20 | 0.03 |
| Banma | 0.38 | 0.37 | 0.01 | 0.32 | 0.25 | 0.06 |
| Gande | 0.38 | 0.35 | 0.03 | 0.30 | 0.25 | 0.05 |
| Dari | 0.29 | 0.28 | 0.01 | 0.24 | 0.21 | 0.03 |
| Jiuzhi | 0.40 | 0.40 | 0.00 | 0.32 | 0.31 | 0.02 |
| Maduo | 0.20 | 0.18 | 0.02 | 0.16 | 0.14 | 0.02 |
| Yushu | 0.28 | 0.29 | −0.01 | 0.22 | 0.22 | 0.00 |
| Zaduo | 0.19 | 0.19 | 0.00 | 0.16 | 0.15 | 0.01 |
| Chengduo | 0.25 | 0.23 | 0.02 | 0.18 | 0.18 | 0.00 |
| Zhiduo | 0.18 | 0.18 | 0.00 | 0.14 | 0.13 | 0.01 |
| Nangqian | 0.29 | 0.29 | 0.00 | 0.23 | 0.24 | −0.01 |
| Qumalai | 0.18 | 0.15 | 0.02 | 0.13 | 0.12 | 0.01 |
| Tanggula | 0.13 | 0.12 | 0.01 | 0.12 | 0.11 | 0.01 |
| Total | 0.29 | 0.28 | 0.01 | 0.23 | 0.21 | 0.02 |
© 2017 by the authors. Licensee MDPI, Basel, Switzerland. This article is an open access article distributed under the terms and conditions of the Creative Commons Attribution (CC BY) license (http://creativecommons.org/licenses/by/4.0/).
Share and Cite
Lu, Q.; Ning, J.; Liang, F.; Bi, X. Evaluating the Effects of Government Policy and Drought from 1984 to 2009 on Rangeland in the Three Rivers Source Region of the Qinghai-Tibet Plateau. Sustainability 2017, 9, 1033. https://doi.org/10.3390/su9061033
Lu Q, Ning J, Liang F, Bi X. Evaluating the Effects of Government Policy and Drought from 1984 to 2009 on Rangeland in the Three Rivers Source Region of the Qinghai-Tibet Plateau. Sustainability. 2017; 9(6):1033. https://doi.org/10.3390/su9061033
Chicago/Turabian StyleLu, Qingshui, Jicai Ning, Fuyuan Liang, and Xiaoli Bi. 2017. "Evaluating the Effects of Government Policy and Drought from 1984 to 2009 on Rangeland in the Three Rivers Source Region of the Qinghai-Tibet Plateau" Sustainability 9, no. 6: 1033. https://doi.org/10.3390/su9061033