1. Introduction
With the recovery of the global economy and the constant development of industrialization, renewable energy has attracted increasing attention of the world. Traditional energy, such as fossil fuel energy, especially coal, will cause a greenhouse effect and air pollution. According to statistics from the Global Carbon Project, carbon dioxide emission from burning coal accounted for 43% of global emissions in 2013 [
1]. China has the largest carbon dioxide emission, which occupies 29% of the world’s total emissions. Meanwhile, fossil fuel as a non-clean energy will cause hazy weather and generate particulate matter during the burning process. According to the PM2.5 and PM10 monitoring report of the World Health Organization, only 12% of the residents of the world are living in a place that reaches the air quality standard set by the World Health Organization [
2].
Compared to fuel energy, renewable energy is clean. Renewable energy includes solar energy, wind power, hydro power, tidal energy, biomass, etc. The paper will focus on solar energy.
With the technical improvement and wide application of silicon wafers, the PV industry has been growing very quickly in the past few decades [
3]. This turns solar power into electricity with the advantages of being renewable, clean and easy to install. According to the European Photovoltaic Industry Association, global PV capacity reached 138.9 GW at the end of 2013 [
4]. Compared to the capacity of 23 GW in 2009, the growth rate is up to 500%. From EPIA (European Photovoltaic Industry Association)’s analysis, a PV plant of this capacity can generate 160 terawatt hours of electricity, which is equal to the energy supply of 32 large fossil fuel power stations, and it can provide electricity to 45 million European residents.
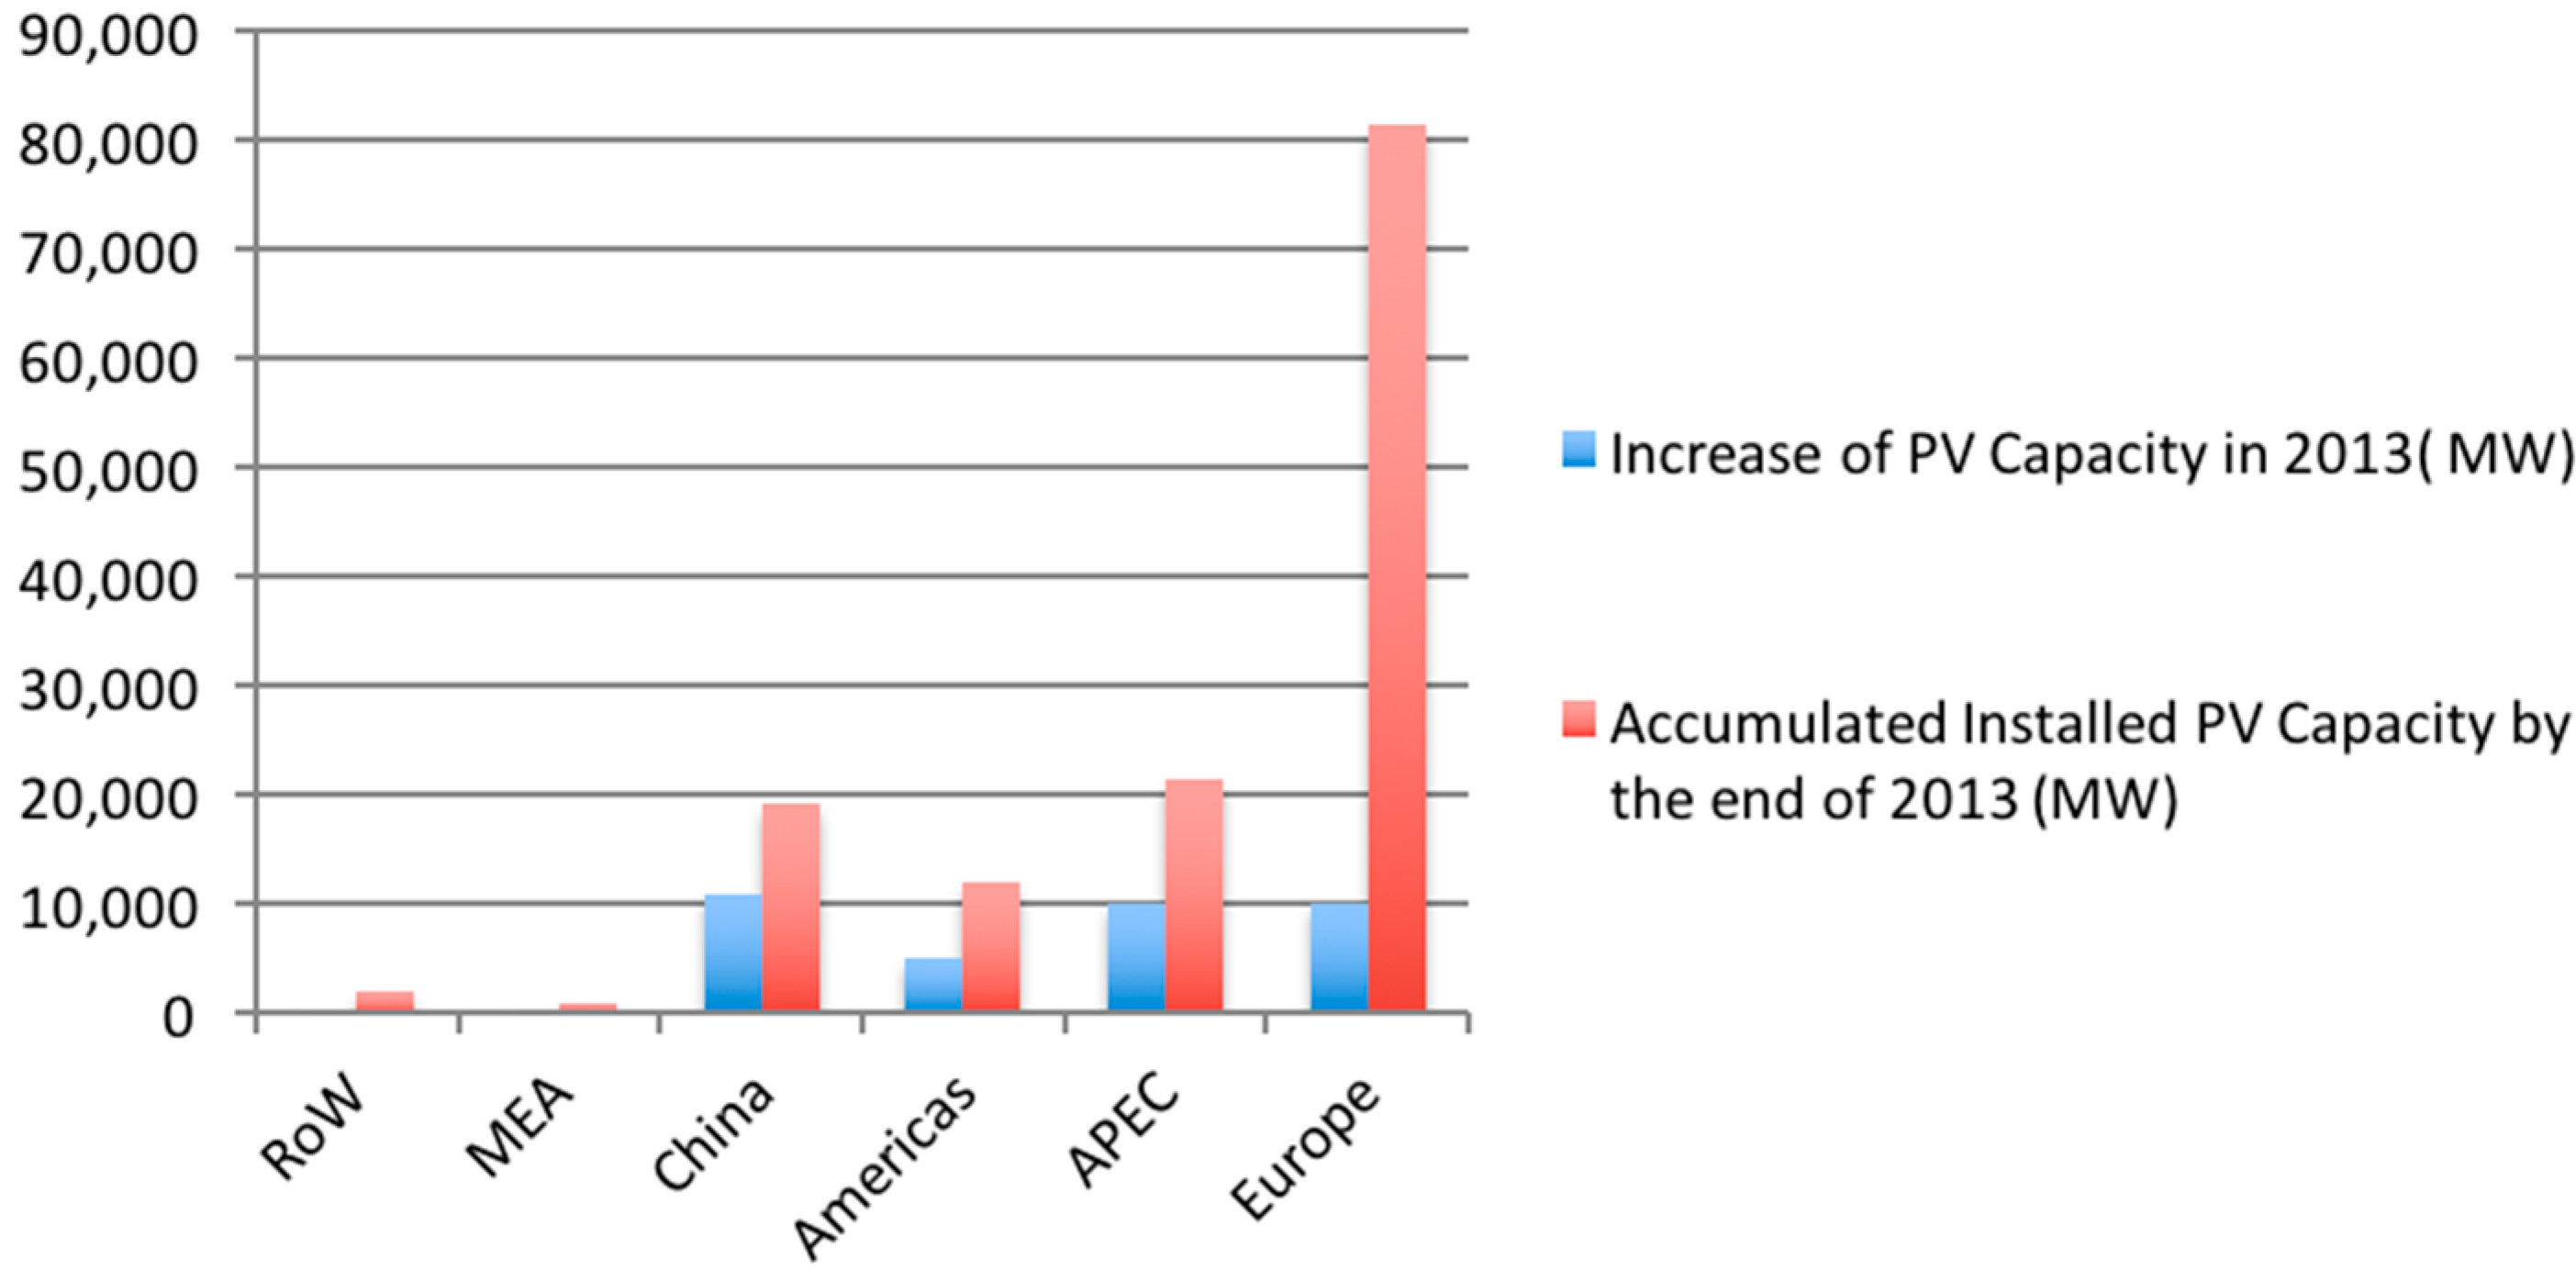
From a global perspective, the European PV industry started earlier than the rest of the world. Spain’s PV industry grew rapidly in the very beginning, and then was followed by Germany and Italy. The European PV industry reached its peak in 2011. In 2013, Europe reached a PV capacity of 81.5 GW and took first place in the world, and Germany has the biggest capacity among all European countries [
4]. The PV industry in China grew quickly in recent years. In 2013, the new installation was 11,800 MW, which was the highest in the world.
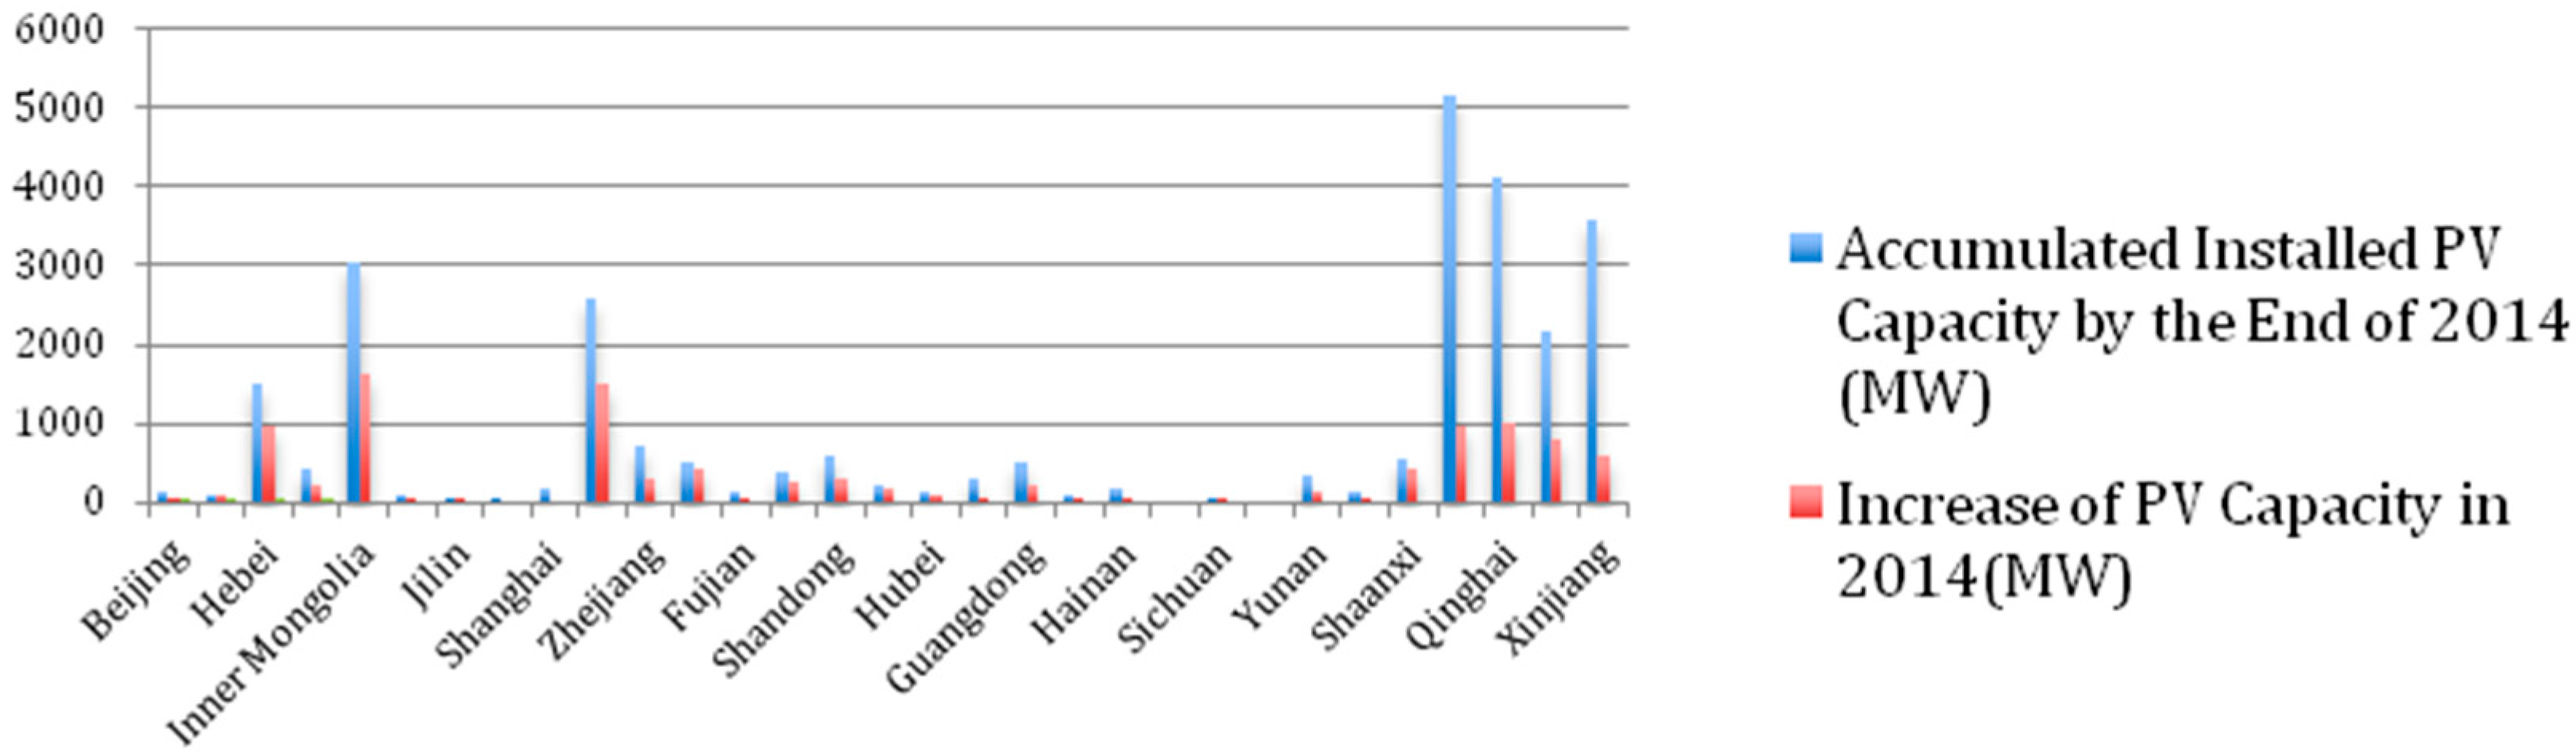
Figure 1 shows the accumulated capacity and incremental capacity of 2013 from a global view. For Mainland China, installed PV plants are mainly concentrated systems, but the government is also working on developing distributed ones. By the end of 2014, Gansu Province, Qinghai Province and Xinjiang Uygur Autonomous Region had the top three largest accumulated capacities, which are presented in
Figure 2 [
5].
Figure 1.
Distribution of PV capacity around the world in 2013 (RoW: Rest of the World, MEA: Middle-East Asia, APEC: Asia-Pacific Economic Cooperation).
Figure 1.
Distribution of PV capacity around the world in 2013 (RoW: Rest of the World, MEA: Middle-East Asia, APEC: Asia-Pacific Economic Cooperation).
Figure 2.
Distribution of PV capacity in Mainland China in 2014.
Figure 2.
Distribution of PV capacity in Mainland China in 2014.
Sunlight has a huge impact on PV power generation, which could lead to the instability of electricity generation sometimes, and the cost of PV generation has remained high for a long time. Thus, it is hard for companies to profit [
6]. The PV industry is still government driven [
4]. In order to support PV companies, the government made a variety of financial subsidy policies, including capital subsidies, feed-in-tariff (FIT) subsidies, green certificate trading (GCT),
etc. Countries should provide incentive polices based on each country’s PV development phase [
7]. In the early stage, the government is inclined to provide capital subsidies as a percentage of the companies’ initial investment. At the time when connecting the PV systems to the electricity grid becomes possible, capital subsidies, FIT and other polices can be feasible. Subsidies are always given to the supply side first and then to the demand side.
Scholars did some remarkable research about countries’ PV subsidy policies and their efficiency.
Dusonchet and Telaretti [
8,
9] introduced Western and Eastern European countries’ subsidy policies, including FIT, GCT and tax credits. Campoccia
et al. [
10] studied 27 European countries’ subsidy policies and compared FIT and GCT of four representative countries based on payback period, ROI, IRR (Internal Rate of Return) and NPV. Menanteau
et al. [
11] compared the subsidy efficiency of the bidding system, FIT and GCT of European areas and pointed out that FIT is more efficient than bidding systems.
In Australia, the government ran the PV Rebate Program and Solar Homes and Communities Plan to support the PV industry. When residents purchase and install a PV system, they are able to obtain subsidies as a percentage of the purchase price [
12]. However, this policy did not work well for improving environmental and economic efficiency. It was not significant for the reduction of CO
2 emissions, nor fair for residents with low income, because successful applicants are mainly rated as having a medium or high income level. Jeon
et al. [
13] found that the current financial subsidy for the PV industry in Korean is not efficient. He analyzed the behaviors of investors, decision makers and customers, as well as external factors, including energy, the economy and environmental conditions, and implemented a real options dynamical model to simulate the interaction among those entities and factors. The result showed that Korea could still meet its target, even if it reduce financial subsidies by 669.9 USD and increased R & D for PV by 310.4 USD. As a strong player in the Asian PV market, Japan’s regional government was clearly helpful for promoting PV installation. Zhang
et al. [
14] analyzed panel data from 1996 to 2006 of 47 prefectures in Japan and found that both capital subsidies provided by the government and the decrease of installation cost have a significant positive impact on PV diffusion. Taiwan provided capital subsidies based on installed capacity by companies or individuals; Hsu [
15] used a dynamical model to evaluate Taiwan’s efficiency of FIT and capital subsidies. It was shown that when the upper limit of ROI is fixed, each single subsidy policy will be efficient, but the combination of two policies will not be. Avril
et al. [
7] believed that there should be a balance between the promotion of subsidy policies and the development speed of the PV industry. In the early phase of Spain’s PV industry, PV demand grew rapidly, and the price increased in a short time due to the government’s promotion policy. This resulted in turbulence in the job market when demand went down. Huo and Zhang [
16] illustrated the PV market and subsidy policies in China, which include capital subsidies, FIT and a public bidding system. The research mentioned the problem of lacking R & D programs and lacking a decreasing rate of capital subsidy to stimulate companies to lower production cost.
2. Problems of PV Subsidy Policies in China
The PV market in China is growing very quickly, which leads to a significant impact on the world’s PV economy. In 2013, the incremental PV capacity of China was in first place in the world. The government launched the Golden-Sun Project in 2009 to provide capital subsidies. For a grid-connected PV system, the government provided a financial subsidy of 50% of the initial investment; for an independent PV system in remote areas without grid connection, the subsidy was 70% of the initial investment. Starting from March 2013, the MoF (Ministry of Finance of China)of China suspended approval of the Golden-Sun Project.
However, this incentive policy not only brought high-speed development of the PV industry, but also led to some issues.
In order to gain short-term profit, investors invested in excessive PV systems. The market was not able to react simultaneously, and the Matthew effect appeared. Installed capacity was much larger than power generation; the idle rate was up to 40% in 2012. Oversea markets, such as the U.S. and Europe, took anti-subsidy actions to limit the import of Chinese PV products due to unfair competition resulting from low prices [
17] Hence, it is urgent for companies to adjust strategies for oversea markets. Capital subsidies are provided before the installation of systems, which leads to a lack of incentive for investors to maximize power generation; the digression rate of FIT and capital subsidies has not been settled [
18]. When the cost decreasing rate is lower than the subsidy digression rate, owners of a PV plant are able to gain a huge profit through the gap [
16]. Among the successful applicants for the Golden-Sun Project, several companies were not able to finish their installation on time. In June 2013, the National Audit Office of China audited approved companies of the Golden-Sun Project and found that several companies were trying to obtain subsidies with illegal application materials. The total subsidy they tried to get illegally was up to 210,000,000 RMB (about 33,894,000 USD) [
19].
PV subsidy policies in China are still developing. During this phase, it is inevitable that unfairness and low efficiency appear. Previous scholars mainly focused on the evaluation of current incentive policies, including the impact on overseas and domestic markets, related social issues, environmental issues, etc. However, research focused on making subsidy policies for the PV industry is not enough. As a country with special conditions, China has large regional diversity. Environmental conditions, economic status and energy efficiency among provinces and municipalities are different. Imitating and learning from developed countries directly may not be wise. In contrast, considering the difference among each region and setting multi-layered subsidies are favorable for leading companies to invest in regions with better development conditions and building highly efficient PV systems.
3. Evaluation Framework
There are many factors contributing to PV efficiency. We will discuss these factors from three aspects considering the differences among regions. They are the ability to develop renewable energy, renewable energy efficiency and environmental responsibility.
Table 1 illustrates the evaluation framework.
Table 1.
PV subsidy efficiency evaluation framework.
Table 1.
PV subsidy efficiency evaluation framework.
| Prime Indicators | Subsidiary Indicators | Directions |
|---|
| Ability to Develop Renewable Energy | Regional GDP | Positive |
| GDP Per Capita | Positive |
| Investment in the Energy Industry | Positive |
| R & D Funds in Industrial Enterprises above a Designated Size | Positive |
| General Financial Revenue | Positive |
| Electricity Consumption | Positive |
| Renewable Energy Efficiency | Energy Consumption per Unit GDP | Negative |
| Electricity Consumption per Unit GDP | Negative |
| Sunshine Duration | Positive |
| Nitrogen Oxide Emission | Negative |
| Dust Emission | Negative |
| Environmental Responsibility | Financial Expenditure for Environmental Protection | Positive |
| Green Cover Rate for Built-Up Areas | Positive |
| Thermal Power Generation Percentage | Negative |
| Coal Consumption | Negative |
| Sulfur Dioxide Emission | Negative |
| Forest Coverage Rate | Positive |
| Completed Investment for Treatment of Waste Gas | Positive |
| Accumulated Installed PV Capacity | Positive |
3.1. Renewable Energy Efficiency
We will discuss two aspects concerning PV efficiency. One is the efficiency of the supply side. Environmental conditions are some of the most important factors influencing PV generation efficiency. When the other conditions stay the same, the better the environmental conditions, the higher the generating/capacity rate, which means it is more productive. The other is the efficiency of the demand side, which could be explained by the economic value generated from unit energy consumption. The smaller the energy consumption per unit GDP, the larger the economic contribution from unit energy consumption. Hence, we pick sunshine duration and haze as the weather conditions to evaluate supply side efficiency and energy consumption per unit GDP and electricity consumption per unit GDP to evaluate the demand side efficiency of provinces and municipalities.
3.1.1. Weather Conditions
PV systems transform solar energy into electricity. The intensity of solar energy absorbed by silicon wafers directly affects the production rate of PV systems. Weather conditions play an important role in the intensity of sunshine reflecting off the silicon wafers, while sunshine duration and haze are two important weather factors.
Many scholars have verified the effect of sunshine hours on PV efficiency [
20,
21]. China is the third biggest country in the world, and it has a variety of weather conditions in 31 PMs, which is attributed to different sunshine hours among the areas. According to China Statistical Year Book, from 2007 to 2013, the province with the longest average sunshine duration is Tibet, with an average annual sunshine duration of 3120.6 h, while the province with shortest sunshine duration is Sichuan Province, with an average 904.1 h a year, which is 2216.5 h less than Tibet and 6 h less per day [
22]. With such a large national territorial area, China has diverse weather and geographical conditions, which contribute to significant differences in sunshine duration among regions and lead to different solar energy resources for PV systems from the environmental perspective.
Except for the huge difference in sunshine conditions among regions, haze is also an important factor that has affected PV efficiency in China in recent years. Haze is a kind of air pollution that consists of sulfur dioxide, nitrogen oxide and particulate matter. Particulate matter mainly comes from automobile exhaust, burning of coal, industrial waste gas, dust from construction sites, etc. In January 2013, serious hazy weather happened four times in 30 provinces and municipalities to varying degrees. In Beijing, only five days in January were not hazy. The National Disaster Management Office of China classified hazy weather as a natural disaster in January 2014.
Scholars proved that deposition from air pollution has a negative impact on PV generation efficiency, especially particulate matter, including dust from the burning process, coal ash from burning, clay, dust, red clay and lime [
23,
24,
25,
26,
27]. Sanchez and Cheng studied the relation between PM2.5 and the PV output rate in Taipei [
28]. It showed that the PV production rate decreased significantly in days with serious air pollution. In June 2013, terrible haze also appeared in Singapore. Liu
et al. [
29] analyzed data and found that the PV generation rate was clearly affected by hazy weather.
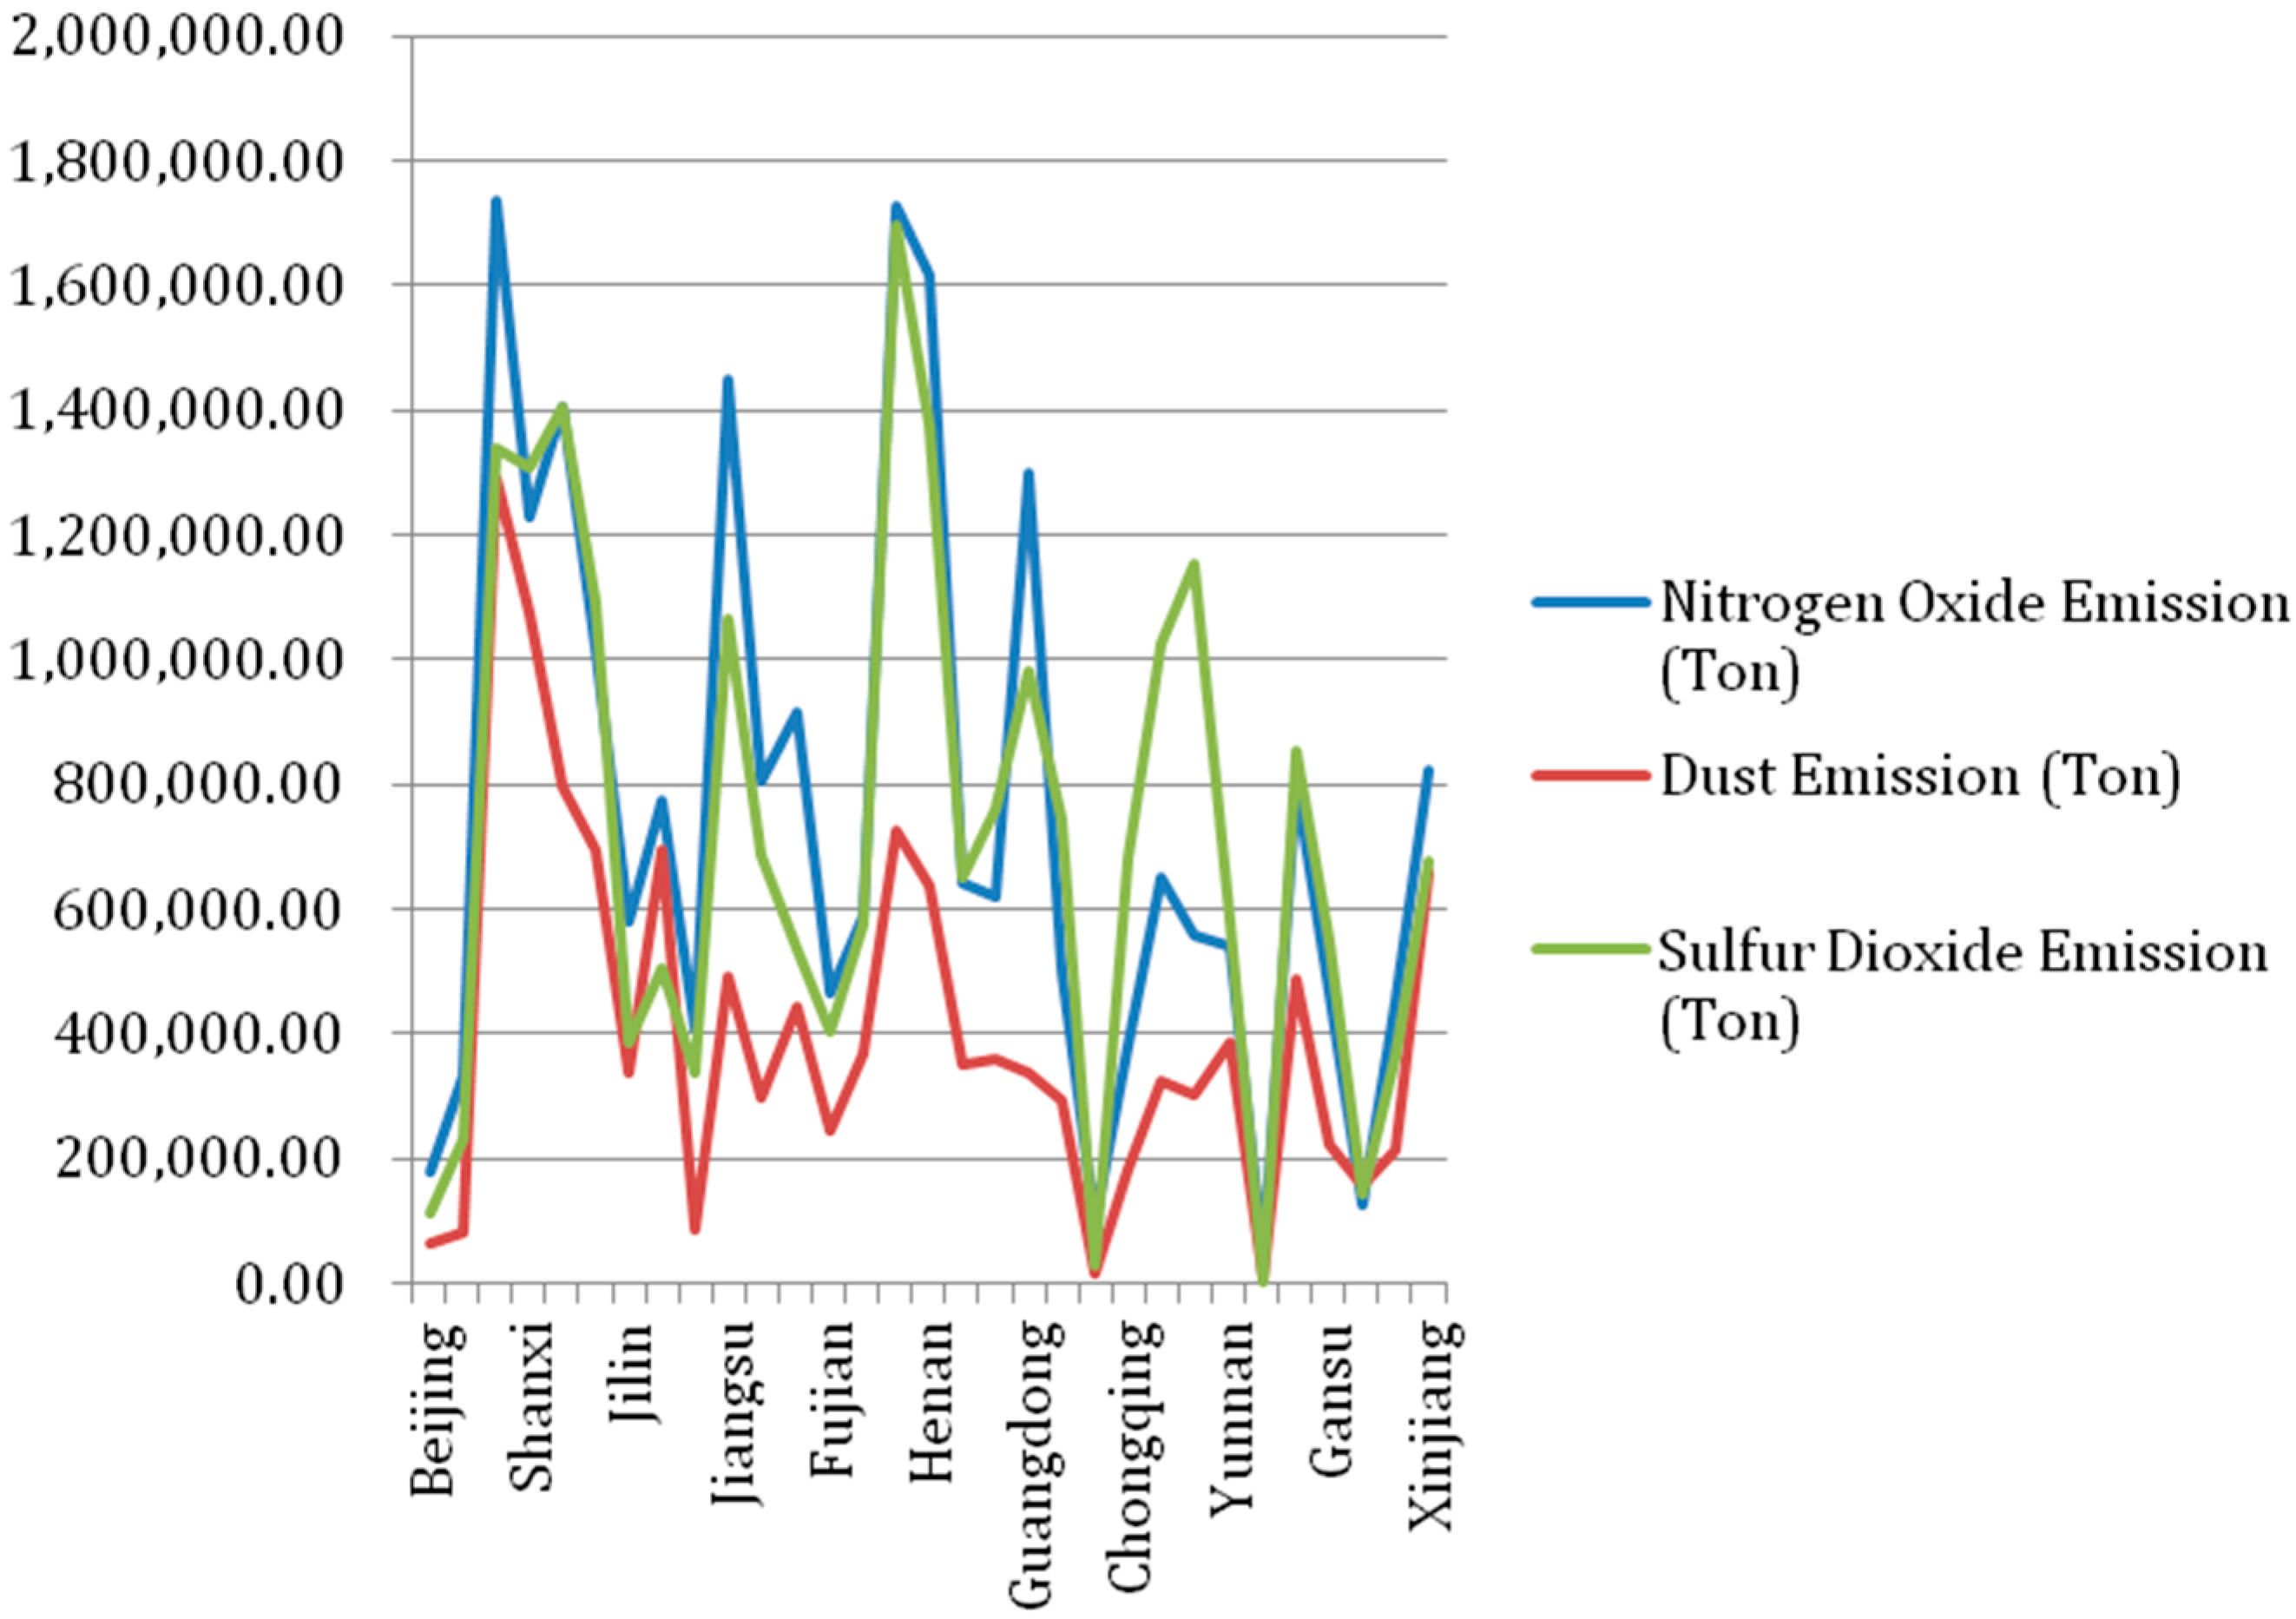
The degree of haze varies among regions. In China, heavily polluted areas are mostly cities with intensive industry development. North China has the severest pollution, followed by the Yangtze River Delta zone, while the western part and southern coastal cities are normally clean. According to the PM2.5 statistics for provinces and municipalities of China from 2011 to 2013, Hebei Province has the highest annual average nitrogen oxide emission and dust emission, which are 40-times and 165-times those of Tibet, respectively.
Figure 3 illustrates the three-year annual average nitrogen oxide emission, dust emission and sulfur dioxide emission for mainland China from 2011 to 2013. Different economic status, population, industrial density, social conventions and other factors resulted in different environmental quality for regions, leading to differences in the supply side efficiency of PV systems ultimately.
In districts with severe haze, the PV generation rate is low, and the transfer of the energy structure from thermal power to PV power is slow, which leads to an inefficient response of haze. However, PV systems are more productive in places with better environmental conditions. Thus, the PV power generated could be connected to the grid and delivered to the rest of the country, which would help regions improve their energy structure, reduce air pollution and obtain a better external environment for the development of PV systems; this forms a virtuous cycle.
Figure 3.
Three-year haze pollution for Mainland China starting from 2011.
Figure 3.
Three-year haze pollution for Mainland China starting from 2011.
3.1.2. Energy Efficiency
For demand side energy, we take energy consumption per unit GDP and electricity consumption per unit GDP into account. Developing the PV industry is not only for environmental benefit, but also for economic benefit. Due to the variation in production resources, local policies, industrial structure, etc., the GDP from unit energy consumption is different among the regions.
Energy consumption stands for energy intensity. In Nathan’s research, he took energy consumption per unit GDP as an indicator of average energy intensity for his valuation model [
30]. Other researchers discussed energy consumption per unit GDP, as well; they suggested that efficiency effects contributed to a majority of the decline of energy intensity [
31]. In this paper, we mainly discuss electricity, which is one of the most important forms of energy, and electricity consumption per unit GDP has a similar calculation pattern as energy intensity; thus, we took electricity consumption per unit GDP as an indicator, as well. For regions with low energy consumption per unit GDP, they require less energy consumption for the increase of unit GDP, which means a higher utility rate for energy. When other conditions stay the same, those regions could gain more economic benefit with less energy consumption. Thus, these regions should be encouraged to develop renewable energy to gain economic and social benefits efficiently.
3.2. Ability to Develop Renewable Energy
Indicators in this sector stand for economic conditions in each area. Many scholars pointed out the bidirectional causal relationship between economic growth and energy use [
32,
33]. Thus, high GDP has a positive impact on energy. For indicators like investment in energy and R & D funds in industrial enterprises, they are the cash flow for energy development. It is obvious that the higher these indicators are, the higher is the ability to develop renewable energy. For general financial revenue, this mainly comes from tax and flows to government expenditure or investment, which are highly relevant to renewable energy development. For electricity consumption, which is included in energy consumption, due to its causal relationship with economic growth, we see it as a positive indicator, as well.
Economic conditions are greatly different among the 31 provinces and municipalities. For general financial revenue from 2007 to 2013, the province with the highest annual average revenue is Guangdong with 472.69 billion RMB, while Tibet has the lowest revenue for the seven years, which is as low as 4.97 billion RMB. Meanwhile, there is a larger gap for R & D funds in industrial enterprises above a designated size among the regions. Jiangsu has annual average industrial R & D funds of 85.4 billion RMB, which is 1900-times Tibet’s 44.9 million RMB.
In order to improve the PV industry’s efficiency, the government should subsidize places with better economic conditions. The main reason is that these places have more resources, including talent, capital, R & D institutes, technology, education resources, highly efficient government departments, etc, as listed in
Table 2 These factors are highly important for the development of an industry, especially for a high-tech industry, such as PV, which highly depends on technology, talent and capital. Better economic conditions are also favorable for the development of the PV industry due to economies of scale.
Table 2.
Differences in the Ability to develop renewable energy among regions.
Table 2.
Differences in the Ability to develop renewable energy among regions.
| | GDP (100 Million Yuan) | GDP Per Capita (Yuan/Capita) | Investment in Energy Industry (100 Million Yuan) |
| Peak | GD | 46,689 | SH | 76,162 | NMG | 1826 |
| Nadir | Tibet | 544 | GZ | 14,442 | Tibet | 66 |
| Multiple | 86 | 5 | 28 |
| | R & D Funds in Industrial Enterprises above a Designated Size (10 Thousands Yuan) | General Financial Revenue (100 Million Yuan) | Electricity Consumption (100 Million KWh) |
| Peak | JS | 8,542,638 | GD | 4727 | GD | 4060 |
| Nadir | Tibet | 4496 | Tibet | 50 | Tibet | 22 |
| Multiple | 1900 | 95 | 188 |
3.3. Environmental Responsibility
Scholars implemented a variety of indicators to evaluate social environmental responsibility. One of the most famous ones is the framework proposed by Global Reporting Initiative (GRI) [
34]. It proposed economic, social and environmental indicators. Many researchers did empirical studies based on this framework [
35]. In this valuation framework, energy and emissions and effluents and waste are two main aspects to be evaluated. Based on the idea of this authentic framework, we came up with a series of indicators to evaluate the environmental consciousness and responsibility of a local government. We also add a few valuable indicators based on the special conditions of China.
Environmental consciousness and responsibility of a local government can be reflected in several factors, including historical investment for environmental projects, the performance of historical and current environmental projects, etc. A government with a strong environmental consciousness and responsibility tends to have high promotion and efficiency for environmental projects, which lead to the better performance of those projects. In China, the efficiency of a government has a huge impact on the development of a certain industry, especially in a policy-driven industry. Hence, the country should provide better offers to such places.
Our research selected financial expenditure for environmental protection, the green coverage rate for built-up areas, thermal power generation percentage, coal consumption, sulfur dioxide emission, forest coverage rate, completed investment for treatment of waste gas and accumulated installed PV capacity as indicators for environmental consciousness and responsibility. These data were sourced from Status Statistics Bureau, and the indicators, such as green coverage rate for built-up areas, thermal power generation percentage, coal consumption, sulfur dioxide emission, forest coverage rate and accumulated installed PV capacity, reveal the current condition of the local government’s achievement with respect to environmental projects, while financial expenditure for environmental protection and completed investment for treatment of waste gas present how much a government has done for environmental projects. Next, we calculated each indicator’s entropy weight and found out the discrepancy of the regions for this indicator. Further, we sorted the evaluation objects based on TOPSIS and got the subsidy proportion for each province or municipality as references for the country’s subsidy policy.
5. Empirical Study
China has diverse environmental conditions due to a vast national territory area. Moreover, economic inequality among regions in China has caused social problems for a long time; more developed cities are mainly in the east coastal areas. Environmental conditions, economic status and energy efficiency are diverse among regions. The diversity has a more significant impact on the development of the PV industry.
In order to understand the discrepancy in the ability to develop the PV industry, energy efficiency and environmental responsibility among regions, we built a criteria matrix of 19 evaluation indicators of 31 provinces and municipalities in Excel based on the framework presented in
Table 1. The data are sourced from China Statistical Year Book of 2007 to 2013 [
46], except for accumulated installed PV capacity, which is updated to 2014 by NEA (Natioanl Education Association) [
5]. Missing data are filled based on the average method.
We calculate the entropy and the entropy weight for 19 indicators according to Equations (1) to (5) based on the entropy weight method, and we calculate evaluation scores
Ci for 31 provinces and municipalities according to Equations (6)–(11) based on the TOPSIS method. A lower
Ci stands for the larger competitiveness of energy efficiency, economic status and environmental conditions in developing the PV industry. To improve the efficiency of developing the PV industry, the government should provide higher subsidies for regions with a low
Ci score. The scores for 31 provinces and municipalities are presented in
Table 3.
Table 3.
Rank of the 31 provinces and municipalities (PM) of Mainland China in their efficiency for developing the PV industry.
Table 3.
Rank of the 31 provinces and municipalities (PM) of Mainland China in their efficiency for developing the PV industry.
| | | | Ci | Rank | Subsidy Proportion |
|---|
| Qinghai | 0.161 | 0.178 | 0.475 | 1 | 4.83% |
| Jiangsu | 0.163 | 0.162 | 0.501 | 2 | 4.59% |
| Gansu | 0.170 | 0.166 | 0.505 | 3 | 4.55% |
| Guangdong | 0.174 | 0.157 | 0.526 | 4 | 4.36% |
| Tibet | 0.208 | 0.161 | 0.564 | 5 | 4.01% |
| Sichuan | 0.190 | 0.131 | 0.592 | 6 | 3.75% |
| Hubei | 0.184 | 0.127 | 0.593 | 7 | 3.74% |
| Zhejiang | 0.180 | 0.119 | 0.602 | 8 | 3.66% |
| Xinjiang | 0.187 | 0.123 | 0.604 | 9 | 3.65% |
| Shandong | 0.205 | 0.129 | 0.614 | 10 | 3.55% |
| Yunan | 0.194 | 0.122 | 0.615 | 11 | 3.54% |
| Inner Mongolia | 0.192 | 0.112 | 0.632 | 12 | 3.38% |
| Guangxi | 0.203 | 0.112 | 0.645 | 13 | 3.27% |
| Fujian | 0.199 | 0.109 | 0.646 | 14 | 3.26% |
| Beijing | 0.220 | 0.118 | 0.650 | 15 | 3.22% |
| Shanghai | 0.216 | 0.115 | 0.652 | 16 | 3.20% |
| Hunan | 0.195 | 0.103 | 0.655 | 17 | 3.18% |
| Tianjin | 0.223 | 0.108 | 0.675 | 18 | 2.99% |
| Chongqing | 0.212 | 0.098 | 0.683 | 19 | 2.92% |
| Hainan | 0.233 | 0.104 | 0.691 | 20 | 2.84% |
| Ningxia | 0.216 | 0.095 | 0.694 | 21 | 2.82% |
| Jiangxi | 0.217 | 0.092 | 0.701 | 22 | 2.75% |
| Jilin | 0.219 | 0.090 | 0.709 | 23 | 2.68% |
| Liaoning | 0.215 | 0.084 | 0.719 | 24 | 2.59% |
| Hebei | 0.211 | 0.081 | 0.723 | 25 | 2.55% |
| Shaanxi | 0.215 | 0.082 | 0.723 | 26 | 2.55% |
| Anhui | 0.222 | 0.079 | 0.736 | 27 | 2.43% |
| Heilongjiang | 0.229 | 0.081 | 0.740 | 28 | 2.39% |
| Guizhou | 0.224 | 0.079 | 0.740 | 29 | 2.39% |
| Henan | 0.223 | 0.074 | 0.752 | 30 | 2.28% |
| Shanxin | 0.231 | 0.068 | 0.773 | 31 | 2.08% |
5.1. Analysis of Entropy and Weight
Table 4 shows the entropy and weight for each indicator. The larger the weight, the larger the difference among the 31 provinces and municipalities for that indicator.
Table 4.
Entropy and weights for the 19 evaluation indicators.
Table 4.
Entropy and weights for the 19 evaluation indicators.
| Prime Indicators | Subsidiary Indicators | Entropy | Weight |
|---|
| Ability to Develop Renewable Energy | Regional GDP | 0.910 | 0.051 |
| GDP Per Capita | 0.905 | 0.054 |
| Investment in Energy Industry | 0.929 | 0.040 |
| R & D Funds in Industrial Enterprises above a Designated Size | 0.827 | 0.098 |
| General Financial Revenue | 0.911 | 0.050 |
| Electricity Consumption | 0.926 | 0.042 |
| Renewable Energy Efficiency | Energy Consumption per Unit GDP | 0.939 | 0.035 |
| Electricity Consumption per Unit GDP | 0.948 | 0.029 |
| Sunshine Duration | 0.956 | 0.025 |
| Nitrogen Oxide Emission | 0.909 | 0.052 |
| Dust Emission | 0.936 | 0.036 |
| Environmental Responsibility | Financial Expenditure for Environmental Protection | 0.943 | 0.032 |
| Green Coverage Rate for Built-Up Areas | 0.972 | 0.016 |
| Thermal Power Generation Percentage | 0.769 | 0.131 |
| Coal Consumption | 0.930 | 0.039 |
| Sulfur Dioxide Emission | 0.919 | 0.046 |
| Forest Coverage Rate | 0.929 | 0.040 |
| Completed Investment for Treatment of Waste Gas | 0.921 | 0.045 |
| Accumulated Installed PV Capacity | 0.755 | 0.139 |
Indicators with a weight over 0.1 are the thermal power generation percentage and accumulated installed PV capacity at the end of 2014. Indicators with a weight below 0.1 and over 0.05 are the regional GDP, GDP per capita, general financial revenue, R & D funds in industrial enterprises above a designated size and nitrogen oxide emission. The differences among the regions fir the indicators above are relatively significant. However, the green coverage rate for built-up areas only accounts for 0.02, which means it has less variation among the regions.
5.2. Analysis of Results in TOPSIS
Based on the entropy weight method, we sort 31 provinces and municipalities in TOPSIS. The larger the discrepancy with the negative ideal solutions, the smaller the discrepancy with the ideal solutions and the higher rank of the evaluation object. The top five regions are Qinghai, Jiangsu, Gansu, Guangdong and Tibet; the bottom five regions are Anhui, Heilongjiang, Guizhou, Henan and Shanxi.
First is Qinghai Province, which has a high rank in several highly weighted indicators. Qinghai is in second place in thermal power generation percentage (negative) and accumulated installed PV capacity and in the third place in nitrogen oxide emission (negative). Qinghai Province is located in remote western China. It possesses superior environmental conditions to develop renewable energy. It has already attracted a large amount of renewable energy investments, including wind energy, solar energy, etc. It has a relatively advanced energy structure, consciousness and responsibility and also a highly efficient environment to develop renewable energy. With the national strategy of western China development, Qinghai is supposed to get high policy subsidies for PV development. Our result conforms to the subsidy policy in the Golden-Sun Project, which is that the government provides 70% of initial investment as the subsidy for independent PV systems in remote areas.
Jiangsu Province is the second, which is located in the Yangtze River Delta economic development zone. Jiangsu has preeminent economic conditions for industries. As for the indicators with a higher weight, Jiangsu ranks first place in R & D funds in industrial enterprises above a designated size, second place in regional GDP and second place in general financial revenue. The well-developed economic environment brings more resources and opportunities for the PV industry. The rank conforms to the fact that Jiangsu is prioritized in developing distributed PV systems. Jiangsu ranks first place in accumulated installed distributed PV capacity and fifth place in total accumulated installed PV capacity.
Shanxi Province is at the bottom. Shanxi is famous for its coal. It highly depends on thermal power generation. Shanxi has the third highest thermal power generation percentage and ranks second place in dust emission. The traditional energy structure has a negative impact on environmental conditions, which is harmful for the efficiency of PV generation. This is one of the reasons that Shanxi has low accumulated installed PV capacity. For these kinds of places, we propose that the government should decrease PV subsidies and lead potential investment to places with higher development efficiency for the PV industry.
6. Conclusions
The global PV industry is still policy driven. In this paper, we discussed the differences in the ability to develop renewable energy, energy efficiency and environmental responsibility in 31 provinces and municipalities in China and proposed that the government should differentiate the amount of subsidies for the PV industry according to regional differences. We established 19 evaluation indicators, allocated weight to indicators through the entropy weight method, evaluated and sorted 31 provinces and municipalities through the TOPSIS method and obtained the subsidy proportion for each province or municipality. Through the multi-layer subsidy policy, the government could lead capital to places with higher development efficiency for the PV industry and increase PV generation with less capital and in a shorter time. It maximally avoids blind investment and waste of resources for PV installation, and it helps improve nationwide air quality, which could improve the energy structure, boost the PV industry from the national perspective and guarantee green growth.
It is more efficient than the Golden-Sun Project. The Golden-Sun Project only provided two layers of capital subsidies, which are 50% of the initial investment for distributed PV systems and 70% initial investment for remote, independent PV systems, respectively. This appealing policy made companies invest large amounts of money into the PV industry, which led to a high idle rate of PV capacity and a huge waste of money and installation resources. Even cheating on applying the subsidies happened. Compared to the two-layer capital subsidy policy, the paper proposed a 31-layer policy to differentiate subsidies for regions and controlled the upper limit of capital investment into each province or municipality accurately, which would lead to capital flow to places with better conditions for PV development.
We proposed a creative solution for PV subsidies considering the reality of China and for the green growth of each region, as well as the whole country. However, existing research concerning this area is not abundant. Hence, we could do more in the future. The selection of evaluation indicators could be more comprehensive; other factors affecting PV efficiency, such as cloud cover, can be included. Further, scholars can discuss the fairness of FIT or other subsidy methods in the future.


