Figure 8.
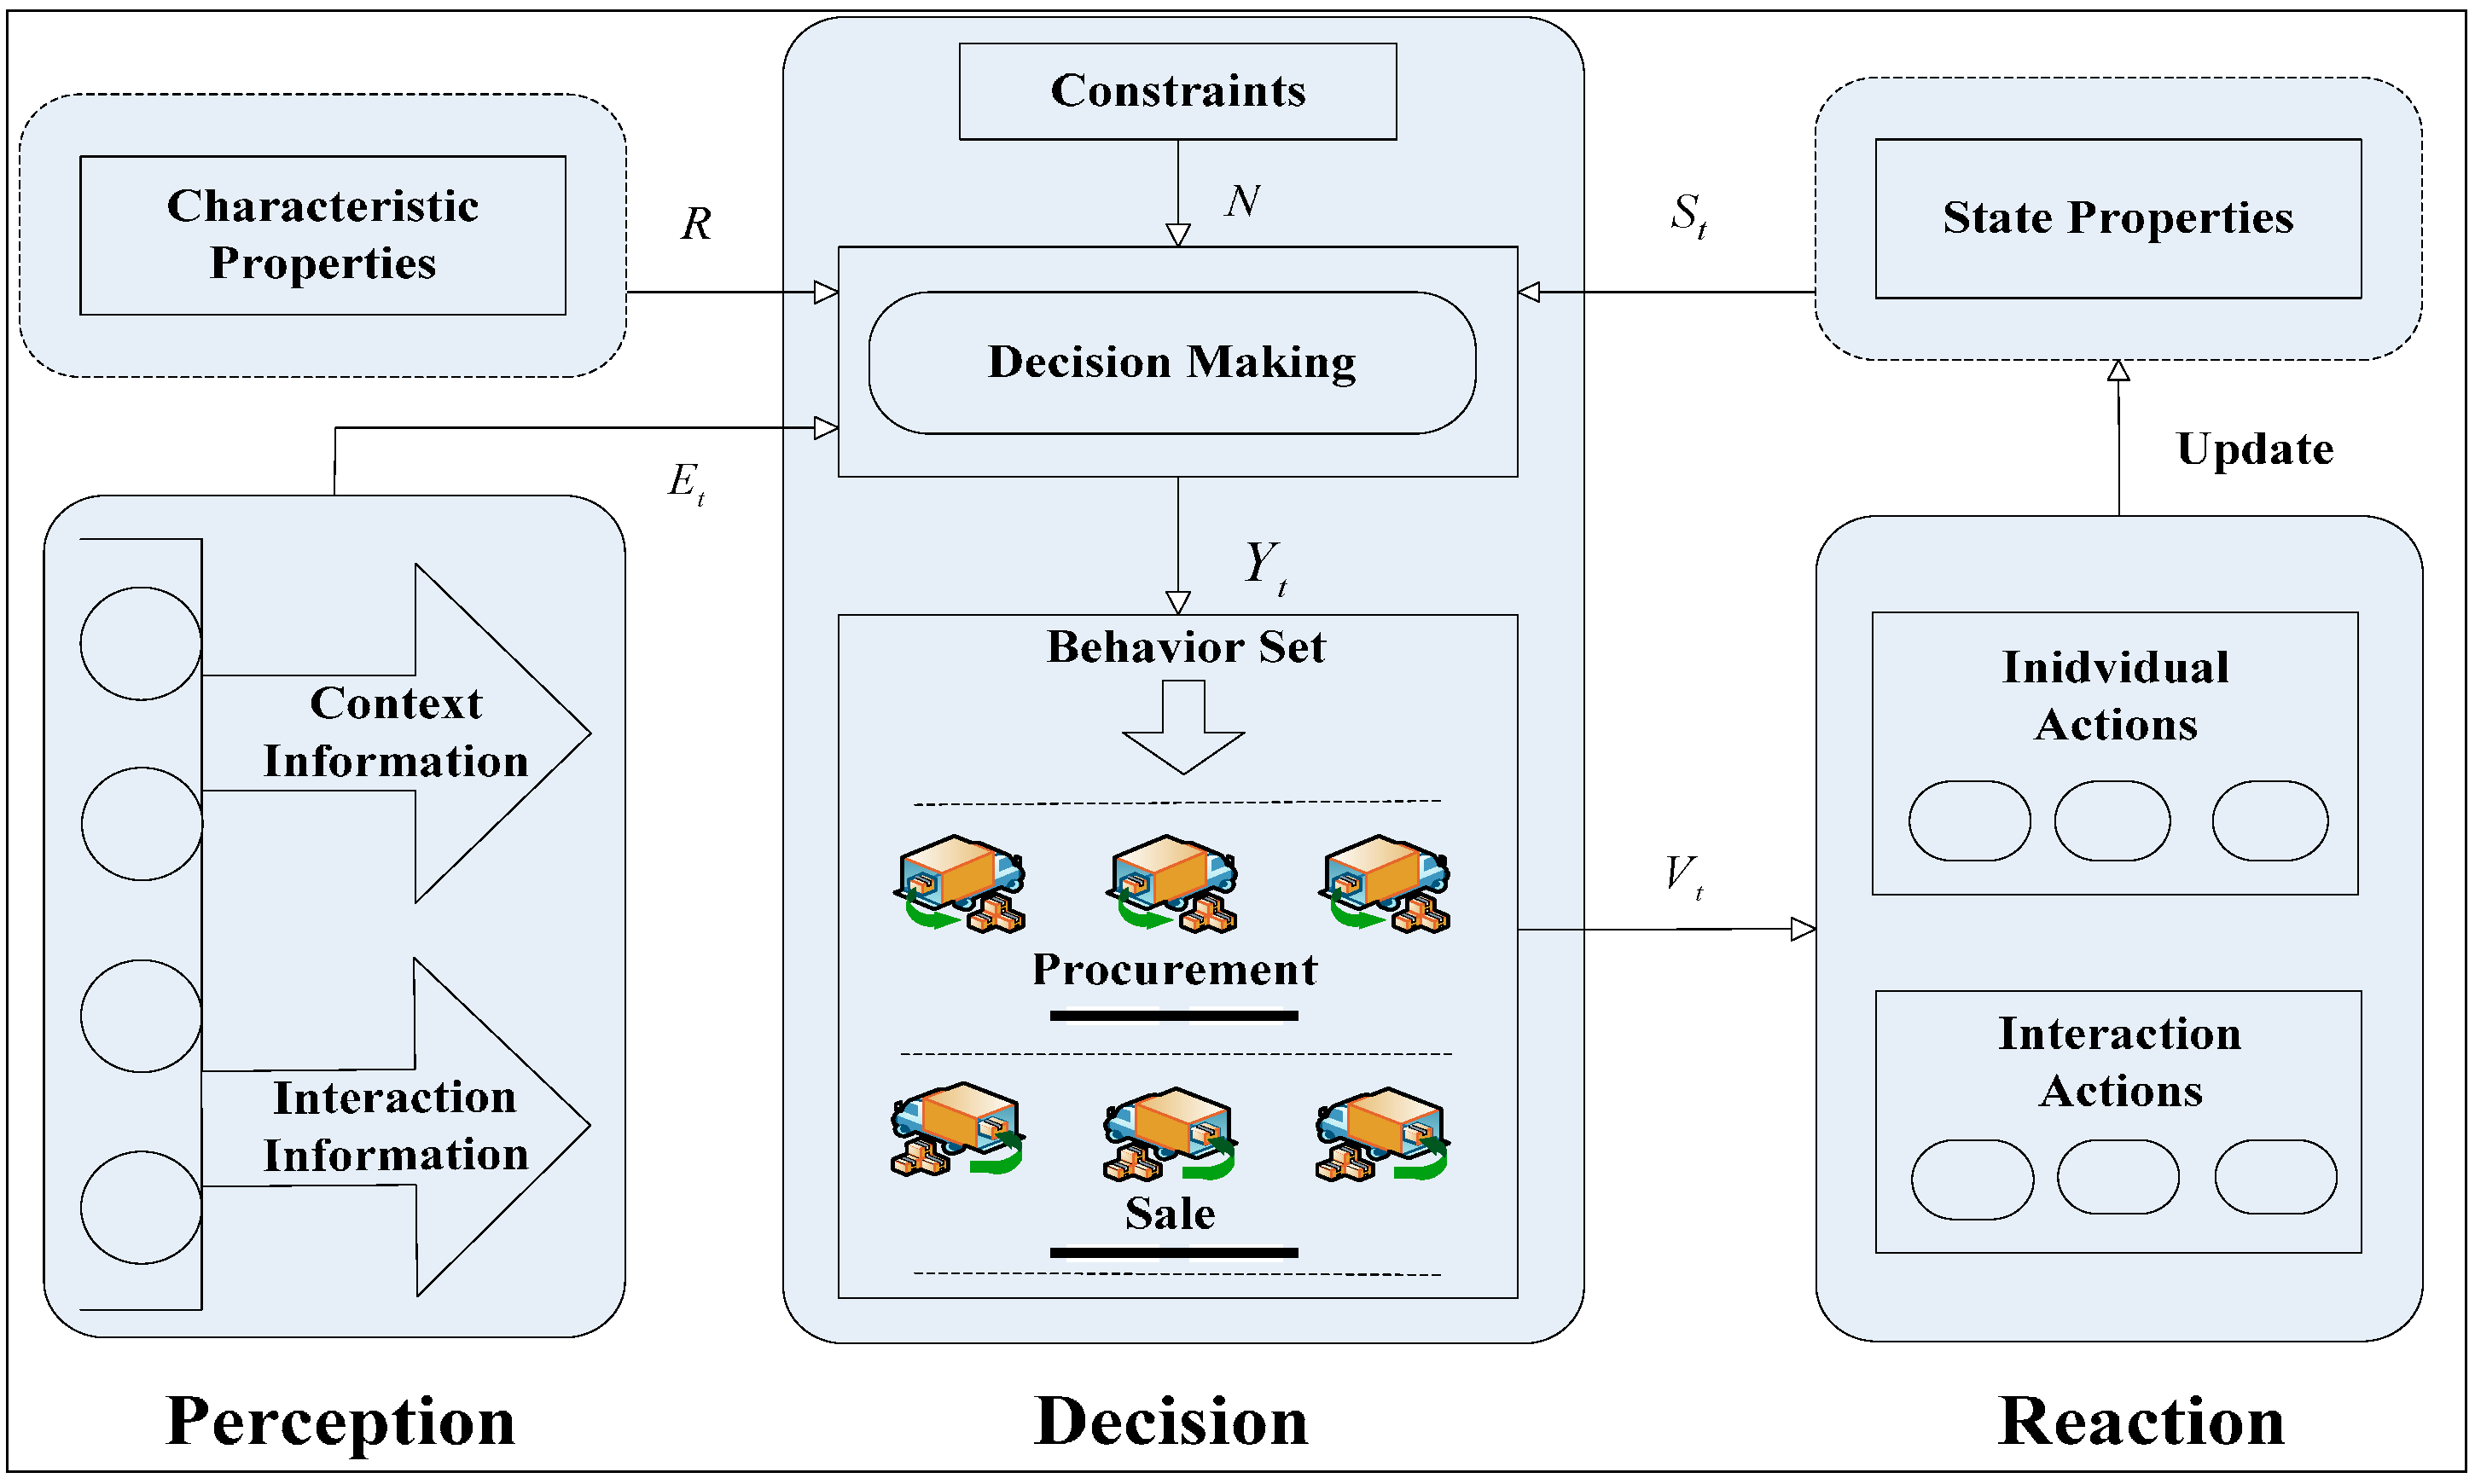
The framework of computational experiment method.
Without external intervention, experiment system will be in a state of natural evolution, which can be used to analyze the impact of initial environment on system evolution; otherwise, experiment system will be in a state of controlled evolution, which can be used to analyze the impact of external intervention on system evolution. This section clarifies the application process of computational experiment method by means of a case study, which takes service-charging policy as the intervention measure in the evolution of procurement pattern.
5.1. Initiation of Experiment System
The display interface of experiment operation is divided into two parts: the upper side indicates the activities of suppliers and the bottom side indicates the activities of manufacturers; gray lines represent the transactions between suppliers and manufacturers; green lines represent the transactions between service provider (or alliance leader) and suppliers; yellow lines represent the transactions between alliance leader and manufacturers; red lines represent the transactions between service provider and manufacturers. The parameters setting of the experiment is shown in
Table 17.
Table 17.
The parameters setting of computational experiment.
Table 17.
The parameters setting of computational experiment.
| Variable | Values | Total Values |
|---|
| The number of manufacturer | 60, located at the bottom side | 1 |
| The number of suppliers | 60, located at the upper side | 1 |
| The scale of enterprise agent | Large (yellow), Medium (dark blue), Small (light blue) | 3 |
| Default agent scale | Medium size | 1 |
| Enterprise distribution | Random | 1 |
| Supplier’s own cost | Fixed | 1 |
| Supplier’s sales price | Bounded random | 1 |
| Manufacturer’s procurement cost | 20% off, when quantity ≥ baseline × 2;
40% off, when quantity ≥ baseline × 5. | 2 |
| Manufacturer’s sales price | Bounded random | 1 |
| Supplier selection criteria | Price | 1 |
| Links between enterprises | Manufacturer, supplier; service provider, manufacturer; service provider, supplier; leader, supplier; leader, manufacturer. | 5 |
| Stable market demand | = | 2 |
| Interaction radius Ria | Bounded random in three ranges {r1, r2, r3}, and r1 < r2 < r3. | 3 |
| Inquiry radius Rio | Bounded random in three ranges {q1, q2, q3}, and q1 < q2 < q3. | 3 |
In the experiment, the market demands are supposed to be stable, which is objective and uncontrollable. In order to realize the controlled evolution, it is very important to identify the applicable condition of various intervention policies, such as the organizational form among enterprises (such as hierarchical or flat form), collaborative strategies (such as the profit distribution policy in the collaboration), coordination mechanism (such as the constraint mechanism for collaboration failure), and so on.
In the case study, service charging policy adopted by service provider is taken as the invention measure in the evolution of procurement pattern.
Table 18 gives the possible service charging policies and their parameter setting. Then, in the operation of experiment, service provider will adopt different service charging polices to compete with the other two procurement patterns. By means of comparative analysis, we can clarify the optimal service charging policy in the stable market environment, which can provide decision support to industry.
In order to identify the optimal policy, two main performance indicators are adopted in the experiment analysis: (1) the average profit of manufacturers in different procurement patterns; and (2) the number of manufacturers participating in different procurement patterns. The first indicator is used to judge whether the policy can keep the profit balance between service provider and manufacturers so as to realize the sustainable development of service provider. The second indicator is used to judge whether the policy can make service procurement prevail in the three procurement patterns, and attract manufacturers as many as possible.
Table 18.
The possible service charging policy in the service-centric collaborative procurement.
Table 18.
The possible service charging policy in the service-centric collaborative procurement.
| Name | Model | Characteristics |
|---|
| Transaction ratio |
Where α indicates the transaction ratio; indicates the unit product price when manufacturers participate service procurement; indicates the ordering quantity of the manufacturer at time t. | High transparency in service cost, which can help manufacturers to make a decision. However, if manufacturers can only obtain low profit from service procurement, the policy may hurt its interests. |
| Earnings ratio |
Where φ indicates earnings ratio; indicates the unit product price when this manufacturers participate service procurement; indicates the unit product price before manufacturers participate the service procurement; indicates the ordering quantity of this manufacturer at time t. | This policy makes some improvements on Transaction Radio, which can protect the interest of some low-profit manufacturers. But, it is difficult to identify the earning of manufacturers in the subsequent collaborative period. |
| Fixed Cost |
Where is the price charged by the service provider when manufacturers take part in service procurement for one time. | High transparency for both manufacturer and service provider, which can ensure the basic income of service provider. But, the potential income of service provider may be restricted. |
| Parameter setting | In order to ensure the comparability of different policies, their own possible maximum earnings under their respective parameter setting should be the same. For example, suppose the baseline value of market demand is set as 12,000, the unit product price is X, and the number of manufacturers is set as 60, the comparable parameters of the three policies can be set as the following: when the earnings ratio α is set to 0.25 and the maximum discount of service provider is 40%, its maximum possible earnings value is 12000 × X × (1 − 0.6) × 0.25 = 1200 × X; when the transaction ratio φ is set to 0.1, its maximum possible earnings is 12000 × X ×0.1 = 1200 × X; when the fixed cost is set to 20 × X, its maximum possible earnings is 20 × X × 60 = 1200 × X.
|
5.2. Operation of Computational Experiment
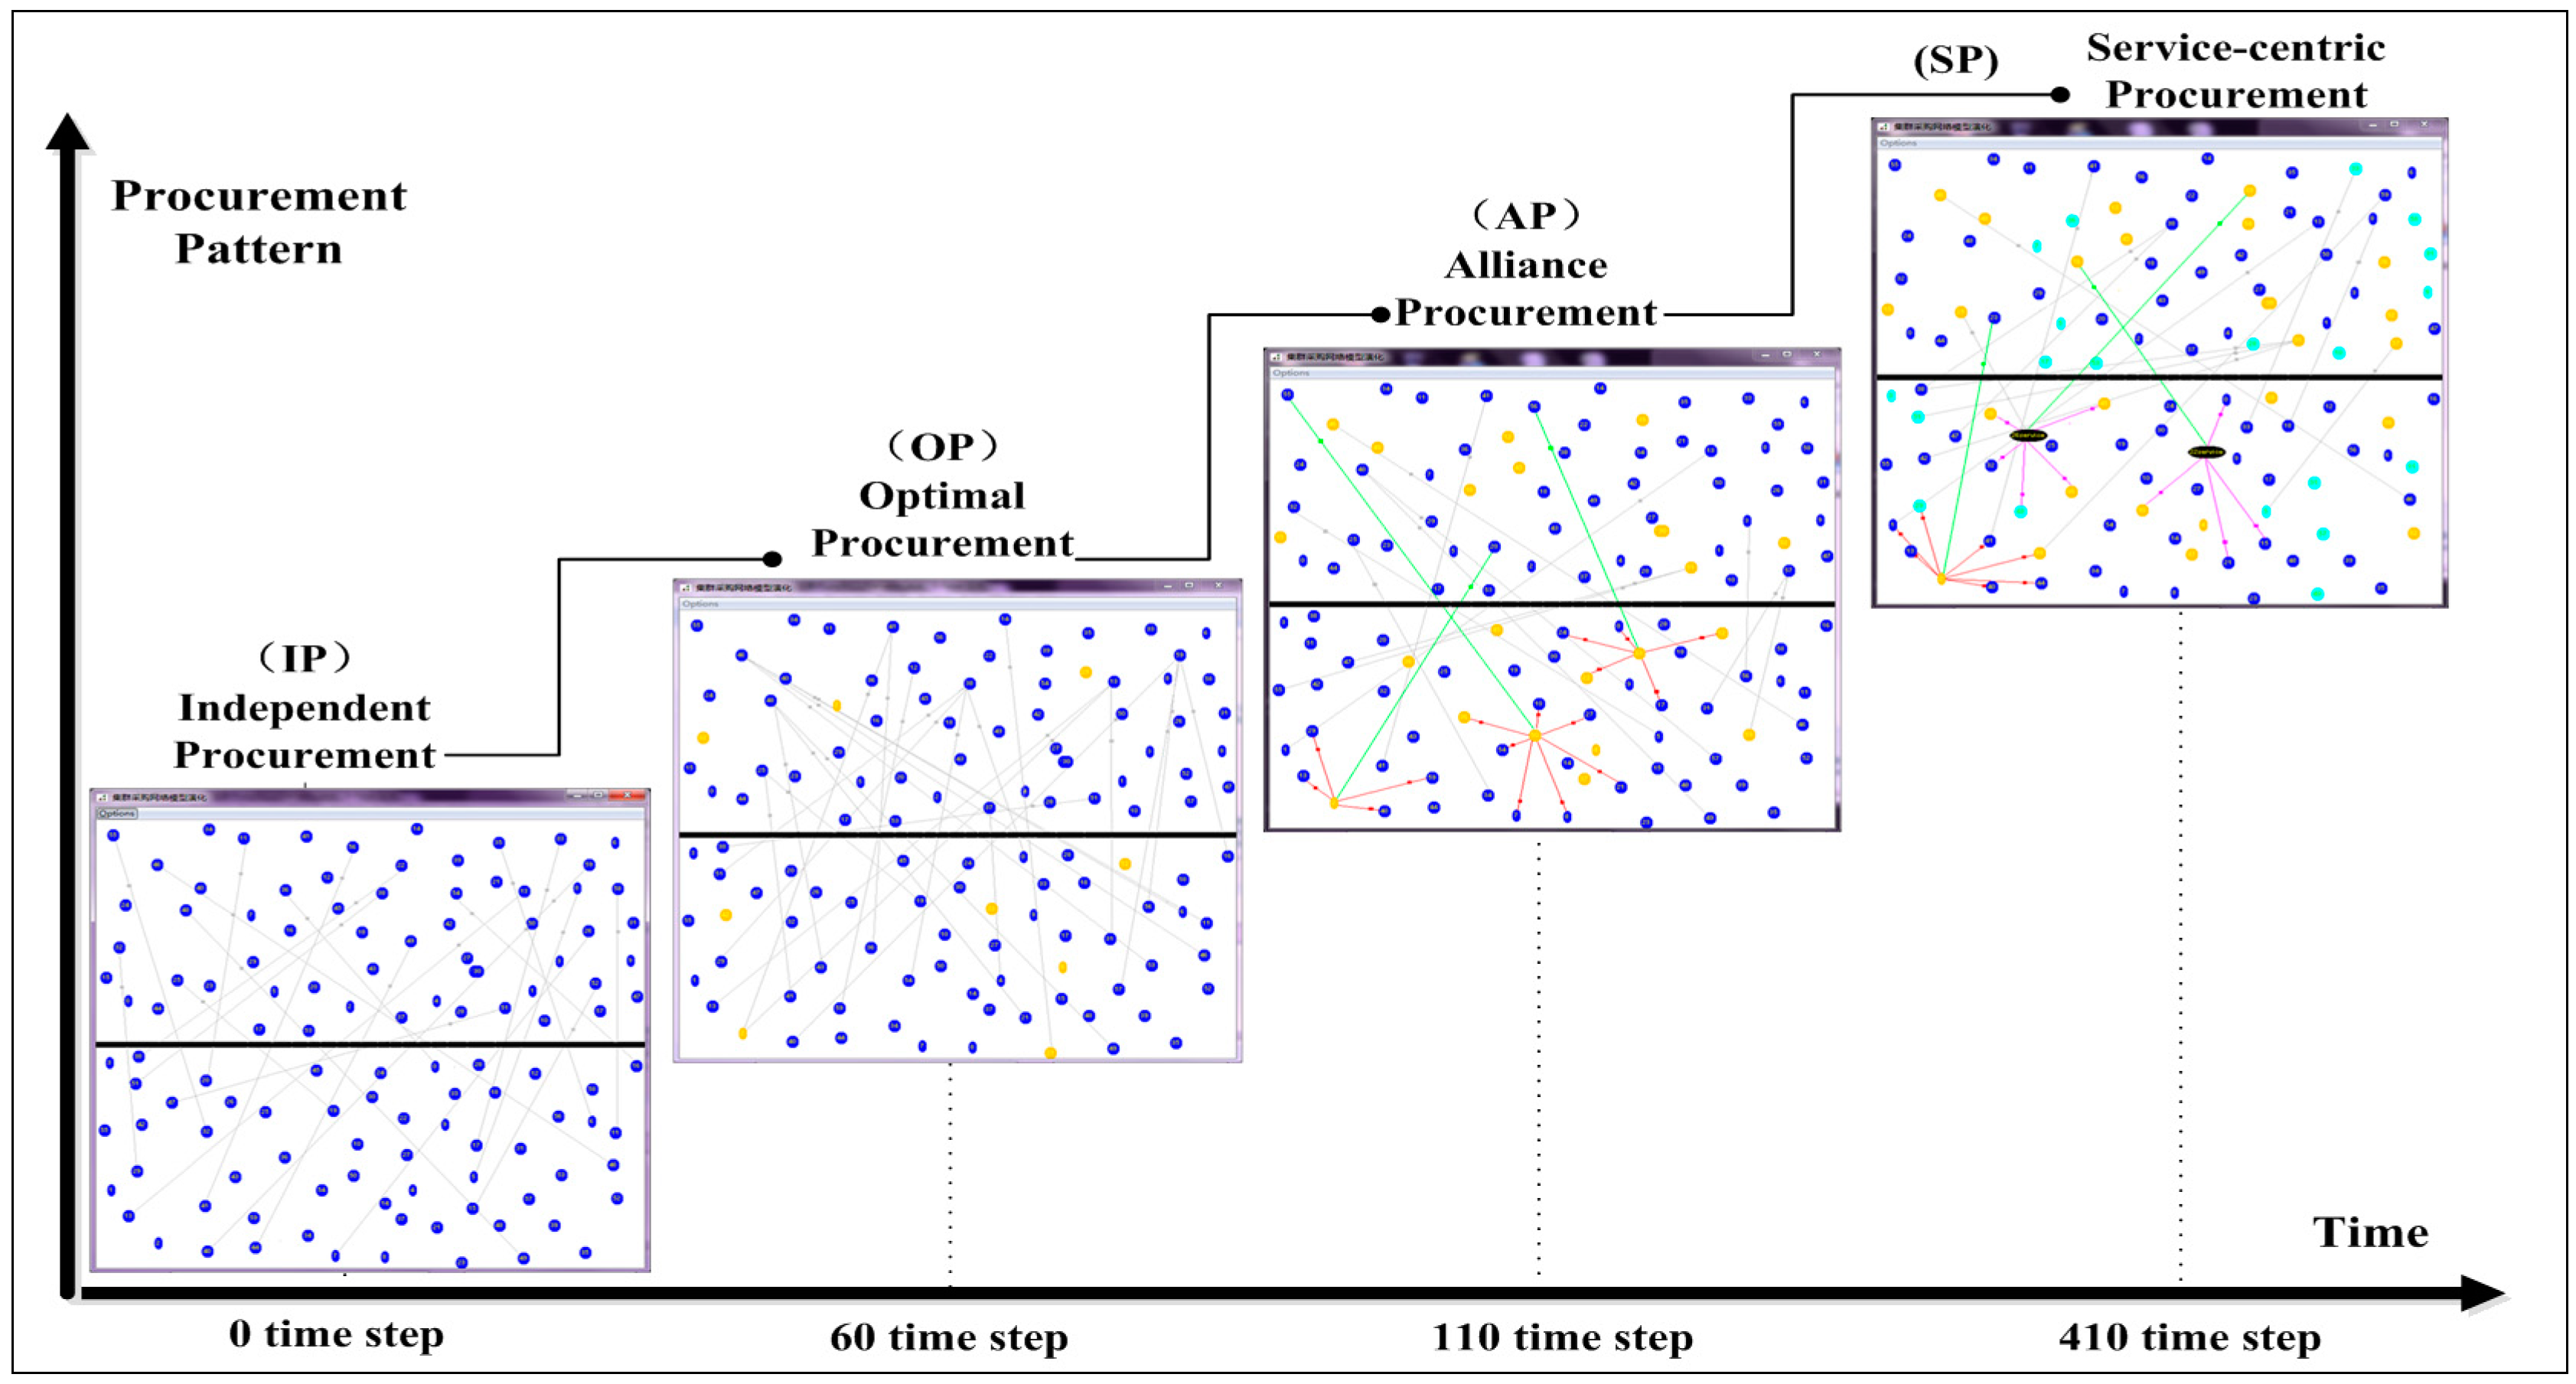
When the market demand is stable, manufacturer’s order size changes little in general, and the return rate is low. Under this situation, the cost of independent procurement is relatively stable. After 100 repeated experiments, it can be found that the evolution process of collaborative procurement under three different service policies can be divided into four basic stages: Independent Procurement (IP, the average time range is about 0–60 time step), Optimal Procurement (OP, the average time range is about 60–110 time step), Alliance Procurement (AP, the average time range is about 110–410 time step), and Service Procurement (SP, the average time range is after about 410 time step).
The whole evolution process is shown in
Figure 9. In the first stage, the system is in a relatively balanced state. The initial scale of manufacturers and suppliers are both medium (blue), and manufacturer randomly selects supplier. In the second stage, the scale differentiation among enterprises begins to occur, and some of them have grown into large enterprises (yellow). Through interaction between manufacturers, their procurement focuses on a small amount of suppliers gradually. In the third stage, some large-scale manufacturers begin to launch alliance procurement. In the fourth stage, the initiator of alliance procurement evolves into the specific service provider, and three kinds of procurement pattern coexist at this period.
Figure 9.
The evolution process of Collaborative Procurement under the stable market environment.
Figure 9.
The evolution process of Collaborative Procurement under the stable market environment.
In order to analyze the evolution details of collaborative procurement,
Figure 10 shows the performance comparison among three kinds of service charging policies. The detailed comparative analysis result is given in
Table 19.
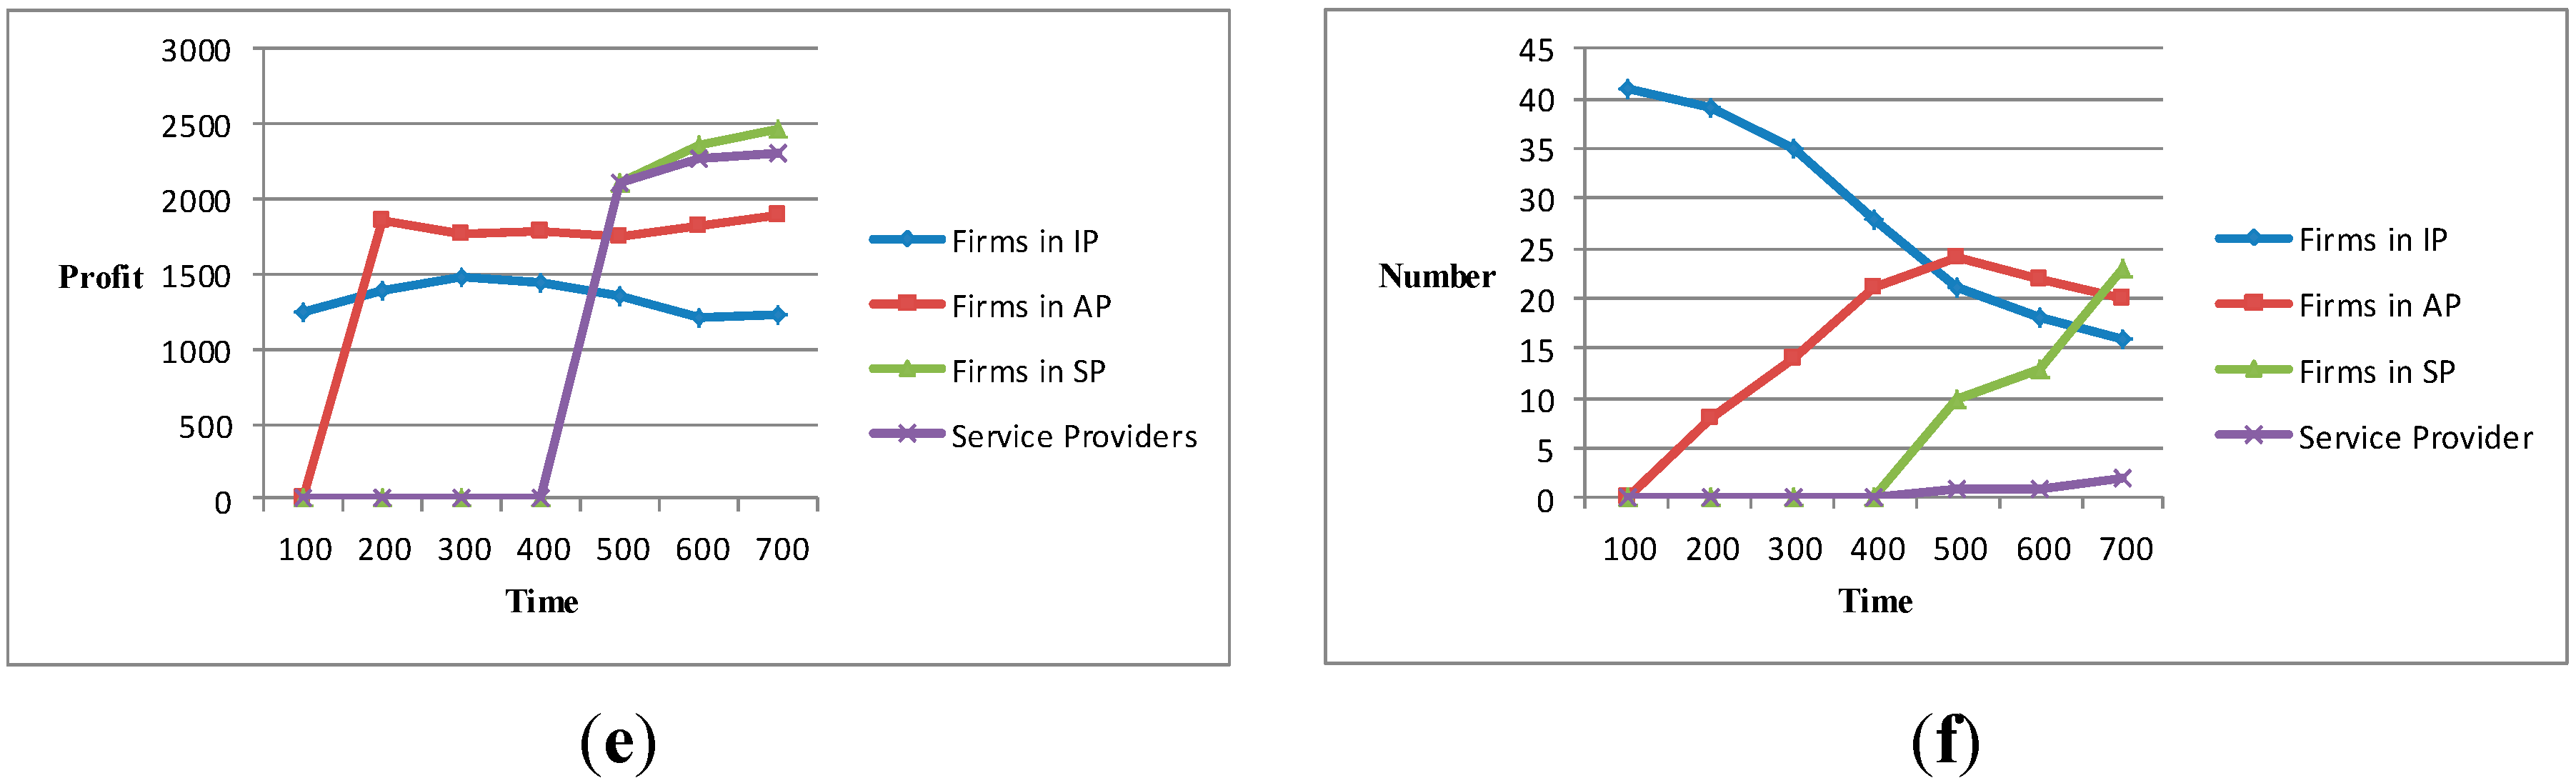
Figure 10.
The comparison of three service charging policies under the stable market environment. (a,b) The comparison of profit and participants number under Earnings ratio policy. (c,d) The comparison of profit and participants number under Transaction ratio policy. (e,f) The comparison of profit and participants number under Fixed Cost policy
Table 19.
The comparative analysis of the first computational experiment.
Table 19.
The comparative analysis of the first computational experiment.
| Policy Type | The Average Profit of Manufacturers in Service Procurement | The Number of Manufacturers in Service Procurement |
|---|
| Earnings Ratio policy | The profit of manufacturers in service procurement is higher than the value in the other two patterns. What’s more, it is close to the profit of service provider. The profit balance can be achieved in the service procurement. (Figure 10a) | Although the number of manufacturers in service procurement increases stably, it has not become the top one among these three procurement patterns. (Figure 10b) |
| Transaction Ratio policy | The profit of manufacturers in service procurement is higher than the value in the other two patterns. However, it is lower than the value under the other policies. (Figure 10c) | The number of manufacturers in service procurement increases lowly. What’s more, it has a certain gap with the top one among these three procurement patterns. (Figure 10d) |
| Fixed Cost policy | With the growth of collaborative scale, the profit of both manufacturers and service providers increases steadily. The profit balance can be achieved in the service procurement. (Figure 10e) | The number of manufacturers in service procurement increases rapidly and has already been in a dominant position. (Figure 10f) |
5.3. Analysis of Experiment Results
In the CSC-based collaborative procurement, there are three types of enterprise (manufacturer, supplier and service provider). Their interests may be different (e.g., manufacturer and supplier), and even be contradictive (e.g., the profit of service provider comes from the payment of manufacturers). Based on the above experimental results, different evolution results of procurement pattern in CSC may be derived from adopting different service charge policies by service provider.
The features of three service charging policies can be summarized: Earnings Ratio policy pays more attention to the interests of manufacturers; Transaction Ratio policy pays more attention to the interests of service provider; Fixed Cost policy is a balanced charging policy. In terms of manufacturers, the charge of Fixed Cost policy is fixed and transparent, which has the more advantages than the other two policies in price competitiveness. In terms of service provider, the profit of Fixed Cost policy has been growing with the increasing number of manufacturers, which can have more advantages than the other two policies in the profit of service providers. Therefore, the Fixed Cost is a suitable choice under the stable market demand environment.
However, the study is just a tentative exploration for the identification of the optimal service charging policy by means of computational experiment. The given example is simplified to a large extent in order to clarify the workflow of the proposed method. The real service charging policy problem is much more complex, which needs to consider a lot of factors, such as the classification of customer requirements, the fluctuation of market environment, the dynamic game between various service providers, and so on. The real phenomenological experiments will be emphasized in two fields: one is manufacturing cluster, and the other is e-commerce.
In terms of manufacturing cluster, the role of service provider is becoming more and more important with the widely application of CSC. In our practical case study, Global Industrial Supply Co., Ltd, Beijing, China (Hereinafter called GIS) is selected as research object, which is a state-owned enterprise. GIS provides professional industrial services (including pooling procurement, Cutting and Machining logistic distribution, Vendor Managed Inventory, and international trade) for all kinds of manufacturers in North China, such as printing machines (e.g., Beiren Printing Machinery Co., Ltd, Beijing, China), CNC machine tools (e.g., Beijing No1 Machine plant, Beijing No2 Machine plant, Beijing, China), construction machinery (e.g., Beijing BEIZHONG Steam Turbine Generator Co., Ltd, Jing Cheng Heavy Industry Co., Ltd, Beijing, China), environmental protection(e.g., Jingcheng Environment Protection Co., Ltd, Beijing, China), power generation equipment(e.g., BMEI Co., Ltd, Beijing, China, Beijing BEIKAI Electronic Co., Ltd, Beijing, China, Beijing Electric Wire and Cable General Factory, Beijing, China, Beijing Electric Motor Co., Ltd, Beijing, China, etc.).
Cluster members can often profit from the operation of GIS. For example, the existing procurement costs can be reduced by about 10 percent to 20 percent by means of the integration and optimization provided by GIS. But, GIS is an independent third party organization with a commercial interest. Consequently, all the savings from CSC do not go to manufacturers. The challenge was to identify a suitable service charge policy to achieve the sustainable development of the whole business ecosystem, which can ensure the reasonable profit of service providers without significantly reducing the benefits gained by manufacturers. In our future research, the proposed method will be used to find a reasonable profit model between manufacturers and industrial service provider in the field of MRO (Maintenance, Repair and Operations) procurement.
Furthermore, the proposed method can be used to solve the service charging policy problem in E-commerce. Currently, many companies such as Amazon, eBay, Alibaba [
39] and JD [
40] provide platforms with e-commerce infrastructure service for small businesses and individual entrepreneurs, allowing them to open online retail stores. This kind of services has significantly accelerated the growth of e-commerce, as it builds a bridge between traditional retailers and online shopping. With the competition between these platform service providers steadily growing up, it becomes necessary to study and improve the profit model of their own platforms. However, this is a very complex dynamic game problem between multi players. In our future research, the proposed method will be used to compare the difference between two e-platform hosts, which uses different service charging policy, respectively.


