Article

An Improved Neural Network for Regional Giant Panda Habitat Suitability Mapping: A Case Study in Ya’an Prefecture

1
Key Laboratory of Digital Earth Science, Institute of Remote Sensing and Digital Earth, Chinese Academy of Sciences, Beijing 100094, China
2
College of Resources and Environment, University of Chinese Academy of Sciences, Beijing 100049, China
3
International Centre on Space Technologies for National and Cultural Heritage under the Auspices of UNESCO, Chinese Academy of Sciences and UNESCO, Beijing 100094, China
*
Author to whom correspondence should be addressed.
These authors contributed equally to this work.
Sustainability 2014, 6(7), 4059-4076; https://doi.org/10.3390/su6074059
Submission received: 27 February 2014 / Revised: 17 June 2014 / Accepted: 17 June 2014 / Published: 26 June 2014
(This article belongs to the Special Issue Sustainable Land Use and Ecosystem Management)

Abstract

:
Expert knowledge is a combination of prior information and subjective opinions based on long-experience; as such it is often not sufficiently objective to produce convincing results in animal habitat suitability index mapping. In this study, an animal habitat assessment method based on a learning neural network is proposed to reduce the level of subjectivity in animal habitat assessments. Based on two hypotheses, this method substitutes habitat suitability index with apparent density and has advantages over conventional ones such as those based on analytical hierarchy process or multivariate regression approaches. Besides, this method is integrated with a learning neural network and is suitable for building non-linear transferring functions to fit complex relationships between multiple factors influencing habitat suitability. Once the neural network is properly trained, new earth observation data can be integrated for rapid habitat suitability monitoring which could save time and resources needed for traditional data collecting approaches through extensive field surveys. Giant panda (Ailuropoda melanoleuca) natural habitat in Ya’an prefecture and corresponding landsat images, DEM and ground observations are tested for validity of using the methodology reported. Results show that the method scores well in key efficiency and performance indicators and could be extended for habitat assessments, particularly of other large, rare and widely distributed animal species.

1. Introduction

Habitat suitability index (HSI) mapping provides spatial quantitative values of habitat types, spatial interspersion of community and relationship between wildlife habitat types with other resource inventories as well as location of animal occurrence [1]. Considering these advantages, HSI mapping is widely used in wildlife management decision making [2], spatial habitat quality predictions [3] and impacts of significant emergency assessments [4,5]. It is a commonly used method adopted by many researchers including in Giant panda habitat studies [4,6,7,8,9].
Existing HSI related works of giant panda apply expert-knowledge-based analytical hierarchy process (AHP), correlation analysis or models involving expert knowledge [4,10,11,12,13]. However, as Vincenzi et al. [14] and Lu et al. [6] point out, criteria and weights determined by expert knowledge and weight estimations are often too subjective and may vary greatly from expert-to-expert. Liu [7,8,9] adopted traditional criteria based methods to generate HSI map as initial input data and used ANN to learn and remap the habitat suitability. Personal bias in criteria decided by expert opinion could be alleviated to some extent by integrating fuzzy logic into ANN models. However, these artificial intelligence methods still depend on expert knowledge to provide initial HSI input data and the criteria used may be different in other study areas. Ray [15] emphasizes that uncertainty in such models needs to be analyzed, wherever there are sufficient field data. To minimize subjectivity, other models use substitute indicators for objectively building relationship between habitat factors (independent variable) and HSI (dependent variable). Apparent density is one of the most useful indicators because field data are represented in the form of point features and can be easily transformed into density maps. However, apparent density map is reliable in regions that are accessible in most parts. Moreover, it should be noted that these and other statistical methods are data demanding [5,16].
As Liu [7] points out, there are no universally accepted standard methods or formulations for quantifying habitat quality because this depends very much on species as well as the population and study area. In conventional giant panda research, HSI values were calculated by AHP of several criteria defined through experience and statistical analysis. Aiming at minimizing levels of subjectivity of expert knowledge in HSI mapping, in this article we substitute the concept of HSI with apparent density and use artificial neural network (ANN) as a transferring function for the purpose of mapping the giant panda habitat with greater objectivity. Apart from ANN, statistical methods especially machine learning methods like boosted regression trees [17], generalized linear models [18], support vector machine [19] and Bayesian networks [20] have all been adopted to analyze HSI. In this study, we choose commonly used ANN model because we only focus on the feasibility of this method in giant panda studies without discussing the comparative performance of each of the other black-box model.
ANN possesses the capacity of adjusting its structures to fit the nonlinear and complex relationship of input and output data through a learning process [21]. Taking giant panda in Ya’an prefecture as an example, we first postulate two hypotheses for this model and deduce a method for acquiring target apparent density. ETM+ images, Digital Elevation Model (DEM) and field data recorded in the third giant panda survey report [22], which provide the most comprehensive information available on giant panda habitats to-date, were processed to obtain seven habitat factor maps covering the following parameters: elevation, slope, aspect, drainage system, vegetation type, food bamboo and topological position index. ANN has been used as the transferring function to fit the nonlinearity and complexity of habitat factors and habitat quality value. A similar ANN and remote sensing image based environmental monitoring method has been used by Nunes et al. [23] in daily detection of deforestation in Amazon Rainforest and the results obtained have been satisfactory. In this paper we substitute apparent density to conventional expert knowledge generated HSI value as habitat quality value to avoid personal bias. Besides, we adopt ANN as the transferring function for mapping the spatial distribution of habitat quality. The results of ANN regression and the apparent density map using giant panda in Ya’an prefecture are presented and discussed as a case study. Conclusions and prospects for future improvement of the methodology, including its broader application for other parts of the giant panda habitat of China, are described.

2. Approach and Methodology
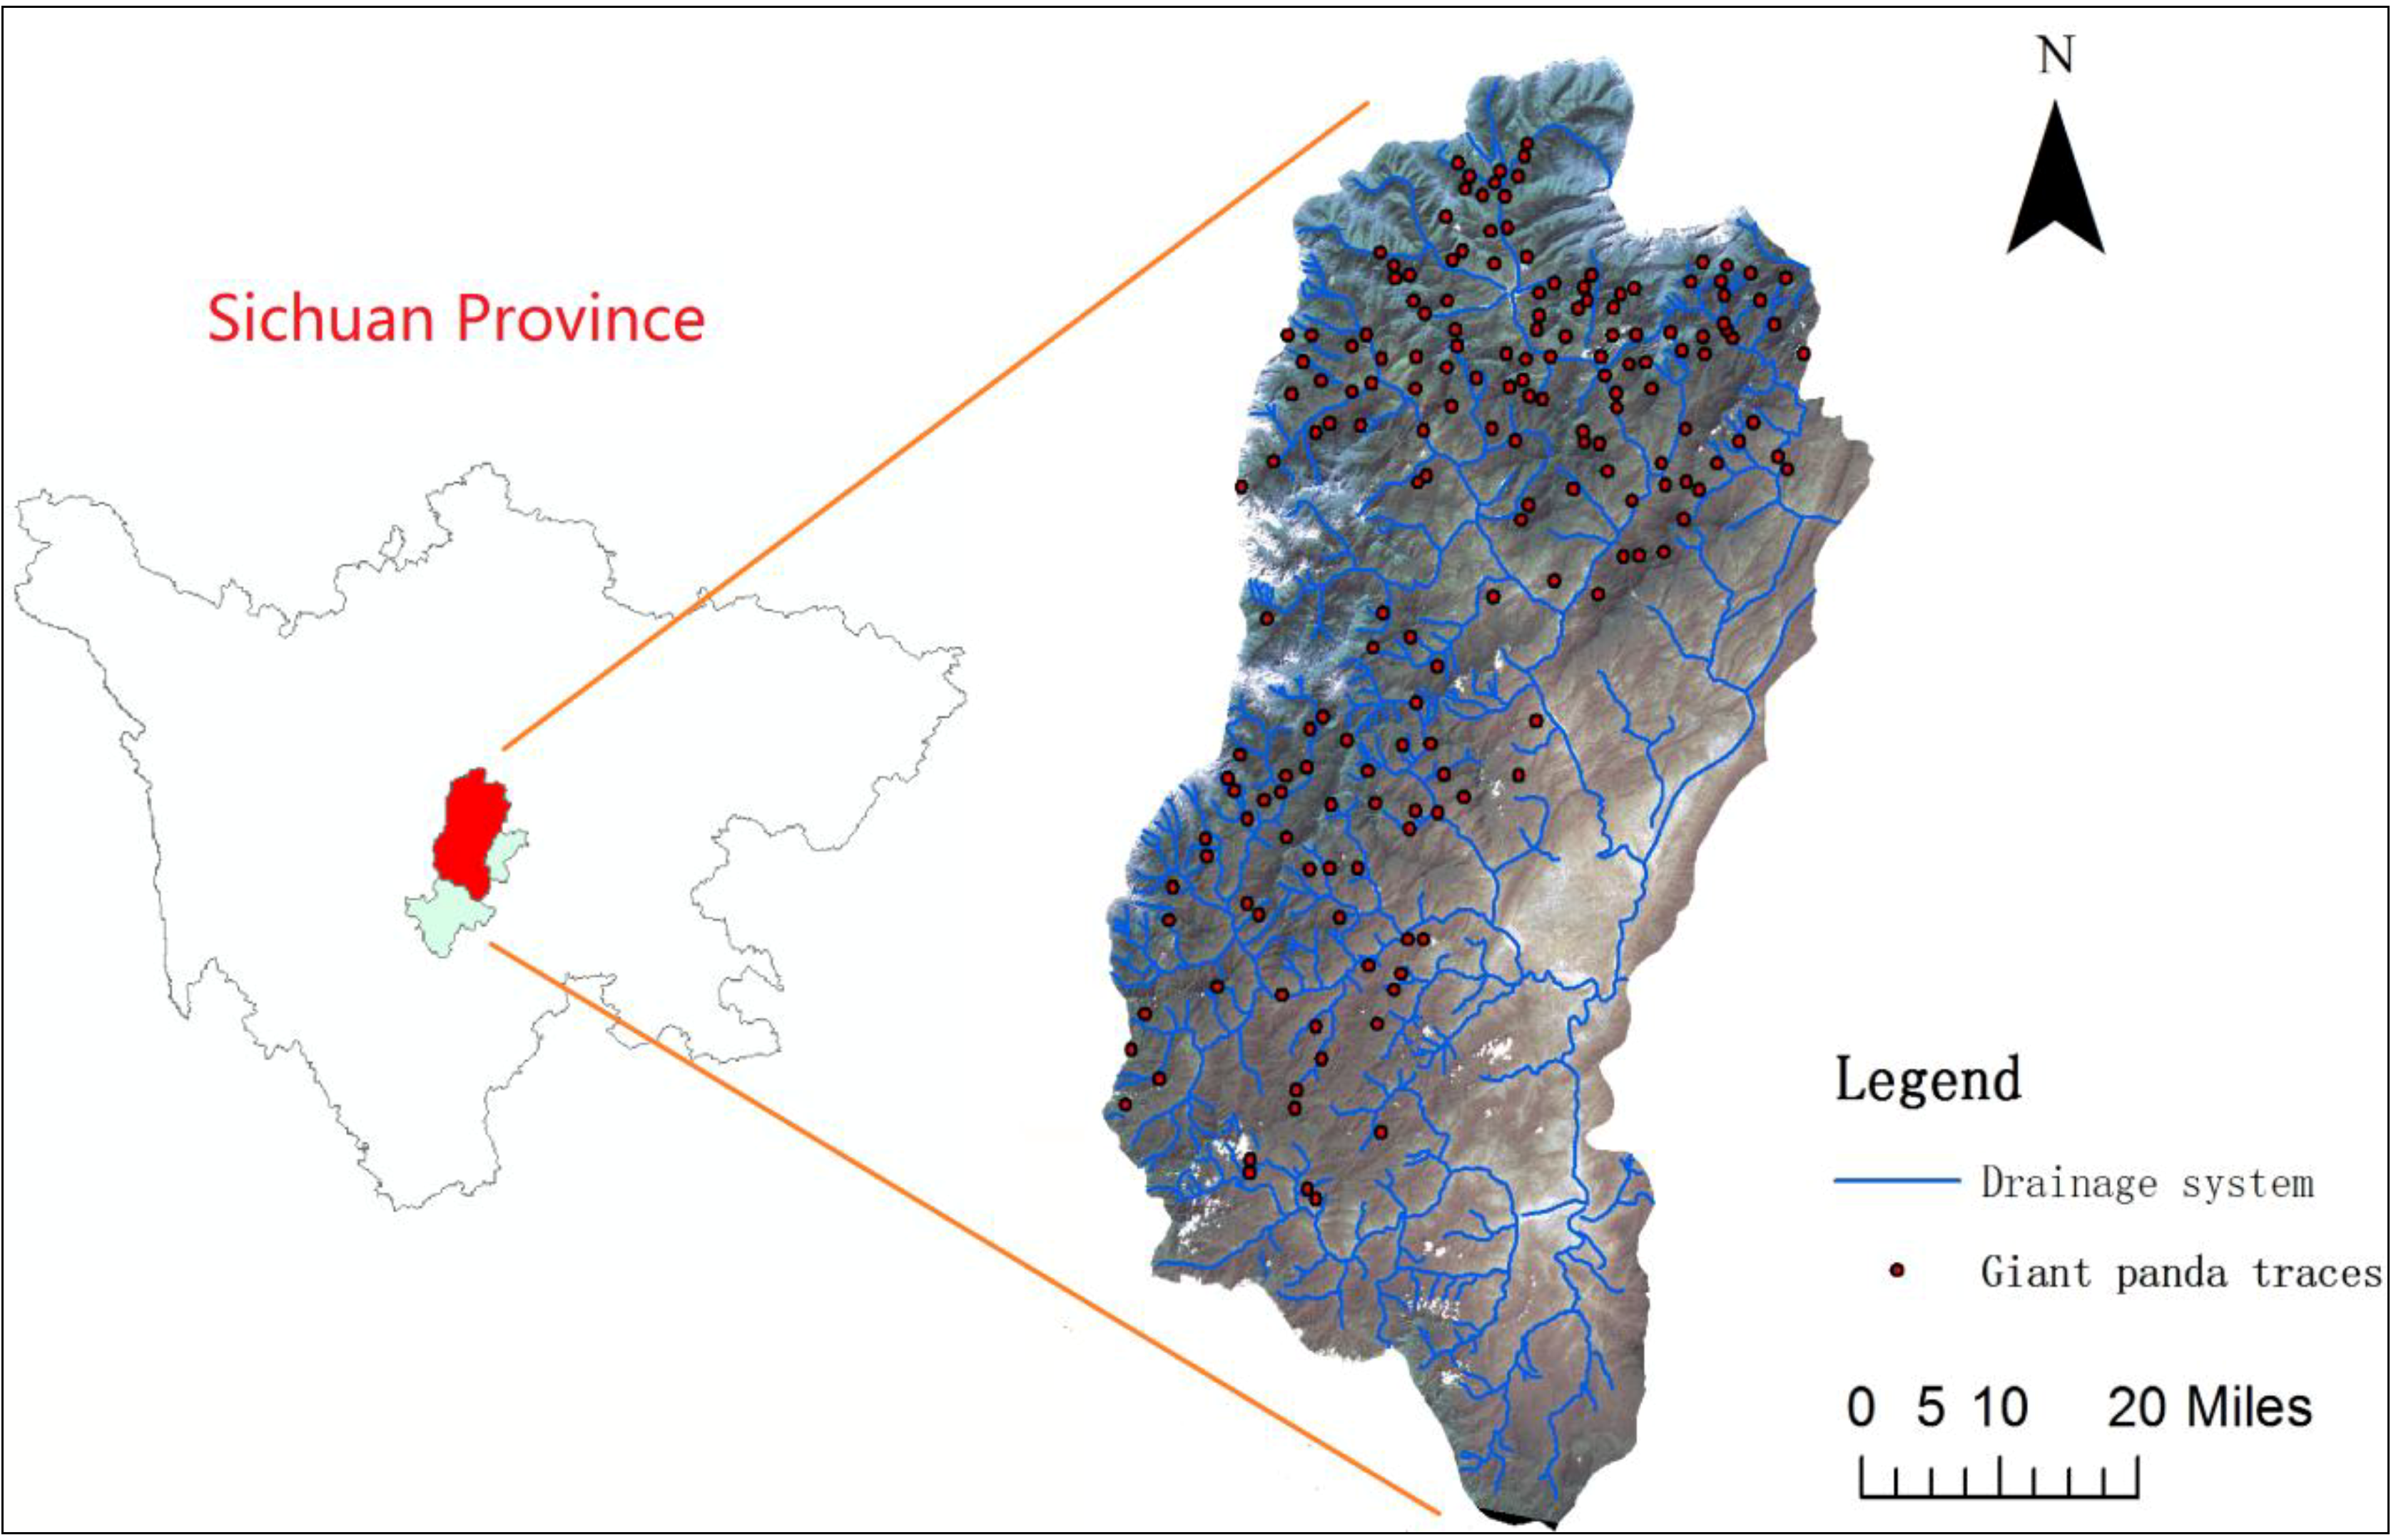
2.1. Study Area

To illustrate our methodology, we present a case study of giant panda (Ailuropoda melanoleuca) in part of Ya’an prefecture (29.47–30.95N, 103.19–103.26E). Lying in the western edge of Sichuan Basin and the eastern part of the Qionglai Mountains, Ya'an prefecture comprises of two districts and six counties. The two districts—Yucheng and Mingshan—comprise the Ya’an metropolitan area. The six counties are mountainous and are mostly wild. The research area covers four counties which have wild giant pandas: Baoxing, Tianquan, Lushan and Yingjing. Figure 1 is the composite true color image from landsat 7 (30 m resolution) taken in 18 September 2007. Ya’an prefecture is one of the most important giant panda natural habitats with 244 individuals (in captivity and in the wild). It is believed that the first wild giant panda in China in recent times was found in the Baoxing county of Ya’an prefecture in 1869 by the French missionary Armand David [24].

2.2. Research Methods

2.2.1. Feasibility of Using Apparent Density Map as a Measure of Habitat Quality

To rationalize the method used in this paper, two hypotheses were proposed: (1) Discovery of a higher number of animal signs means animals are more active in the region. Therefore, we surrogate HSI with apparent density as quantitative measure for habitat suitability quality; (2) Discoveries of homogeneous animal signs (bamboo stem fragment in this study) are events of equal detection probability in all regions. Figure 2 is the general flow chart of the proposed animal habitat quality network building and mapping method.
Figure 1. ETM+ True color images of study area and its related drainage system. Red dots are giant panda signs.
Sustainability 06 04059 g001
Figure 2. Flow chart of large rare animal habitat quality mapping.
Sustainability 06 04059 g002
The two hypotheses may not apply to some previous studies as the signs used and surveying methods vary. In our study, the signs and survey method meet the two hypotheses. In fact, previous studies have discovered close relationship of HSI and apparent density [25,26] and Tirpak et al. equate apparent density with HSI and use HSI to deduce the spatial distribution of bird density [5]. For the giant panda previously, bamboo stem fragment, waste, food sign, footprint, caves and scratches have been used as signs. In the third giant panda survey, bamboo stem fragment is used to estimate both giant panda spatial distribution and total numbers [22]. In comparison to other signs, bamboo stem fragment, which is located at the surface of bamboo, is more stable and resistant and less likely to be influenced by environmental disturbances. Besides, previous studies also hold similar assumption that giant pandas have equal access to the different habitats [8]. For the second hypotheses, animal signs survey is carried out by adopting a commonly used method called grid-line transect [22]. Grid-line transect divides the study area into irregular grids (2 km2) by taking landscape, vegetation, bamboo distribution, elevation, giant panda habitat and accessibility to the area into consideration. In practice, divisions are partially set by length of routes, drainage systems, ridges and difficulties in surveying. When taking samples, signs are detected according to an intersecting line through the region. This method can mathematically guarantee the equal detection probability and objectivity of the sampling but is susceptible to environmental factors like sunlight on the slope or surrounding vegetation type which are discussed later in this paper.
The core step is to build a nonlinear relationship between the chosen factors impacting habitat and the apparent density map. Maps of signs of presence of the species of large and rare animals are prepared from point features acquired in field work. It can be transformed into apparent density map that is considered to describe the spatial distribution of habitat quality. The key question is: how reliable is the apparent density map? In reality many regions cannot be accessed and investigated and for those areas the map is not reliable. However, in regions which are reachable and in accordance with hypotheses 2, the density values are reliable and of equal detection probability. Thus we selected several sign points as sampling points to extract input and output for ANN training (these points are within reachable area which is certainly reliable for sampling data extraction). To make the result more robust, different land types outside the area with no animal signs (i.e., the zero habitat quality points) are selected as complementary data for the ANN to learn which area is unsuitable for giant panda. Combining the species signs data expressed as apparent density maps and complementary data, the whole set of sampling points are used in further data extraction.
After building the density map and sampling points, the input and output data for training the ANN are extracted from apparent density maps and habitat impact factor maps, respectively (see Figure 2). To avoid over-refinement which will lead to meaningless values, a 150 m moving circular window (to ensure equal distance) is used to build a 30 m resolution map. Considering the complex relationship between different habitat impact factors and habitat quality value, a nonlinear neural network is trained and validated, after which the network is used for mapping habitat quality distribution from new habitat impact factors. For example, satellites can provide near-real-time images for landuse change detection [27,28] especially with regard to changes in vegetation characteristics [29]. Disturbance in landuse types will lead to big difference in habitat quality maps which is of great value in comprehensive analysis of habitats of large and widely distributed animals. For example, when assessing the impact of 2008 Wenchuan earthquake on giant panda habitat, many researchers focused on the impact of earthquake on elevation related habitat factors and vegetation types by patch-analysis [4,30], habitat suitability index (HSI) [31,32] and other statistical methods [33]. Land type, especially vegetation is closely linked to giant panda habitat suitability and food source; even though bamboo cannot be detected through remote sensing data (they grow under the forest canopy), the conditions for their abundance and occurrence depend greatly on the sub-canopy environment.

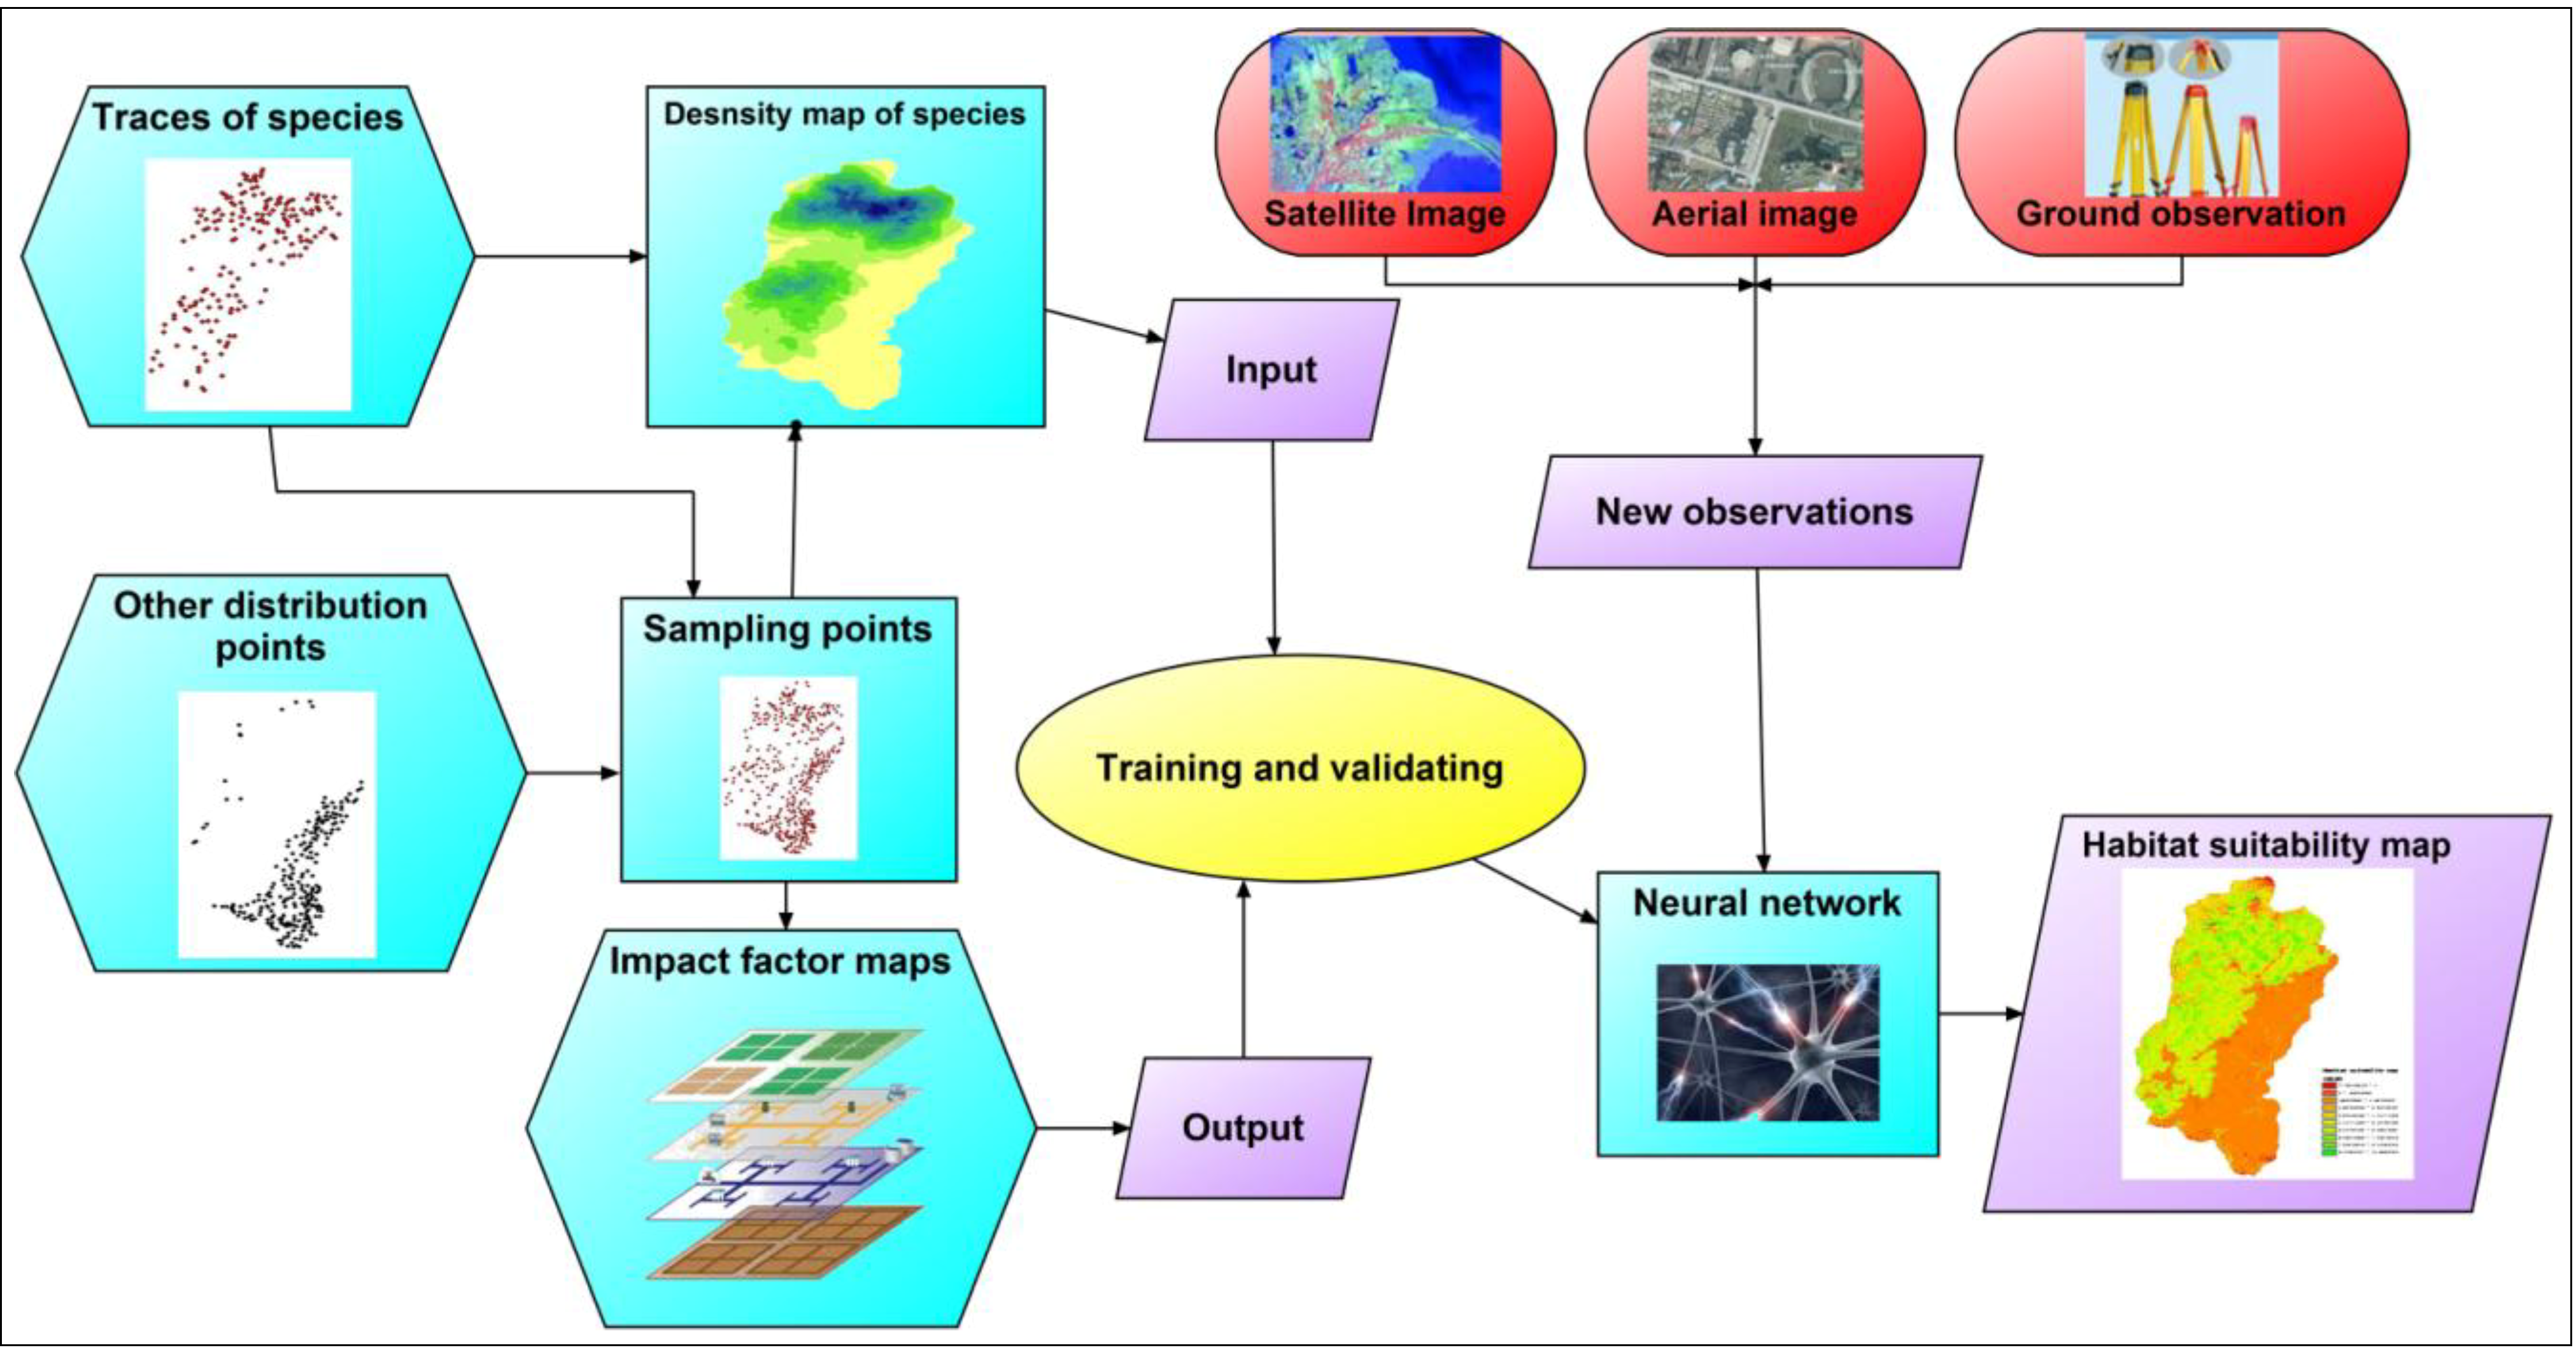
2.2.2. Neural Networks

Originally developed to solve complex and non-linear problems like fitting, pattern recognition, clustering and time series predictions, neural network is designed by imitating brain processes. In this study we used ANN for the following reasons: (1) The HSI criteria is complex. Giant panda HSI criteria often consisted of a set of divided function [7,8,12,34] instead of linear formulae; (2) The thresholds are often set using expert knowledge or statistical analysis. In real situation, these distinctions are fuzzy and blurry; (3) Even in each section, the suitability may not be stable at all; many habitat factors may exert different influence at a small scale not observed by researchers. Therefore, these thresholds based relationships are hard to be fitted by a linear function; using an ANN model which possesses the capacity of fitting nonlinear relationship is, in our view, better suited for this purpose [7]. In this study, the neural network is used as a transfer function between habitat factors and habitat quality value. A three layer (Input layer, hidden layer and Output layer) with feed forward neural network including back-propagation of error is used in this study.
In our study the structure of ANN is made up of input layers and hidden layers. Number of input layers is determined by the number of input habitat factors. Hidden layers are set through experiment. The output of the network is habitat quality value simulated by the neural network with corresponding input habitat factors (Fi, i = 1,2,...,n). In the hidden layer:
Sustainability 06 04059 i001
where Netj represents the jth node in the hidden layer and vij represents the activation function of a node, in this study we use a sigmoid function as follows:
Sustainability 06 04059 i002
In the output layer, the habitat quality value is calculated through the function as follows:
Sustainability 06 04059 i003
where ωj is the corresponding weight for each hidden node and f0 is the activation function. In this study, we use the commonly used line function. Both ωj and vij are assigned with random values initially, and then modified by the delta rule traditionally derived from the learning samples.
In order to get comparable and reliable results, all the habitat quality values were standardized between 1 and 10 by Equation (4).
Sustainability 06 04059 i004
where Dmax and Dmin are the maximum and minimum value of density and Di is the corresponding value. The standardization of habitat quality is carried out in order to calculate MAPE (mean absolute percentage error).

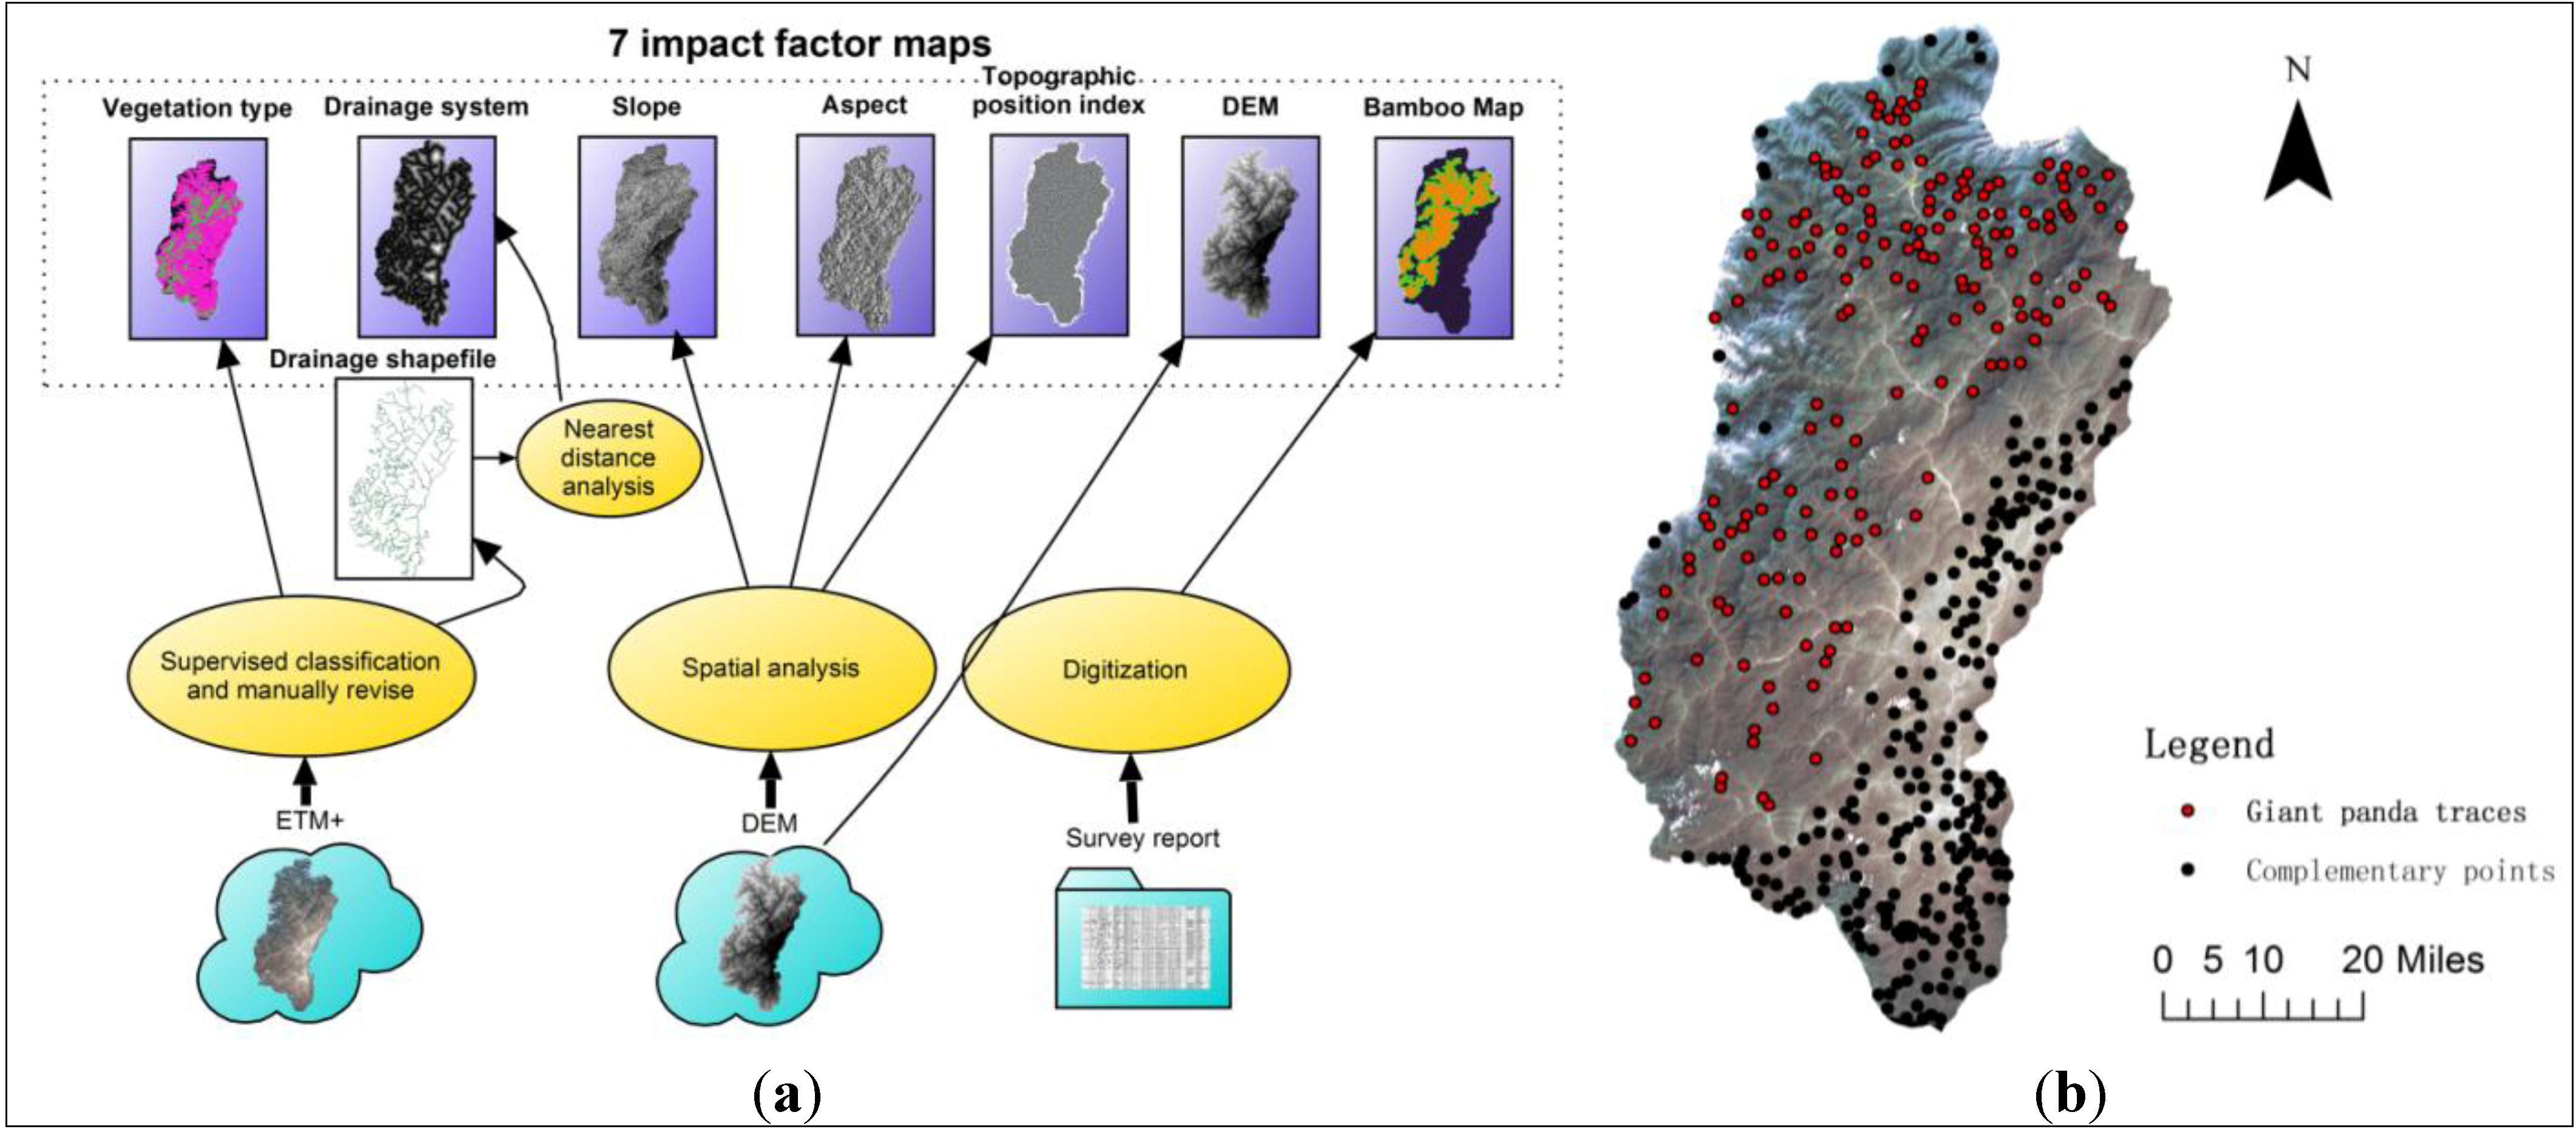
2.3. Pre-Processing of Date

In giant panda studies, AHP estimates weights or criteria for input habitat factor maps subjectively, whereas, our study builds a black box model to link the input habitat factor maps to apparent density map in the study area. Based on previous studies [35,36], the following seven habitat factors closely related to habitat quality are chosen for training data: DEM, drainage system, vegetation type, food bamboos, slope, aspect and topographic position index. Thirty-meter resolution DEM and ETM+ images are downloaded from the United States Geological Survey website. DEM (I) and its derivation slope (II), aspect (III) and topographic position index (IV) generated from Jeff Jenness’ topographic position index toolbox (ArcView Extensions) [37] are added as the four topographic habitat factors. Several studies have stated that terrain related habitat factors like elevation, slope and aspect affect the vegetation and water availability in giant panda habitats [4,5,6,35,36,38]. Considering the surveying time span of the third giant panda survey report (May 2000 to November 2001) and frequent, heavy cloud cover in Ya’an region, we selected ETM+ data from 13 June 2001. Pre-processing has been done to de-stripe the ETM+ data using ENVI 4.7. Atmospheric correction is performed by Fast Line-of-Sight Atmospheric Analysis of Spectral Hypercubes (FLAASH) software package also in ENVI 4.7. To ensure precision of other two habitat factors, i.e., drainage system (V) and vegetation type (VI), the landuse classification is first carried out by supervised classification and then revised manually. A raster distance map is generated from the drainage system polylines by calculating the Euclidean distance of each cell to their nearest rivers.
Vegetation types include broad-leaved forest, coniferous forest, broad-leaved and coniferous mixed forest, meadows and bushes. According to the third giant panda survey report [22], the chance of finding giant panda in coniferous forest and broad-leaved coniferous mixed forest is 70%; while the chance of finding the giant panda in broad-leaved forest, meadows and bushes is 30%. Based on these facts, the coniferous forest and broad-leaved coniferous mixed forest and their corresponding buffer zone (1000 m) are assigned as the most suitable area (score 5) while the other vegetation areas are assigned as moderately suitable area (score 3). The rest of the territory is assigned as unsuitable area (score 1). The last habitat factor, i.e., preferred species of food bamboo (VII) is mapped according to the third giant panda survey report [22] and areas with known presence of Bashania faberi, Yushania brevipaniculata and Fargesia robusta and their corresponding buffer zone are treated as the main feeding areas (score 5) and areas with other species of bamboos as of moderate importance (score 3). All the input habitat factor maps are unified to 30 m resolution with a 300 m moving window. These seven habitat factor maps are utilized as the input for the neural network. Figure 3a shows the flow chart of the seven habitat impact factors generation.
Output giant panda density maps are generated from the sign points digitized from the third giant panda survey report [22]. Sampling data consists of two parts: (1) The giant panda signs points themselves (183 points). Based on the hypothesis described above, these points are those that were accessible during field work with equal signs detection probability. We assume that these sampling points are of the same precision for density distribution as well; (2) Other points that are apparently not suitable for giant pandas (233 points). These points (Figure 3b) are used to avoid detection of false giant panda signs that may lead to false training results and thereby increase the reliability of the model. Unsuitable points are marked from different habitat factor types to cover different existing situations. These points are generated randomly in non-forest region using the random point generator in Hawth’s Tool s for ArcGIS 9.x [39]. With a total of 416 records covering most of the habitat factor combinations, training and validating of the neural network was confidently carried out. In Liu’s research [7,8,12], she had 160 survey points and 1425 non-overlapping radio tracking points and she randomly chose 700 points for 15 trials. The aim of her random sampling point selection is to minimize the effect of sample errors influencing the accuracy of the ANN model. In our study, we specifically chose all the field data and complement other zero habitat quality value data for testing the correlation between the broadened habitat quality value and the seven habitat factor maps.
Figure 3. Pre-processing of data. (a) Flow chart of large giant panda habitat quality mapping. (b) Training sampling points. Red points denote the giant panda sign. Black points denote the complimentary points chosen with regard to land type (Urban, snow and bareland).
Sustainability 06 04059 g003

3. Results and Discussion
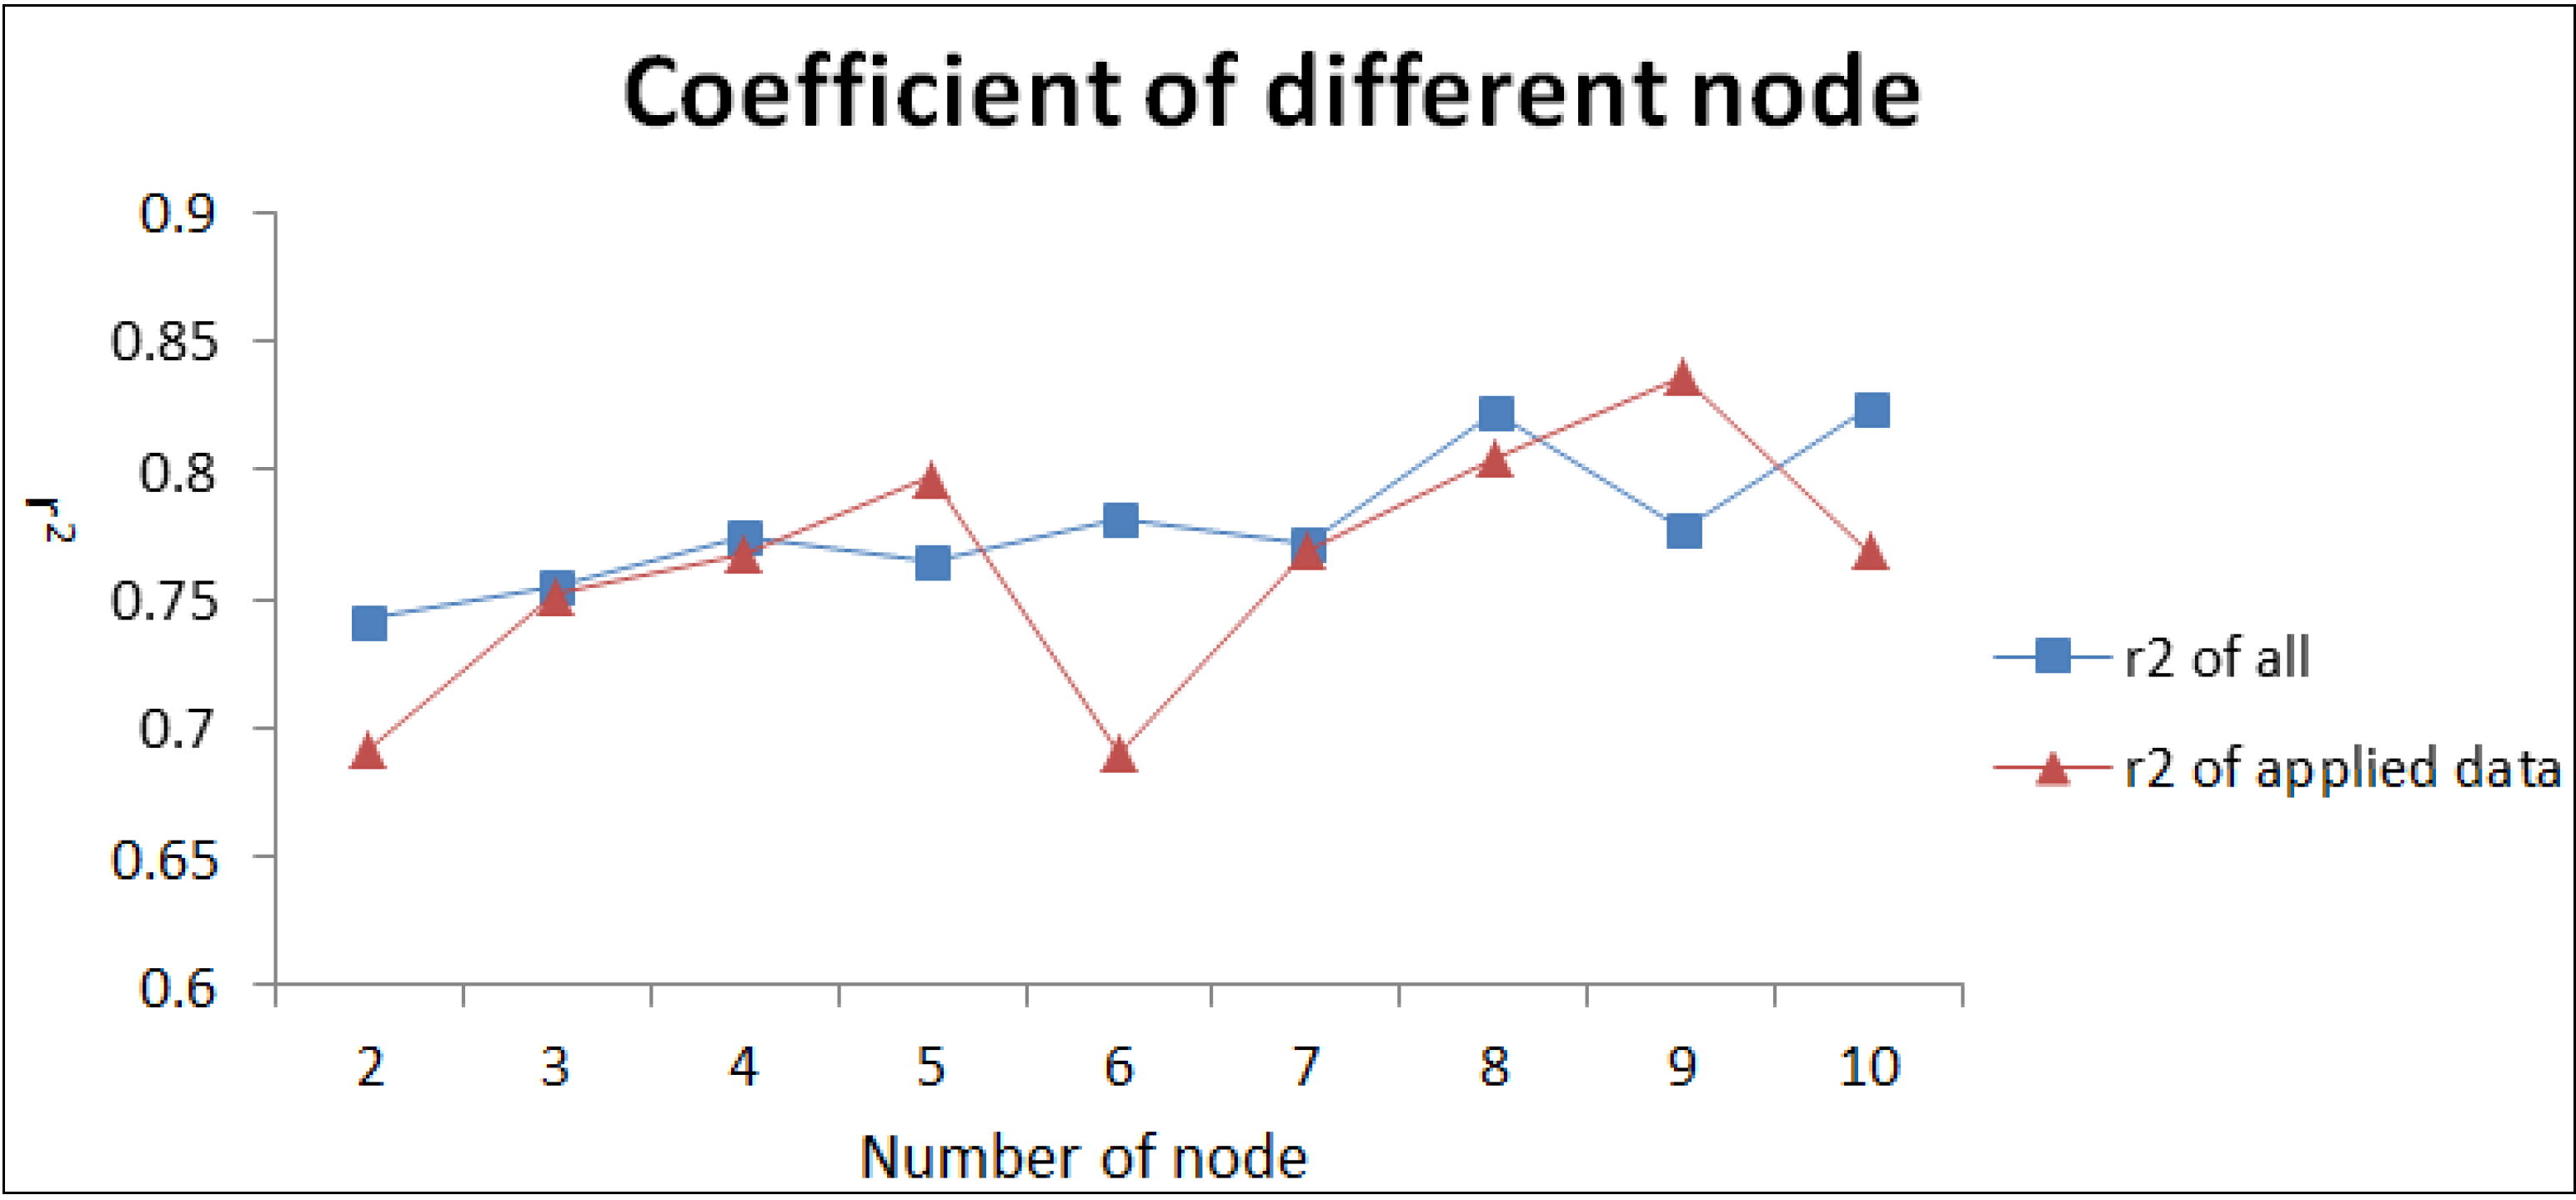
3.1. ANN Structure

The total dataset (416) was divided into three groups: the training data (291), the validation data (62) and the testing data (63). Levenberg-Marquardt approximation method was used to minimize errors for 15 trials.
To get best performance, best hidden layer node was chosen by testing each value ranging from 2 to 10. Figure 4 shows that the best node number is 8. To test the performance of the neural network, expected data (63 applied data) are confronted with the real sampling results. The R2 of the testing data and total data are 0.8042 and 0.828 (node 8). The average MAPE (mean absolute percentage error) for all the data is 19.39% with only 10 data exceeding 30%, 4 exceeding 40% and 1 exceeding 50% error, respectively.
Figure 4. Performances of each node and corresponding coefficient.
Sustainability 06 04059 g004

3.2. ANN Simulation Results

Figure 5 shows the seven one-factor habitat suitability maps, neural network retrieved habitat quality map and original density map. The one-factor HSI maps show the fact which has been consolidated in previous studies that the seven factors chosen in this study are closely relevant to giant panda habitat. ANN retrieved degree map is classified into five classes using natural breaks [40] with the hope of discovering big gaps between different habitat quality levels. However, as the degree map is a fuzzy map, any reasonable classification method is acceptable. The original map is classified accordingly. Comparing the two maps, two conclusions can be drawn: (1) The spatial trends of the neural network map and the original density map are similar especially in the areas where signs are clustered. This indicates that neural network has extracted and learned the information of the training data to a considerable degree; (2) High habitat quality values do occur in areas free of signs—the two shades of green which indicate the highest apparent density and habitat quality values are much more widespread in the ANN output in comparison to that shown by presence of signs. There are a lot of hard-to-access areas in giant panda habitat which leads to signs rarely being discovered. Giant panda habitat in Ya’an region is a place full of high mountains, complex landforms and limited access and greatly suffers from geological hazards which make field surveys difficult and at times dangerous. Successive recent earthquakes occurred in neighboring regions (2008 Wenchuan earthquake and 2013 Lushan earthquake). Therefore, these areas may not be accessible to humans but possibly be used by giant pandas. Note that the inaccessible area does not mean the slope of this place is high; instead it can be due to the lack of an access path, dense vegetation or the point being surrounded by steep mountains. Figure 5i clearly shows some high habitat quality values in the gap between groups of signs. Taking the good performance of neural network training and validation into consideration, these areas are probably those that are inaccessible to -humans but yet are used by the giant panda.
Figure 5. (a) Elevation map. (b) Distance to main drainage map. (c) Vegetation map. (d) Bamboo map. (e) Slope map. (f) Aspect map. (g) Topological positioning index map. (h) Artificial neural network (ANN) retrieved habitat quality map. (i) Original density map. All the maps are in 30 m resolution.
Sustainability 06 04059 g005
It should be noted that some isolated areas in the Figure 5h are attributable to error results of neural network caused by insufficient complementary data. For those adjacent to the habitat area, these errors cannot be corrected unless a more advanced fitting tool is implemented. For those isolated in other places, they can be corrected by merging small patches into the background.
Univariate preference frequency is used in this study to show the allocation of different habitat impact factors in contributing to giant panda habitat preference. Figure 6 shows the corresponding giant panda signs presence histograms of the seven habitat factor maps and ANN retrieved result of Figure 5. The habitat use and preference are calculated from map to indices that range from 1 to 0 (high value means high occurrence frequency and vice versa). Figure 6a agrees with previous study [41] that giant panda is mainly distributed in the area where elevation ranges from 2000 to 3500 m. Studies also show that pandas prefer foraging on the sunny aspect (Figure 6f), due to its body biological structure and food availability [38,42]. However, giant panda rarely appear at gentle slope lower than 30 (Figure 6e); this may partly be due to the scale chosen for slope map generation. ANN results show that 86.95% of total signs are within moderate suitable or suitable regions which suggest the good performance of ANN-apparent density based method.
Figure 6. (ag) Seven habitat quality impact factors and habitat use graphs. (h) ANN retrieved habitat quality graph.
Sustainability 06 04059 g006
Another significant aspect of the resolution of the HSI model needs to be mentioned here. Previous giant panda habitat studies seldom discuss scale issues. Only Vina et al. [34] mentioned that they “resample the finer resolution images to coarser one” and they resampled all the images to 80 × 80 m in accordance with the most coarse image of the first generation of landsat image (MSS). Their resolution setting was for technical purposes. The resolution of the study area not only needs to be technically right but also should be biologically and ecologically sensible. Even though the resolution of our image and DEM is 30 × 30, we use a 150 × 150 moving window due to the following reasons: (1) The home ranges of male and female giant panda are 6–7 km2 and 4–5 km2 [42], respectively. Resolution that is too fine will lead to meaningless results. As Chen et al. [43] have pointed out Giant Panda habitats are extremely fragmented. Small suitable patches surrounded by unsuitable pixels are still unsuitable because an island of suitable habitat separated from other such islands cannot provide enough area for regular giant panda activity; (2) Giant panda habitats are located in mountainous regions with fragmented landscape which also leads to the slope and aspect generated from DEM to be fragmented. see Figure 7, if we use 30 × 30 pixel, the output map of the small mountain will consist of hundreds of pixels with very suitable and very unsuitable patches (the slope and aspect of pixels vary greatly). If we use 150 × 150 pixel window, the small mountain will be expressed by several pixels and that agrees with practice. Therefore, a 150 × 150 m moving window can not only preserve high resolution, but also take into account biological and ecological specificities of the giant panda home-range.
Figure 7. Photo taken in Ya’an region in May 2013 showing a fragmented landscape located within the giant panda habitat. The electricity pylon (Reference) is about 30 m tall.
Sustainability 06 04059 g007
Further earth observation data, including new vegetation classification data from remote sensing images, DEM from SAR satellite or bamboo species data from ground surveys, can be used for giant panda habitat monitoring dynamically using this trained network. The performance of ANN can be significantly improved with the use of more detailed and precise field and ground data. In this manner, this neural network can meet the goal of near-real-time habitat monitoring for the giant panda in China.

4. Conclusions

We have proposed a different adaptation of the ANN method for increasing objectivity for habitat quality mapping that could have significance particularly for study of giant panda and in situ actions where the two hypotheses that we have based our study on are applicable. ANN is used as a transferring function to fit the nonlinear and complex relationship of the input habitat factors and output habitat quality map. This article takes giant panda in Ya’an prefecture as an example and results show that the method has good performance in mapping habitat quality and mining the training data with a coefficient reaching 0.822 and an average MAPE 19.39%. After further refining the training process, new habitat factor maps can be integrated into the system to yield the latest habitat quality map to support future panda surveys, planning and management. The Report of the Third Survey of the Giant Panda has density distribution maps for the entire giant panda habitats extending across Sichuan, Shanxi and Gansu Provinces of China. It could be interesting to further test the validity of the ANN used here in other districts or counties where similar data can be retrieved from the Third Survey Report.
However, future work needs to address the following:
(1)
Compared with traditional HSI mapping method, this method avoids dependence on subjective views and interpretations of expert knowledge and uses ANN to extract information. However, expert knowledge and field experience would still be of great value to HSI mapping. Their knowledge should not be used in deciding weights for densities in different parts of the habitat or other such abstract purposes; it should be used for clearly defined purposes such as identifying high animal activity areas. For example, our first hypothesis assumes “discoveries of animal signs are events of equal detection probability in all regions”. In reality, grid-line transect method tries to meet that goal but there are still many errors introduced by differences in forest type, elevation or angle of the sun. Experts may add accuracies or weights to each sign and original density map may take them into consideration for providing more accurate training data to ANN. Besides, expert knowledge may be applied to deciding the resolution of the model by taking biological and ecological information into consideration.
(2)
One of the hypotheses assumes the equal detection probability of finding animal signs. In field work, few efforts have been made to test this hypothesis like building grids for sampling [44]. A more rigorous approach to dedicate equal searching time for signs in all areas may be welcome but may well be prohibitively expensive from the point of view of designing and conducting field work.
(3)
As our method provides a more objective way of assessing the habitat suitability of giant panda, future work may focus on incorporating near-real-time ground observation and remote sensing data to dynamically adjust the ANN model for better results. A dynamic data driven application system or data assimilation method [45] may be used to improve the performance of the ANN model.

Acknowledgments

This article was supported by the program of International S&T Cooperation “Fined Earth Observation and Recognition of the Impact of Global Change on World Heritage Sites” (Grant No. S2013GR0477) and the National Natural Science Foundation of China (Grant No. 41271427). The ETM+ 2003 data and DEM were downloaded from United States Geological Survey. The authors would like to thank Lan Libo from Institute of Mountain Hazards and Environment (IMHE), Chinese Academy of Sciences and Miao Fang from Chengdu University of Technology for their valuable suggestions. The authors would also like to thank three anonymous reviewers and the editors for their valuable and helpful suggestions.

Author Contributions

Jingwei Song and Xinyuan Wang conceived and design the study. JingweiSong and Natarajan Ishwaran performed the experiment and wrote the paper. Ying Liao, Jing Zhen, HuadongGuo, Ruixia Yang, Chuansheng Liu, Chun Chang, Xin Zong contributed to data collection and processing. All authors read and approved the manuscript.

Supplementary Materials

Supplementary materials can be accessed at: https://www.mdpi.com/2071-1050/6/7/4059/s1.

Conflicts of Interest

The authors declare no conflict of interest.

References

  1. McCulloch, S.L. Inventory and Monitoring of Wildlife Habitat; US Department of the Interior, Bureau of Land Management: Washington, DC, USA, 1986. [Google Scholar]
  2. Larson, M.A.; Thompson, F.R., III; Millspaugh, J.J.; Dijak, W.D.; Shifley, S.R. Linking population viability, habitat suitability, and landscape simulation models for conservation planning. Ecol. Model. 2004, 180, 103–118. [Google Scholar] [CrossRef]
  3. Tirpak, J.M.; Jones-Farrand, D.T.; Thompson, F.R., III; Twedt, D.J.; Nelson, M.D.; Uihlein, W.B., III. Predicting bird habitat quality from a geospatial analysis of FIA data. In Proceedings of the Eighth Annual Forest Inventory and Analysis Symposium, Monterey, CA, USA, 16–19 October 2006.
  4. Zhang, J.; Hull, V.; Xu, W.; Liu, J.; Ouyang, Z.; Huang, J.; Wang, X.; Li, R. Impact of the 2008 Wenchuan earthquake on biodiversity and giant panda habitat in Wolong Nature Reserve, China. Ecol. Res. 2011, 26, 523–531. [Google Scholar] [CrossRef]
  5. Li, D.; Ren, B.; Hu, J.; Shen, Y.; He, X.; Krzton, A.; Li, M. Impact of snow storms on habitat and death of Yunnan snub-nosed monkeys in the baimaxueshan nature reserve, Yunnan, China. ISRN Zool. 2012, 2012. Article ID 813584. [Google Scholar]
  6. Lu, C.Y.; Gu, W.; Dai, A.H.; Wei, H.Y. Assessing habitat suitability based on geographic information system (GIS) and fuzzy: A case study of Schisandra sphenanthera Rehd. et Wils. in Qinling Mountains, China. Ecol. Model. 2012, 242, 105–115. [Google Scholar]
  7. Liu, X. Mapping and Modelling the Habitat of Giant Pandas in Foping Nature Reserve, China. Ph.D. Thesis, Tropical Nature Conservation and Vertebrate Ecology Group Wageningen University, Wageningen, The Netherlands, 12 December 2001. [Google Scholar]
  8. Liu, X.; Toxopeus, A.G.; Skidmore, A.K.; Shao, X.; Dang, G.; Wang, T.; Prins, H.H.T. Giant panda habitat selection in foping nature reserve, China. J. Wildl. Manag. 2005, 69, 1623–1632. [Google Scholar] [CrossRef]
  9. Liu, X.; Skidmore, A.K.; Bronsveld, M.C. Assessment of giant panda habitat based on integration of expert system and neural network. Ying Yong Sheng Tai Xue Bao 2006, 17, 438–443. [Google Scholar]
  10. Wang, X.; Xu, W.; Ouyang, Z. Integrating population size analysis into habitat suitability assessment: Implications for giant panda conservation in the Minshan Mountains, China. Ecol. Res. 2009, 24, 1101–1109. [Google Scholar] [CrossRef]
  11. Viña, A.; Bearer, S.; Zhang, H.; Ouyang, Z.; Liu, J. Evaluating MODIS data for mapping wildlife habitat distribution. Remote Sens. Environ. 2008, 112, 2160–2169. [Google Scholar] [CrossRef]
  12. Zhang, Y.; Wang, M.; Li, J. The impact of conservation projects on giant panda habitat. Acta Ecol. Sin. 2011, 31, 154–163. [Google Scholar]
  13. Viña, A.; Tuanmu, M.N.; Xu, W.; Lia, Y.; Ouyangb, Z.; DeFriesc, R.; Liua, J. Range-wide analysis of wildlife habitat: Implications for conservation. Biol. Conserv. 2010, 143, 1960–1969. [Google Scholar] [CrossRef]
  14. Vincenzi, S.; Caramori, G.; Rossi, R.; Leo, G.A.D. A GIS-based habitat suitability model for commercial yield estimation of Tapes philippinarum in a Mediterranean coastal lagoon (Sacca di Goro, Italy). Ecol. Model. 2006, 193, 90–104. [Google Scholar] [CrossRef]
  15. Ray, N.; Burgman, M.A. Subjective uncertainties in habitat suitability maps. Ecol. Model. 2006, 195, 172–186. [Google Scholar] [CrossRef]
  16. Beaudry, F.; Pidgeon, A.M.; Radeloff, V.C.; Howe, R.W.; Mladenoff, D.J.; Bartelt, G.A. Modeling regional-scale habitat of forest birds when land management guidelines are needed but information is limited. Biol. Conserv. 2010, 143, 1759–1769. [Google Scholar] [CrossRef]
  17. Mazur, M.L.C.; Kowalski, K.P.; Galbraith, D. Assessment of suitable habitat for Phragmites australis (common reed) in the Great Lakes coastal zone. Aquat. Invasions 2014, 9, 1–19. [Google Scholar]
  18. Douglas, S.J. Habitat Suitability Modelling in the New Forest National Park; Bournemouth University: Poole and Bournemouth, UK, 2009. [Google Scholar]
  19. Drake, J.M.; Randin, C.; Guisan, A. Modelling ecological niches with support vector machines. J. Appl. Ecol. 2006, 43, 424–432. [Google Scholar] [CrossRef]
  20. Douglas, S.J.; Newton, A.C. Evaluation of Bayesian networks for modelling habitat suitability and management of a protected area. J. Nat. Conserv. 2014, 22, 235–246. [Google Scholar] [CrossRef]
  21. Yegnanarayana, B. Artificial Neural Networks; PHI Learning Pvt. Ltd.: Delhi, India, 2009. [Google Scholar]
  22. State Forestry Administration. The Third National Survey Report on Giant Panda in China; Science Press: Beijing, China, 2006. [Google Scholar]
  23. NunesKehl, T.; Todt, V.; Veronez, M.R.; Cazella, S.C. Amazon rainforest deforestation daily detection tool using artificial neural networks and satellite images. Sustainability 2012, 4, 2566–2573. [Google Scholar] [CrossRef]
  24. Science Museum of China. Available online: http://www.kepu.net.cn/english/giantpanda/giantpanda_know/200409230031.html (accessed on 22 February 2014).
  25. Roseberry, J.L.; Woolf, A. Habitat-population density relationships for white-tailed deer in Illinois. Wildlife Soc. Bull. 1998, 26, 252–258. [Google Scholar]
  26. Bissonette, J.A.; Storch, I. (Eds.) Landscape Ecology and Resource Management: Linking Theory with Practice; Island Press: Washington, DC, USA, 2003.
  27. Lunetta, R.S.; Knight, J.F.; Ediriwickrema, J.; Lyon, J.G.; Worthy, L.D. Land-cover change detection using multi-temporal MODIS NDVI data. Remote Sens. Environ. 2006, 105, 142–154. [Google Scholar] [CrossRef]
  28. Shalaby, A.; Tateishi, R. Remote sensing and GIS for mapping and monitoring land cover and land-use changes in the Northwestern coastal zone of Egypt. Appl. Geogr. 2007, 27, 28–41. [Google Scholar] [CrossRef]
  29. Yu, Q.; Gong, P.; Clinton, N.; Biging, G.; Kelly, M.; Schirokauer, D. Object-based detailed vegetation classification with airborne high spatial resolution remote sensing imagery. Photogramm. Eng. Remote Sens. 2006, 72, 799–811. [Google Scholar] [CrossRef]
  30. Wang, X.; Xu, W.; Ouyang, Z.; Zhang, J. Impacts of Wenchuan Earthquake on giant panda habitat in Dujiangyan region. Acta Ecol. Sin. 2008, 28, 5856–5861. [Google Scholar]
  31. Zheng, W.; Xu, Y.; Liao, L.; Yang, X.; Gu, X.; Shang, T.; Ran, J. Effect of the Wenchuan earthquake on habitat use patterns of the giant panda in the Minshan Mountains, southwestern China. Biol. Conserv. 2012, 145, 241–245. [Google Scholar] [CrossRef]
  32. Wei, W.; Zhe, Z.; Yuan, J.; Liu, X.; Xu, C. Assessment of giant panda habitat after the Chengdu earthquake based on habitat suitability. Res. Environ. Sci. 2010, 23, 1128–1135. [Google Scholar]
  33. Deng, X.; Jiang, Q.; Ge, Q.; Yang, L. Impacts of the Wenchuan Earthquake on the giant panda nature reserves in China. J. Mt. Sci. 2010, 7, 197–206. [Google Scholar] [CrossRef]
  34. Vina, A.; Bearer, S.; Chen, X.; He, G.; Linderman, M.; An, L.; Zhang, H.; Ouyang, Z.; Liu, J. Temporal changes in giant panda habitat connectivity across boundaries of Wolong Nature Reserve, China. Ecol. Appl. 2007, 17, 1019–1030. [Google Scholar] [CrossRef]
  35. Li, J.; Li, T.; Jin, X.; Liu, X.; Tang, G. The quality evaluation of giant panda’s habitat based on analytic hierarchy process. J. Mt. Sci. 2005, 23, 694–701. [Google Scholar]
  36. Linderman, M.; Bearer, S.; An, L.; Tan, Y.; Ouyang, Z.; Liu, J. The effects of understory bamboo on broad-scale estimates of giant panda habitat. Biol. Conserv. 2005, 121, 383–390. [Google Scholar] [CrossRef]
  37. Jeff Jenness Topographic Position Index (TPI) v. 1.3a. Available online: http://www.jennessent.com/arcview/arcview_extensions.htm (accessed on 12 May 2014).
  38. Li, J.Q.; Shen, G.Z. The Habitat of Giant Pandas; Higher Education Press: Beijing, China, 2012. [Google Scholar]
  39. Beyer, H.L. Hawth’s Analysis Tools for ArcGIS. Available online: http://www.spatialecology.com/htools (accessed on 20 April 2014).
  40. Jenks, G.F. The data model concept in statistical mapping. Int. Yearb. Cartogr. 1967, 7, 186–190. [Google Scholar]
  41. Ouyang, Z.; Liu, J.; Xiao, H. An assessment of giant panda habitat in Wolong Nature Reserve. Acta Ecol. Sin. 2000, 21, 1869–1874. [Google Scholar]
  42. Hu, J; Wei, F.W. The biological Studies of the Giant Panda; Sichuan Public House of Science and Technology: Chengdu, China, 1990; pp. 24–28. [Google Scholar]
  43. Chen, L.; Liu, X.; Fu, B. Evaluation on giant panda habitat fragmentation in Wolong Nature Reserve. Acta Ecol. Sin. 1998, 19, 291–297. [Google Scholar]
  44. Chapman, C.A.; Fedigan, L.M. Dietary differences between neighboring Cebuscapucinus groups: Local traditions, food availability or responses to food profitability? Folia Primatol. 1990, 54, 177–186. [Google Scholar] [CrossRef]
  45. Song, J.W.; Xiang, B.; Wang, X.; Wu, L.; Chang, C. Application of dynamic data driven application system in environmental science. Environ. Rev. 2014. [Google Scholar] [CrossRef]

