Article

Leaching Runoff Fraction for Nitrate and Herbicides on Sugarcane Fields: Implications for Grey Water Footprint

by
Fabio Vale Scarpare
1,2,*,
Luciana do Carmo Zotelli
2,
Robson Barizon
3,
Sergio Gustavo Quassi de Castro
4 and
Andre Herman Freire Bezerra
5
1
Biological Systems Engineering Department, Washington State University, Pullman, WA 99164-6120, USA
2
Faculdade de Engenharia Mecânica, Universidade Estadual de Campinas, Cidade Universitária “Zeferino Vaz”, Campinas 13083-860, SP, Brazil
3
Empresa Brasileira de Pesquisa Agropecuária (EMBRAPA) Meio Ambiente, Jaguariúna 13820-000, SP, Brazil
4
Laboratório Nacional de Biorrenováveis, Centro Nacional de Pesquisa em Energia e Materiais, Campinas 13083-970, SP, Brazil
5
Instituto Metrópole Digital, Universidade Federal do Rio Grande do Norte, Campus Universitário Lagoa Nova, Natal 59078-970, RN, Brazil
*
Author to whom correspondence should be addressed.
Sustainability 2023, 15(8), 6990; https://doi.org/10.3390/su15086990
Submission received: 30 March 2023 / Revised: 15 April 2023 / Accepted: 19 April 2023 / Published: 21 April 2023

Abstract

:
Sugarcane cultivation uses many chemical inputs to ensure good yields, which puts local water resources under pressure. Grey water footprint (GWF) is a widely used indicator of the volume needed to assimilate a pollutant load in a water body. However, the GWF relies on leaching runoff fractions, which are empirically determined. We hypothesize that these fractions might not represent the true magnitude of the Brazilian sugarcane environment and that management practices can further reduce this fraction loaded into the environment. In two field trials, we measure the herbicides and nitrate loaded into the environment through in situ measurements, determine their loss fractions, compare them with some empirical models, calculate the GWF, and estimate the potential for nitrate pollution attenuation with the adoption of split and incorporated nitrogen application. Both hypotheses are confirmed. For nitrate, our results suggest that the leaching runoff fraction used in most GWF studies is overestimated by about two times, impacting the GWF estimation for the Brazilian sugarcane environment. However, the same conclusion was not possible for herbicides due to the low diversity of the analyzed molecules. In addition, the fertilizer management application reduced the nitrate load on the environment, which the GWF did not necessarily detect.

1. Introduction

Brazil is the world’s largest sugarcane producer, with a cultivated area of 8.317 Mha in the 2021/2022 season and an average yield of ~70 Mg ha−1 [1]. The country’s central southern region is responsible for ~90% of all production. This region has adopted high technological levels, including the retention of straw mulch on the ground after mechanical harvests and crop rotation [2]. However, sugarcane had the second-largest national pesticide market in 2018, with ~12% of all sales in the country [3]. Moreover, due to a large amount of biomass produced, substantial amounts of nitrogen (N) fertilizer in commercial sugarcane fields are used compared to many other crops [4,5,6]. Furthermore, ~1000 weed species are estimated to inhabit the sugarcane agroecosystems, competing for nutrients, water, and light [7]. Therefore, various pesticides are applied simultaneously throughout the season [8,9]. In São Paulo (state), the largest producer region in Brazil, it is estimated that ~5 kg ha−1 of herbicides as a commercial product is applied widely in almost all cultivated fields [9]. Although they have agronomic benefits, these molecules outside the agricultural system can cause adverse effects on the environment [10]. Several studies [11,12,13] have indicated the potential for water resource contamination by herbicides used in sugarcane fields. Even at low concentrations, herbicide molecules can result in noticeable alterations in the long-term environmental quality of water resources [14], representing risks to biota and human health [15]. Likewise, nitrate losses to the environment can contaminate surface and groundwater sources, causing eutrophication [16].
Nitrate and herbicide loss quantification is challenging to perform directly on fields, partly due to the difficulties performing field trials and the uncertainties associated with estimating deep drainage and concentrations [17,18]. In this sense, researchers as well as different stakeholders from companies to environmental non-governmental organizations and governmental institutions frequently use sustainable indicators, such as grey water footprint (GWF) [19,20,21]. GWF estimates the volume of freshwater required to assimilate a load of pollutants based on existing ambient water quality standards [22,23]. However, the great uncertainty in its calculation relies on the fraction of diffuse pollution loaded into the environment through leaching and runoff processes, as Jamshidi [24] reported.
Due to the need for more accurate information, GWF studies addressing nitrate and herbicides, particularly at a large scale (e.g., at watershed, country, and continental levels), have used the Tier 1 approach by Franke et al. [25], an empirical model that assumes that 10% and 1% of the total N and herbicides applied in an agricultural system reach the surface water. However, Tier 1 has fixed lost fractions via the leaching and runoff of herbicides and nitrogen from fertilizers applied to the soil, disregarding the interaction and transformation of these inputs in the soil or along its flow path. Tiers 2 and 3 may be used to further refine leaching runoff fractions. However, their use is limited in studies addressing large areas due to the need for more specific data for each addressed environment (field). For this reason, most GWF assessment studies rely on Tier 1 [25]. Another alternative for the herbicide loss estimation to water resources is the PestLCI 2.0 model, which aligns with the most modern pesticide risk assessment models [26].
Although agricultural practices in the sugarcane production system vary according to growers’ access to productive factors, Brazilian central southern sugarcane fields can be considered relatively homogeneous at technical levels. Since the early 2000s, sugarcane harvesting in São Paulo has been done without burning (green cane) with a mechanical harvesting system, which may include large amounts of straw and tops on the soil surface as mulch. Currently, ~99% of the cane fields harvested in São Paulo are under the green cane management system [14,27]. Under these conditions, the effect of N fertilization and herbicide application rates on sugarcane fields and their leaching and runoff deviation fractions are investigated. This study hypothesizes that:
(a)
The leaching runoff estimated fractions of the Tier 1 approach by Franke et al. [25] and PestLCI [26] might not accurately represent the true magnitude of these losses to the Brazilian sugarcane environment;
(b)
Management practices can further reduce the fraction of diffuse solutes loaded into the environment through the leaching and runoff processes.
Therefore, the objectives of this study are as follows: (i) to measure the amount of two herbicides (Diuron and Hexazinone) and nitrate from a fertilizer loaded into the environment through in situ measurements; (ii) to determine the loss fractions of these pollutants, comparing them with some empirical models; (iii) to calculate the appropriation of water resources for the sugarcane production system through the grey water footprint methodology; and (iv) to estimate the potential for nitrate pollution attenuation with the adoption of some agricultural practices, such as split and incorporated nitrogen applications.
To our knowledge, no study has yet conducted a high-resolution GWF quantification on a sugarcane production system, separately analyzing the leaching and runoff fractions from field trials to nitrate and pesticides. The findings of this study are relevant beyond the study sites and could be used in similar sugarcane fields in central southern Brazil to refine the GWF estimations.

2. Materials and Methods

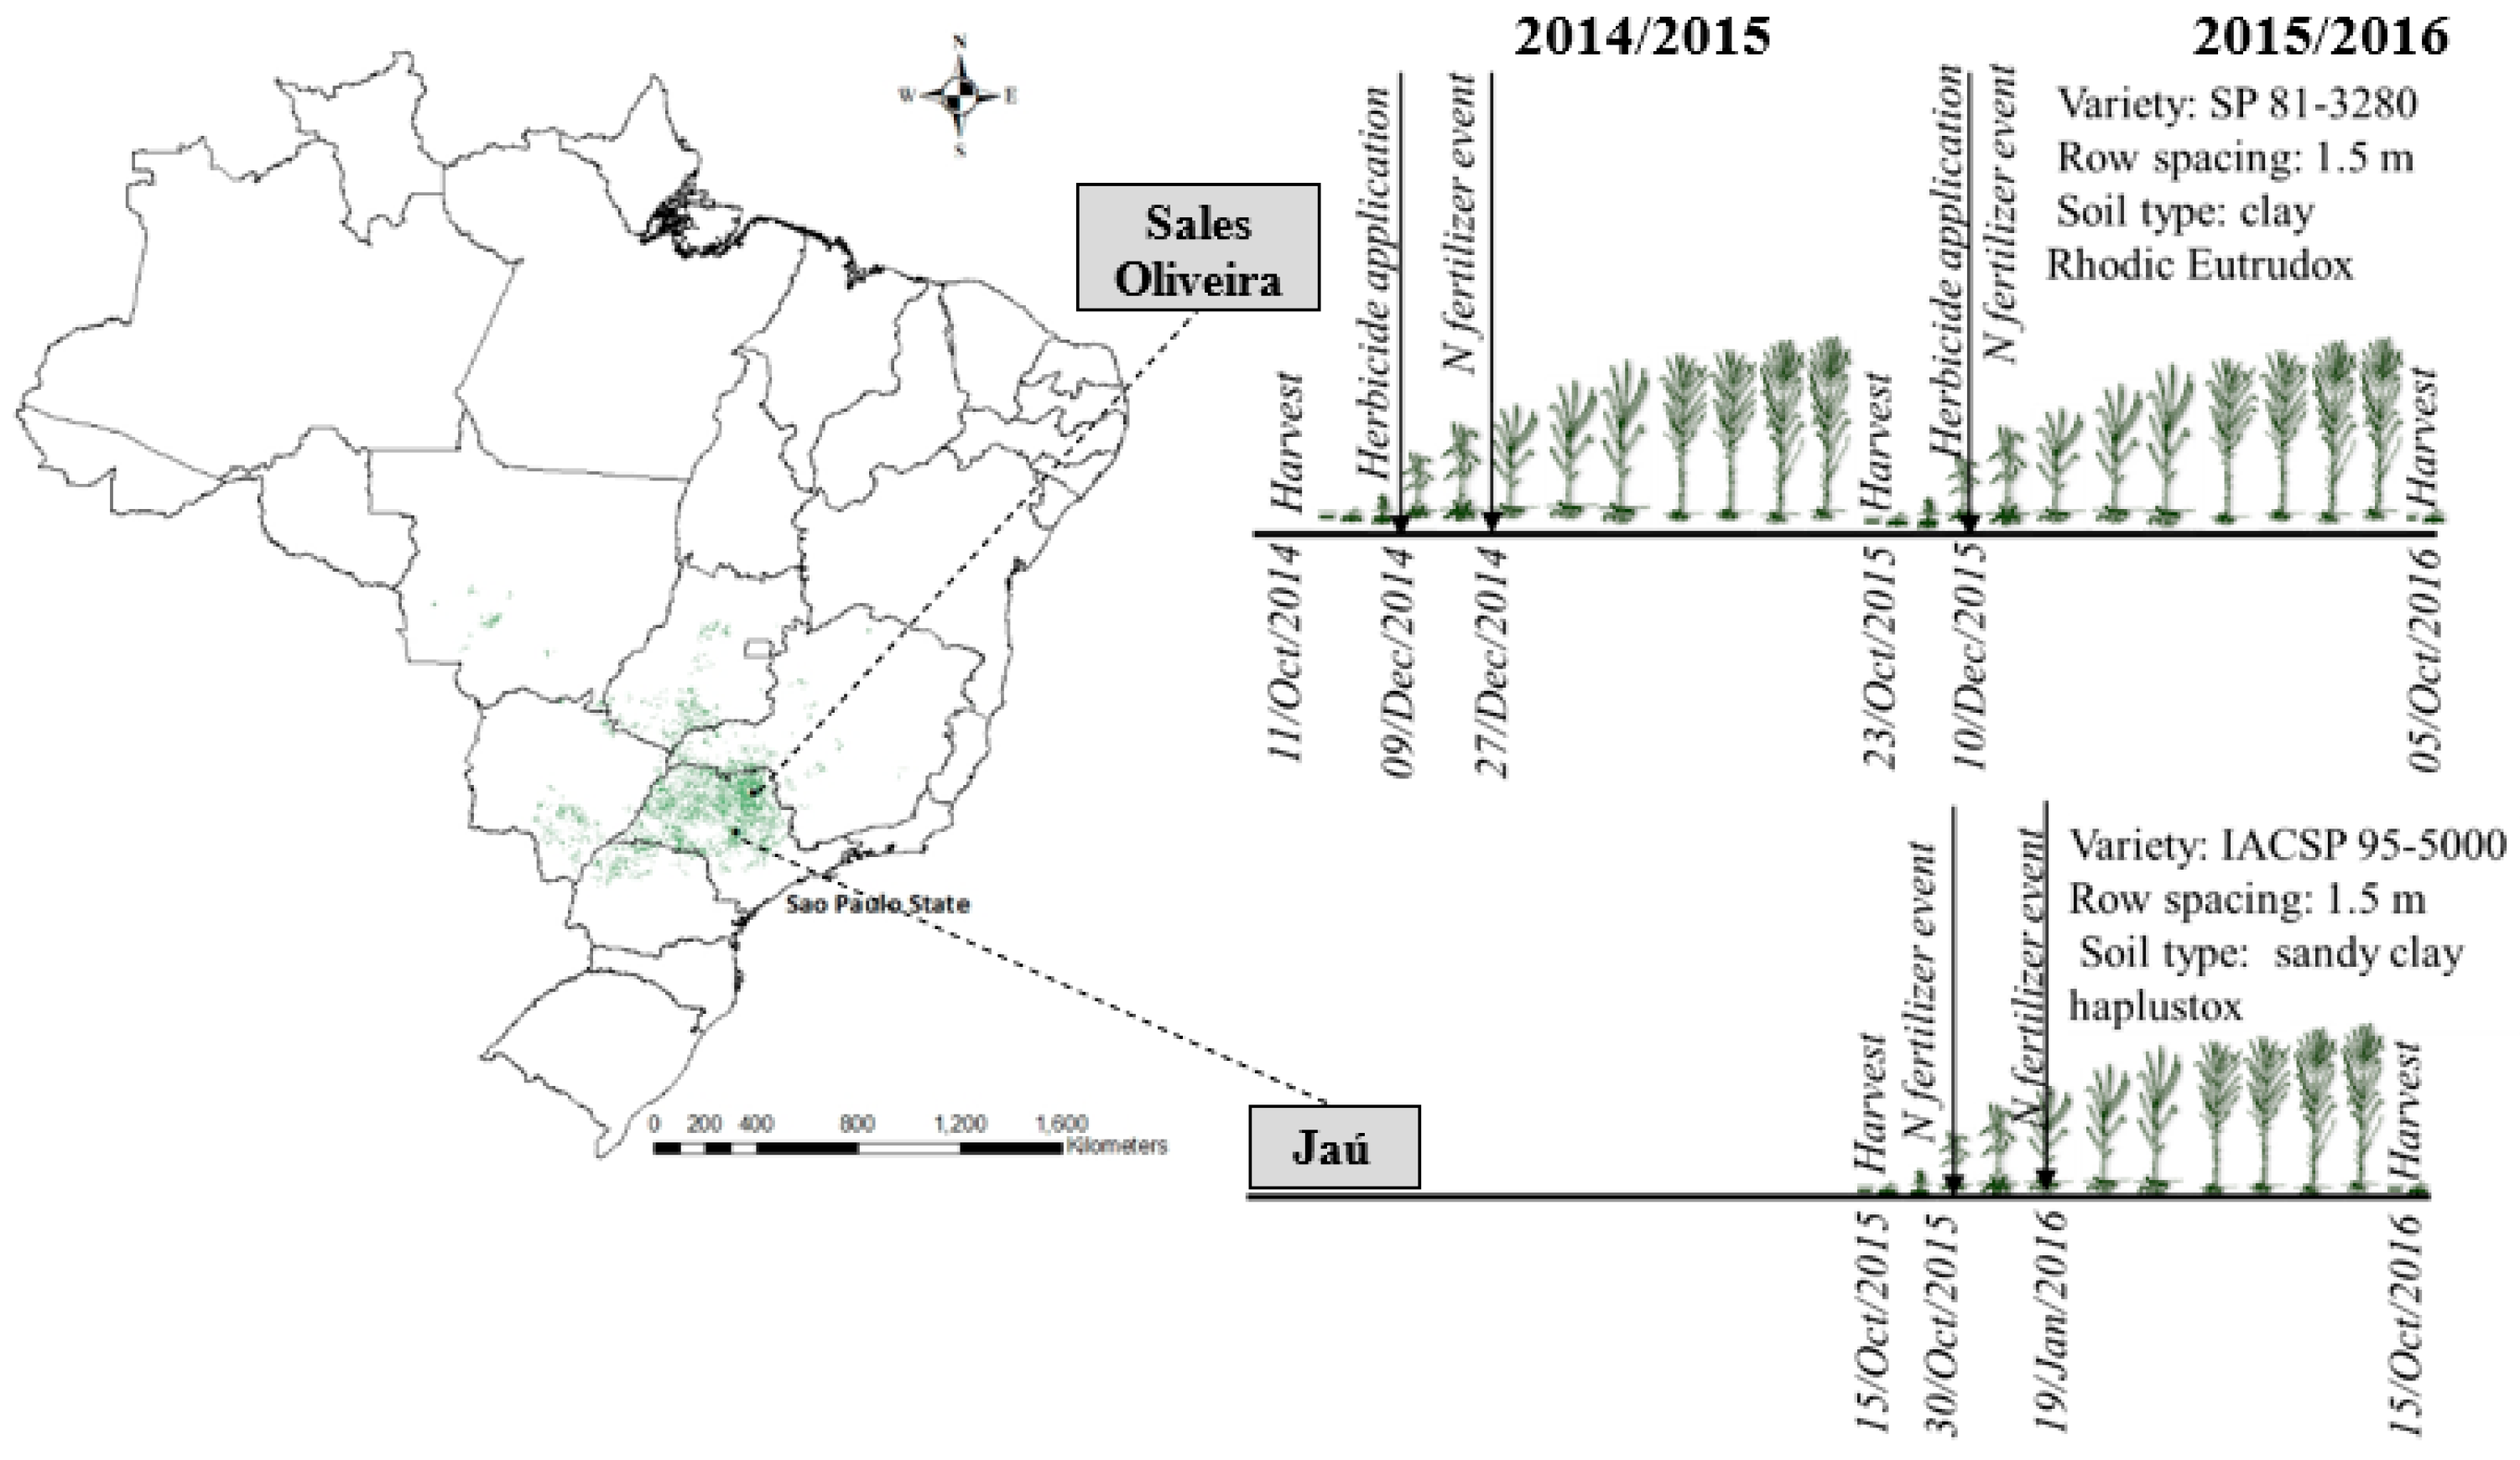
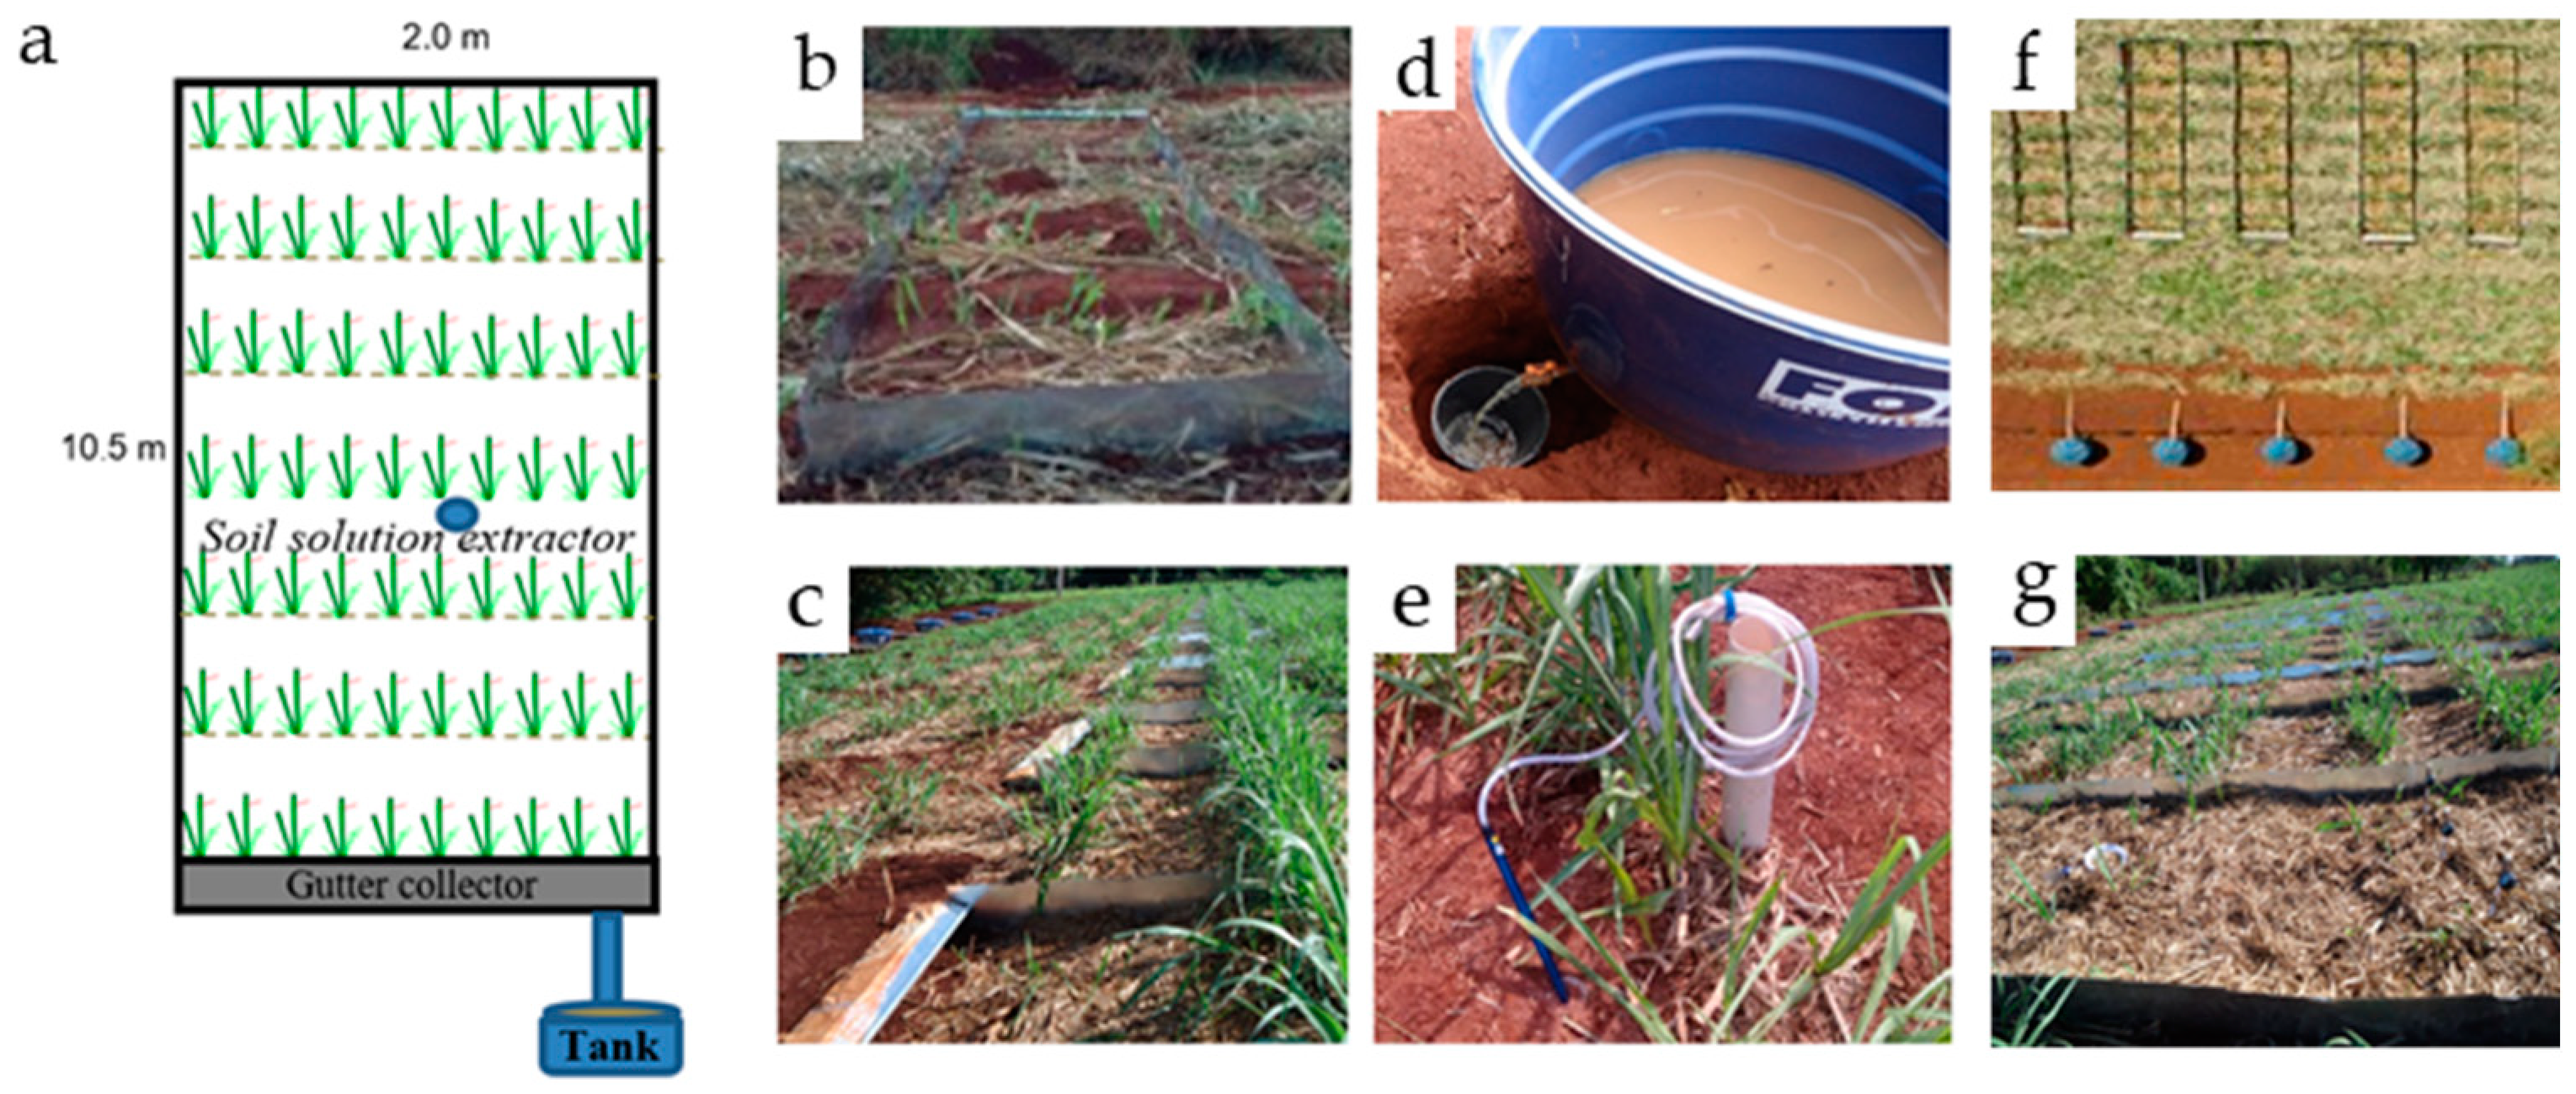
2.1. Trial Description and Used Treatments

The study consisted of two sugarcane field trials carried out in São Paulo (state), central southern Brazil, in the municipalities of (i) Sales Oliveira—SO (20°51′42″ S, 47°57′15″ W and 681 m above sea level) and (ii) Jaú—JA (22°17′ S, 48°34′ W and 580 m above sea level) (Figure 1).
The climate in this traditional sugarcane region is classified in the Köppen system as Aw, mesothermal tropical, with a mean annual temperature of 22 °C and mean annual precipitation of ~1300 mm. The soil type and the physical characteristics of both sites are described in Table 1.
The first trial was established in a commercial field cultivated throughout the 2014/2015 and 2015/2016 crop seasons with SP81-3280 variety in SO. The experiment was designed in randomized blocks using three treatments with three replications. The treatments comprised 120 kg N ha−1 of ammonium nitrate applied via spraying broadcast over residue mulch (N120bro), 120 kg N ha−1 of ammonium nitrate incorporated in the soil at 0.1 m on both sides of the sugarcane row (N120inc), and a control treatment without nitrogen fertilization (Nzero), according to the methodology proposed by Castro et al. [29]. All nitrogen fertilization was applied at once 77 and 48 days after the previous crop harvest for the 2014/2015 and 2015/2016 seasons, respectively. In addition to nitrogen, 30 kg P2O5 ha−1 of triple super phosphate and 60 kg K2O ha−1 of potassium chloride were applied based on soil chemical analysis [30]. In this trial, a commercial herbicide was sprayed on the soil surface at 0.33 kg ha−1 to hexazinone and 1.17 kg ha−1 to diuron 59 and 48 days after previous crop harvests in the 2014/2015 and 2015/2016 seasons, respectively. Herbicides were applied in all treatments, including the control.
The second trial occurred in JA at the Experimental Station of the Agronomic Institute of Campinas (IAC) during the 2015/2016 crop season throughout the first ratoon cycle (variety IACSP 95-5000). The treatments comprised two nitrogen fertilization application rates of 140 (N140bro) and 210 kg ha−1 (N210bro) ammonium nitrate applied via spraying broadcast over a straw residue on sugarcane rows. However, in this trial, the total nitrogen fertilizer was split 15 and 96 days after the previous crop harvest. In addition, the control (Nzero) without any nitrogen fertilization was also considered. The experimental layout was arranged in a randomized split block design with four replicates. Moreover, based on soil analysis, all treatments received 140 kg ha−1 of K2O.
In both trials, cane harvest was performed manually without burning. Therefore, ~8.0 and 9.5 Mg ha−1 straws (green and dry leaves) on the dry matter basis were left on the soil surface as mulch in the 2014/15 and 2015/16 seasons in SO, while ~8.0 Mg ha−1 straws were left in JA. For residue dry matter estimation, straw was dried to constant weight at 65 °C and distributed manually on each plot, as detailed in the following section.

2.2. Field and Lab Measurements

Each plot (replicates) consisted of a 21 m2 catchment area delimited by galvanized sheets (2.0 × 10.5 m) fixed vertically in the ground perpendicular to the planting lines. The catchment area had seven sugarcane planting rows spaced 1.5 m apart. A gutter connected through a 200 mm pipeline to a closed water tank with a 1.0 m3 capacity was used for runoff assessment. Soil solution extractors with porous cups (UMS, SK20, Munich, Germany) were installed at 0.9 m depth in the middle of each catchment plot and kept in the vacuum at 0.6 bar for leaching samples’ assessment (Figure 2).
Leachate extraction at 0.9 m depth was adopted because it is below the effective sugarcane rooting zone [31], where about 80% of the root mass is concentrated. Runoff and leachate samples from the field were stored in a freezer under 4 ± 2 °C according to CETESB [32] before laboratory analysis. The nitrogen in leachate, i.e., the removal of soluble materials by water moving from one layer to another of the soil profile and runoff samples from SO were determined by ion chromatography and the herbicides by ultra-performance liquid chromatography (UPLC-ESI-QTOF/MS) according to the APHA [33]. Runoff and leachate samples from JA were analyzed by flow injection analysis (FIA), adapted from Armstrong et al. [34].
In both sites, soil water retention characteristics were measured from undisturbed cores collected with stainless steel cylinders (0.05 × 0.05 m) at 0.20, 0.40, and 1.0 m depths with ten replicates. In the laboratory, these undisturbed soil cores were saturated and equilibrated to defined pressure heads (0.1, 0.2, 0.6, 1.0, 3.3, 10, 30, and 150 m) on porous plate equipment, after which water content was determined. The van Genuchten [35] soil-water retention equation was fitted to these data to describe the functional relationship between predicted soil water content θ(h) and the corresponding absolute value of the pressure head (h). Soil porosity was calculated from bulk and particle densities. The volume fraction of micropores was estimated considering the water content at 0.6 m tension (θ0.6) and macropore content by the difference between micropores and total porosity.
In JA, dielectric water potential sensors (MPS-2 Decagon, Pullman, WA, USA) were horizontally installed at 0.2, 0.4, and 1.0 m depths, 0.15 m apart from the planted lines with three replicates. In SO, the daily soil pressure head was obtained by tensiometers with porous cups installed at 0.8, 0.9, and 1.0 m depth with four replicates. In both sites, a meteorological station installed adjacent to the experimental area recorded the maximum and minimum air temperature (°C), wind speed (m s−1), air humidity (%), solar radiation (MJ m−2), and rainfall (mm) daily.

2.3. Runoff and Leaching Assessment

In this study, nitrogen and herbicides leaching runoff fractions from field experiments (αexp, %) were used in two empirical methodologies for leaching runoff fraction calculation: those by Franke et al. [25] (αFranke, %) and PestLCI [26] (αPestLCI, %).

2.3.1. Leaching Runoff Fraction and Total Pollutant Losses from Field Experiments

The nitrogen and herbicides leaching runoff fractions from field experiments (αexp, %), i.e., the sum of runoff (αrunoff, %) plus leaching (αleaching, %) fractions, were estimated by mass balance approach, presented in Equations (1) and (2).
α runoff [ % ] = q runoff AR
α leaching % = q leaching AR
where AR is the chemical application rate (kg ha−1), qrunoff is the sum of the chemical mass element in surface water (kg ha−1), which is estimated according to Equation (3), and qleaching is the chemical mass element flow below 0.9 m depth (kg ha−1), which is calculated according to Equation (4):
q r u n o f f = t 0 t f q r C r d t
q l e a c h i n g = t 0 t f q l C l d t
where qr is the surface runoff flux (m d−1), Cr is the chemical element concentration (mg L−1) in the surface water samples collected in reservoirs, ql is the soil water flux density (m d−1), Cl is the chemical element concentration (mg L−1) in the soil solution samples collected in soil solution extractors, and t0 and tf are the initial time (emergence after preview harvest) and final time, which correspond to the harvest.
The soil water flux density (ql) and surface runoff flux (qr) were estimated by using the Soil Water Atmosphere Plant—SWAP model, version 3.2, a dynamic, deterministic, and process-based model with a daily time step [36,37]. The soil water flux density (ql) was calculated by the Darcy–Buckingham approach (Equation (5)) for daily one-dimensional vertical soil profile. The surface runoff flux (qr) was estimated by Equation (6).
q l = K ( h ) ( h + z ) z
where K(h) is the soil hydraulic conductivity (m d−1), h is soil water pressure head (m), and z is the soil profile vertical coordinate (m), taken positively upward.
q r = 1 γ max 0 , h 0 h 0 , t h r e s h o l d β
where h0 is the ponding depth of water (m) on the soil surface, γ is a resistance parameter (−1 d), β is an exponent (-) in the empirical relation, and h0,threshold is the critical depth of water storage in a ponding layer that, when it is exceeded, results in surface runoff.
In SWAP, an embedded generic mechanistic crop growth model WOrd FOod Studies—WOFOST [37,38] was used based on the calibration by Scarpare [39] for sugarcane above-ground biomass production under rainfed conditions in São Paulo. The core of the SWAP model is Richards’ equation (Equation (7)), where the soil water transport is modeled by combining the Darcy–Buckingham equation and the law of continuity.
θ t = C ( h ) h t = K ( h ) h z + 1 z S ( h )
where θ is the soil water content (m3 m−3), C is the water capacity (m−1), t is the time (d), z is the vertical distance taken positive upward (m), K is the unsaturated hydraulic conductivity (m d−1), and S is the sink term (d−1).
The saturated soil hydraulic conductivity (Ksat, cm d−1) and its shape parameter (λ, -) were estimated by inverse modeling approach using the soil water potential from field observations as fitting criteria [40]. The Parameter ESTimation (PEST) software [41] that uses Gauss–Levenberg–Marquardt algorithm to solve Equation (5) was used for this task.
Based on SWAP/WOFOST water balance simulation, the total amount of pollutant lost from field experiments (kg ha−1) was estimated by multiplying the total water losses (runoff and leachate) by average pollutant concentration.

2.3.2. Leaching Runoff Fraction According to Franke et al. [25]—Tier 1 Approach

The second leaching runoff fraction approach for nitrate, diuron, and hexazinone was based on Franke et al. [25] (Equation (8)):
α F r a n k e % = α m i n + i s i × w i i w i × α m a x α m i n
where si is the score for the leaching runoff potential (-), and wi is the weight of the factor considered (-). For nitrogen, αmin is considered 1.0% and αmax 25%, while for herbicides, αmin is 0.01% and αmax 10%.
The factors influencing the methodology for the leaching runoff fraction proposed by Franke et al. [25] were used to estimate the contribution of the leaching and surface runoff from specific categories. The categories for nitrate are environmental factors (N-deposition, texture, natural drainage, and precipitation) and agriculture practices (N-fixation, application rate, N-plant uptake, and management practice). For pesticides, the categories are chemical properties (Koc and persistence), environmental factors (texture and organic matter), climate (rain intensity and precipitation), and agricultural practices (management practices).

2.3.3. Leaching Runoff Fraction According to PestLCI [26] Approach

PestLCI 2.0 is a pesticide inventory model [26] primarily used in life cycle assessments to estimate the fractions of pesticides emitted to different environmental compartments. For example, herbicide emissions are estimated according to Equation (9) as the sum of the number of pesticides emitted to air, surface water, and groundwater.
α P e s t [ % ] = m e m A R = f a i r + f s w + f g w
where mem is the total mass of pesticide emitted (kg ha−1), AR is the chemical application rate (kg ha−1), fair is the fraction of pesticide emitted to air (%), fsw is the fraction of pesticide emitted to the surface water (%), and fgw is the fraction of pesticide emitted to groundwater (%).
PestLCI 2.0 was parameterized to SO considering the following inputs: soil properties (organic carbon, pH, and texture), climate (maximum and minimum air temperature, average rainfall on a rainy day, total rainfall in 24 h, and solar irradiation). In addition, landscape (field width, length, and slope) and agronomic data (crop development stage at the time of application, active ingredient rate, application month, and application method) were also considered.

2.4. Grey Water Footprint Assessment

The leaching runoff fractions (α) obtained from the different methodologies described above were used to estimate the GWF, which was estimated according to Hoekstra et al. [42]’s approach (Equation (10)):
G W F m 3 k g 1 = A R × α / c m a x c n a t C a n e   y i e l d

2.5. Statistical Analysis

All data were statistically analyzed using the PAST 3® software [43]. The homogeneity of variance of chemical concentration was checked, and when necessary, the data were transformed using the Box and Cox [44] optimal potential procedure. An analysis of variance (ANOVA) test was performed to evaluate differences in nitrogen and herbicide losses between the evaluated treatments. The Tukey test (at 5% of probability) was used to assess whether the means for a different group (treatments) were significantly different from each other.

3. Results

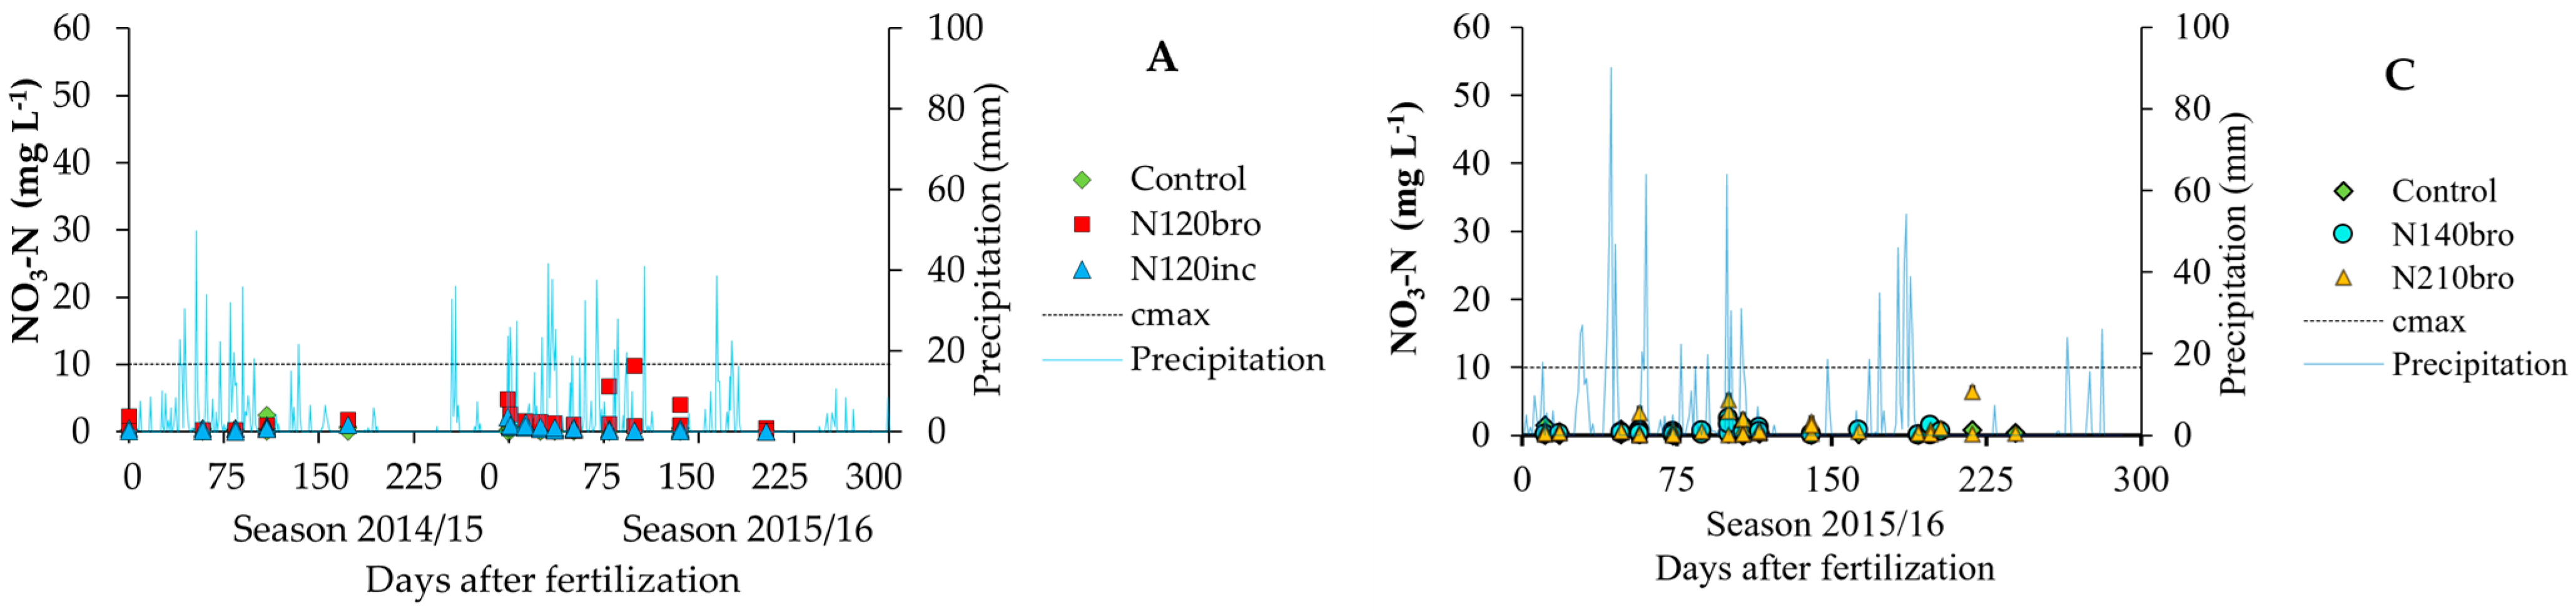
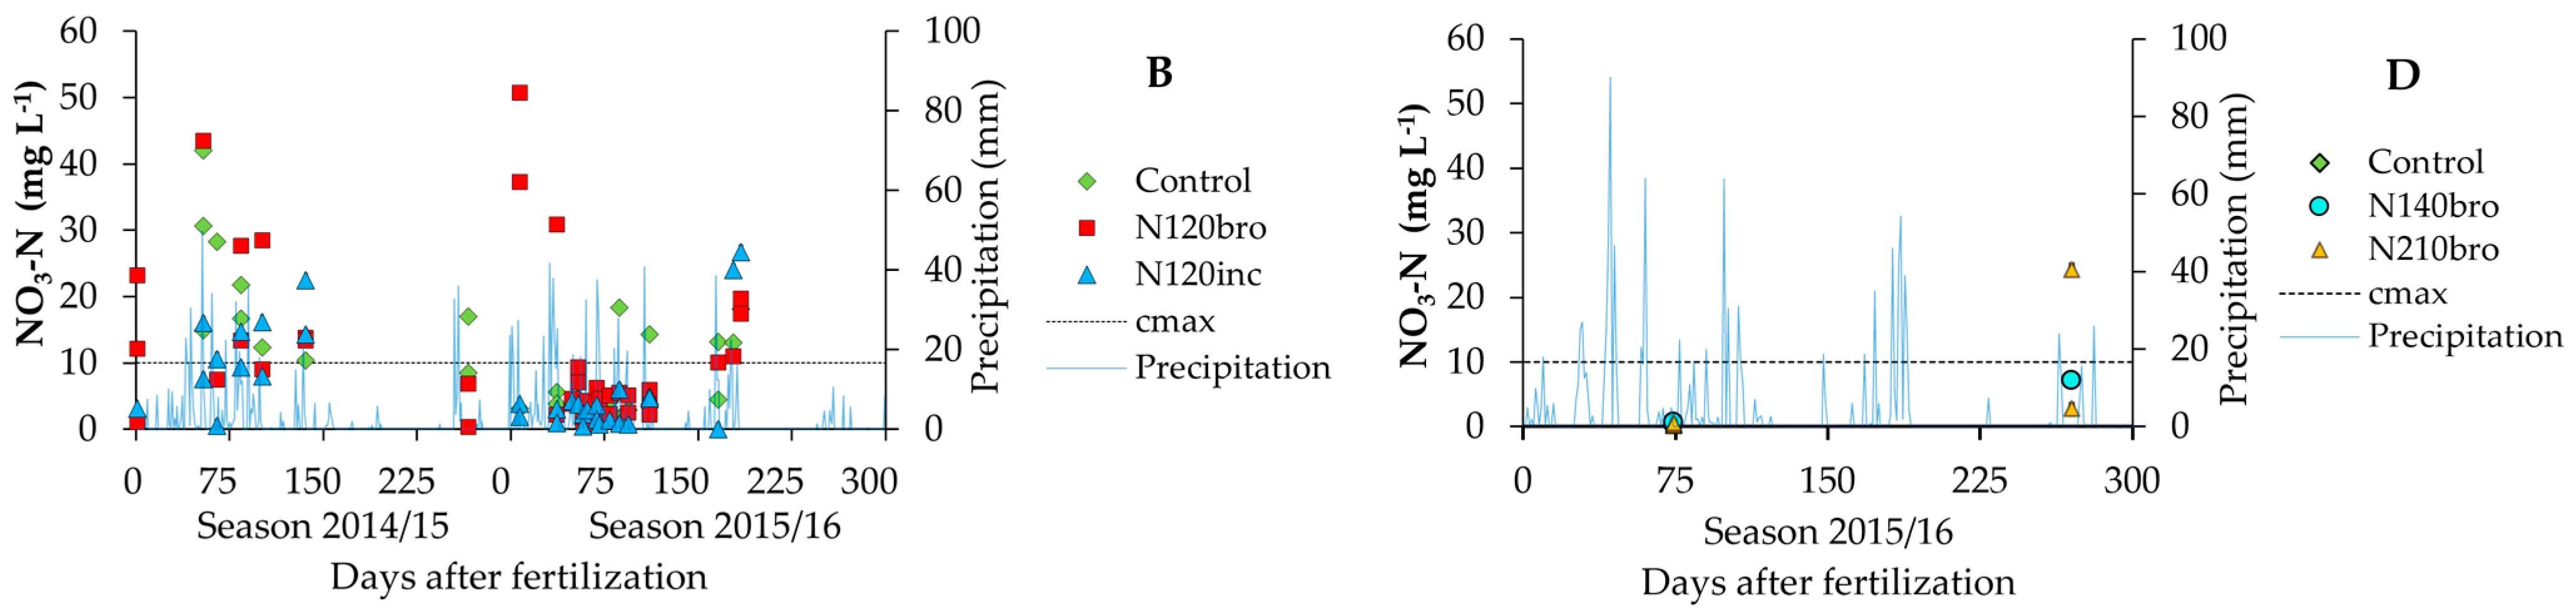
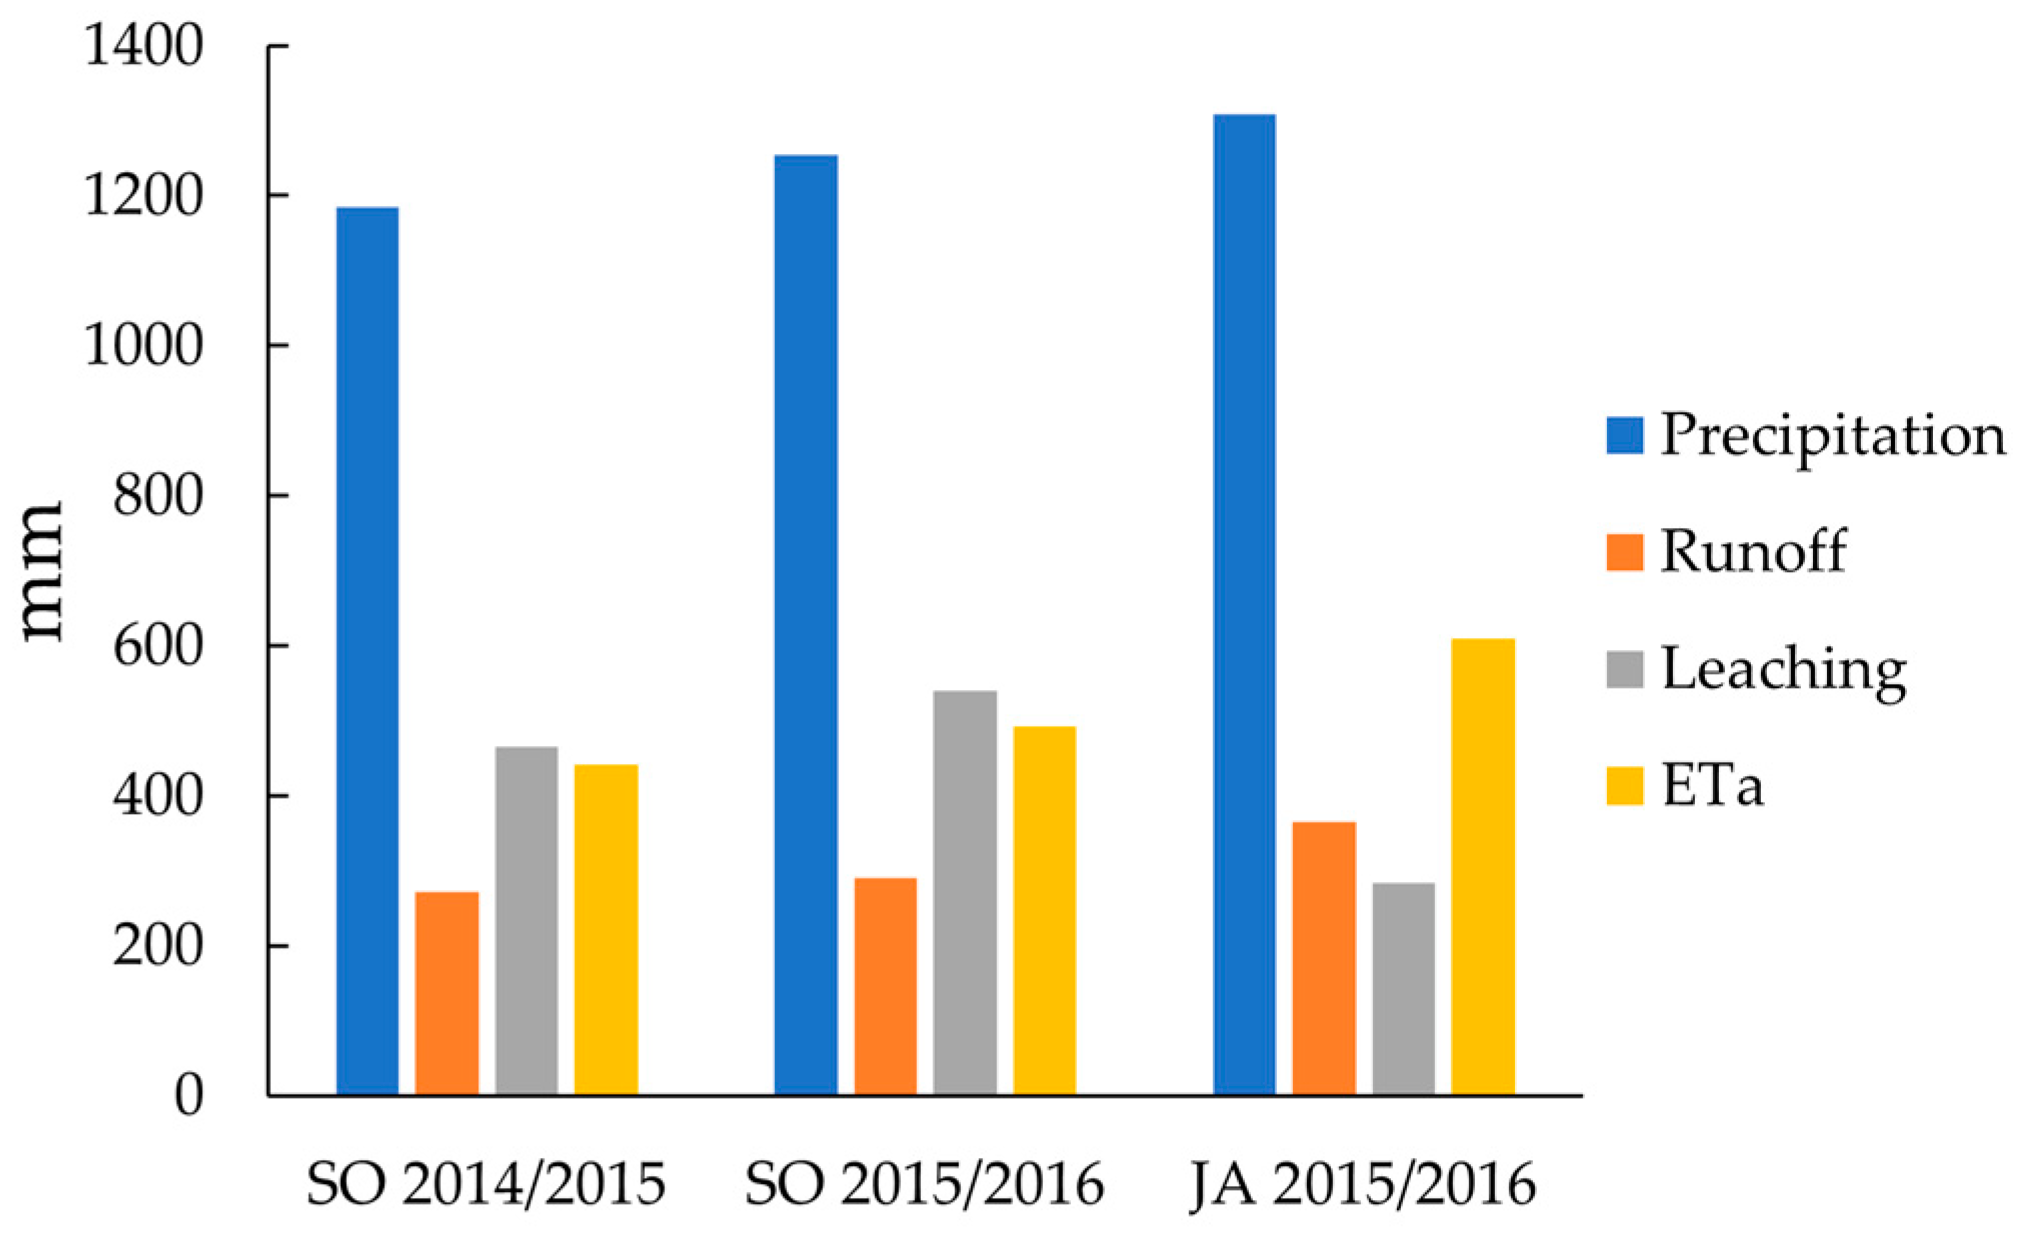
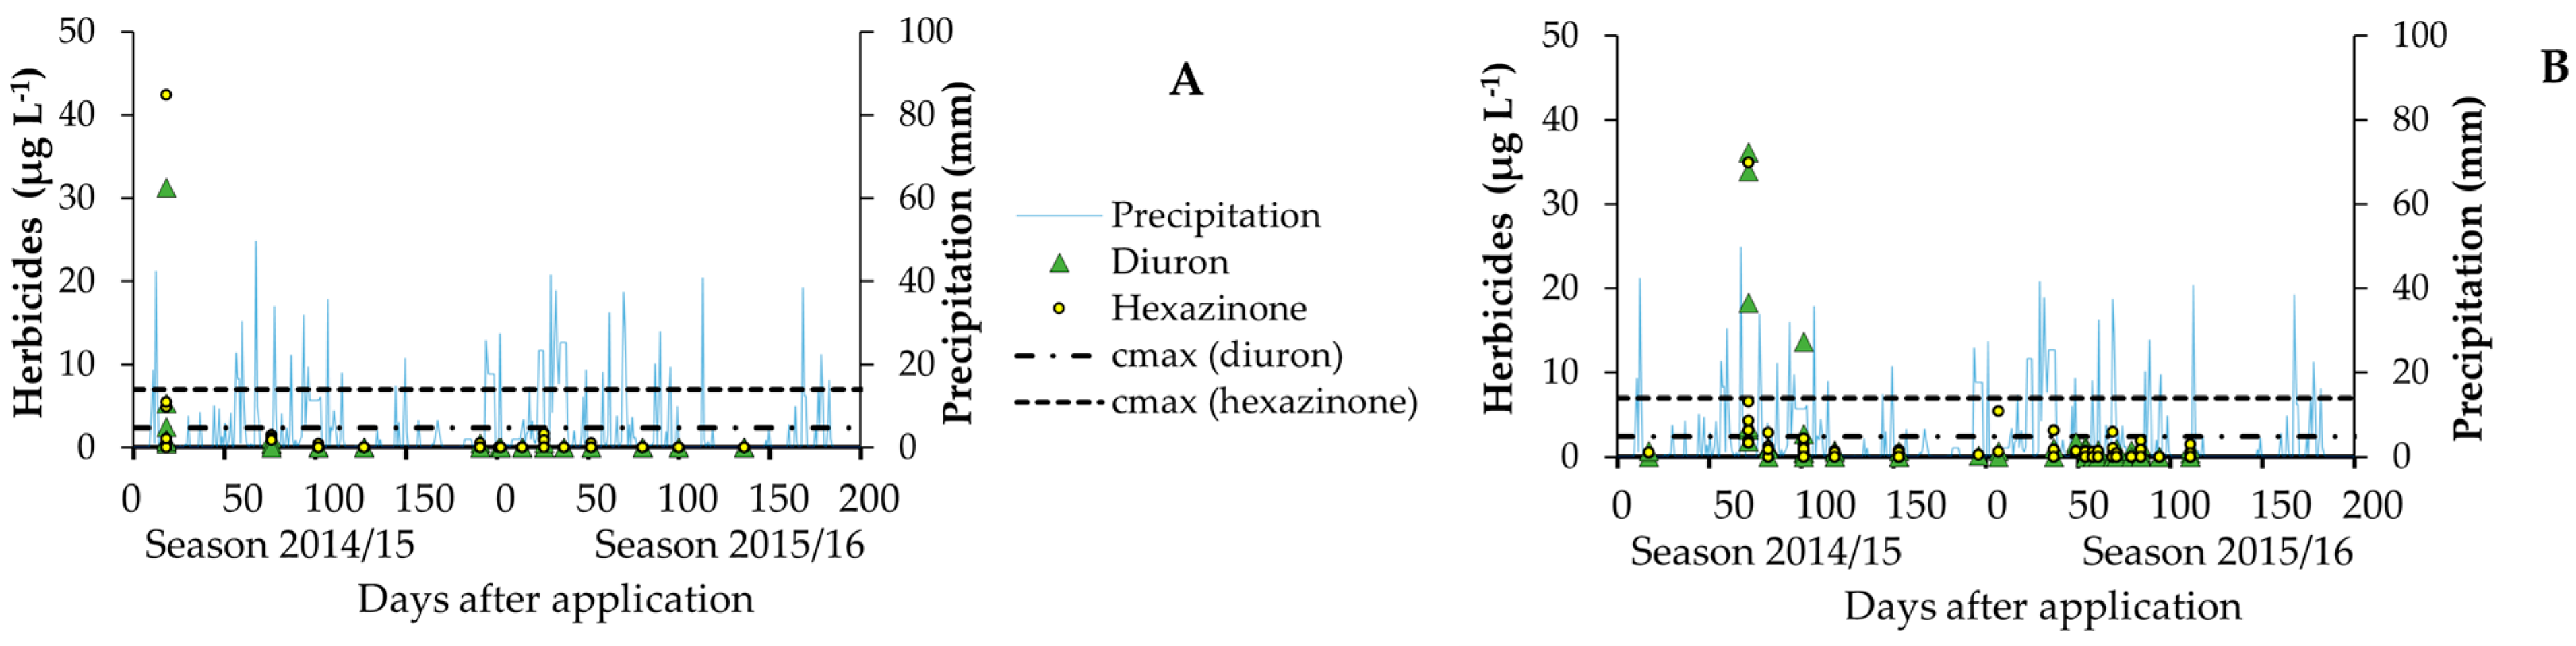
3.1. Nitrate and Herbicide Pollutant Load on the Environment—Measurement

The nitrate concentration patterns were similar in both trials. Although there were no significant differences between the runoff treatment samples, the nitrate concentration was always higher than the leachate concentration (by ~ten times in SO and ~five times in JA), often exceeding the cmax. On the other hand, the leachate concentration that was below 0.9 m was significant (p < 0.05) between the treatments (Table 2), and it never exceeded the established limit for nitrate (Figure 3).
Although the leachate concentration samples were lower, the nitrate load on the environment could be substantial at the end of a season, especially for high porosity soil, such as SA (Table 1), which presented a high fraction (~40%) of water balance for drainage (Figure 4). Studies performed with sugarcane in the same region have also reported a high amount of leached N from native and fertilizer sources [46,47,48].
The nitrate concentration in the control treatment samples (Nzero) was also expected since these trials were carried out in fields with a long history of more than 20 years of sugarcane cultivation. Thus, the nitrate detection may stem from previous growing cycle fertilizations in the area, as reported in different studies [16,17,18,19,20,21,22,23,24,25,26,27,28,29,30,31,32,33,34,35,36,37,38,39,40,41,42,43,44,45,46,47,48], and to a lesser extent, from the mineralization of soil organic matter [49].
The herbicide concentrations, such as nitrate, were lower for the runoff samples than leachate (Figure 5). However, the leachate fraction’s herbicide losses to the environment were significant, especially for hexazinone (Table 2).
The maximum concentrations of diuron (36.2 µg L−1) and hexazinone (34.9 µg L−1) in the runoff samples were observed ~2.5 months after their application, which lasted for ~5.5 months for diuron (13.6 μg L−1) (Figure 5). Furthermore, several other studies reported similar herbicide concentrations in sugarcane fields in Australia 2.5 and 4 months after their application [50,51] and in Brazil [12], evidencing a longer half-life on the soil (75 days) than was proposed by Lewis et al. [52].

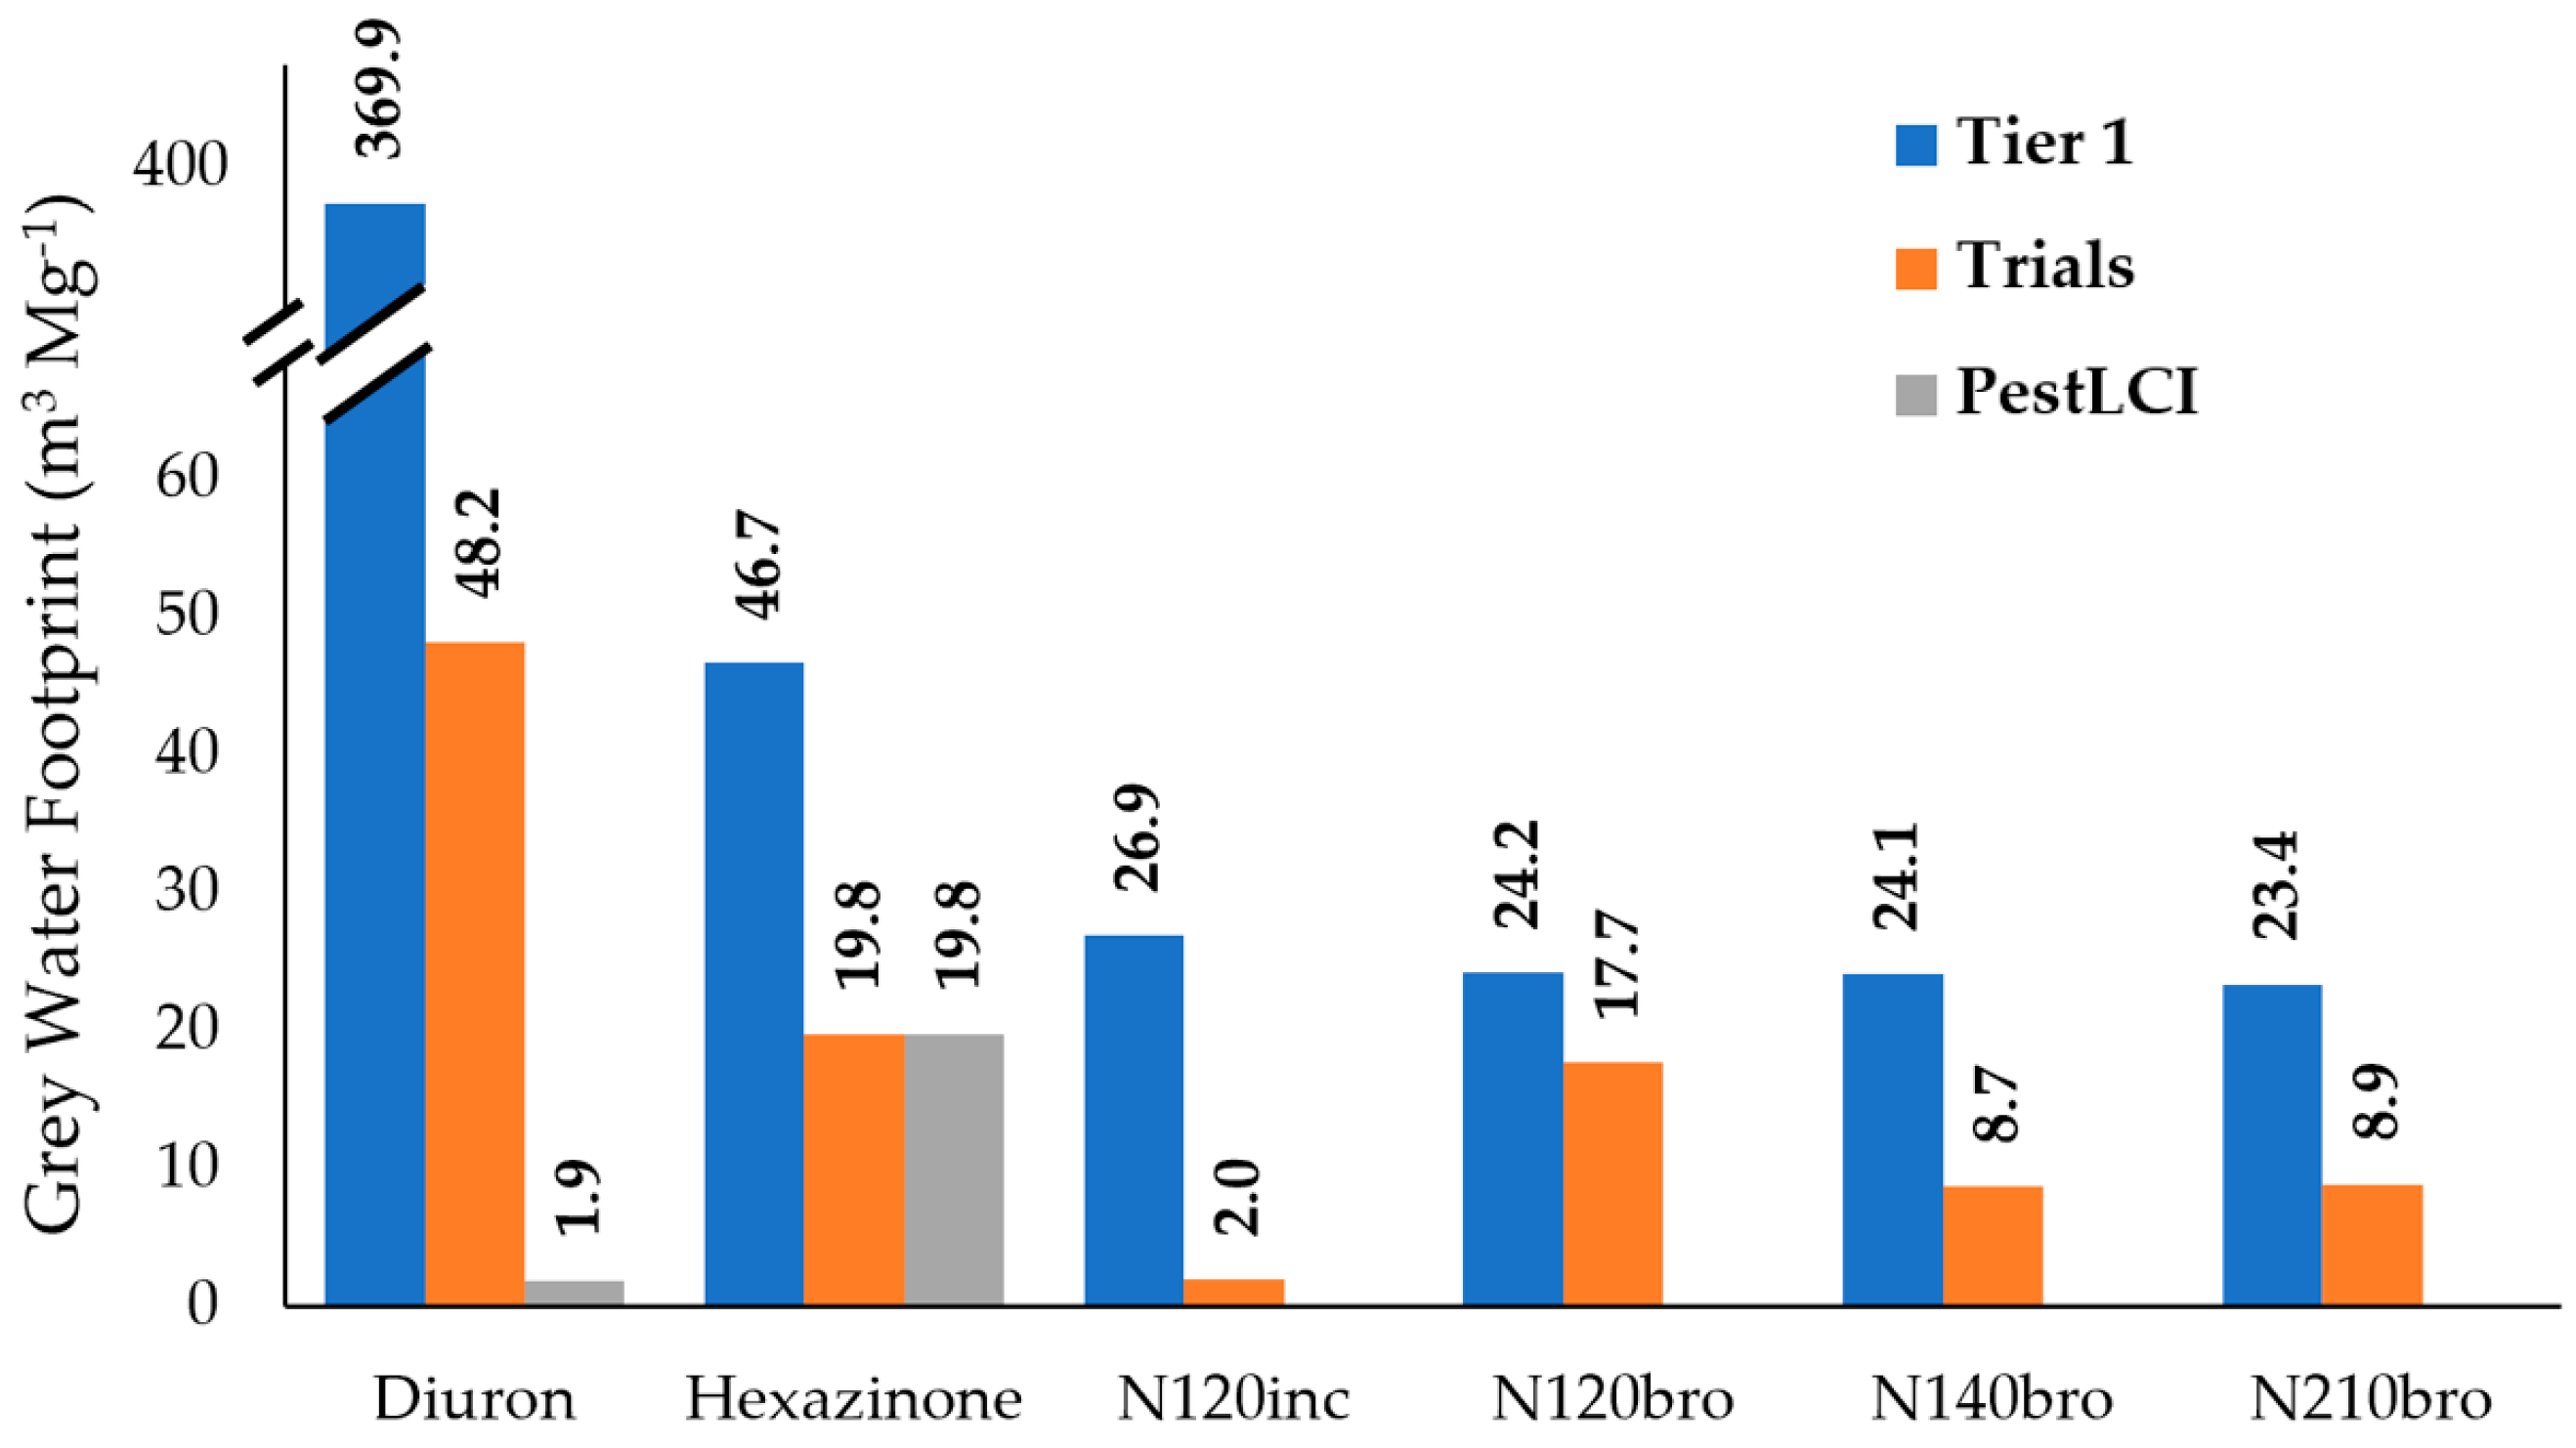
3.2. Leaching Runoff Fraction and GWF

The leaching runoff fractions for nitrate, diuron, and hexazinone estimated by two empirical models versus those obtained from the field measurements, detailed in Section 2.3, are presented in (Table 3).
The huge leaching runoff fraction differences between the herbicides are due to each molecule’s physical/chemical characteristics. For example, hexazinone’s water solubility (252 mg L−1 at 20 °C) is ~seven times higher than that of diuron (35.6 mg L−1 at 20 °C). At the same time, the sorption coefficient in the soil organic carbon of hexazinone is ~ten times lower than that of diuron [52], facilitating its adsorption affinity to the soil organic particles [53]. In regards to GWF, diuron is the main chemical element requiring the largest amount of water to re-dilute the polluted freshwater back to an acceptable threshold value (Figure 6).

4. Discussion

The average αFranke was ~2.5 and ~4.5 times higher than that in the field experiments for the nitrate and herbicides. However, the most significant discrepancy between the trials and empirical models was observed for pesticide αPestLCI, which was ~20 times lower than αexp (Table 3). The PestLCI underestimated the losses of diuron and hexazinone in the two harvests evaluated. This model was originally developed to meet European production scenarios [26,54]; therefore, its applicability to other geographic areas can be limited [55]. Some essential practices in tropical environments, such as vegetation cover, were not incorporated into the model and can explain this result [56]. The maintenance of straw on the soil surface plays a vital role in the dynamics of pesticides. The amount of plant material maintained in the experiments (~8 kg ha−1), which is not considered in the PestLCI, can substantially interfere with the losses of the herbicides on the surface and at a depth. In addition to the geographic factor, the difference of 0.2 m in the depth assessed for herbicide loss between the PestLCI (1 m) and our agricultural experiment (0.9 m) may have contributed to the lower leaching runoff fraction obtained by the model, since herbicides tend to degrade in the soil profile.
The average nitrate αexp from our trials, 5.2%, was very close to what Otto et al. [57] observed (5.6%), which summarized the in-situ measurements of the N balance for Brazilian sugarcane fields at the same technical level as explored in this study. The fertilizer management application explored in both trials reduced the nitrate load on the environment. The fertilizer soil incorporation used in the SO trial was responsible for significant nitrate reductions of ~75% and ~45% for leaching and runoff, respectively (Table 2). While in JA, although not significant, the split broadcast application, i.e., a half-dose of N120bro vs. N210bro, reduced the nitrate load by ~50% and ~40% through solute leaching and runoff, respectively (Table 2). However, lower nitrate load management does not necessarily translate into lower GWF estimations, because it is composed of a ratio between the application rate times its leaching runoff fraction over the crop yield, which are directly proportional. Therefore, the nitrate GWF interpretation per unit of yield could be tricky. For example, in JA, although the N210bro resulted in a higher nitrate load on the environment (Table 2), it also promoted a higher crop yield (e.g., 90.3 Kg ha−1 compared to 79.2 Kg ha−1), counterbalancing the GWF estimations (Figure 6). In SO, the GWF estimations were impacted by the meager leaching runoff fraction measured for the N120inc treatment (Table 3).
The average nitrate GWF of ~9 m3 kg−1 obtained in our trials is substantially smaller than that of the Franke approach, ~24 m3 kg−1, and by other studies performed in Brazil, ~18 m3 kg−1 [20,21], which used a constant α approach of 10%. Therefore, in addition to Tier 1, two other higher-tier levels (Tiers 2 and 3) are suggested to be used for more accurate α results [58]. However, this requires detailed input data, making it difficult for large global, national, basin, and district assessment areas. Furthermore, besides the leaching runoff fractions (α), GWF estimations are strongly sensitive to the environmental water quality standard values, which could vary from basin to basin for cnat, and the environmental protection agencies in different countries for cmax, as stated by Muratoglu [58].
In our trials, the higher nitrate concentration in the runoff samples was somehow expected, especially at the beginning of the crop development when the sugarcane canopy had not yet covered the soil, as stated in some studies [59,60]. Furthermore, although the straw mulch deposition on the soil surface after an unburnt harvest mitigates the erosion process by dissipating the kinetic energy of raindrops on the surface [2], at the same time, it creates a physical barrier between the soil and fertilizer. Therefore, high-intensity storms (e.g., >7.5 mm h−1), which represented 27 and 37% of total precipitation in SO and JA, provide mechanisms for rapid fertilizer transport to the environment through runoff. This is one of the reasons why N fertilization applications should be split or even incorporated into the soil when applied in large doses, especially on sandy soil texture fields with a moderate slope.
Regarding all the nitrate leached below 0.9 m, it is impossible to affirm that its fate will be in local water bodies or groundwater. Soil nitrogen dynamics are complex, with mineralization occurring during the decomposition of organic matter and immobilization occurring during microbial synthesis and humification [61]. Moreover, it is recognized that the sugarcane root system, composed of rope roots, plus the superficial and buttress root types [62], can reach several meters of depth, depending on the physical/chemical characteristics of the cultivated soil [31,32,33,34,35,36,37,38,39,40,41,42,43,44,45,46,47,48,49,50,51,52,53,54,55,56,57,58,59,60,61,62,63]. In Brazil, sugarcane fields are established mainly on well-drained deep and highly weathered soils [64], expanding toward the Cerrado environment (Cerrado is a vast ecoregion of tropical savanna in Eastern Brazil, particularly in the states of Goiás, Mato Grosso do Sul, Mato Grosso, Tocantins, Maranhão, Minas Gerais, and the Federal District) under similar soil conditions [65,66]. Thus, iron (Fe) and aluminum (Al) oxides prevail in the subsurface horizons of highly weathered soil with low soil organic matter.
Moreover, depending on the soil’s pH, the development of anion exchange capacity can sorb anions, such as nitrate. On top of that, the N rates adopted in Brazil are substantially lower than the N fertilization rates adopted in other sugarcane producers’ countries, as stated by Robinson et al. [67]. For example, in São Paulo (state), the official N fertilization recommendations for ratoon crops vary between 60 and 120 kg N ha−1, depending on the expected yield [68]; in Australia, higher fertilization amounts for ratoon, i.e., ~30%, are usually recommended.
The highest calculated GWF in our trials were obtained for herbicides, diuron, and hexazinone (Figure 6), reinforcing the idea that all chemical products used in the production chain should be considered for calculating the appropriation of water resources, as stated in several studies, e.g., [8,19,58]. In our trials, ammonium nitrate was the only source of nitrogen addressed. However, other types of nitrogen fertilization, particularly inorganic N versus manure or organic N, could influence the leaching runoff fraction and GWF. Besides fertilizers, various other agrochemical types usually applied in sugarcane areas, including natural substances with no toxicological characteristics and risks (e.g., vegetable extracts and pheromones used to control pests), to chemical molecules such as herbicides, insecticides, ripeners, and adhesive spreading agents. Higher herbicide GWF levels have been reported for sugarcane fields in Brazil. Under a mixture of herbicides, Vale et al. [8] estimated a GWF of ~900 m3 kg−1, while Barreto et al. [19] found a GWF of ~1700 m3 kg−1. Besides the α, the highest GWF levels for herbicides compared to nitrate are also due to the low cmax and null cnat. Synthetic chemical molecules used as pesticides do not have a natural environmental concentration. In addition, the cmax for these molecules in water bodies are very low compared to nitrate (~1400 and ~4000 times for diuron and hexazinone, respectively).
Studies involving field measurements and laboratory analyses always have a certain degree of uncertainty. Our experimental data and model simulation partially determined the estimated water balance in both trials. The soil hydraulic parameters were estimated using the soil moisture profile measurements by applying the inverse modeling approach. Although consistent with other studies in the same area [59,69], we cannot exclude the possibility that actual runoff or leaching may have been slightly different. Nevertheless, up until now, there had not been any studies on the assessment of high-resolution leaching runoff fractions for central southern Brazil’s sugarcane production system.

5. Conclusions

Our experiments showed that both hypotheses were confirmed. The global average leaching runoff fractions (α) recommended within the Tier 1 method [25] for nitrate and herbicides do not represent the reality of the Brazilian sugarcane sector since it overestimates the leaching runoff fractions. For herbicides, PestLCI [26] had higher differences for diuron, while similar results for hexazinone were observed. These differences reveal the importance of quantifying leaching runoff fractions as in situ measurements. Therefore, while assessing the appropriation of water resources for the sugarcane production system through the GWF methodology, we strongly suggest considering regional conditions instead of specifying a fixed global average value. For nitrate GWF estimations, in light of the absence of more detailed information in the study area, we recommend adopting a 5% level instead of 10% under Brazilian production conditions. The same recommendation for herbicides cannot be made from the presented results since only two molecules were targets in our evaluation. However, our results suggest that the herbicide global leaching runoff average is also an order of magnitude. Further studies are necessary to refine the leaching runoff fraction for pesticides used in the sugarcane production system.
The fertilizer management application explored in this study reduced the nitrate load on the environment, which was not necessarily detectable in the GWF. Therefore, increasing the yield with efficient fertilizer use would be a solution to reduce the high levels of N released into freshwater resources, improving GWF estimations based on the achieved yield.

Author Contributions

Conceptualization, F.V.S., L.d.C.Z. and R.B.; methodology, F.V.S., L.d.C.Z. and R.B.; formal analysis, F.V.S., S.G.Q.d.C. and L.d.C.Z.; investigation, F.V.S., S.G.Q.d.C. and L.d.C.Z.; resources, F.V.S. and R.B.; data curation, L.d.C.Z., S.G.Q.d.C. and A.H.F.B.; laboratory analysis, L.d.C.Z. and A.H.F.B.; writing—original draft preparation, F.V.S. and L.d.C.Z.; writing—review and editing, F.V.S.; S.G.Q.d.C., R.B. and visualization, F.V.S. and L.d.C.Z.; supervision, F.V.S.; project administration, F.V.S.; funding acquisition, F.V.S. and R.B. All authors have read and agreed to the published version of the manuscript.

Funding

This research was funded by the Brazilian Council of Scientific and Technological Development (CNPq) grant numbers 407258/2013-2 and 404245/2013-7 for the first author; by EMBRAPA grant number 02.12.11.005.00.00 for the third author; and by the Brazilian Coordination for the Improvement of Higher Education Personnel (CAPES) for the second author via a studentship.

Institutional Review Board Statement

Not applicable.

Informed Consent Statement

Not applicable.

Data Availability Statement

The data presented in this study are available on request from the corresponding author.

Acknowledgments

We appreciate the support of the Experimental Station of the Agronomic Institute of Campinas (IAC), the AgroQuatro-S Farm, the Soil Physics Laboratory (FISOL) at Center of Nuclear Energy in Agriculture (CENA-USP), and the Brazilian Biorenewable National Laboratory.

Conflicts of Interest

The authors declare no conflict of interest.

References

  1. CONAB. Acompanhamento da Safra Brasileira de Cana-de-Açúcar. In Segundo Levantamento—Safra 2021/2022; National Supply Company (CONAB): Brasilia, Brazil, 2023. Available online: http://www.conab.gov.br (accessed on 14 February 2023).
  2. Aquino, G.S.; Medina, C.C.; Shahab, M.; Santiago, A.D.; Cunha, A.C.B.; Kussaba, D.A.O.; Carvalho, J.B.; Moreira, A. Does straw mulch partial-removal from soil interfere in yield and industrial quality sugarcane? A long term study. Ind. Crops Prod. 2018, 111, 573–578. [Google Scholar] [CrossRef]
  3. Moutinho, M.F.; de Almeida, E.A.; Espindola, E.L.G.; Daam, M.A.; Schiesari, L. Herbicides employed in sugarcane plantations have lethal and sublethal effects to larval Boana pardalis (Amphibia, Hylidae). Ecotoxicology 2020, 29, 1043–1051. [Google Scholar] [CrossRef] [PubMed]
  4. Chen, X.; Ma, L.; Ma, W.; Wu, Z.; Cui, Z.; Hou, Y.; Zang, F. What has caused the use of fertilizers to skyrocket in China? Nutr. Cycl. Agroecosyst. 2018, 110, 241–255. [Google Scholar] [CrossRef]
  5. Heffer, P.; Gruère, A.; Roberts, T. Assessment of Fertilizer Use by Crop at the Global Level; International Fertilizer Association and International Plant Nutrition Institute: Paris, France, 2013; pp. 1–18. [Google Scholar]
  6. Thorburn, P.J.; Meier, E.A.; Probert, M.E. Modelling nitrogen dynamics in sugarcane systems: Recent advances and applications. Field Crop Res. 2005, 92, 337–351. [Google Scholar] [CrossRef]
  7. Kaur, S.; Kaur, R.; Chauhan, B.S. Understanding crop-weed-fertilizer-water interactions and their implications for weed management in agricultural systems. J. Crop Prot. 2018, 103, 65–72. [Google Scholar] [CrossRef]
  8. Vale, R.L.; Maciel Netto, A.; Xavier, B.T.L.; Barreto, M.L.P.; Silva, J.P.S. Assessment of the gray water footprint of the pesticide mixture in a soil cultivated with sugarcane in the northern area of the State of Pernambuco, Brazil. J. Clean. Prod. 2019, 234, 925–932. [Google Scholar] [CrossRef]
  9. Reis, F.C.; Victória Filho, R.; Andrade, M.T.; Barroso, A.A.M. Use of herbicides in sugarcane in the São Paulo State. Planta Daninha 2019, 37, e019184227. [Google Scholar] [CrossRef]
  10. Martinelli, L.A.; Filoso, S. Expansion of sugarcane ethanol production in Brazil: Environmental and social challenges. Ecol. Appl. 2008, 18, 885–898. [Google Scholar] [CrossRef]
  11. Guimarães, A.C.D.; Mendes, K.F.; Campion, T.F.; Christoffoleti, P.J.; Tornisielo, V.L. Leaching of herbicides commonly applied to sugarcane in five agricultural soils. Planta Daninha 2019, 37, e019181505. [Google Scholar] [CrossRef]
  12. Santos, E.A. Contaminação por Herbicidas em Corpos Hídricos da Microbacia do Córrego Rico (SP) e Aspectos Toxicológicos de Atrazine a Juvenis de Piaractus Mesopotamicus. Master’s Thesis, University of São Paulo, Jaboticabal, Brazil, 3 May 2013. [Google Scholar]
  13. Queiroz, S.C.N.; Ferracini, V.L.; Gomes, M.A.F.; Rosa, M.A. Comportamento do herbicida hexazinone em área de recarga do aqüífero Guarani cultivada com cana-de-açúcar. Quím. Nova 2009, 32, 378–381. [Google Scholar] [CrossRef]
  14. Bordonal, R.O.; Carvalho, J.L.N.; Lal, R.; Figueiredo, E.B.; Oliveira, B.G.; Scala, N., Jr. Sustainability of sugarcane production in Brazil. A review. Agron. Sustain. Dev. 2018, 38, e13. [Google Scholar] [CrossRef]
  15. Marin-Morales, M.A.; Ventura-Camargo, B.C.; Hoshina, M.M. Toxicity of herbicides: Impact on aquatic and soil biota and human health. In Herbicides-Current Research and Case Studies in Use; Price, A., Kelton, J.A., Eds.; In Tech: Zagreb, Croatia, 2013; pp. 399–443. [Google Scholar] [CrossRef]
  16. Sebilo, M.; Mayer, B.; Nicolardot, B.; Pinay, G.; Mariotti, A. Long-term fate of nitrate fertilizer in agricultural soils. Proc. Natl. Acad. Sci. USA 2013, 110, 18185–18189. [Google Scholar] [CrossRef] [PubMed]
  17. Van der Laan, M.; Annandale, J.G.; Bristow, K.L.; Stirzaker, R.J.; Preez, C.C.du.; Thorburn, P.J. Modelling nitrogen leaching: Are we getting the right answer for the right reason? Agric. Water Manag. 2014, 133, 74–80. [Google Scholar] [CrossRef]
  18. Stewart, L.K.; Charlesworth, P.B.; Bristow, K.L.; Thorburn, P.J. Estimating deep drainage and nitrate leaching from the root zone under sugarcane using APSIM-SWIM. Agric. Water Manag. 2006, 81, 315–334. [Google Scholar] [CrossRef]
  19. Barreto, M.L.P.; Maciel Netto, A.; Silva, J.P.S.; Amaral, A.; Borges, E.; França, E.J.; Vale, R.L. Gray water footprint assessment for pesticide mixtures applied to a sugarcane crop in Brazil: A comparison between two models. J. Clean. Prod. 2020, 276, e124254. [Google Scholar] [CrossRef]
  20. Rodriguez, R.; Scanlon, B.R.; King, C.W.; Scarpare, F.V.; Xavier, A.C.; Pruski, F.F. Biofuel-water-land nexus in the last agricultural frontier region of the Brazilian Cerrado. Appl. Energy 2018, 231, 1330–1345. [Google Scholar] [CrossRef]
  21. Scarpare, F.V.; Hernandes, T.A.D.; Ruiz-Corrêa, S.T.; Kolln, O.T.; Gava, G.J.C.; Santos, L.N.S.; Victoria, R.L. Sugarcane water footprint under different management practices in Brazil: Tietê/Jacaré watershed assessment. J. Clean. Prod. 2016, 112, 4576–4584. [Google Scholar] [CrossRef]
  22. Mekonnen, M.M.; Hoekstra, A.Y. The green, blue, and grey water footprint of crops and derived crop products. Hydrol. Earth Syst. Sci. 2010, 15, 1577–1600. [Google Scholar] [CrossRef]
  23. Hoekstra, A.Y. Virtual Water Trade. In Proceedings of the International Expert Meeting on Virtual Water Trade, Delft, The Netherlands, 12–13 December 2002; IHE—International Institute for Hydraulic and Environmental Engineering: Deft, The Netherlands, 2003. [Google Scholar]
  24. Jamshidi, S. Grey Water Footprint Accounting, Challenges, and Problem-Solving. In Agroecological Footprints Management for Sustainable Food System; Banerjee, A., Meena, R.S., Jhariya, M.K., Yadav, D.K., Eds.; Springer: Singapore, 2021. [Google Scholar] [CrossRef]
  25. Franke, N.A.; Boyacioglu, H.; Hoekstra, A.Y. Grey Water Footprint Accounting: Tier 1 Supporting Guidelines; UNESCO-IHE Institute for Water Education: Delft, The Netherlands, 2013; pp. 1–57. [Google Scholar]
  26. Dijkman, T.; Birkved, M.; Hauschild, M. PestLCI 2.0: A second generation model for estimating emissions of pesticides from arable land in LCA. Int. J. Life Cycle Assess. 2012, 17, 973–986. [Google Scholar] [CrossRef]
  27. CONAB (Companhia Nacional de Abastecimento). Acompanhamento da Safra Brasileira de Cana-de-Açúcar na Safra 2019/20. Quarto Levantamento; 2020. Available online: https://www.conab.gov.br/info-agro/safras/cana (accessed on 9 September 2020).
  28. CANASAT. Cane Mapping via Earth Observation Satellite Images (Mapeamento de Cana via Imagens de Satélite de Observação da Terra). Tables. Available online: http://www.dsr.inpe.br/laf/canasat/en/ (accessed on 16 May 2015.).
  29. Castro, S.G.Q.; Decaro, S.T.; Franco, H.C.J.; Magalhães, P.S.G.; Garside, A.; Mutton, M.A. Best practices of nitrogen fertilization management for sugarcane under green cane trash blanket in Brazil. Sugar Tech. 2016, 19, 51–56. [Google Scholar] [CrossRef]
  30. Van Raij, B.; Cantarella, H.; Quaggio, J.A.; Furlani, A.M.C. Recomendações de Adubacão e Calagem para o Estado de São Paulo, 2nd ed.; Instituto Agronômico/Fundação IAC: Campinas, Brazil, 2007.
  31. Scarpare, F.V.; Jong van Lier, Q.; Camargo, L.; Pires, R.C.M.; Ruiz-Corrêa, S.T.; Gava, G.J.C.; Bezerra, A.H.F.; Dias, C.T.S. Tillage assessment on soil physical properties associated with sugarcane water availability. Soil Tillage Res. 2019, 187, 110–118. [Google Scholar] [CrossRef]
  32. CETESB (Companhia Ambiental do Estado de São Paulo). Guia Nacional de Coleta e Preservação de Amostras; CETESB/ANA: São Paulo, Brasília, 2011. Available online: https://cetesb.sp.gov.br/wp-content/uploads/2021/10/Guia-nacional-de-coleta-e-preservacao-de-amostras-2012.pdf (accessed on 24 February 2016).
  33. American Public Health Association (APHA). Standard Methods for the Examination of Water and Wastewater, 22nd ed.; Rice, E.W., Baird, R.B., Eaton, A.D., Clesceri, L.S., Eds.; American Public Health Association (APHA): Washington, DC, USA; American Water Works Association (AWWA): Washington, DC, USA; Water Environment Federation (WEF): Washington, DC, USA, 2012. [Google Scholar]
  34. Armstrong, F.A.; Stearns, C.R.; Strickland, J.D. The measurement of upwelling and subsequent biological processes by means of the Technicon Autoanalyzer and associated equipment. Deep-Sea Res. 1967, 14, 381–389. [Google Scholar] [CrossRef]
  35. Van Genuchten, M.T. A closed-form equation for predicting the hydraulic conductivity of unsatured soils. Soil Sci. Soc. Am. J. 1980, 44, 892–898. [Google Scholar] [CrossRef]
  36. Van Dam, J.C.; Groenendijk, P.; Hendriks, R.F.A.; Kroes, J.G. Advances of modeling water flow in variably saturated soils with SWAP. Vadose Zone J. 2008, 7, 640–653. [Google Scholar] [CrossRef]
  37. Kroes, J.G.; van Dam, J.C.; Groenendijk, P.; Hendriks, R.F.A.; Jacobs, C.M.J. SWAP Version 3.2. Theory Description and User Manual; Alterra: Wageningen, The Netherlands, 2008; pp. 147–172. [Google Scholar]
  38. van Diepen, C.A.; Rappoldt, C.; Wolf, J.; van Keulen, H. Crop Growth Simulation Model WOFOST. Documentation Version 4.1; Centre for World Food Studies: Wageningen, The Netherlands, 1988; 299p. [Google Scholar]
  39. Scarpare, F.V. Simulação do crescimento da cana-de-açúcar pelo modelo agrohidrológico SWAP/WOFOST. Ph.D. Thesis, University of São Paulo, Piracicaba, Brazil, 31 August 2011. [Google Scholar]
  40. Bezerra, A.H.F.; Scarpare, F.V.; de Jong van Lier, Q. Optimizing hydraulic conductivity parameters with field measurements. In Proceedings of the 4th Brazilian Soil Physics Meeting, Piracicaba, Brazil, 30 May 2017. [Google Scholar]
  41. Doherty, J. PEST: Model Independent Parameter Estimation; Watermark Numerical Computing: Corinda, Australia, 2002. [Google Scholar]
  42. Hoekstra, A.Y.; Chapagain, A.K.; Aldaya, M.M.; Mekonnen, M.M. The Water Footprint Assessment Manual: Setting the Global Standard; Earthscan: London, UK, 2011; pp. 19–68. [Google Scholar]
  43. Hammer, O.; Harper, D.A.T.; Ryan, P.D. PAST: Paleontological Statistics Software Package for Education and Data Analysis. Palaeontol. Electron. 2001, 4, 1–9. [Google Scholar]
  44. Box, G.E.; Cox, D.R. An analysis of transformations. J. R. Stat. Soc. Ser. B Stat. Methodol. 1964, 26, 211–252. [Google Scholar] [CrossRef]
  45. CONAMA (National Environmental Council). Resolução CONAMA 430, de 17 de Março de 2005. 2005. Available online: http://www2.mma.gov.br/port/conama/legiabre.cfm?codlegi=459 (accessed on 2 February 2016).
  46. Ghiberto, P.J.; Libardi, P.L.; Trivelin, P.C.O. Nutrient leaching in an Ultisol cultivated with sugarcane. Agric. Water Manag. 2015, 148, 141–149. [Google Scholar] [CrossRef]
  47. Blum, J.; Melfi, A.J.; Montes, C.R. Nutrição mineral da cana-de-açúcar irrigada com efluente de esgoto tratado, em área com aplicação de fosfogesso. Pesq. Agropec. Bras. 2012, 47, 593–602. [Google Scholar]
  48. Tomer, M.D.; Burkart, M.R. Long-term effects of nitrogen fertilizer use on ground water nitrate in two small watersheds. J. Environ. Qual. 2003, 32, 2158–2171. [Google Scholar] [CrossRef]
  49. Ghanem, M.; Jebreen, H.; Lange, J. Qualitative spring water management in the central western catchment of the West Bank from hydrochemical and environmental isotopes approaches. Arab. J. Geosci. 2016, 9, 283. [Google Scholar] [CrossRef]
  50. Nachimuthu, G.; Halpin, N.V.; Bell, M.J. Effect of sugarcane cropping systems on herbicide losses in surface runoff. Sci. Total Environ. 2016, 557–558, 773–784. [Google Scholar] [CrossRef] [PubMed]
  51. Masters, B.; Rohde, K.; Gurner, N.; Reid, D. Reducing the risk of herbicide runoff in sugarcane farming through controlled traffic and early-banded application. Agric. Ecosyst. Environ. 2013, 180, 29–39. [Google Scholar] [CrossRef]
  52. Lewis, K.A.; Tzilivakis, J.; Warner, D.; Green, A. An international database for pesticide risk assessments and management. Hum. Ecol. Risk. Assess. 2016, 22, 1050–1064. [Google Scholar] [CrossRef]
  53. Giacomazzi, S.; Cochet, N. Environmental impact of diuron transformation: A review. Chemosphere 2004, 56, 1021–1032. [Google Scholar] [CrossRef]
  54. Birkved, M.; Hauschild, M.Z. PestLCI: A model for estimating field emissions of pesticides in agricultural LCA. Ecol. Model. 2006, 198, 433–451. [Google Scholar] [CrossRef]
  55. Fantin, V.; Buscaroli, A.; Djikman, T.; Zamagni, A.; Garavini, G.; Bonoli, A.; Righi, S. PestLCI 2.0 sensitivity to soil variations for the evaluation of pesticide distribution in Life Cycle Assessment studies. Sci. Total Environ. 2019, 656, 1021–1031. [Google Scholar] [CrossRef]
  56. Gentil, C.; Fantke, P.; Mottes, C.; Basset-Mens, C. Challenges and ways forward in pesticide emission and toxicity characterization modeling for tropical conditions. Int. J. Life Cycle Assess. 2020, 25, 1290–1306. [Google Scholar] [CrossRef]
  57. Otto, R.; Castro, S.A.Q.; Mariano, E.; Castro, S.G.Q.; Franco, H.C.J.; Trivelin, P.C.O. Nitrogen use efficiency for sugarcane-biofuel production: What is next? Bioenerg. Res. 2016, 9, 1272–1289. [Google Scholar] [CrossRef]
  58. Muratoglu, A. Grey water footprint of agricultural production: An assessment based on nitrogen surplus and high-resolution leaching runoff fractions in Turkey. Sci. Total Environ. 2020, 2020, 742. [Google Scholar] [CrossRef]
  59. Gmach, M.R.; Scarpare, F.V.; Cherubin, M.R.; Lisboa, I.P.; Santos, A.K.B.; Cerri, C.E.P.; Cerri, C.C. Sugarcane straw removal effects on soil water storage and drainage in Southeastern Brazil. J. Soil Water Conserv. 2019, 74, 466–476. [Google Scholar] [CrossRef]
  60. Ruiz-Corrêa, S.T.; Barbosa, L.C.; Menandro, L.M.S.; Scarpare, F.V.; Reichardt, K.; Moraes, L.O.; Hernandes, T.A.D.; Franco, H.J.; Carvalho, J.L.N. Straw removal effects on soil water dynamics, soil temperature, and sugarcane yield in south-central Brazil. BioEnergy Res. 2019, 12, 749–763. [Google Scholar] [CrossRef]
  61. Motasim, A.M.; Samsuri, A.W.; Sukor, A.S.A.; Adibah, A.M. Nitrogen dynamics in tropical soils treat with liquid and granular urea fertilizers. Agriculture 2021, 11, 546. [Google Scholar] [CrossRef]
  62. Smith, D.M.; Inman-Bamber, N.G.; Thorburn, P.J. Growth and function of the sugarcane root system. Field Crop. Res. 2005, 92, 169–183. [Google Scholar] [CrossRef]
  63. Laclau, P.B.; Laclau, J.P. Growth of the whole root system for a plant crop of sugarcane under rainfed and irrigated environments in Brazil. Field Crop. Res. 2009, 114, 351–360. [Google Scholar] [CrossRef]
  64. Prado, H.; Prado, T.A.B. Pedologia Facil: Aplicaçoes em Solos Tropicais, 6th ed.; Editora UFLA—Universidade Federal de Lavras: Lavras, Brazil, 2022; pp. 229–259. [Google Scholar]
  65. Silva, J.F.; Carvalho, A.M.; Rein, T.A.; Coser, T.R.; Ribeiro Junior, W.Q.; Vieira, D.L.; Coome, D.A. Nitrous oxide emissions from sugarcane fields in the Brazilian Cerrado. Agric Ecosyst Environ. 2017, 246, 55–56. [Google Scholar] [CrossRef]
  66. Rachid, C.T.; Piccolo, M.C.; Leite, D.C.A.; Balieiro, F.C.; Coutinho, H.L.C.; van Elsas, J.D.; Peixoto, R.S.; Rosado, A.S. Physical-chemical and microbiological changes in Cerrado soil under differing sugarcane harvest management systems. BMC Microbiol. 2012, 12, 2–11. [Google Scholar] [CrossRef]
  67. Robinson, N.; Brackin, R.; Vinall, K.; Soper, F.; Holst, J.; Gamage, H.; Paungfoo-Lohienne, C.; Renneberg, H.; Lakshmanan, P.; Schmidt, S. Nitrate paradigm does not hold up for sugarcane. PLoS ONE 2011, 6, e19045. [Google Scholar] [CrossRef]
  68. Spironello, A.; van Raij, B.; Penatti, C.P.; Cantarella, H.; Morelli, J.L.; Orlando Filho, J.; Landell, M.G.A.; Rossetto, R. Cana-de-açúcar. In Technical Report 100—Fertilization and Liming Recommendations for São Paulo State, 3rd ed.; van Raij, B., Cantarella, H., Quaggio, J., Furlani, A.M.C., Eds.; Instituto Agronômico de Campinas: Campinas, Brazil, 1996; pp. 237–239. [Google Scholar]
  69. Barbosa, E.A.A.; Matsura, E.E.; dos Santos, L.N.S.; Gonçalves, I.Z.; Nazário, A.A.; Feitosa, D.R.C. Water footprint of sugarcane irrigated with treated sewage and freshwater under subsurface drip irrigation, in Southeast Brazil. J. Clean. Prod. 2017, 153, 448–456. [Google Scholar] [CrossRef]
Figure 1. Sugarcane trial location over sugarcane land use in central southern Brazil [28] and field management information.
Sustainability 15 06990 g001
Figure 2. Experimental field details: (a) Plot design overview, (b) Catchment area surrounded by galvanized sheets, (c) Runoff gutter collector, (d) Runoff tank collector, (e) Soil solution extractor, (f) Aerial trial overview, and (g) Cross-section overview.
Sustainability 15 06990 g002
Figure 3. Nitrate concentration (mg L−1) in SO for (A) leachate and (B) runoff samples in the 2014/2015 and 2015/2016 seasons; (C) leachate and (D) runoff samples in JA 2015/2016 season. cmax is the maximum acceptable concentration of NO3-N according to CONAMA [45].
Sustainability 15 06990 g003aSustainability 15 06990 g003b
Figure 4. Water balance components for SO (2014/2015 and 2015/2016 seasons) and JA (2015/2016 season). Precipitation for both areas and runoff in SO were measured in field experiments while leaching, and SWAP/WOFOST model estimated actual evapotranspiration (ETa).
Sustainability 15 06990 g004
Figure 5. Herbicides concentration in SO trial in the 2014/2015 and 2015/2016 seasons for (A) leachate and (B) runoff samples.
Sustainability 15 06990 g005
Figure 6. Grey water footprint (GWF, m3 Mg−1) for sugarcane production associated with loss of herbicides and nitrate from field trials and two empirical models [25,26].
Sustainability 15 06990 g006
Table 1. Soil type and physical properties in SO (Sales Oliveira) and JA (Jaú), the state of São Paulo, Brazil. Data represent the average of four replicates with a 0–0.4 m soil layer.
Soil Layer (m)SO—Clay Rhodic Eutrudox (Slope 9%)JA—Sandy-Clay Haplustox (Slope 6%)
ClaySiltSandBD *MaP **MiP ***ClaySiltSandBD *MaP **MiP ***
g kg−1kg m−3m3 m−3g kg−1kg m−3m3 m−3
0–0.2687244691.220.400.14362585811.670.110.31
0.2–0.4718214681.210.410.13434555121.530.150.31
0.4–1.0700235661.130.380.20399495521.480.120.32
* BD: bulk density; ** MaP: macroporosity; *** MiP: microporosity.
Table 2. The average amount of herbicides (g ha−1) and N-NO3 (kg ha−1) load to the environment in Sales Oliveira (SO) and Jaú (JA).
Trial sitesSOJA
TreatmentsN120broN120incNzeroN210broN140broNzero
N-NO3 losses (kg ha−1)
Leaching7.2a ± 2.31.9b ± 0.31.0bc ± 0.21.4A ± 0.30.7AB ± 0.050.6B ± 0.2
Runoff18.2a ± 2.010.0a ± 0.713.8a ± 1.712.1A ± 0.017.3A ± 0.011.8A ± 0.01
Herbicide losses in SO trial (g ha−1)
LeachingRunoffTotal
Diuron4.4 ± 4.04.2 ± 1.78.6 ± 4.7
Hexazinone7.1 ± 5.53.0 ± 1.010.1 ± 5.7
Lowercase letters for SO trial and uppercase letters for JA trial in rows for N-NO3 losses (kg ha−1) represent the results of the Tukey test (p < 0.05); ± is the standard error.
Table 3. Leaching runoff fraction (α) comparison of nitrate, diuron, and hexazinone from field trials (SO—Sales Oliveira and JA—Jaú) and from two empirical methodologies [25,26].
FieldSeasonTreatmentSource/Methodologyαrunoff (%)αleaching (%)αtotal (%)
Nitrate
SO2014/2015N120broField trial2.471.904.37
SO2014/2015N120incField trial0.000.500.50
SO2014/2015N120broFranke et al. [25]----12.20
SO2014/2015N120incFranke et al. [25]----12.20
SO2015/2016N120broField trial4.878.4013.27
SO2015/2016N120incField trial0.340.931.27
SO2015/2016N120broFranke et al. [25]----13.42
SO2015/2016N120incFranke et al. [25]----13.42
JA2015/2016N140broField trial5.210.105.31
JA2015/2016N210broField trial5.780.386.16
JA2015/2016N140broFranke et al. [25]----14.62
JA2015/2016N210broFranke et al. [25]----16.23
Diuron
SO2014/20151.17 kg ha−1Field trial0.630.711.34
SO2014/20151.17 kg ha−1Franke et al. [25]----4.84
SO2014/20151.17 kg ha−1PestLCI [26]----0.03
SO2015/20161.17 kg ha−1Field trial0.080.040.12
SO2015/20161.17 kg ha−1Franke et al. [25]----5.01
SO2015/20161.17 kg ha−1PestLCI [26]----0.03
Hexazinone
SO2014/20150.33 kg ha−1Field trial1.254.225.47
SO2014/20150.33 kg ha−1Franke et al. [25]----6.34
SO2014/20150.33 kg ha−1PestLCI [26]----0.17
SO2015/20160.33 kg ha−1Field trial0.570.100.67
SO2015/20160.33 kg ha−1Franke et al. [25]----6.52
SO2015/20160.33 kg ha−1PestLCI [26]----0.17
Disclaimer/Publisher’s Note: The statements, opinions and data contained in all publications are solely those of the individual author(s) and contributor(s) and not of MDPI and/or the editor(s). MDPI and/or the editor(s) disclaim responsibility for any injury to people or property resulting from any ideas, methods, instructions or products referred to in the content.

