
Land Degradation–Desertification in Relation to Farming Practices in India: An Overview of Current Practices and Agro-Policy Perspectives


Abstract
:1. Introduction
2. Materials and Methods
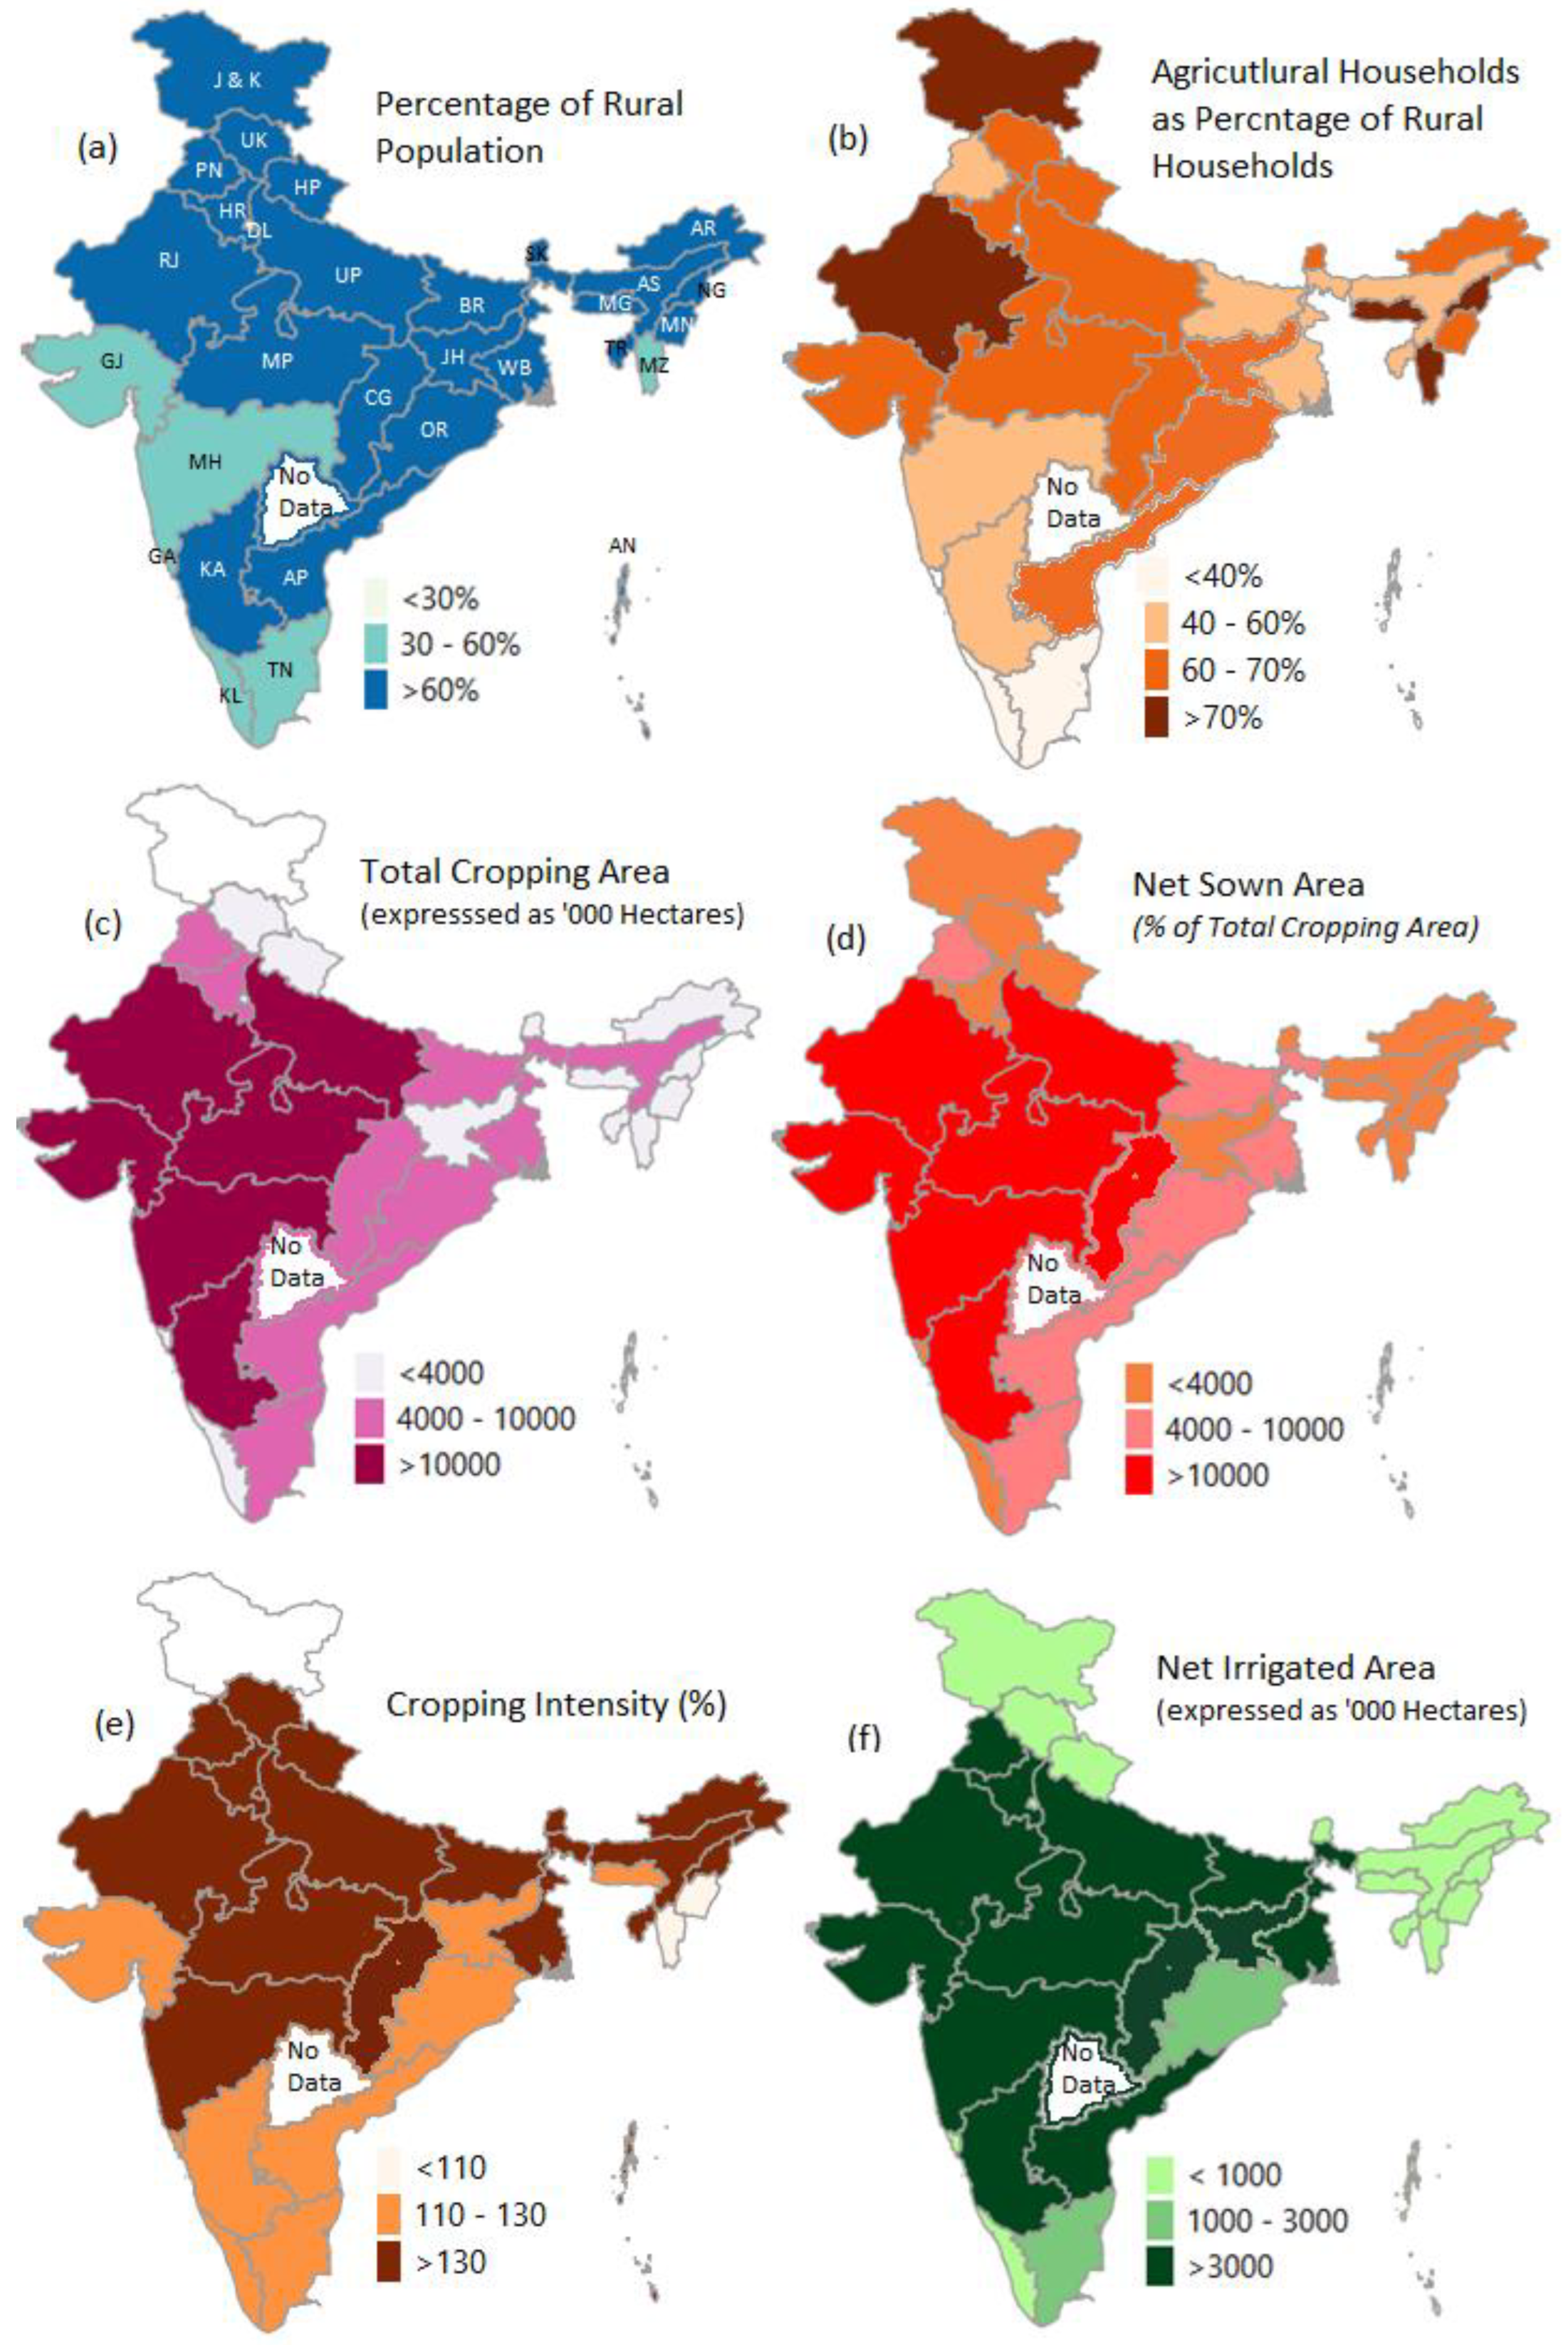
2.1. Agricultural Patterns in the Study Area
2.2. Data Acquisition, Compilation, Quality Concerns
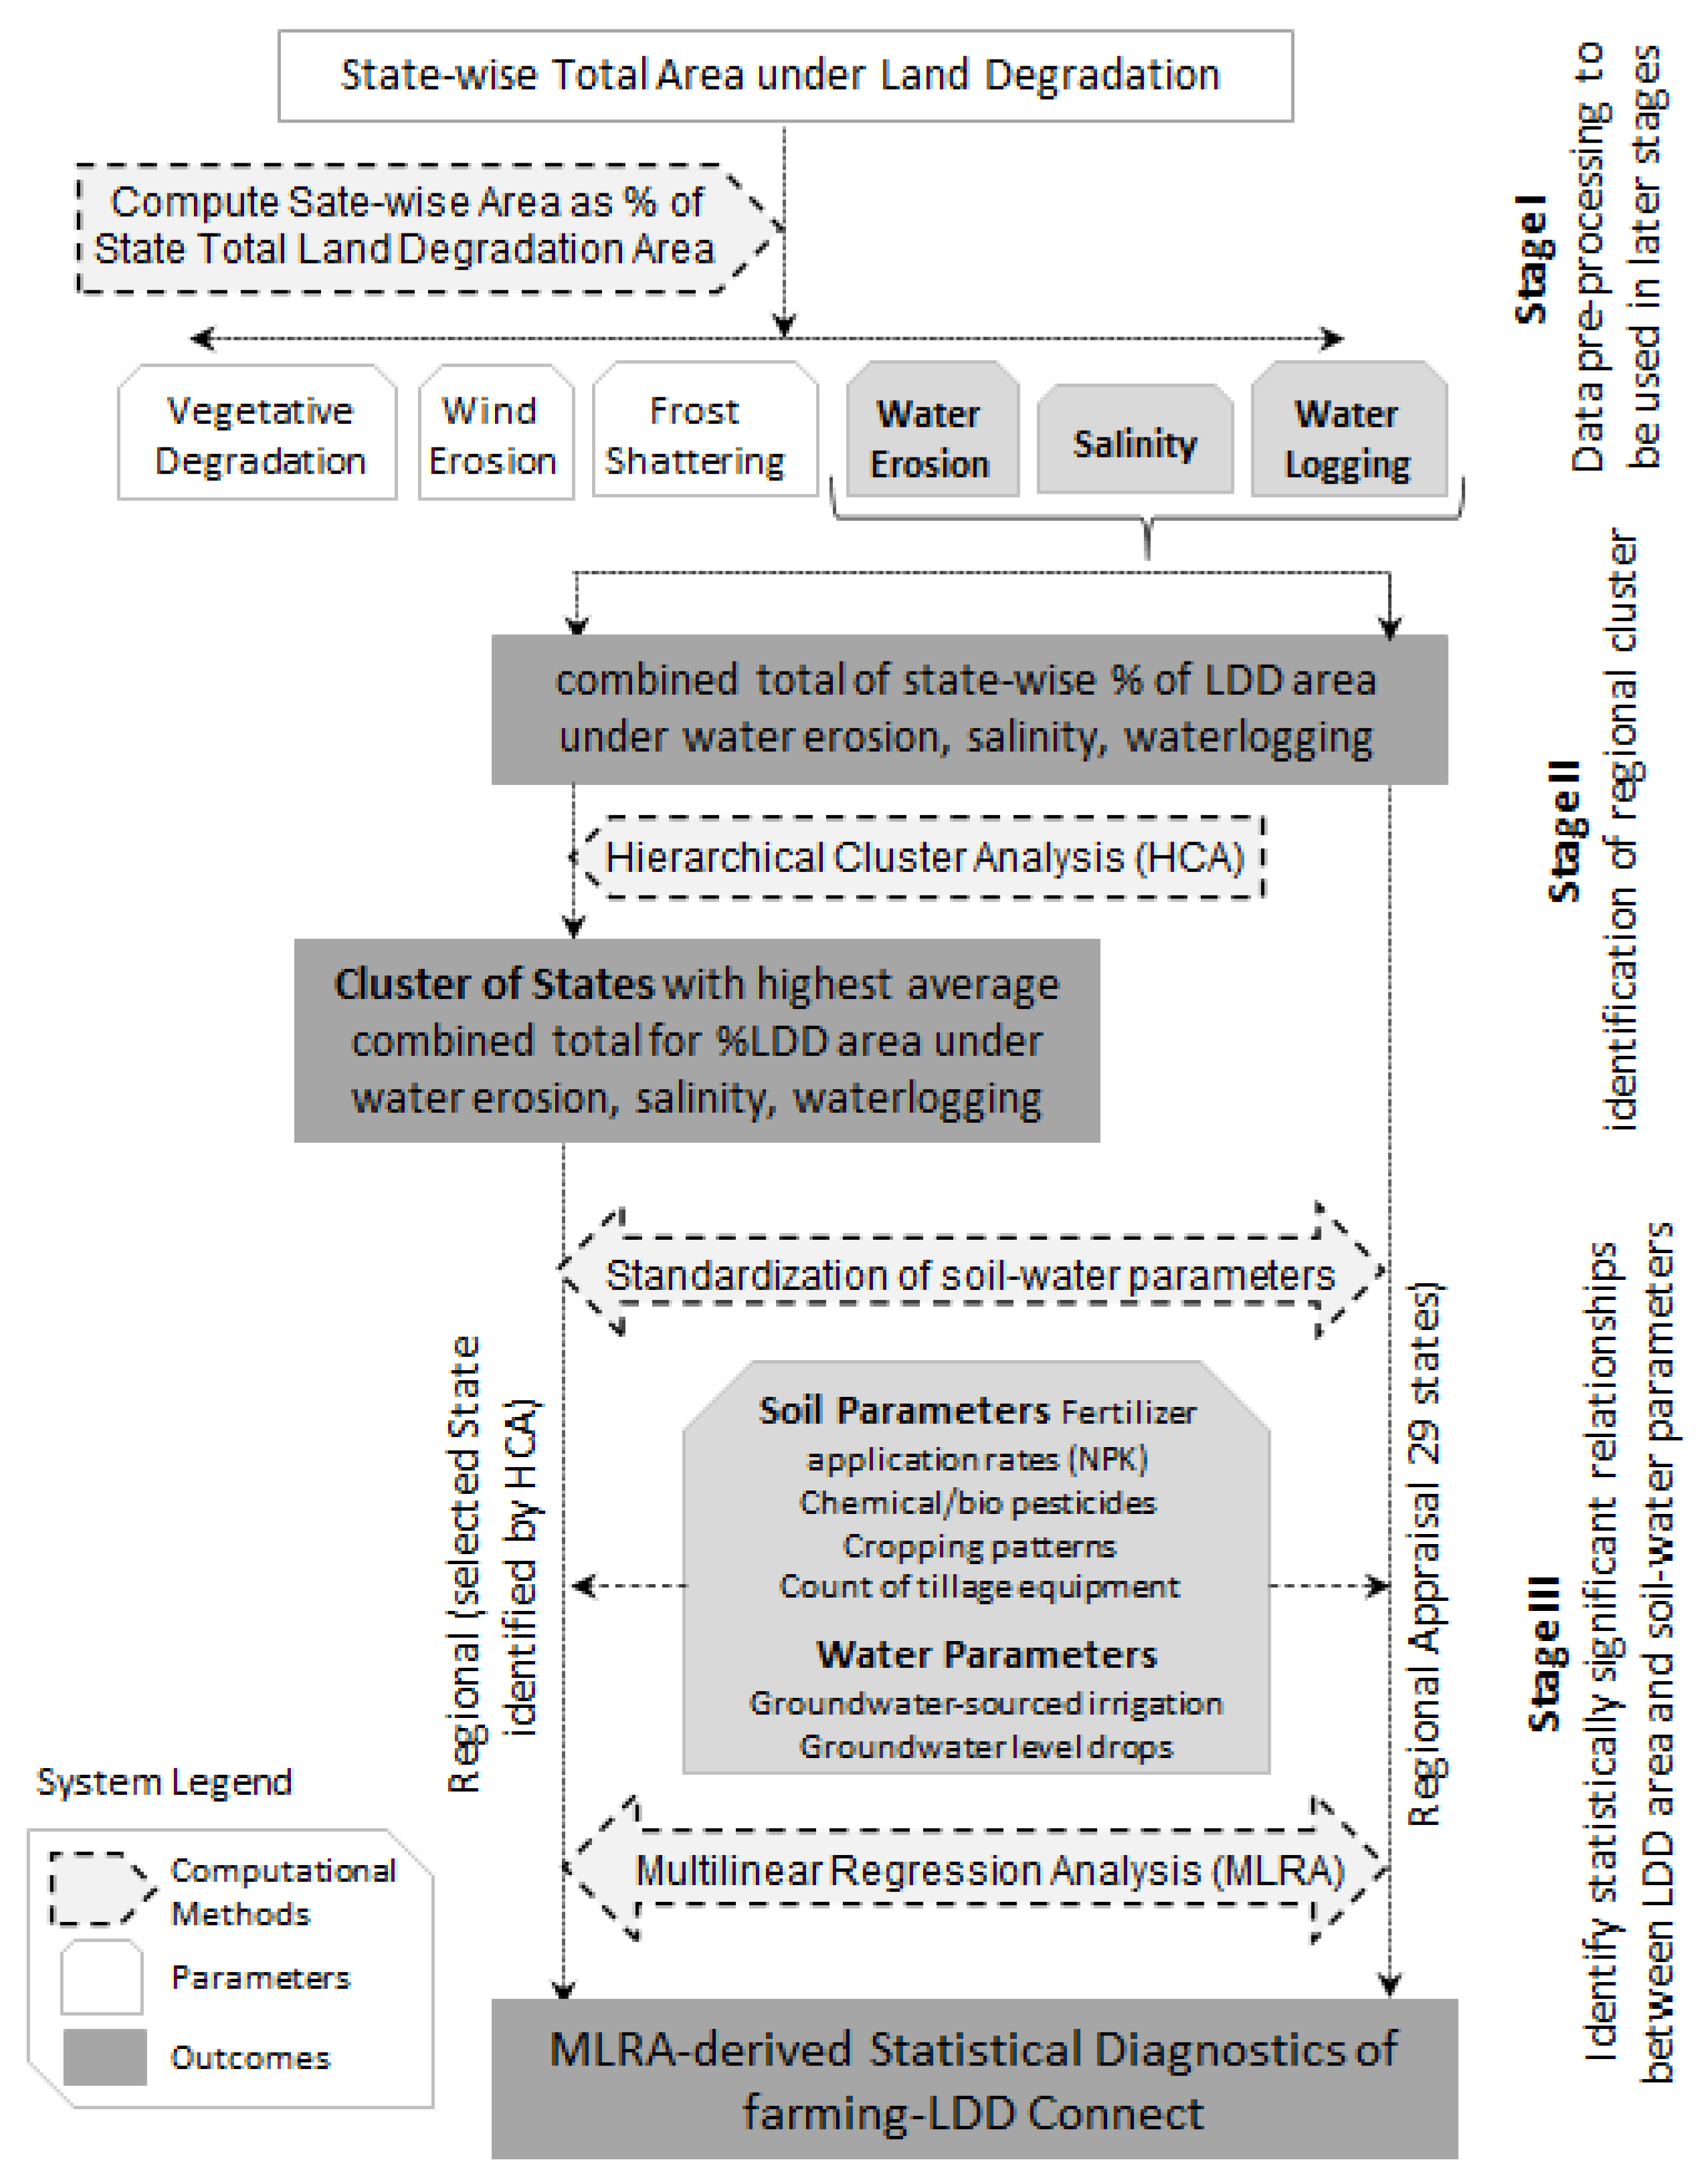
2.3. Analytical Procedures
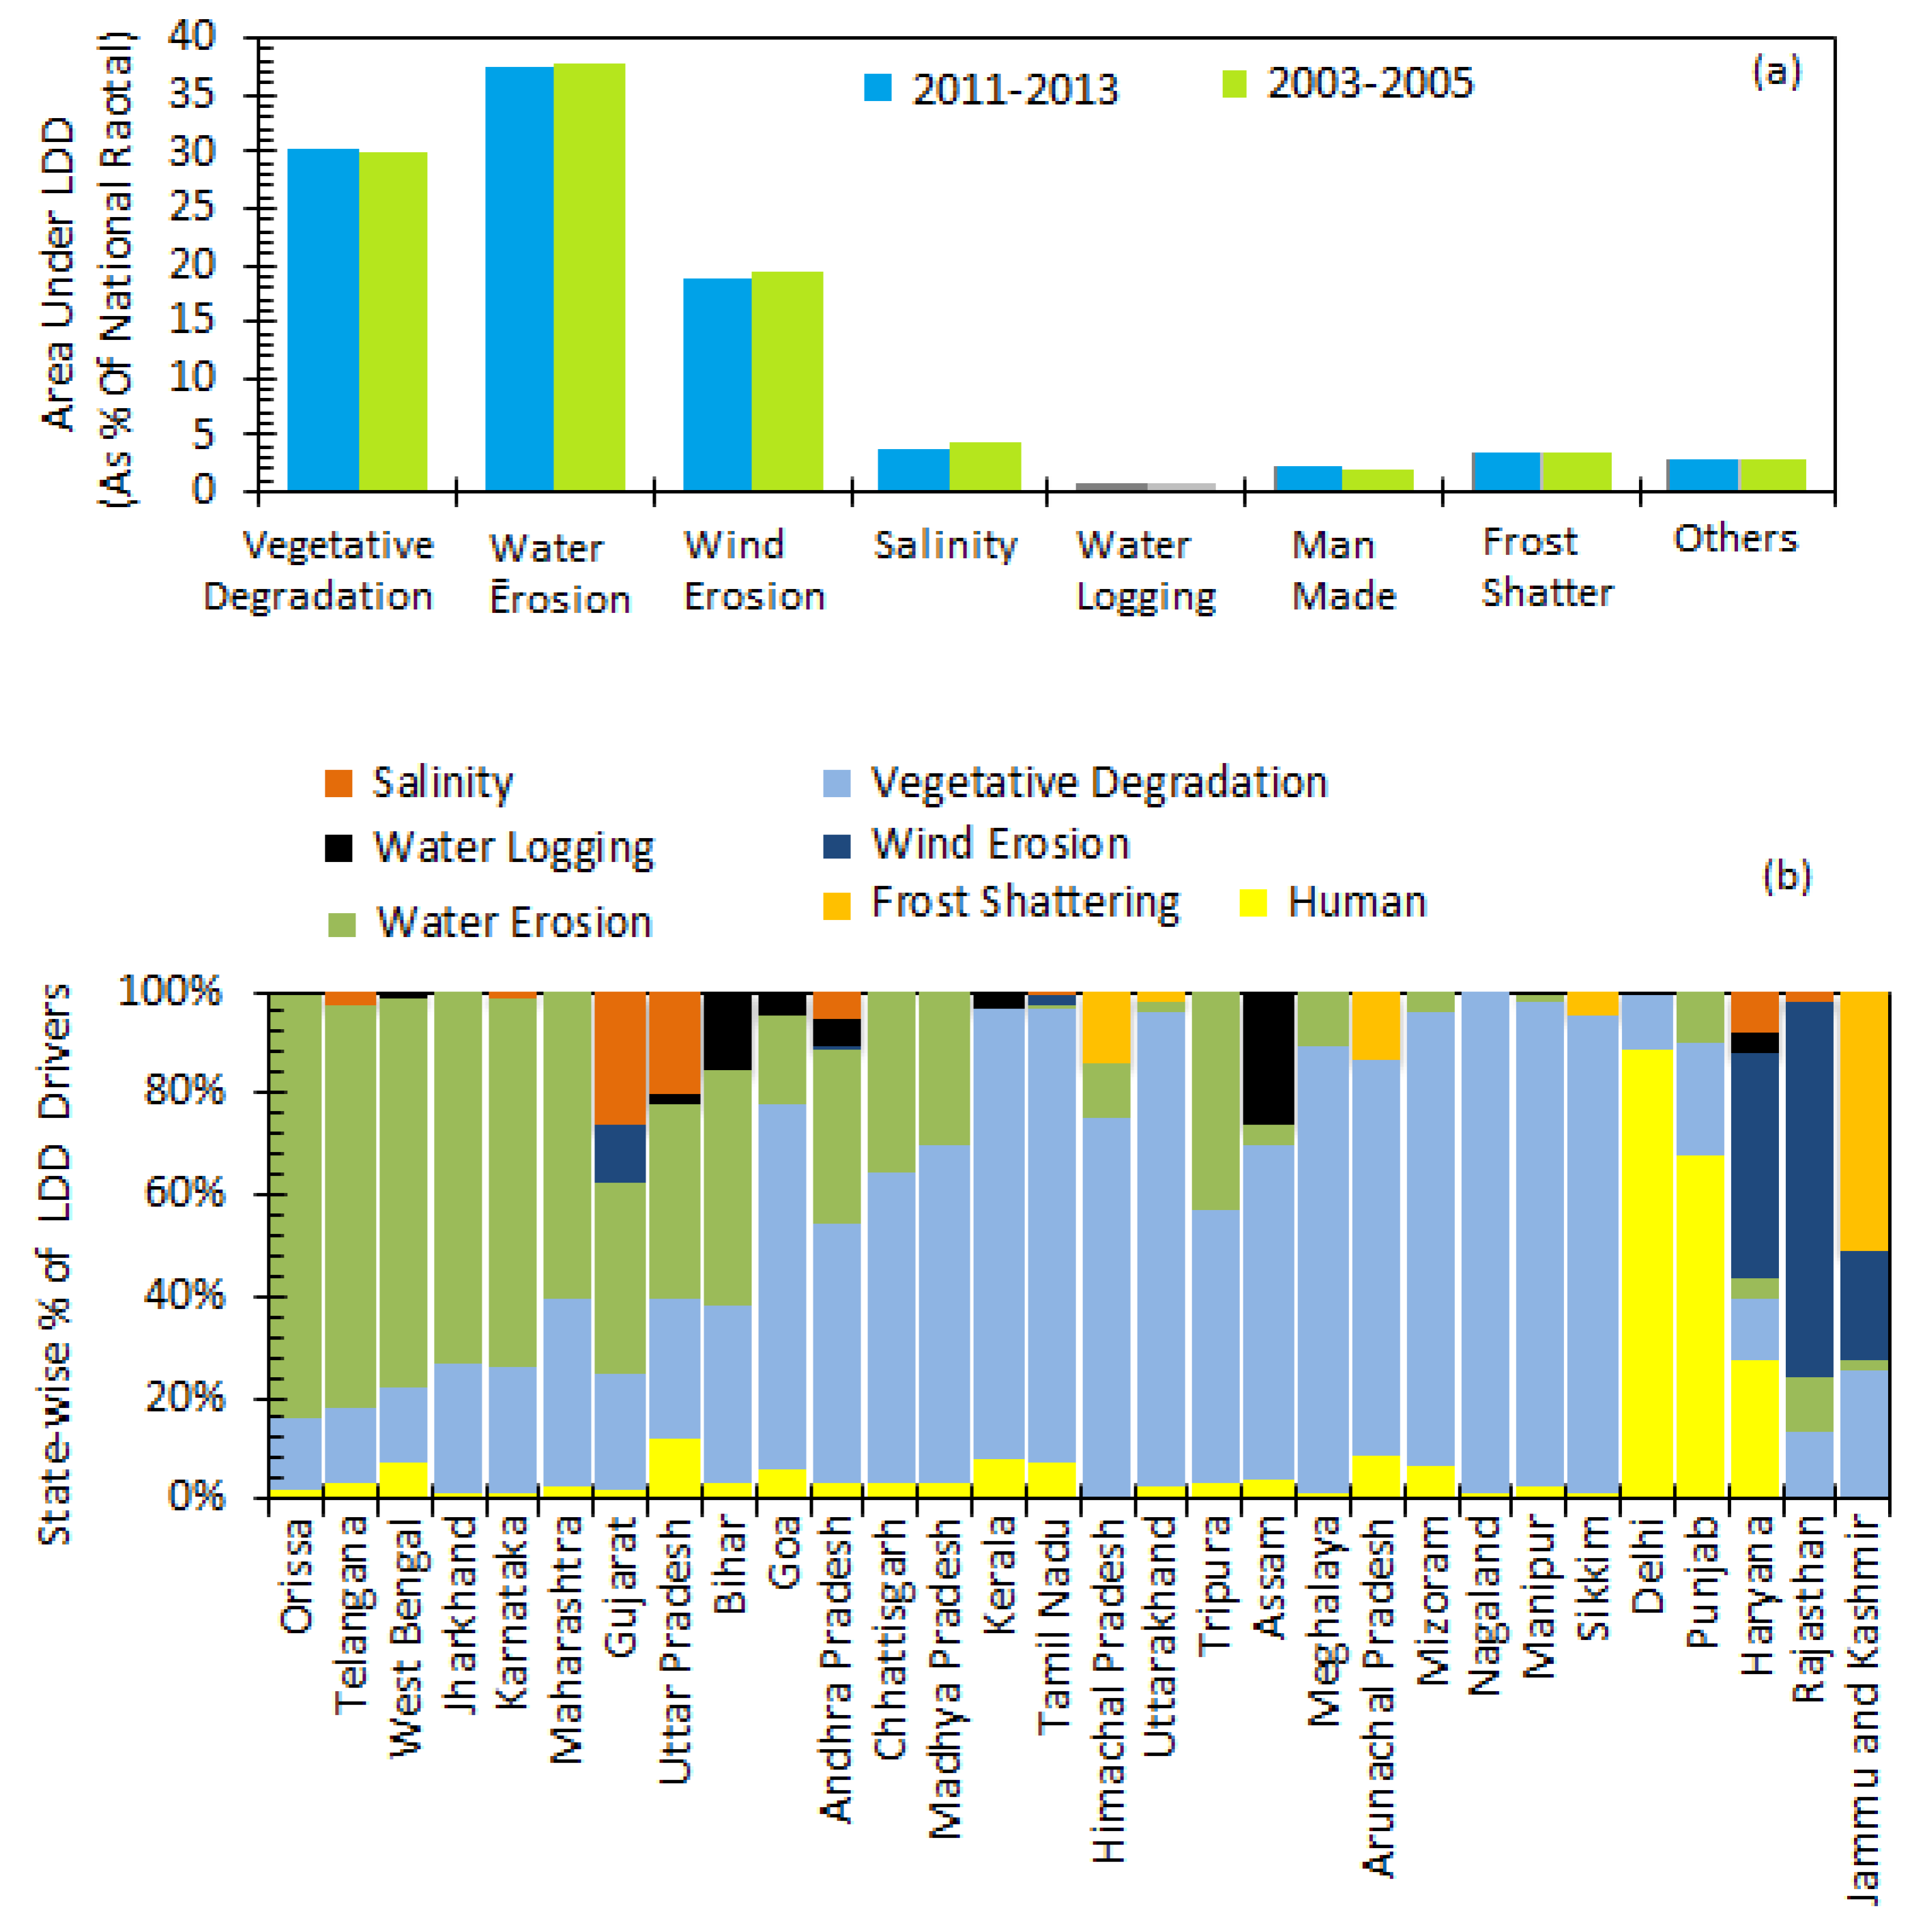
3. Results
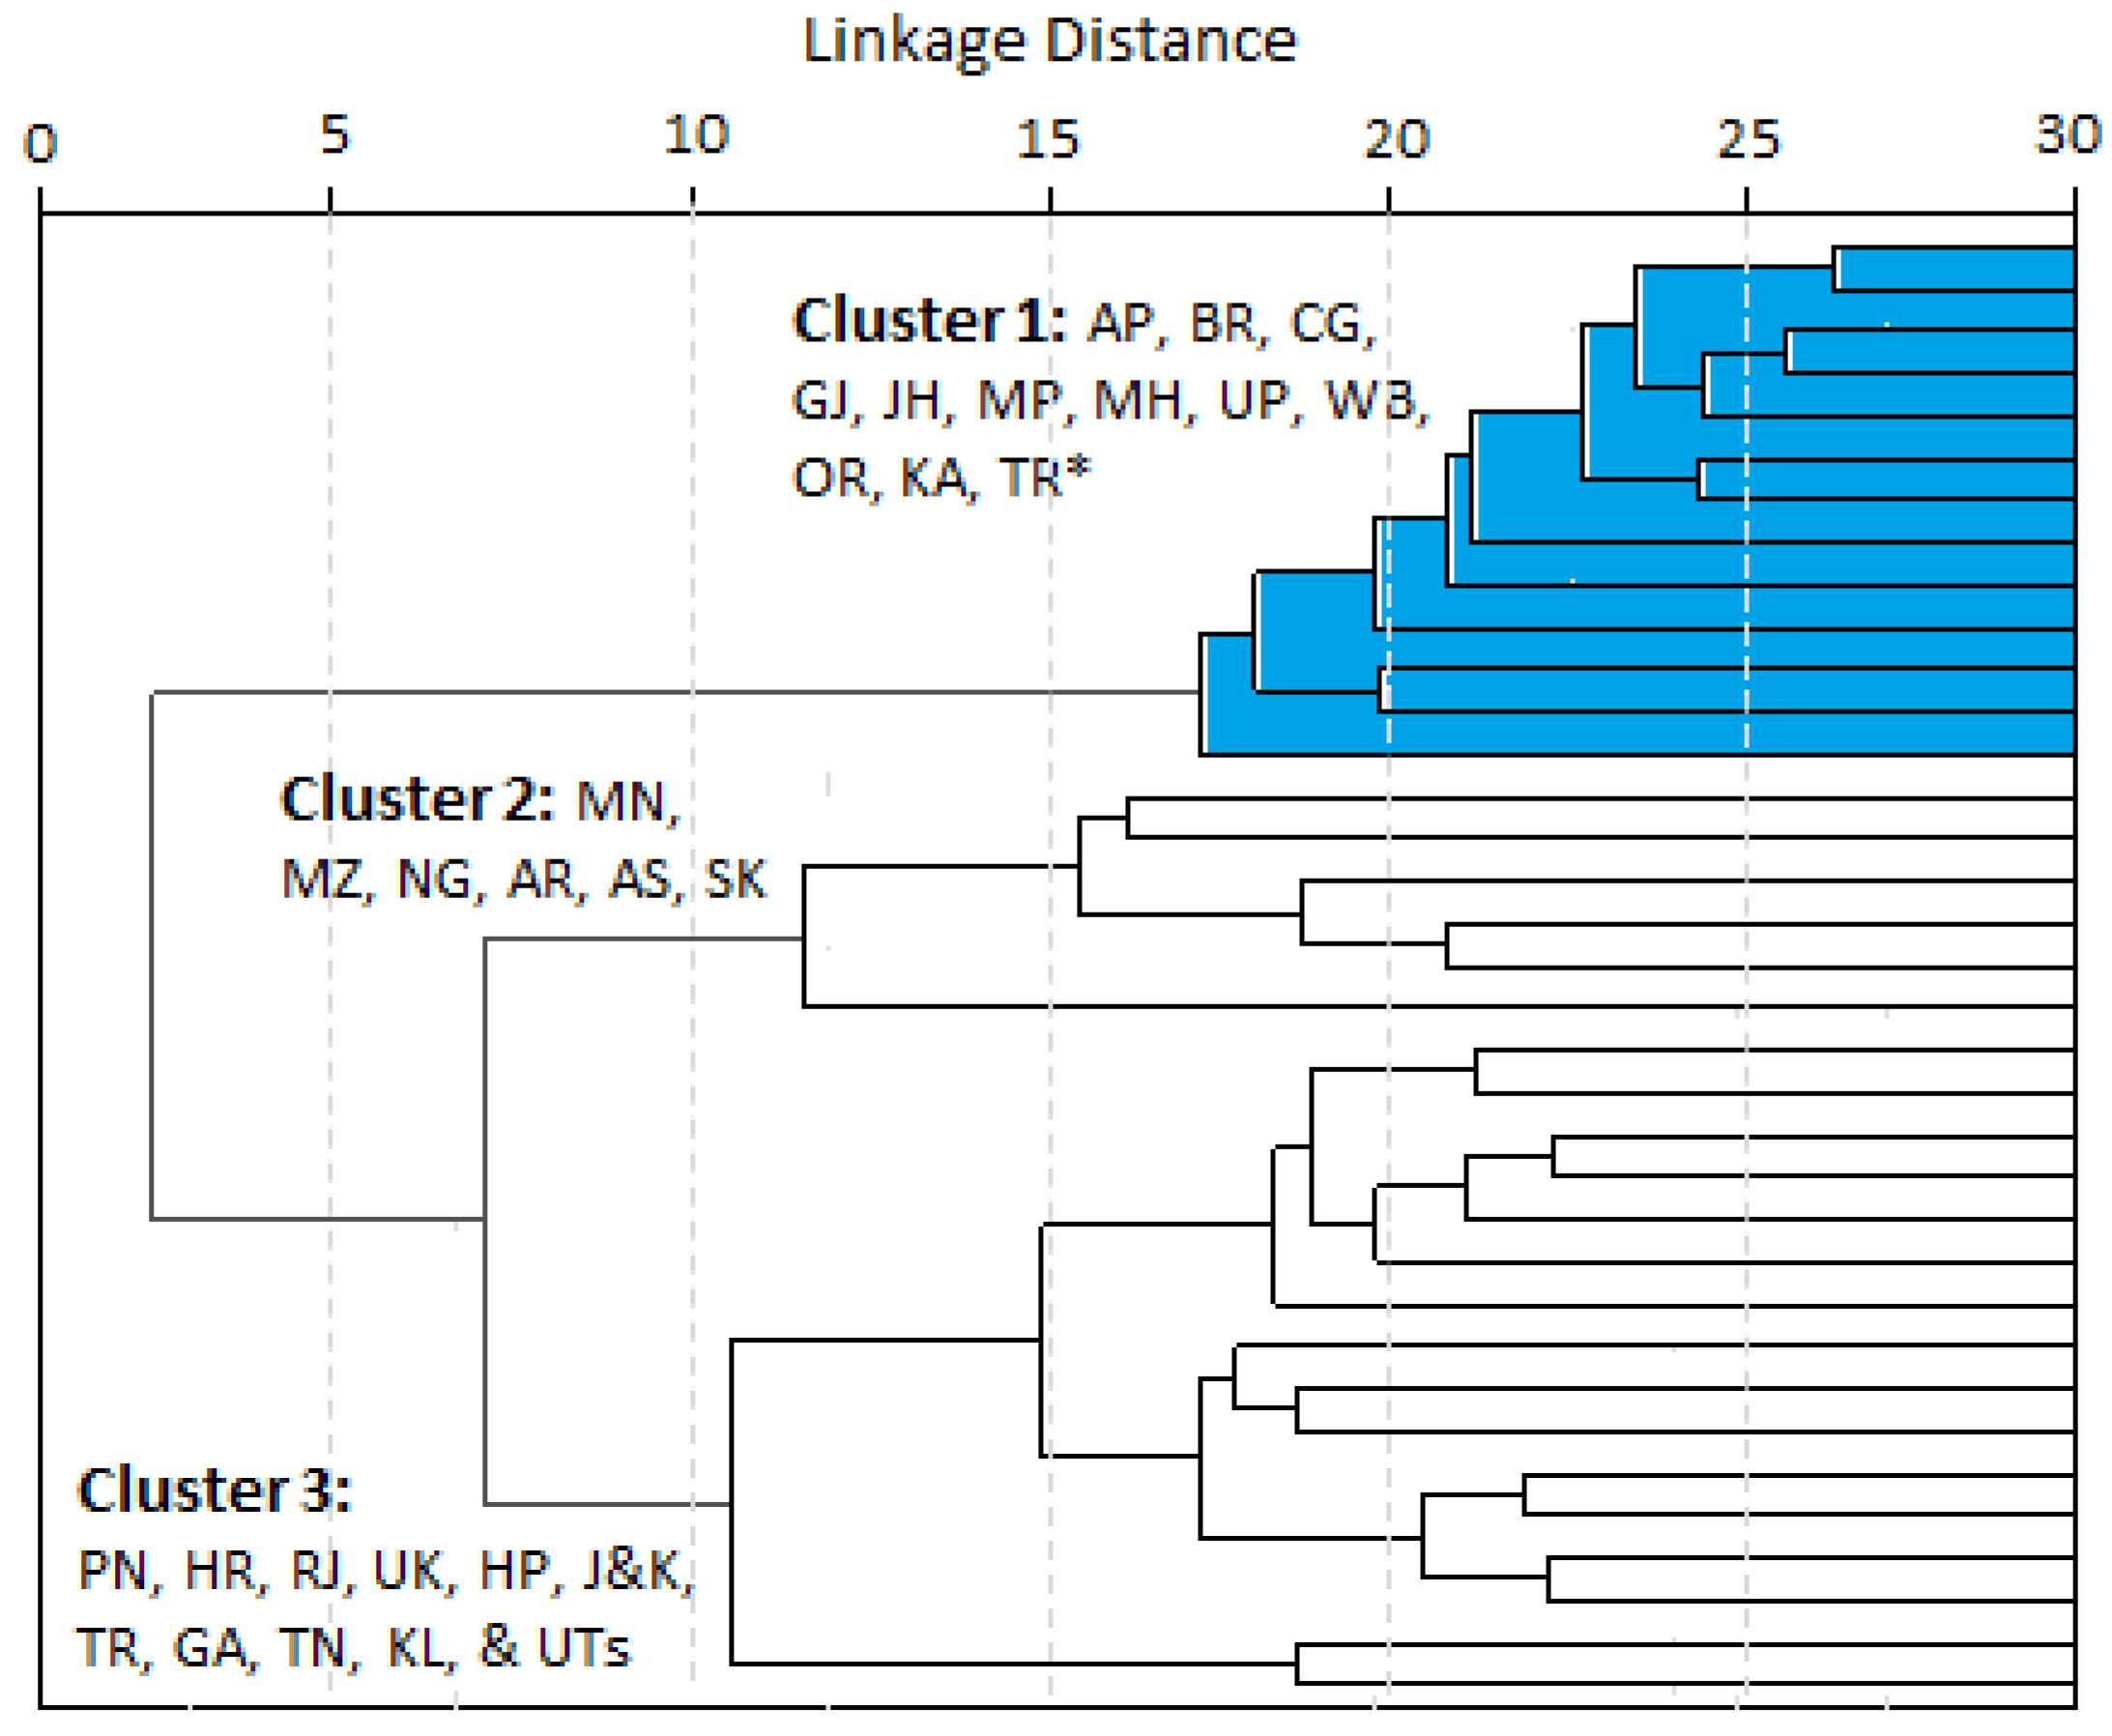
3.1. Hierarchical Cluster Analysis (HCA)
3.2. Correlation Analysis (MLRA) between LDD and Farming Parameters
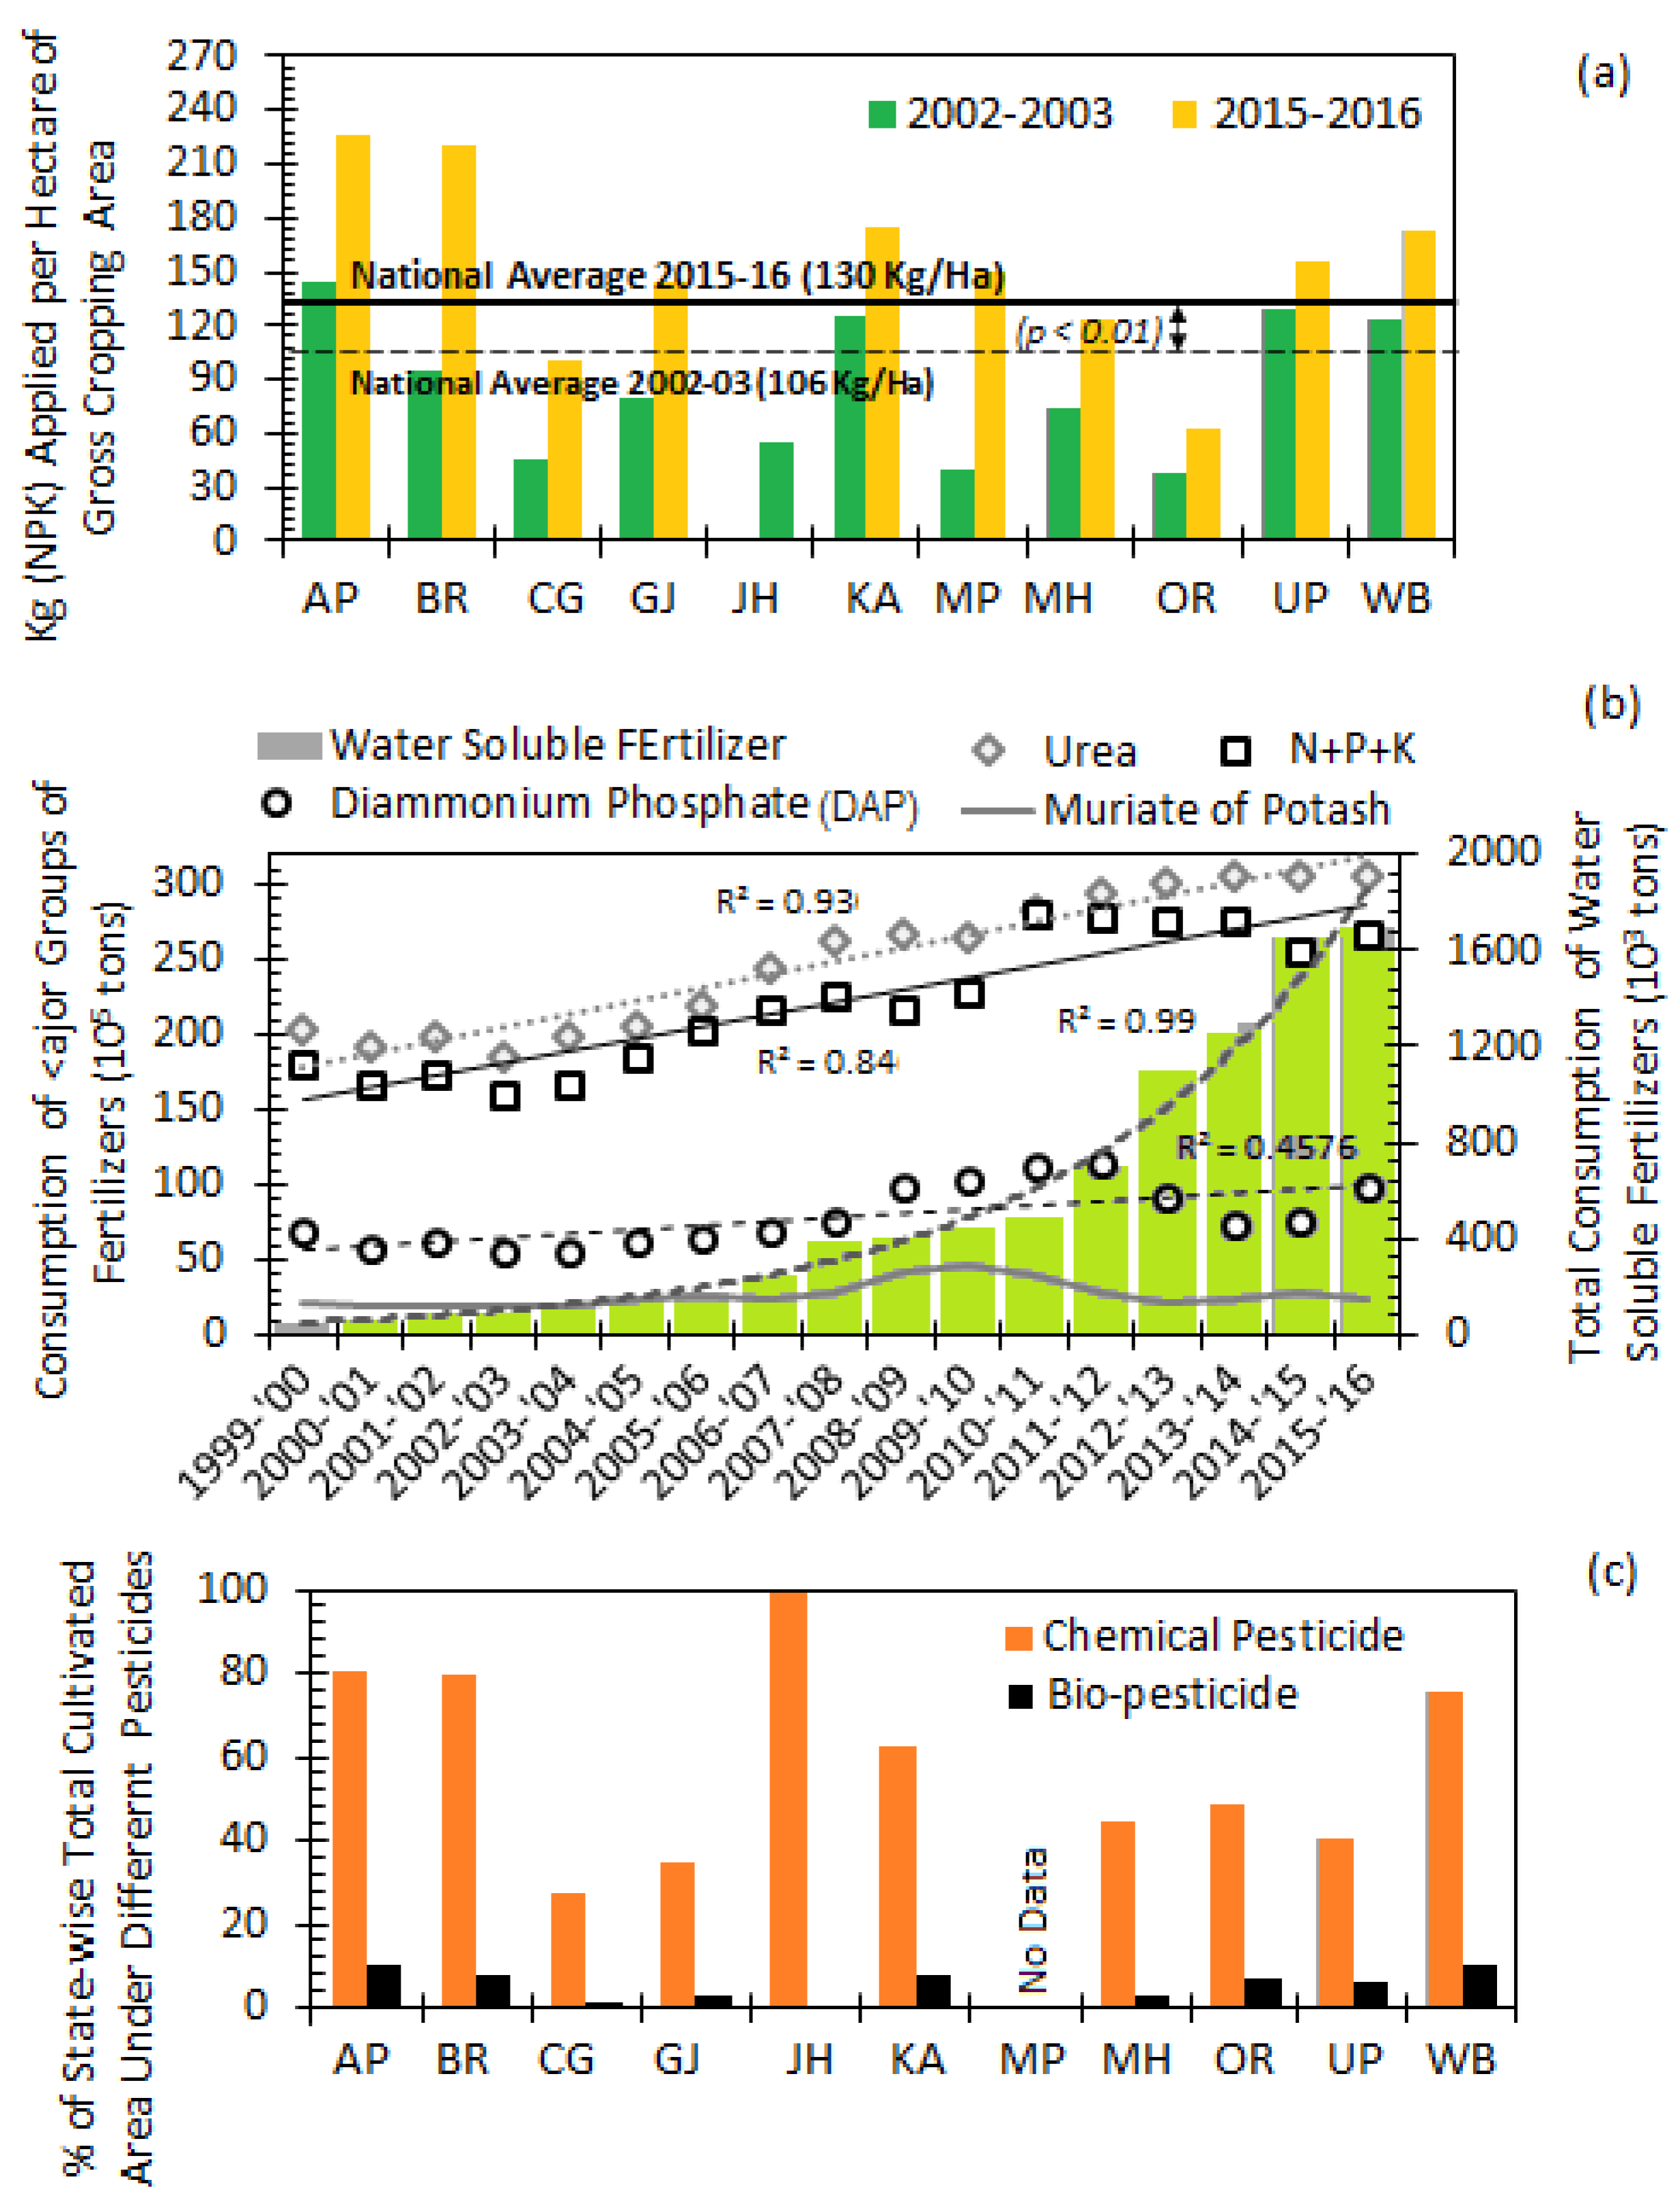
3.2.1. Mineral Fertilizers
3.2.2. Pesticides
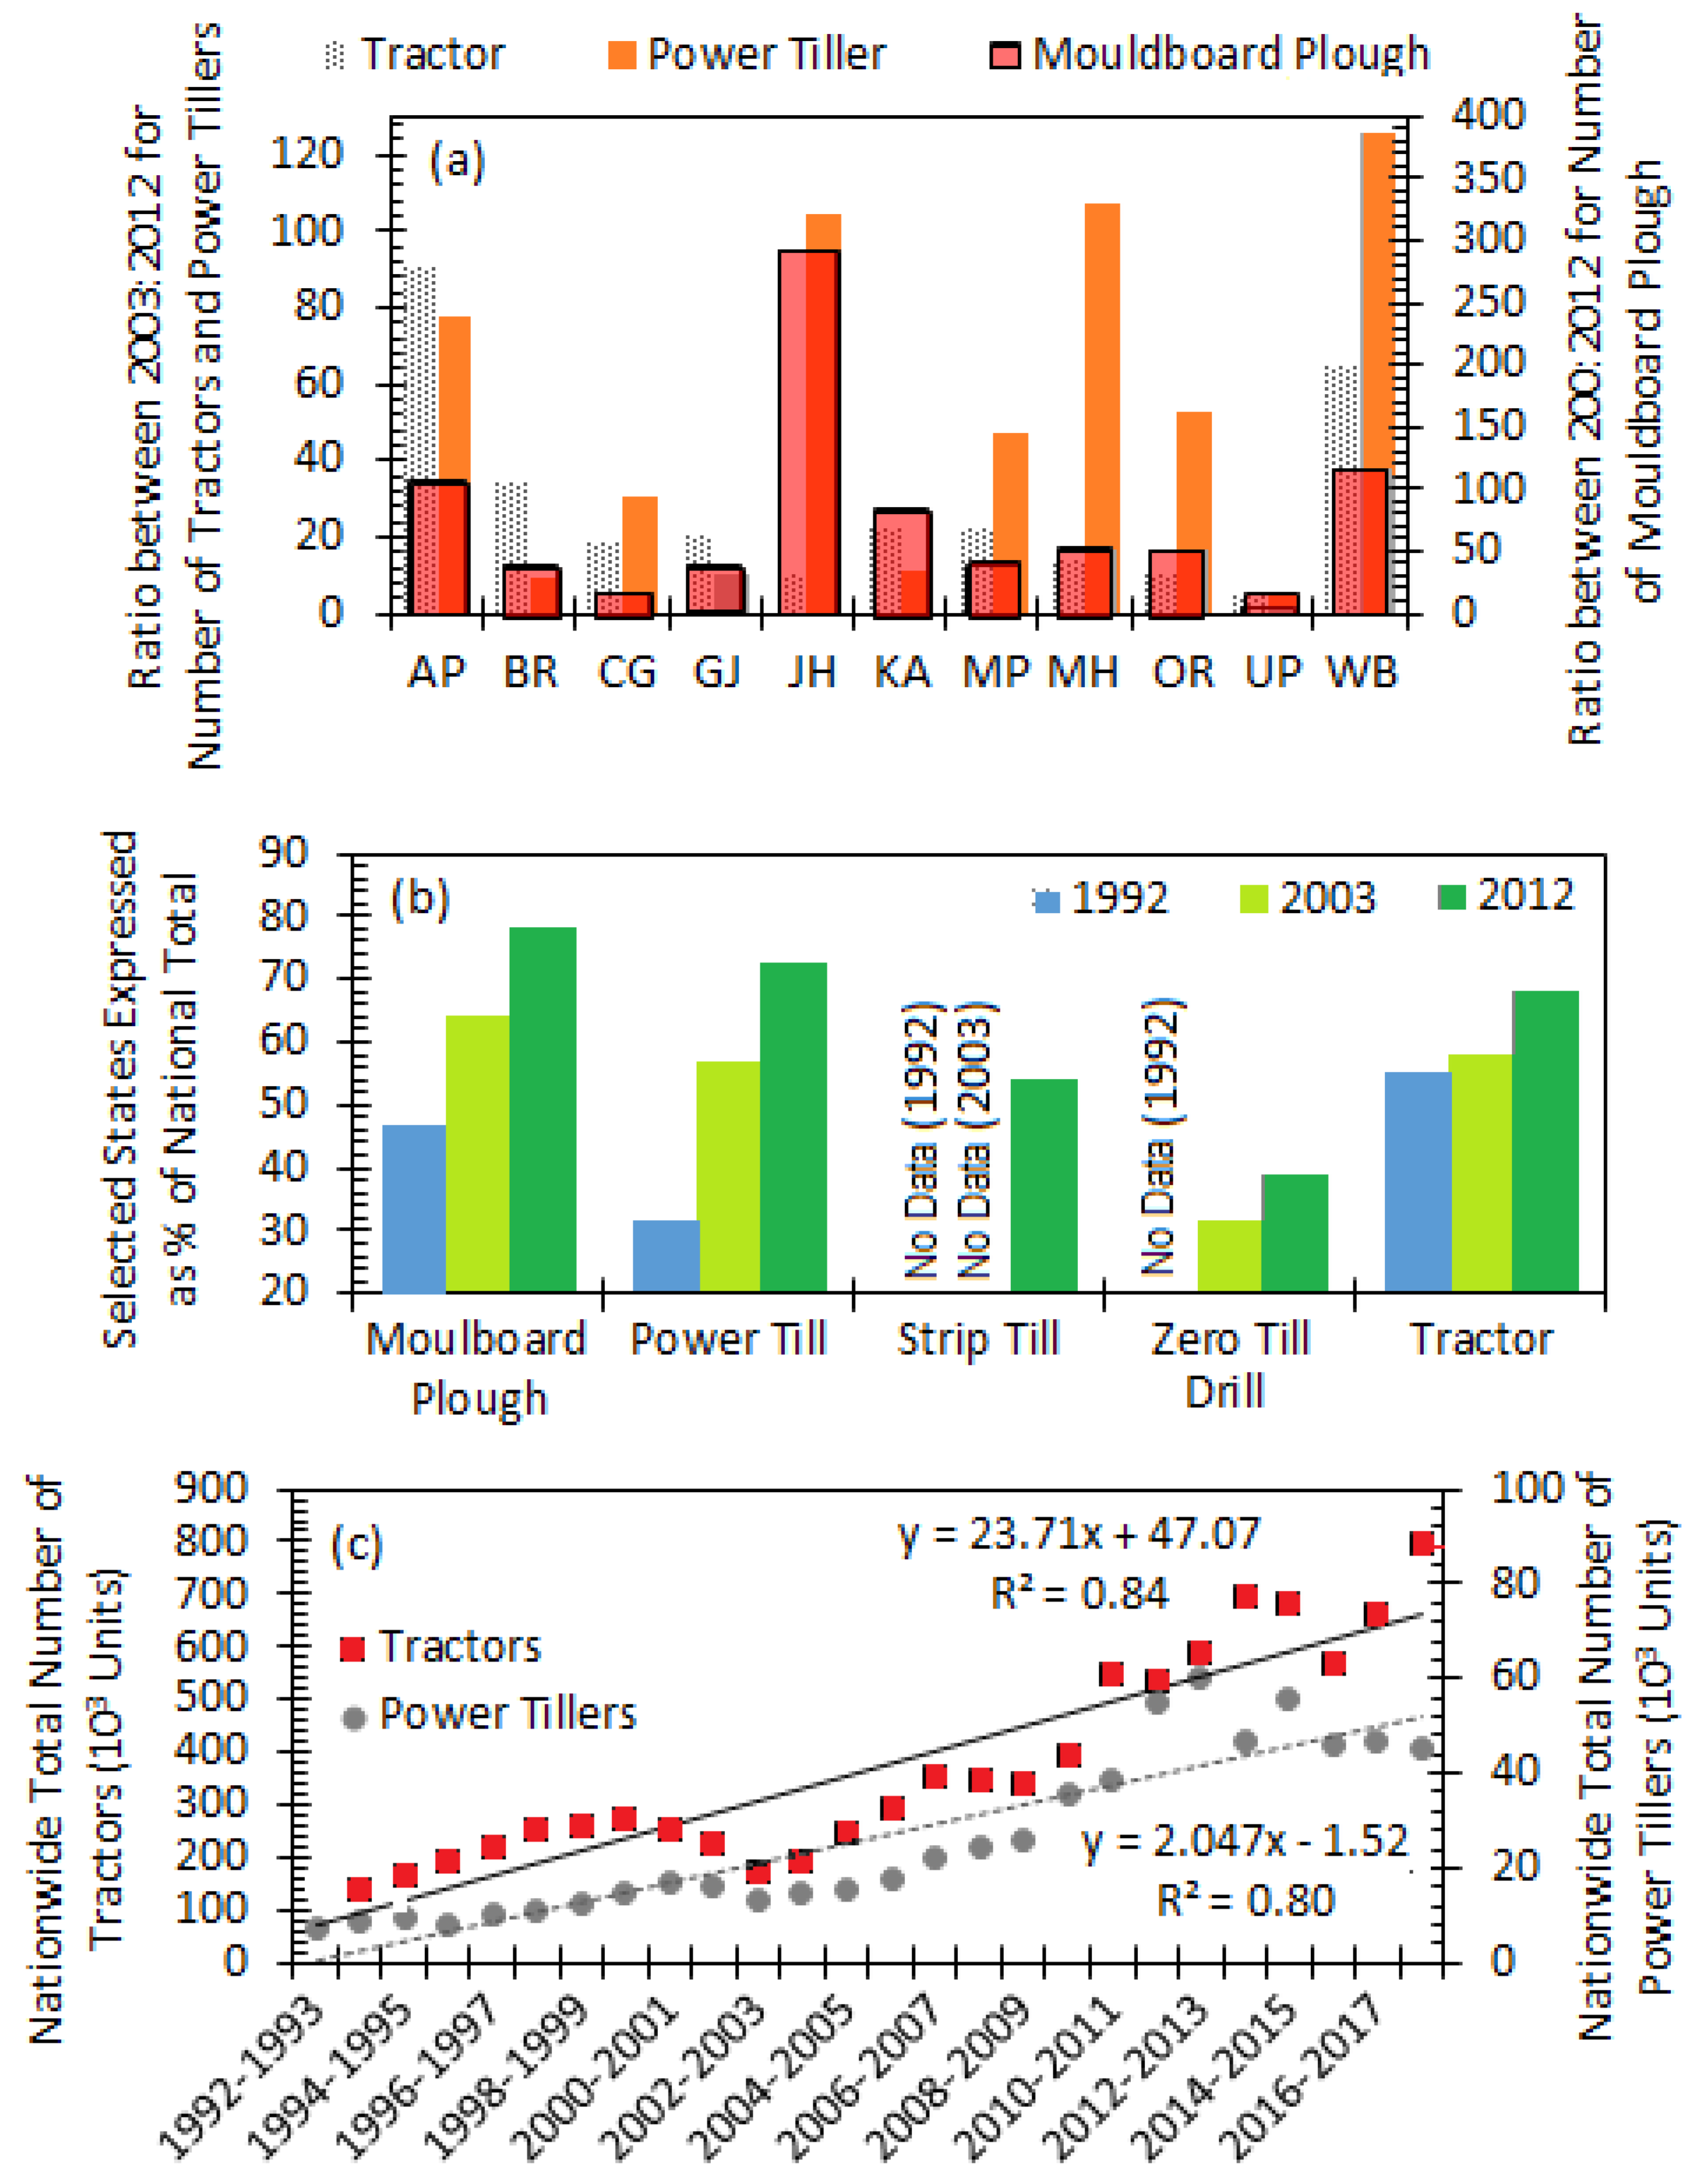
3.2.3. Tillage
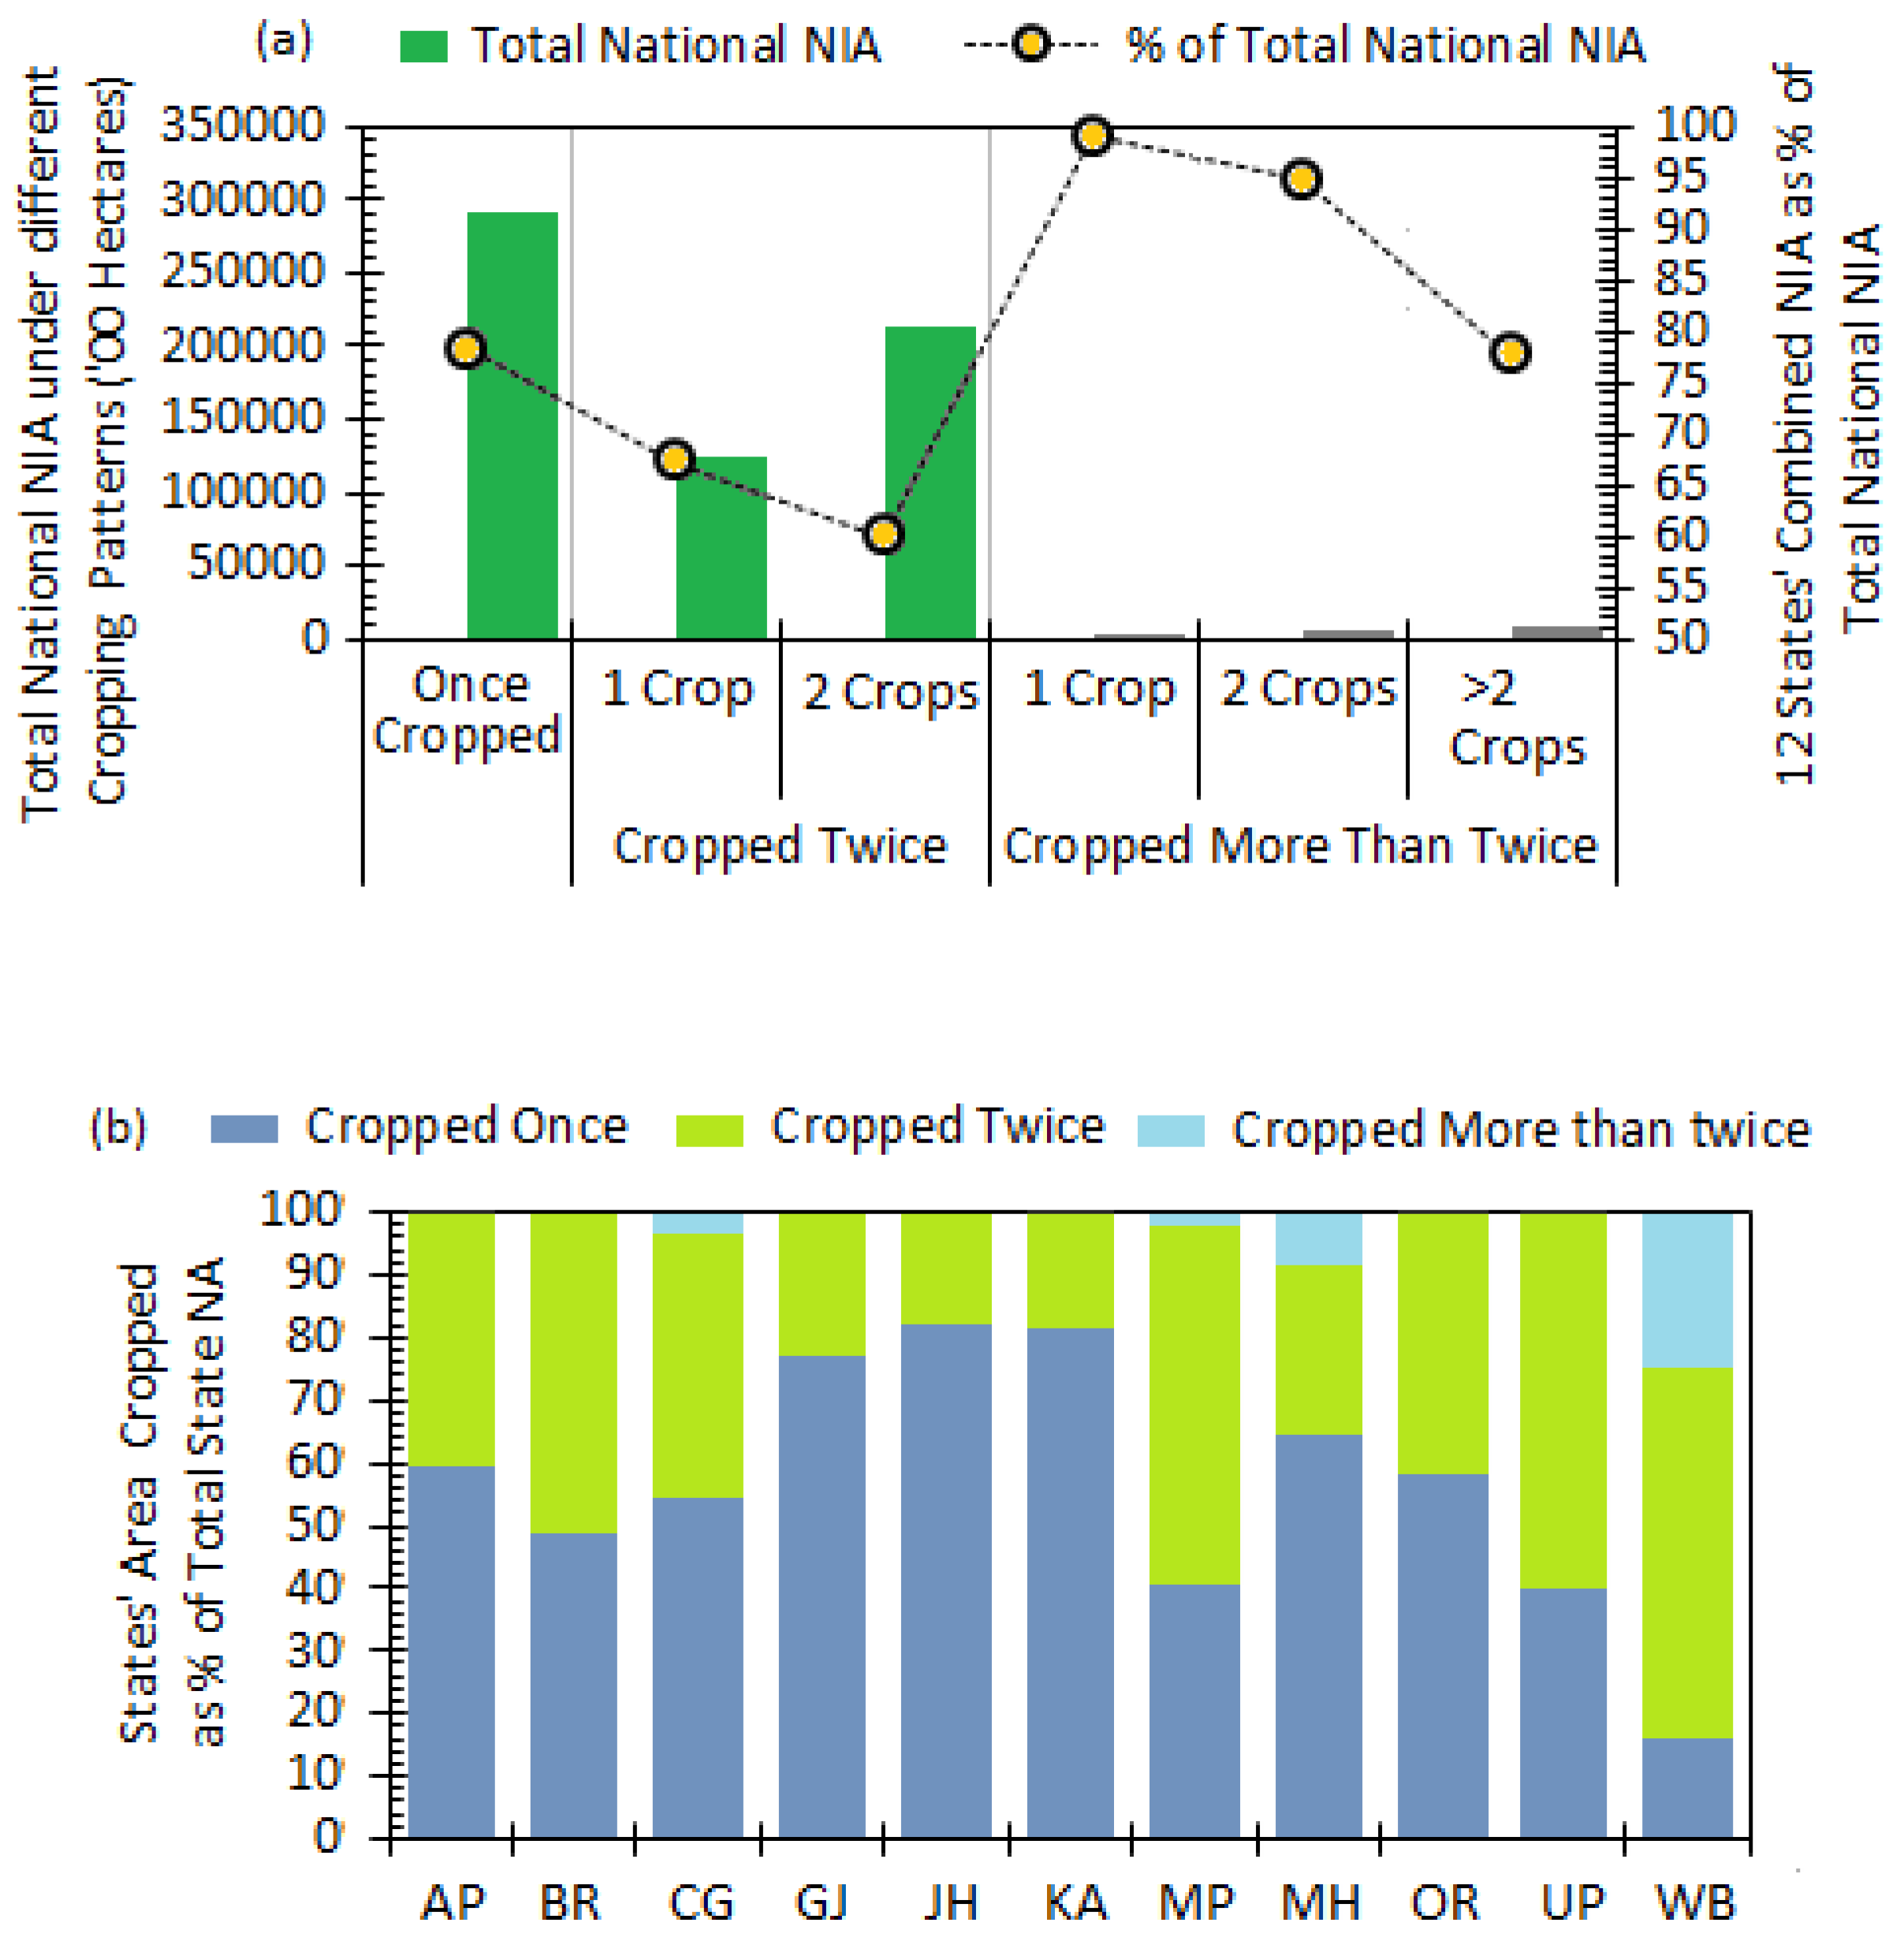
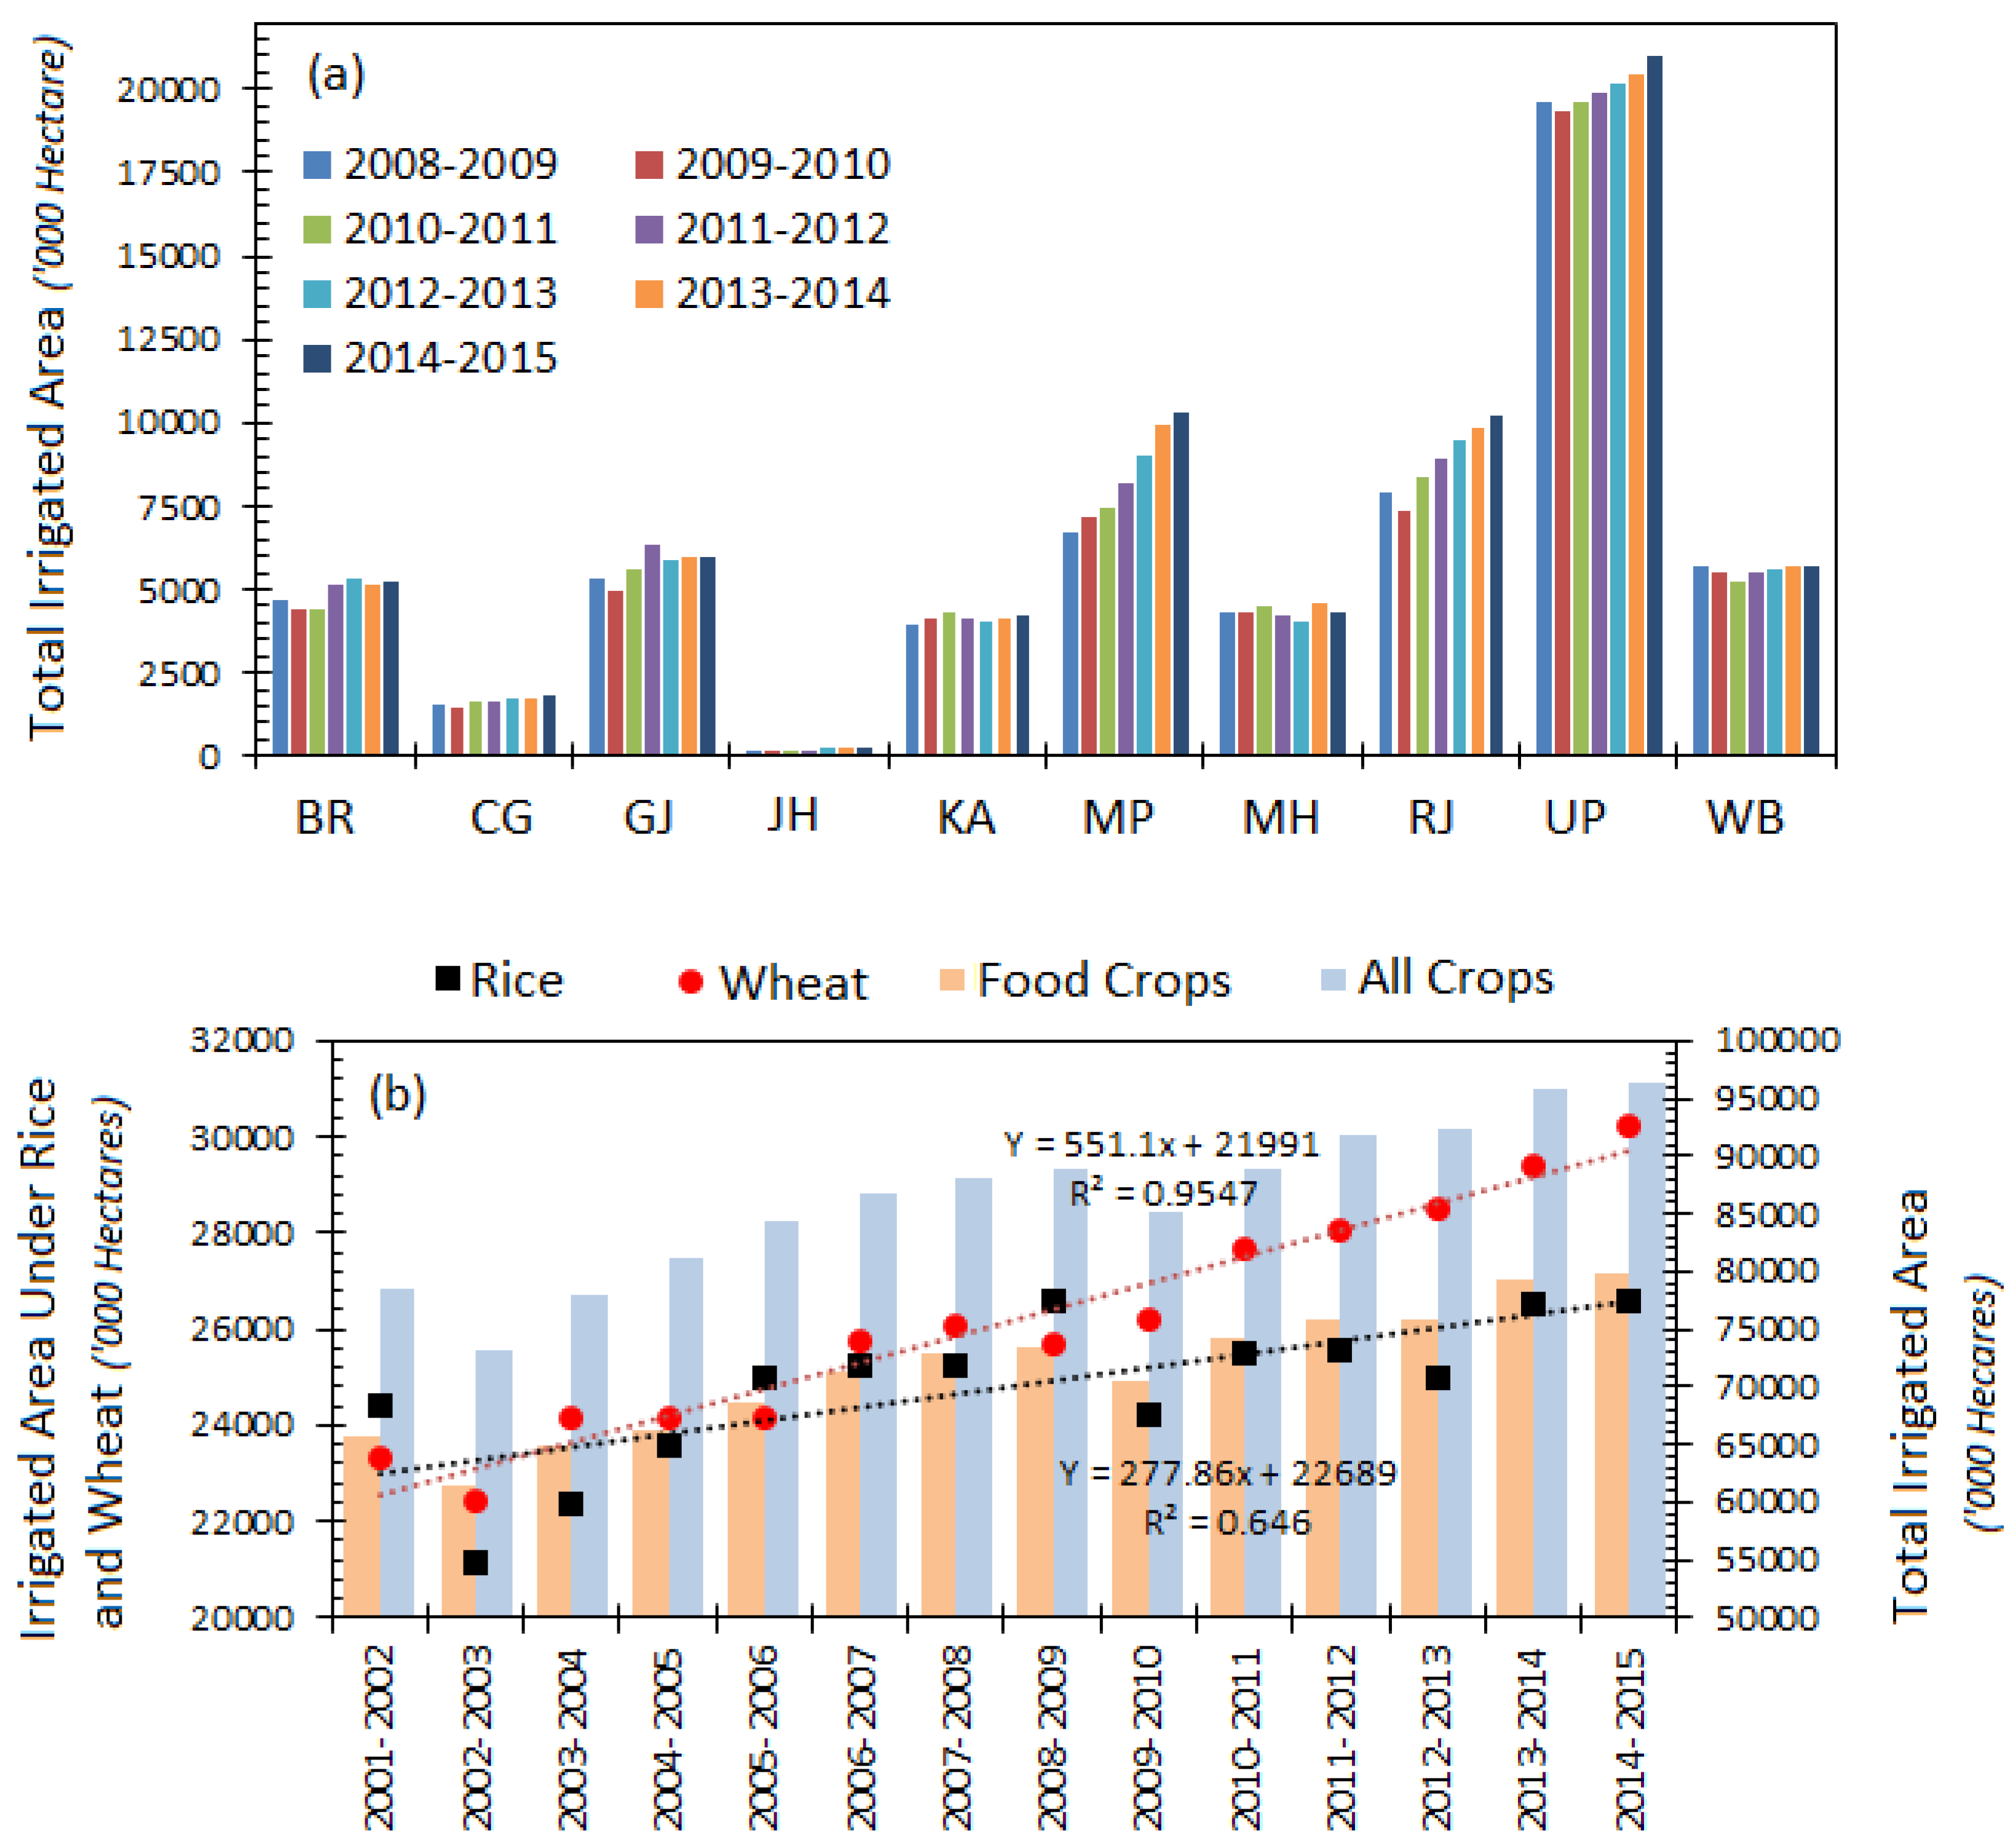
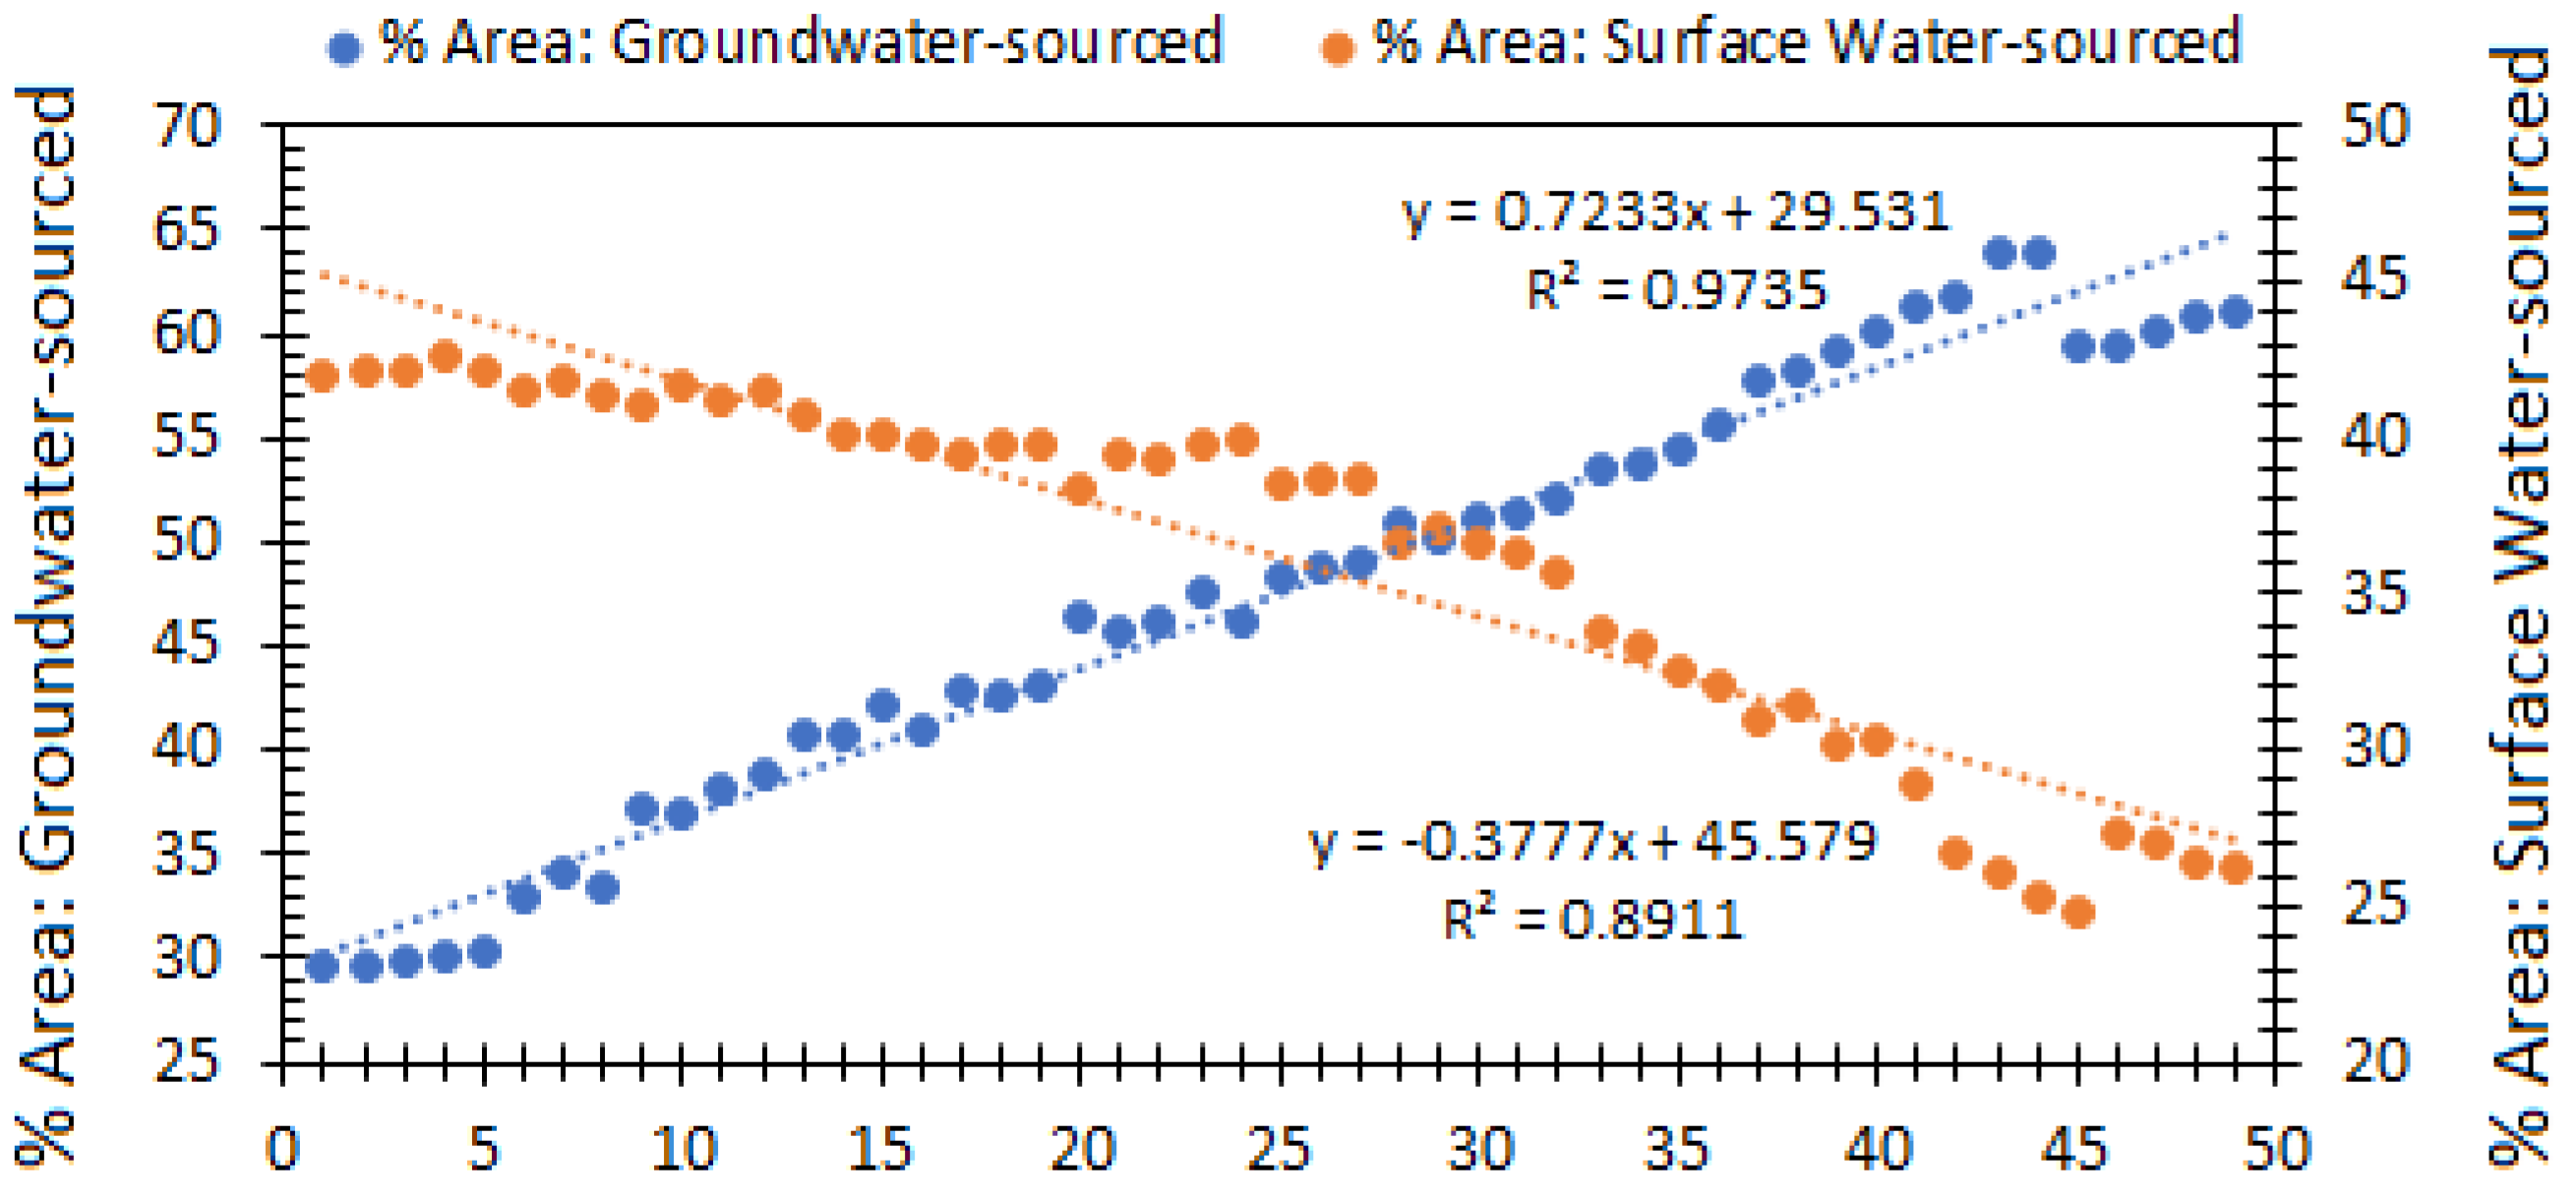
3.2.4. Irrigation
4. Discussion
4.1. Assessment of MLRA
4.2. Mineral Fertilizers
- (A)
- FERTILIZER IMBALANCE: Deviation in relative proportions of N, P, and K in fertilizer mixes from what is ideally prescribed, i.e., 4:2:1 [46]. This also deviates from the global average NPK ratio of 3.4:1.3:1 [47]. NPK ratios in fertilizers vary widely from 5.4:2.7:1.8 to about 8.2:3.2:1 from region to region [48]. With little regulatory oversight and farmer awareness of detrimental impacts, preference for increased N content in fertilizers has persisted for a long time, which now threatens land system sustainability, risking production failure due to the deterioration in overall land quality.
- (B)
4.3. Pesticides
- ○
- Providing farmers with concrete evidence of the efficacy of bio-pesticides (e.g., assurance about income enhancement and improved crop yields)
- ○
- Making high-quality bio-pesticides available at affordable prices in local village shops/markets
- ○
- Lowering bio-pesticides registration cost
- ○
- Ensuring fast-track registration of newly developed varieties
- ○
- Building a digital database of bio-pesticides on open-sourced platforms
- ○
- Strategically increasing the liaison between bio-pesticide marketers, regulators, and retailers
- ○
- Organizing sensitization and capacity building at grassroots (e.g. focused group discussions, one-on-one meeting, door to door campaigns)
- ○
- Subsidizing bio-pesticides
- ○
- Incentivizing farmers for bio-pesticide uptake
- ○
- Developing insurance schemes for risk aversion
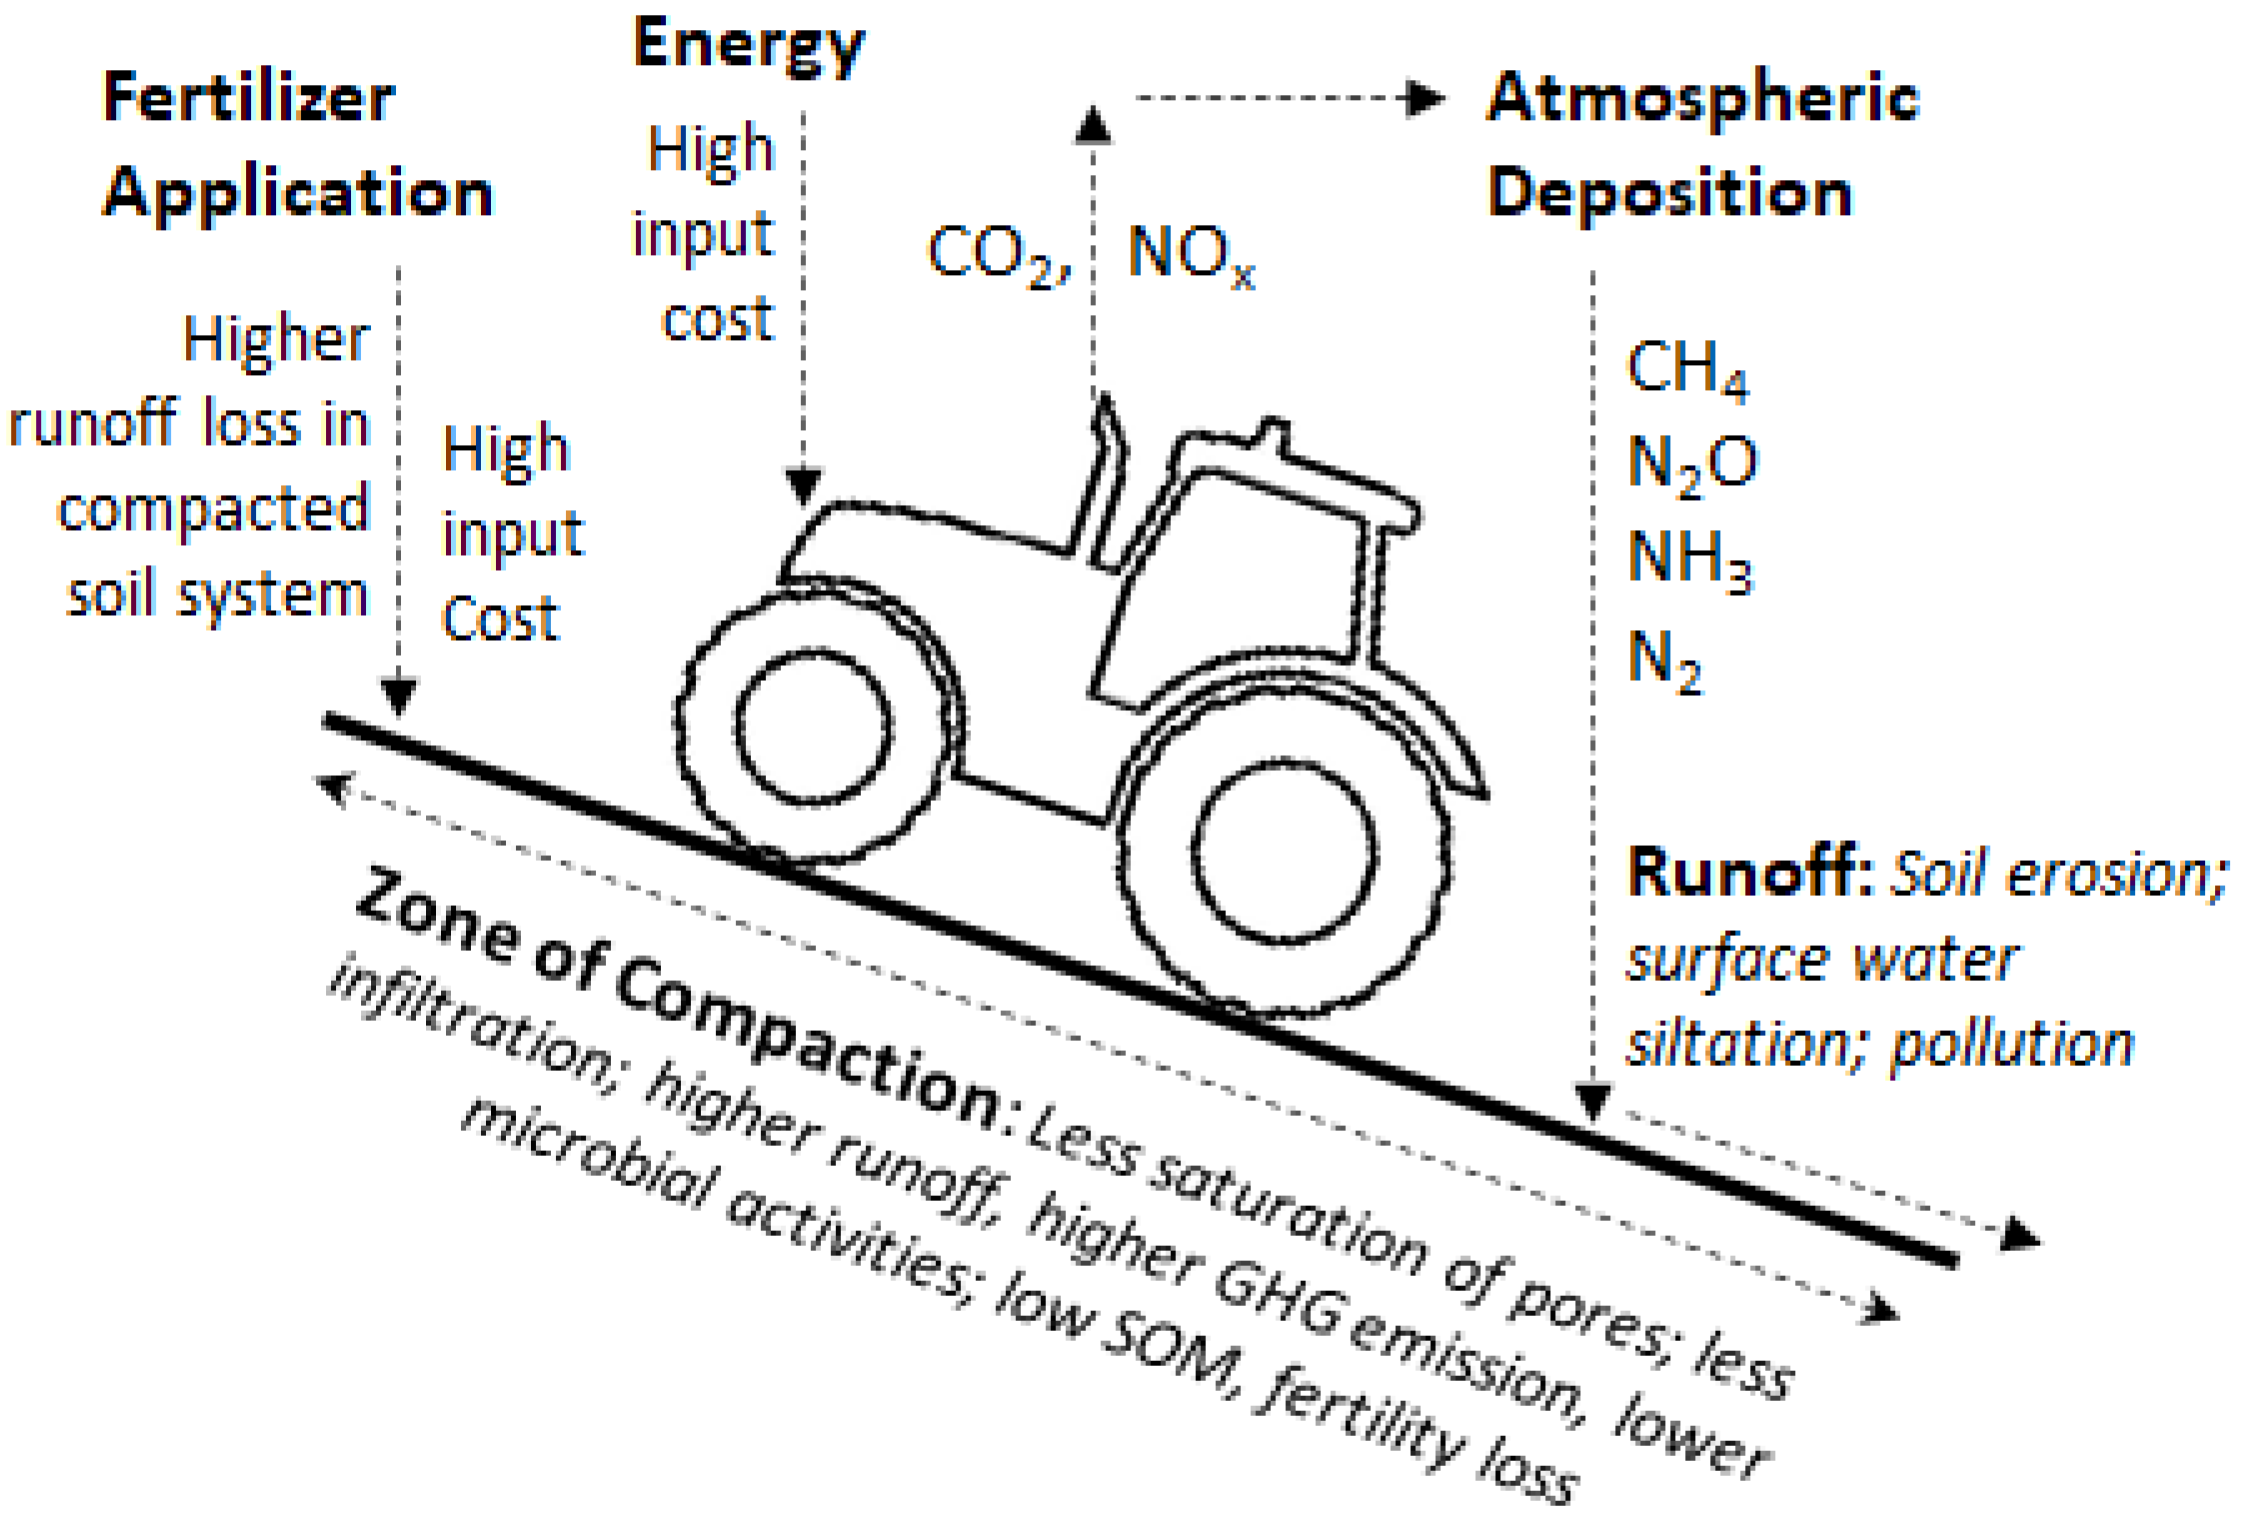
4.4. Tillage
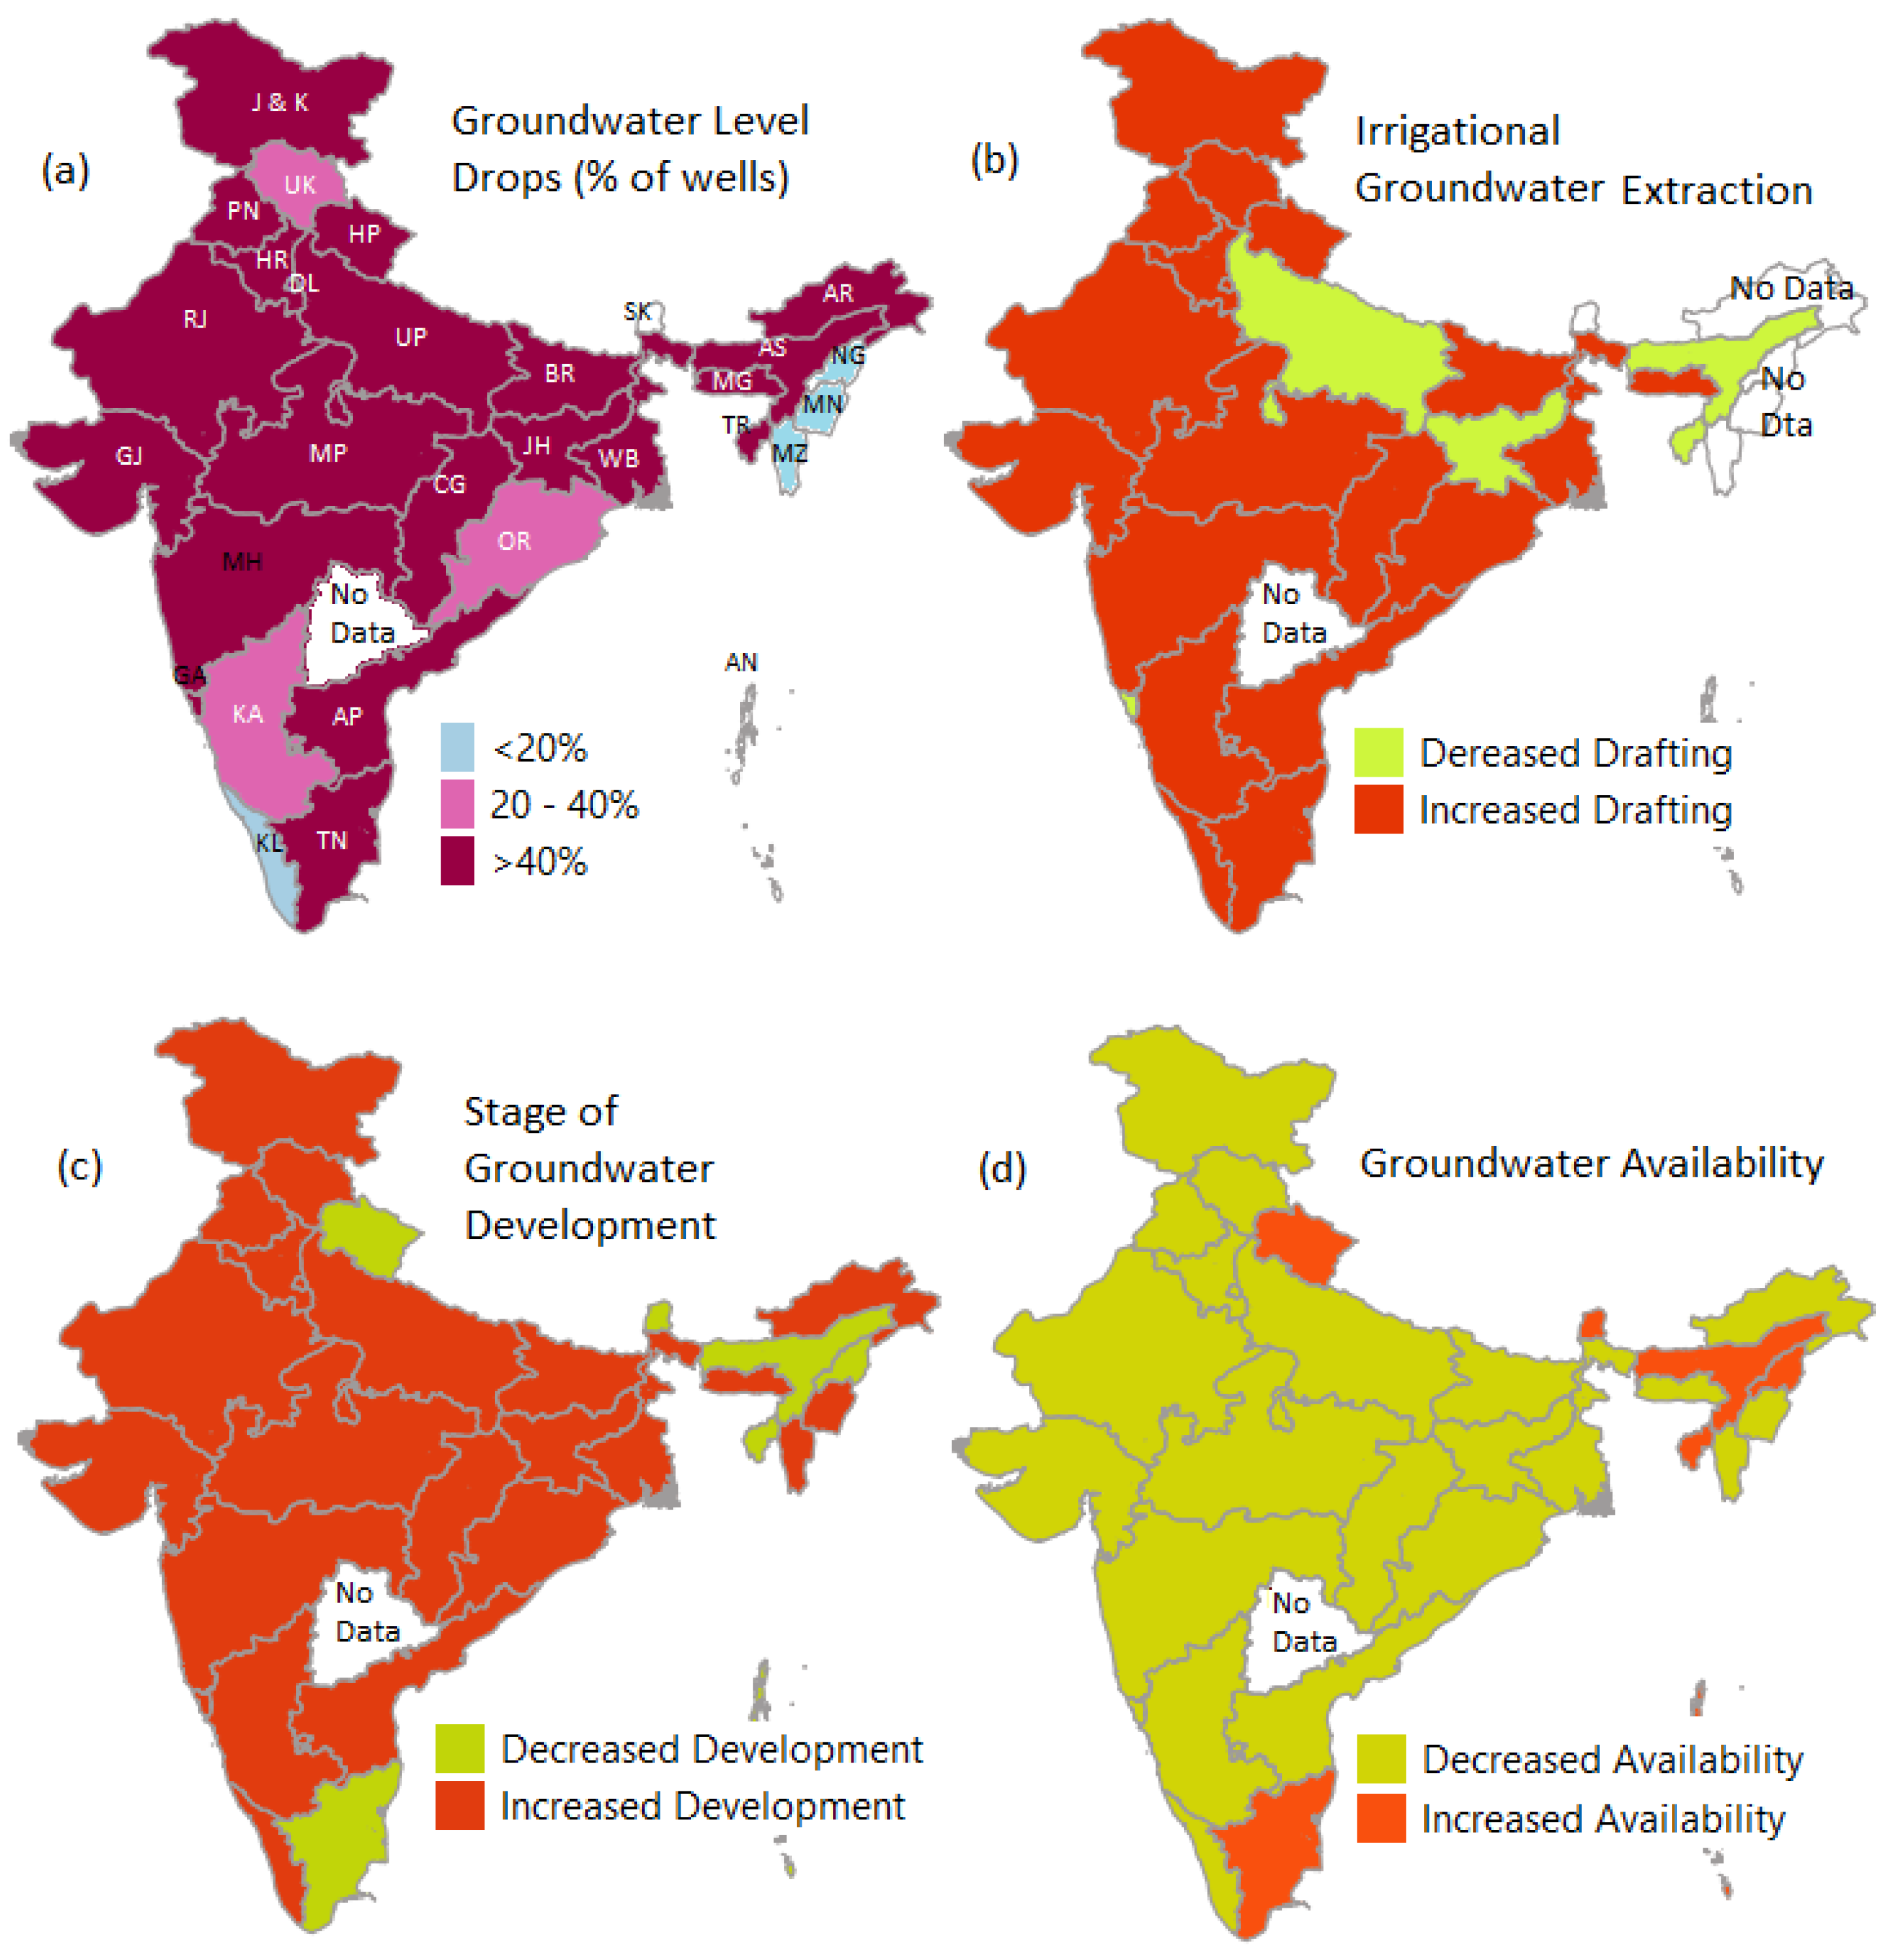
4.5. Irrigation
5. Future Directions and Developments
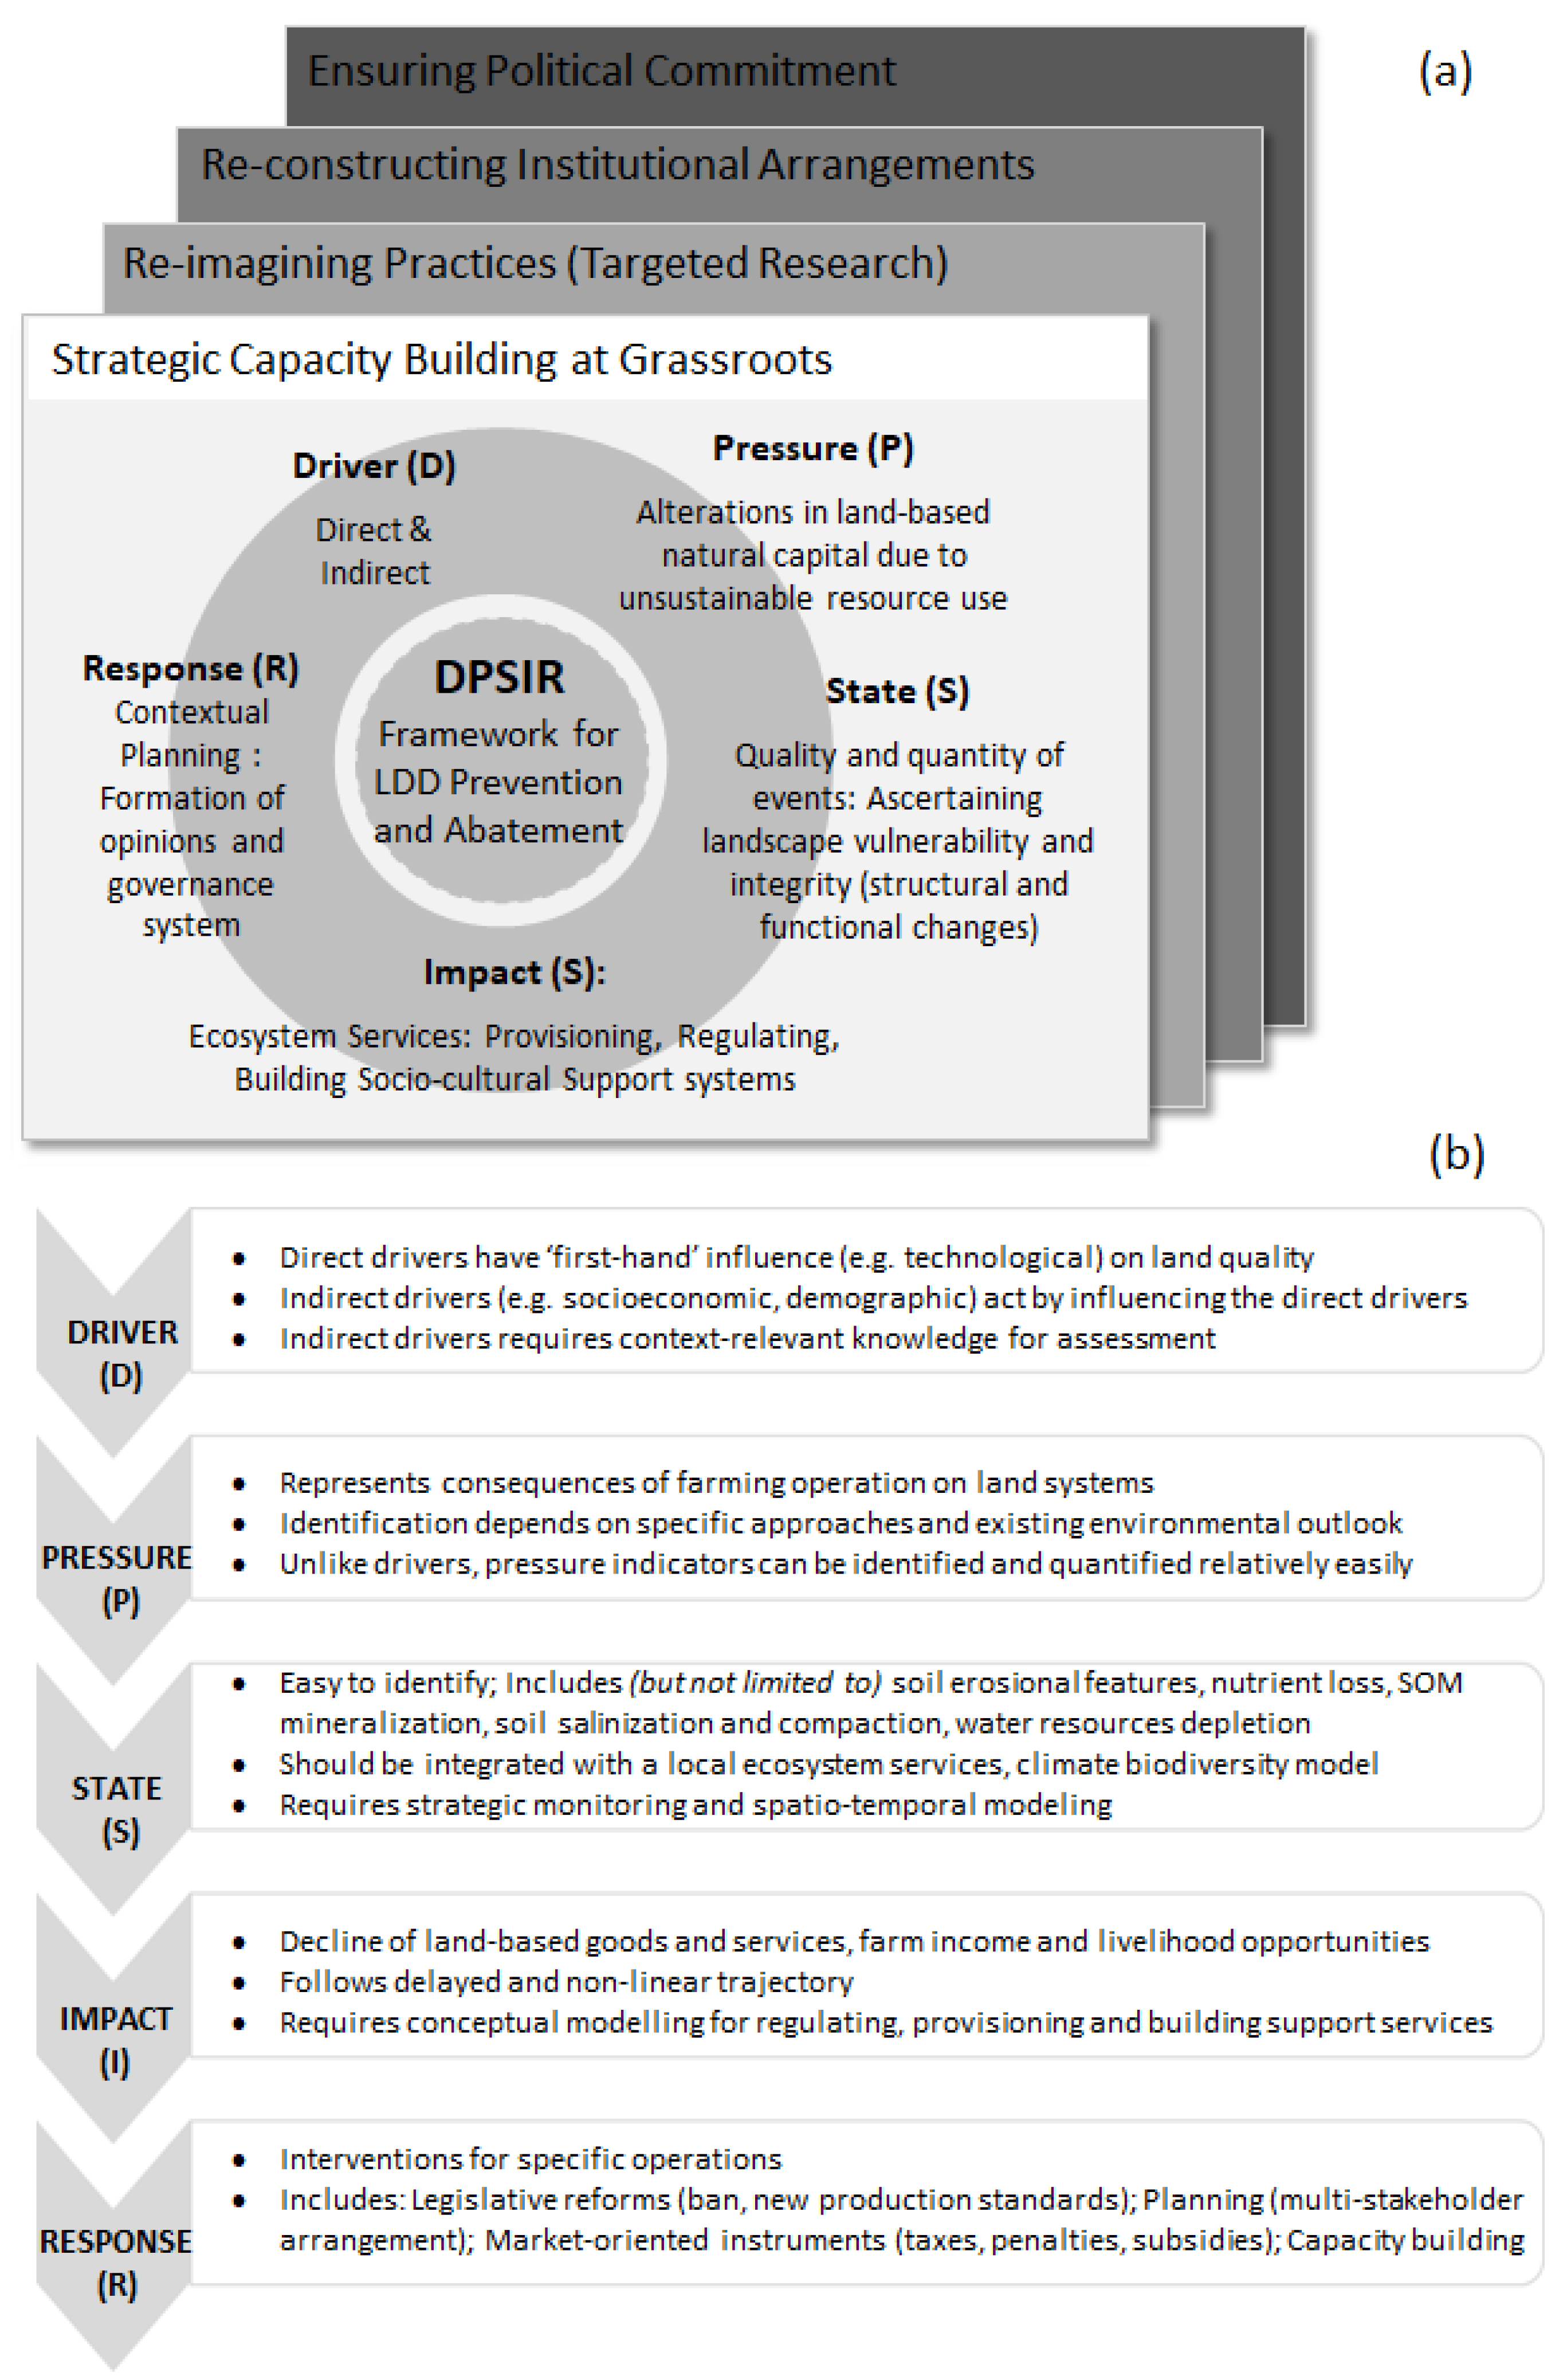
5.1. Towards a Systemic Vision: The DPSIR Framework
- -
- Dietary Shifts: Rapid economic growth, urbanization, globalization, and elevated living standards have prompted dietary shifts in India [99], just like the rest of the world, with rapidly growing preferences for a protein-rich diet (meat and dairy products) [100,101]. This requires intensive farming routines, which have large environmental footprints [101,102].
- -
- Alteration of Food Supply Chain: With changing demographic patterns, the food supply chain has been transformed from production to retailing. This is marked by the growing emphasis of producers and food retailers on a cheap, flexible, and shorter production chain. Such aspirational targets operating with the main idea of profit maximization prompts farmers to continue with the long-standing ‘tried-and-tested’ means of input-intensive farming.
- -
- Traditional Thinking of Success: Despite growing attention to declining environmental quality and ecosystem services, excellence in the farming sector is still only measured by economic returns, i.e., crop yield and per capita productivity. Consequently, farmers adopt any means to increase production, regardless of the impact on land quality.
- -
- Export-oriented Farming: The government still largely promotes production of certain crops that have high international market value. However, several of these crops demand input-intensive farming (e.g., rice, wheat).
- -
- Short-term Thinking: The agrarian policy sector is known for shortsightedness, which is the outcome of rapid privatization (rise of corporations and multinationals), wherein large agribusiness firms push for industrial modes of production, often with little regard for long-term environmental consequences.
- -
- Individualism: Policies are largely developed in silos. For examples, there is little coordination between various ministries (e.g., land, water, farmers’ welfare, agriculture, energy) to devise mutually complementary strategies (e.g., offering lucrative fertilizer and energy subsidies without consulting the ministries of land, water, and environment). Such individualism prompts farmers to discover loopholes and continue traditional practices of input-intensive farming.
- -
- Political Entrenchment: Most forward-thinking agro-policies are branded as anti-farmer, heavily criticized, and repealed. This largely occurs due to political cohorts seeking to gain populist mandates among the electorate, which, on most occasions, is largely comprised of farming communities.
5.2. LDD Monitoring and Assessment: The Need for a Data Revolution
6. Conclusions
- Long and sustained use of mineral fertilizers, chemical pesticides, mechanical tillage, and groundwater exploitation has negatively impacted land quality. In a cyclic fashion, this might make farmers adopt more aggressive means to maintain production which, in turn, only escalates LDD losses.
- There is a spatial dimension in which certain regions experience more LDD threats.
- There is little awareness of bio-pesticides, reduced tillage practices, and new fertilizer recommendations at the grassroot level due to various institutional shortcomings, ranging from a lack of sensitization to capacity building and extension services to support farmers. It keeps traditional (input-intensive) practices in running despite their long-term implications for land quality resources.
- There is a need for a more systemic vision to assess LDD within an interlocking web of drivers and pressures to contemplate context-relevant response strategies.
- There is a need to support high-end research by generating and disseminating high-resolution spatial–temporal data to develop robust decision-support systems.
Author Contributions
Funding
Data Availability Statement
Acknowledgments
Conflicts of Interest
References
- Abebaw, W.A. Review on impacts of land degradation on agricultural production in Ethiopia. J. Resour. Dev. Manag. 2019, 57. [Google Scholar] [CrossRef]
- IPBES. Summary for Policymakers of the Assessment Report on Land Degradation and Restoration of the Intergovernmental Science-Policy Platform on Biodiversity and Ecosystem Services; Scholes, R., Ed.; Intergovernmental Science-Policy Platform on Biodiversity and Ecosystem Services Secretariat: Bonn, Germany, 2018. [Google Scholar]
- Lal, R. Restoring soil quality to mitigate soil degradation. Sustainability 2015, 7, 5875–5895. [Google Scholar] [CrossRef] [Green Version]
- Stavi, I.; Lal, R. Achieving net-zero land degradation: Challenges and opportunities. J. Arid. Environ. 2015, 112, 44–51. [Google Scholar] [CrossRef]
- Khaledian, Y.; Kiani, F.; Ebrahimi, S.; Brevik, E.E.C.; Aitkenhead-Peterson, J. Aitkenhead-Peterson, Assessment and monitoring of soil degradation during land use change using multivariate analysis. Land Degrad. Dev. 2017, 28, 128–141. [Google Scholar] [CrossRef]
- Mekonnen, M.; Keesstra, S.D.; Stroosnijder, L.; Baartman, J.E.M.; Maroulis, J. Soil conservation through sediment trapping: A review. Land Degrad. Dev. 2015, 26, 544–556. [Google Scholar] [CrossRef]
- Thomaz, E.L.; Luiz, J.C. Soil loss, soil degradation and rehabilitation in a degraded land area in Guarapuava (Brazil). Land Degrad. Dev. 2012, 23, 72–81. [Google Scholar] [CrossRef]
- Wuepper, D.; Borrelli, P.; Finger, R. Countries and the global rate of soil erosion. Nat. Sustain. 2020, 3, 51–55. [Google Scholar] [CrossRef]
- Olsson, L.; Barbosa, H.; Bhadwal, S.; Cowie, A.; Delusca, K.; Flores-Renteria, D.; Stringer, L. Land Degradation. In Climate Change and Land; Shukla, P.R., Ed.; LIDSEN Publishing Inc.: Beachwood, OH, USA, 2019. [Google Scholar]
- Roy, P.; Pal, S.C.; Chakrabortty, R.; Saha, A.; Chowdhuri, I. A systematic review on climate change and geo-environmental factors induced land degradation: Processes, policy-practice gap and its management strategies. Geol. J. 2022. [Google Scholar] [CrossRef]
- UNCCD. The economics of desertification, land degradation and drought: Methodologies and analysis for decision-making. In Proceedings of the UNCCD 2nd Scientific Conference, Bonn, Germany, 9–12 April 2013. [Google Scholar]
- Cherlet, M.; Hutchinson, C.; Reynolds, J.; Hill, J.; Sommer, S.; von Maltitz, G. (Eds.) World Atlas of Desertification; Publication Office of the European Union: Luxembourg, 2018. [Google Scholar]
- SAC. Desertification and Land Degradation Atlas of India (Based on AWiFS Data of 2011–2013 and 2003–2005); Space Application Center: Ahmedabad, India, 2016. [Google Scholar]
- Adithyalakshmanan, K.; Kaur, H.; Chaudhuri, S. Unpacking Land Degradation Neutrality (LDN), An Emerging Paradigm to Conserve Land Systems’ Sustainability in 21st Century? Meta-analysis of challenges and opportunities. Nat. Environ. Pollut. Technol. 2022, 21, 91–100. [Google Scholar]
- UNCCD. Global Land Outlook, 1st ed.; United Nations Convention to Combat Desertification: Bonn, Germany, 2017; Available online: http://www2.unccd.int/sites/default/files/documents/2017-09/GLO_Full_Report_low_res.pdf (accessed on 5 March 2023).
- Ajayi, A. (Land degradation and the sustainability of agricultural production in Nigeria: A review. J. Soil Sci. Environ. Manag. 2015, 6, 234–240. [Google Scholar]
- Reddy, V.R.; Galab, S. Looking beyond debt trap. Econ. Political Wkly. 2006, 41, 1838–1841. [Google Scholar]
- Goyal, S.K.; Prbha, R.J.P.; Singh, S.R. Indian agricultures and farmers—Problems and reforms. In Indian Agriculture and Farmers; Poddar: Nagar, India, 2016. [Google Scholar]
- Chinnasamy, P.; Hsu, M.J.; Agoramoorthy, G. Groundwater storage trends and their links to farmers’ suicides in Maharashtra state, India. Front. Public Health 2019, 7, 247. [Google Scholar] [CrossRef] [PubMed] [Green Version]
- Priya, R.; Pani, P. Land degradation and agricultural productivity: A district level analysis, India. J. Rural. Dev. 2017, 36, 557–568. [Google Scholar] [CrossRef]
- Chandrika, S.; Ravindra, N.P. Agrarian crisis in India. Asian J. Res. Soc. Sci. Hum. 2017, 7, 1199–1206. [Google Scholar]
- Mythili, G.; Goedecke, J. Economics of land degradation in India. In Economics of Land Degradation and Improvement—A Global Assessment for Sustainable Development; Nkonya, E., Mirzabaev, A., von Braun, J., Eds.; Springer: Cham, Germany, 2016; pp. 431–469. [Google Scholar]
- Vyawahare, M. Land Degradation Cost India 2.5% of Its GDP in 2014-15. Hindustan Times. 19 February 2018. Available online: https://www.hindustantimes.com/environment/land-degradation-cost-india-2-5-of-its-gdp-in-2014-15/story-r5I0Kpv3qBJdeJw3PWsuHO.html (accessed on 5 April 2023).
- TERI. Reversing Land Degradation in India. Energy Resour. Inst. 2019. Available online: https://www.teriin.org/sites/default/files/2019-07/reversing-land-degradation-bg-paper.pdf (accessed on 5 March 2023).
- TERI. Economics of Desertification, Land Degradation and Drought in India. The Energy and Resource; Ministry of the Environment, Forestry and Climate Change (MoEFCC): New Delhi, India, 2018. [Google Scholar]
- Reddy, G.P.O.; Rao, S.S.; Dharumarajan, S.; Surya, J.N.; Lalitha, M.; Mahapatra, S.K.; Meena, R.K.; Sreenivasan, R.; Jena, R.K.; Kumar, N. Mapping and Assessment of Land Degradation in Major Ecosystems of India using Geospatial Technologies. NBSS LUP Rep. 2022, 1158, 300. [Google Scholar]
- Dharumarajan, S.; Bishop, T.F.A.; Hegde, R.; Singh, S.K. Desertification Vulnerability Index-an effective approach to assess desertification processes: A case study in Anantapur District, Andhra Pradesh, India. Land Degrad. Desertif. 2018, 29, 150–161. [Google Scholar] [CrossRef]
- Dharumarajan, S.; Lalitha, M.; Hegde, R.; Janani, N.; Rajawat, A.S.; Sastry, K.L.N.; Singh, S.K. Status of desertification in South India: Assessment, mapping and change detection analysis. Curr. Sci. 2018, 15, 331–338. [Google Scholar] [CrossRef]
- Reddy, N.N.; Chakraborty, P.; Roy, S.; Singh, K.; Minasny, B.; McBratney, A.B.; Biswas, A.; Das, B.S. Legacy data-based national-scale digital mapping of key soil properties in India. Geoderma 2021, 381, 114684. [Google Scholar] [CrossRef]
- Reddy, N.N.; Das, B.S. Digital soil mapping of key secondary soil properties using pedotransfer functions and Indian legacy soil data. Geoderma 2023, 429, 116265. [Google Scholar] [CrossRef]
- Dash, P.K.; Panigrahi, N.; Mishra, A. Identifying opportunities to improve digital soil mapping in India: A systematic review. Geoderma Reg. 2022, 28, e00478. [Google Scholar] [CrossRef]
- Dharumarajan, S.; Hegde, R.; Janani, N.; Singh, S.K. The need for digital soil mapping in India. Geoderma Reg. 2019, 16, e00204. [Google Scholar] [CrossRef]
- RBI. Agricultural Growth and Rural Poverty Reduction in India; Springer Nature: Berlin/Heidelberg, Germany, 2020; Available online: https://rbidocs.rbi.org.in/rdocs/Content/PDFs/2AGRICULTURALGROWTHF76E5CFA07A442258EF7F16D319B3EF2.PDF (accessed on 5 April 2023).
- Reddy, T.; Dutta, M. Impact of Agricultural Inputs on Agricultural GDP in Indian Economy. Theor. Econ. Lett. 2018, 8, 1840–1853. [Google Scholar] [CrossRef] [Green Version]
- RBI. Indian Agriculture: Achievements and Challenges. Reserve Bank of India Bulletin. 2022. Available online: https://rbidocs.rbi.org.in/rdocs/Bulletin/PDFs/02AR_170120226CD582783DB44FECB7A07AC238270E5F.PDF (accessed on 5 April 2023).
- PLFS. Annual Report. In Periodic Labour Force Survey. Government of India; 2020. Available online: https://dge.gov.in/dge/sites/default/files/2022-07/Annual_Report_PLFS_2020-21_0_0.pdf (accessed on 5 March 2023).
- GoI. Agricultural Statistics at a Glance. Department of Agriculture Cooperation and Farmers Welfare, Directorate of Economics and Statistics, Ministry of Agriculture and Farmers Welfare. 2019. Available online: https://eands.dacnet.nic.in/PDF/At%20a%20Glance%202019%20Eng.pdf (accessed on 5 March 2023).
- Brainerd, E.; Menon, N. Seasonal effects of water quality: The hidden costs of the Green Revolution to infant and child health in India. J. Dev. Econ. 2014, 107, 49–64. [Google Scholar] [CrossRef] [Green Version]
- John, D.A.; Babu, G.R. Lessons from the Aftermaths of Green Revolution on Food System and Health. Front. Sustain. Food Syst. 2021, 5, 644559. [Google Scholar] [CrossRef]
- Chhabra, V. Studies on use of biofertilizers in agricultural production. Eur. J. Mol. Clin. Med. 2020, 7, 2335–2339. [Google Scholar]
- Singh, S.; Benbi, D.K. Punjab-soil health and green revolution: A quantitative analysis of major soil parameters. J. Crop. Improv. 2016, 30, 323–340. [Google Scholar] [CrossRef]
- Chaudhuri, S.; Roy, M. Rural-urban spatial inequality in water and sanitation facilities in India: A cross-sectional study from household to national level. Appl. Geogr. 2017, 85, 27–38. [Google Scholar] [CrossRef]
- Cho, K.H.; Kang, J.H.; Ki, S.J.; Park, Y.; Cha, S.M.; Kim, J.H. Determination of the optimal parameters in regression models for the prediction of chlorophyll-a: A case study of the Yeongsan Reservoir, Korea. Sci. Total Environ. 2009, 407, 2536–2545. [Google Scholar] [CrossRef]
- Praveen, K.V. Indian fertilizer policies: Revisiting the Odyssey and lessons from abroad. Curr. Sci. 2017, 113, 1246–1254. [Google Scholar] [CrossRef]
- Prasad, R. Fertilizers and manures. Curr. Sci. 2012, 102, 894–898. [Google Scholar]
- Usama, M.; Khalid, M.A. Fertilizer consumption in India and need for its balanced use: A review. Indian J. Environ. Prot. 2018, 38, 564–577. [Google Scholar]
- FAI. Fertilizer Use and Environmental Quality. Fertilizer Association of India. 2017. Available online: https://www.faidelhi.org/general/Fert-use-Evironmental-quality.pdf (accessed on 5 March 2023).
- Patra, S.; Mishra, P.; Mahapatra, S.C.; Mithun, S.K. Modelling impacts of chemical fertilizer on agricultural production: A case study on Hooghly district, West Bengal, India. Model. Earth Syst. Environ. 2016, 2, 1–11. [Google Scholar] [CrossRef] [Green Version]
- Rahman, K.M.A.; Zhang, D. Effects of fertilizer broadcasting on the excessive use of inorganic fertilizers and environmental sustainability. Sustainability 2018, 10, 759. [Google Scholar] [CrossRef] [Green Version]
- Islam, M.K.; Hossain, M.E. Do farmers use overdose chemical fertilizer in agriculture? Empirical evidence from Northern Bangladesh. Rajshahi Univ. J. Soc. Sci. Bus. Stud. 2017, 25, 63–75. [Google Scholar]
- Tewatia, R.K.; Chanda, T.K. Trends in Fertilizer Nitrogen Production and Consumption in India. Indian Nitrogen Assess. 2017, 45–56. [Google Scholar] [CrossRef]
- Chaudhuri, S.; Ale, S. Long term (1960–2010) trends in groundwater contamination and salinization in the Ogallala aquifer in Texas. J. Hydrol. 2014, 513, 376–390. [Google Scholar] [CrossRef]
- Neog, R. Assessing the impact of chemical fertilizers on soil acidification: A study on Jorhat district of Assam, India. Agric. Sci. Dig. A Res. J. 2018, 38, 270–274. [Google Scholar] [CrossRef]
- Massah, J.; Azadegan, B. Effect of chemical fertilizers on soil compaction and degradation. AMA Agric. Mech. Asia Afr. Lat. Am. 2016, 47, 44–50. [Google Scholar]
- Chaudhuri, S.; Ale, S.; DeLaune, P.; Rajan, N. Spatio-temporal variability of groundwater nitrate concentration in Texas: 1960 to 2010. J. Environ. Qual. 2012, 41, 1806–1817. [Google Scholar] [CrossRef] [Green Version]
- Chaudhuri, S.; Ale, S. Characterization of groundwater resources in the Trinity and Woodbine aquifers in Texas. Sci. Total Environ. 2013, 452–453, 333–348. [Google Scholar] [CrossRef]
- Chaudhuri, S.; Ale, S. An appraisal of groundwater quality in Seymour and Bliane aquifers in a major agro-ecological region in Texas, USA. Environ. Earth Sci. 2014, 71, 2765–2777. [Google Scholar] [CrossRef]
- Nichols, C.E. Inflammatory agriculture: Political ecologies of health and fertilizers in India. Environ. Plan. E Nat. Space 2022, 25148486221113557. [Google Scholar] [CrossRef]
- Sharma, C.; Tiwari, M.K.; Pathak, H. Estimates of emission and deposition of reactive nitrogenous species for India. Curr. Sci. 2008, 94, 1439–1446. [Google Scholar]
- Pathak, H. Is nitrogen fertilizer a polluter or producer? Indian J. Fertil. 2016, 12, 106–117. [Google Scholar]
- Honfoga, B.G. Diagnosing soil degradation and fertilizer use relationship for sustainable cotton production in Benin. Cogent Environ. Sci. 2018, 4, 1422366. [Google Scholar] [CrossRef]
- GoI. Official Memorandum. Department of Fertilizer, No 23011/12/2022-P&K. 2022. Available online: https://www.fert.nic.in/sites/default/files/What-is-new/NBS%20Notification%20Dated%20%202-11-2022.pdf (accessed on 5 March 2023).
- Tewatia, R.K. Policy developments in nitrogenous fertilizers in India. Indian J. Fertil. 2016, 12, 128–136. [Google Scholar]
- Sharma, S.; Kandel, N.; Chaudhary, P.; Rai, P. A Review on Integrated Nutrient Management on Wheat. J. Food Agric. 2020, 1, 32–37. [Google Scholar] [CrossRef]
- Fixen, P.; Brentrup, F.; Bruulsema, T.; Garcia, F.; Norton, R.; Zingore, S. Nutrient/fertilizer use efficiency: Measurement, current situation and trends. In Nutrient/Fertilizer Use Efficiency: Measurement, Current Situation and Trends; IFA: Paris, France, 2014. [Google Scholar]
- Malika, M.; Islam, M.R.; Karim, R.; Huda, A.; Jahiruddin, M. Organic and inorganic fertilizers influence the nutrient use efficiency and yield of a rice variety BINA dhan7. Acad. Res. J. Agric. Sci. Res. 2015, 3, 192–200. [Google Scholar]
- Kakraliya, S.K.; Jat, R.D.; Kumar, S.; Choudhary, K.K.; Pakash, J.; Singh, L.K. Integrated Nutrient Management for Improving, Fertilizer Use Efficiency, Soil Biodiversity and Productivity of Wheat in Irrigated Rice Wheat Cropping System in Indo-Gangetic Plains of India. Int. J. Curr. Microbiol. Appl. Sci. 2017, 6, 152–163. [Google Scholar] [CrossRef]
- Devi, K.N.; Singh, M.S.; Singh, N.G.; Athokpam, H.S. Effect of integrated nutrient management on growth and yield of wheat (Triticumaestivum L.). J. Crop. Weed 2011, 7, 23–27. [Google Scholar]
- Singh, G.D.; Vyas, A.K.; Dhar, S. Productivity and profitability of wheat (Triticumaestivum)-based cropping systems under different nutrient management practices. Indian J. Agron. 2015, 60, 52–56. [Google Scholar]
- Pandey, I.B.; Dwivedi, D.K.; Pandey, R.K. 2009. Integrated nutrient management for sustaining wheat (Triticumaestivum) production under late sown condition. Indian J. Agron. 2009, 54, 306–309. [Google Scholar]
- Subhash, S.P.; Chand, P.; Pavithra, S.; Balaji, S.J.; Pai, S. Pesticide Issues in Indian Agriculture: Trends, Market Structure and Policy Issues; Policy Brief 2017; ICAR—National Institute of Agricultural Economics and Policy Research: New Delhi, India, 2017. [Google Scholar]
- Damalas, C.A.; Koutroubas, S.D. Current status and recent development in bio-pesticide use. Agriculture 2018, 8, 13. [Google Scholar] [CrossRef] [Green Version]
- Gupta, S.; Dikshi, A.K. Biopesticides: An ecofriendly approach for pest control. J. Biopestic. 2010, 3, 186–188. [Google Scholar]
- Pavela, R. Limitation of plant biopesticides. In Advances in Plant Biopesticides; Singh, D., Ed.; Springer: Berlin/Heidelberg, Germany, 2014. [Google Scholar]
- Chandler, D.; Bailey, A.S.; Tatchell, G.M.; Davidson, G.; Greaves, J.; Grant, W.P. The development, regulation and use of biopesticides for integrated pest management. Philos. Trans. R. Soc. London Ser. B Biol. Sci. 2011, 366, 1987–1998. [Google Scholar] [CrossRef] [PubMed]
- Lokesh, G.B.; Patil, S.S.; Amaresh, Y.S. Socio-economic assessment of bio-pesticides application in agriculture. Ecol. Environ. Conserv. 2016, 22, 35–39. [Google Scholar]
- Kandpal, V. Biopesticides. Int. J. Environ. Res. Dev. 2014, 4, 191–196. [Google Scholar]
- Elaoud, A.; Chehaibi, S. Soil compaction due to tractor traffic. J. Fail. Anal. Prev. 2011, 11, 539–545. [Google Scholar] [CrossRef]
- Batey, T. Soil compaction and soil management—A review. Soil Use Manag. 2009, 25, 335–345. [Google Scholar] [CrossRef]
- Beylich, A.; Oberholzer, H.R.; Schrader, S.; Höper, H.; Wilke, B.M. Evaluation of soil compaction effects on soil biota and soil biological processes in soils. Soil Tillage Res. 2010, 109, 133–143. [Google Scholar] [CrossRef]
- Schjønning, P.; van den Akker, J.J.H.; Keller, T.; Greve, M.H.; Lamandé, M.; Simojoki, A.; Breuning-Madsen, H. Driver-Pressure-State-Impact-Response (DPSIR) analysis and risk assessment for soil compaction-A European perspective. Adv. Agron. 2015, 133, 183–237. [Google Scholar]
- Zheng, H.; Liu, W.; Zheng, J.; Luo, Y.; Li, R.; Wang, H.; Qi, H. Effect of long-term tillage on soil aggregates and aggregate-associated carbon in black soil of Northeast China. PLoS ONE 2018, 13, e0199523. [Google Scholar] [CrossRef]
- Chaudhuri, S.; McDonald, L.M.; Pena-Yewtukhiw, E.M.; Skousen, J.; Roy, M. Chemically stabilized soil organic carbon fractions in a reclaimed minesoil chronosequence: Implications for soil carbon sequestration. Environ. Earth Sci. 2013, 70, 1689–1698. [Google Scholar] [CrossRef]
- Liu, M.; Han, G.; Zhang, Q. Effects of soil aggregate stability on soil organic carbon and nitrogen under land use change in an erodible region in Southwest China. Int. J. Environ. Res. Public Health 2019, 16, 3809. [Google Scholar] [CrossRef] [PubMed] [Green Version]
- Chaudhuri, S.; McDonald, L.M.; Pena-Yewtukhiw, E.M. Soil organic carbon molecular properties: Effects of time since reclamation in a reclaimed minesoil chronosequence. Land Degrad. Dev. 2015, 26, 237–248. [Google Scholar] [CrossRef]
- Chaudhuri, S.; Pena-Yewtukhiw, E.M.; McDonald, L.M.; Skousen, J.; Sperow, M. Early C sequestration rate changes for reclaimed minesoils. Soil Sci. 2012, 177, 443–450. [Google Scholar] [CrossRef]
- CWGB. Ground Water Yearbook—India 2016–2017; Central Ground Water Board: Faridabad, India, 2017. [Google Scholar]
- Chaudhuri, S.; Roy, M. Drinking water sources in India: How safe is Safe? Curr. Sci. 2017, 113, 393–402. [Google Scholar] [CrossRef]
- Chaudhuri, S.; Roy, M. Overview of rural water supply sector in West Bengal, India: Challenges and concerns. Int. J. Innov. Res. Sci. Eng. Technol. 2016, 5, 9768–9777. [Google Scholar]
- Chaudhuri, S.; Roy, M. Reflections on groundwater quality and urban-rural disparity in drinking water sources in Haryana, India. Int. J. Sci. Res. Dev. 2016, 4, 837–843. [Google Scholar]
- Chaudhuri, S.; Ale, S. Temporal evolution of depth-stratified groundwater salinity in municipal wells in the major aquifers in Texas, USA. Sci. Total Environ. 2014, 472, 370–380. [Google Scholar] [CrossRef]
- Chaudhuri, S.; Ale, S. Evaluation of Long-term (1960–2010) Groundwater Fluoride Contamination in Texas. J. Environ. Qual. 2014, 43, 1404–1416. [Google Scholar] [CrossRef] [PubMed] [Green Version]
- Ankita, P.V.; Chaudhuri, S. What do farmers don’t know? A Generic Index to Summarize Cognitive Awareness of Groundwater sourced Irrigation and Conservation at grass roots. Ecol. Environ. Conserv. 2022, 28, 179–192. [Google Scholar]
- Parakh, D.; Chaudhuri, S. Groundwater regulation bills in Haryana—A call for groundwater conservation and management for sustainable irrigation supply services—Opportunities and challenges. Ecol. Environ. Conserv. 2022, 28, 147–164. [Google Scholar]
- Chaudhuri, S.; Roy, M. Irrigation water pricing in India as a means to conserve water resources: Challenges and Potential future directions. Environ. Conserv. 2019, 46, 99–102. [Google Scholar] [CrossRef] [Green Version]
- Chaudhuri, S.; Roy, M.; McDonald, L.M.; Emendack, Y. Reflections on farmers’ social networks: A means for sustainable agricultural development? Environ. Dev. Sustain. 2021, 23, 2973–3008. [Google Scholar] [CrossRef]
- Chaudhuri, S.; Parakh, D.; Roy, M.; Kaur, H. Groundwater-sourced irrigation and agro-power subsidies: Boon or bane for small/marginal farmers in India? Groundw. Sustain. Dev. 2021, 15, 100690. [Google Scholar] [CrossRef]
- Patrício, J.; Elliott, M.; Mazik, K.; Papadopoulou, K.; Smith, C.J. DPSIR—Two decades of trying to develop a unifying framework for marine environmental management? Front. Mar. Sci. 2016, 3, 177. [Google Scholar] [CrossRef] [Green Version]
- Gaiha, R.; Kaicker, N.; Imai, K.; Kulkarni, V.S.; Thapa, G. Dietary Shift and Diet Quality in India: An Analysis Based on 50th, 61st and 66th Rounds of NSS. ASARC. 2012. Available online: https://taxpolicy.crawford.anu.edu.au/acde/asarc/pdf/papers/2012/WP2012_17.pdf (accessed on 5 March 2023).
- Westhoek, H.; Lesschen, J.P.; Rood, T.; Wagner, S.; De Marco, A.; Murphy-Bokern, D.; Oenema, O. Food choices, health and environment: Effects of cutting Europe’s meat and dairy intake. Glob. Environ. Chang. 2014, 26, 196–205. [Google Scholar] [CrossRef] [Green Version]
- Bouwman, L.; Goldewijk, K.K.; Van Der Hoek, K.W.; Beusen, A.H.W.; Van Vuuren, D.P.; Willems, J.; Stehfest, E. Exploring global changes in nitrogen and phosphorus cycles in agriculture induced by livestock production over the 1900–2050 period. PNAS 2013, 110, 20882–20887. [Google Scholar] [CrossRef] [Green Version]
- Aleksandrowicz, L.; Green, R.; Joy, E.J.M.; Smith, P.; Haines, A. The impacts of dietary change on greenhouse gas emissions, land use, water use, and health: A systematic review. PLoS ONE 2016, 11, e0165797. [Google Scholar] [CrossRef] [Green Version]
- Chakraborty, P.; Das, B.S.; Vasava, H.B.; Panigrahi, N.; Santra, P. Spatial structure, parameter nonlinearity, and intelligent algorithms in constructing pedotransfer functions from large-scale soil legacy data. Sci. Rep. 2020, 10, 1–13. [Google Scholar] [CrossRef] [PubMed]
- Minasny, B.; McBratney, A.B.; Malone, B.P.; Wheeler, I. Digital Mapping of Soil Carbon. Adv. Agron. 2013, 118, 1–47. [Google Scholar]
- Minasny, B.; Hartemink, A.E. Predicting soil properties in the tropics. Earth Sci. Rev. 2011, 106, 52–62. [Google Scholar] [CrossRef]


| Farm Operation Type | Parameter | Spatial Extent | Temporal Extent |
|---|---|---|---|
| Agrochemical Applications |
| ** | Yearly, between 2002–2003 and 2015–2016 |
| ** | Yearly, between 2004–2005 and 2011–2012 | |
| ** | Computed from the above for 2011–2012 period | |
| Tillage Operations |
| ** | Yearly, between 1992 and 2012 |
| ** | Computed for 2012 | |
| Irrigation |
| ** | 2011–2012 |
| Groundwater Usage |
| * | Yearly, 1970–2014 |
| Summary Statistic | Nationwide (29 States) | Regional (11 States) |
|---|---|---|
| Constant | 0.083 | 3.042 |
| Multiple R | 0.320 | 0.705 |
| R2 | 0.102 | 0.497 |
| Adjusted R2 | 0.101 | 0.497 |
| Standard Error | 0.158 | 0.063 |
| F-statistic | 56.351 | 106.027 |
| Significance | 0.231 | 0.018 |
| National (29 States) | Regional (11-State Cluster) | |||||||||
|---|---|---|---|---|---|---|---|---|---|---|
| Soil–Water Parameters | a | t-Value | VIF | Residual | Error | a | t-Value | VIF | Residual | Error |
| NPK application rate | 0.114 | 1.950 | 2.661 | 0.2387 | −1.241 | 0.829 | 15.243 § | 3.820 | 0.2804 | −0.758 |
| Chemical pesticide area | 0.102 | 0.761 | 3.017 | −0.5386 | −3.190 | 0.204 | 1.867 | 2.116 | −0.6139 | −0.902 |
| Bio-pesticide area | 0.029 | −0.033 | 2.250 | −1.6362 | −1.121 | 0.317 | −6.362 * | 2.439 | −1.2915 | −0.826 |
| BioPest:CHPest ratio | 0.038 | −0.052 | 1.833 | 1.2807 | −0.926 | 0.483 | −8.402 * | 1.318 | 1.3698 | −0.706 |
| Moldboard (Mp) | 0.161 | 1.108 | 3.410 | 1.2107 | −3.503 | 0.925 | 16.026 § | 2.280 | 1.2871 | −1.395 |
| Tractor (Tr) | 0.142 | 1.005 | 1.802 | 0.9232 | −4.660 | 0.561 | 7.917 § | 3.304 | 0.9726 | −1.884 |
| Power tiller (Pt) | 0.073 | 0.821 | 1.446 | −0.7337 | −3.296 | 0.452 | 4.034 * | 3.120 | −0.7887 | −2.304 |
| Strip tiller (St) | 0.048 | 0.519 | 2.904 | −0.8548 | −4.152 | 0.118 | 0.896 | 1.728 | −0.9086 | −2.050 |
| Zero-till drill (Ztd) | 0.174 | 0.620 | 3.060 | 0.1765 | −4.940 | 0.883 | −11.66 § | 2.930 | 0.1833 | −1.672 |
| Ztd/(Mp + Tr + Pt + St) | 0.383 | −4.040 * | 2.293 | 0.7759 | −1.553 | 0.806 | −14.19 § | 3.185 | 0.8101 | −1.037 |
| Net irrigated area | 0.112 | 1.036 | 3.500 | −0.0578 | −3.251 | 0.442 | 6.180 * | 3.608 | −0.0636 | −0.926 |
| Area cropped once | 0.142 | 0.179 | 1.920 | 0.4353 | −2.538 | 0.209 | 1.037 | 2.200 | 0.5098 | −1.860 |
| Area cropped twice | 0.195 | 0.182 | 2.205 | −1.1046 | −3.220 | 0.609 | 9.037 § | 3.020 | −1.1734 | −1.553 |
| Area cropped twice+ | 0.225 | 1.514 | 3.138 | −0.8569 | −1.640 | 0.862 | 11.253 § | 1.671 | −0.9110 | −2.082 |
| % GW-sourced NIA | 0.481 | 5.042 * | 3.552 | −0.1282 | −1.052 | 0.632 | 8.460 § | 2.830 | −0.1453 | −0.801 |
| % Wells (WL drops) | 0.307 | 4.46 * | 3.049 | −0.6995 | −0.960 | 0.780 | 12.471 § | 4.941 | −0.8941 | −0.730 |
| Soil Systems Processes | Potential Impacts on Agricultural Sustainability/Productivity |
|---|---|
| Erosion |
|
| Soil Salinity |
|
| Waterlogging |
|
| Parameter | Significance Towards LDD | |
|---|---|---|
| Tillage |
|
|
| Land Management Practices |
|
|
| Soil Quality |
|
|
| Fertility |
|
|
| Water |
|
|
| Livestock |
|
|
| Parameter | Significance towards LDD |
|---|---|
| Socio-demographic Traits | |
| Circumstantial characteristics to develop context-relevant initiatives at land conservation and LDD prevention |
| Resource Exploitation Patterns | |
| Water exploitation status Development of context-relevant natural resource conservation and utilization protocols |
| Public Support System | |
| Moving towards more land-conservation-centric practices to ensure long-term ecosystem services from land-based natural capital |
Disclaimer/Publisher’s Note: The statements, opinions and data contained in all publications are solely those of the individual author(s) and contributor(s) and not of MDPI and/or the editor(s). MDPI and/or the editor(s) disclaim responsibility for any injury to people or property resulting from any ideas, methods, instructions or products referred to in the content. |
© 2023 by the authors. Licensee MDPI, Basel, Switzerland. This article is an open access article distributed under the terms and conditions of the Creative Commons Attribution (CC BY) license (https://creativecommons.org/licenses/by/4.0/).
Share and Cite
Chaudhuri, S.; Roy, M.; McDonald, L.M.; Emendack, Y. Land Degradation–Desertification in Relation to Farming Practices in India: An Overview of Current Practices and Agro-Policy Perspectives. Sustainability 2023, 15, 6383. https://doi.org/10.3390/su15086383
Chaudhuri S, Roy M, McDonald LM, Emendack Y. Land Degradation–Desertification in Relation to Farming Practices in India: An Overview of Current Practices and Agro-Policy Perspectives. Sustainability. 2023; 15(8):6383. https://doi.org/10.3390/su15086383
Chicago/Turabian StyleChaudhuri, Sriroop, Mimi Roy, Louis M. McDonald, and Yves Emendack. 2023. "Land Degradation–Desertification in Relation to Farming Practices in India: An Overview of Current Practices and Agro-Policy Perspectives" Sustainability 15, no. 8: 6383. https://doi.org/10.3390/su15086383