Article

Numerical Analysis of an Aerofoil Fin Integrated Double Pass Solar Air Heater for Thermal Performance Enhancement

by
Madhwesh Nagaraj
,
Manu Krishna Reddy
,
Arun Kumar Honnesara Sheshadri
and
Kota Vasudeva Karanth
*
Department of Mechanical and Industrial Engineering, Manipal Institute of Technology, Manipal Academy of Higher Education, Manipal 576104, Karnataka, India
*
Author to whom correspondence should be addressed.
Sustainability 2023, 15(1), 591; https://doi.org/10.3390/su15010591
Submission received: 16 November 2022 / Revised: 7 December 2022 / Accepted: 15 December 2022 / Published: 29 December 2022

Abstract

:
The Solar Air Heater (SAH) is considered to be one of the promising devices for the utilization of solar radiation. Extracting more heat to the flowing air is the focus of researchers, and many novel ideas are adopted to improve the efficiency of such collectors. The objective of the present work is the enhancement of thermal performance using a numerical analysis of a single flow double pass solar air heater with two types of arrangements of aerofoil fin configurations. The effect of the aerofoil fin configurations and the height of the fin are investigated for their thermal and thermohydraulic efficiencies. The height of the fin varied parametrically for the Reynolds number ranging from 3000 to 24,000 by keeping the axial pitch of the fin as a constant. It is found that the thermal efficiency increases with the increase in fin height due to an increased flow turbulence causing more absorption of heat to the working fluid. However, it is seen that the varying height of the fin beyond a certain height has yielded an adverse effect in terms of lesser thermal efficiency due to the expected flow blockage in the main stream. The thermohydraulic efficiency increases as the height of the fin decreases. The Computational Fluid Dynamics (CFD) results revealed that the optimum aerofoil fin configuration yields approximately a 23.24% higher thermal efficiency when compared with that of the single pass solar air heater (base model). The thermohydraulic efficiency exceeds the optimum aerofoil fin configuration compared with the base model by approximately 20.94%.

1. Introduction

A solar air heater (SAH) is a renewable energy device that utilizes the energy from the sun; insolation is captured by an absorbing medium as solar radiation and transformed into usable energy. SAH is one of the solar energy applications that has been aggressively employed to capture a substantial amount of the supply of solar radiation for home, agricultural, and industrial needs. For some of the applications, SAH captures more energy compared to the liquid collector, as it avoids the consequences of boiling and evades deterioration by water bodies.
As the conversion efficiency is relatively lower for SAH systems, many researchers have attempted to improve the performance of these systems either experimentally or numerically. They have incorporated various turbulence promoting devices such as fins, turbulators, splitters, etc. [1,2,3]. A computational simulation work was carried out by adding the inclined fins to the absorber plate to analyze the turbulence and heat transfer coefficient of SAH by Qader et al. [4]; the RNG k-ε model was used for the simulation with 12 different fin configurations and six different Re values ranging from 4000 to 24,000. A maximum THPP of 1.916 for the angle of 45°, p = 20 mm at Re = 20,000, was achieved. A numerical analysis was carried out by Patel et al. [5], with a unique roughness element in the shape of a reverse NACA 0040 profile rib. The performance of SAH was carried out by different parameters such as pitch to height ratio and height to diameter ratio, with a varying Re ranging from 6000 to 18,000. Two different configurations were used for analysis: forward facing aerofoil and reverse facing aerofoil, for a range from 6000 to 18,000, pitch to height ratio of 5 and 13.33, and height to diameter ratio = 0.043 to 0.13. An RNG k-ε model was used for CFD simulation. It was found that for a reverse and forward-facing aerofoil, the THPP was 2.53 and 2.09 at Re = 6000. Thus, the reverse-facing aerofoil performed better. CFD investigation of SAH by varying the bottom area of the air duct was carried out by Choi and Choi [6]. A transverse triangle block was attached to the bottom of the SAH for improving the heat transfer characteristics. RNG k-ε was utilized for the turbulence model. A CFD analysis was carried out for the range of Re 8000 to 20,000 and varying parameters. They found that as the height increases, friction factor increases significantly. They also reported that as height increases the THPP increases intially at lower mass flow rates and then gradually decreases for larger mass flow rates. A numerical study on transverse inverted T-shaped ribs by Mahanand and Senapati et al. [7] focused on the flow field and heat transfer in the SAH duct. To improve the rate of heat transmission in the SAH, computation was done by altering non-dimensional parameters. ANSYS Fluent was used to perform the numerical simulations. The turbulent model used was the Renormalization-group (RNG) k-ε. It was found that the Thermal enhancement factor (TEF) is optimized at 1.86 for SAH with inverted-T rib.
The experimental and numerical studies on the different fin configurations in DPSAH by S. Singh. [8] focused on the improvement of thermal performance with different arrangements of fins such as inline, staggered, and hybrid. They have varied the geometrical parameters of the fin configuration angle from 30° to 90°, a length of 0.007–0.028 m, a height of 0.007–0.014 m, and a hydraulic diameter = 0.029 m and 0.057 m, with a range of Re = 3000 to 24,000. In comparison to a single air pass, experimental data showed that a double air pass (counter flow) has the optimum thermal performance. In the hybrid staggered layout, the shorter length fin was found to yield better results. The numerical thermal performances for hybrid staggered fins were about 3.8% and 3.5% better compared to inline and staggered configurations, respectively. An experimental study on a trapezoidal DPSAH with natural and forced air circulation by Salih et al. [9] focused on improving the thermal performance of SAH by using trapezoidal fins on both sides of the absorber plate. They evaluated the impact of the impact of solar radiation and the mass flow rate of air on DPSAH performance. They concluded that the maximum efficiency was 73.5% for natural circulation and 64% for forced air circulation. Furthermore, the MFR of air for natural convection was nearly 3 times lesser than it was for forced convection. A new concept for a counter-flow, curved, double-pass solar air heater was proposed by Amit Kumar et al. [10]. Under various flow and geometric situations, its performance characteristics are quantitatively examined and compared with those of several parallel designs. According to their research, the counter-flow curved DPSAH with turbulators arranged symmetrically is thermally superior to other designs. The thermal performance was increased by a maximum of 23% in this setup. Analytical research on the thermal and thermohydraulic properties of various double pass solar air heaters (DPSAHs) with three flow channels was conducted by Ahmadkhani et al. [11]. The analyses were carried out at various reflux ratios between 0.1 and 1, as well as at air mass flow rates of 0.01, 0.015, and 0.025 kg/s. An analysis was done on the consequences of upstream and downstream recycling patterns. The results showed that, for the downward recycling pattern, the use of a matrix increases the DPSAH’s thermal efficiency, exhibiting a thermal efficiency of 79%; however, at high mass flow rates and reflux ratios, it reduces its thermohydraulic efficiency and incurs significant fan power costs.
Experimental research by Sharol et al. [12] examined the impact of thermal energy storage material inside the tube of a double-pass solar air heater with a cross-matrix absorber (DPSAH-CMA). The constructed SAH was put to the test in a range of operational circumstances both inside and outside. At a mass flow rate of 0.005 kg/s, it was discovered that the DPSAH-CMA with PCM achieves a superior thermal buffer of 0.81 C/min compared to the one without PCM. When compared to the one without PCM, DPSAH-CMA-with PCM’s cumulative heat rate increased, reaching a maximum value of 1548.54 W with greater solar radiation of 900 W/m2. Singh et al. [13] presented the experimental and numerical results of their inquiry into the thermal performance of a porous serpentine wavy wire-mesh packed bed solar air heater. The thermal and thermohydraulic efficiencies were found to be 18% and 17% higher for 93% porous double pass serpentine packed bed solar air heaters when compared to that of the single pass respectively. On the other hand, a CFD tool is used for a numerical investigation, and the outcomes are confirmed by experimental data. On the basis of THPP and exergy efficiency, the range of porosity from 85% to 95%, wavelength from 0.05 m to 0.075 m, amplitude from 0.012 m to 0.016 m, hydraulic diameter from 0.025 m to 0.046 m, and mass flow rate from 0.01 to 0.05 kg/s is taken into consideration in order to obtain the best values for geometrical and flow parameters. When compared to a flat packed bed solar air heater, the numerical results show a maximum 24.33% improvement in thermohydraulic performance for a serpentine packed bed solar air heater. Tandel et al. [14] conducted research on a solar combi-system for producing hot water for home purposes and enhanced temperature air for Solar Air Heater (SAH)-based applications. Two identical double-pass SAHs were made, one without augmentation and the other with augmentation of the vertical plate perforated baffles on the absorber plate and the pipe transporting hot water over the bottom plate, in order to meet the goal of the solar combi-system. To examine the thermal performance of both SAHs, experiments were conducted for three consecutive days in each case, with air flowing upward and downward. In the case of the downward flow of air, it was discovered that the thermal performance of the enhanced SAH was superior to that of the conventional one.
From the literature study, various researchers have explored different types of turbulators, fins, and double pass arrangements for improving the thermo-hydraulic performance. It was observed that the maximum thermo-hydraulic performance was about 2.35 for V-shaped rib SAH and the maximum efficiency was about 83% for the corrugated-perforated fin absorber plate of a DPSAH. It is clear from the literature that a single flow DPSAH with an aerofoil fin configuration has not been a focus of study so far, hence an attempt is being made in this study to explore the effect of aerofoil fin inside a single flow DPSAH for improving thermal performance.

2. Experimental Analysis

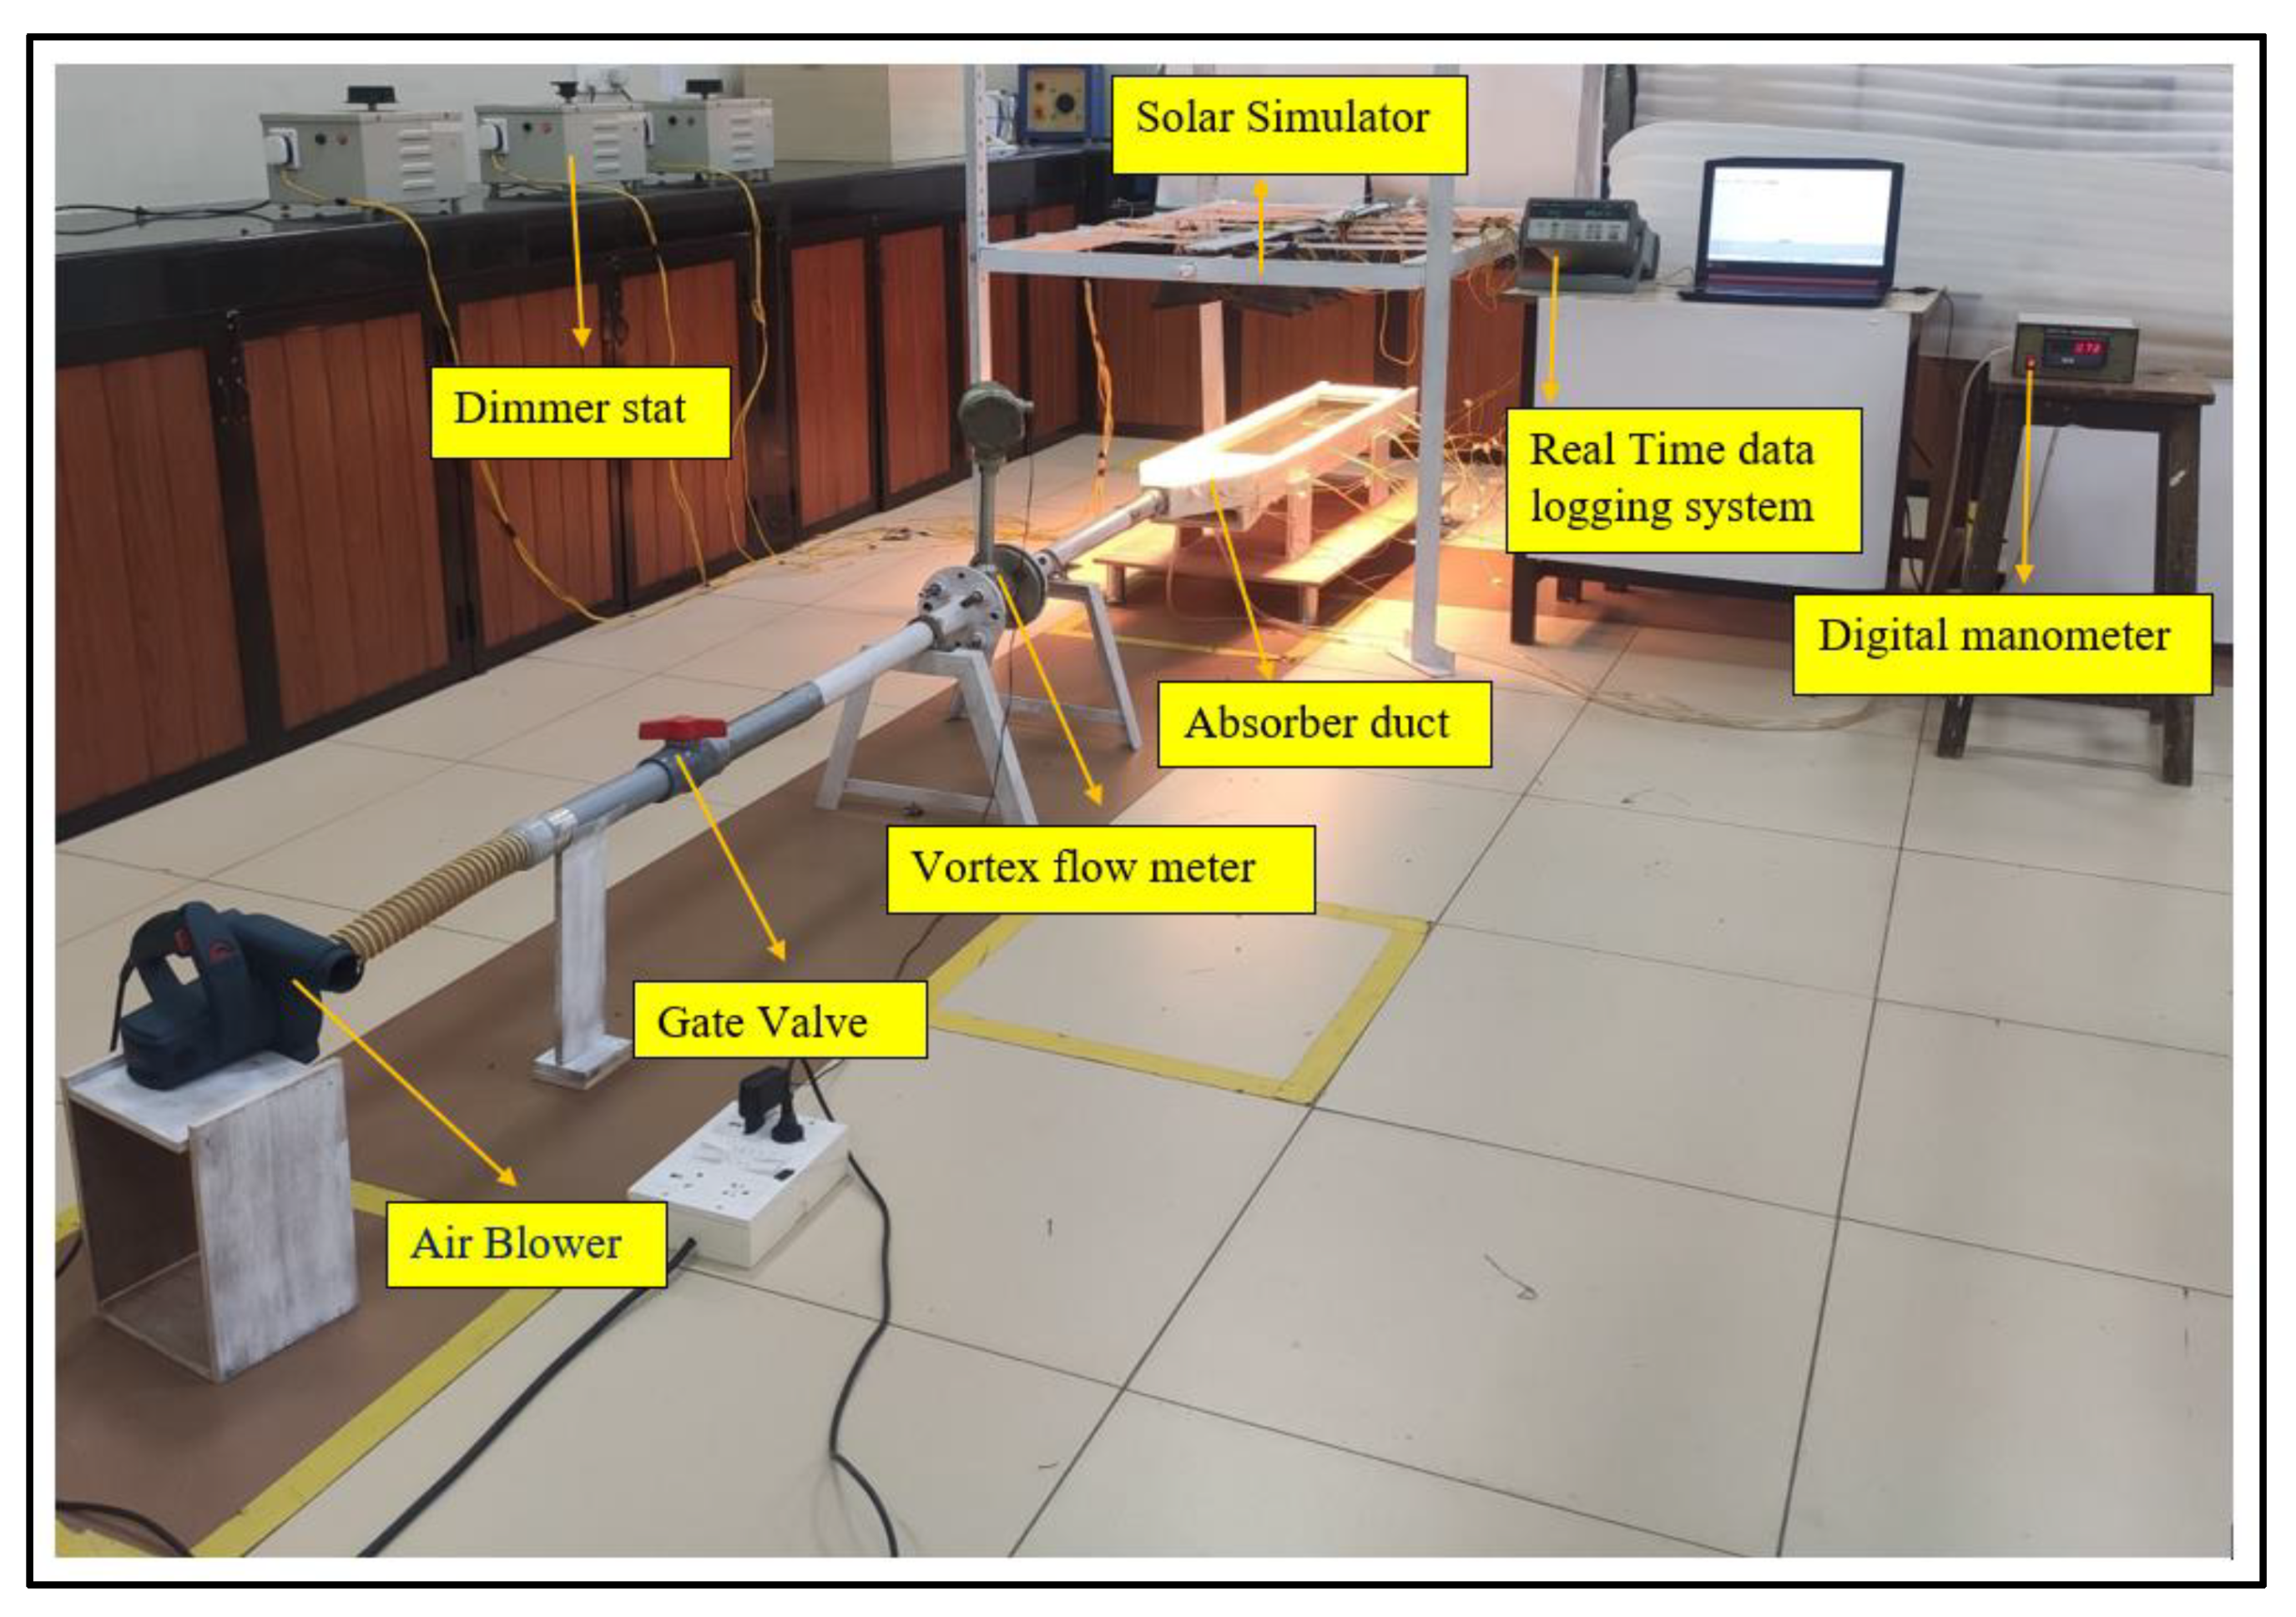
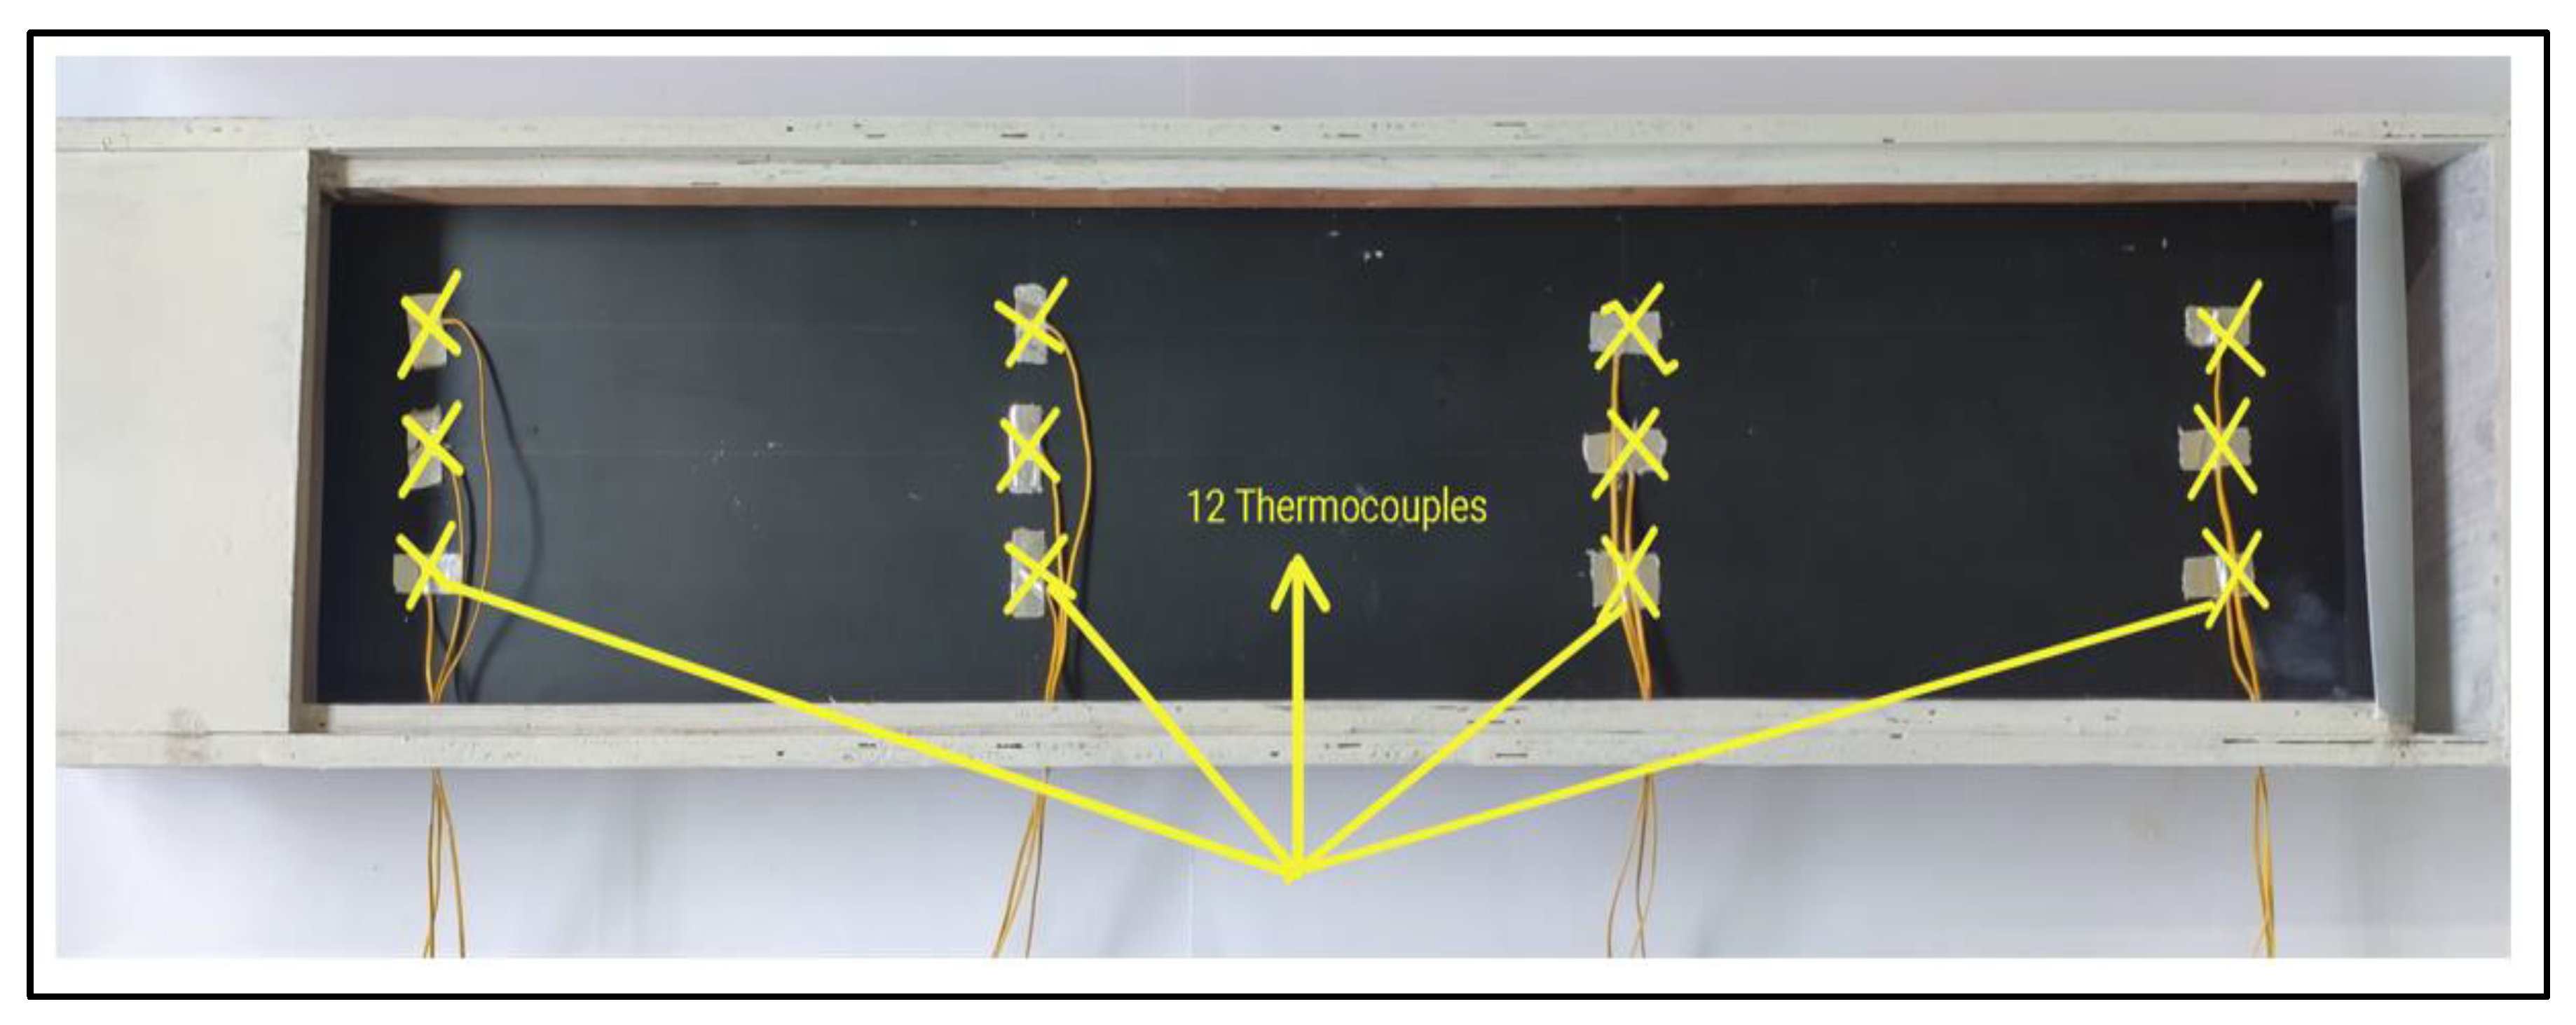
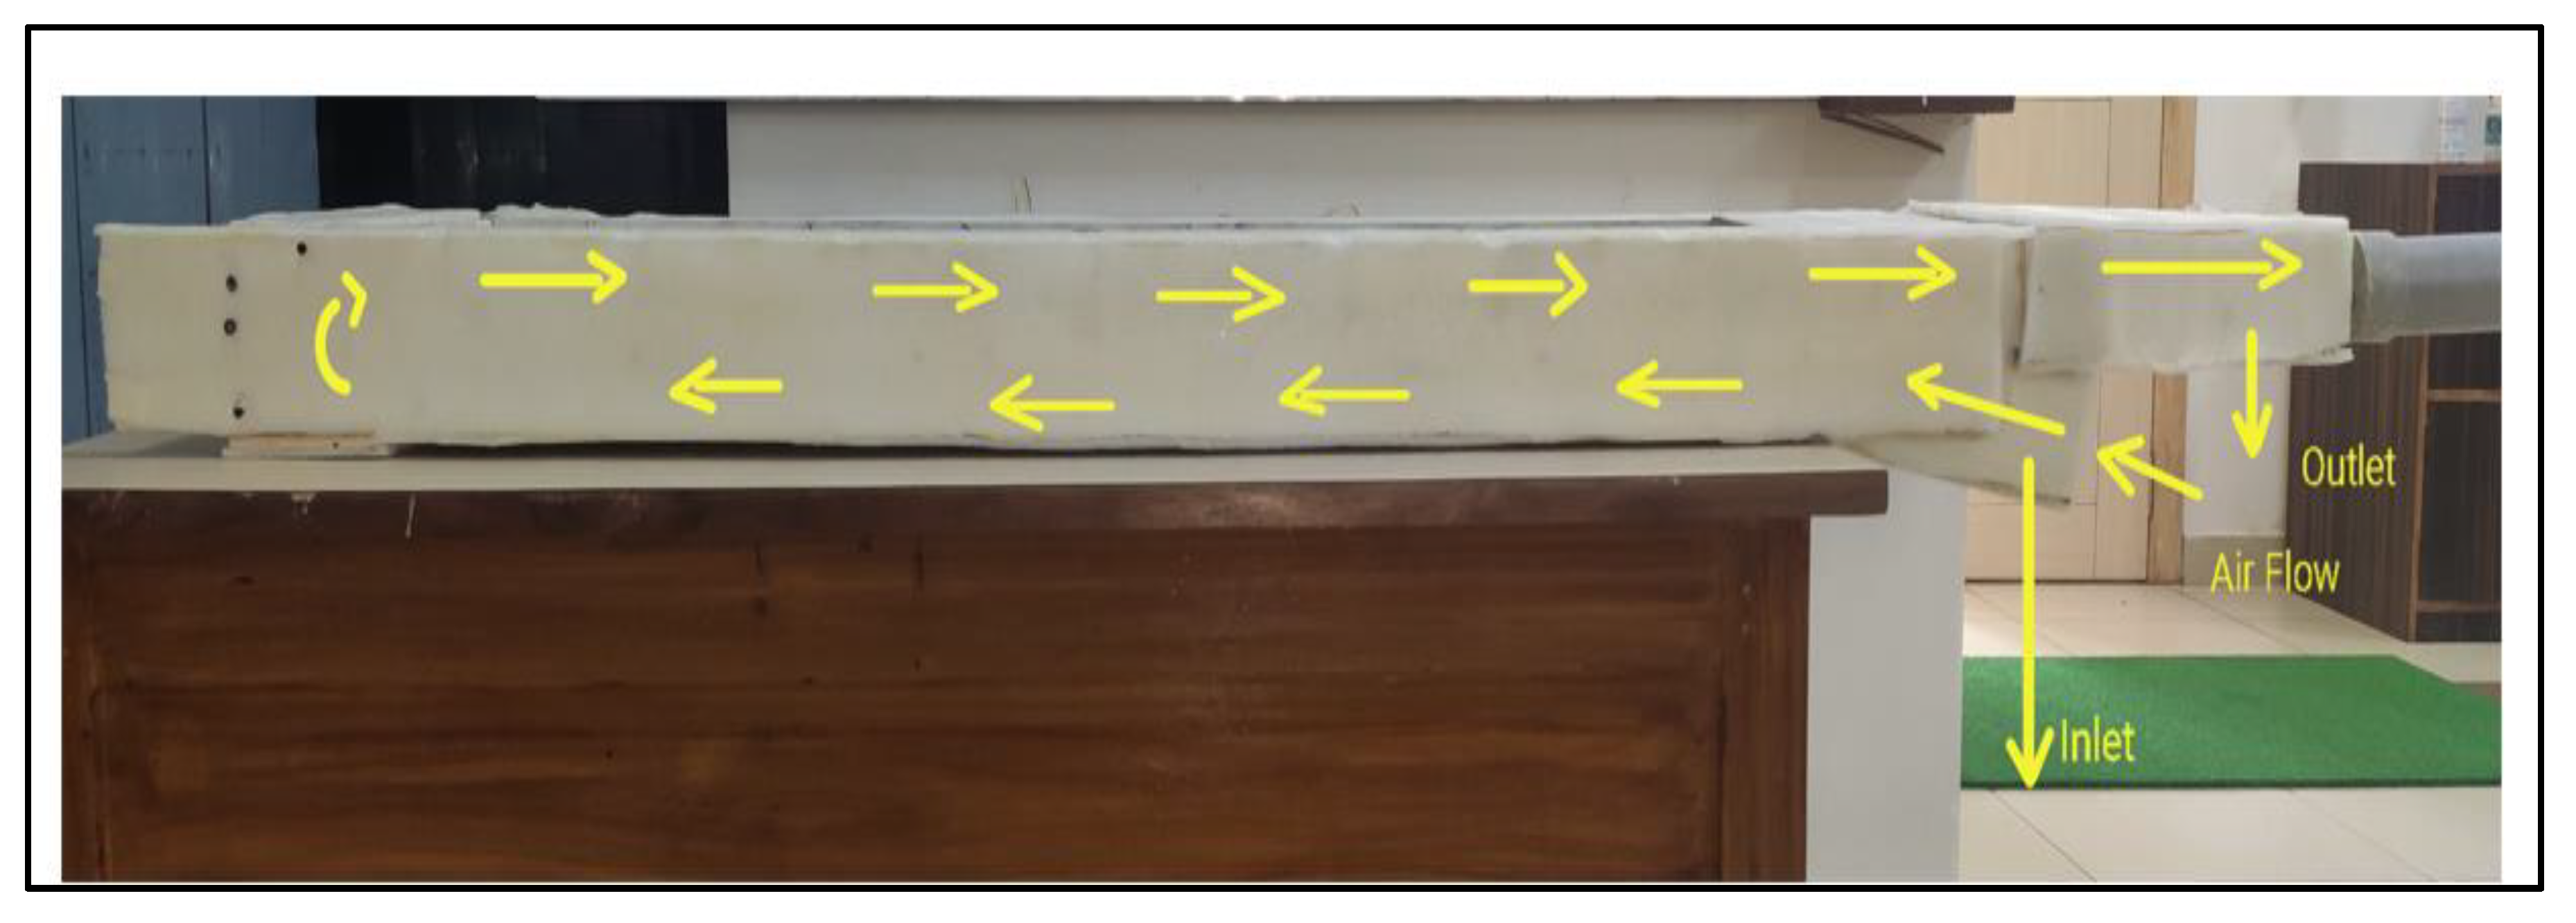
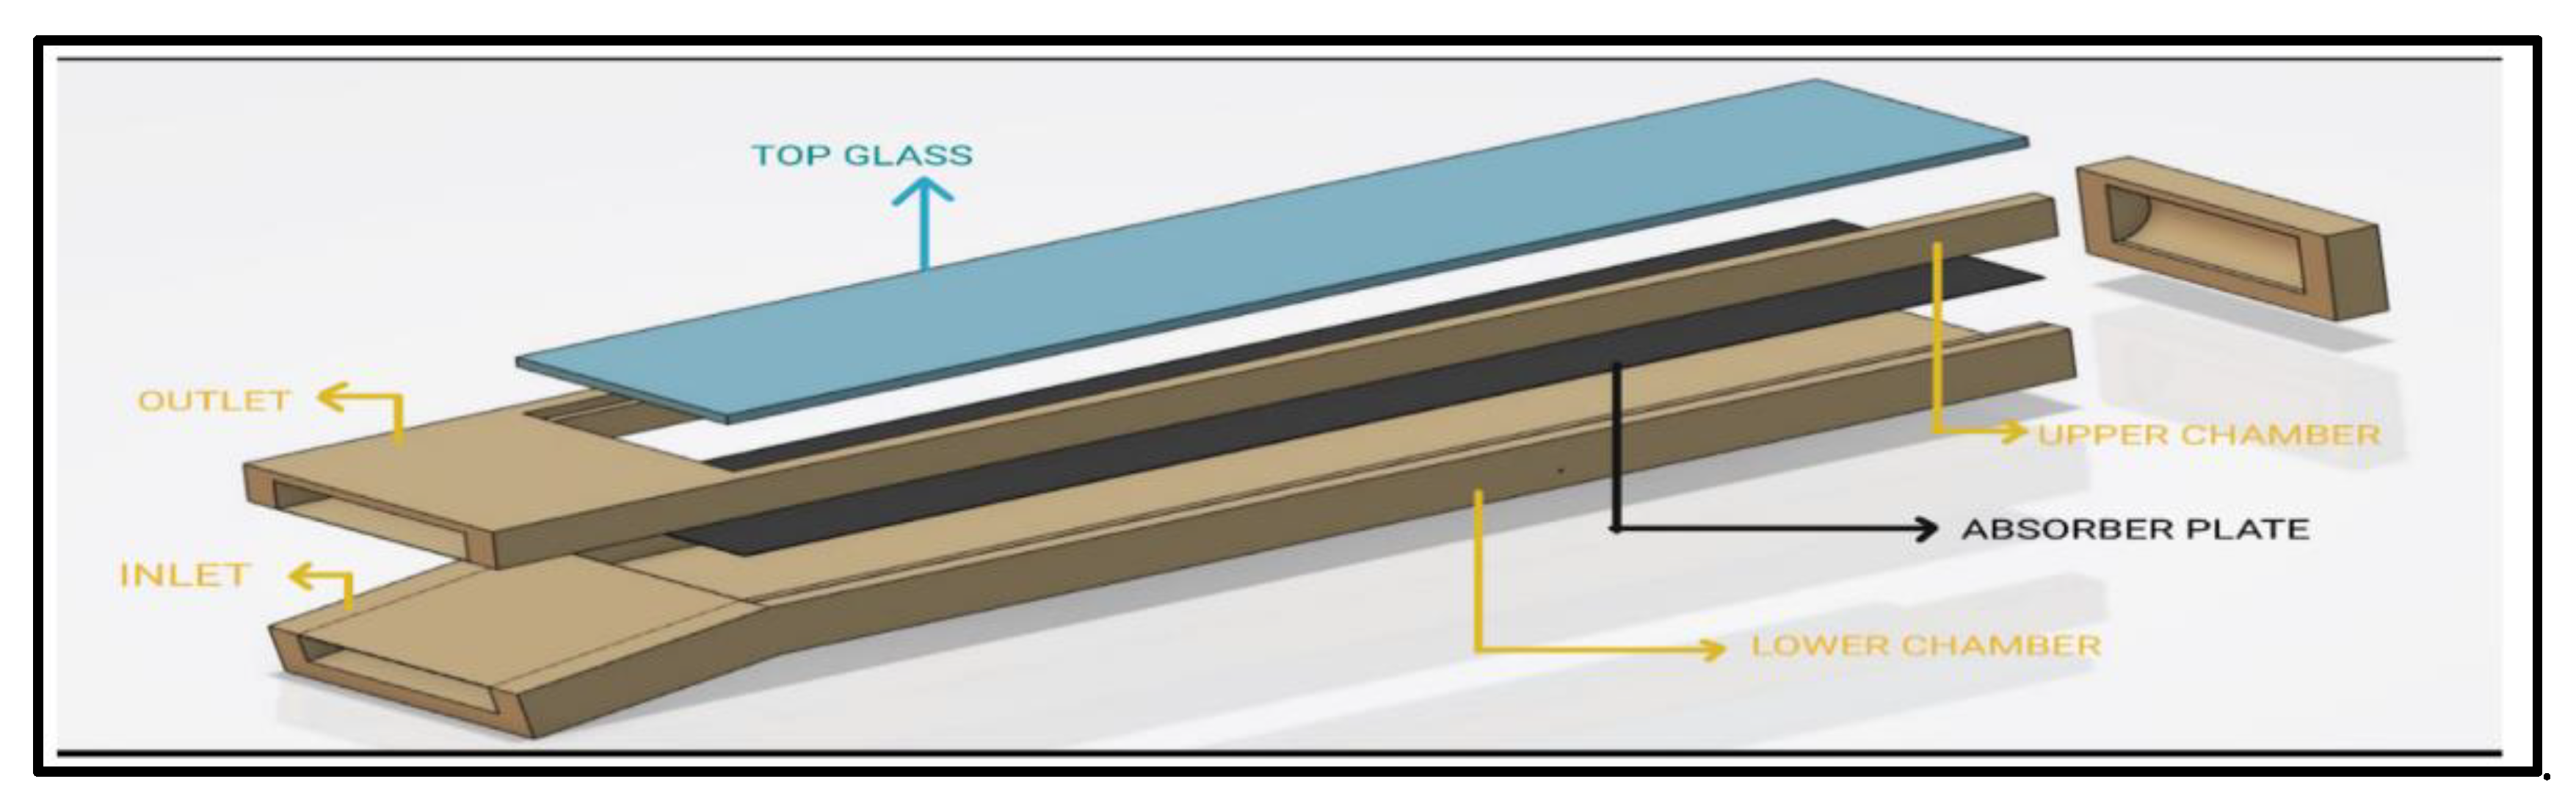
2.1. Experimental Setup

The experimental setup for the DPSAH employed in this investigation is shown in Figure 1. The experimental model is made of wood with a thickness of 12 mm size and polystyrene foam is provided for insulation over the model to prevent heat loss from the absorber duct to the surroundings. The model has two sections in which the inlet duct of the 10-degree inclined angle is attached to the bottom chamber and the outlet duct is attached to the upper chamber. The absorber duct is made up of wood with the dimensions 1000 mm × 200 mm × 30 mm. In the bottom chamber inside the absorber duct, glossy laminates are applied to reduce surface skin friction loss by the wood surface. In order to connect the bottom and upper chamber, a smooth semicircle-shaped wooden block of 60 mm curvature is placed. An absorber plate of 1mm thickness is coated with matte finish black paint to absorb the radiation and is placed between the bottom and upper chamber.
For the continuous flow of air inside the absorber duct, the blower is connected to the exit duct. A gate valve is used for controlling the flow rate, and a vortex flowmeter is used to measure the flow rate. The pressure drop across the air heater is measured using a digital manometer connected between the inlet duct and the exit duct, at a distance of 50 mm from each of the end points. Twelve ‘K’ type thermocouples are installed at specific locations on the absorber plate to capture the average temperature, as shown in Figure 2. An RTD thermocouple is used to measure the temperatures of the incoming and outgoing air. The pressure drop across the duct induced by flow resistance is monitored using a digital manometer. A solar simulator is used to replicate the heat flux from solar insolation. The solar simulator has twelve halogen lights, with three dimmer stats controlling the intensity. The direction of air flow is depicted in Figure 3.

2.2. Experimental Procedure

Experimental work is carried out on the smooth duct with a single flow double pass SAH. The experiments are conducted at the atmospheric conditions in the laboratory of the institute. Suction is created by the use of a portable centrifugal. Using a butterfly valve, various mass flow rates of air ranging from 0.00651 kg/s to 0.04614 kg/s are employed. The dimmerstat of the simulator is adjusted to obtain the desired heat flux of 950 W/m2. This heat flux is equivalent to the solar radiation imparted at the local region and is maintained constant for all the mass flow rate conditions. The data logger records the air entrance temperature, exit air temperature, and pressure for every mass flow rate with a steady-state condition. A digital manometer is used to track the differential pressure.

2.3. Data Reduction

Experimental trials on the DPSAH have been carried out for various values of inlet mass flow rates of air. Thermal efficiency and thermohydraulic efficiency are computed for every mass flow rate using the associated property values at the inlet and outlet regions of the duct.
The hydraulic diameter is calculated as per Equation (1).
D h = 4 A p
The mass flow rate in terms of Re number is given by Equation (2)
m ˙ = Re   ×   A   ×   μ D h
By knowing the temperatures of the absorber plate (Tab), Glass cover (Tg), ambient (Tamb), inlet (Ti), and outlet (T0), and pressure at the inlet (Pin) and outlet (Pout) of SAH, thermal efficiency can be calculated using Equation (3).
η t h e r m a l = m ˙ C p ( T 0 T i ) I T A c
The pumping power (Pm) is computed by using Equation (4) and is given by
P m = m ˙ Δ p ρ
Thermo-hydraulic efficiency is calculated using Equation (5) and is given by
η t h e r m o h y d r a u l i c = m ˙ C p ( T 0 T i ) P m C I T A c
In Equation (5), C is a factor based on the total efficiency of converting thermal to mechanical energy to run the air blower, and the value is assumed to be 0.18 [15].

2.4. Experimental Uncertainty Analysis

The uncertainty for thermal and thermo-hydraulic efficiency is estimated for various configurations employed in the study using the relation employed by Arun Kumar et al. [16].
R is a parameter that depends on multiple independent variables such as mass, temperature, width, length, and heat flux due to radiation. The uncertainty WR of the output variable R is given by Equation (6).
W R = i = 1 n ( δ R δ x i × W i ) 2
where W1, W2, W3, …,Wn are the measurement of uncertainties for the independent variables chosen in the study. Table 1 depicts the uncertainty values for the chosen variables.
Based on the above equation, the uncertainty level for the thermal efficiency for the present study is calculated using Equation (7).
W η t h η t h = [ ( W m ˙ m ˙ ) 2 + ( W Δ T Δ T ) 2 + ( W w w ) 2 + ( W L L ) 2 + ( W I I ) 2 ] 0.5
Similarly, the uncertainty equation for the thermo-hydraulic efficiency is given by Equation (8).
W η t h e r m o h y d r a u l i c η t h e r m o h y d r a u l i c = [ ( W m ˙ m ˙ ) 2 + ( W Δ T Δ T ) 2 + ( W w w ) 2 + ( W L L ) 2 + ( W I I ) 2 + ( W d p p ) 2 ] 0.5
It is found from the uncertainty analysis that the average percentage uncertainty values for thermal efficiency and thermohydraulic efficiency are 1.76% and 1.80%, respectively, for the range of Reynolds numbers used in the experiments.

3. Numerical Analysis

A numerical analysis was performed for the validation of the experimental results. A detailed description of CFD model, numerical setup, boundary conditions, governing equations, grid independency test and validation studies were undertaken as follows.

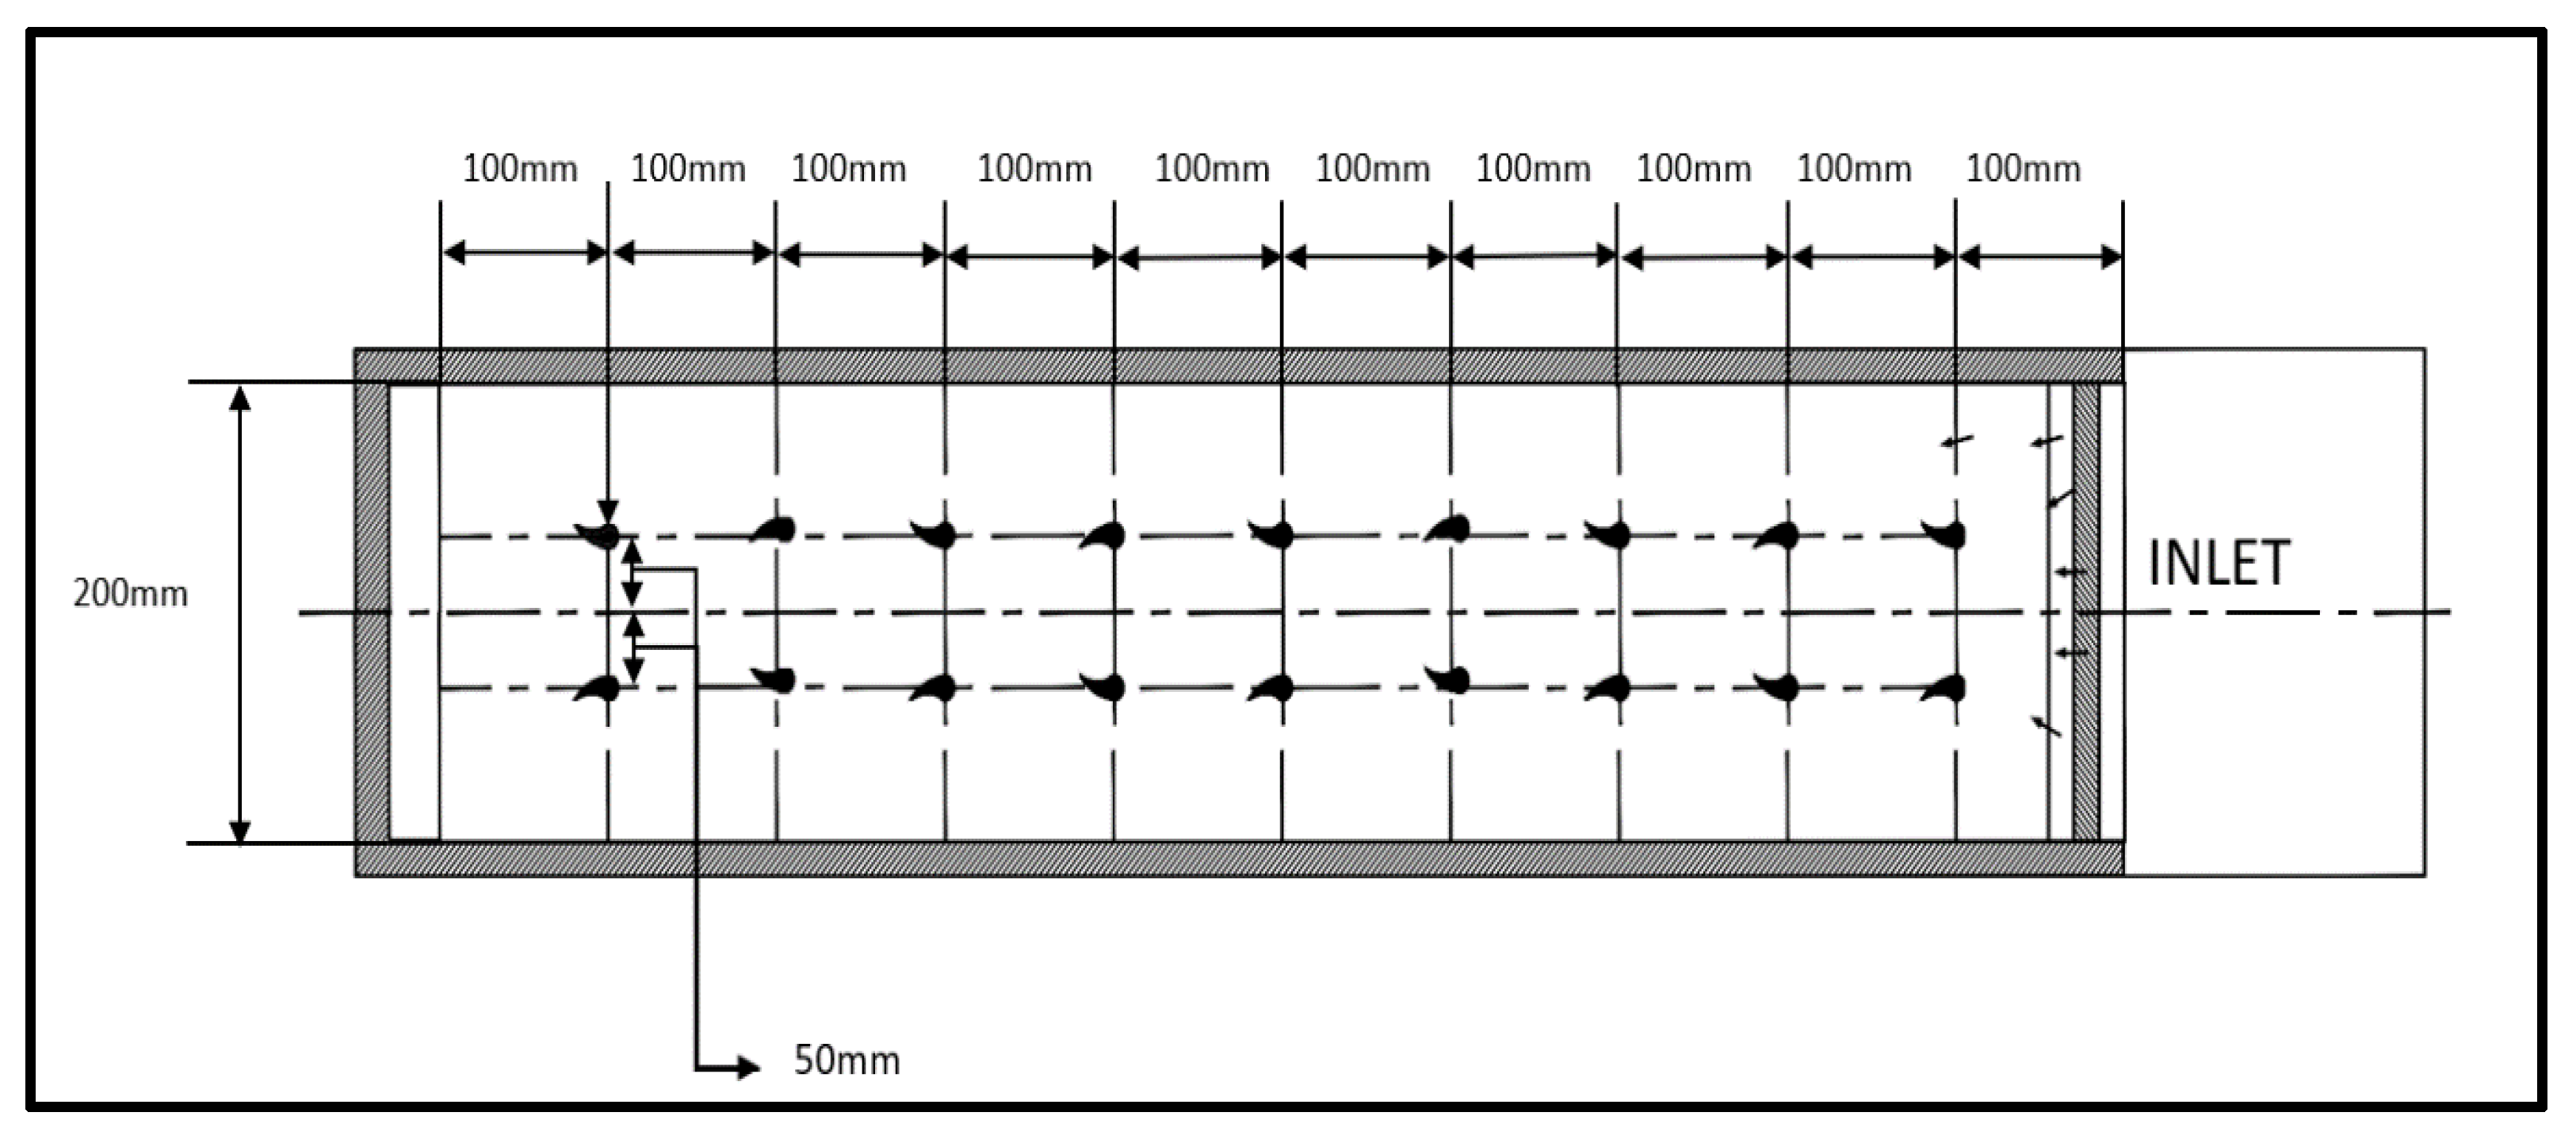
3.1. DPSAH Geometric Specifications

The geometric model of the SAH is shown in Figure 4 as per the dimension details described in Section 2.1.
Figure 5 shows the shape of the aerofoil fin. The direction of the tail end of the aerofoil fin is changed to arrive at two configurations, namely the aerofoil 1 configuration and aerofoil 2 configuration. In the aerofoil 1 configuration, the tail end of all the fins are facing away from the center line of the absorber duct, whereas in the aerofoil 2 configuration the tail end of the fins is facing towards and away from the center line of the absorber duct in alternative columns. On the flow side of the absorber plate, the structural configurations of the aerofoil are attached. Figure 6, Figure 7 and Figure 8 show the placement of the aerofoil guide vanes arrangement. Table 2 depicts the geometrical variables of the aerofoil (1 and 2) configurations and the various values of height chosen for the studies. The aerofoil fin is placed with an axial pitch of 100 mm and 50 mm each from the centerline of the absorber duct.

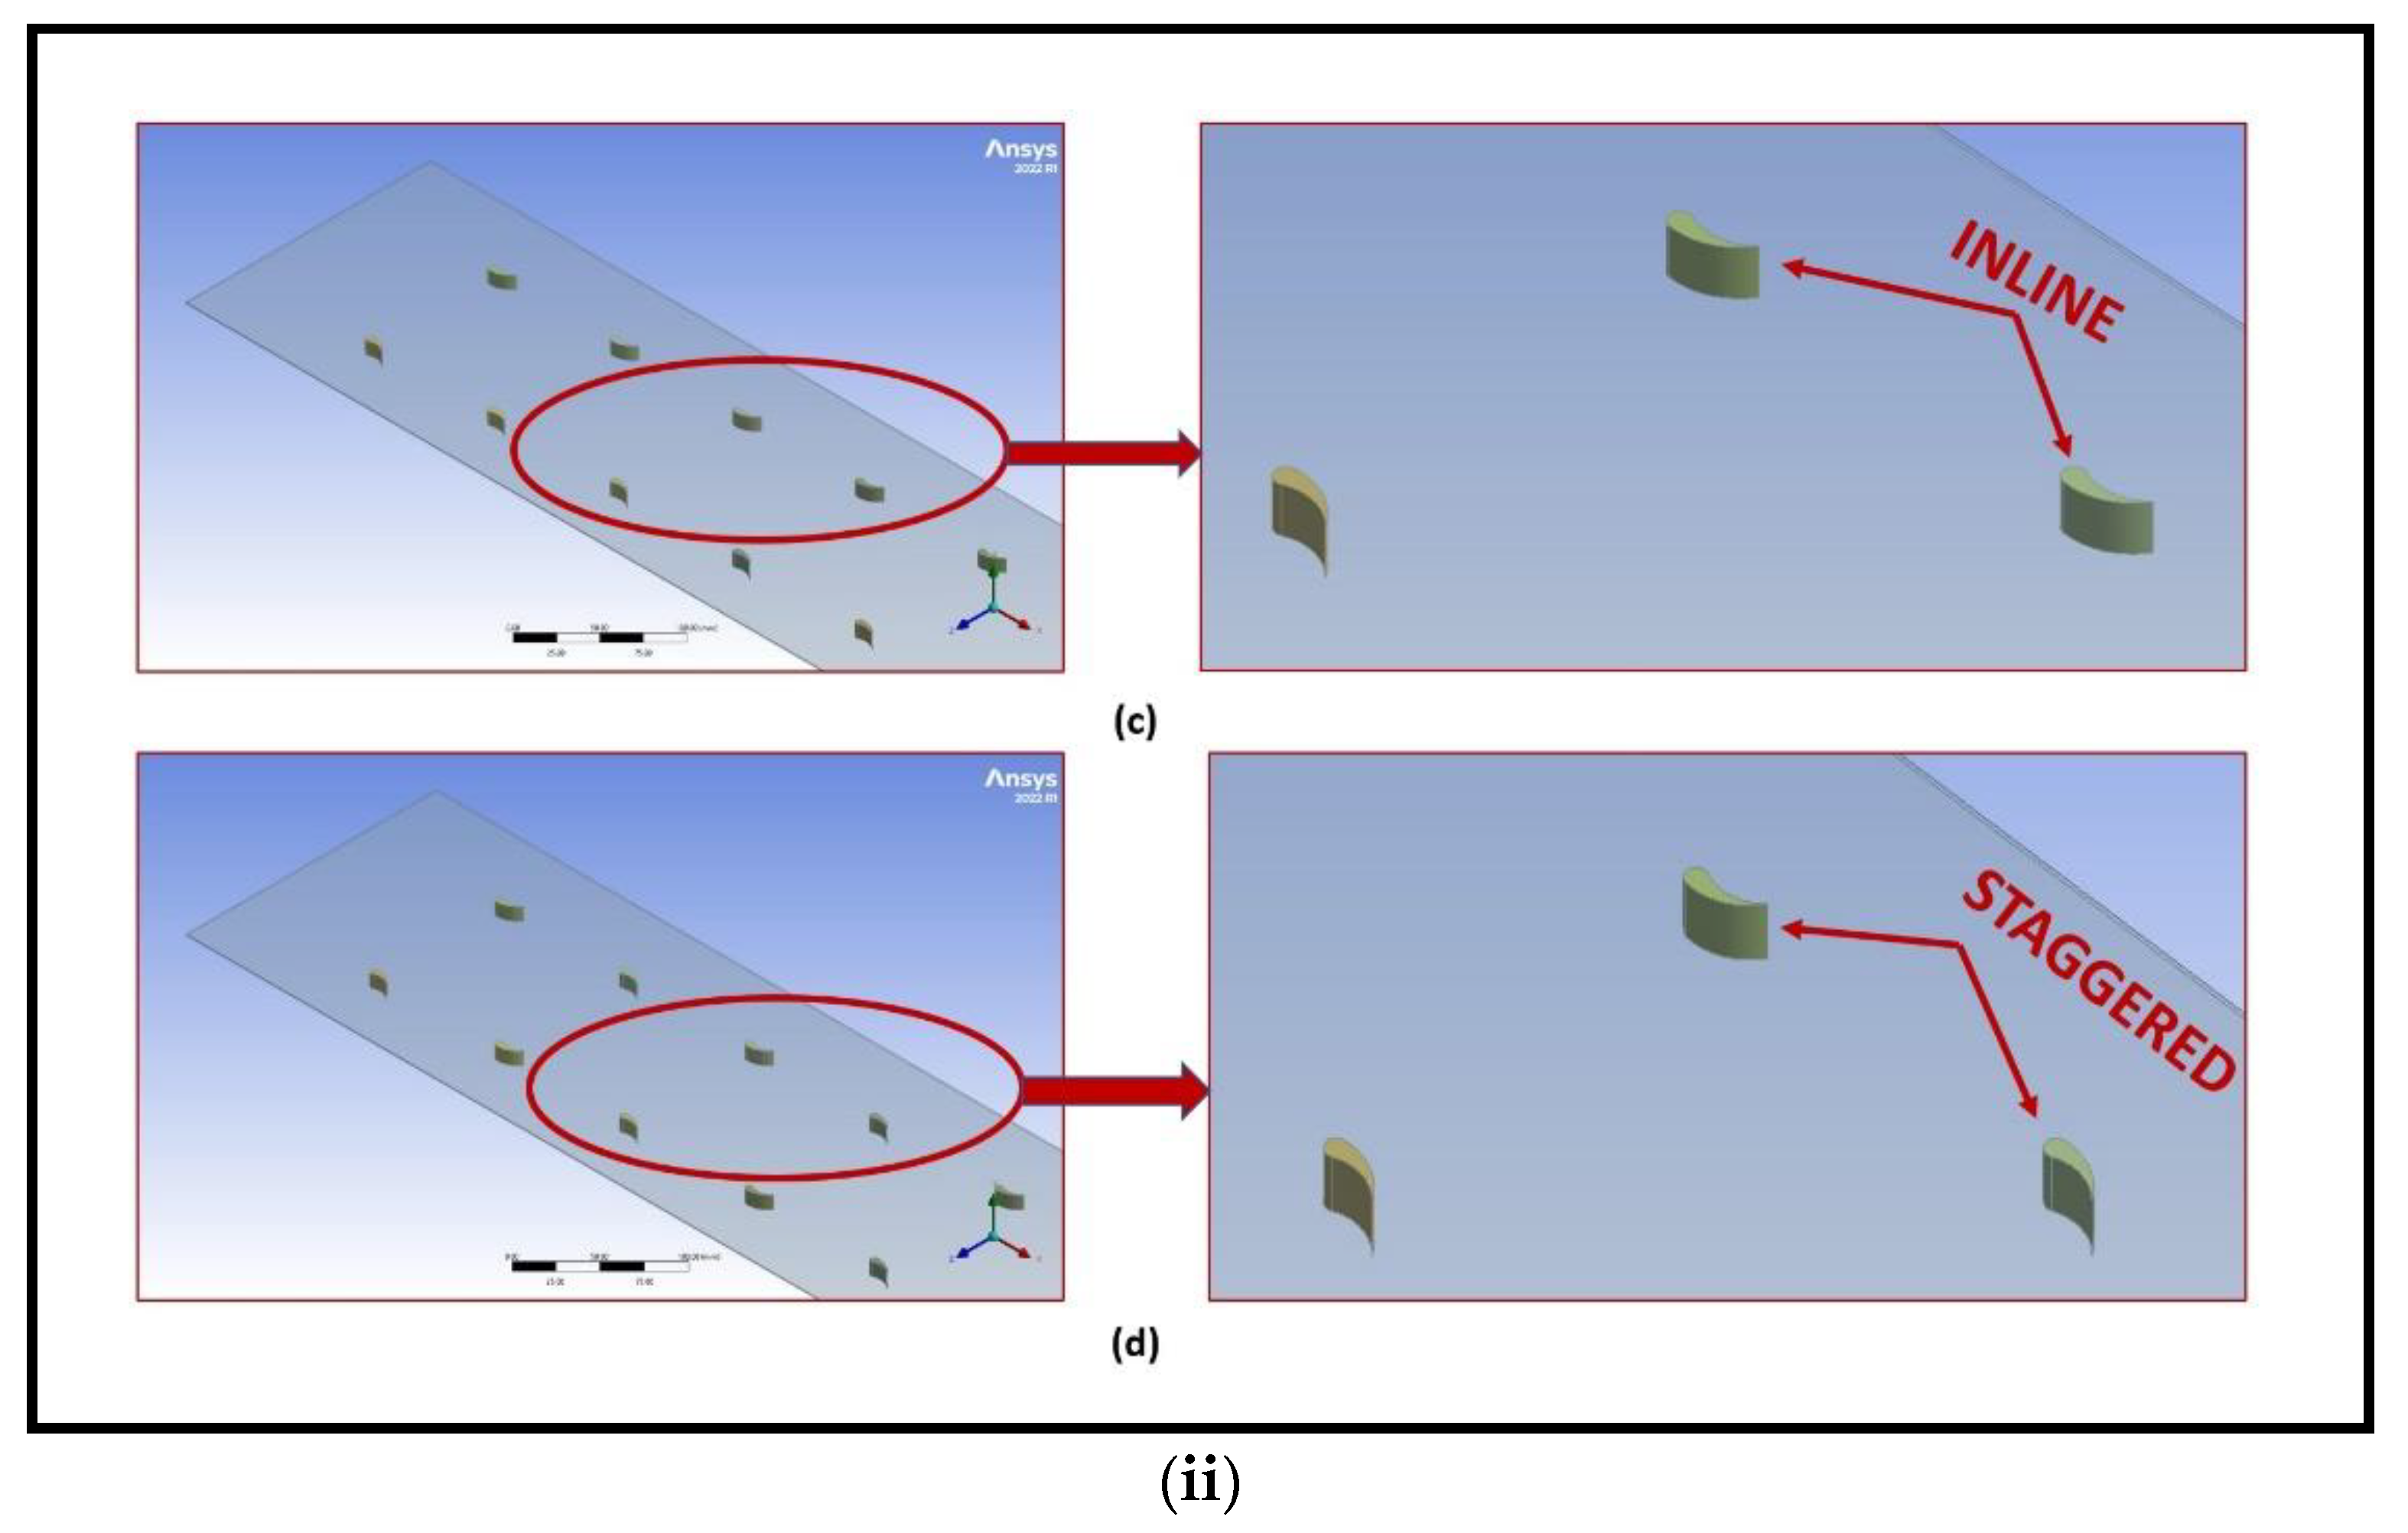
3.2. Parametric Details of Finned SAH

A CFD analysis was conducted on a Single Pass Solar Air Heater (SPSAH) as a base model and DPSAH of a 10° inclined inlet with an aerofoil fins configuration for the possible enhancement of the thermal efficiency and thermo-hydraulic efficiency. Table 3 gives the configurations used for the present CFD analysis. A total of nine geometric configurations are employed in which one is the base model (SPSAH) and the other eight configurations are with the aerofoil and DPSAH. The pitch for the aerofoil fins is fixed at 100 mm for all of the configurations. The type of aerofoil configuration is varied along with the height of the aerofoil fin. In the table shown below, the configuration SIIDPSAH 1-e-30 means that the model has a single inlet inclined at 10°, a double pass, and is equipped with aerofoil fin 1 type having a fin height of 30 mm.

3.3. Governing Equations

In the present work, the steady-state numerical simulation is carried out using Ansys-Fluent software. The software solves a set of governing equations such as continuity, momentum, and energy equations, as shown in Equations (9)–(11).
Continuity equation
( ρ U j ) x j = 0
Momentum equation
x j ( ρ u i u j ) + p x i = x j [ μ ( u i x j + U j x i ) ] + x j [ μ ( u i x j + u j x i ) ]
Energy equation
x j ( ρ u j T ) = x j [ ( Γ + Γ t ) T x j ]

3.4. Boundary Conditions and Material Properties

The details of boundary conditions imposed on the CFD model are enlisted in Table 4.
The absorber plate receives solar radiation through the glass cover, and the radiation heat flux which is incident on the absorber plate is achieved by using the Discrete Ordinate Radiation model (DOR) available in CFD software. The model includes a place to enter the coordinates for the sun’s position on a specific day, time, and location. The radiation that is produced is used as a heat source. The solar ray tracing method is applied in the solar load model.
The properties of air, aluminium and glass are tabulated in Table 5. Equations (12)–(14) are temperature dependent, and are used to calculate the density, thermal conductivity, and absolute viscosity, respectively.
ρ = 3.1947 0.016082 T + 2.9013 × 10 5 T 2 1.9407 × 10 8 T 3
K = 1.5315 × 10 6 + 9.64 × 10 5 T 3.33 × 10 8 T 2
μ = 1.6157 × 10 6 + 6.523 × 10 8 T 3.02 × 10 11 T 2

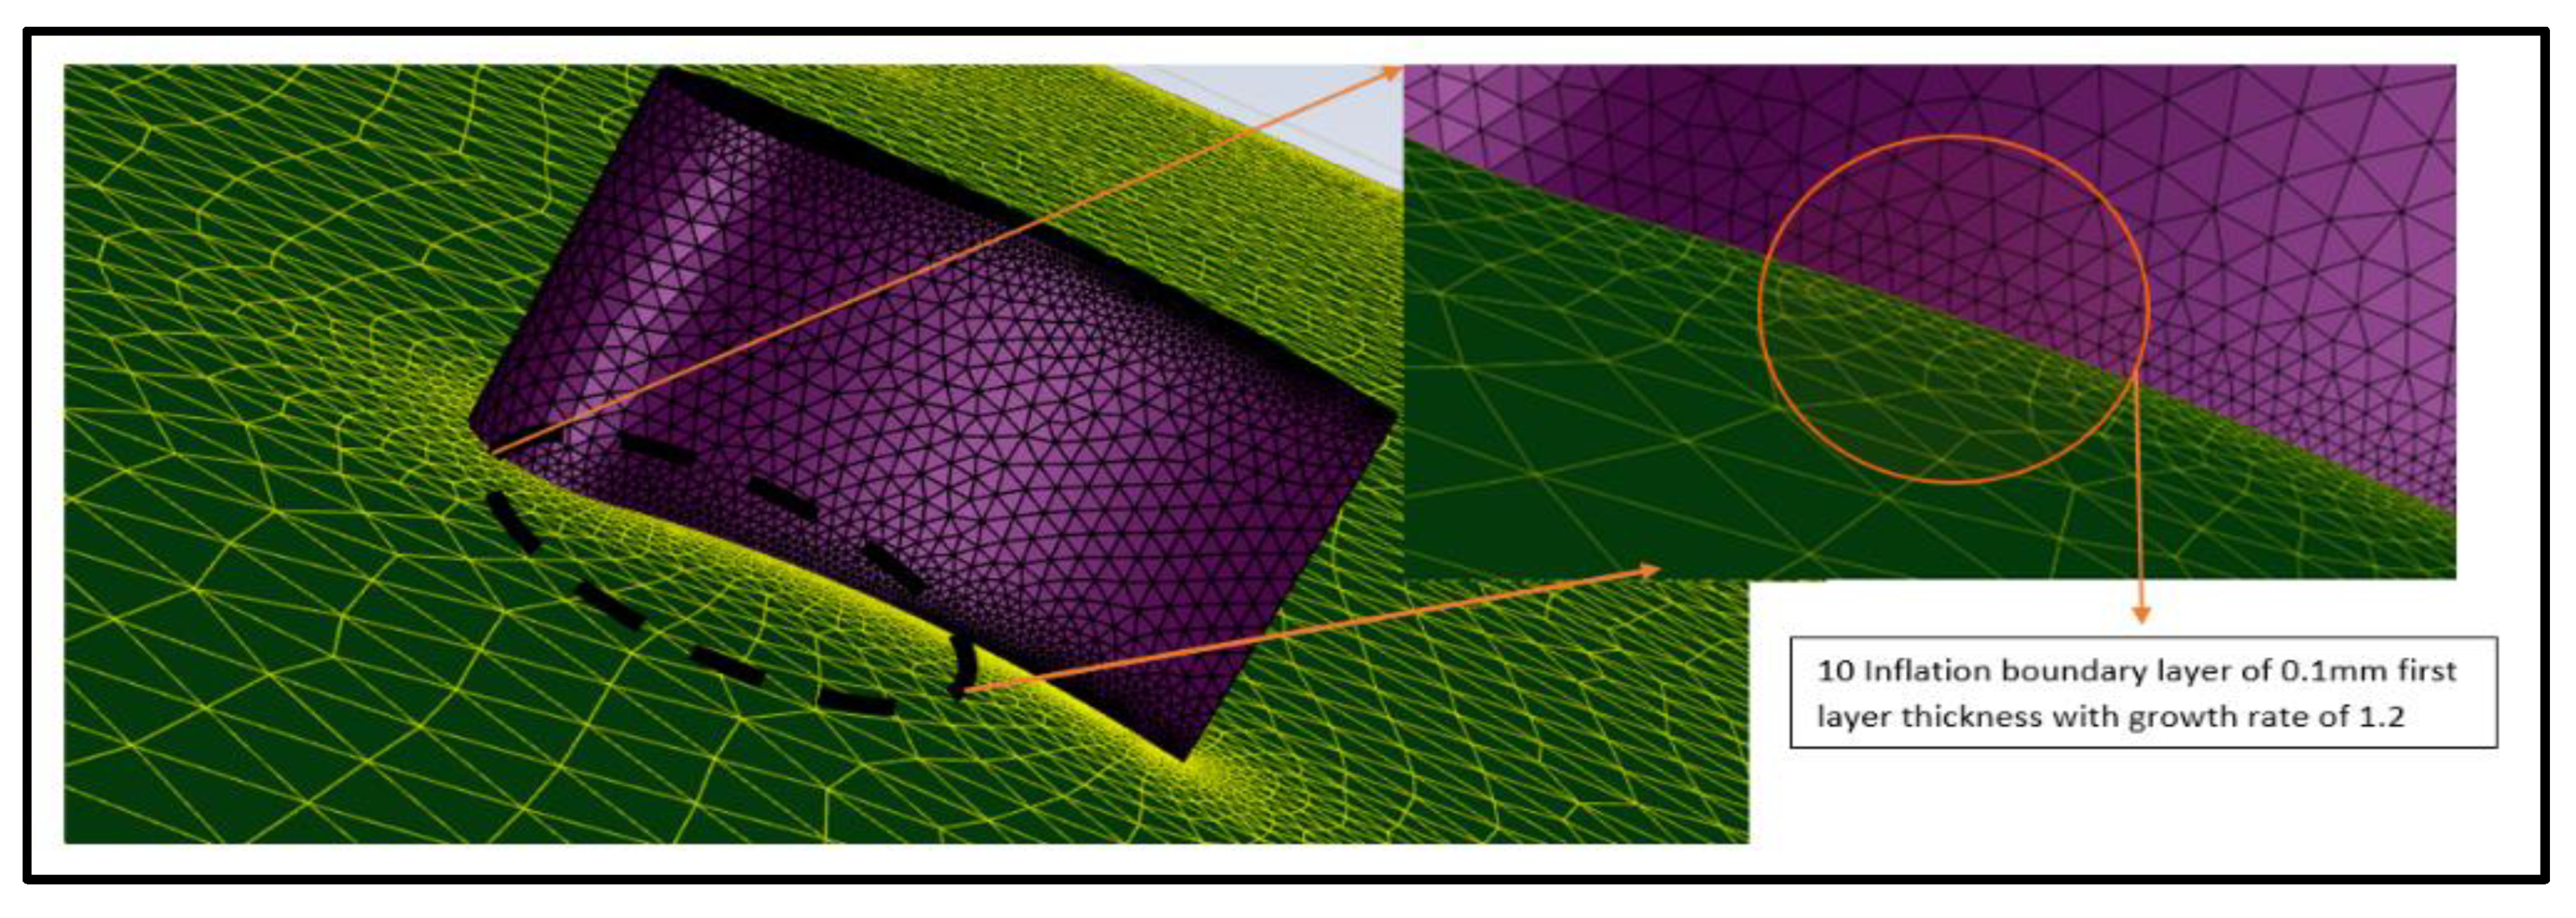
3.5. Mesh Generation

The mesh, as part of discretization of the flow domain, is generated by using the meshing module of ANSYS. To capture the boundary layer effects vividly, a boundary layer mesh is provided along the interface region of the absorber plate with an aerofoil fin and absorber duct on the fluid side. Figure 9 shows the fine mesh region near the aerofoil fin.

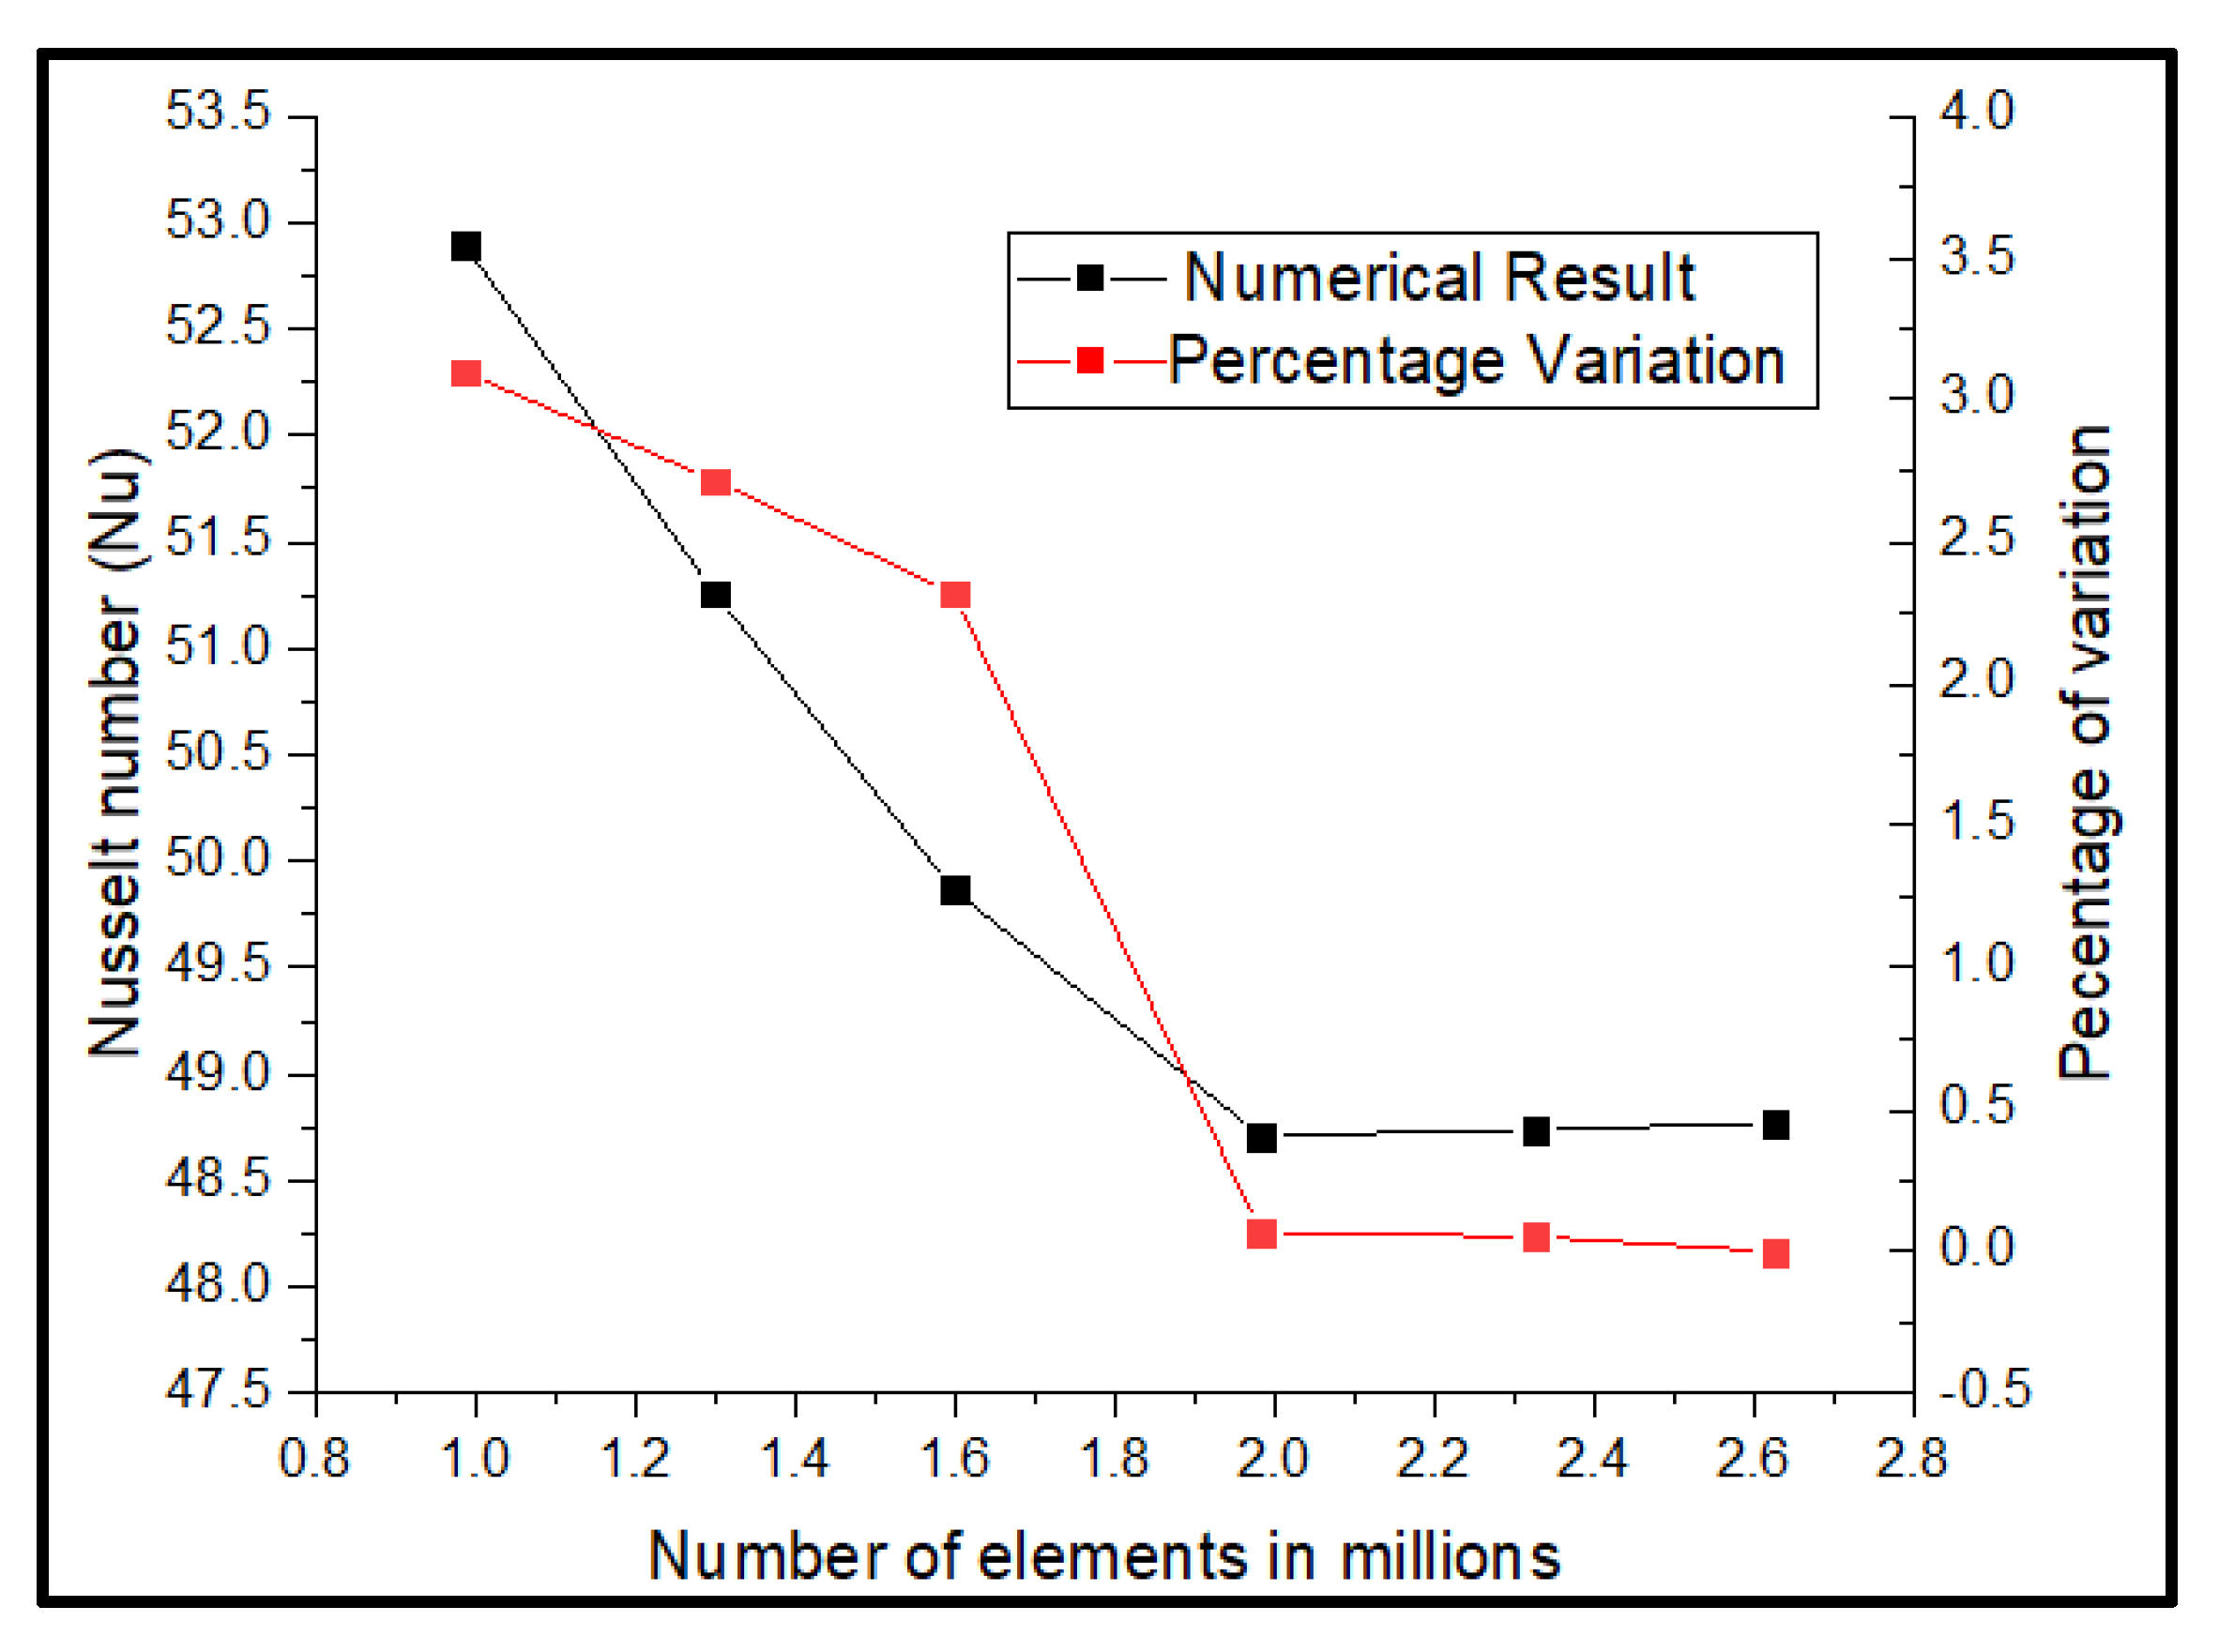
3.6. Mesh Independence Test

A mesh independence analysis establishes the mesh accuracy and allows the CFD solution to be independent of mesh resolution. By changing the element size, the number of mesh elements in the computational domain is varied from 0.98 million to 2.62 million cells. The simulation is run for the mass flow rate of 0.026363 kg/s (corresponds to Reynolds number of 12,000) for 1-e-10 configuration.
The Nusselt number variation for 1.98 million cells to 2.62 million elements configuration is less than 0.5 percent, as shown in Figure 10. Hence, all the analyses presented in this article are carried out on the computation domain having of 1.98 million control volumes or higher in order to reduce the computational time.

3.7. Solution Setup

The numerical simulations are carried out using a double-precision CFD solver that employs the three equations (energy, continuity, and momentum) equations as mentioned in Section 3.3. An RNG k-ε turbulence model is employed for the analysis. A Semi Implicit Pressure Linked Equation (SIMPLE) algorithm is used to for the pressure-velocity coupling, while a second-order upwind approach is used for spatial discretization. The convergence criteria for energy, momentum, and continuity equations are met when the residuals in the computational domain fall below 10−6.

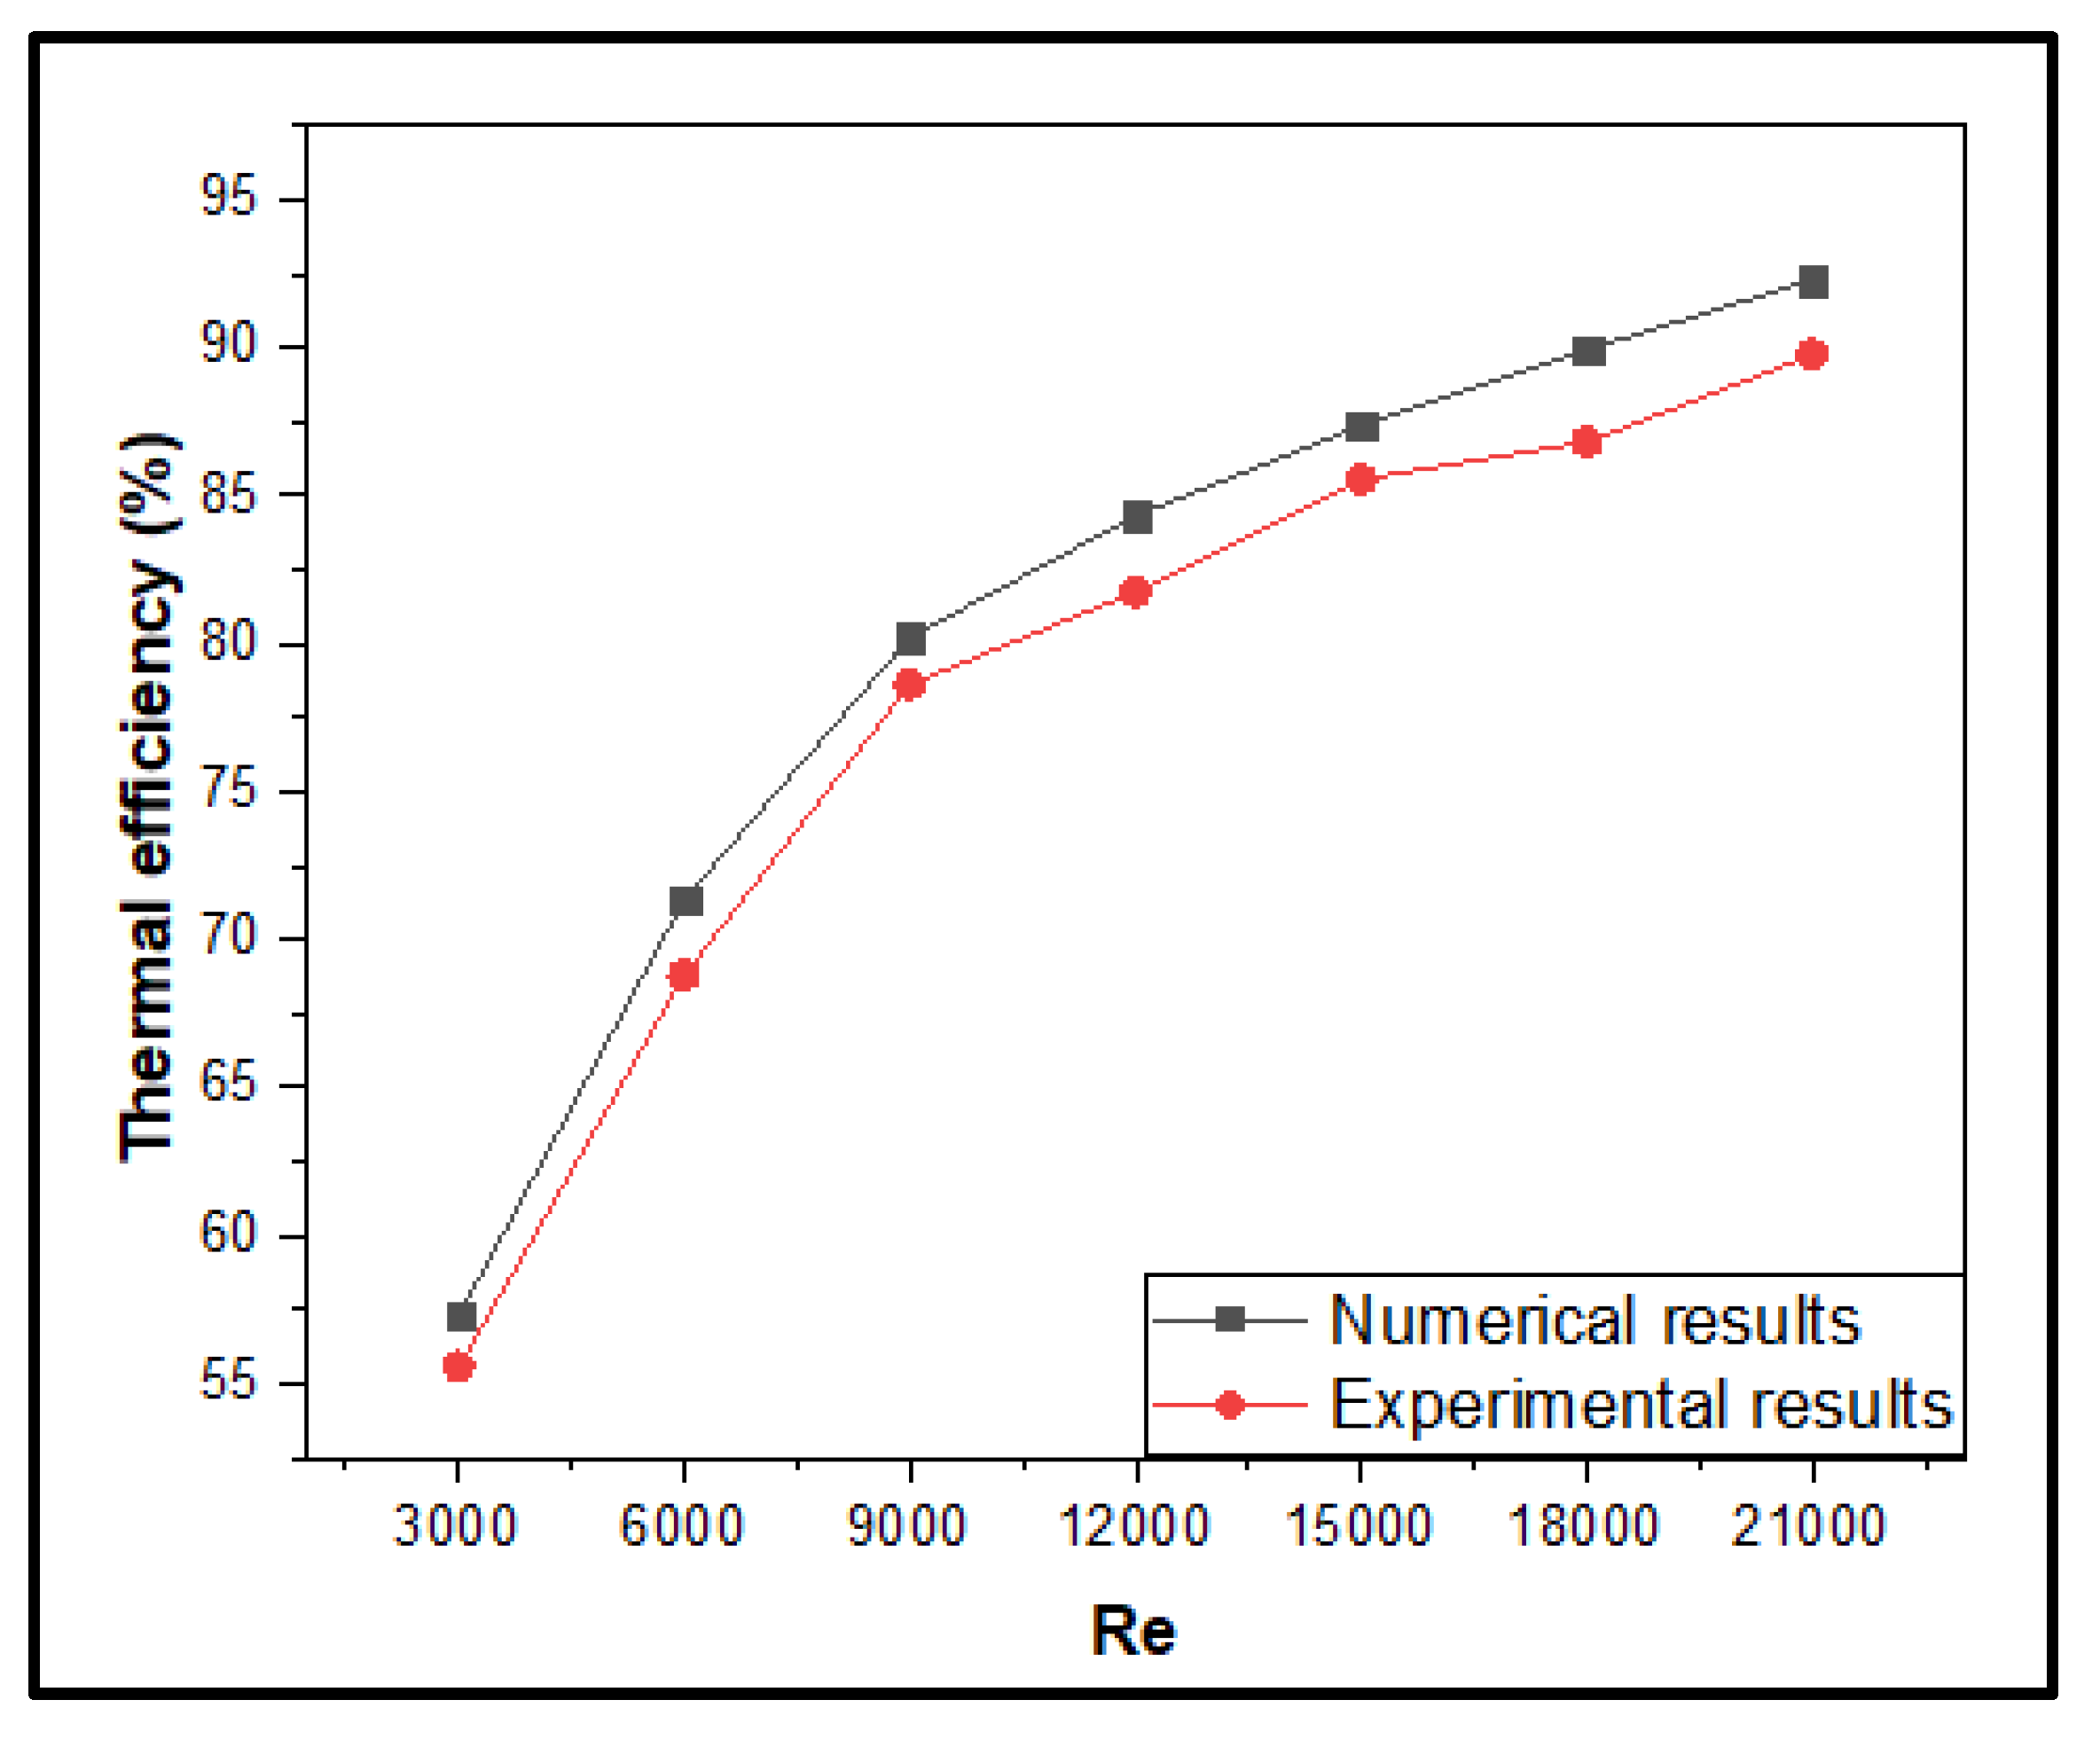
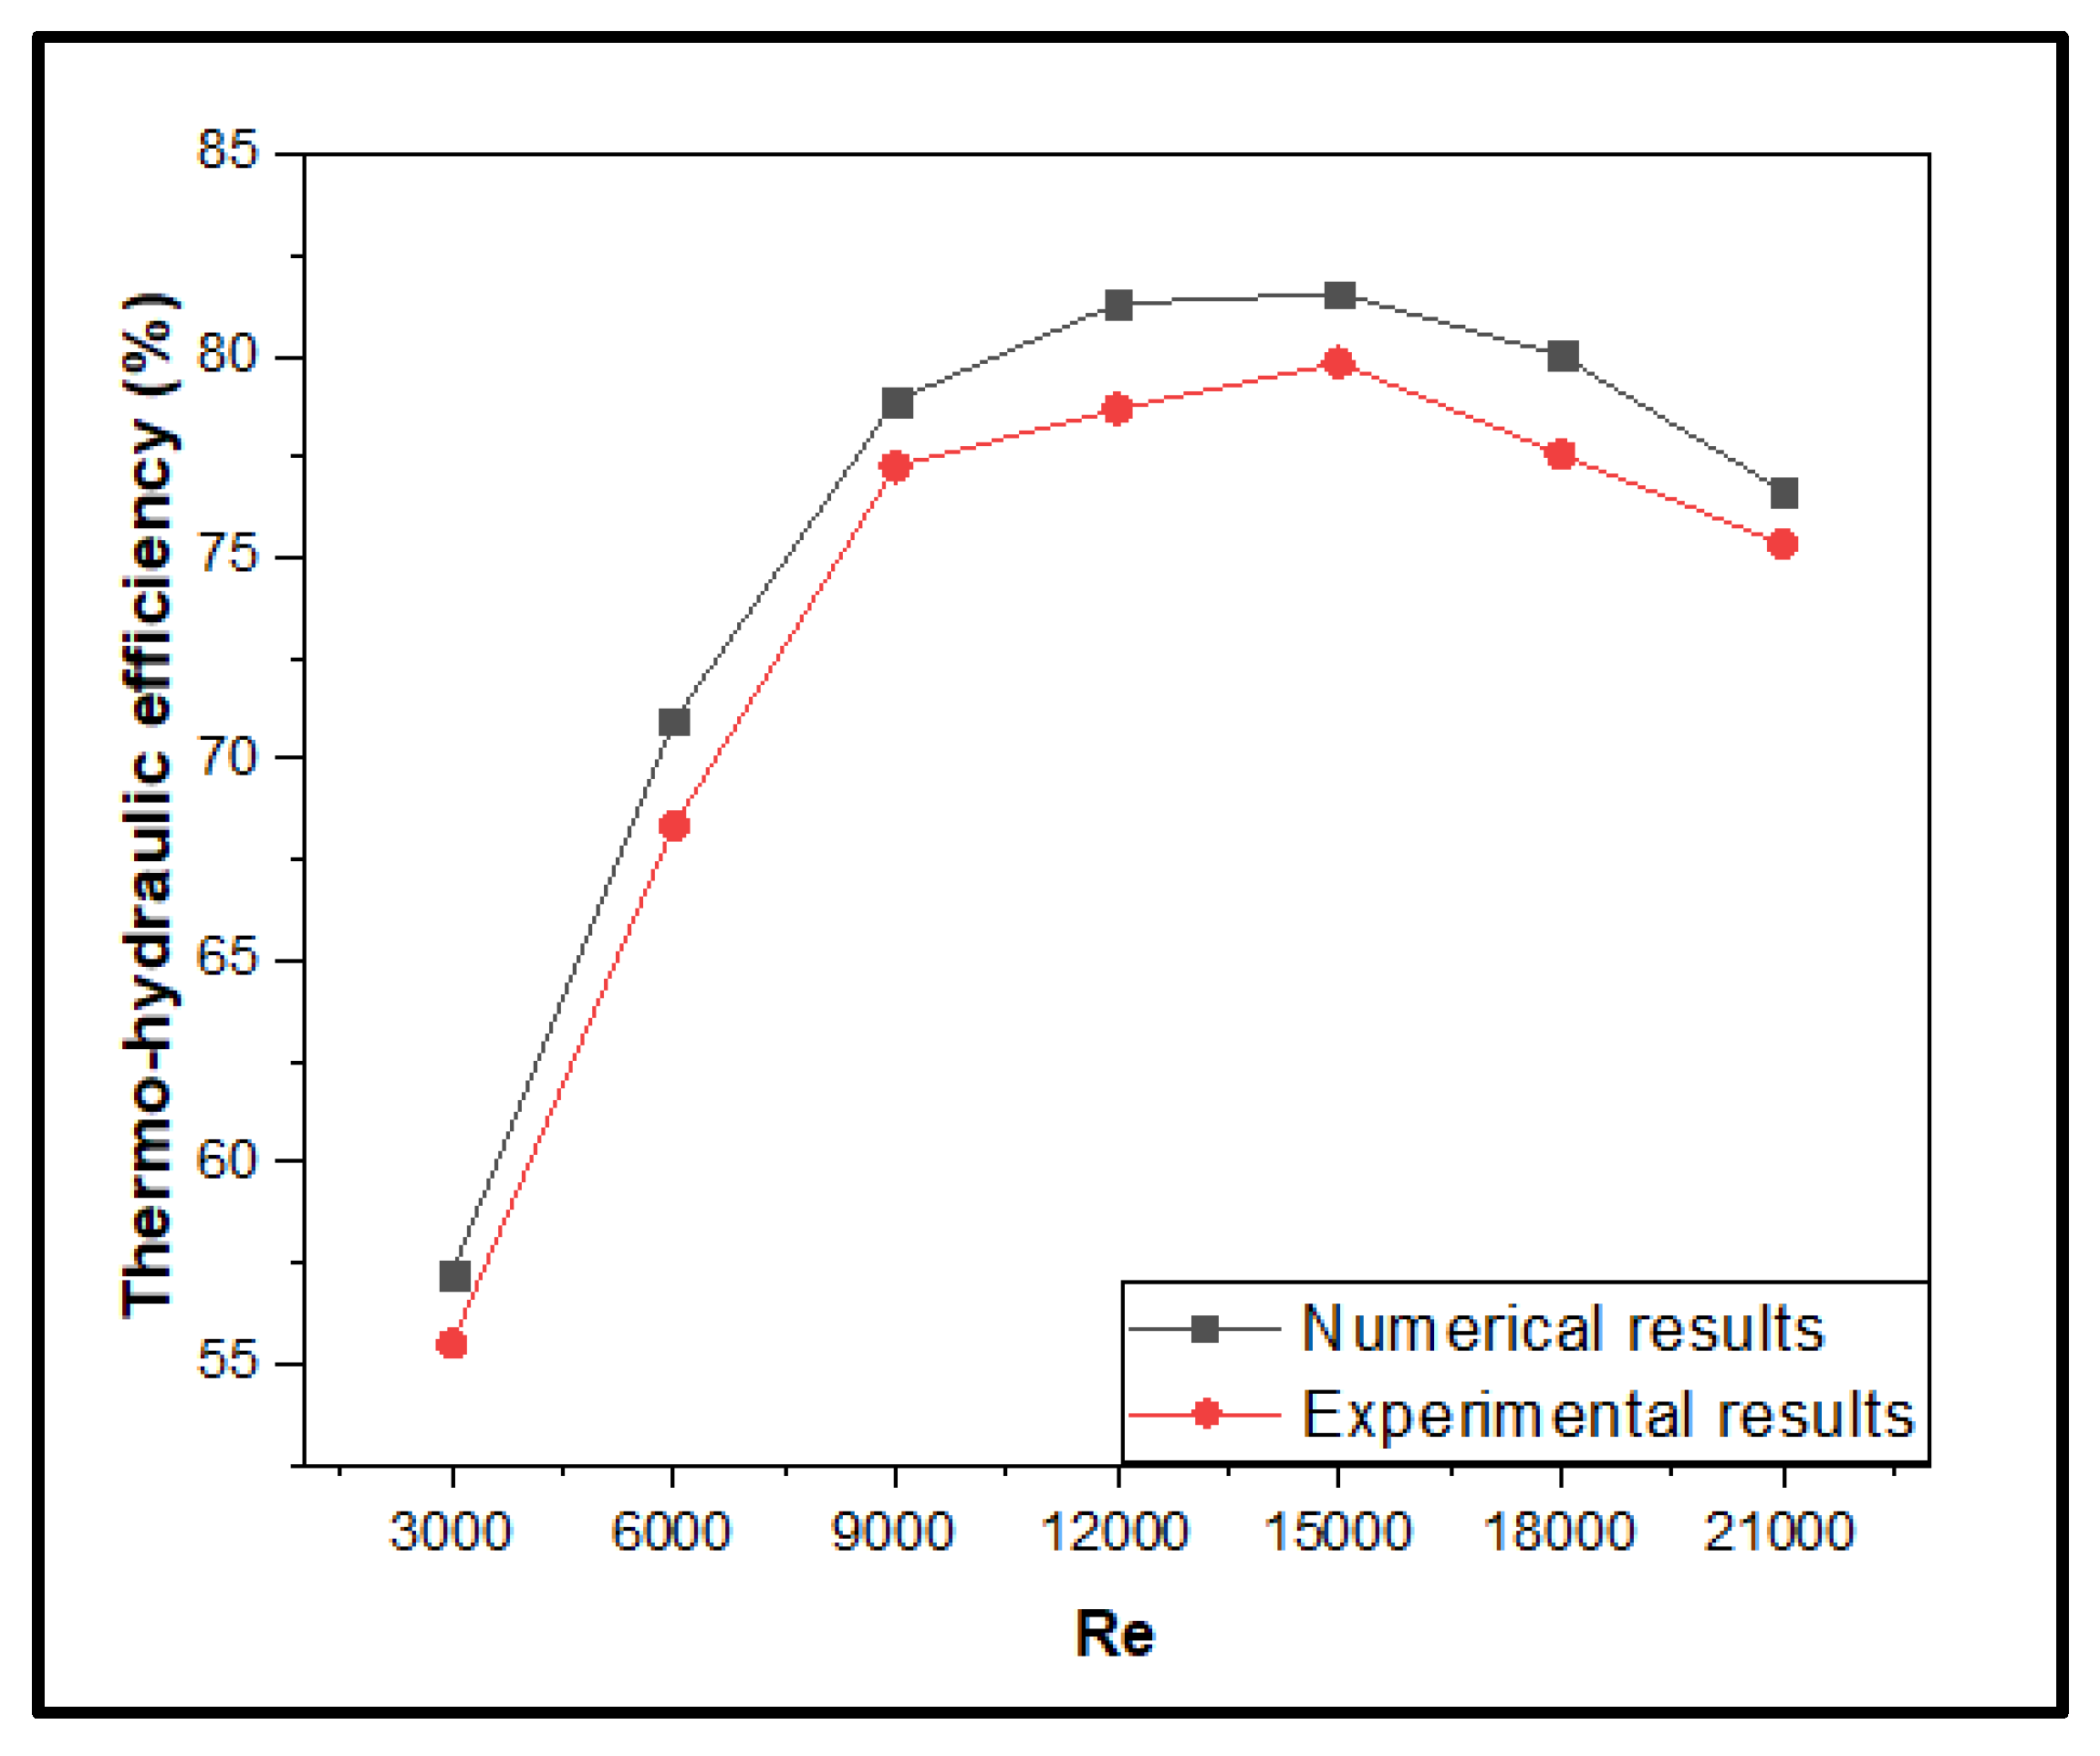
4. Validation of Experimental Results with CFD Analysis

The thermal efficiency of the experimental data and the values acquired by numerical analysis are plotted in Figure 11. For all measured values, the thermal efficiency increases as Re increases. The difference between CFD and the experimental values is about 5%, which is acceptable. The relatively lower percentage deviation among these two results shows that the built CFD model is in conformity with the experimental analysis.
Furthermore, Figure 12 compares the experimental and numerical results for thermo-hydraulic efficiency. This parameter is taking care of both the improvement in the Nusselt number and the associated pressure drop in the flow passage. It is found that with the increase in Re, thermohydraulic efficiency increases up to an Re of 15,000 and then decreases. The variation between the numerical and experimental results is found to be within 5%, thus validating the similar trend that was obtained for thermal efficiency.
The minor deviation between the CFD and experimental results is because there might be a considerable amount of non-measured radiation energy losses in the real time experiments which are not captured in the CFD analysis.

5. Results and Discussion

This section deals with the detailed analysis of numerical results obtained from ANSYS Fluent. The results are quantified with the help of thermal efficiency and thermo-hydraulic efficiency. The velocity vector and contour plots explain the physics of flow vividly for various geometric configurations of aerofoil fin used in the study and depicts the importance of such fin designs for the performance betterment of the solar air heater.

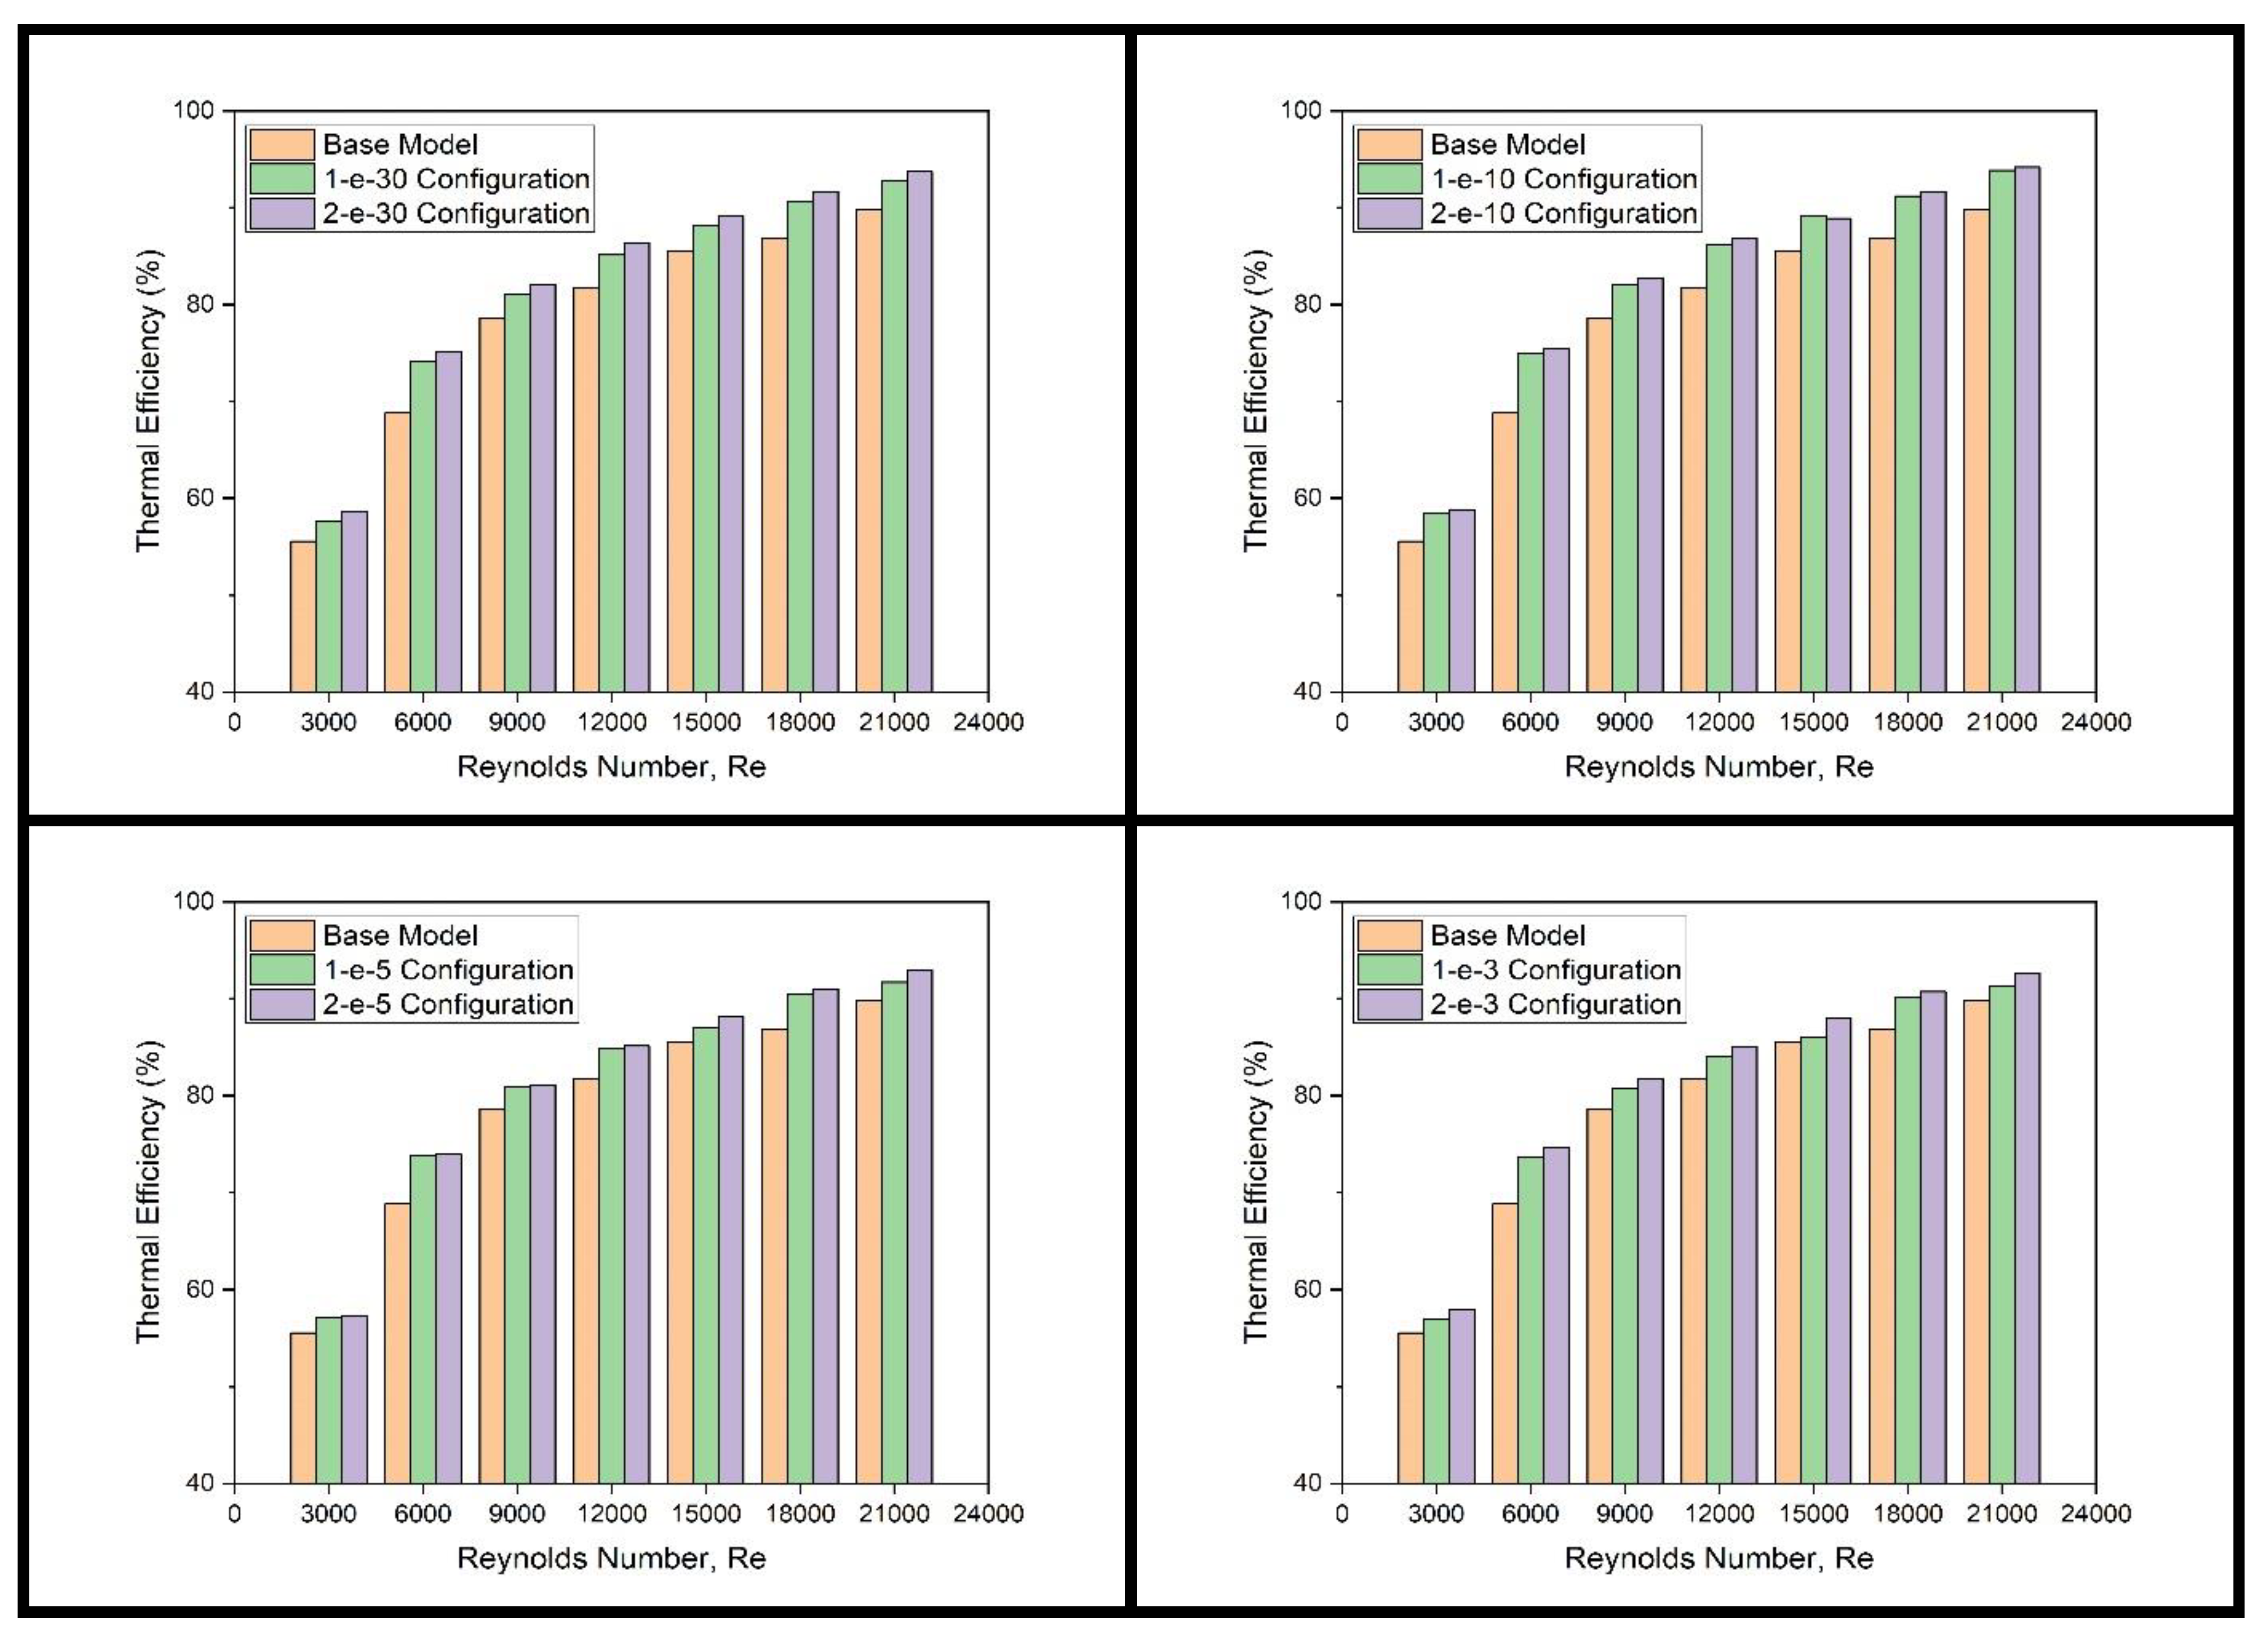
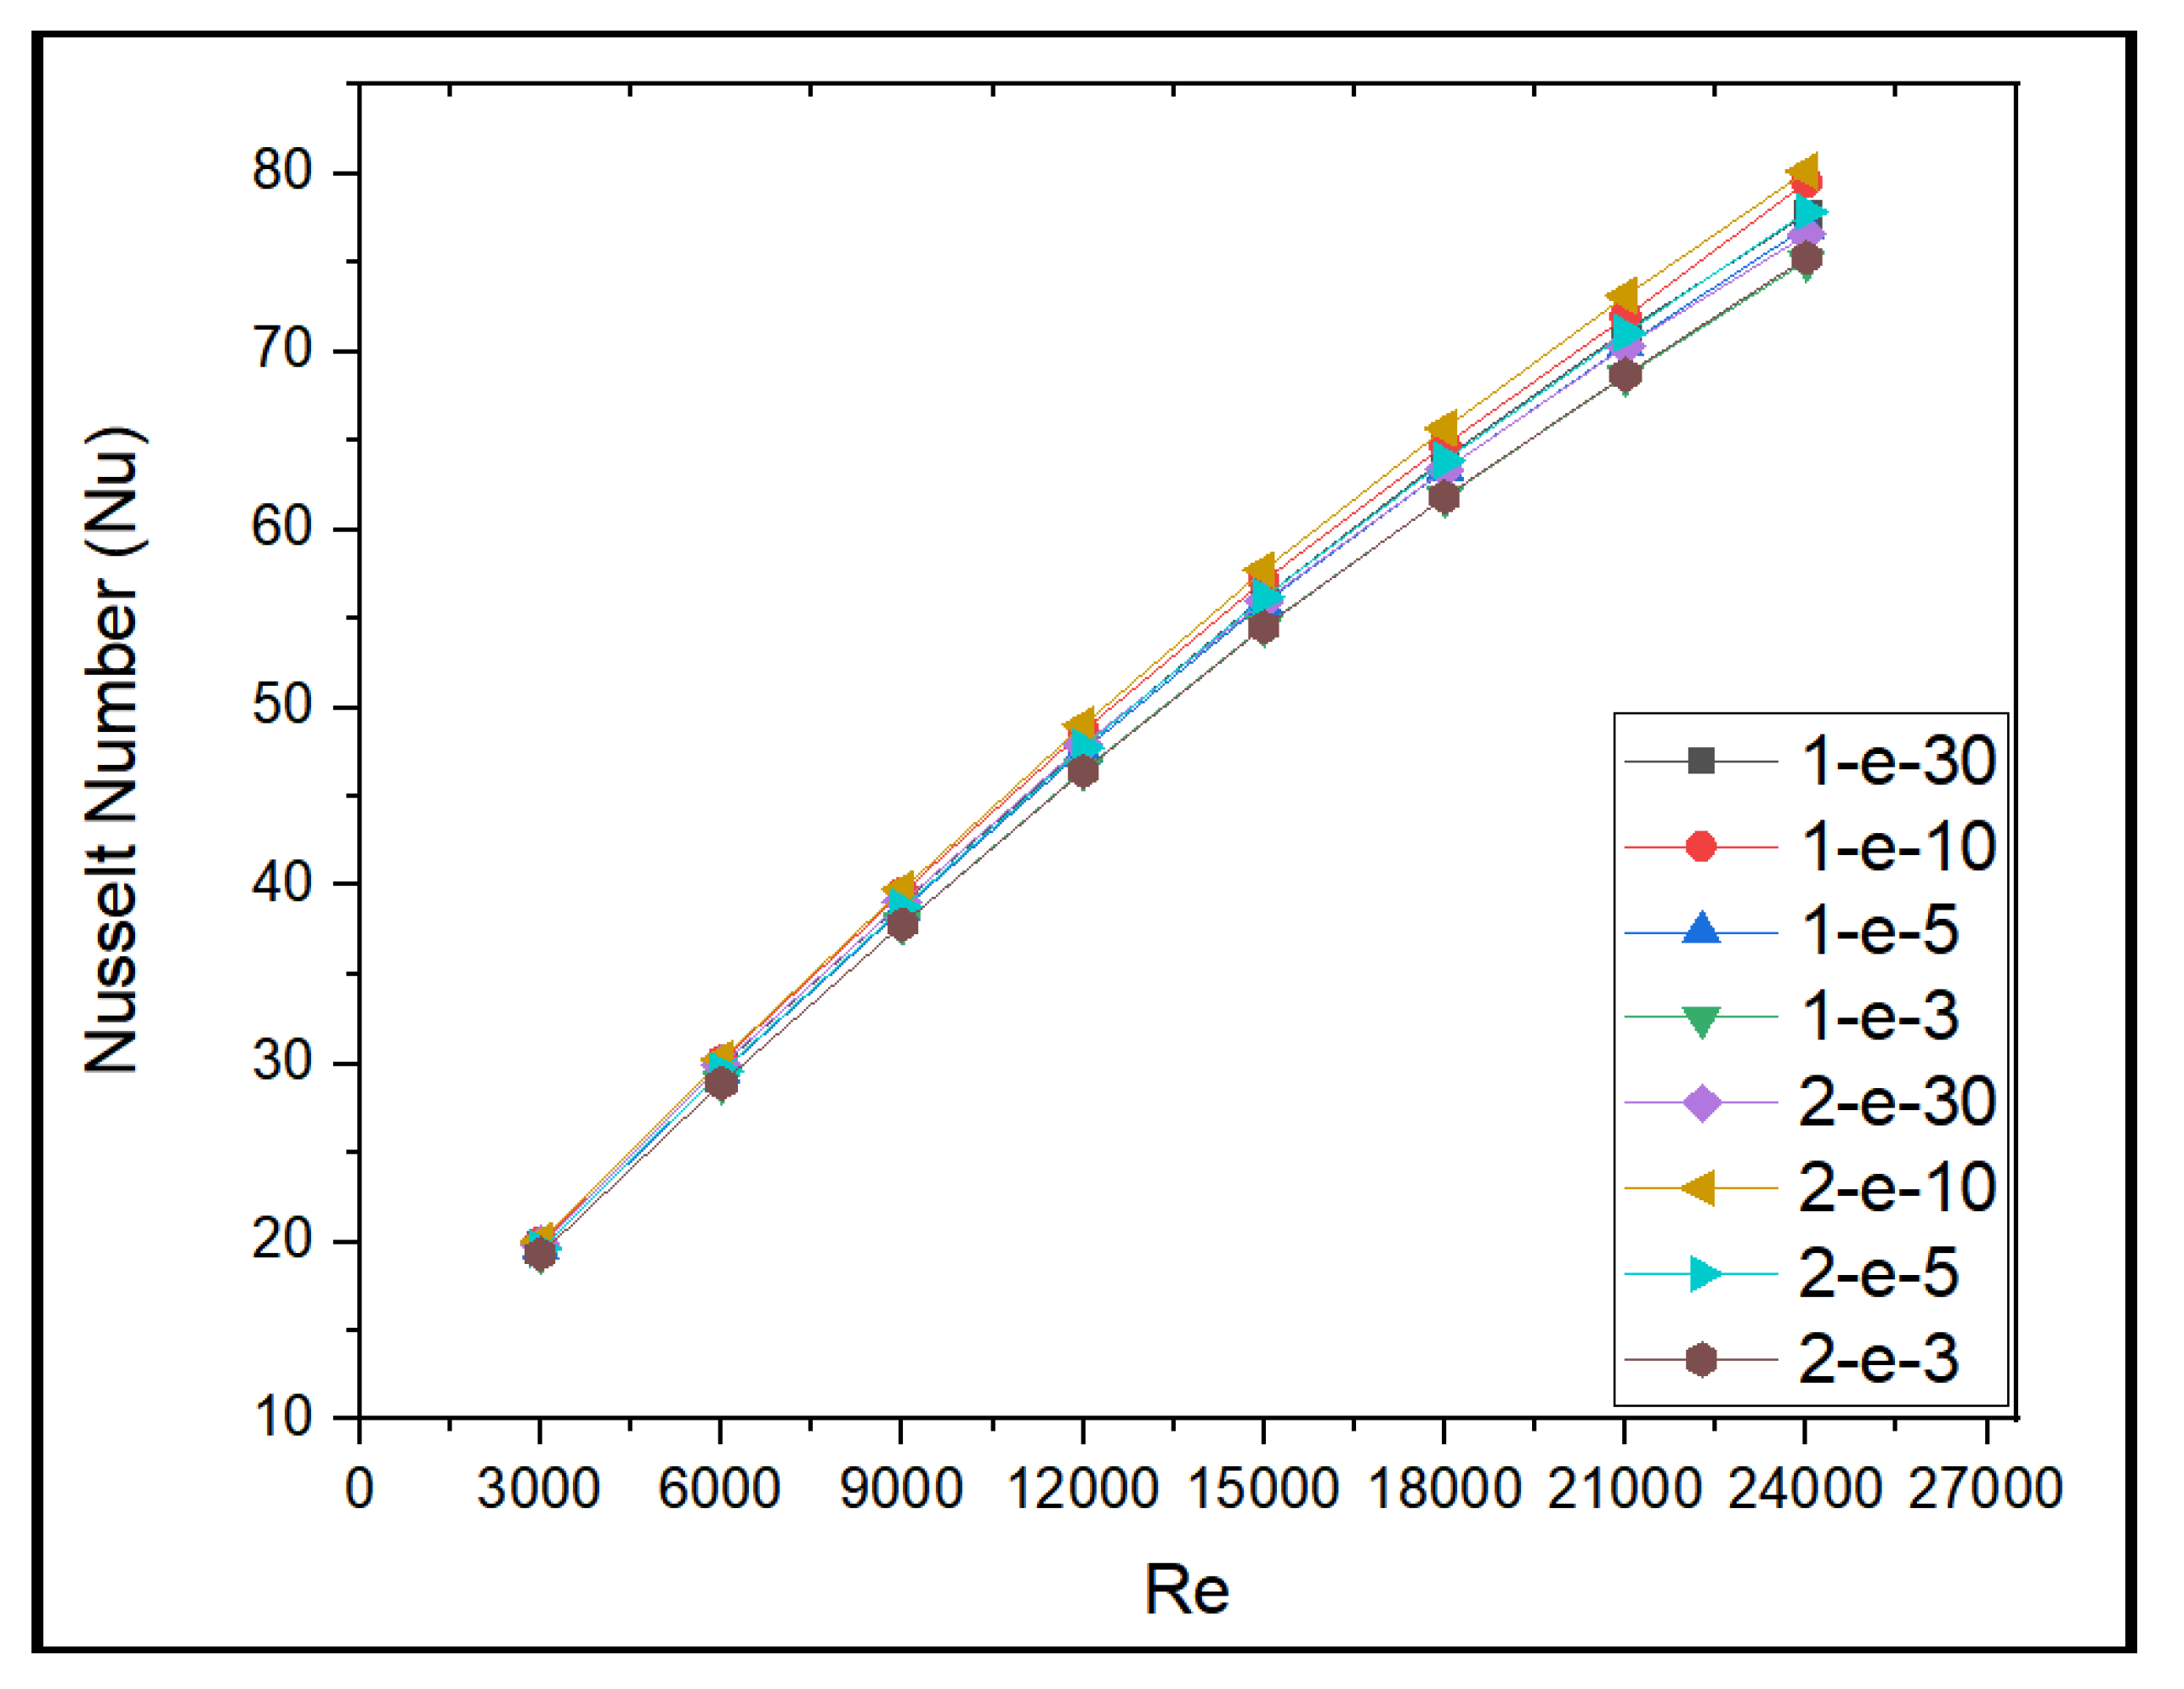
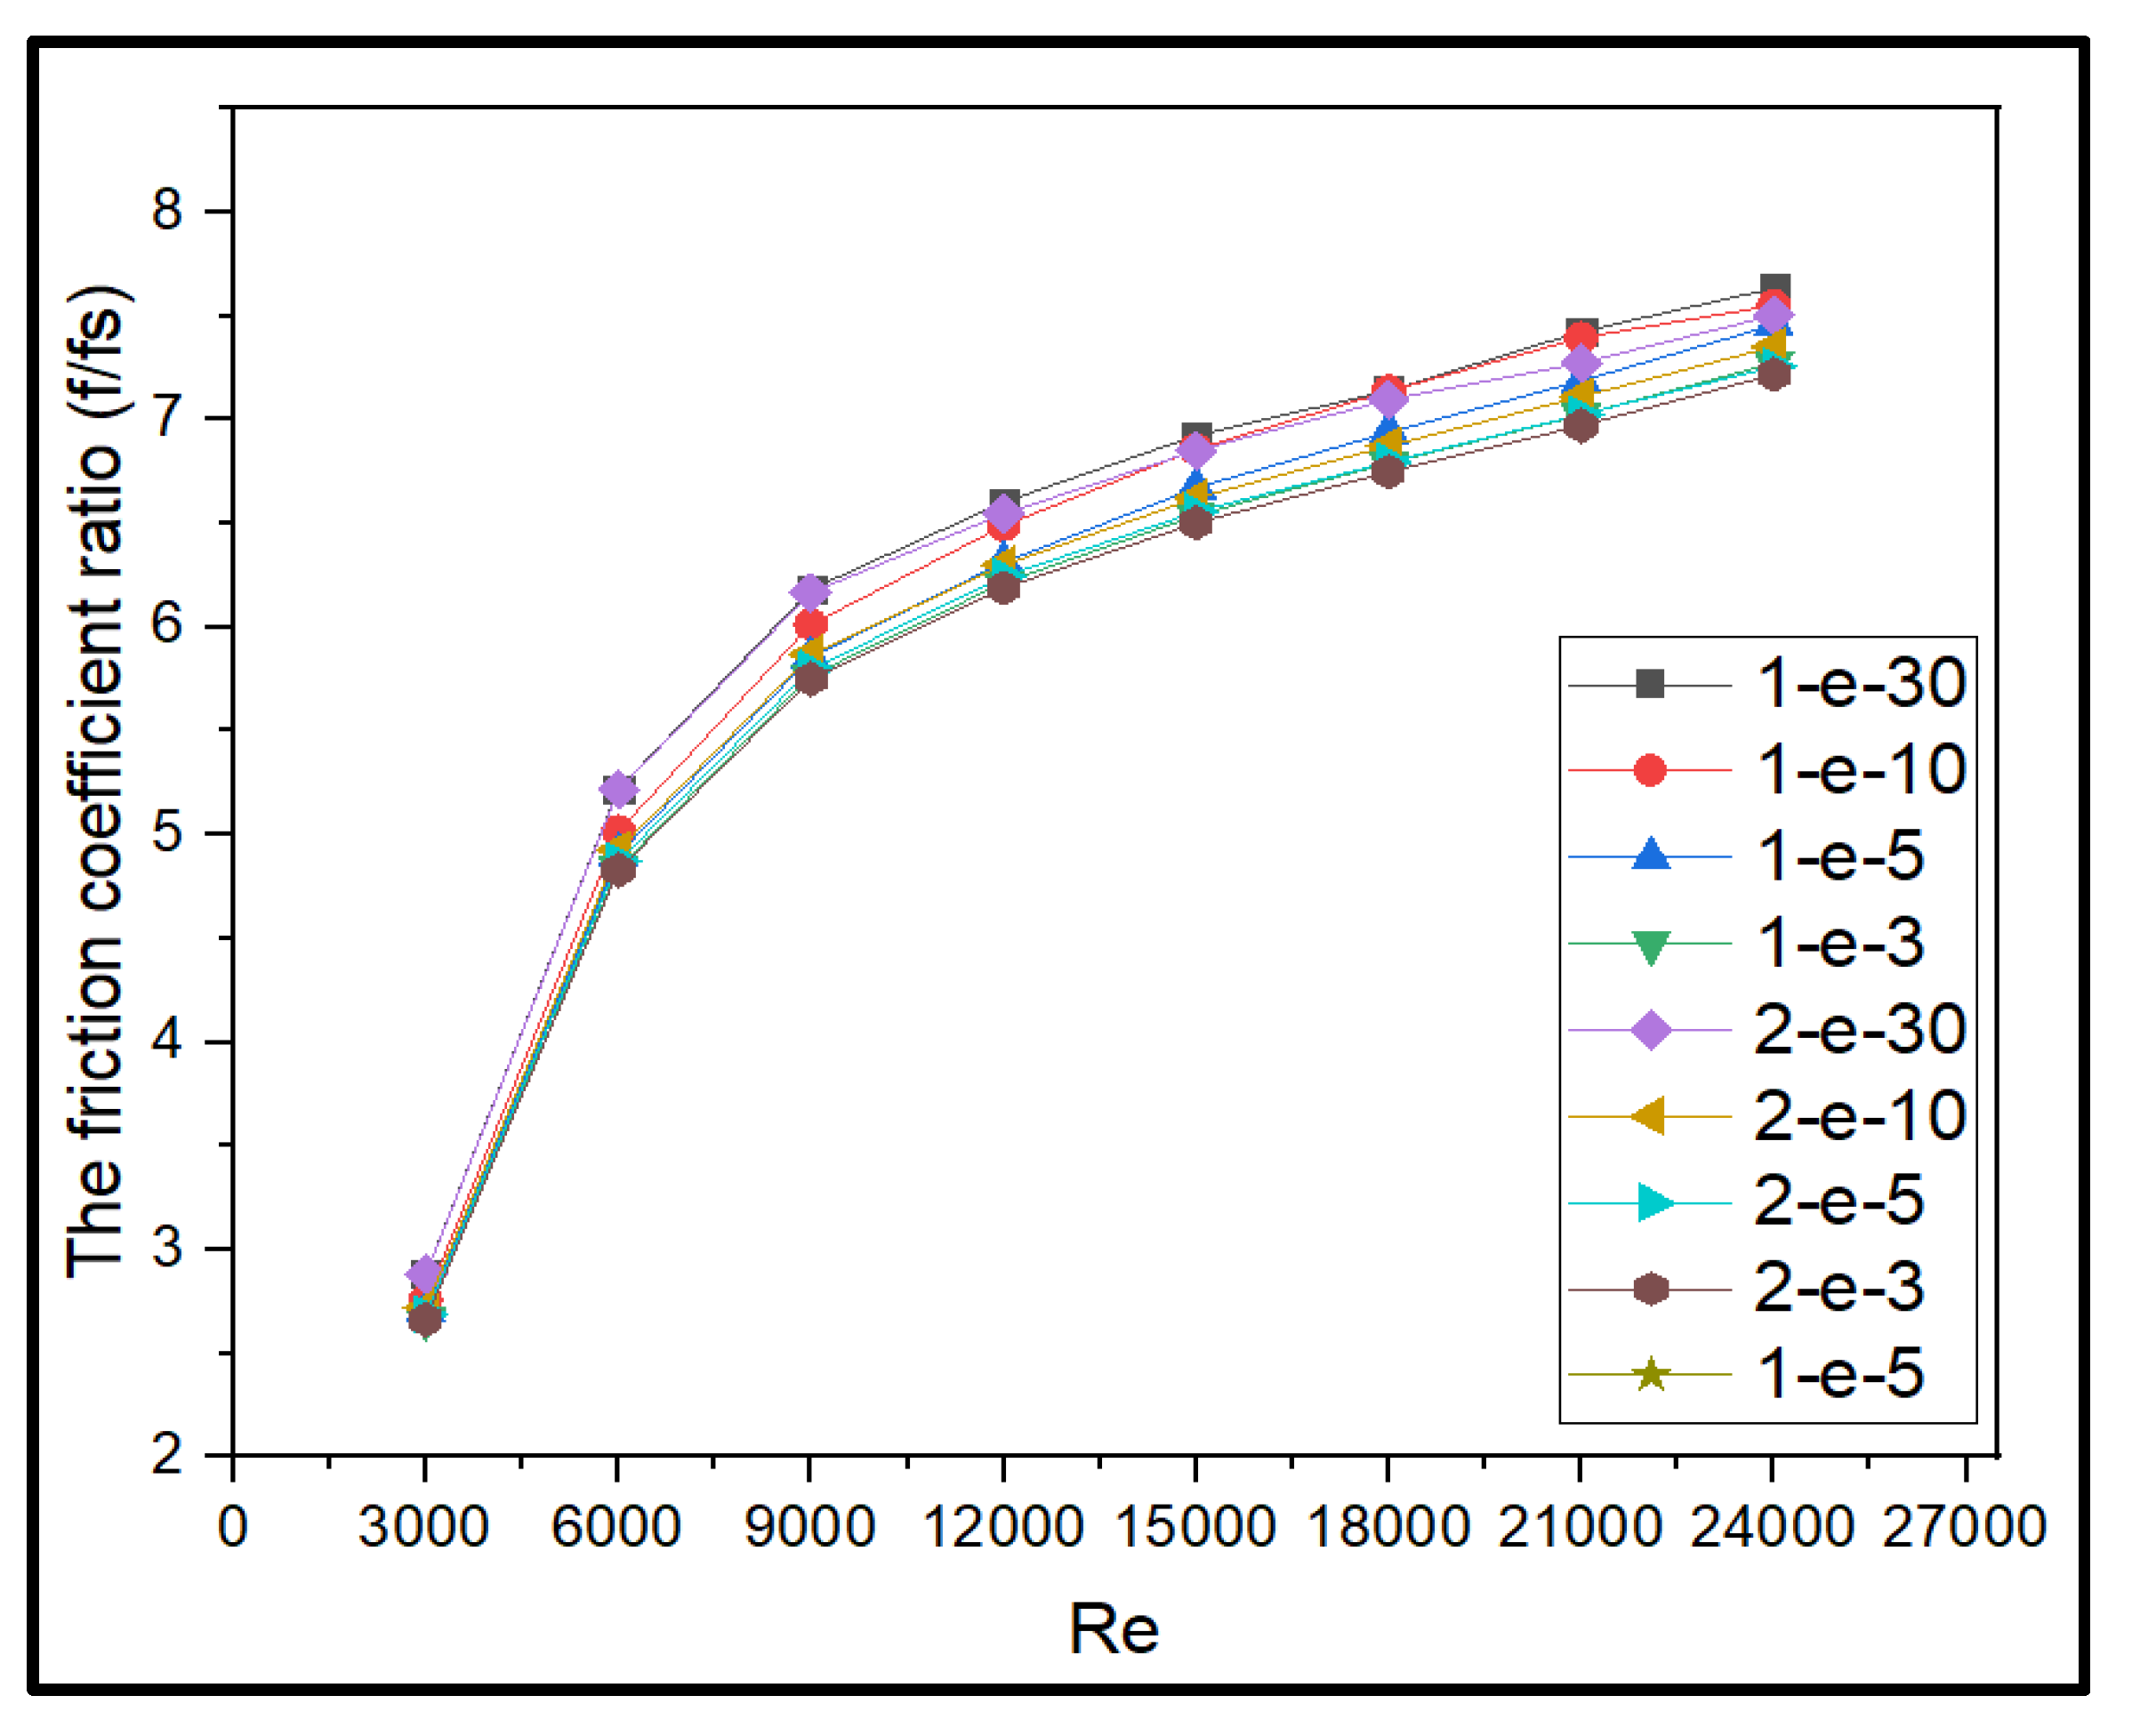
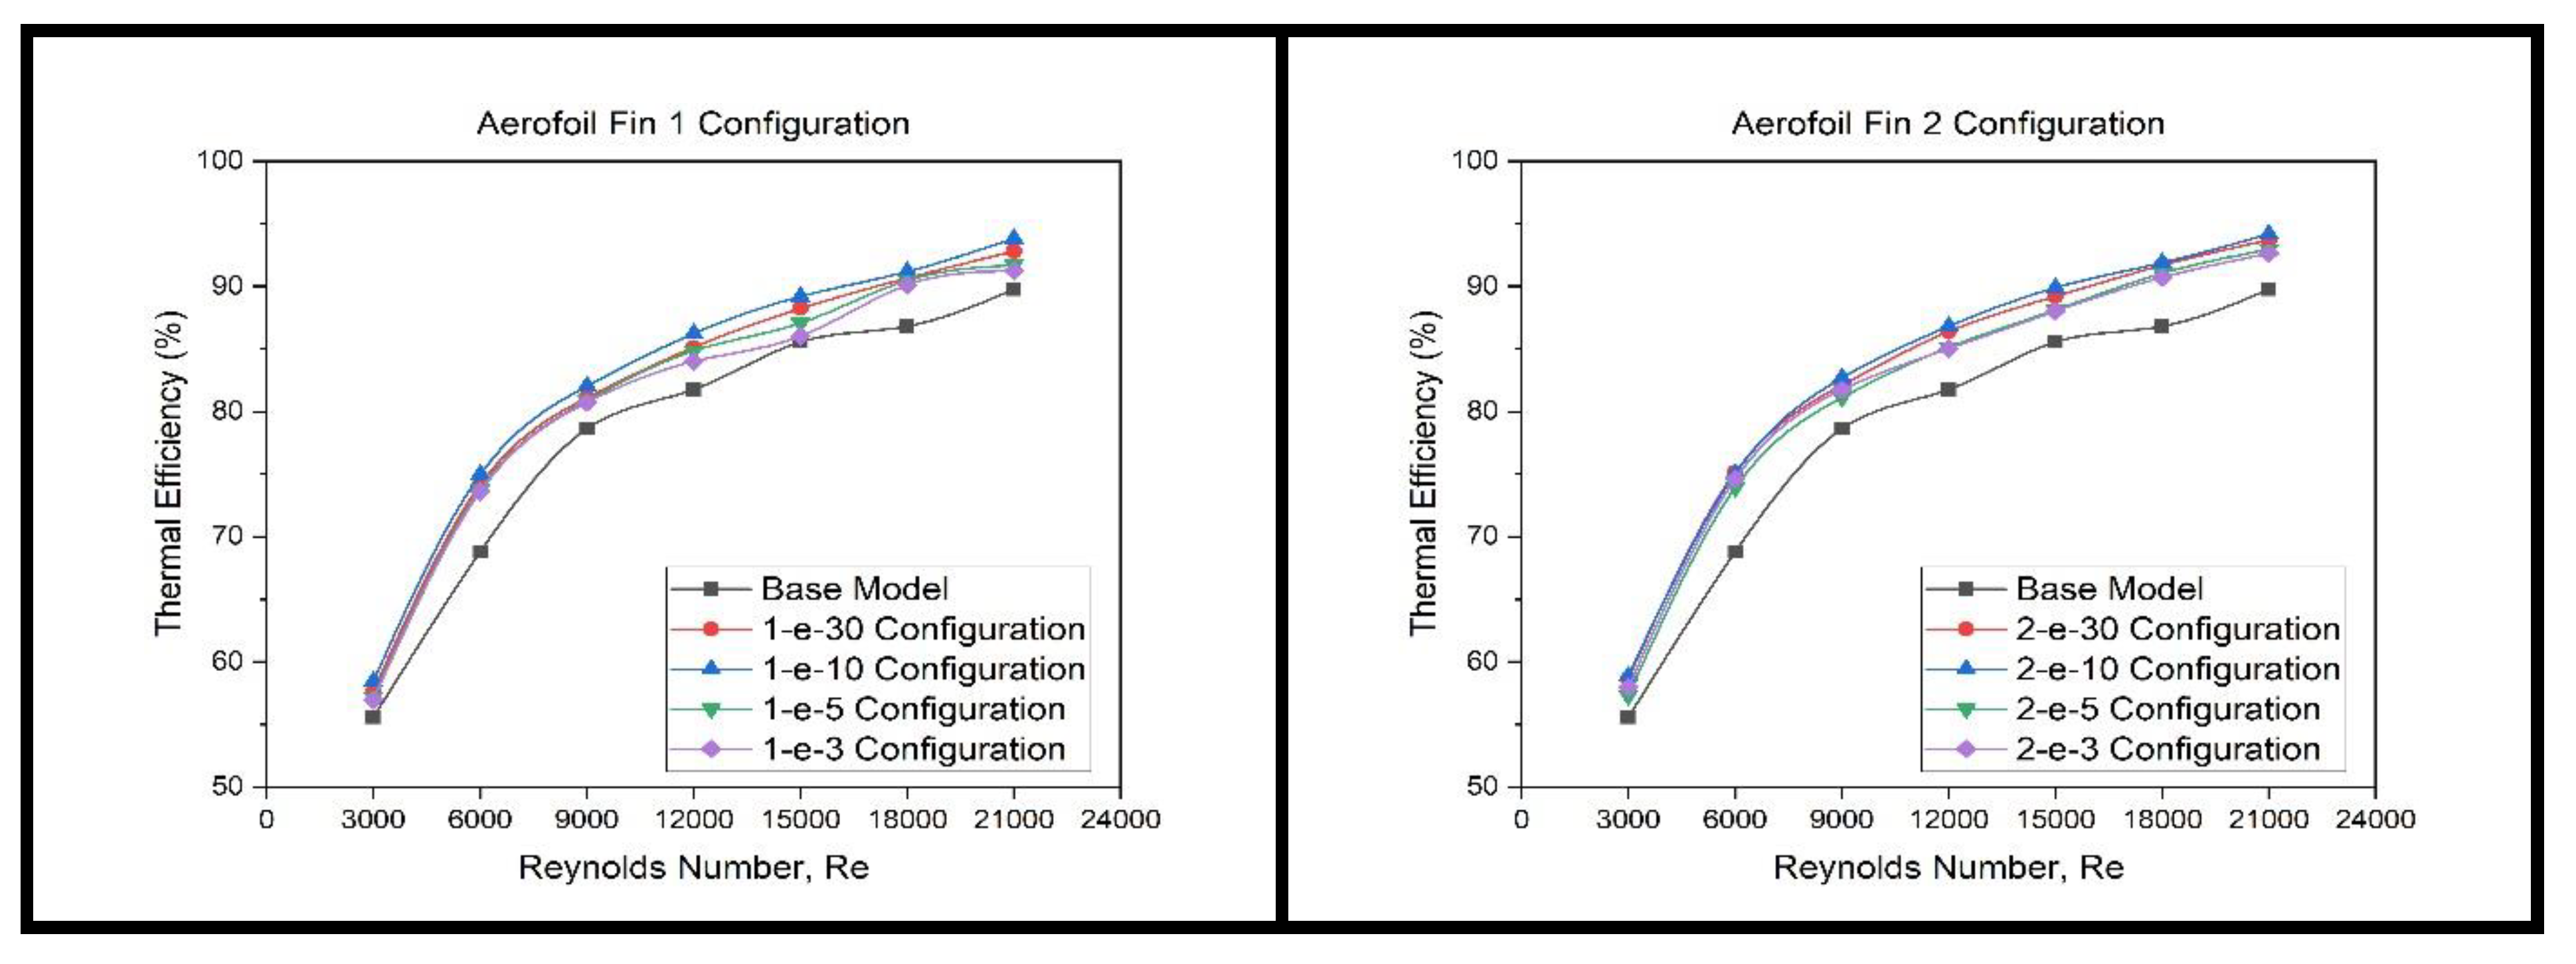
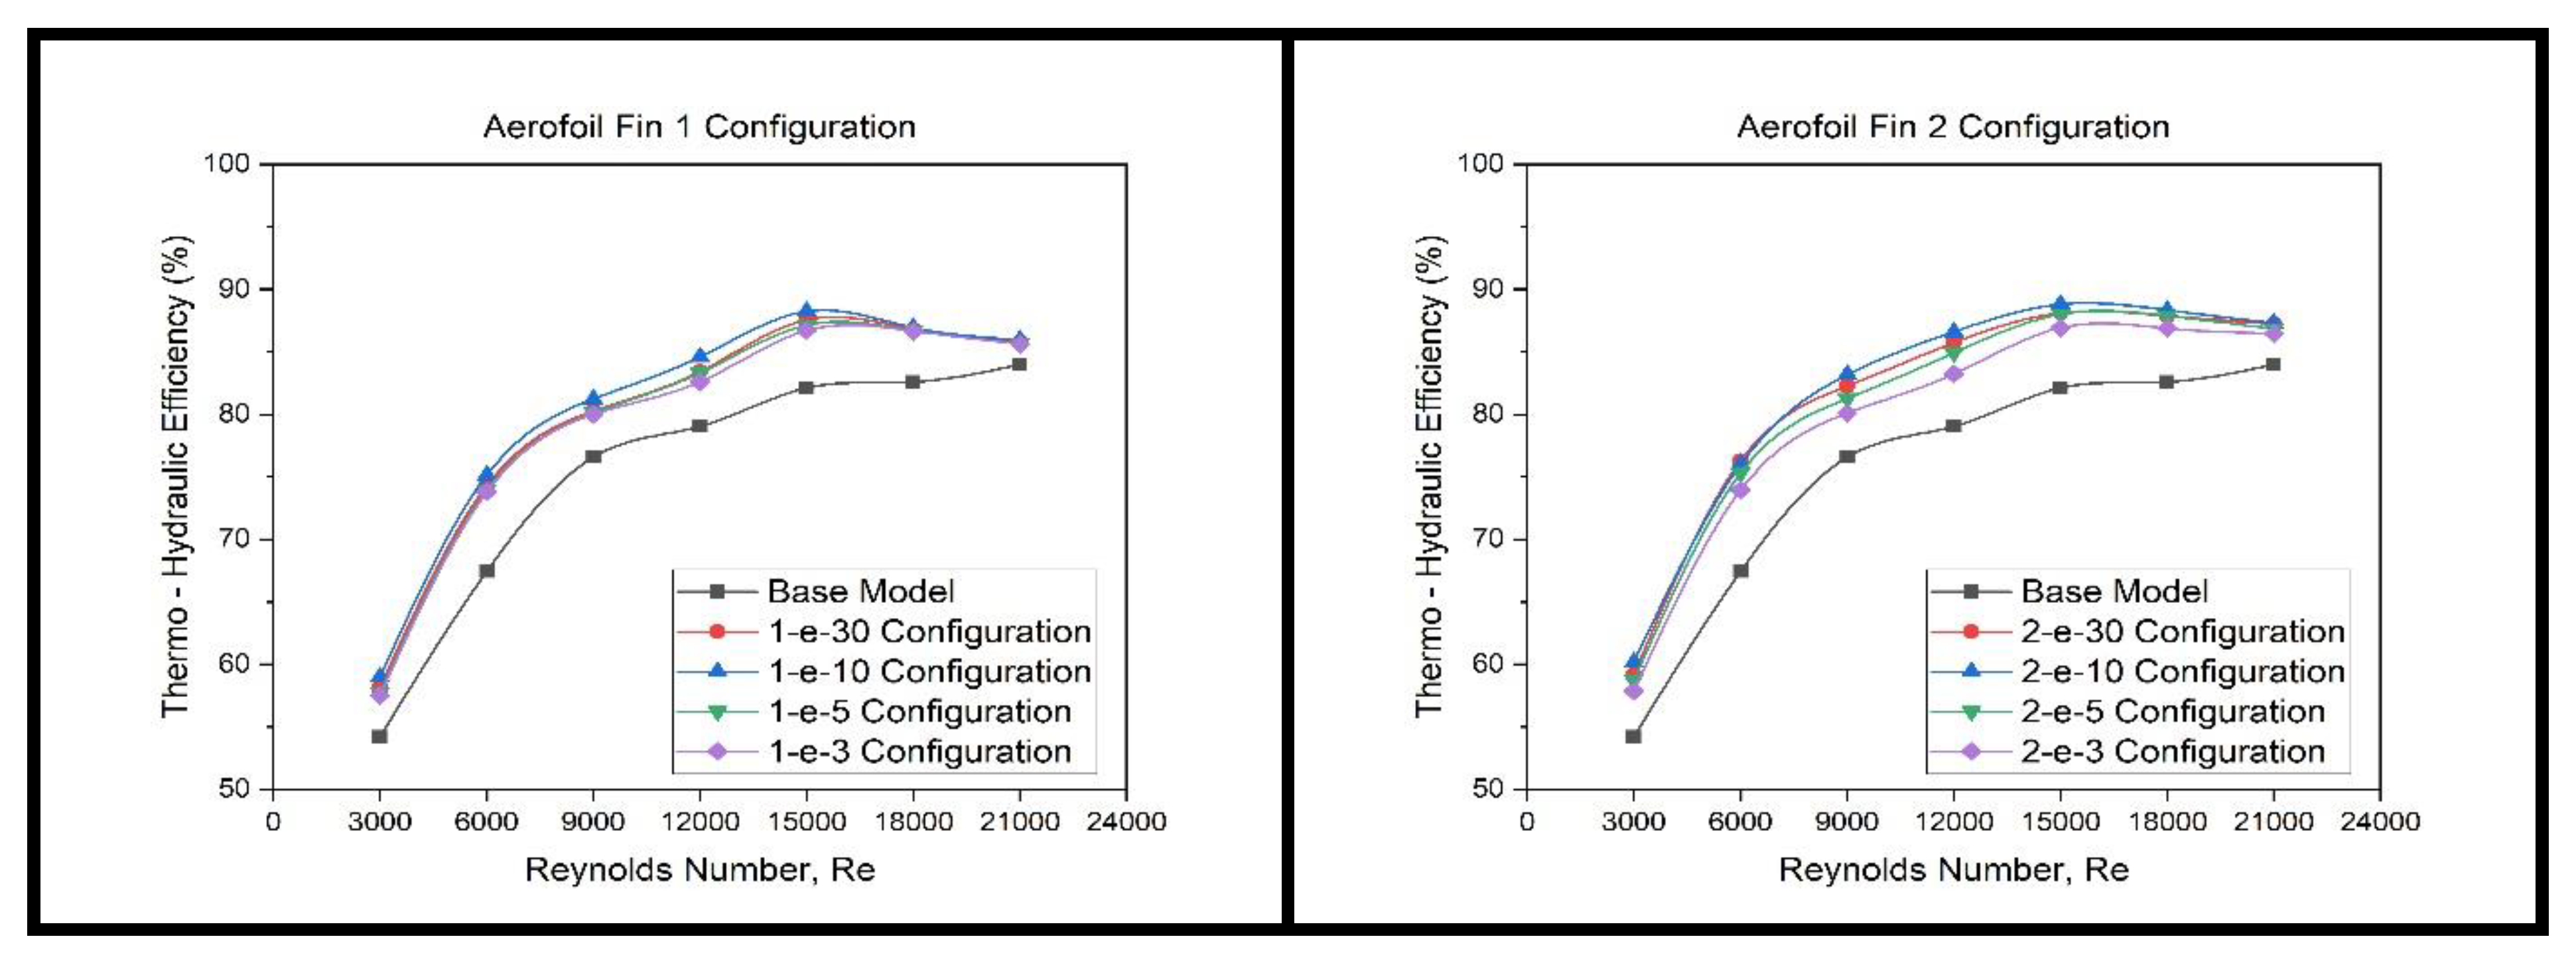
5.1. Heat Transfer Characteristics

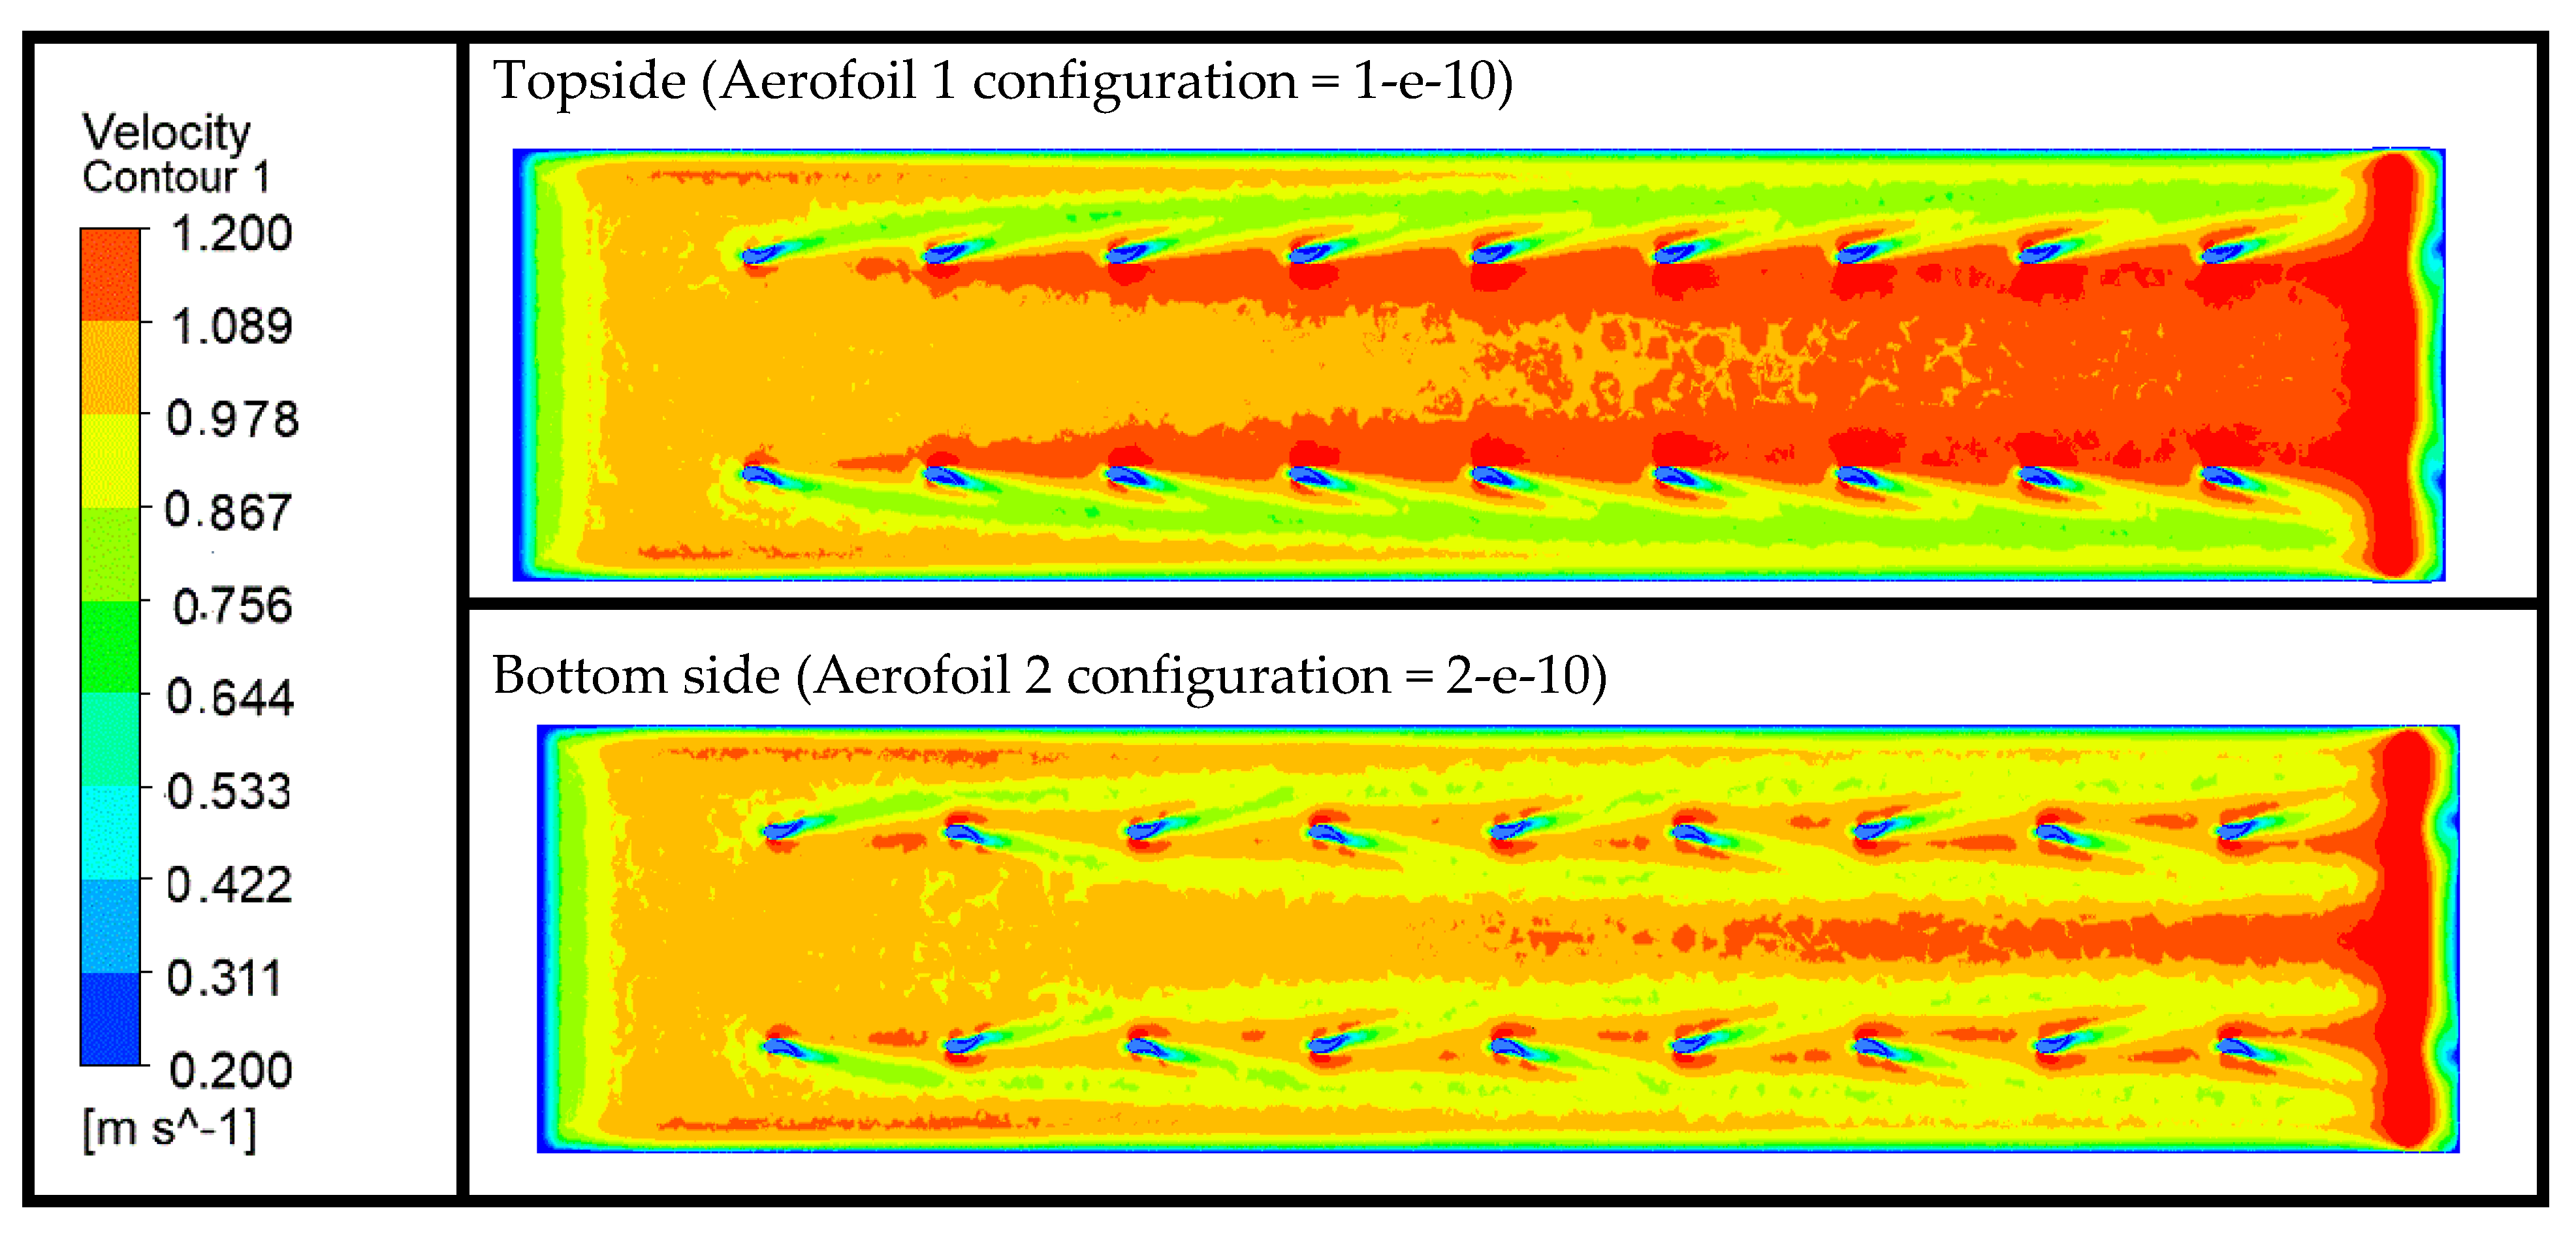
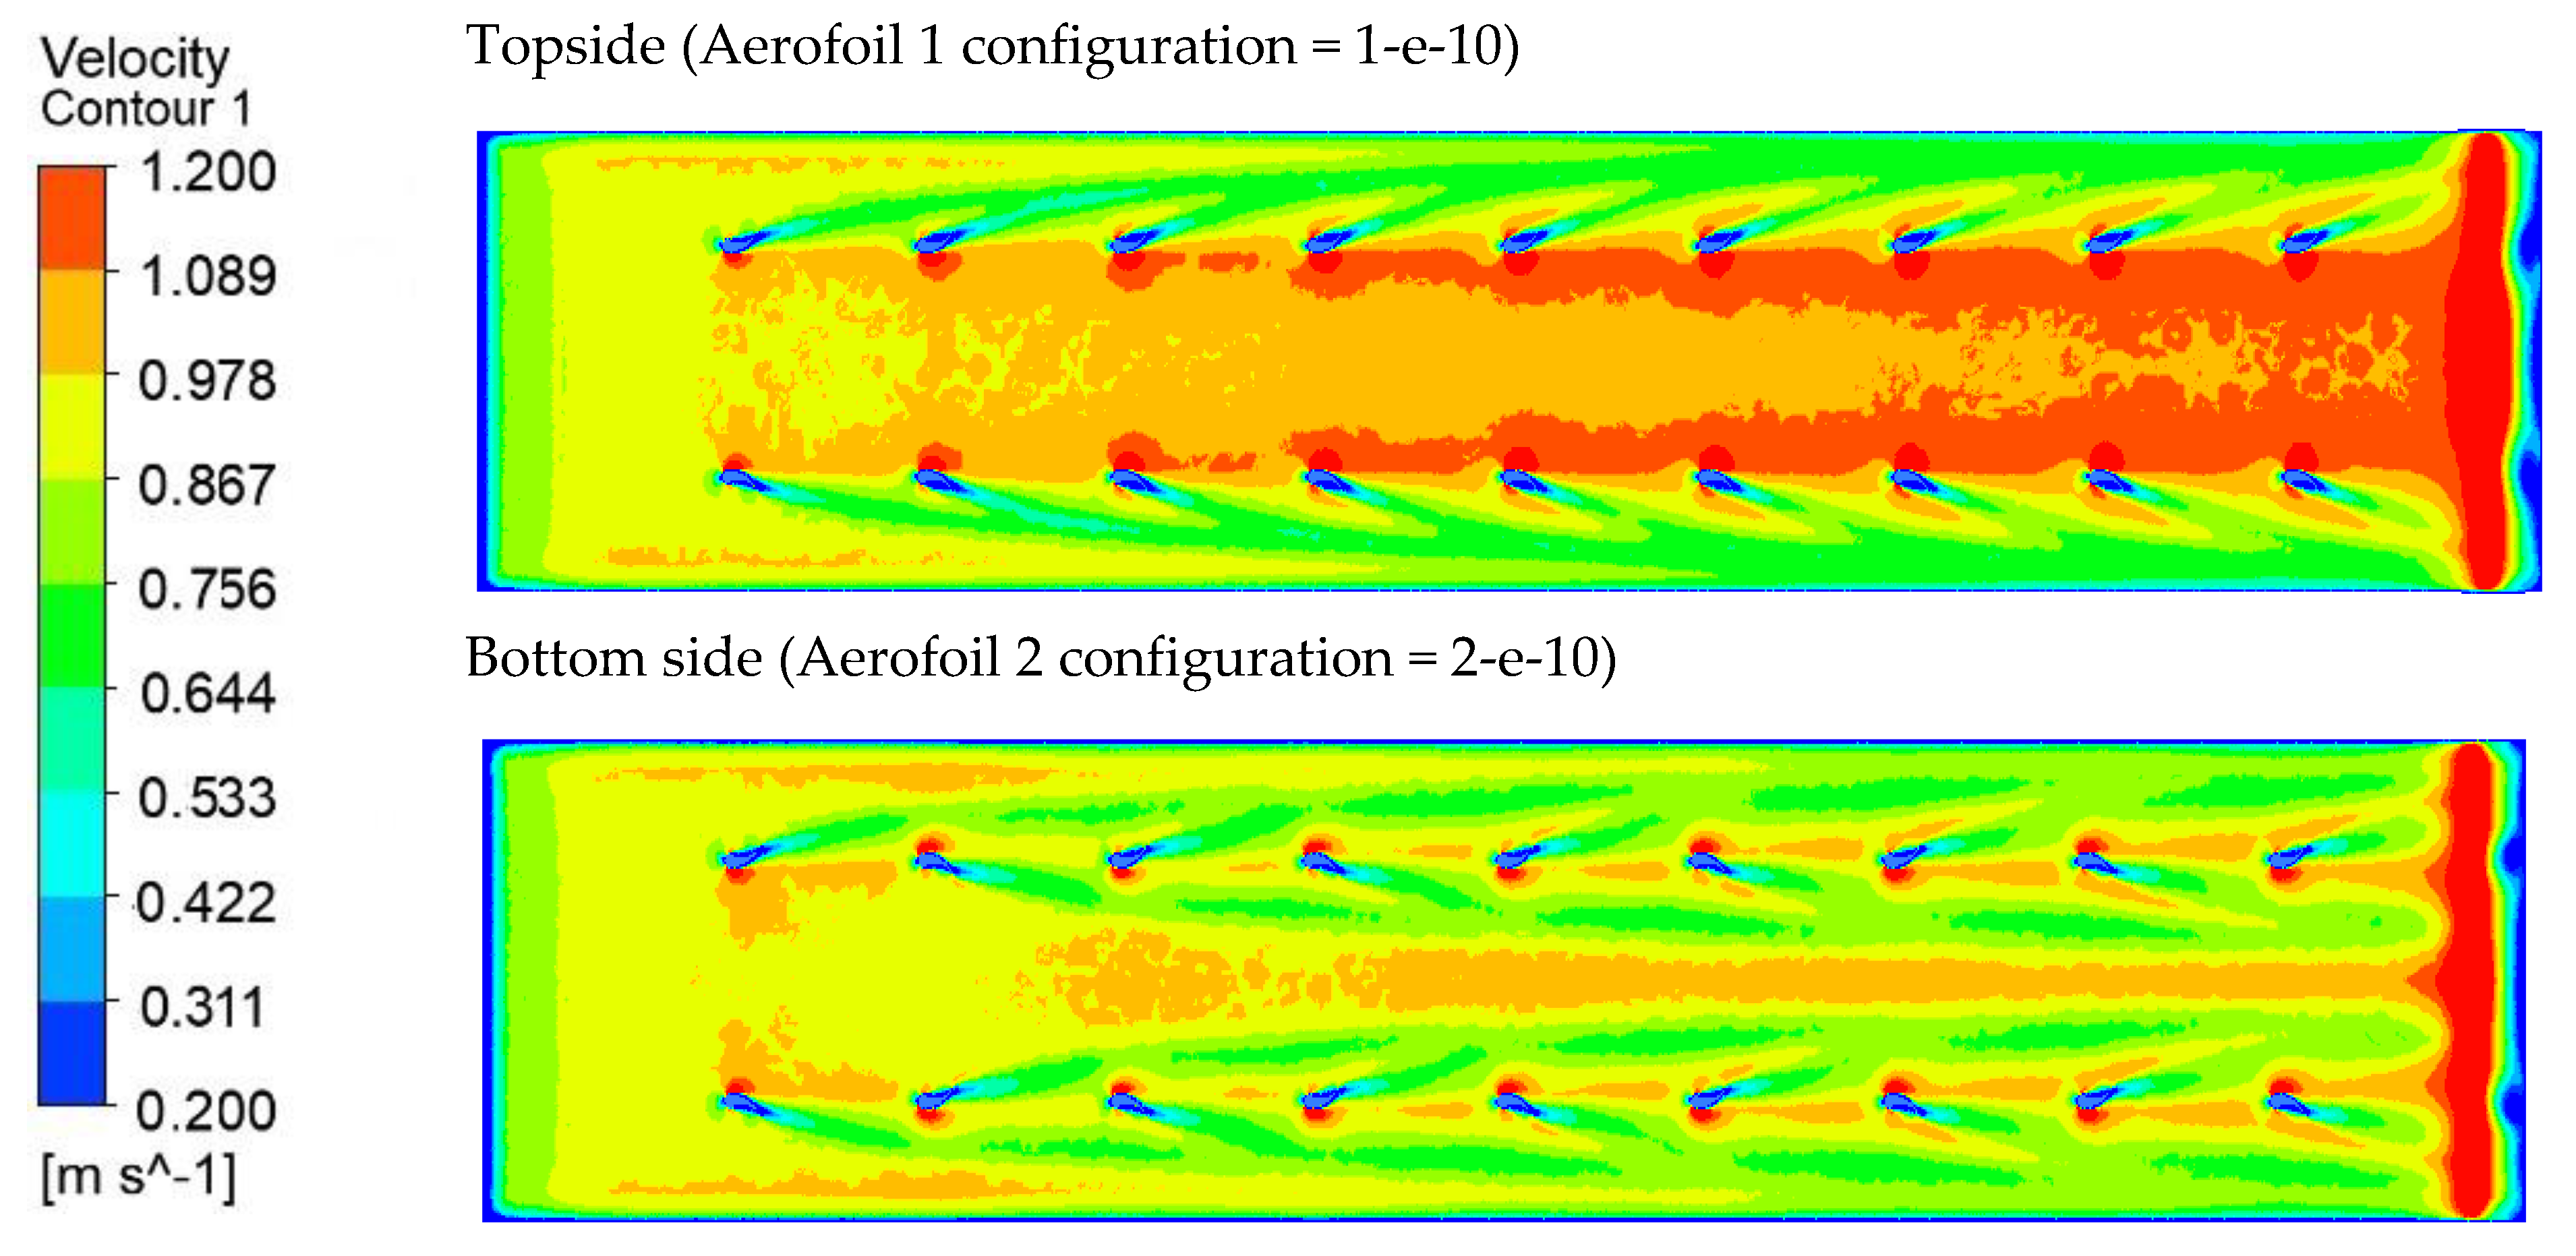
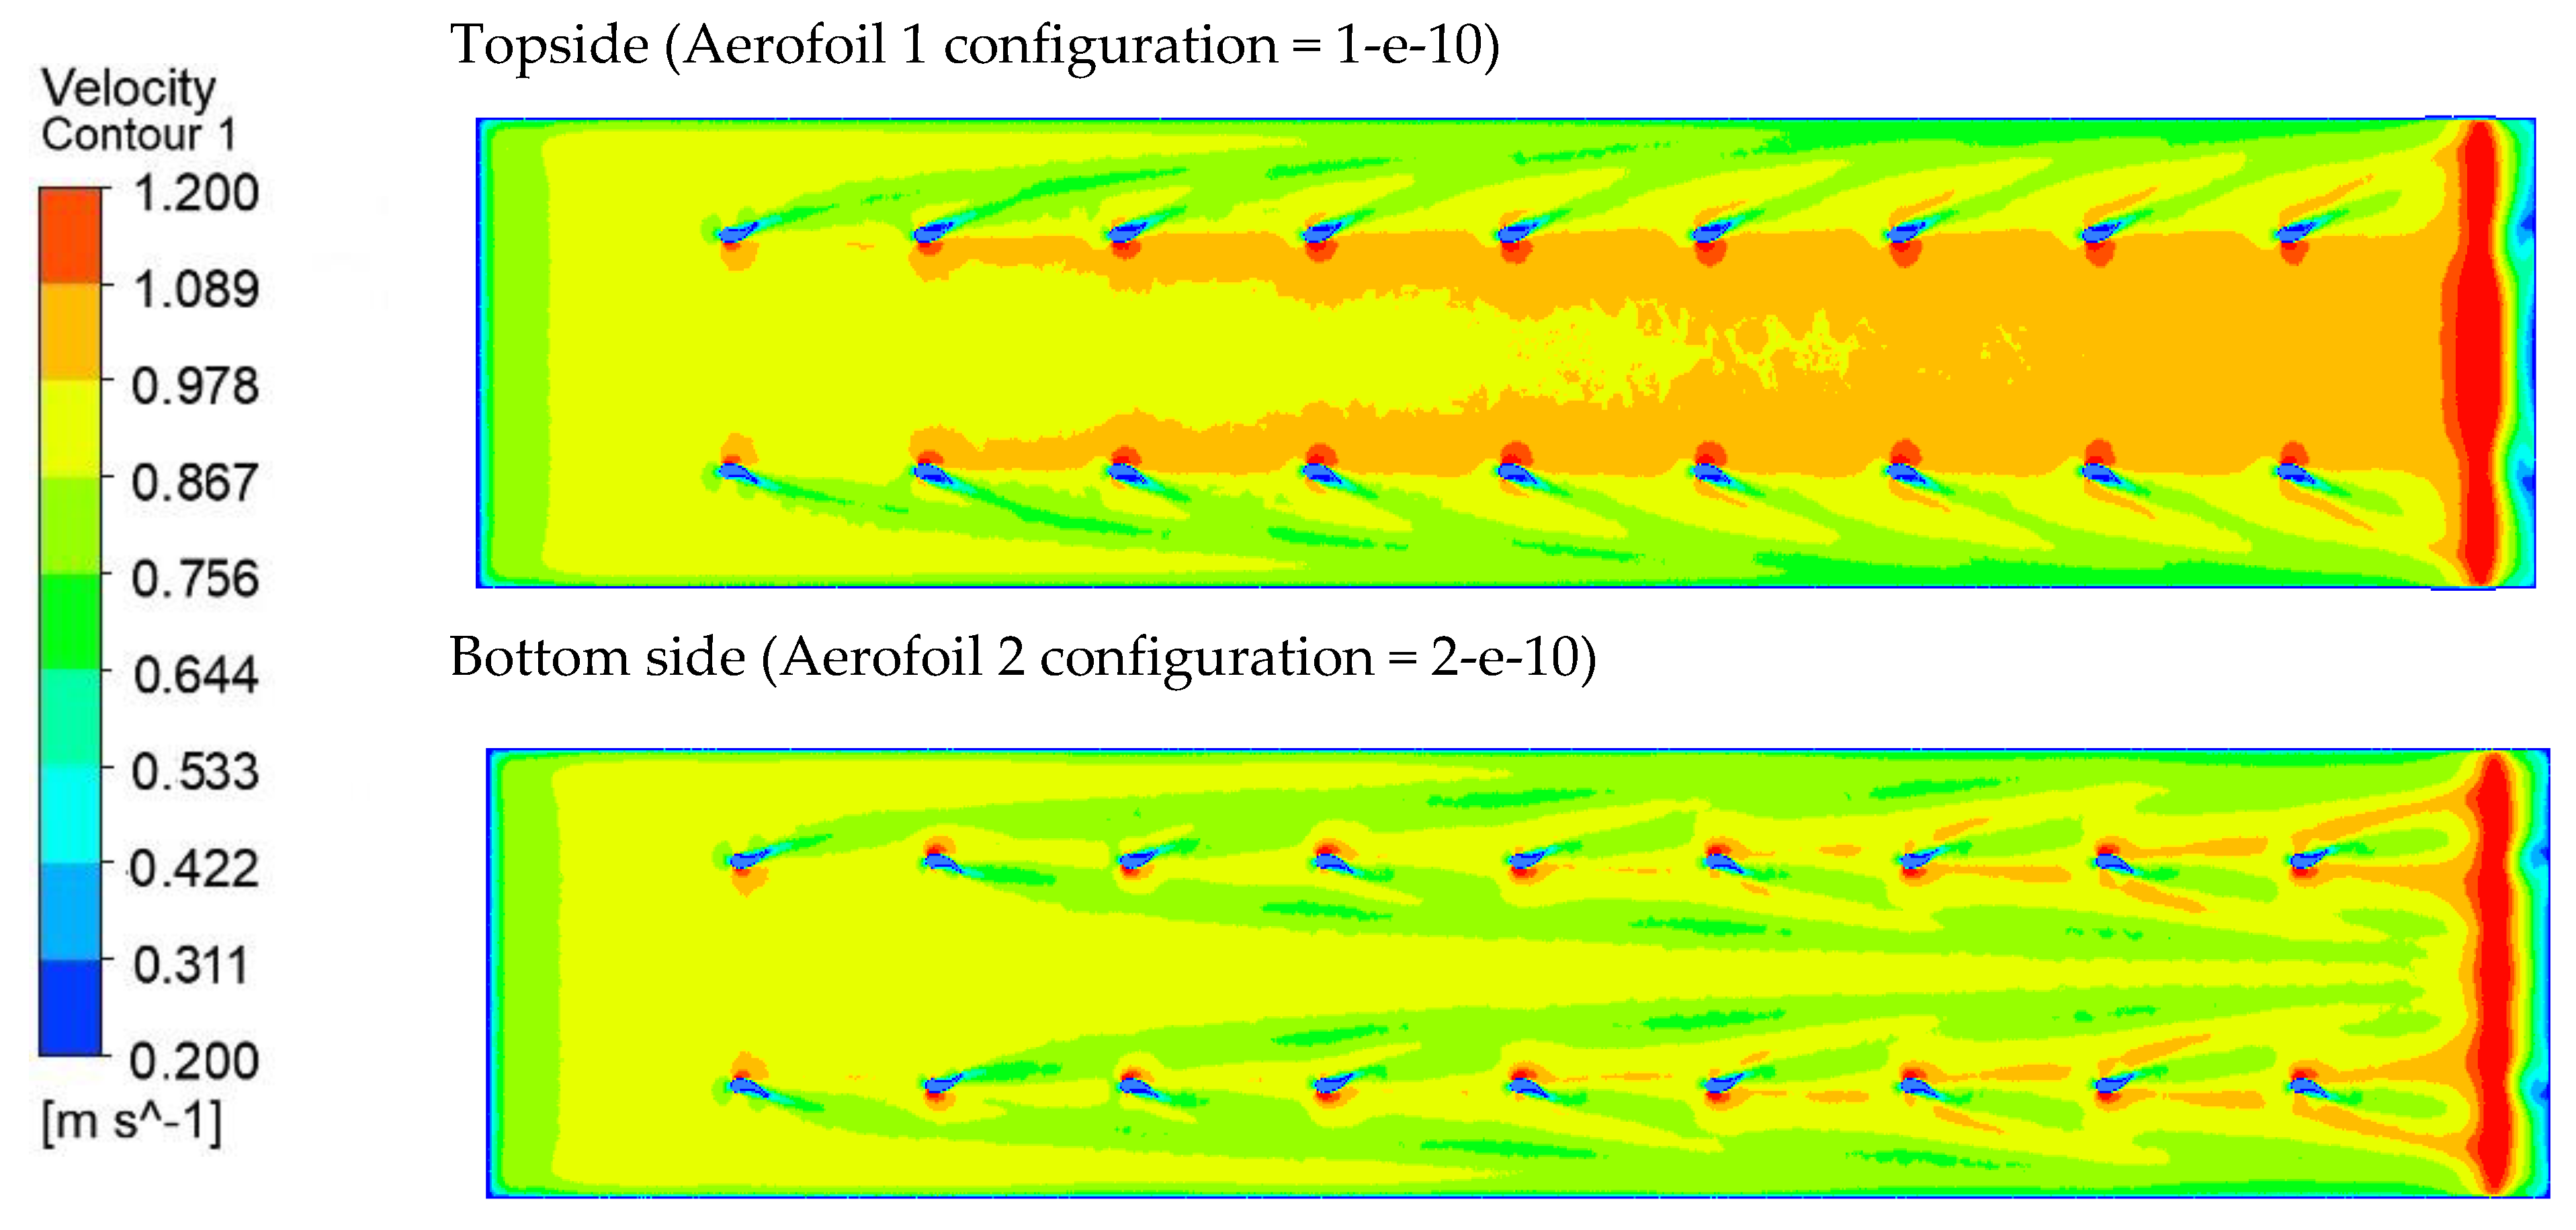
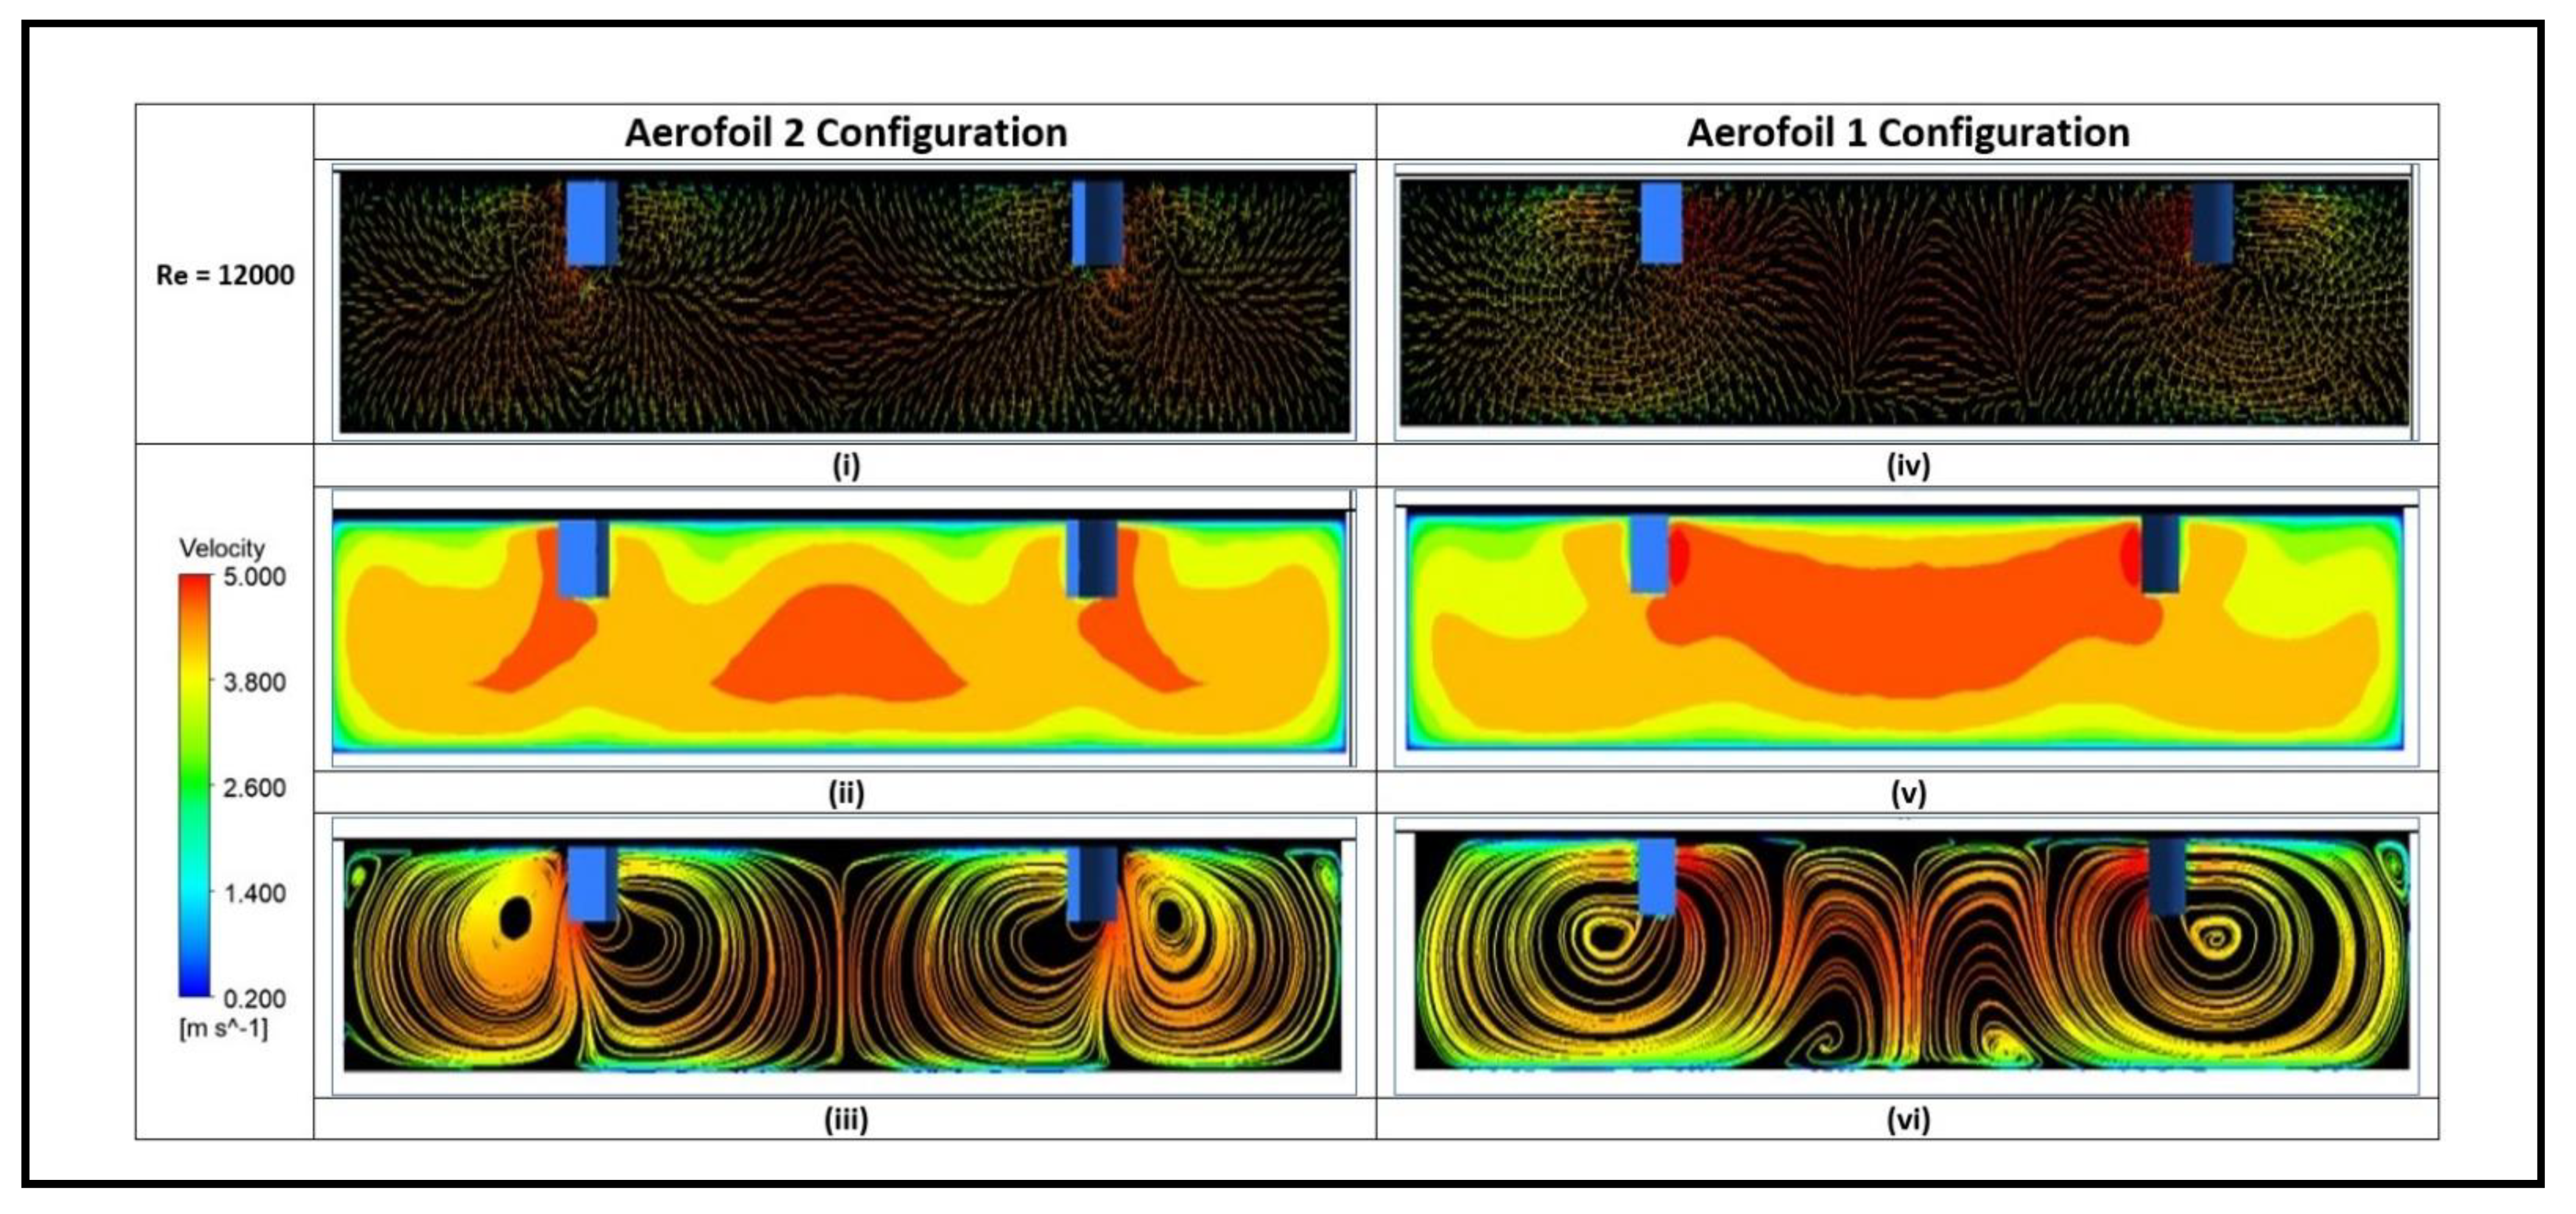
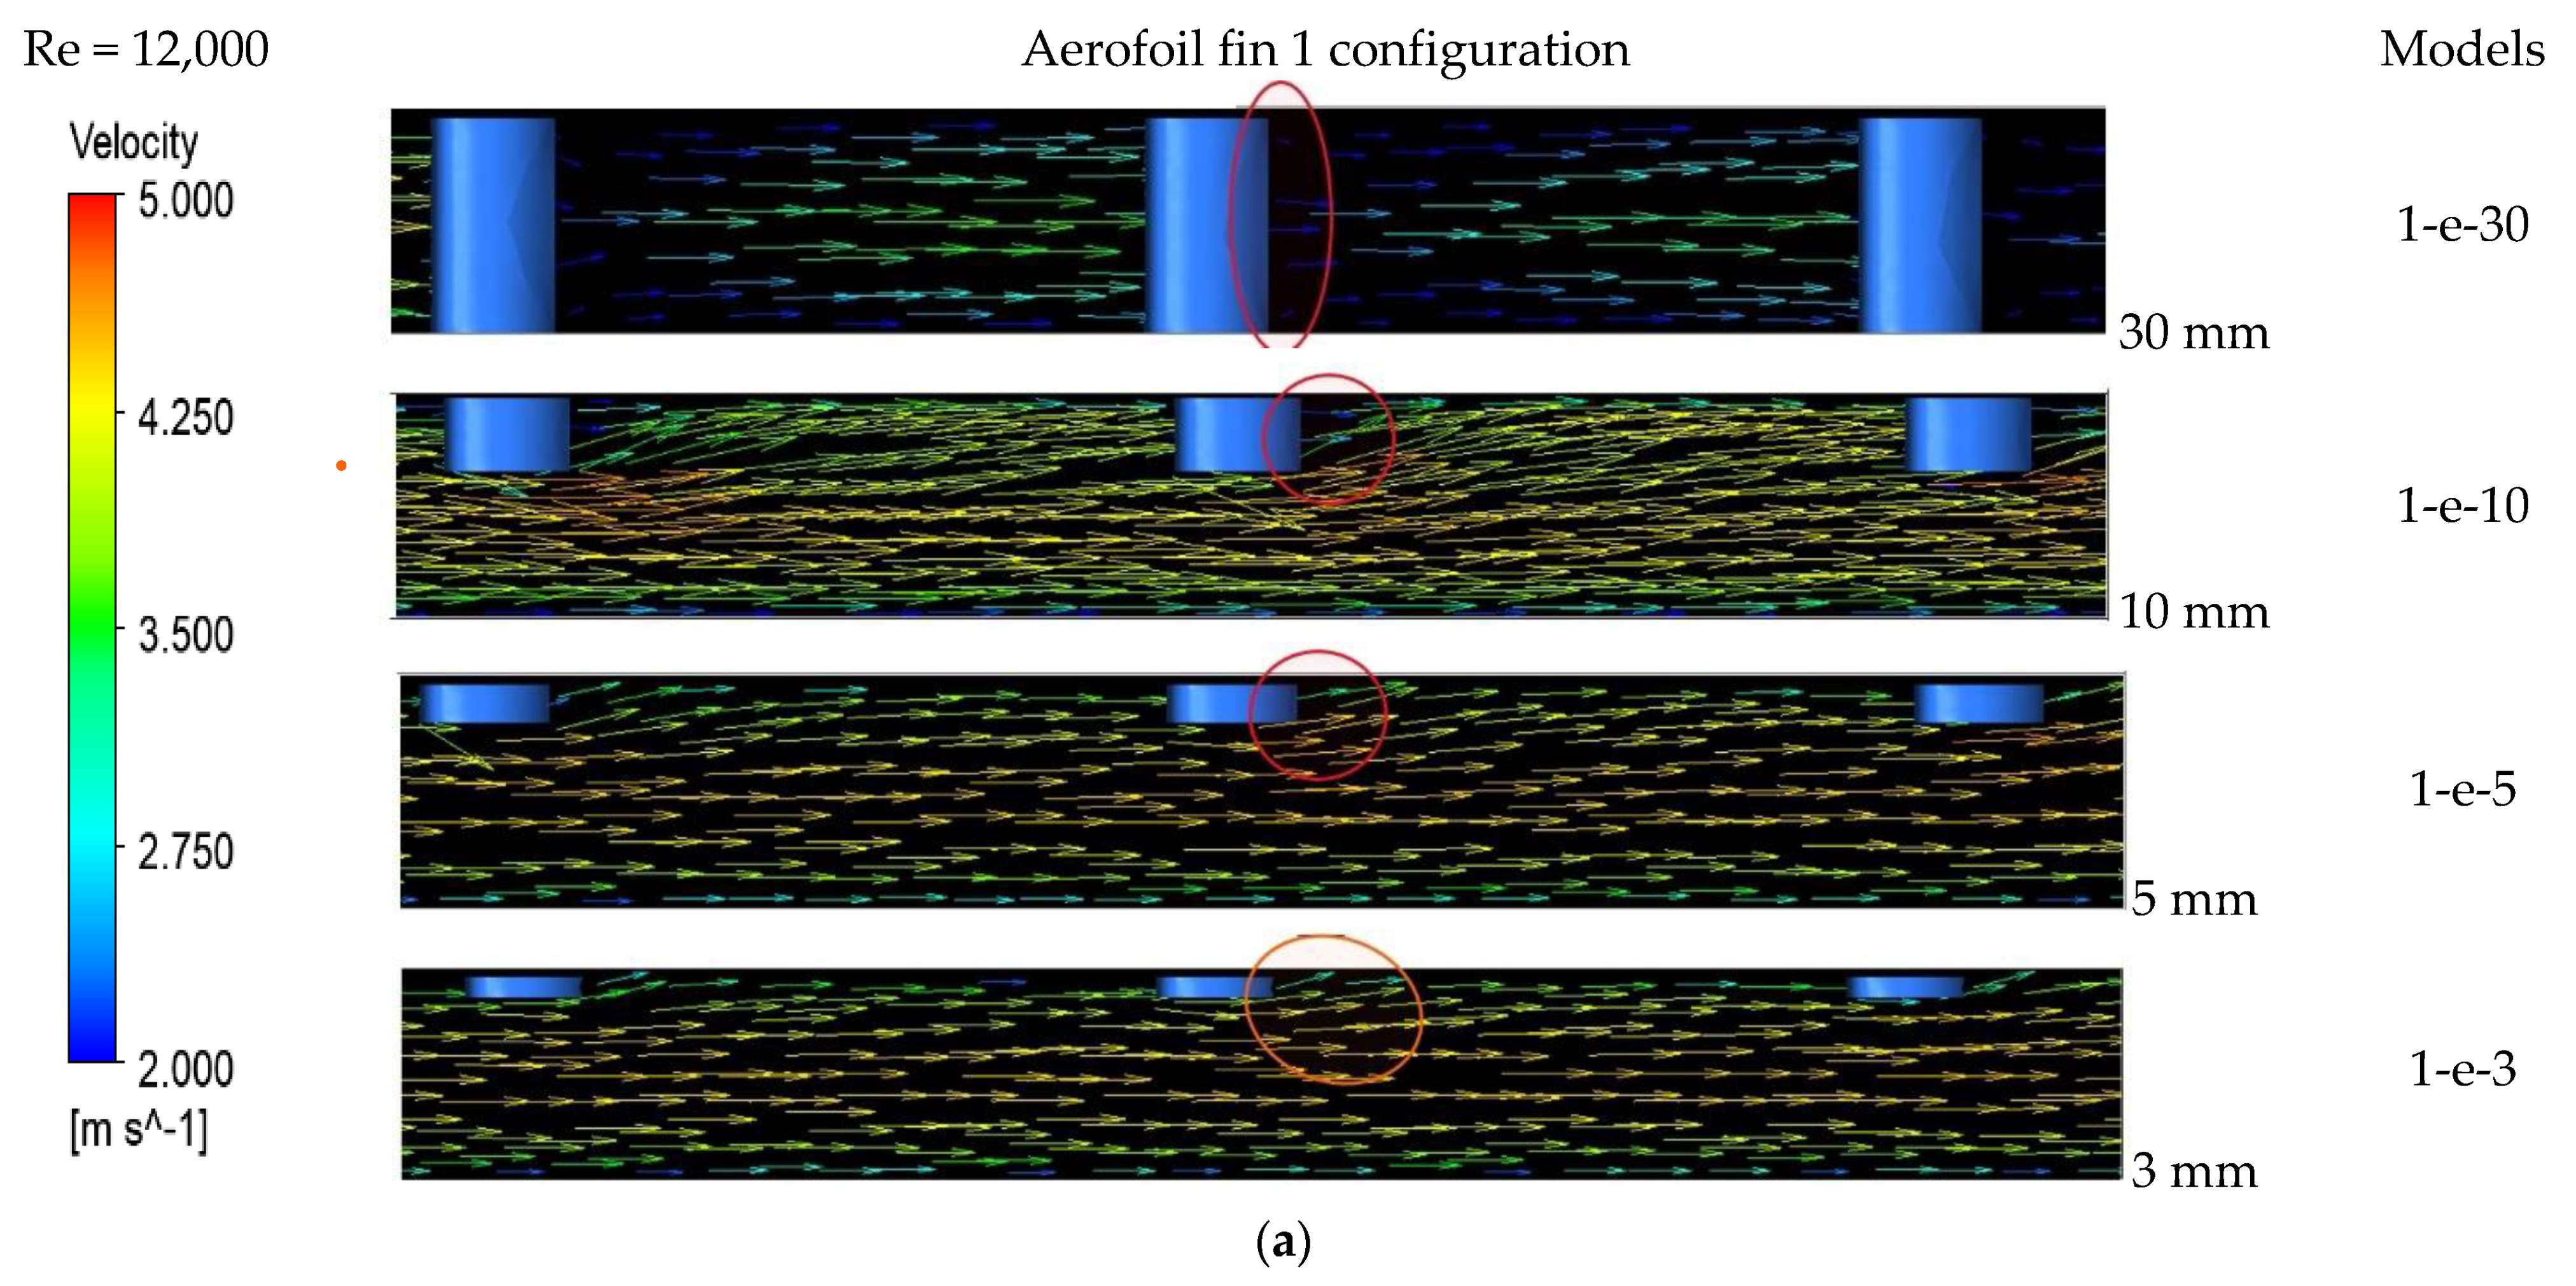
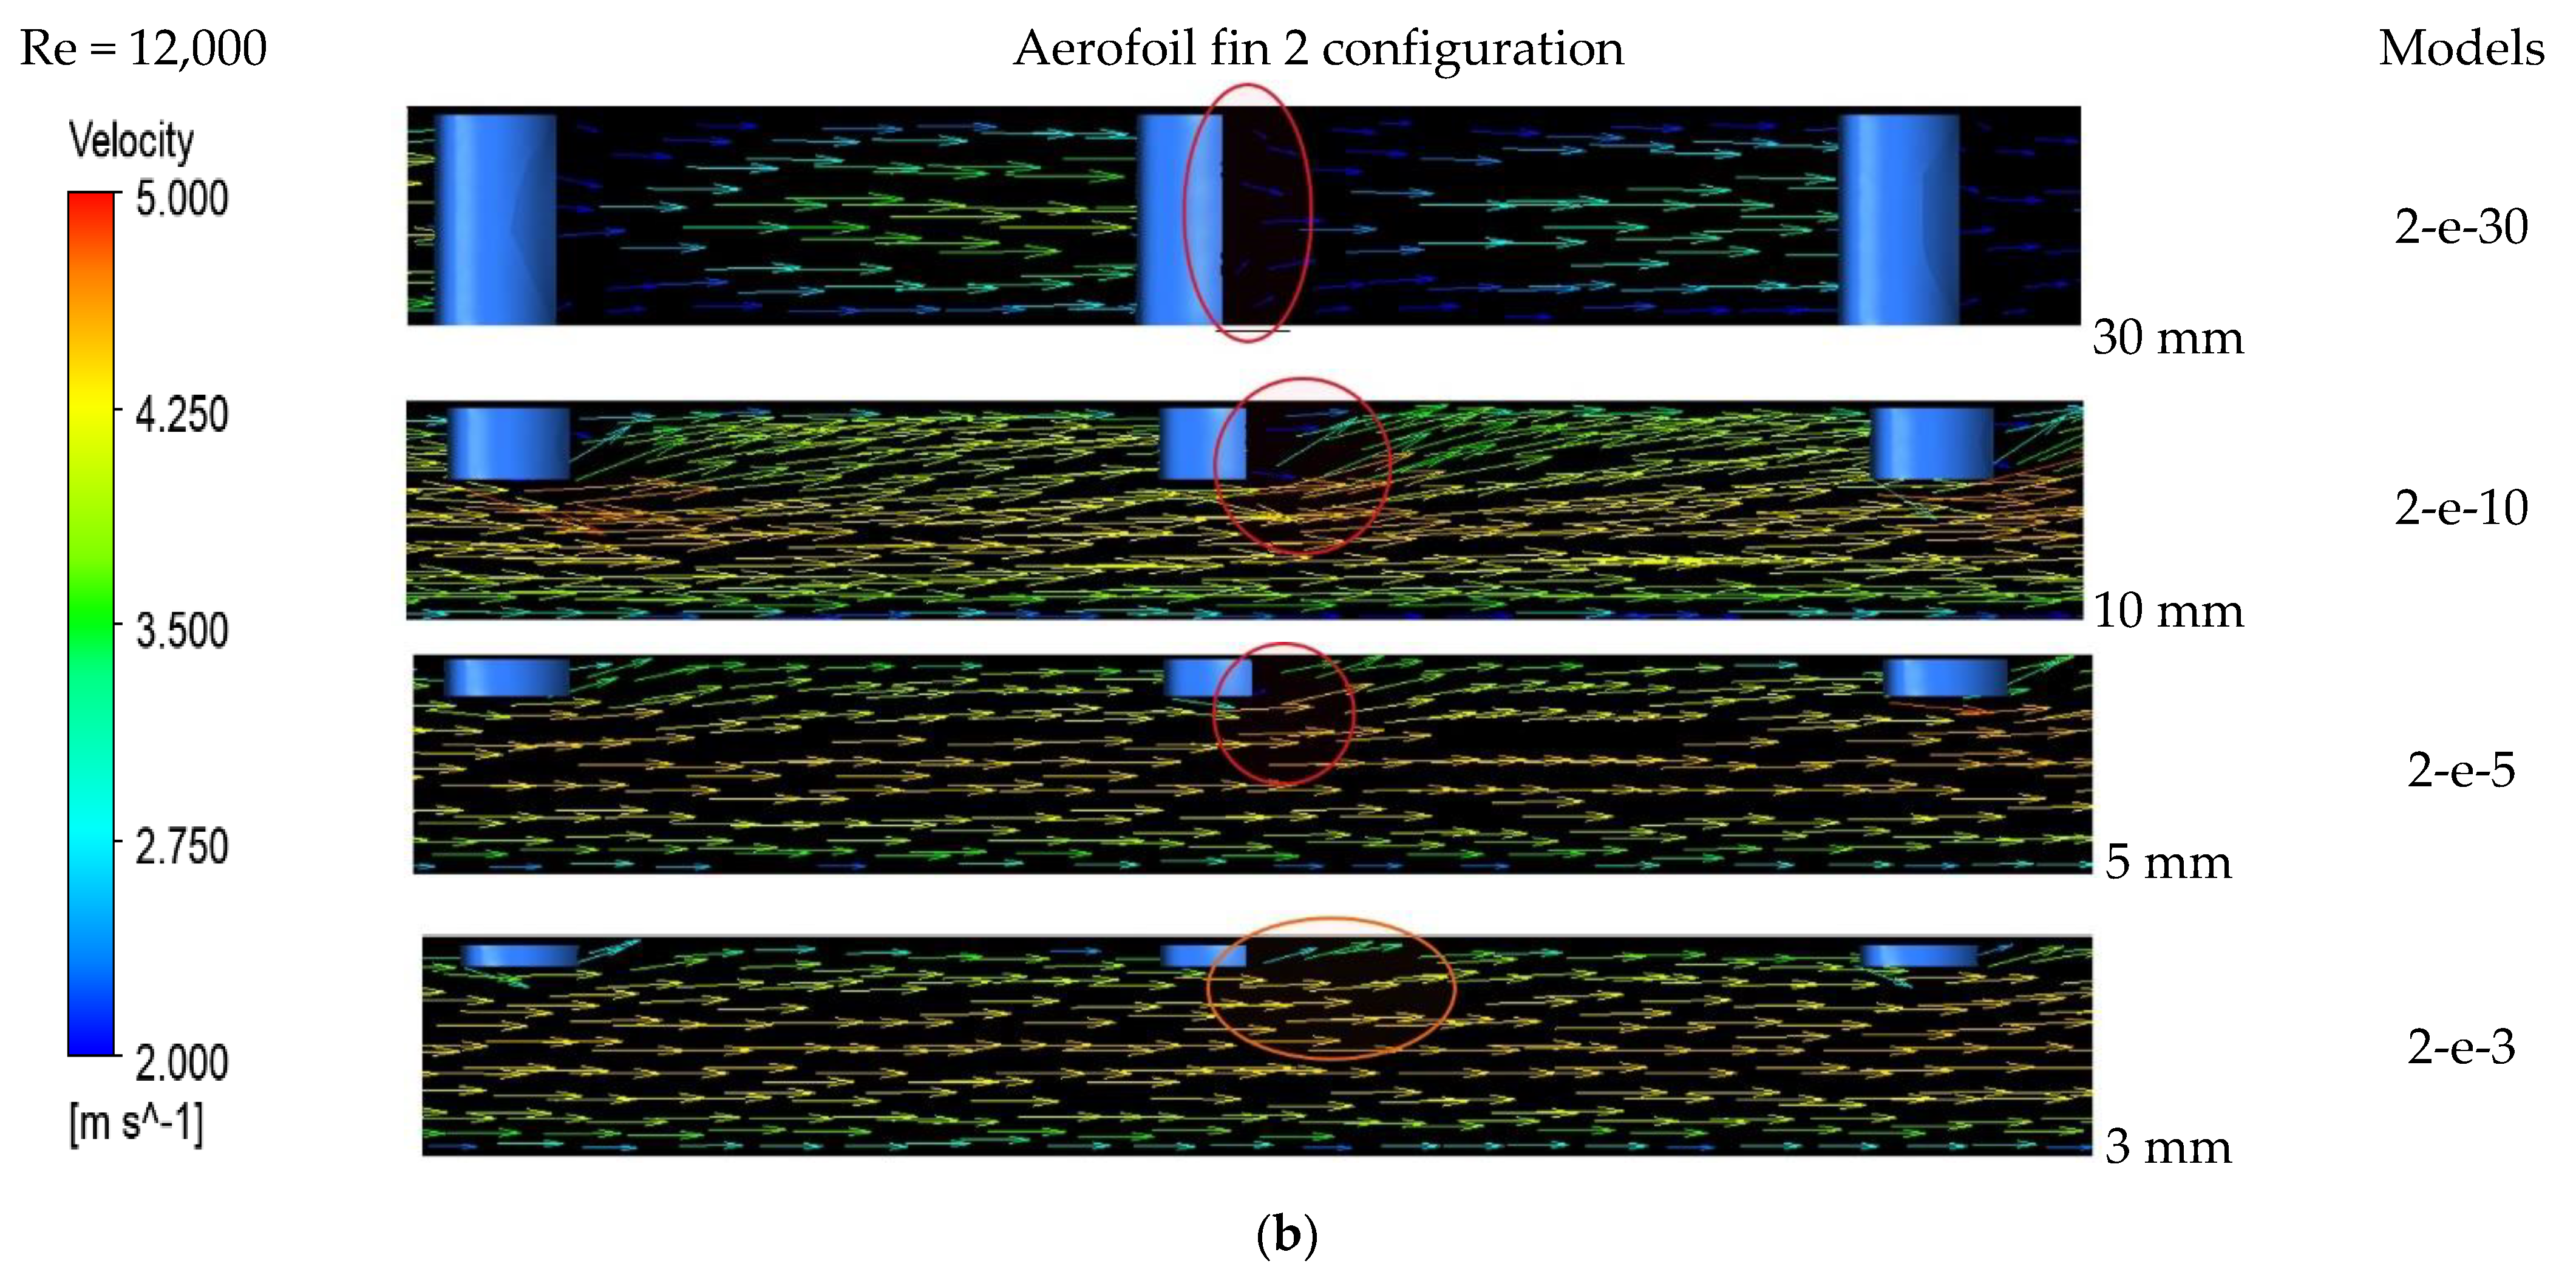
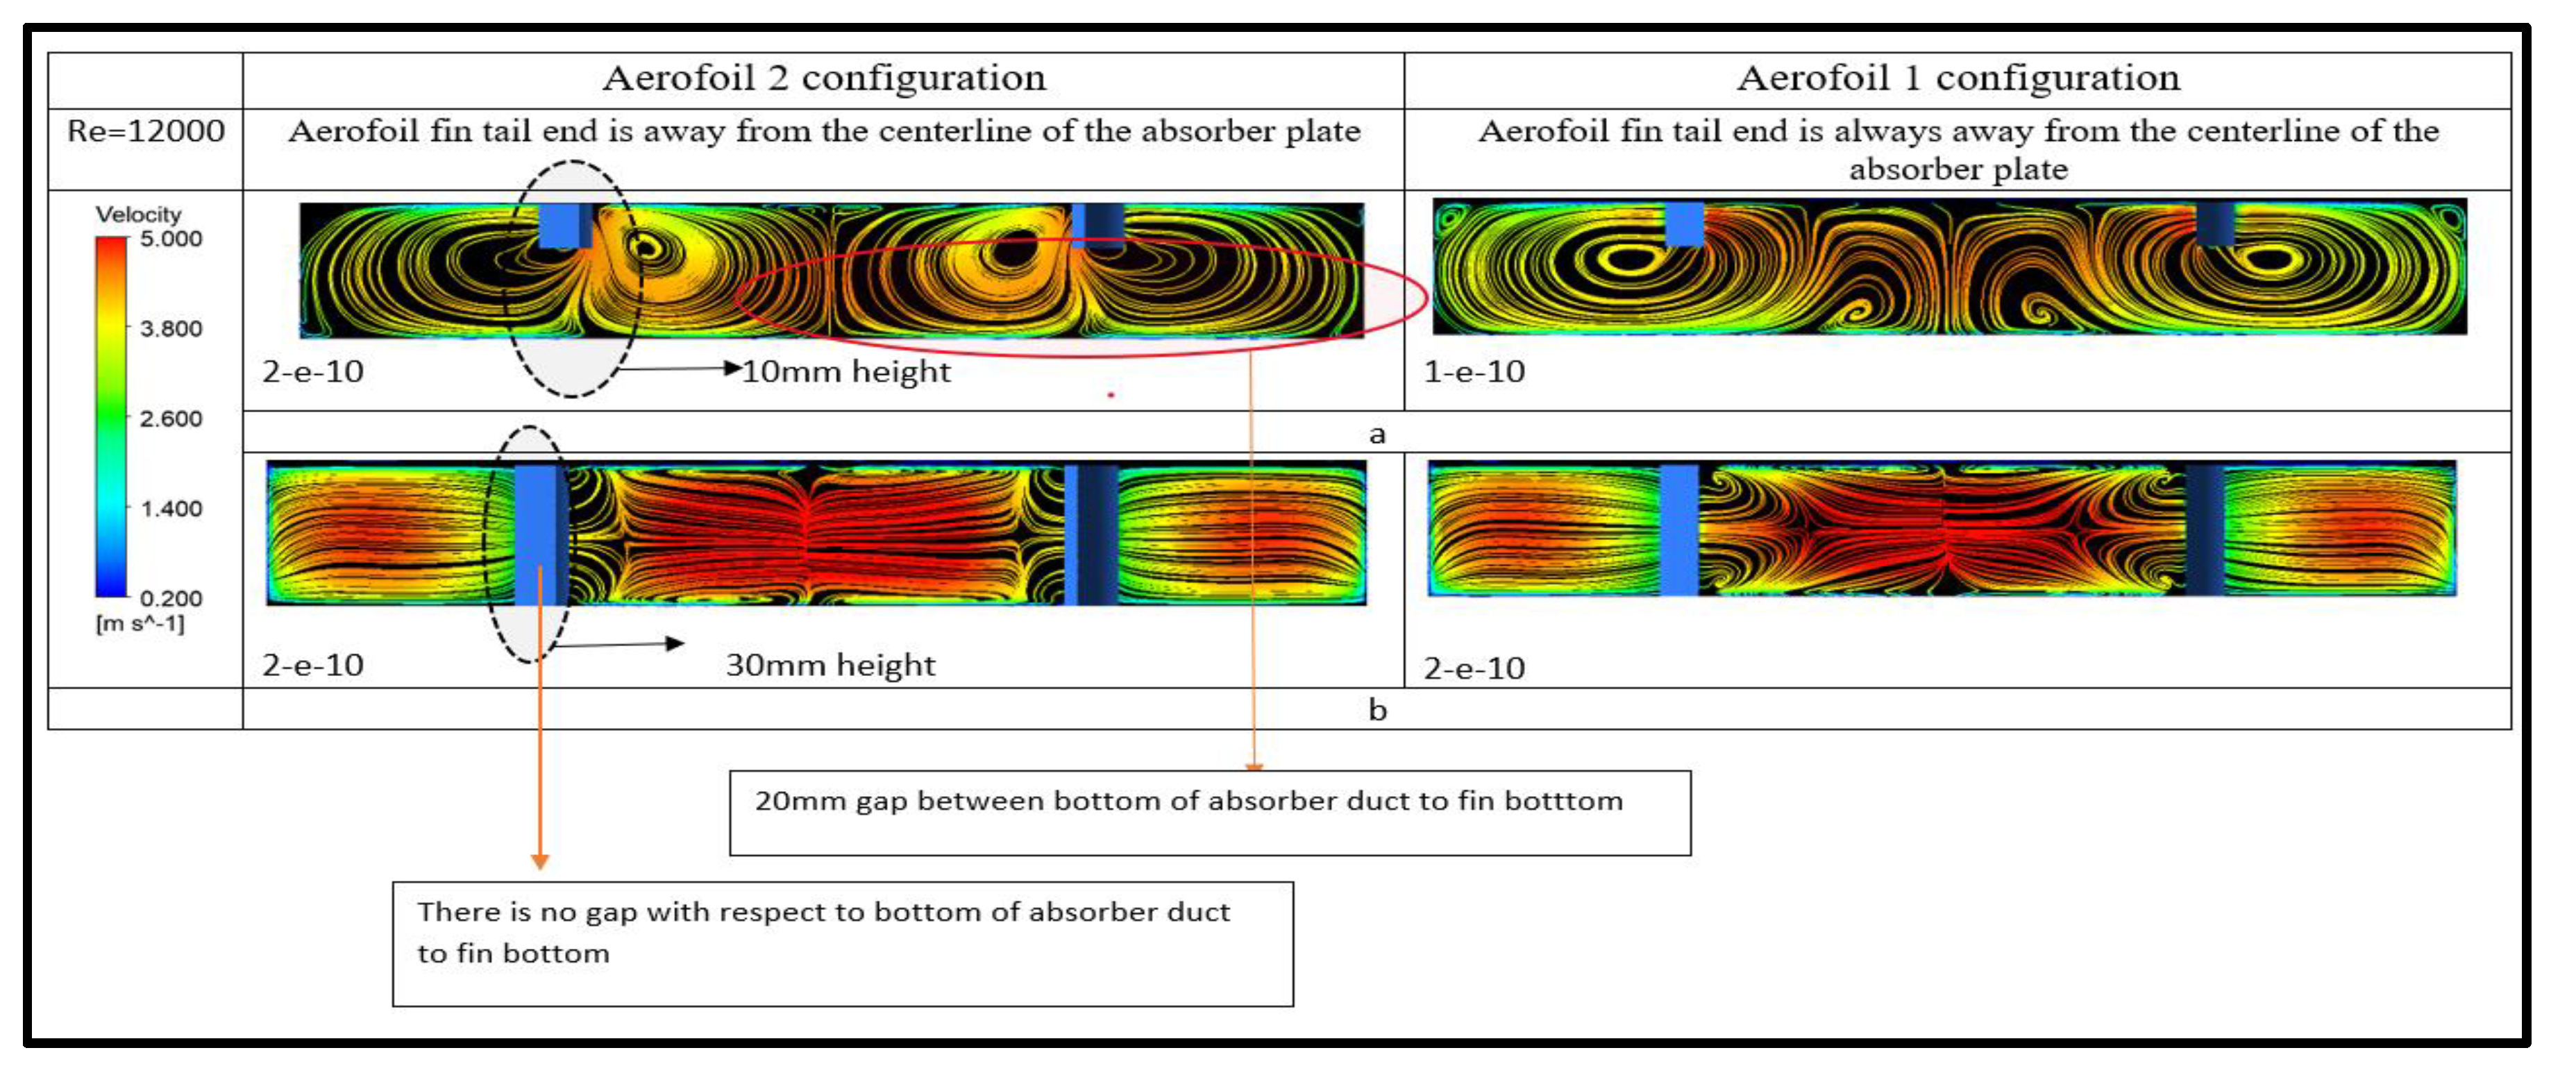
Effect of the Configuration Type of Aerofoil Fin

Numerical analyses were carried out on both the aerofoil configurations 1 and 2 at lower, medium, and higher Reynolds numbers. Figure 13, Figure 14 and Figure 15 show the contour plots of velocity for the Re values of 3000, 12,000 and 24,000, respectively. To determine the efficacy of the aerofoil type, the fin length was fixed at 10 mm and fins are located at a pitch of 100 mm. It was seen that both of the arrangements of the aerofoil configuration lead to an improvement in the thermal efficiency of the DPSAH model.
At lower values of Re, the fluid flow in the absorber duct is properly mixed (fluid mixing), thus the fluid flowing in the duct is able to extract as much heat as needed from the heated absorber surface resulting in the enhancement of the thermal performance of SAH. Figure 13 shows the top side of the aerofoil 1 configuration in which the fluid is not properly mixed in the main stream and mixing of the fluid flow is only taking place at the wall side of the absorber plate. A relatively higher fluid velocity is also seen at the central region of the absorber plate. Figure 13 depicts the bottom side of the aerofoil 2 configuration arrangement where the mixing of fluids is well established in the absorber plate and a relatively lower fluid velocity is observed in the central region. This leads to improvement in the thermal efficiency for this aerofoil 2 configuration.
Similarly, for the values of Re = 12,000 and 24,000 as the Reynolds number is increased, the flow rate of air increases, resulting in better fluid velocity distribution. This enhances the thermal efficiency. This fact can be justified with the help of the velocity contour plots seen in Figure 14 and Figure 15 for the medium and higher values of Re, respectively.
The aerofoil 2 configuration is arranged in such a way that the aerofoil fin guides the fluid flow on all sides of the absorber plate, i.e., the wall side and central region of the absorber plate. Hence, from Figure 13, Figure 14 and Figure 15 it can be concluded that the aerofoil 2 configuration has better fluid flow mixing and an increased rate of heat transfer when compared with that for the aerofoil 1 configuration.
Figure 16 depicts the effect of different aerofoil configurations on the thermal efficiency of the SAH. The collector’s thermal efficiency is proportional to the mass flow rate through the inlet duct. The reason for an increase in thermal efficiency is due to the proper mixing of the fluid flow through the aerofoil fins, resulting in a higher heat transfer rate, as described above. The aerofoil fin 2 configuration has better thermal efficiency when compared to the aerofoil fin configuration 1 for all the fin heights chosen for the study.
Figure 17 shows the vector, contour, and streamline plots for both of the aerofoil fin configurations. The streamline plots show that the vortex is formed alternately in an aerofoil 2 configuration, whereas in the aerofoil 1 configuration vortex a formation is only seen at the sides of the wall of the absorber duct, thus the mixing of the working fluid is at the wall side of the absorber duct only.
As a result, it is observed that the aerofoil 2 configuration, because of the alternative arrangement of the aerofoil fin, causes a vortex generation in the center of the absorber duct as well as on the wall side, resulting in better mixing of the working fluid and thus more heat transfer from the absorber plate to the working fluid is seen.
Figure 18 shows a plot of thermohydraulic efficiency versus Re for the aerofoil fin 1 and 2 configurations. Thermo-hydraulic efficiency includes both thermal efficiency and pumping power. In the figure corresponding to 30 mm, 10 mm, 5 mm, and 3 mm height of the fin, the aerofoil fin 2 configuration has more thermo-hydraulic efficiency compared to the aerofoil fin 1 configuration. This is because the aerofoil fin 2 configuration is arranged in such a way that the aerofoil fin guides the air flow in all the directions, whereas in the aerofoil fin 1 configuration the air flow is on one side (i.e., at the sides of the wall), and thus creates extra pressure leading to an increase in pumping power and in turn resulting in the reduced value of thermohydraulic efficiency.

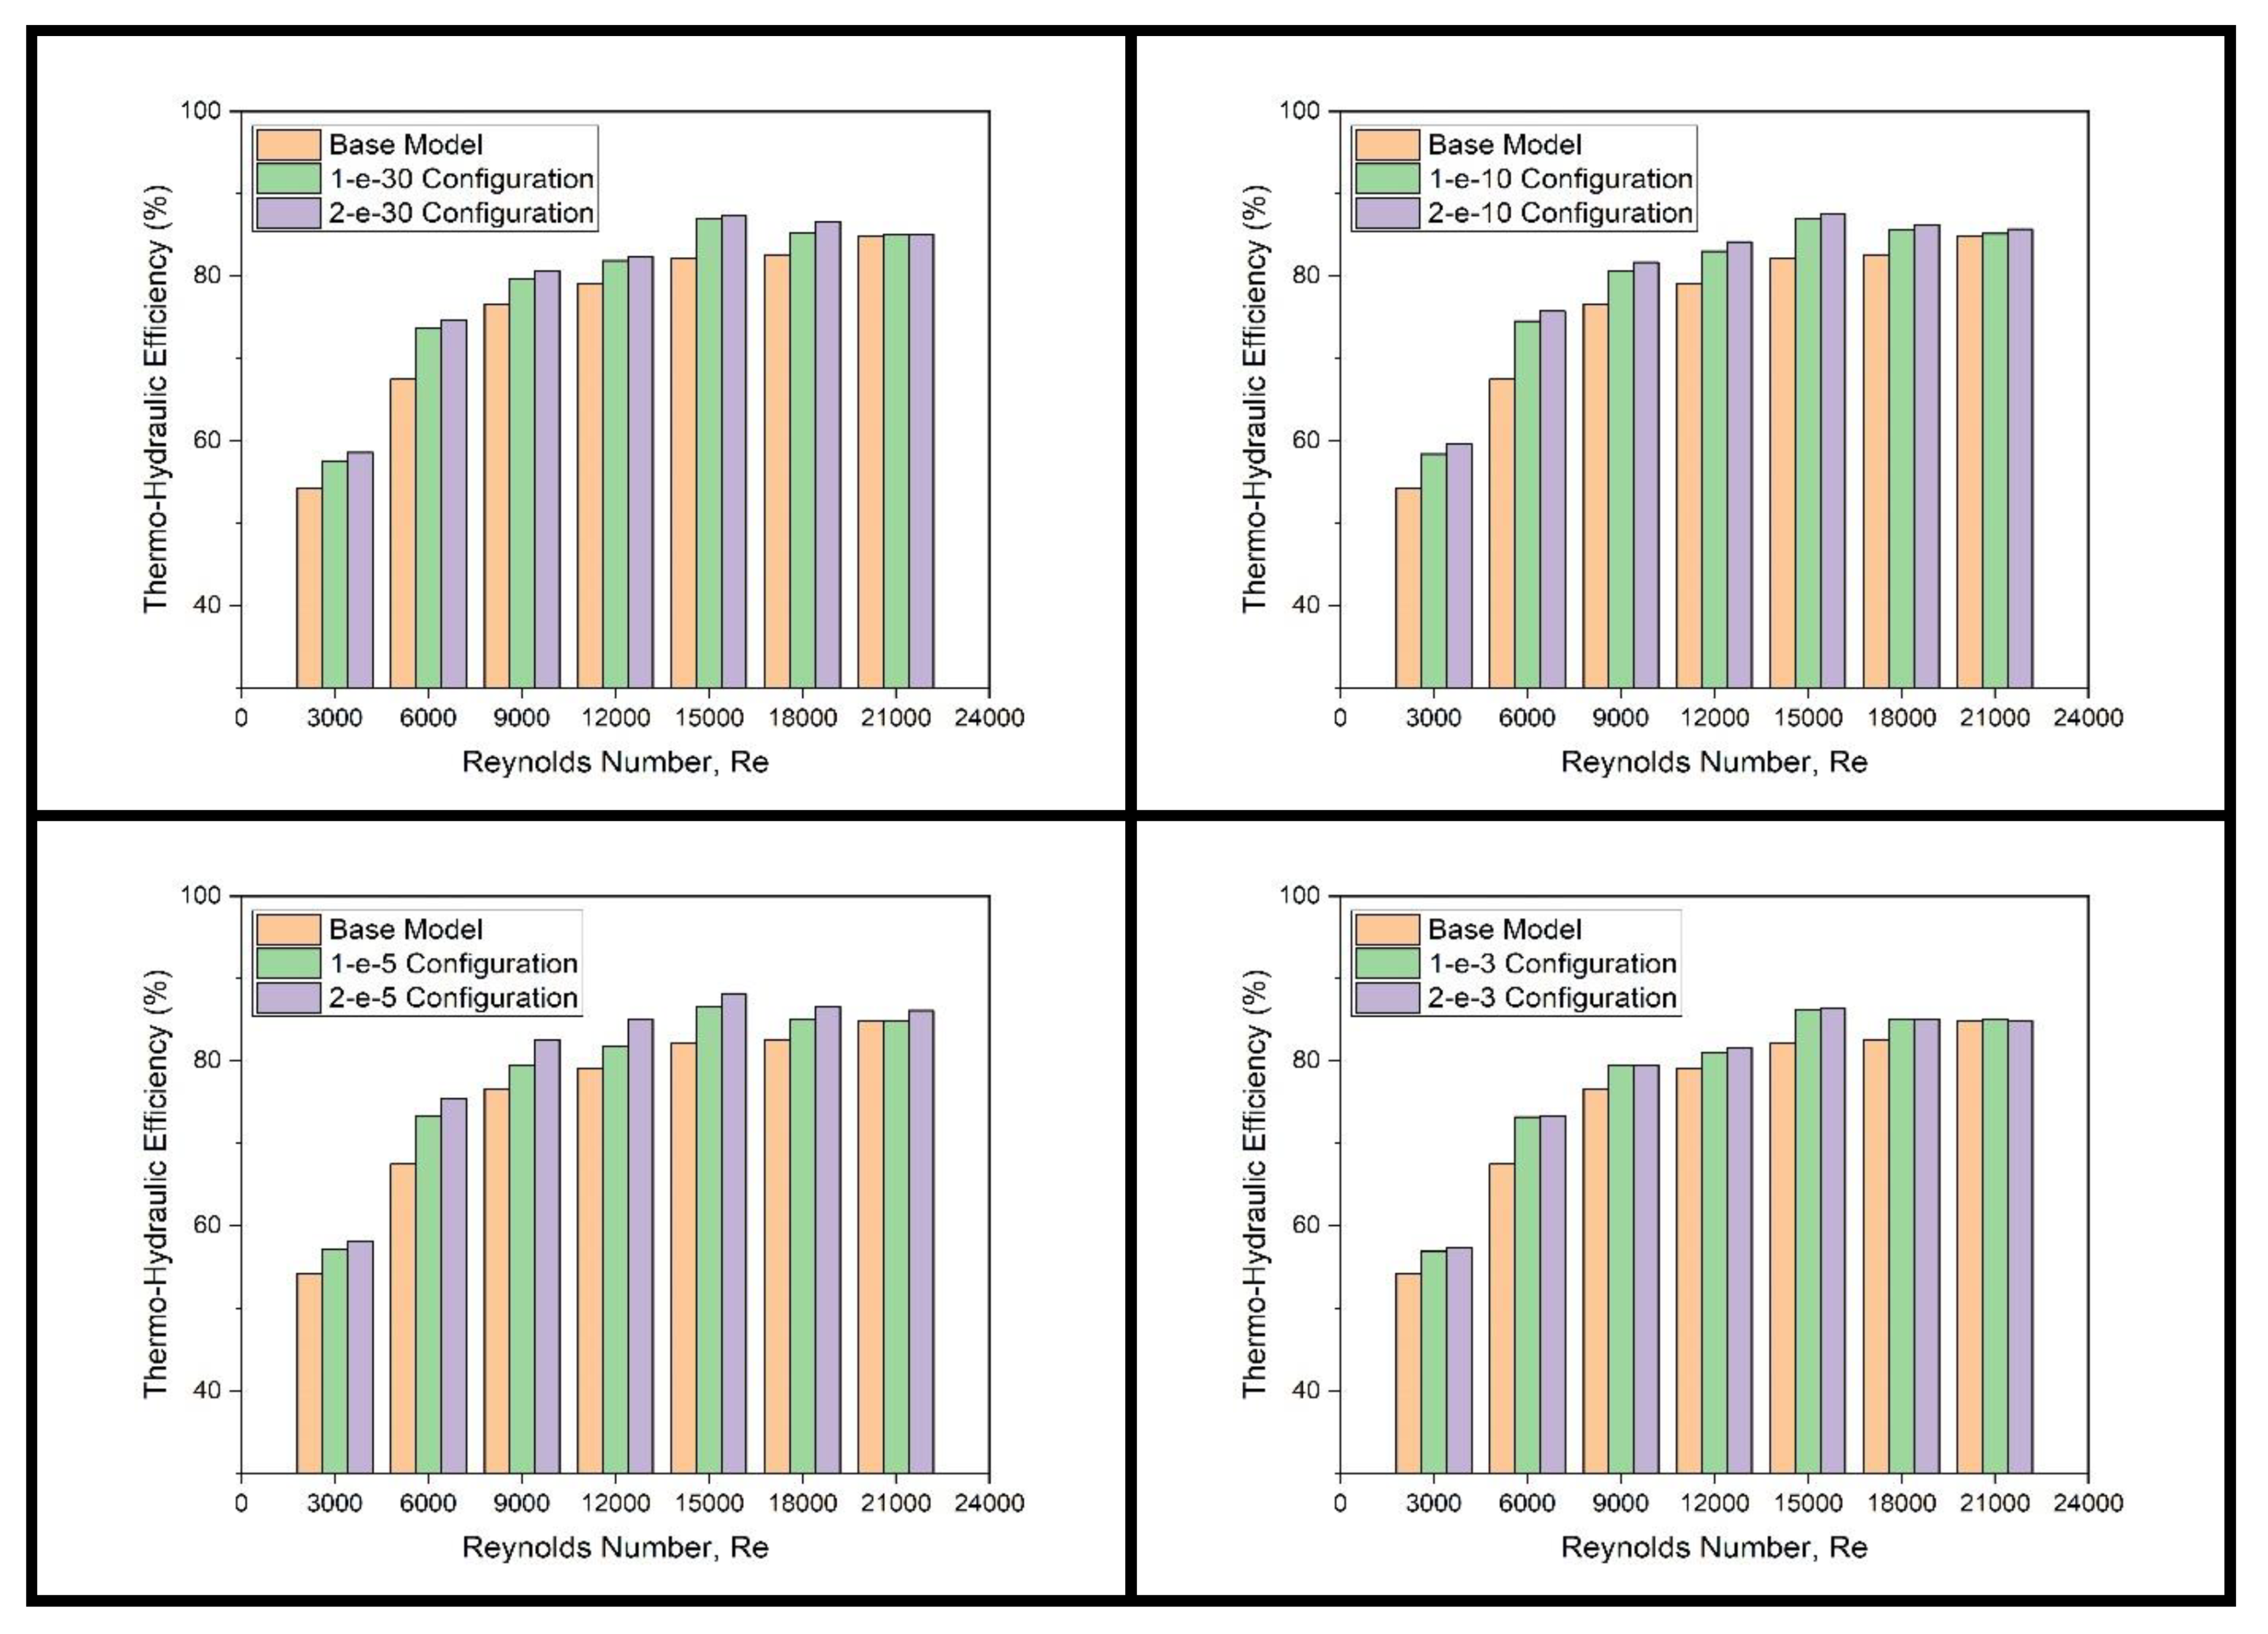
5.2. Effect of the Height of Aerofoil Fin

As mentioned earlier, the height of the aerofoil is varied at 3 mm, 5 mm, 10 mm and 30 mm in the present analysis. Figure 19 depicts the Nusselt number variation with respect to different values of fin height for both the aerofoil 1 and 2 configurations. The plot shows that the Nu for the 1-e-10 configuration is relatively higher than that of 1-e-30, 1-e-5, and 1-e-3 for the aerofoil 1 configurations. Nu is found to be relatively higher for 2-e-10 of the aerofoil 2 configuration when compared with that of 2-e-30, 2-e-5, and 2-e-3 of the aerofoil 2 configuration.
As the fin is incorporated, it provides additional area for effective heat transfer, the result of which causes Nu to increase. For higher values of fin height (such as 30 mm), the gap between the lower chamber to the absorber plate is also higher, thus providing a better heat transfer area. At the same time the flow of air is restricted at the higher fin heights, thereby reducing the tendency of heat transfer. This phenomenon is seen in the velocity vector plots depicted in Figure 20a for the aerofoil fin 1 configuration and Figure 20b for the aerofoil fin 2 configuration.
The friction coefficient ratio (f/fs) indicates the pumping power to be supplied to the inlet duct. Figure 21 shows the effect of friction coefficient ratio with Re for various geometric configurations chosen for the study. It is seen that the resistance to flow increases as the height of the aerofoil fin increases. The aerofoil fin configuration 2 has better fluid flow and reduced resistance compared to aerofoil fin configuration 1. As the height of the fin increases, the friction coefficient ratio increases due to the increased surface area and restricted flow passage, reaching a maximum value of 7.633 for the 1-e-30 configuration.
Figure 22 depicts the variation of thermal efficiency with respect to the fin height for all the aerofoil fin configurations. It is observed that the configuration 1-e-10 in the aerofoil 1 configuration and 2-e-10 in the aerofoil 2 configuration exhibits better thermal performance and results in optimum thermal efficiency. It is evident that the thermal efficiency increases with the increase in the heat transfer rate for the 10 mm configuration. It is seen that for the models with 30mm fin height of both the configurations there exists a larger area of heat dissipation; however, the increased height of the fin causes a reduced flow of air in the vicinity of the fin tip. This tends to decrease the heat transfer, thereby reducing the thermal efficiency. It is evident from the graph that the model 2-e-10 has a relatively higher thermal efficiency at Re of 24,000 and is 23.24% greater compared to that of the base model.
Figure 23a,b shows the streamline plot for the configurations of fin height 10 mm and 30 mm at a flow Reynolds number of 12,000 for both of the aerofoil fin models. It is seen that for the models 1-e-10 and 2-e-10, air can flow easily at the bottom of the absorber duct, and there is no restriction for the fluid flow. On the contrary, for the models 1-e-30 and 2-e-30, the fin completely blocks the flow at certain sections, thereby resulting in restricted heat transfer. The thermal efficiency for the 30mm height models is thus relatively less than that for the models of 10 mm fin height.
Figure 24 depicts the variation of thermohydraulic efficiency against the Re for different aerofoil fin heights (30 mm, 10 mm, 5 mm, and 3 mm) for both of the aerofoil configurations chosen in the study. It can be seen from the figure that both aerofoil fin configurations (1 and 2) having 10 mm fin height (i.e., models 1-e-10 and 2-e-10) show better thermo-hydraulic efficiency when compared with all other models. This is because an increase in the height of the fin restricts the flow of fluid. In this numerical analysis, the thermohydraulic efficiency is higher for the model with a fin height of 10 mm. The 2-e-10 model configuration has relatively higher thermo-hydraulic efficiency at an Re of 15,000 and is found to be 20.94% higher when compared with that of the base model. This is due to the fact that the configuration 2-e-10 model has larger thermal heat gain than the hydraulic losses, leading to the augmented performance of the collector for the given range of operation.

6. Conclusions

The numerical analysis is performed for the aerofoil fin 1 and 2 configurations with variable fin height. The aerofoil fin aids in the removal of the viscous sub-layer beneath the absorber plate and guides the flow of the working fluid with the proper mixing inside the duct, hence improving the thermal energy transfer from the absorber plate to the airflow inside the absorber duct. The present analysis leads to the following conclusions:
The effect of the aerofoil fin configuration is important for enhancing the thermal performance by uniform flow distribution of the fluid inside the duct. It is clear from the analysis that the alternative arrangement of the aerofoil fin (aerofoil fin configuration 2) causes better mixing of fluid in the duct, which absorbs the heat from the absorber plate to the air when compared to a linear arrangement (aerofoil 1 configuration).
The effect of fin height is also an import parameter for enhancing the thermal performance. As the height of the fin increases, the heat transfer area and rate increases, thus leading to an increased value of Nu, and results in a higher friction coefficient factor (f/fs). The thermal efficiency is higher for the aerofoil fin 2 configuration with a fin height of 10 mm (2-e-10) at a Re of 24,000. The thermohydraulic efficiency is higher for the aerofoil fin 2 configuration with a fin height of 10 mm at an Re of 15,000.
The thermal and thermohydraulic efficiencies are found to be 23.24% and 20.94% higher for the aerofoil fin 2 configuration with 10 mm fin height when compared with that of the base model.
As a design prescription, it can be suggested that the aerofoil 2 fin configuration with a fin height of 10 mm is better for the overall augmentation of the performance of the solar air heater for the given range of operations.

Author Contributions

Conceptualization: M.N. and A.K.H.S., Methodology: M.N. and A.K.H.S., Formal analysis: M.K.R., Data curation: M.N. and A.K.H.S., Writing—original draft preparation: M.K.R., Writing—review and editing: M.N. and K.V.K., Supervision: K.V.K. All authors have read and agreed to the published version of the manuscript.

Funding

This research received no external funding.

Institutional Review Board Statement

Not applicable.

Informed Consent Statement

Not applicable.

Data Availability Statement

Not applicable.

Conflicts of Interest

The authors declare that they have no conflict of interest.

Nomenclature

CFDComputational Fluid Dynamics
DPSAHDouble Pass Solar Air Heater
RNGRenormalization Group
SAHSolar Air Heater
SIIDPSAHSingle Inlet Inclined Double Pass Solar Air Heater
SIMPLESemi Implicit Method for Pressure Linked Equations
TEFThermal Enhancement Factor
THPPThermo-Hydraulic Performance Parameter
AFlow area (m2) = w × e
AcCollector area (m2) = l × w
CpSpecific heat (J/kg K)
DhHydraulic Diameter (m)
eHeight of the fin (m)
e/DRelative Roughness Height
fFriction factor
ITHeat flux due to radiation (W/m2)
kTurbulence kinetic energy (J/kg)
m ˙ Mass flow rate (kg/s)
NuNusselt number
lLength (m)
pPitch (m)
p/eRelative Roughness Pitch
ReReynolds Number
TiInlet Air Temperature (K)
T0Outlet Air Temperature (K)
wWidth (m)
ρDensity [kg/m3]
εDissipation rate of turbulence (s−1)
ΔpDifferential Pressure Drop [Pa]
η t h Thermal Efficiency
μ t Eddy viscosity
Γ t Turbulent thermal diffusivity
Γ Molecular thermal diffusivity

References

  1. Chamoli, S.; Chauhan, R.; Thakur, N.S.; Saini, J.S. A review of the performance of double pass solar air heater. Renew. Sustain. Energy Rev. 2021, 16, 481–492. [Google Scholar] [CrossRef]
  2. Ravi, R.K.; Saini, R.P. A review on different techniques used for performance enhancement of double pass solar air heaters. Renew. Sustain. Energy Rev. 2016, 56, 941–952. [Google Scholar] [CrossRef]
  3. Kumar, R.; Gaurav; Kumar, S.; Afzal, A.; Manokar, A.M.; Sharifpur, M.; Issakhov, A. Experimental investigation of impact of the energy storage medium on the thermal performance of double pass solar air heater. Sustain. Energy Technol. Assess. 2021, 48, 101673. [Google Scholar] [CrossRef]
  4. Qader, B.S.; Supeni, E.E.; Ariffin, M.K.A.; Talib, A.R.A. Numerical investigation of flow through inclined fins under the absorber plate of solar air heater. Renew. Energy 2019, 141, 468–481. [Google Scholar] [CrossRef]
  5. Patel, Y.M.; Jain, S.V.; Lakhera, V.J. Thermo-hydraulic performance analysis of a solar air heater roughened with reverse NACA profile ribs. Appl. Therm. Eng. 2020, 170, 114940. [Google Scholar] [CrossRef]
  6. Choi, H.U.; Choi, K.H. CFD analysis on the heat transfer and fluid flow of solar air heater having transverse triangular block at the bottom of air Duct. Energies 2020, 13, 1099. [Google Scholar] [CrossRef] [Green Version]
  7. Mahanand, Y.; Senapati, J.R. Thermal enhancement study of a transverse inverted-T shaped ribbed solar air heater. Int. Commun. Heat Mass Transf. 2020, 119, 104922. [Google Scholar] [CrossRef]
  8. Singh, S. Thermohydraulic performance of double pass solar thermal collector with inline, staggered and hybrid fin configurations. J. Energy Storage 2020, 27, 101080. [Google Scholar] [CrossRef]
  9. Salih, M.M.M.; Alomar, O.R.; Ali, F.A.; Abd, H.M. An experimental investigation of a double pass solar air heater performance: A comparison between natural and forced air circulation processes. Sol. Energy 2019, 193, 184–194. [Google Scholar] [CrossRef]
  10. Kumar, A.; Singh, A.P.; Akshayveer; Singh, O.P. Performance characteristics of a new curved double-pass counter flow solar air heater. Energy 2022, 239, 121886. [Google Scholar] [CrossRef]
  11. Ahmadkhani, A.; Sadeghi, G.; Safarzadeh, H. An in depth evaluation of matrix, external upstream and downstream recycles on a double pass flat plate solar air heater efficacy. Therm. Sci. Eng. Prog. 2021, 21, 100789. [Google Scholar] [CrossRef]
  12. Sharol, A.F.; Razak, A.A.; Majid, Z.A.A.; Azmi, M.A.A.; Tarminzi, M.A.S.M.; Ming, Y.H.; Zakaria, Z.A.; Harun, M.A.; Fazlizan, A.; Sopian, K. Effect of thermal energy storage material on the performance of double-pass solar air heater with cross-matrix absorber. J. Energy Storage 2022, 51, 104494. [Google Scholar] [CrossRef]
  13. Singh, S. Experimental and numerical investigations of a single and double pass porous serpentine wavy wire mesh packed bed solar air heater. Renew. Energy 2020, 145, 1361–1387. [Google Scholar] [CrossRef]
  14. Tandel, H.U.; Modi, K.V. Experimental assessment of double-pass solar air heater by incorporating perforated baffles and solar water heating system. Renew. Energy 2022, 183, 385–405. [Google Scholar] [CrossRef]
  15. Gao, W.; Lin, W.; Liu, T.; Xia, C. Analytical and experimental studies on the thermal performance of cross-corrugated and flat-plate solar air heaters. Appl. Energy 2007, 84, 425–441. [Google Scholar] [CrossRef]
  16. Arunkumar, H.S.; Kumar, S.; Karanth, K.V. Experimental study on thermo-hydraulic performance of a solar air heater with rectangular perforated duct inserts. Sol. Energy 2021, 227, 179–189. [Google Scholar] [CrossRef]
Figure 1. The DPSAH experimental setup.
Sustainability 15 00591 g001
Figure 2. Position of thermocouples on the absorber plate.
Sustainability 15 00591 g002
Figure 3. Direction of flow of air inside the duct.
Sustainability 15 00591 g003
Figure 4. Exploded view of a DPSAH.
Sustainability 15 00591 g004
Figure 5. Aerofoil fin structure.
Sustainability 15 00591 g005
Figure 6. Diagram of a 2D model of a single flow DPSAH with an aerofoil fin.
Sustainability 15 00591 g006
Figure 7. Diagram indicating the dimensions of the absorber duct of a single flow DPSAH with an aerofoil fin.
Sustainability 15 00591 g007
Figure 8. (i). Schematic representation of Aerofoil configuration (a) aerofoil 1 configuration and (b) aerofoil 2 configuration. (ii). Aerofoil configuration (c) aerofoil 1 configuration—inline (d) aerofoil 2 configuration—staggered.
Sustainability 15 00591 g008aSustainability 15 00591 g008b
Figure 9. Fine mesh near the aerofoil fin.
Sustainability 15 00591 g009
Figure 10. Variation of Nu with the number of elements for 1-e-10 model at Re = 12,000.
Sustainability 15 00591 g010
Figure 11. Thermal efficiency vs. Re plot for numerical and experimental results.
Sustainability 15 00591 g011
Figure 12. The thermo-hydraulic efficiency Vs Re plot for numerical and experimental results.
Sustainability 15 00591 g012
Figure 13. Velocity contour plots for 10 mm height aerofoil fin with aerofoil configurations 1 and 2 for Re = 3000.
Sustainability 15 00591 g013
Figure 14. Velocity contour plots for 10 mm height aerofoil fin with aerofoil con-figurations 1 and 2 for Re = 12,000.
Sustainability 15 00591 g014
Figure 15. Velocity contour plots for 10mm height aerofoil fin with aerofoil configurations 1 and 2 for Re = 24,000.
Sustainability 15 00591 g015
Figure 16. Thermal efficiency variation for aerofoil configurations 1 and 2 for various fin heights.
Sustainability 15 00591 g016
Figure 17. The vector, contour, and streamline plots of the velocity for aerofoil 2 configuration ((i), (ii), and (iii)), respectively) and aerofoil 1 configuration ((iv), (v), and (vi)), respectively).
Sustainability 15 00591 g017
Figure 18. Thermo-hydraulic efficiency variation for aerofoil configurations 1 and 2 for all the fin heights chosen for study.
Sustainability 15 00591 g018
Figure 19. Nusselt number variation against Re for various aerofoil fin configurations.
Sustainability 15 00591 g019
Figure 20. (a): Velocity contour plots for various heights of aerofoil fin with aerofoil configurations 1 for Re = 12,000. (b): Velocity contour plots for various heights of aerofoil fin with aerofoil configurations 2 for Re = 12,000.
Sustainability 15 00591 g020aSustainability 15 00591 g020b
Figure 21. Plot of friction coefficient ratio against Re for various aerofoil fin configurations.
Sustainability 15 00591 g021
Figure 22. Variation of thermal efficiency for different fin heights (30, 10, 5 and 3 mm) for aerofoil fin configurations 1 and 2.
Sustainability 15 00591 g022
Figure 23. The streamline plots of the velocity for the models with (a) 10 mm fin height and (b) 30 mm fin height.
Sustainability 15 00591 g023
Figure 24. Variation of thermohydraulic efficiency for aerofoil fin configurations 1 and 2 at different fin heights (30, 10, 5, and 3 mm).
Sustainability 15 00591 g024
Table 1. Measurement of the independent variables’ uncertainty.
Sl No.MeasurementInstrumentAccuracy
1Length of the duct (L)Linear Scale±0.5 mm
2Height/Width (w)Vernier caliper±0.1 mm
3Pressure drop in the duct (dp)Digital manometer±0.01 mm WC
4Temperature (T)K-Type Thermocouple
RTD sensors
±0.5 °C
±0.1 °C
5 Mass   flow   rate   ( m ˙ )Vortex flow meter±0.001 m3/h
6Heat flux (I)Pyranometer±1 W/m2
Table 2. Geometrical variables of the aerofoil configurations.
Sl No.Height (e) mmRepresentation
Aerofoil 1 ConfigurationAerofoil 2 Configuration
1301-e-302-e-30
2101-e-102-e-10
351-e-52-e-5
431-e-32-e-3
Table 3. Model configurations used in the analysis.
Sl No.NotationModel Configuration
1BmBase Model SPSAH (single-pass solar air heater)
21-e-30SIIDPSAH 1-e-30 (single inlet inclined at 10°, double pass, 30 mm height aerofoil fin 1 configuration).
31-e-10SIIDPSAH 1-e-10 (single inlet inclined at 10°, double pass, 10 mm height aerofoil fin 1 configuration).
41-e-5SIIDPSAH 1-e-5 (single inlet inclined at 10°, double pass, 5 mm height aerofoil fin 1 configuration).
51-e-10SIIDPSAH 1-e-3 (single inlet inclined at 10°, double pass, 3 mm height aerofoil fin 1 configuration).
62-e-30SIIDPSAH 2-e-30 (single inlet inclined at 10°, double pass, 30 mm height aerofoil fin 2 configuration).
72-e-10SIIDPSAH 2-e-10 (single inlet inclined at 10°, double pass, 10 mm height aerofoil fin 2 configuration).
82-e-5SIIDPSAH 2-e-5 (single inlet inclined at 10°, double pass, 5 mm height aerofoil fin 2 configuration).
92-e-3SIIDPSAH 2-e-3 (single inlet inclined at 10°, double pass, 3 mm height aerofoil fin 2 configuration).
Table 4. Boundary condition imposed on the CFD model.
Sl No.BoundaryBoundary Condition
1InletMass flow inlet (Re range from 3000 to 24,000 with an increment of 3000), Temperature (Air inlet temperature)
2OutletThe fully developed flow condition—Outflow
3WallNo Slip
4Air PropertiesPolynomial function (Equations (12)–(14))
5Cell zoneAbsorber plate (aluminum); inside air duct (air)
Table 5. Properties of materials used in the study.
PropertiesAirAluminumGlass
Density (kg/m3)Equation (12)27192500
Specific heat (J/kg K)1006.34871800
Thermal Conductivity (W/mK)Equation (13)202.41.2
Viscosity (kg/ms)Equation (14)--
Specific gas constant (J/kg K)287--
Emissivity-0.90.925
Refractive index-11.53
Disclaimer/Publisher’s Note: The statements, opinions and data contained in all publications are solely those of the individual author(s) and contributor(s) and not of MDPI and/or the editor(s). MDPI and/or the editor(s) disclaim responsibility for any injury to people or property resulting from any ideas, methods, instructions or products referred to in the content.

