
Surface Soil Moisture Inversion and Distribution Based on Spatio-Temporal Fusion of MODIS and Landsat

1
Yinshanbeilu Grassland Eco-Hydrological National Observation and Research Station, China Institute of Water Resources and Hydropower Research, Hohhot 010018, China
2
Institute of Water Resources for Pastoral Area, China Institute of Water Resources and Hydropower Research, Hohhot 010018, China
*
Author to whom correspondence should be addressed.
Sustainability 2022, 14(16), 9905; https://doi.org/10.3390/su14169905
Submission received: 13 June 2022
/
Revised: 28 July 2022
/
Accepted: 8 August 2022
/
Published: 10 August 2022
Abstract
:Soil moisture plays an important role in hydrology, climate, agriculture, and ecology, and remote sensing is one of the most important tools for estimating the soil moisture over large areas. Soil moisture, which is calculated by remote sensing inversion, is affected by the uneven distribution of vegetation and therefore the results cannot accurately reflect the spatial distribution of the soil moisture in the study area. This study analyzes the soil moisture of different vegetation covers in the Wushen Banner of Inner Mongolia, recorded in 2016, and using Landsat and MODIS images fused with multispectral bands. Firstly, we compared and analyzed the ability of the visible optical and short-wave infrared drought index (VSDI), the normalized differential infrared index (NDII), and the short-wave infrared water stress index (SIWSI) in monitoring the soil moisture in different vegetation cover soils. Secondly, we used the stepwise multiple regression analysis method in order to correlate the multispectral fusion bands with the field-measured soil water content and established a soil moisture inversion model based on the multispectral fusion bands. As the results show, there was a strong correlation between the established model and the measured soil water content of the different vegetation cover soils: in the bare soil, R2 was 0.86; in the partially vegetated cover soil, R2 was 0.84; and in the highly vegetated cover soil, R2 was 0.87. This shows that the established model could better reflect the actual condition of the surface soil moisture in the different vegetation covers.
1. Introduction
Agricultural and pastoral farming in arid and semi-arid areas depend, to a large extent, on the amount of water that is provided to plants through the soil. In these areas, evaporation and dryness are heavy and the soils are mostly sandy in texture. Rainfall deficits may result in substantially reduced agricultural and livestock yields, eventually leading to problems such as grassland vegetation degradation and soil sanding, which can cause dietary difficulties for humans and animals and threaten normal human life [1,2,3,4]. Moreover, soil moisture is also a critical input parameter in order to study grassland meteorological and hydrological models [5,6,7,8]. Therefore, it is necessary to obtain accurate soil moisture readings. Remote sensing methods compared, with traditional soil moisture monitoring methods, not only have the advantages of a large spatial coverage and high spatial and temporal resolutions, but they also facilitate the analysis of the soil moisture heterogeneity and interrelationships with other ecological, hydrological, and meteorological factors [9]. Generally, soil moisture inversion by remote sensing is realized by simulating the empirical relationships between the surface cover type, surface temperature, soil thermal inertia, surface evapotranspiration, and soil water content (various vegetation index models, temperature index models, thermal inertia models, evapotranspiration models, etc.) through the changes in the reflected radiation characteristics of the ground material. Currently, research methods are mainly of three types: visible–near-infrared remote sensing [10,11], thermal infrared remote sensing [12,13], and microwave remote sensing [14,15]. Remote sensing sensors in the visible–near-infrared band (0.4–0.2.5 μm) receive reflection information primarily from the surface, in response to solar short-wave radiation. It is in this spectral interval that different soil moistures directly lead to different spectral reflection characteristics [16]. Bowers studied soil moisture and soil reflectance in the short-wave range under bare soil conditions and showed that soil reflectance decreases with increasing soil moisture, while absorption increases with increasing soil moisture. In particular, the best relationship between soil moisture and soil reflectance was noted in the moisture-sensitive band of 1.9 μm, but it was susceptible to the effects of the actual surface complexity and atmospheric influences on the short-wave signal [17]. Therefore, the vegetation indices developed based on visible–NIR reflectance are also more commonly used for the indirect estimation of soil moisture, especially for drought monitoring [18]. Of these, the normalized vegetation index calculated using red and near-infrared reflectance is a relatively simple and widely used index for monitoring drought or soil moisture conditions. As research continues, it has been found that there is no direct correspondence between the NDVI and the status of the soil water supply. This is due to the fact that the NDVI is influenced not only by plant growth, but also by the soil background and atmospheric conditions. In addition, the normalized water index (NDWI) [19], the normalized infrared index (NDII) [20], the vegetation drought response index (VegDRI) [21], and the normalized drought index (NDDI) have been proposed. While these indices can reflect drought or soil moisture conditions to some extent, they are far from adequate in characterizing the quantitative soil moisture content. Moreover, other soil moisture evaluation indices based on the NIR–red spectral space have been proposed [22]. Ghulam et al. [23] proposed a perpendicular drought index (PDI) that depends on the soil line, which is very effective for bare ground surfaces but not for vegetated areas. Liu et al. [24] proposed the TM/ETM+ soil moisture monitoring index (SMMI) that does not depend on the soil background line. In addition, Zhang et al. [25] built a surface water content index (SWCI) in order to monitor the soil moisture in a mixed soil and vegetation zone based on the spectral reflectance sensitive to moisture changes using MODIS bands 6 and 7, as well as empirical coefficients. Although that approach can be effective for the remote sensing of moisture inversion, it is also affected by the variation in empirical coefficients in its application because these inversion models introduce adjusted empirical coefficients. Finally, various indices can monitor both the soil moisture and vegetation water content. For example: the short-wave infrared water stress index [26], the normalized multi-band drought index [27], the modified perpendicular drought index (MDPI) [28], and the visible light and short-wave infrared drought index [29]. However, remote sensing data are easily altered by clouds, and it is also difficult to continuously monitor the soil water content. Zhu et al. [30] proposed an enhanced spatial and temporal adaptive reflectance fusion model (ESTARFM) that takes into account the temporal variation in image reflectance characteristics; the spatial and temporal adaptive reflectance fusion model (STARFM), which is a relative adaptive remote sensing image fusion model, improves the fusion accuracy of the surface feature parameters under complex subsurface conditions, as well as improves the correlation between the prediction results and real images. Sisheber et al. [31] used ESTARFM in order to fuse the reflectance data obtained from Landsat and MODIS and calculated the time series of the NDVI for the phenological monitoring in agricultural landscapes. The results showed that crop phenology and some growth stages of agricultural landscapes can be correlated and mapped through the temporal and spatial fusion of multi-sensor data. Ghosh et al. [32] used ESTARFM in order to merge the NIR, SIR-1, and Sir-2 bands from Landsat and VIIRS for monitoring coal fires and the results showed that the fused data can improve the monitoring accuracy based on VIIRS. Zhou et al. [33] used ESTARFM in order to fuse Sentinel-2 and MODIS NDVI data for quantitative drought monitoring and the results showed that the fused NDVI can improve the monitoring accuracy based on MODIS.
The Wushen Banner in Inner Mongolia is a sandy area with grassland climate conditions, where the period between April and October is a major phase of crop growth in the region. In this case, neither the vegetation moisture index nor the soil moisture index can accurately monitor the soil moisture on complex surfaces. Therefore, it is desirable to study a simple, stable, and practical soil moisture inversion model that is stable for the different vegetation covers. To achieve this goal, the enhanced spatial and temporal adaptive reflectance fusion model (ESTARFM) was used in order to obtain the optical reflectance bands with high spatial and temporal resolutions that were then used to analyze the performance of the VSDI, NDII, and SIWSI for the inversion of soil moisture, to establish soil moisture inversion models for different vegetation covers according to stepwise regression methods, and to validate them using actual measured surface soil moisture data.
2. Study Area and Data Collection
2.1. Study Area
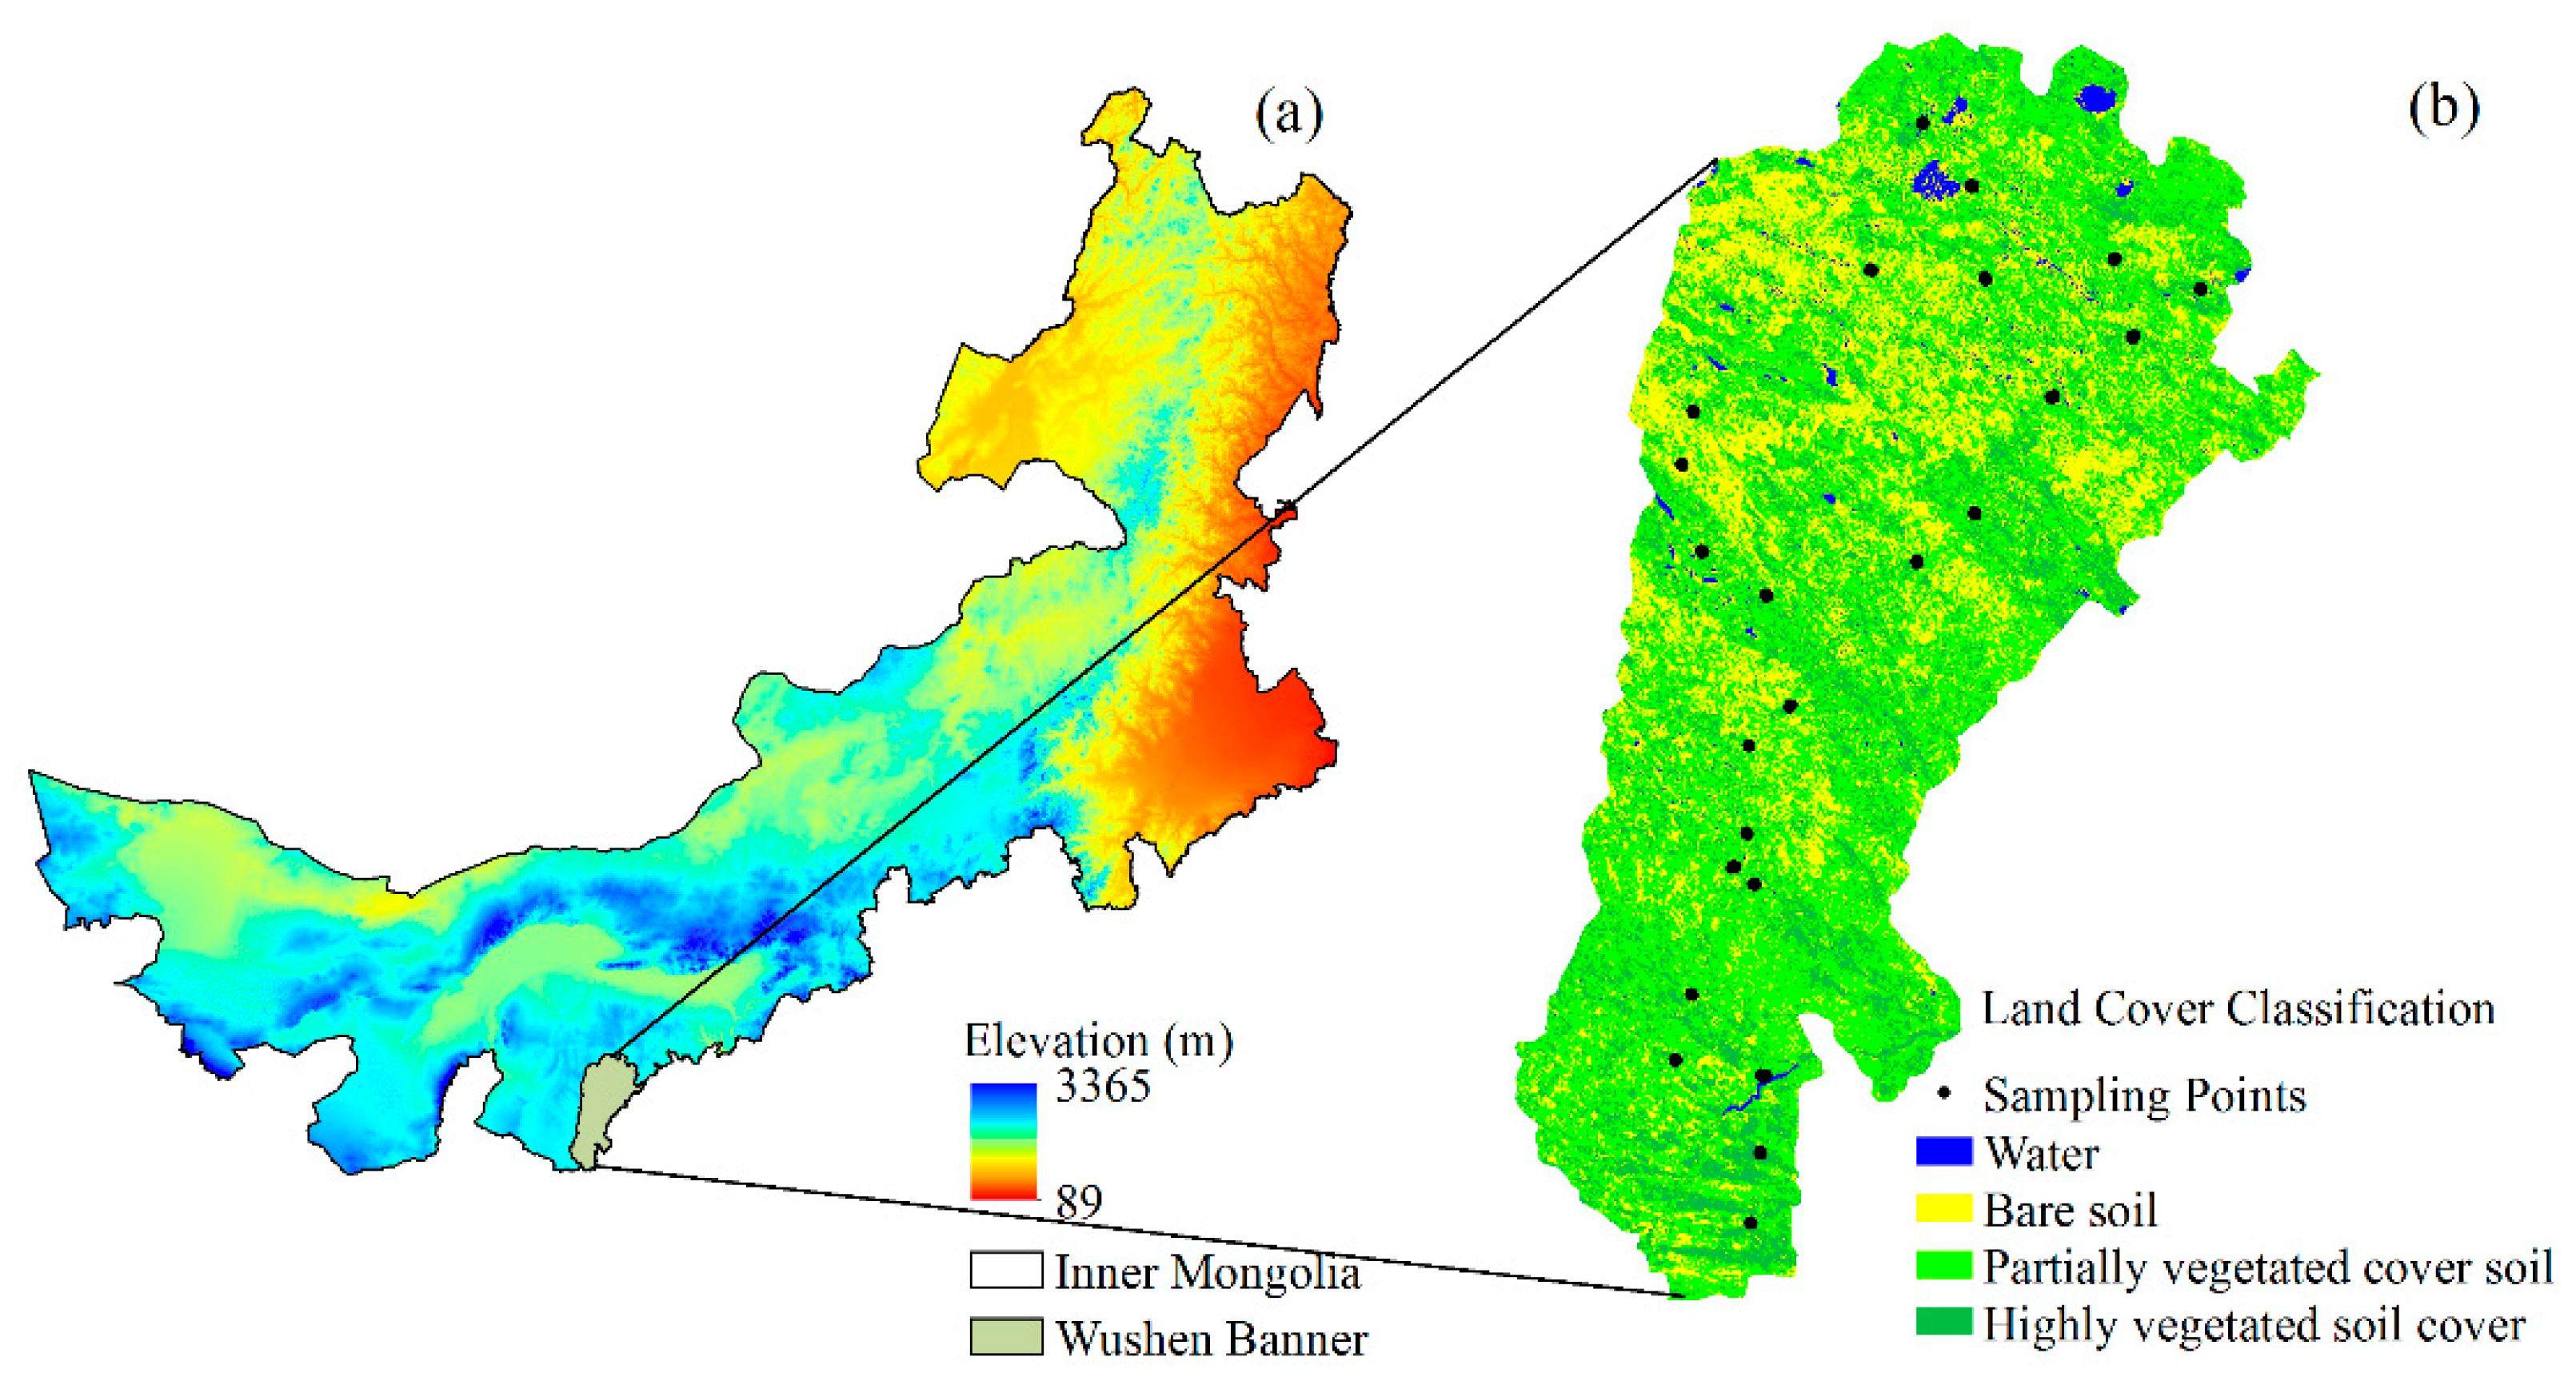
The Wushen Banner is located in the southernmost part of the Inner Mongolia Autonomous Region (Figure 1a), which is situated in the center of the Maowusu Desert (108°17′–109°40 ′ E, 37°38′–39°23′ N), with an average altitude of 1305 m. The climate is temperate continental monsoon, with four distinct seasons, an annual average rainfall of 350–400 mm, an annual average temperature of 6.8 °C, an annual average wind speed of about 3.4 m/s, and a frost-free period of 113–156 d. Most soil types are chestnut calcium, meadow, saline, or marsh submerged soils, as well as various types of wind–sand soils. In addition, using the NDVI threshold method, bare soil (NDVI < 0.2), partial vegetation cover (0.2 < NDVI < 0.5), and highly vegetated soils (NDVI > 0.5) [34] are classified as shown in Figure 1b.
2.2. Data
2.2.1. Remote Sensing Data
According to the Landsat 8 image strip number and the geographical location of this study area, 128 rows and 34 columns of remote sensing data were selected and downloaded from https://earthexplorer.usgs.gov/ (accessed on 1 June 2022), which has a panchromatic band spatial resolution of 15 m and a basic resolution of 30 m. It also includes two thermal infrared bands with a 100 m spatial resolution. In this paper, the good quality Landsat 8 remote sensing images, taken on 27 August 2016, and that consisted of two scenes of the study area, were selected and processed with ENVI 5.3 software for radiometric calibration, atmospheric correction, and cropping in order to obtain the surface reflectance. The NDVI was calculated using the near-infrared and red bands.
MODIS is a sensor carried by the Aqua and Terra satellites and has 36 spectral bands. In this paper, the Terra MODIS secondary surface reflectance product MOD09GA at 500 m resolution (26–28 August 2016) was selected for the study area. The MODIS and Landsat data have different map projections and resolutions. Prior to fusing the data from MODIS and Landsat, the MOD09 products were UTM projected and resampled with a 30 m spatial resolution using the MODIS tool provided by NASA (https://lpdaac.usgs.gov/tools/modis_reprojection_tool) (accessed on 1 June 2022).
2.2.2. Measured Soil Moisture Data
Soil moisture sampling experiments were conducted on 26–28 August 2016, based on the satellite transit time. There were 24 soil moisture sampling areas, and the minimum interval between each sampling area was 1 km. The size of each sampling area was 30 m × 30 m, and five points were selected for each sampling area, including the center point, providing a total of 120 soil samples. During sampling, the GPS location information of the five points in each sampling area was first recorded and then soil samples were collected from 0 to 10 cm of the soil surface with a soil auger. Finally, the soil samples from these five points were mixed and weighed in the field. The soil samples were brought back to the laboratory in sealed bags, placed in a constant-temperature oven, kept at 100–105 °C, and dried for 6–8 h until they reached a constant weight; the difference between the two weights was the soil water content, and the percentage of soil water content to dry soil was the soil weight water content, calculated by the formula in Equation (1).
where w indicates the weight moisture content of the soil (%); w1 is the mass of the empty soil box (g); w2 is the total amount of the soil box and wet soil (g); w3 is the total amount of the soil box and dry soil (g).
2.3. Methods
2.3.1. ESTARFM Fusion Model
ESTARFM is based on MODIS and Landsat images acquired at tm and tn moments and MODIS images at tp moments, and by calculating the differences in spatial distribution between image elements and image element reflectance, and simulating the prediction of the high-spatial-resolution data at tp moments (tp is located between tm and tn). Firstly, MODIS and Landsat images acquired at tk (k = m, n) and MODIS images acquired at tp are used to predict the reflectance of the central image elements in the sliding window of Landsat images at tp by calculating the spatial distribution differences and spectral differences of similar elements between images, which are denoted by Lm (xw/2, yw/2, tp) and Ln (xw/2, yw/2, tp), respectively; secondly, according to MODIS image reflectance differences, time weights are calculated at tk with respect to tp, which are expressed as Tm and Tn, respectively; lastly, high-resolution images at tp moments calculated at tk moments and time weights are used in order to calculate the final high-resolution images at tp moments with the following equation:
where N is the number of similar pixels including the predicted pixels; ω is the size of the sliding window; (xi, yi) is the position of the i similar pixel. Wi is the weight size of the i similar image element, which can be described as the degree of contribution to the predicted reflectance of the central image element and is determined based on three terms: spatial distance, temporal distance, and spectral distance. The spatial distance is the Euclidean distance between the central image element and the neighboring image elements in the window; the time distance is the difference between MODIS at tp and MODIS at t0 at a given location; the spectral distance is the difference between the Landsat image element value and the MODIS image element value at t0 at a given location. Vi is the conversion coefficient of the i similar image element for which the mixed image element decomposition is considered.
2.3.2. Visible Optical and Short-Wave Infrared Drought Index
Based on the existing research literature [35], the VSDI has already been shown to be advantageous in evaluating agricultural drought conditions. It is constructed using the short-wave infrared and red bands, which have a significant response to surface moisture changes, as monitoring bands, and the blue band, which has a low sensitivity, as the reference band. The formulas are as follows:
where is the short-wave infrared 2 band; is the blue light band; is the red light band.
2.3.3. Normalized Differential Infrared Index
The NDII is constructed by integrating the characteristics of vegetation and soil spectral reflectance controlled by moisture content, which is more capable of monitoring the surface water content of soil than the traditional vegetation index and can directly express the surface moisture content [36].
where is the short-wave infrared 1 band, and is the near-infrared band.
2.3.4. Short-Wave Infrared Water Stress Index
The SIWSI can better reflect the trend of soil moisture change and can monitor soil moisture without passing through the vegetation cover, which has certain applications in actual drought monitoring operations [37].
where is the short-wave infrared 1 band, and is the near-infrared band.
2.3.5. Stepwise Regression Method
The stepwise regression (SR) method is a method based on multiple regressions, using the principle of least squares in order to establish equations and solve regression coefficients. It has been applied to soil salinity inversion, and organic matter estimation and mapping [38,39]. In this study, stepwise regression was applied in order to develop a new surface moisture inversion model. This process began by extracting reflectance values from the fusion bands (B2 to B7) and correlating them with the field-measured surface soil moisture in order to determine the most relevant band. Using the stepwise function method, various combinations of selected bands (independent variables) and field-measured surface soil moistures (dependent variables) were examined. During each step, a variable was considered to be either an additive or a subtractive. However, after each independent variable was introduced into the equation, an F-test based on the partial regression sum of squares was conducted for each independent variable in the equation in order to see if there is a need to eliminate some independent variables that degrade to “insignificant” and to ensure that the equation contains only “significant” independent variables before each new variable is introduced. Finally, four statistically significant multiple linear regression fitted models were established, where the fitted model with the highest R2 and the lowest RMSE was considered to be the optimal model. Formula (6) is as follows:
where Y is the dependent variable (topsoil moisture), Ci is the regression coefficient, Bi is the spectral band, and b is the intercept.
2.3.6. Accuracy Evaluation
An equidistant sampling method was used to group 120 study samples in descending order of soil moisture content, with 84 in the training set and 36 in the validation set. The correlation coefficient (R2), root mean square error (RMSE), and normalized root mean square error (nRMSE) were selected as the metrics for the inverse model evaluation and validation [40].
where P is the inverse soil moisture, M is the measured soil moisture, is the inversion of the mean soil moisture content, and n is the number of samples in the validation set.
3. Results
3.1. ESTARFM Spatio-Temporal Fusion Model Accuracy Evaluation
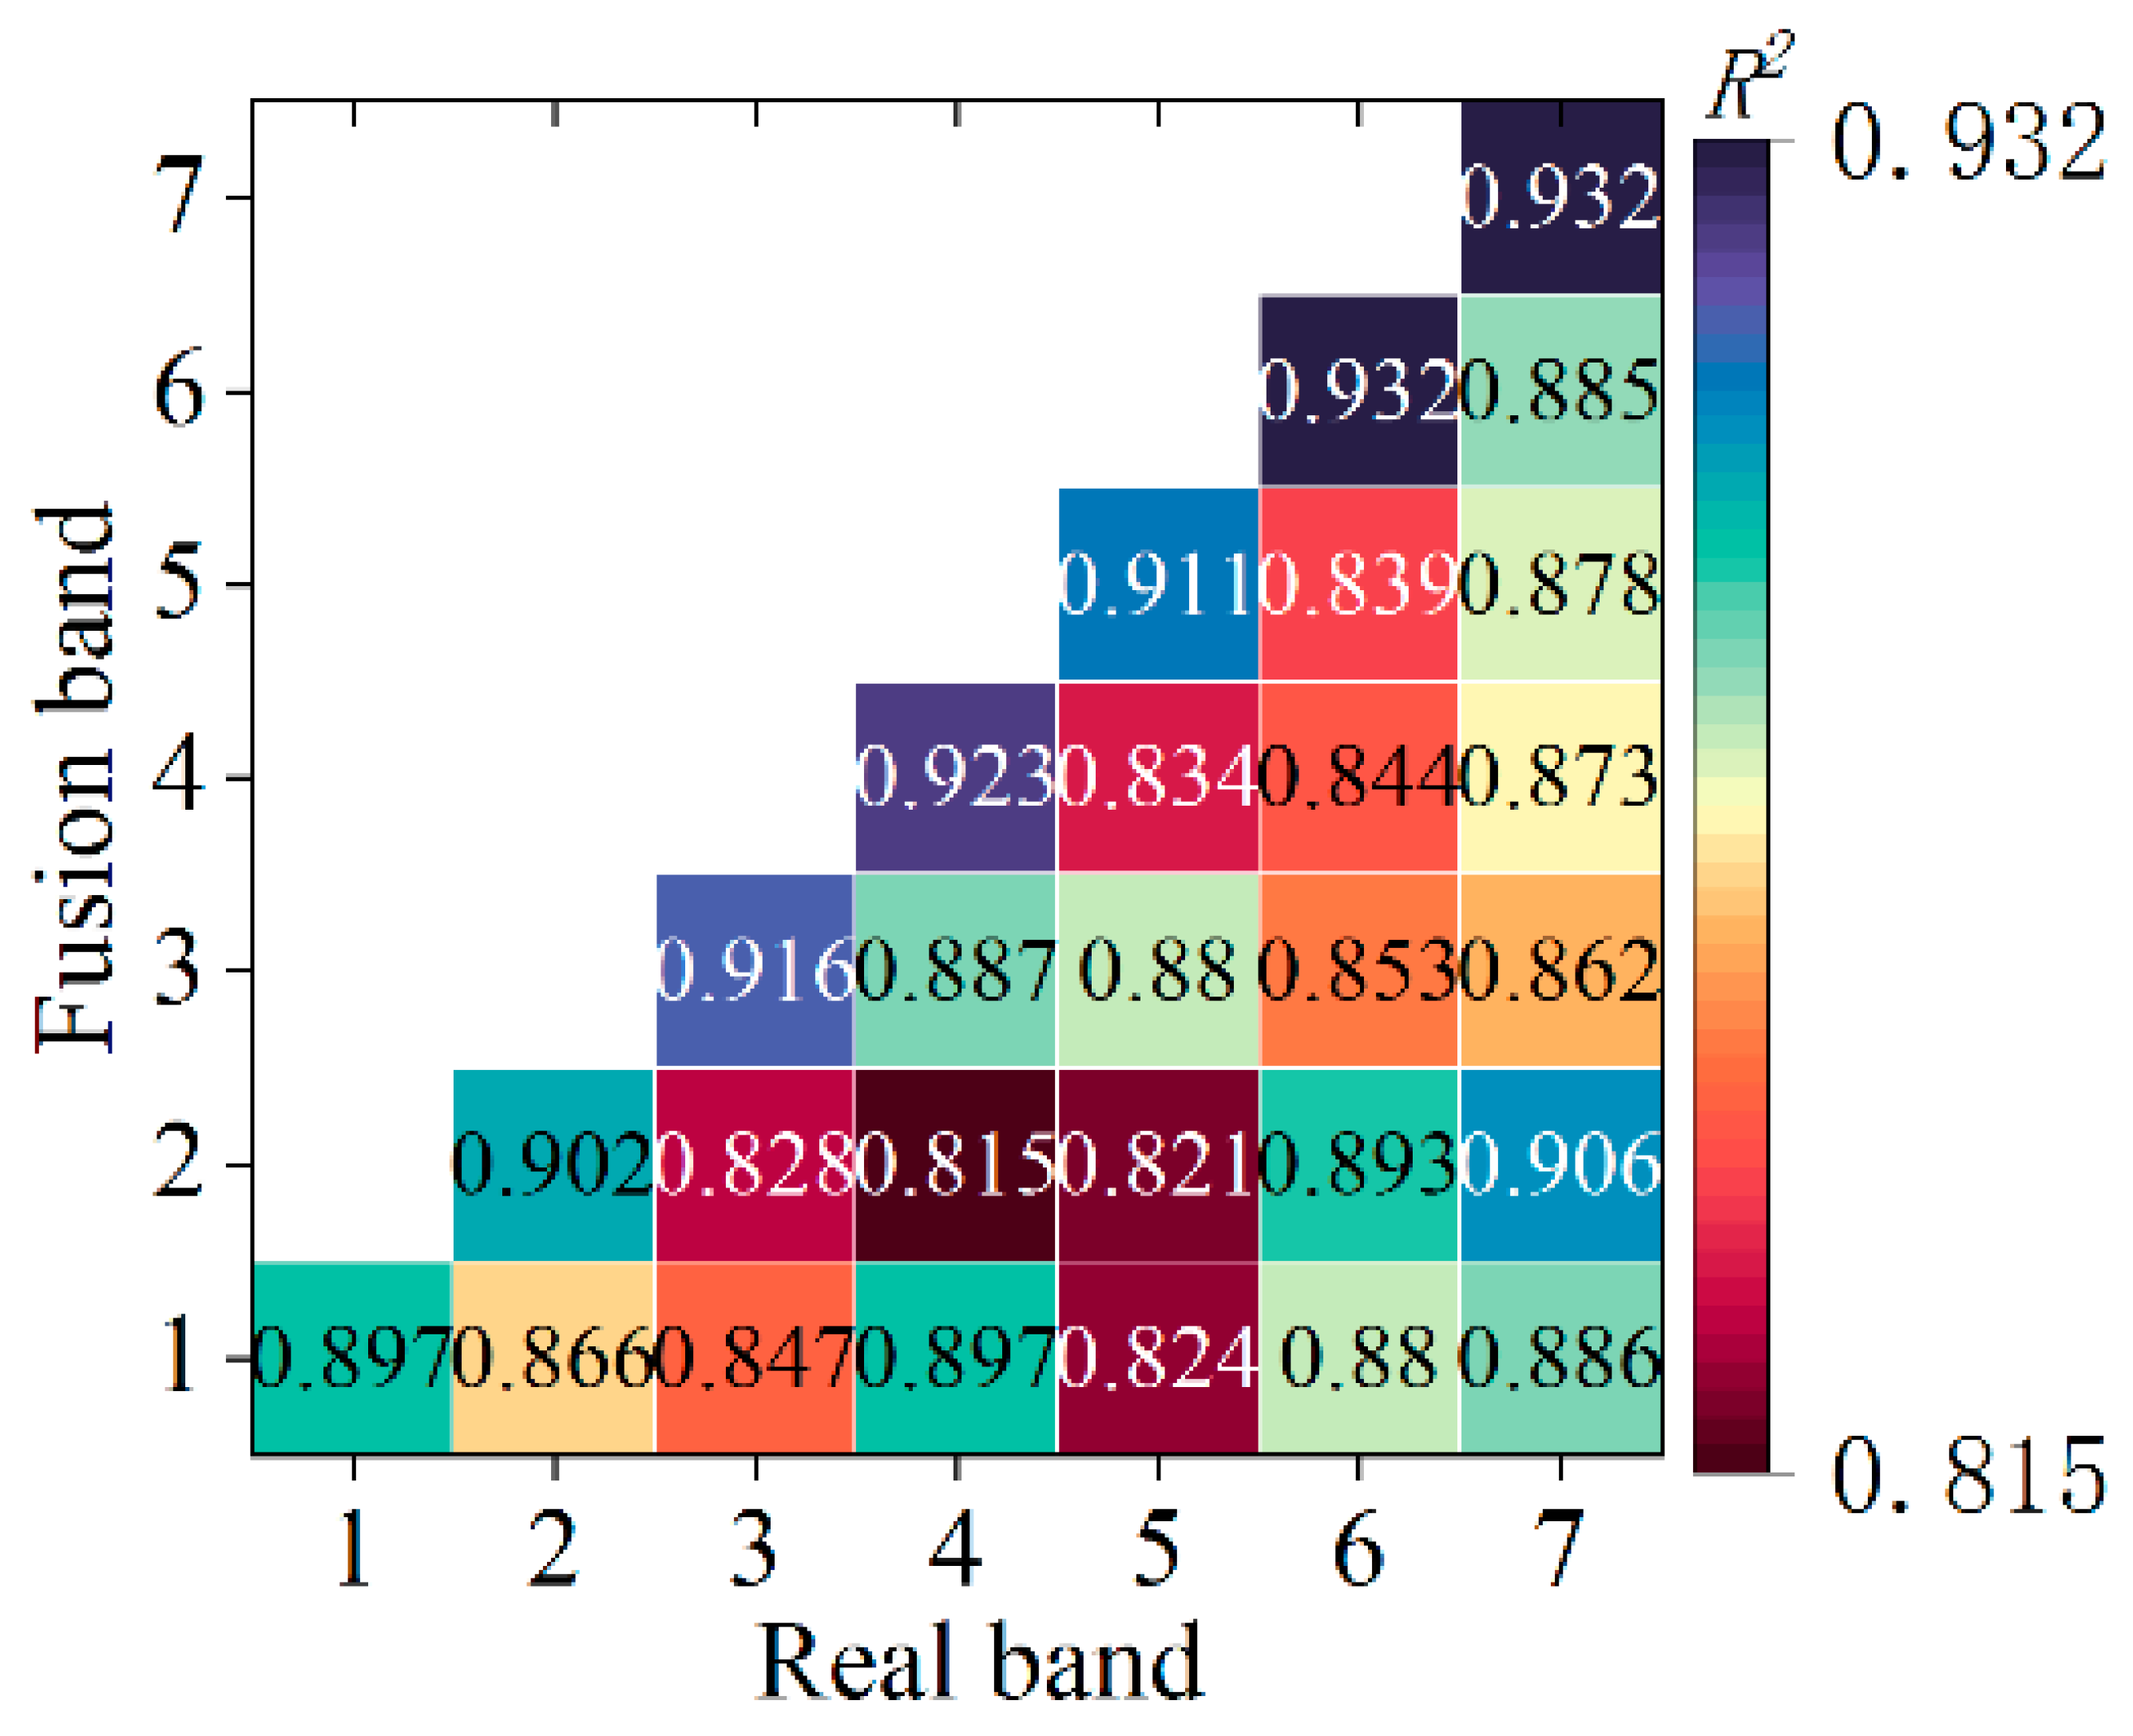
In order to verify the fusion prediction effect of ESTARFM, selected fused images from 27 August were compared with the original images in seven bands. The determination coefficients R2 between the real and fused images in the blue band, green band, red band, near-infrared band, short-wave infrared 1 band, and short-wave infrared 2 band were calculated as 0.902, 0.917, 0.924, 0.912, 0.932, and 0.932 (Figure 2). The determination coefficients R2 were all above 0.90 and reached above 0.93 in the short-wave infrared band, indicating a high correlation between the true reflectance and the fused predicted reflectance, confirming that the fused prediction accuracy of ESTARFM is high and could be applied as the data basis for the soil moisture inversion in the study area.
3.2. Vegetation and Bare Soil Reflectance Sensitivity Analysis on the Surface Soil Moisture
Many studies have clearly elucidated the relationship between soil moisture and surface reflectance [37]. Reflectance data were obtained by fusing Landsat and MODIS images and comparing the soil surface moisture of vegetated and bare soils obtained from field experiments.
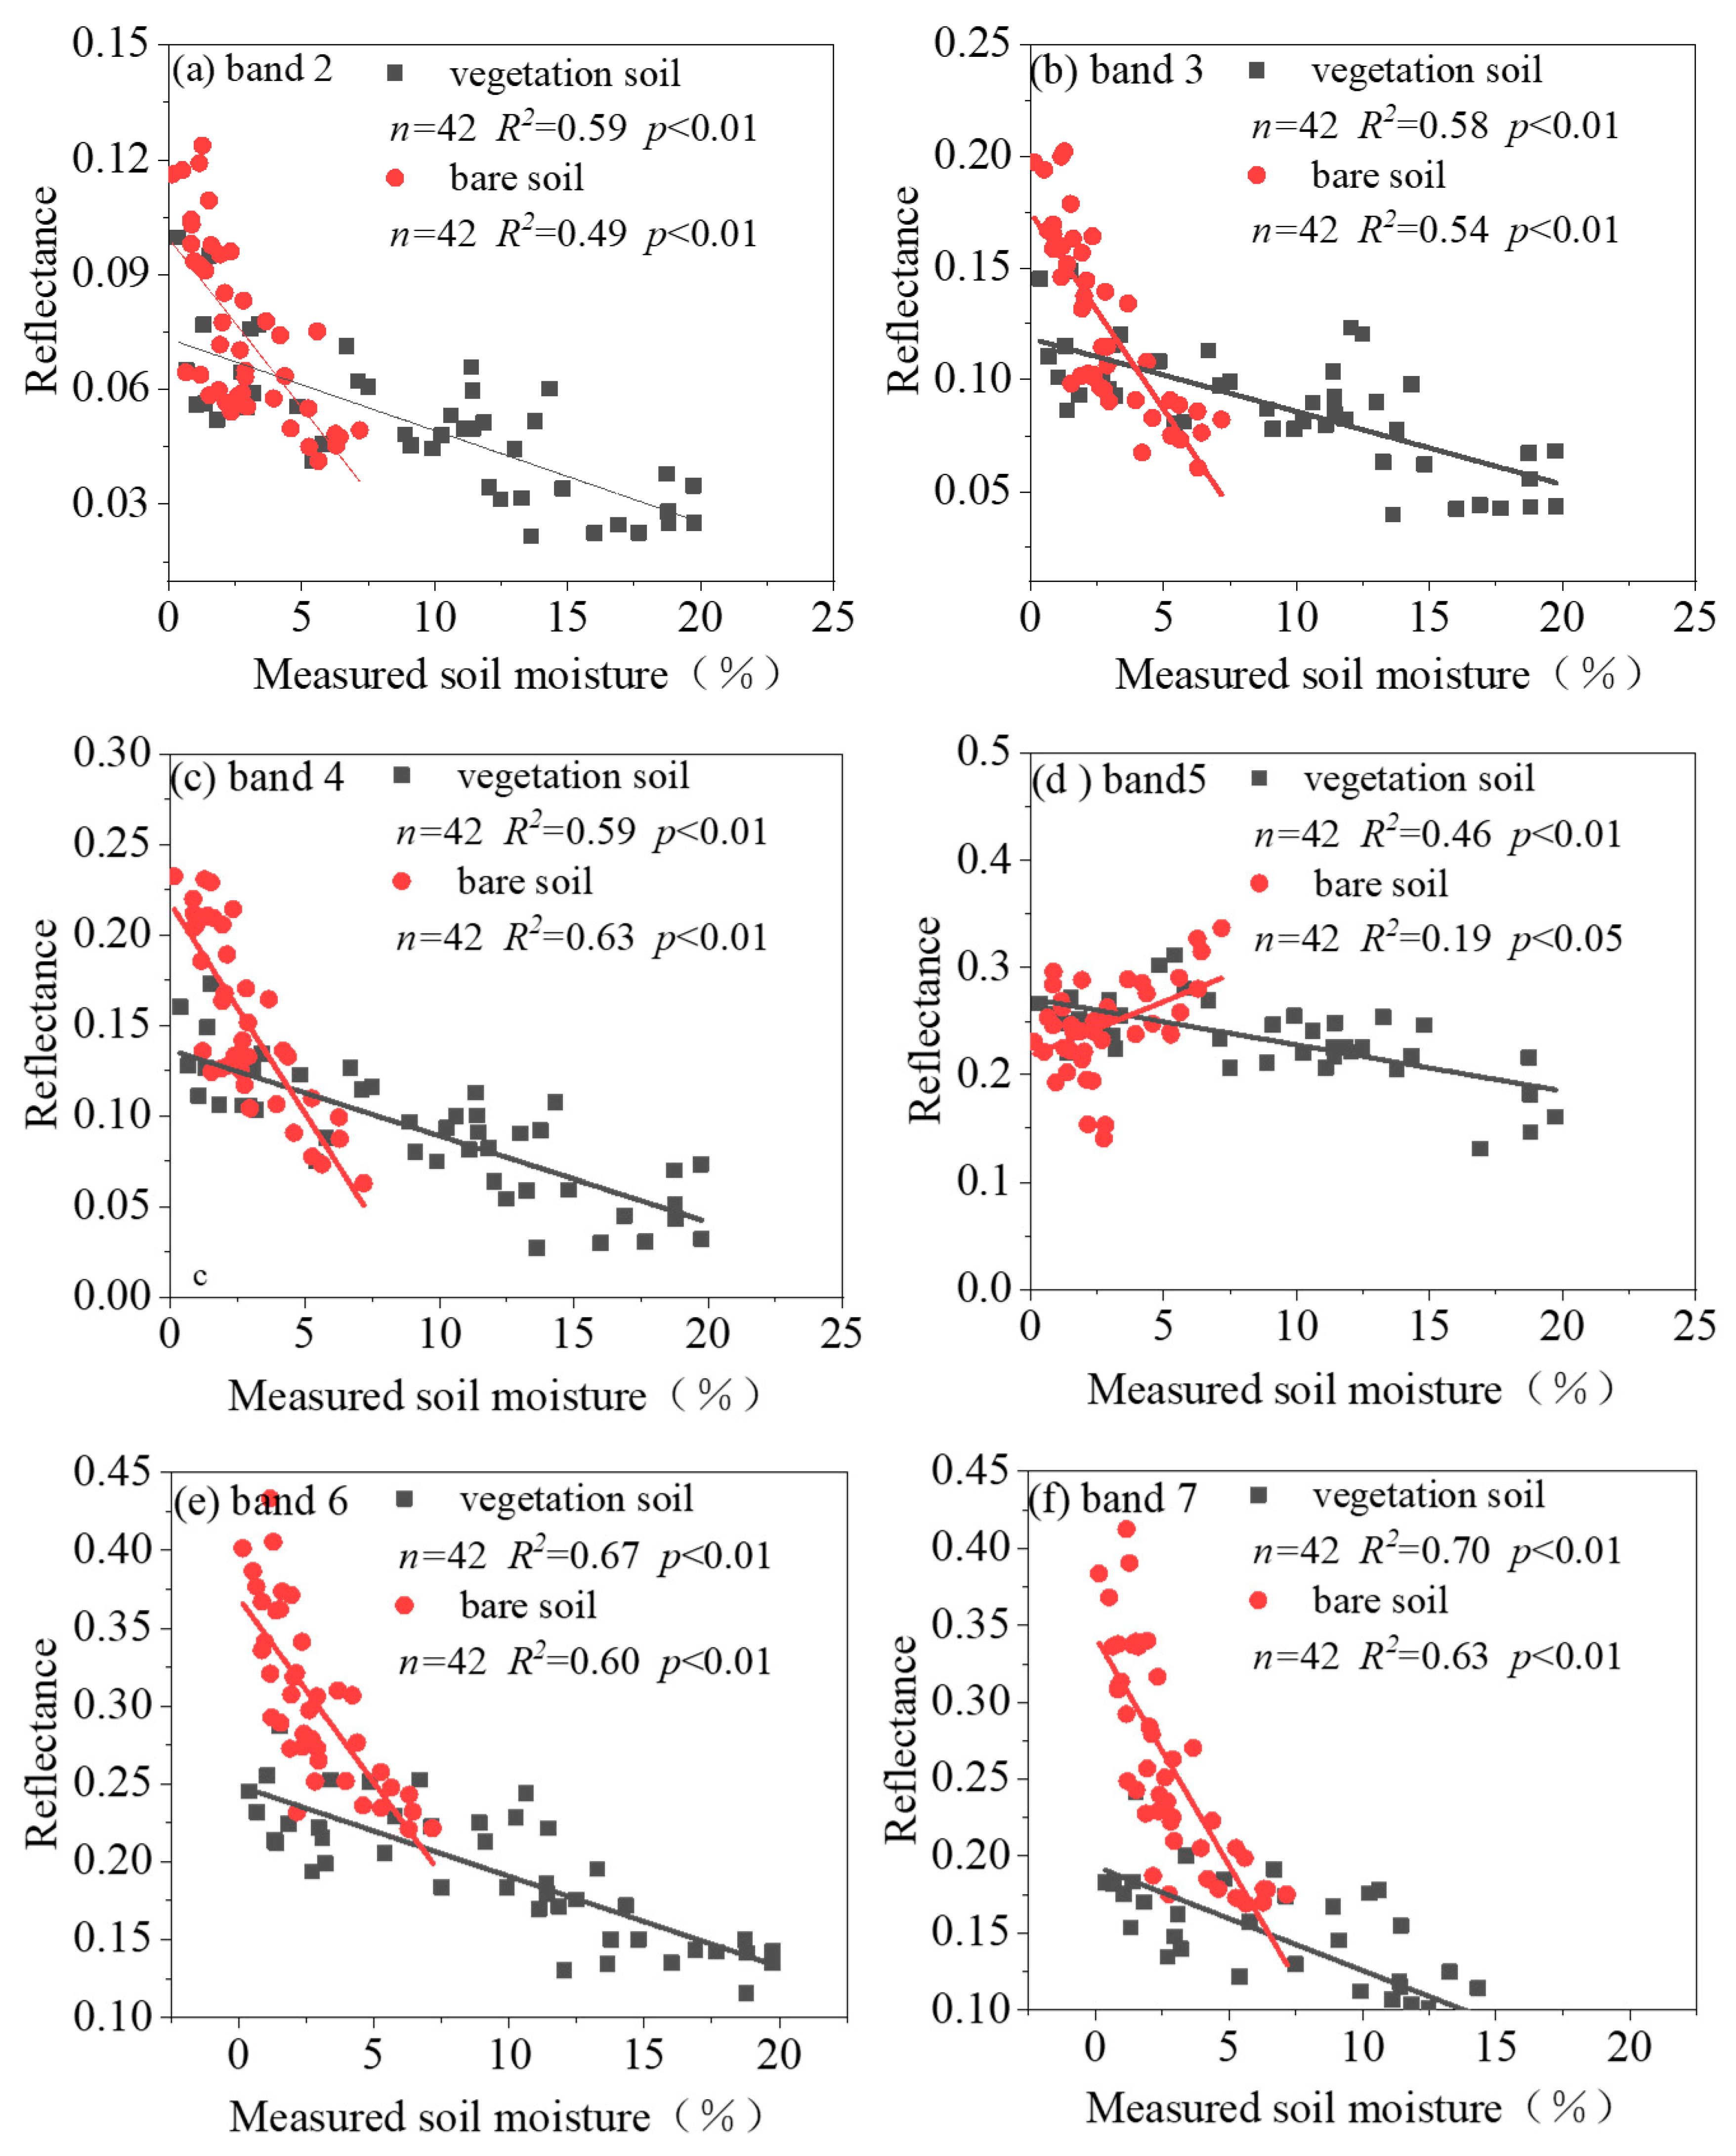
Figure 3 shows the scatter plot between Landsat and MODIS fused band reflectance data and field-measured surface soil moisture. In general, the blue, green, red, near-infrared, and short-wave infrared reflectance mostly showed negative correlations with soil surface moisture in different vegetation covers, but the opposite result was observed for the near-infrared band in bare soil, with a positive correlation (Figure 3d). This is the same result as that found in the study by Rida et al. [41].
Figure 3a–c show the scatter plots of the correlation relationship of visible fusion bands with surface soil moisture. In bare soil, the red, blue, and green bands with surface soil moisture had an R2 of 0.63, 0.56, and 0.54, respectively. In vegetated cover soil, the red, blue, and green bands with surface soil moisture had an R2 of 0.66, 0.59, and 0.58, respectively. The visible band correlations with surface soil moisture were higher in vegetated cover soils than in bare soils, which, in both bare and vegetated cover soils, the high correlation with the surface soil moisture of the red and blue bands can be explained by the sensitivity of the red and blue bands to the soil moisture. The correlation between the reflectance of the green band and surface soil moisture was higher in vegetated cover soils than in bare soil (Figure 3b). The reason for this is because green vegetation has the highest reflectance in the green band of the spectrum.
The SWIR1 and SWIR2 reflectance in the short-wave infrared band correlated well with the soil surface moisture (Figure 3e,f). In bare soil, SWIR1 and SWIR2 correlated with the surface soil moisture, with an R2 of 0.67 and 0.70, respectively. In vegetated soil, SWIR1 and SWIR2 correlated with the surface soil moisture, with an R2 of 0.60 and 0.63, respectively. It is clear that the correlation between the SWIR2 band reflectance and surface soil moisture was higher than that of the SWIR1 band. Thus, short-wave infrared is more suitable for soil moisture inversion than near infrared, mainly because this spectrum band has a higher sensitivity to the reflectance of vegetation and soil moisture content by including moisture absorption bands.
In view of the obvious connection between the reflectance fused from the Landsat and MODIS data and the field-measured surface soil moisture, the blue, red, and short-wave infrared bands’ reflectance was considered as the most important predictor of surface soil moisture.
3.3. Correlation Analysis of the Spectral Index and the Surface Soil Moisture
In this study, the VSDI, NDII, and SIWSI were applied for correlation analysis between the surface soil moisture measured in the field under different vegetation cover soils and all showed a positive correlation. Of these, the VSDI had the highest correlation with surface soil moisture for bare soils (NDVI < 0.2), partially vegetated soils (0.2 < NDVI < 0.5), and highly vegetated soils (NDVI > 0.5). The R2 values were 0.59, 0.58, and 0.47, and the RMSE values were 1.76%, 1.59%, and 1.36%, respectively. The results of this study are similar to those of Amani et al. [42] using the TSMI for bare, partially vegetated, and fully vegetated soils.
The NDII and surface soil moisture of bare and highly covered soils were significantly correlated, with an R2 of 0.63 and 0.43, respectively. Conversely, the correlation coefficients were lower for partially vegetated cover soils, with an R2 of 0.38. The same results apply to the SIWSI spectral index. For partially vegetated cover soils, the estimation of surface soil moisture is more complicated, because vegetated soils have a higher reflectance in the NIR band than bare soils. For the NDII and SIWSI with the NIR band, the background reflectance will have a certain degree of influence on the vegetation direction reflection, showing that the indices are not suitable for estimating surface soil moisture in partially vegetated soils. The VSDI correlated better with the surface soil moisture (R2 = 0.58) than other indices (R2 < 0.38), allowing for better inversion and monitoring of the surface soil moisture for the different vegetation covers.
As shown in Table 1, the VSDI, NDII, and SIWIS spectral indices correlated with the surface soil moisture, thereby decreasing with increasing vegetation cover (increase in the NDVI), which is particularly evident in the NDII and SIWSI spectral indices, and which is related to the use of NIR bands that are easily affected by vegetation foliar structure and density [43]. Therefore, they are not suitable for studying the surface water content. The VSDI includes the SWIR2 band corresponding to the water vapor absorption peak, which is sensitive to the change in moisture reflectance, contains rich information of soil moisture, and can be applied to different vegetation cover soils.
3.4. Surface Soil Moisture Modeled by the Stepwise Linear Regression
The reflectance of remote sensing data fusion bands B2, B4, B6, and B7 were used as independent variables and the soil water content was used as a dependent variable, in which the proportions of the training and validation sets were 70% and 30%, respectively. The results of the model established by the “optimal” regression subset are shown in Table 2.
As shown in Table 2, the modeling coefficient of determination R2 increases with the number of modeling bands (m < 3) and decreases when the bands m = 4. The SR modeling of the soil moisture content was the best when the bands were B4, B6, and B7, at which time the modeling coefficient of determination R2 and root mean square error RMSE were 0.83 and 1.65, respectively, which are better. According to the F-test, the significance level of the model was less than 0.01. The test of the model indicated that there was a linear correlation between the independent variable and the dependent variable.
where y is the surface soil moisture, and B4, B6, and B7 are the reflectance of the fused bands.
3.5. Model Validation
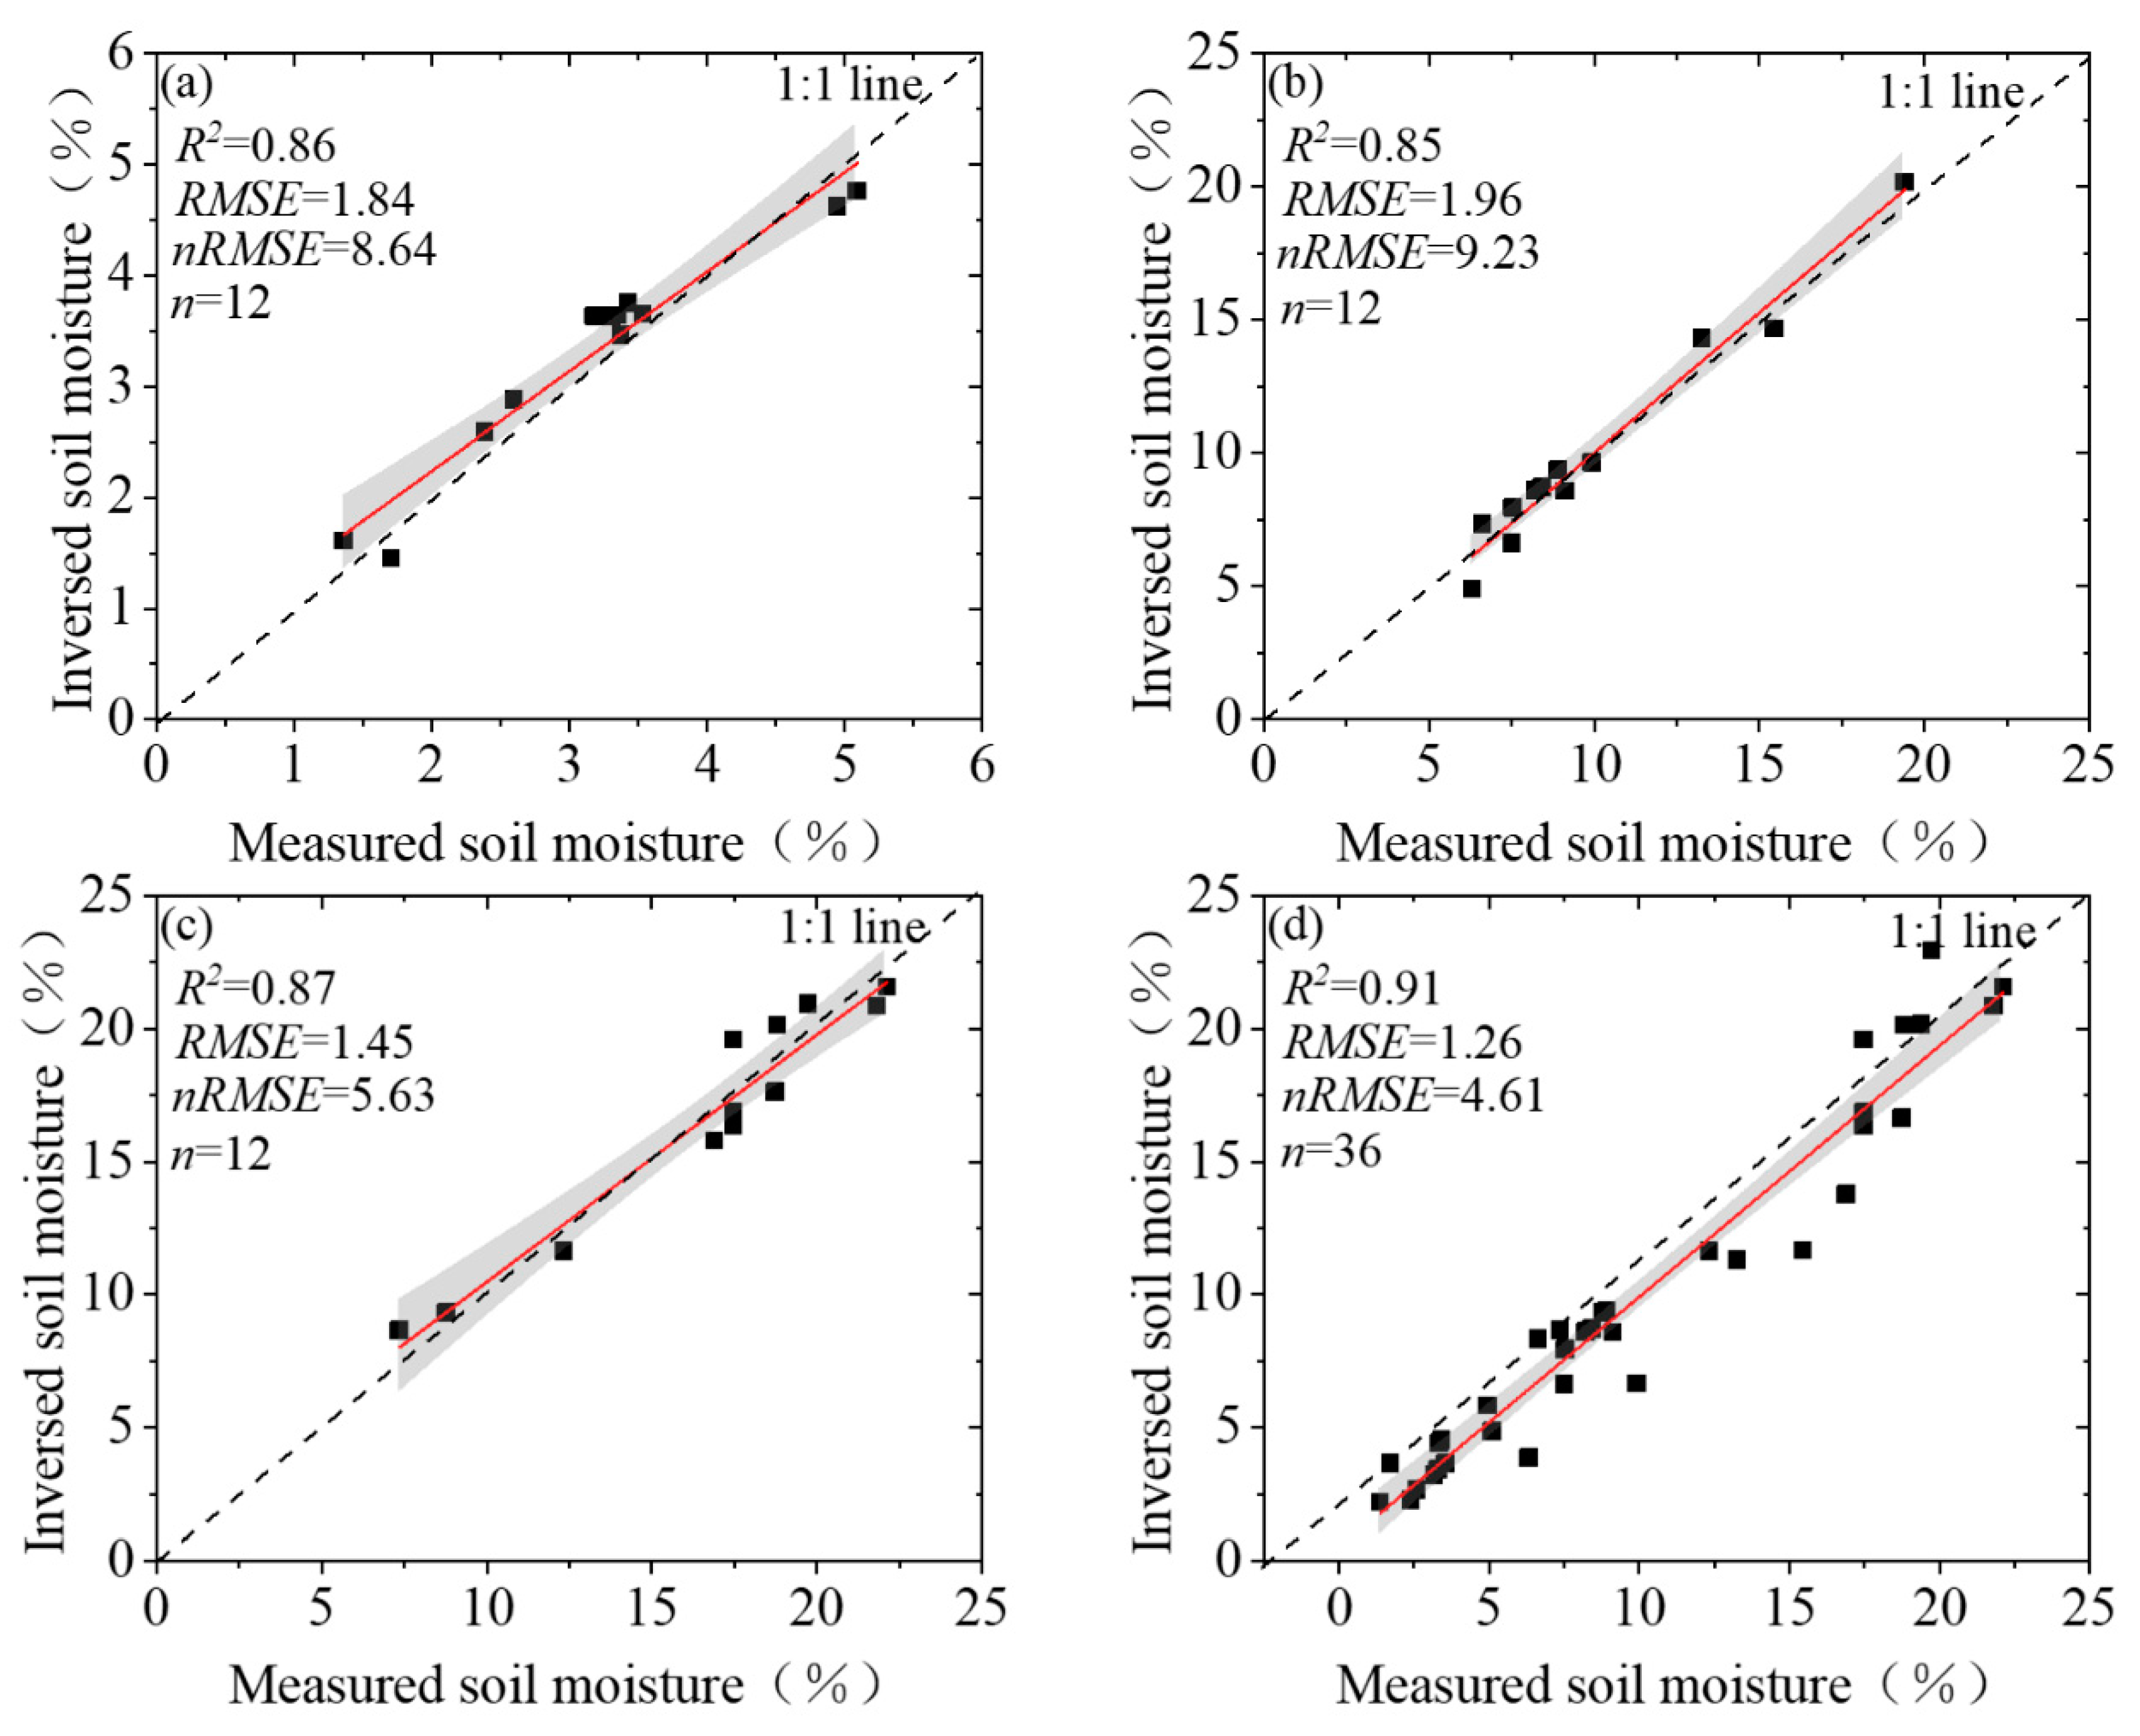
The surface soil moisture models were evaluated using the validation set and the validation results are shown in Figure 4. The predicted and measured values had a high correlation between each other. In the bare soil, the R2, RMSE, and nRMSE values were 0.86, 1.84%, and 8.64%, respectively. In partially covered soils, the values of R2, RMSE, and nRMSE were 0.84, 1.96%, and 9.23%, respectively. In highly covered soils, R2, RMSE, and nRMSE were 0.87, 1.45%, and 5.63%, respectively. This shows that the fitting effect of the model is more satisfactory. Therefore, the soil moisture inversion model constructed in this paper can predict the soil moisture condition in the study area with a high accuracy. It can be seen that the inversion accuracy of the model was improved to different degrees after the introduction of the red and SWIR bands’ reflectance. Among them, the NIR band is only sensitive to vegetation moisture [44], while the SWIR band is sensitive to both vegetation moisture and soil moisture [45], so the inversion accuracy of the model was significantly improved after considering the SWIR band.
3.6. Soil Moisture Spatial Distribution Characteristics
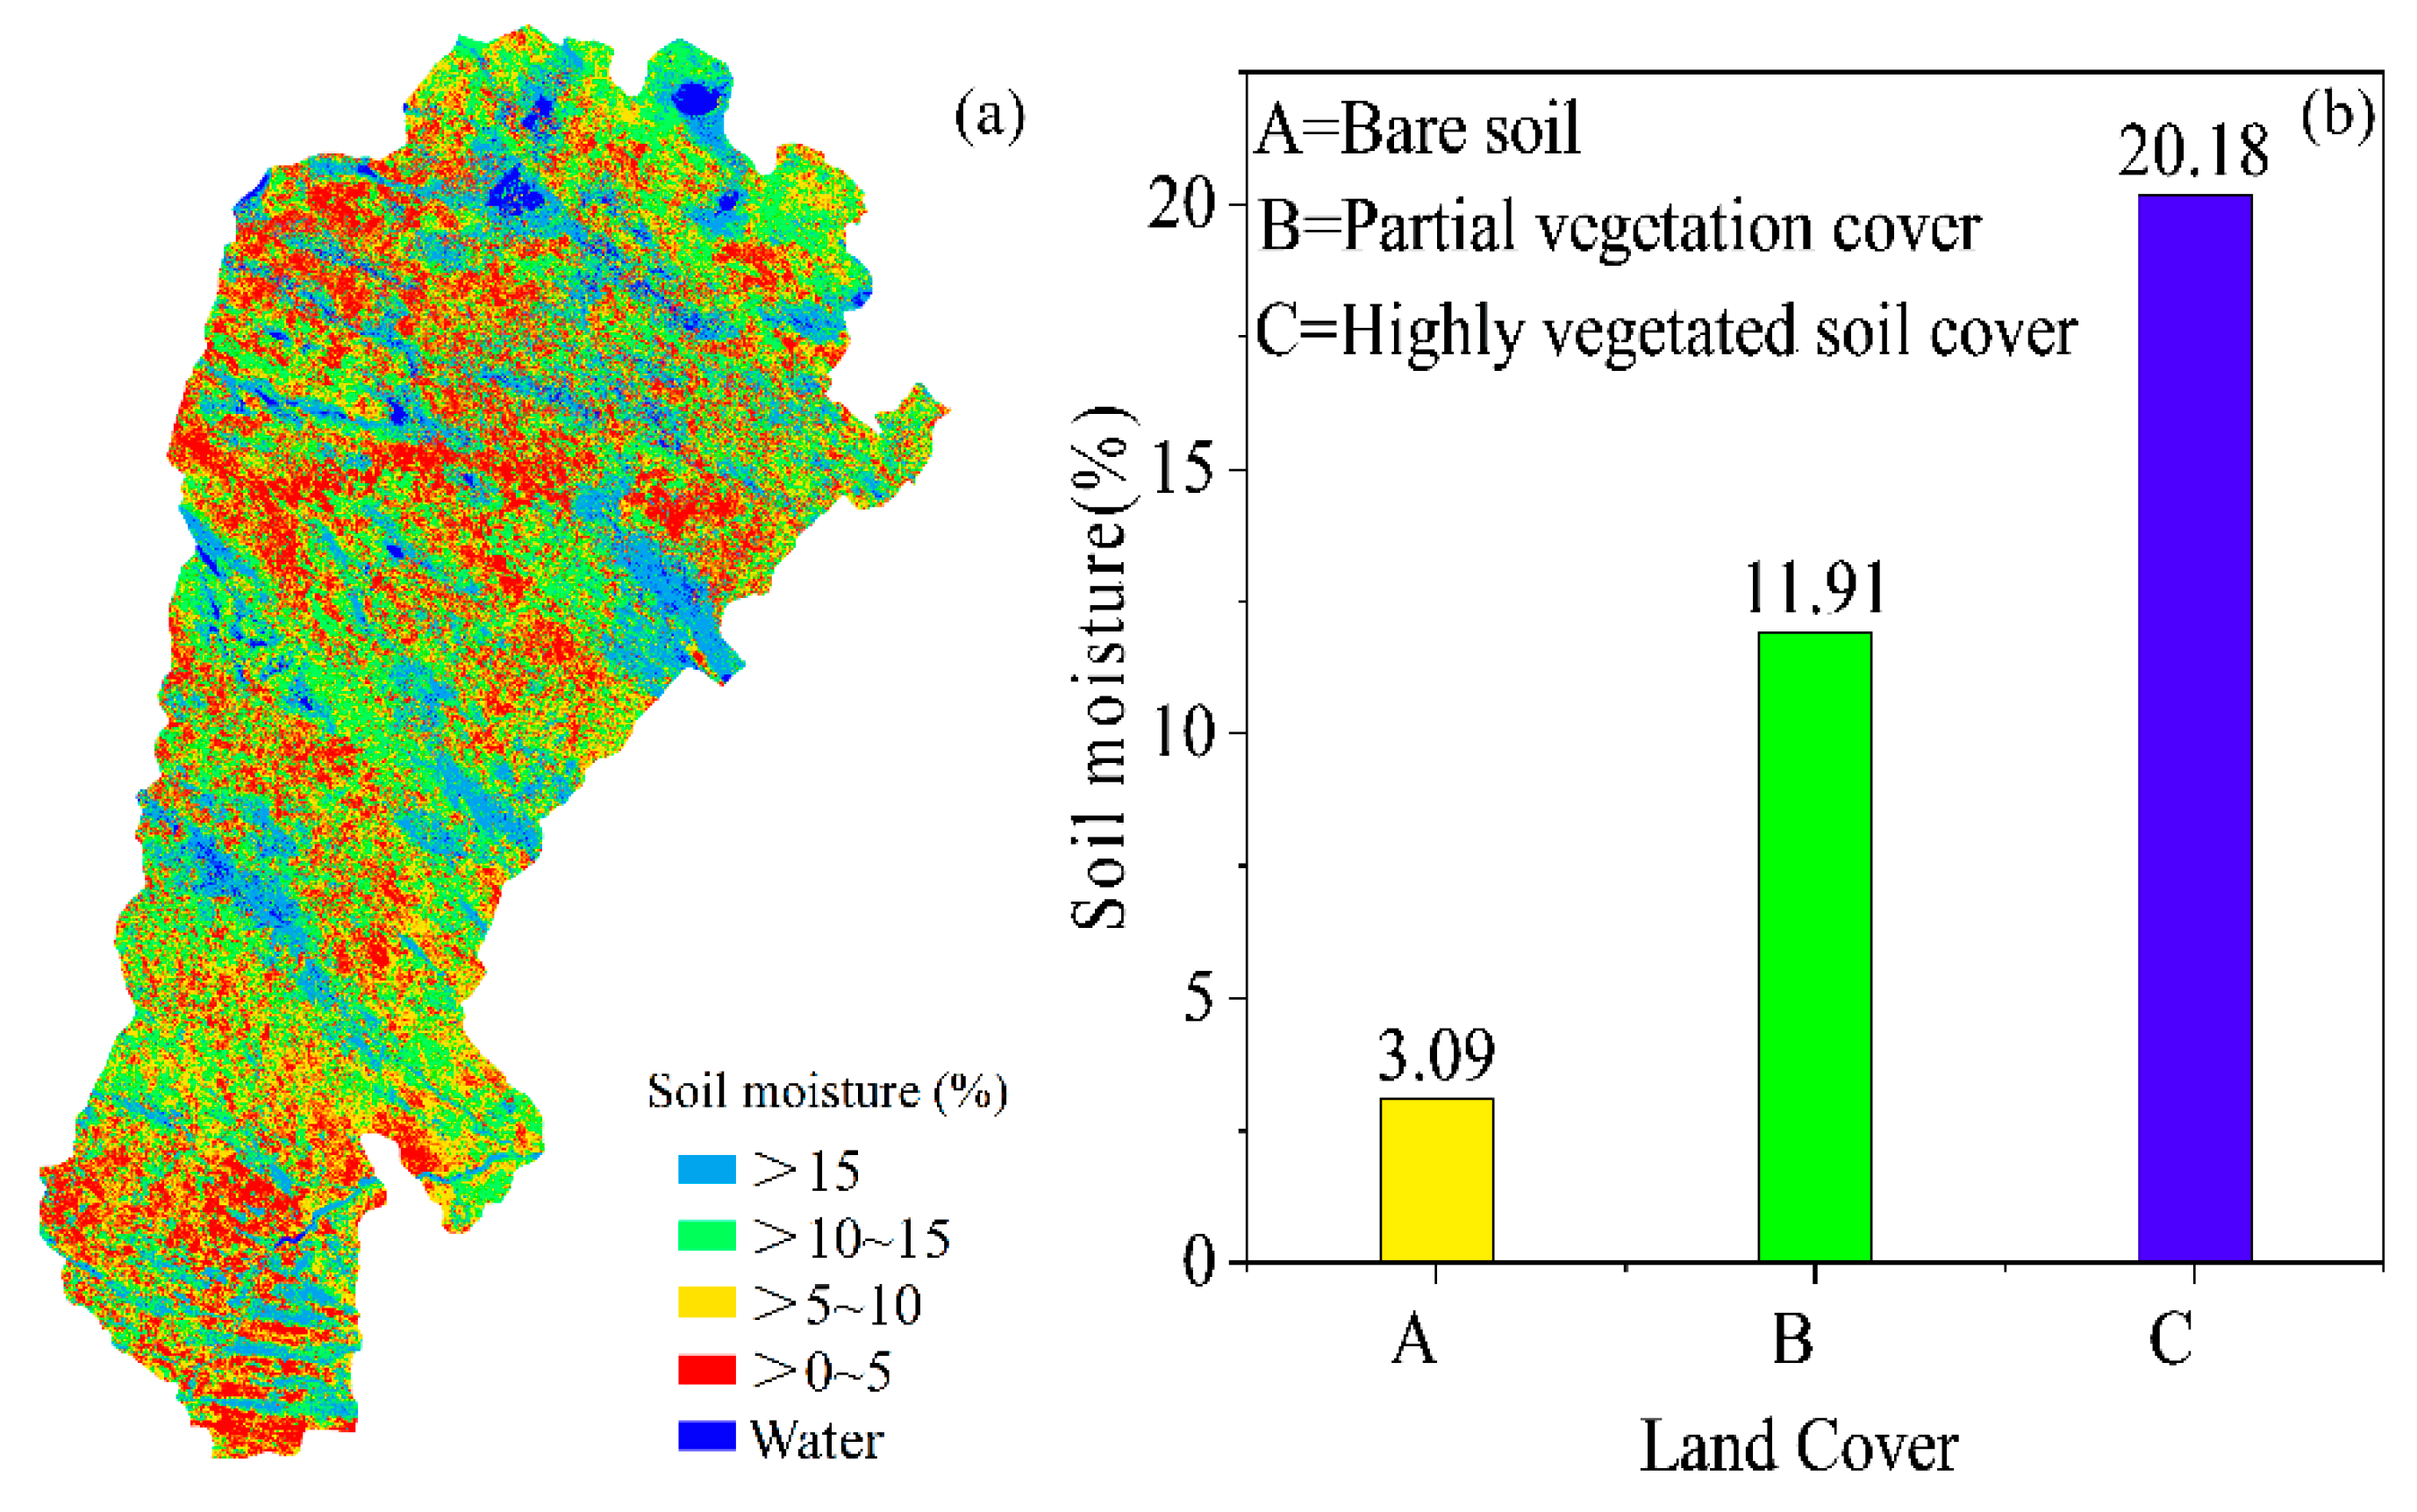
The soil moisture distribution in August 2016 is shown in Figure 5. The soil moisture distribution throughout the study area shows the actual true distribution, with areas shown in red having a low soil moisture content and mostly sandy areas, and areas shown in green having a high soil moisture content and mostly grassland areas. In the whole study area, the average soil water content in August was around 13.41%. Combined with different land cover and soil moisture distribution maps, a regional statistical analysis was conducted on the water content of three cover types: bare soil, partially vegetated cover soil, and highly vegetated cover soil; the results show that there were large differences in the soil water content of different vegetation covers, where the highest water content was found for the highly vegetated cover soil (20.18%), the lowest water content was found for the partially vegetated cover soil (11.91%), and the average water content value of 3.09% was found for the bare soil.
4. Discussion
In this study, we evaluated the ability of two optical remote sensing methods in order to monitor the surface soil moisture in deserted grassland areas, spanning from bare soil to highly vegetated cover soils. The first method compared and evaluated the monitoring capability of three spectral indices (VSDI, SIWSI, and NDII) for surface soil moisture. Spectral indices are a common method for studying ground problems using satellite-based multispectral sensors, which make full use of the spectral information of the ground features. The NDII was significantly correlated with surface soil moisture in bare and highly vegetated soils, with R2 values of 0.63 and 0.43, respectively. In contrast, partially vegetated soils had a lower correlation coefficient, with an R2 of 0.38. The same results apply to the SIWSI spectral index. In partially vegetated soils, surface soil moisture estimates are more complex because the NIR reflectance of vegetation is higher than that of bare soil. NDII and SIWSI values no longer represent the true surface reflectance when using the NIR band, indicating that these indices are not suitable for estimating surface soil moisture in partially vegetated soils. For a mixed cover of bare soil and vegetation, a common feature when comparing the spectral response of soil and vegetation under moisture stress is that a decrease in moisture content is associated with an increase in reflectance over the optical wavelength range, particularly in the red and SWIR bands. In general, the reflection response increases with increasing wavelength. The VSDI uses the difference between wavelengths with moisture sensitivity in order to estimate the moisture content of different ground cover types based on this common feature, with a higher correlation (R2 = 0.58) than other indices (R2 < 0.38). The main limitation of the VSDI is that it is calculated using only the spectral bands and does not take into account the temperature index. Wang et al. [46] estimated that the moisture content of different ground cover types using a TVDI composed of a vegetation index and surface temperature, with a higher correlation (R2 = 0.604) than the VSDI (R2 = 0.58). This indicates that the temperature index is also an important factor in characterizing drought. As a result, the VSDI may not perform well in drought-prone areas where the main limiting factor is temperature rather than rainfall.
In summary, different spectral indices have different advantages, disadvantages, and applications, but a drought index applicable to different vegetation cover types is still worth exploring because the vegetation cover in the study area may change over time [47,48,49]. Vegetation moisture indices and soil moisture indices cannot work alone in this case due to the limitations of the application range. Possible solutions are to perform a vegetation cover classification and assign a suitable drought index to each category, or to find a drought index that can be applied to different vegetation covers. However, classification accuracy and the combined use of different drought indices may increase the uncertainty of the final results and the complexity of agricultural drought monitoring.
The studied spectral indices are mostly based on typical sensitive bands or a single spectral index in order to model the soil moisture estimation, but the spectral information embedded in these data is often saturated, and too many indices lead to the phenomenon of a reduced model accuracy [50]. In this paper, a new surface soil moisture model based on the combination of spectral reflectance values of different bands could reflect the vegetation growth and soil moisture in a certain area using a stepwise regression method based on Landsat and MODIS multispectral fusion bands, which can be applied to the soil moisture inversion from bare soil to highly vegetated cover. According to the spectral information of soil and vegetation, the quantitative estimation of soil moisture has certain theoretical support from remote sensing and spectral mechanisms, its verification results have certain data support from field experiments, and this idea has great potential for the application in solving the problem of the insufficient accuracy of agricultural drought monitoring in large regions. However, this conclusion also has some limitations. Due to the small number of samples, this method cannot be used as a mature practical method at present. In order to make this method practical, it is necessary to increase the representation and number of samples and to establish a reliable and stable soil moisture inversion model. Although some studies have shown that reflectance can be used to characterize the relationship between moisture content and the absorptivity of soils with different textures by linear models. In addition, some other results also found that for a low soil moisture content, a single linear relationship can be used to roughly estimate the soil water content. With the increase of the soil moisture content, a nonlinear relationship should be considered in order to estimate the soil water content. A simple linear relationship has limitations in describing the relationship between soil moisture and reflectance. In order to more accurately describe the relationship between reflectance and soil moisture, further study is needed first to determine the nonlinear relationship between band reflectance and soil moisture through the use of a machine learning algorithm.
5. Conclusions
- (1)
- In this study, the VSDI, NDII, and SIWSI were found to be positively correlated with surface soil moisture, among which the VSDI had the highest correlation with surface soil moisture for bare soil (NDVI < 0.2), partially vegetated soil (0.2 < NDVI < 0.5), and highly vegetated soil (NDVI > 0.5), with R2 values of 0.69, 0.68, and 0.47, and RMSE values of 1.76%, 1.59%, and 1.36%, respectively;
- (2)
- Surface soil moisture models were evaluated using the validation set. In bare soil, the values of R2, RMSE, and nRMSE were 0.86, 1.84%, and 8.64%, respectively. In partially vegetated soils, the values of R2, RMSE, and nRMSE were 0.84, 1.96%, and 9.23%, respectively. In the highly vegetated cover soil, the values of R2, RMSE, and nRMSE were 0.87, 1.45%, and 5.63%, respectively. This indicates that the developed model can better reflect the actual level of surface soil moisture in different land cover types;
- (3)
- The soil water content in the study area averaged around 13.41% in August. Additionally, different vegetation cover types had large differences in water content, with the highest soil water content found in the highly vegetated cover (20.18%), the lowest soil water content found in the partially vegetated cover (11.91%), and an average soil water content of 3.09% found in the bare soil.
Author Contributions
S.W. and S.Z. designed the project, conducted the data analysis, discussed the results, and wrote the manuscript. Y.W. and W.W. contributed to the interpretation of the results and provided expert advice on this manuscript. All authors have read and agreed to the published version of the manuscript.
Funding
This research was funded by a special research project of the China Institute of Water Resources and Hydropower Research (No. MK2020J11), the Inner Mongolia Applied technology research and development fund project (No. 2021GG0020), the IWHR Research & Development Support Program (No. MK0145B022021), major special projects and projects of the science and technology plan of the Inner Mongolia Autonomous Region (Nos. 2020ZD0020, 2021GG0050), and the IWHR Internationally-oriented Talents Program. The central government will guide local funding projects for scientific and technological development (No. 2021ZY0027).
Institutional Review Board Statement
Not applicable.
Informed Consent Statement
If the publication or product is published on an open access basis, I understand that it will be freely available on the internet and may be seen by the general public.
Data Availability Statement
The datasets generated and analyzed during the current study are available from the corresponding author upon reasonable request.
Conflicts of Interest
The authors have no conflict of interest to declare that are relevant to the content of this article.
References
- Gidey, E.; Dikinya, O.; Sebego, R.; Segosebe, E.; Zenebe, A. Analysis of the long-term agricultural drought onset, cessation, duration, frequency, severity and spatial extent using Vegetation Health Index (VHI) in Raya and its environs, Northern Ethiopia. Environ. Syst. Res. 2018, 7, 13. [Google Scholar] [CrossRef] [Green Version]
- Choi, M.; Jacobs, J.M.; Anderson, M.C.; Bosch, D.D. Evaluation of drought indices via remotely sensed data with hydrological variables. J. Hydrol. 2013, 476, 265–273. [Google Scholar] [CrossRef]
- Dai, A. Drought under global warming: A review. Wiley Interdiscip. Rev. Clim. Chang. 2011, 2, 45–65. [Google Scholar] [CrossRef] [Green Version]
- Wang, H.; Liu, G.; Li, Z.; Ye, X.; Fu, B.; Lv, Y. Impacts of Drought and Human Activity on Vegetation Growth in the Grain for Green Program Region, China. Chin. Geogr. Sci. 2018, 28, 470–481. [Google Scholar] [CrossRef] [Green Version]
- Daly, E.; Porporato, A. A review of soil moisture dynamics: From rainfall infiltration to ecosystem response. Environ. Eng. Sci. 2005, 22, 9–24. [Google Scholar] [CrossRef]
- Nam, S.; Kang, S.; Kim, J. Maintaining a constant soil moisture level can enhance the growth and phenolic content of sweet basil better than fluctuating irrigation. Agric. Water Manag. 2020, 238, 106203. [Google Scholar] [CrossRef]
- Seneviratne, S.I.; Corti, T.; Davin, E.L.; Hirschi, M.; Jaeger, E.B.; Lehner, I.; Orlowsky, B.; Teuling, A.J. Investigating soil moisture–climate interactions in a changing climate: A review. Earth-Sci. Rev. 2010, 99, 125–161. [Google Scholar] [CrossRef]
- Behera, S.S.; Nikam, B.R.; Babel, M.S.; Garg, V.; Aggarwal, S.P. The Assimilation of Remote Sensing-Derived Soil Moisture Data into a Hydrological Model for the Mahanadi Basin, India. J. Indian Soc. Remote Sens. 2019, 47, 1357–1374. [Google Scholar] [CrossRef]
- Petropoulos, G.P.; Ireland, G.; Barrett, B. Surface soil moisture retrievals from remote sensing: Current status, products & future trends. Phys. Chem. Earth Parts A/B/C 2015, 83–84, 36–56. [Google Scholar]
- Jin, S.; Sader, S.A. Comparison of time series tasseled cap wetness and the normalized difference moisture index in detecting forest disturbances. Remote Sens. Environ. 2005, 94, 364–372. [Google Scholar] [CrossRef]
- Bidgoli, R.D.; Koohbanani, H.; Keshavarzi, A.; Kumar, V. Measurement and zonation of soil surface moisture in arid and semi-arid regions using Landsat 8 images. Arab. J. Geosci. 2020, 13, 826. [Google Scholar] [CrossRef]
- Rahimzadeh-Bajgiran, P.; Berg, A.A.; Champagne, C.; Omasa, K. Estimation of soil moisture using optical/thermal infrared remote sensing in the Canadian Prairies. ISPRS J. Photogramm. Remote Sens. 2013, 83, 94–103. [Google Scholar] [CrossRef]
- Qin, J.; Yang, K.; Lu, N.; Chen, Y.; Zhao, L.; Han, M. Spatial upscaling of in-situ soil moisture measurements based on MODIS-derived apparent thermal inertia. Remote Sens. Environ. 2013, 138, 1–9. [Google Scholar] [CrossRef]
- Ebtehaj, A.; Bras, R.L. A physically constrained inversion for high-resolution passive microwave retrieval of soil moisture and vegetation water content in L-band. Remote Sens. Environ. 2019, 233, 111346. [Google Scholar] [CrossRef]
- Kolassa, J.; Reichle, R.H.; Draper, C.S. Merging active and passive microwave observations in soil moisture data assimilation. Remote Sens. Environ. 2017, 191, 117–130. [Google Scholar] [CrossRef]
- Veysi, S.; Naseri, A.A.; Hamzeh, S. Relationship Between Field Measurement of Soil Moisture in the Effective Depth of Sugarcane Root Zone and Extracted Indices from Spectral Reflectance of Optical/Thermal Bands of Multispectral Satellite Images. J. Indian Soc. Remote Sens. 2020, 48, 1035–1044. [Google Scholar] [CrossRef]
- Bowers, S.A.; Hanks, R.J. Reflection of Radiant Energy from Soils. Soil Sci. 1965, 100, 130–138. [Google Scholar] [CrossRef] [Green Version]
- Rahimzadeh-Bajgiran, P.; Omasa, K.; Shimizu, Y. Comparative evaluation of the Vegetation Dryness Index (VDI), the Temperature Vegetation Dryness Index (TVDI) and the improved TVDI (iTVDI) for water stress detection in semi-arid regions of Iran. ISPRS J. Photogramm. Remote Sens. 2012, 68, 1–12. [Google Scholar] [CrossRef]
- Das, S. Characterization of Surface Geological Material in Northwest India and Adjoining Areas of Pakistan Using Normalized Difference Water Index, Land Surface Temperature and Silica Index. J. Indian Soc. Remote Sens. 2018, 46, 1645–1656. [Google Scholar] [CrossRef]
- Tavazohi, E.; Ahmadi, M. Assessment of drought in the Zayandehroud basin during 2000-2015 using NDDI and SPI indices. Fresenius Environ. Bull. 2018, 27, 2332–2340. [Google Scholar]
- Otkin, J.A.; Anderson, M.C.; Hain, C.; Svoboda, M.; Johnson, D.; Mueller, R.; Tadesse, T.; Wardlow, B.; Brown, J. Assessing the evolution of soil moisture and vegetation conditions during the 2012 United States flash drought. Agric. For. Meteorol. 2016, 218–219, 230–242. [Google Scholar] [CrossRef] [Green Version]
- Zhan, Z.; Qin, Q.; Ghulan, A.; Wang, D. NIR-red spectra space based new method for soil moisture monitoring. Sci. China Ser. D Earth Sci. 2007, 50, 283–289. [Google Scholar] [CrossRef]
- Ghulam, A.; Qin, Q.; Zhan, Z. Designing of the perpendicular drought index. Environ. Geol. 2007, 52, 1045–1052. [Google Scholar] [CrossRef]
- Liu, Y.; Wu, L.X.; Ma, B.D. Remote sensing monitoring of soil Moisture on the basis of TM/ETM + spectral space. Zhongguo Kuangye Daxue Xuebao/J. China Univ. Min. Technol. 2013, 42, 296–301. [Google Scholar]
- Zhang, H.; Chen, H.; Sun, R.; Yu, W.; Zou, C.; Shen, S. The Application of Unified Surface Water Capacity Method in Drought Remote Sensing Monitoring. In Remote Sensing for Agriculture, Ecosystems, and Hydrology XI; SPIE: Bellingham, WA, USA, 2009; pp. 324–330. [Google Scholar]
- Fensholt, R.; Sandholt, I. Derivation of a Shortwave Infrared Water Stress Index from MODIS Near- and Shortwave Infrared Data in a Semiarid Environment. Remote Sens. Environ. 2003, 87, 111–121. [Google Scholar] [CrossRef]
- Wang, L.; Qu, J. NMDI: A normalized multi-band drought index for monitoring soil and vegetation moisture with satellite remote sensing. Geophys. Res. Lett.-Geophy.s Res. Lett. 2007, 34. [Google Scholar] [CrossRef]
- Zhang, J.-H.; Zhou, Z.; Yao, F.; Yang, L.; Hao, C. Validating the Modified Perpendicular Drought Index in the North China Region Using In Situ Soil Moisture Measurement. IEEE Geosci. Remote Sens. Lett. 2015, 12, 542–546. [Google Scholar] [CrossRef]
- Zhang, N.; Hong, Y.; Qin, Q.; Liu, L. VSDI: A visible and shortwave infrared drought index for monitoring soil and vegetation moisture based on optical remote sensing. Int. J. Remote Sens. 2013, 34, 4585–4609. [Google Scholar] [CrossRef]
- Zhu, X.; Chen, J.; Gao, F.; Chen, X.; Masek, J.G. An enhanced spatial and temporal adaptive reflectance fusion model for complex heterogeneous regions. Remote Sens. Environ. 2010, 114, 2610–2623. [Google Scholar] [CrossRef]
- Sisheber, B.; Marshall, M.; Mengistu, D.; Nelson, A. Tracking crop phenology in a highly dynamic landscape with knowledge-based Landsat–MODIS data fusion. Int. J. Appl. Earth Obs. Geoinf. 2022, 106, 102670. [Google Scholar] [CrossRef]
- Ghosh, R.; Gupta, P.K.; Tolpekin, V.; Srivastav, S.K. An enhanced spatiotemporal fusion method—Implications for coal fire monitoring using satellite imagery. Int. J. Appl. Earth Obs. Geoinf. 2020, 88, 102056. [Google Scholar] [CrossRef]
- Zhou, X.; Wang, P.; Tansey, K.; Zhang, S.; Li, H.; Wang, L. Developing a fused vegetation temperature condition index for drought monitoring at field scales using Sentinel-2 and MODIS imagery. Comput. Electron. Agric. 2020, 168, 105144. [Google Scholar] [CrossRef]
- Benabdelouahab, T.; Balaghi, R.; Hadria, R.; Lionboui, H.; Minet, J.; Tychon, B. Monitoring surface water content using visible and short-wave infrared SPOT-5 data of wheat plots in irrigated semi-arid regions. Int. J. Remote Sens. 2015, 36, 4018–4036. [Google Scholar] [CrossRef]
- Zhang, N.; Hong, Y.; Qin, Q.; Zhu, L. Evaluation of the Visible and Shortwave Infrared Drought Index in China. Int. J. Disaster Risk Sci. 2013, 4, 68–76. [Google Scholar] [CrossRef] [Green Version]
- Zhou, H.; Zhou, G.; Song, X.; He, Q. Dynamic Characteristics of Canopy and Vegetation Water Content during an Entire Maize Growing Season in Relation to Spectral-Based Indices. Remote Sens. 2022, 14, 584. [Google Scholar] [CrossRef]
- Olsen, J.L.; Ceccato, P.; Proud, S.R.; Fensholt, R.; Grippa, M.; Mougin, E.; Ardö, J.; Sandholt, I. Relation between Seasonally Detrended Shortwave Infrared Reflectance Data and Land Surface Moisture in Semi-Arid Sahel. Remote Sens. 2013, 5, 2898–2927. [Google Scholar] [CrossRef] [Green Version]
- Dou, X.; Wang, X.; Liu, H.; Zhang, X.; Meng, L.; Pan, Y.; Yu, Z.; Cui, Y. Prediction of soil organic matter using multi-temporal satellite images in the Songnen Plain, China. Geoderma 2019, 356, 113896. [Google Scholar] [CrossRef]
- Bai, Y.; Zhou, Y. The main factors controlling spatial variability of soil organic carbon in a small karst watershed, Guizhou Province, China. Geoderma 2020, 357, 113938. [Google Scholar] [CrossRef]
- Yang, Z.; Zhao, J.; Liu, J.; Wen, Y.; Wang, Y. Soil Moisture Retrieval Using Microwave Remote Sensing Data and a Deep Belief Network in the Naqu Region of the Tibetan Plateau. Sustainability 2021, 13, 12635. [Google Scholar] [CrossRef]
- Khellouk, R.; Barakat, A.; Boudhar, A.; Hadria, R.; Lionboui, H.; El Jazouli, A.; Rais, J.; El Baghdadi, M.; Benabdelouahab, T. Spatiotemporal monitoring of surface soil moisture using optical remote sensing data: A case study in a semi-arid area. J. Spat. Sci. 2018, 65, 481–499. [Google Scholar] [CrossRef]
- Amani, M.; Parsian, S.; Mirmazloumi, S.M.; Aieneh, O. Two new soil moisture indices based on the NIR-red triangle space of Landsat-8 data. Int. J. Appl. Earth Obs. Geoinf. 2016, 50, 176–186. [Google Scholar] [CrossRef]
- Pinty, B.; Lavergne, T.; Widlowski, J.L.; Gobron, N.; Verstraete, M.M. On the need to observe vegetation canopies in the near-infrared to estimate visible light absorption. Remote Sens. Environ. 2009, 113, 10–23. [Google Scholar] [CrossRef]
- Li, C.; Zhu, X.-C.; Wei, Y.; Cao, S.; Guo, X.; Yu, X.; Chang, C. Estimating apple tree canopy chlorophyll content based on Sentinel-2A remote sensing imaging. Sci. Rep. 2018, 8, 3756. [Google Scholar] [CrossRef] [PubMed]
- Jia-hua, Z.; Li, L.; Feng-mei, Y. Progress in Retrieving Vegetation Water Content under Different Vegetation Coverage Condition Based on Remote Sensing Spectral Information. Spectrosc. Spectr. Anal. 2010, 30, 1638–1642. [Google Scholar]
- Wang, S.; Li, R.; Li, X. Inversion and distribution of soil moisture in belly of Maowusu sandy land based on comprehensive drought index. Trans. Chin. Soc. Agric. Eng. 2019, 35, 113–121. [Google Scholar]
- Shen, M.-S.; Zhang, J.-J.; Zhang, S.-H.; Zhang, H.-B.; Sun, R.-X.; Zhang, Y.-Z. Seasonal variations in the influence of vegetation cover on soil water on the loess hillslope. J. Mt. Sci. 2020, 17, 2148–2160. [Google Scholar] [CrossRef]
- Makhamreh, Z. Derivation of vegetation density and land-use type pattern in mountain regions of Jordan using multi-seasonal SPOT images. Environ. Earth Sci. 2018, 77, 384. [Google Scholar] [CrossRef]
- Shan, L.; Yu, X.; Sun, L.; He, B.; Wang, H.; Xie, T. Seasonal differences in climatic controls of vegetation growth in the Beijing–Tianjin Sand Source Region of China. J. Arid. Land 2018, 10, 850–863. [Google Scholar] [CrossRef] [Green Version]
- Jahangir, M.H.; Arast, M. Estimation of Surface Soil Moisture Based on Improved Multi-index Models and Surface Energy Balance System. Nat. Resour. Res. 2021, 30, 789–804. [Google Scholar] [CrossRef]
Figure 1.
Geographical location (a) and sampling (b) layout of the study area.

Figure 2.
Accuracy analysis of the fusion results of each band.

Figure 3.
Correlation between the fusion bands of Landsat and MODIS and the field-measured surface soil moisture. (a) band 2, (b) band 3, (c) band 4, (d) band 5, (e) band 6, (f) band 7.
Figure 3.
Correlation between the fusion bands of Landsat and MODIS and the field-measured surface soil moisture. (a) band 2, (b) band 3, (c) band 4, (d) band 5, (e) band 6, (f) band 7.

Figure 4.
Scatter plots of the remote sensing inversion of the soil moisture and measured soil moisture: (a) bare soil; (b) partially vegetated cover soil; (c) highly vegetated cover soil; (d) all types of cover.
Figure 4.
Scatter plots of the remote sensing inversion of the soil moisture and measured soil moisture: (a) bare soil; (b) partially vegetated cover soil; (c) highly vegetated cover soil; (d) all types of cover.

Figure 5.
Spatial distribution map of 0–10 cm soil moisture on the surface on 27 August 2016. (a) Spatial distribution map of soil moisture and (b) The proportion of soil moisture under different land cover.
Figure 5.
Spatial distribution map of 0–10 cm soil moisture on the surface on 27 August 2016. (a) Spatial distribution map of soil moisture and (b) The proportion of soil moisture under different land cover.


Table 1.
Correlation between the surface soil moisture and the spectral index of different vegetation types.
Table 1.
Correlation between the surface soil moisture and the spectral index of different vegetation types.
| NDVI < 0.2 | 0.2 < NDVI < 0.5 | NDVI > 0.5 | |||||||
|---|---|---|---|---|---|---|---|---|---|
| R2 | RMSE/% | nRMSE/% | R2 | RMSE/% | nRMSE/% | R2 | RMSE/% | nRMSE/% | |
| VSDI | 0.59 | 1.76 | 9.46 | 0.58 | 1.59 | 10.03 | 0.47 | 1.36 | 6.44 |
| NDII | 0.63 | 1.34 | 7.2 | 0.38 | 2.56 | 16.15 | 0.43 | 1.40 | 6.63 |
| SIWSI | 0.50 | 2.25 | 12.09 | 0.21 | 3.02 | 19.02 | 0.42 | 1.37 | 6.49 |
Table 2.
SR model of soil moisture.
| Band m | Regression Model | R2 | RMSE/% | nRMSE/% | F Value | Sig. |
|---|---|---|---|---|---|---|
| 1 | Y = −0.002 × B7 + 9.09 | 0.62 | 3.87 | 16.35 | 43.64 | p < 0.01 |
| 2 | Y = 53.87 × B6 − 90.38 × B7 + 13.37 | 0.76 | 1.76 | 4.36 | 87.51 | p < 0.01 |
| 3 | Y = 186.34 × B4 + 18.95 × B6 − 226.84 × B7 + 21.03 | 0.83 | 1.65 | 3.57 | 123.65 | p < 0.01 |
| 4 | Y = 28.47 × B + 185.256 × B4 + 170.67 × B6 − 316.90 × B7 + 4.09 | 0.65 | 2.63 | 6.38 | 47.78 | p < 0.01 |
Publisher’s Note: MDPI stays neutral with regard to jurisdictional claims in published maps and institutional affiliations. |
© 2022 by the authors. Licensee MDPI, Basel, Switzerland. This article is an open access article distributed under the terms and conditions of the Creative Commons Attribution (CC BY) license (https://creativecommons.org/licenses/by/4.0/).
Share and Cite
MDPI and ACS Style
Wang, S.; Wang, W.; Wu, Y.; Zhao, S. Surface Soil Moisture Inversion and Distribution Based on Spatio-Temporal Fusion of MODIS and Landsat. Sustainability 2022, 14, 9905. https://doi.org/10.3390/su14169905
AMA Style
Wang S, Wang W, Wu Y, Zhao S. Surface Soil Moisture Inversion and Distribution Based on Spatio-Temporal Fusion of MODIS and Landsat. Sustainability. 2022; 14(16):9905. https://doi.org/10.3390/su14169905
Chicago/Turabian StyleWang, Sinan, Wenjun Wang, Yingjie Wu, and Shuixia Zhao. 2022. "Surface Soil Moisture Inversion and Distribution Based on Spatio-Temporal Fusion of MODIS and Landsat" Sustainability 14, no. 16: 9905. https://doi.org/10.3390/su14169905
Note that from the first issue of 2016, this journal uses article numbers instead of page numbers. See further details here.