Article

Satisfaction of Logistics Dispatchers Who Use Electric Tricycles\linebreak for the Last Mile of Delivery: Perspective from Policy Intervention

1
College of Automobile and Traffic Engineering, Nanjing Forestry University, Nanjing 210037, China
2
School of Transportation, Southeast University, Nanjing 211189, China
*
Author to whom correspondence should be addressed.
Sustainability 2022, 14(13), 7638; https://doi.org/10.3390/su14137638
Submission received: 9 May 2022 / Revised: 11 June 2022 / Accepted: 15 June 2022 / Published: 23 June 2022

Abstract

:
This paper investigates the satisfaction factors of logistics dispatchers who used electric tricycles for the last mile of delivery under policy intervention, and a questionnaire survey is conducted on the last-mile dispatchers in Nanjing. Based on four principal components extracted by exploratory factor analysis, the structural equation model (SEM) for the relationship between exogenous variables (sound policy, legality, and standardizing system) and endogenous variables (perceived convenience and satisfaction) is established to obtain the factors influencing the satisfaction of dispatchers. The results indicate that the correlation coefficients between the perceived convenience, sound policy, legality, standardizing system and the dispatchers’ satisfaction are 0.606, 0.448, 0.242 and −0.366, respectively. The correlations between perceived convenience, sound policy, legality and dispatchers’ satisfaction are significantly positive. The correlations between standardizing system and dispatchers’ satisfaction are negative. Finally, corresponding improvement policies are proposed based on the analysis of the model. The research results help improve the dispatcher’s satisfaction during the last-mile distribution process and provide support for standards by using electric tricycles and the formulation of new policies.

1. Introduction

In recent years, the express business volume in China has shown continuous growth. In 2021, the express business volume in China has reached 108.30 billion pieces [1], with an average daily delivery volume of about 290 million pieces [2]. Due to the rapid development of the e-economy, the transportation of goods between cities is more frequent, and the road infrastructure cannot meet the huge logistics demand in time. The consequences of these factors likely lead to more traffic congestion, noise, and pollution [3,4]. The last part of the supply chain is often referred to as the “last mile” and refers to the process of transporting a product to the end customer or point of sale. The last mile is often considered the most important element of the logistics process [5,6]. At present, vans, container trucks, electric tricycles, bicycles, special delivery vehicles, etc., are used as the main means of transportation for last-mile distribution. Diversified last-mile deliver vehicles and increasing distribution volume not only cause traffic chaos, but also increase traffic congestion and urban traffic pollution [7]. Under the requirements of energy-saving and emission-reduction standards in China’s transportation industry, electric tricycles have become an effective means of transportation for last-mile express distribution services by virtue of their mobility, flexibility, low carbon, environmental protection, and high-cost performance [8]. However, more and more electric tricycles are flooding into the courier industry due to the growing logistics demand, and there are fewer regulations for the distribution behavior of electric tricycles, especially the lack of a complete management system for last-mile distribution, which brings serious hidden dangers to road-traffic safety. At the same time, there are phenomena such as overloading, speeding, and arbitrary parking of electric tricycles.
In order to promote the standardization and efficient use of electric tricycles in the courier industry, on 13 November 2015, the State Post Bureau of China organized the Postal Science Research and Planning Institute to complete the national mandatory standard “Technical Requirements for Electric Tricycles for Express Delivery”. It not only regulates the height and length of electric tricycles for express delivery, but also restricts the speed, start-up, and load. In China, Nanjing, Guangzhou, Hangzhou, Tianjin, and Suzhou have formulated corresponding standard policies and quota policies, respectively, according to the norms. The standard policy unifies the appearance of electric tricycles, requires courier enterprises to purchase insurance uniformly, and the dispatchers (drivers) are uniformly ruled on duty. The total number of courier electric tricycles will be limited by the quota policy. However, with the intervention of standard policy and quota policy, the cost of logistics enterprises and distributors increases, the difficulty of distribution increases, the satisfaction of dispatchers is affected, and dispatchers’ income drop, resulting in a large number of dispatchers and potential dispatchers leaving the logistics market, an exodus that imperils the efficiency of express distribution. These have become bottlenecks that restrict the development of electric tricycles for last-mile delivery. Meanwhile, the lack of rational policies and regulations leads to inefficient logistics services, which then create new problems in policies related to urban freight and employment. In addition, dispatchers are managed by courier enterprises, which have become more stringent under the policy intervention.
The dispatchers are the direct users of electric tricycles; their satisfaction reflects the image and service level of the courier company and has the most direct impact on the dispatchers’ willingness to choose to engage in delivery services. In addition, the dispatchers’ satisfaction under policy interventions provide the reference for electric tricycles in logistics and distribution services. In view of these, it is necessary to study the factors influencing dispatchers’ satisfaction under policy intervention. For dispatchers, it is conducive to alleviating the imbalance between supply and demand of electric tricycles, balancing the income of dispatchers and increasing service loyalty. For courier enterprises, the results are beneficial to improving the overall delivery service level and distribution efficiency, and promoting the sustainable development of last-mile distribution service. For the government, the results also help to develop more reasonable policies and promote the promotion and application of electric tricycles in the logistics industry.
This study makes the following contributions. (1) Previous studies on satisfaction have mainly explored from the passenger perspective. The dispatchers are the direct users of electric tricycles. Therefore, dispatchers are used as the research object of this study. Based on the questionnaire data in Nanjing, China, the factors influencing the satisfaction of last-mile delivery dispatchers were analyzed. (2) Based on the current policies being implemented in electric tricycles and dispatchers and in order to explore the dispatchers’ satisfaction after the policy intervention, structural equation modeling is established to explore the influence of each factor on the dispatchers’ satisfaction.
The organization of this paper is divided into seven sections. The structure is as follows. In Section 2, we review the literature to study the last-mile delivery services, electric cargo bikes, and dispatcher satisfaction. Section 3 describes the data collection. In Section 4, we processed the acquired data and obtained four principal components extracted by exploratory factor analysis. Section 5 describes the research methodology of the SEM model and model building. Section 6 discusses the main findings and presents policy recommendations of this study. Some significant outcomes, limitations, and the future scope of this research preoccupy the final section.

2. Literature Review

This study focuses on the factors influencing the satisfaction of dispatchers using electric tricycles under policy interventions. However, the extant literature on this study is still scarce. The relevant literature primarily focuses on the effect of electric tricycles in saving energy and reducing emissions during last-mile distribution services, the application of electric cargo bicycles in last-mile distribution services, and passenger satisfaction studies in other transportation industries. These past studies provide the basis for this study.

2.1. Tricycles in Last-Mile Delivery

Researchers have been focusing on the application of electric tricycles in urban logistics, especially last-mile delivery services, many of which pay attention to analyzing the effect of energy saving and emission reduction in last-mile delivery. For example, Saenz et al. analyzed and compared the carbon footprint between the last-mile electric tricycle logistics system and the traditional diesel-powered van system, and took a tricycle logistics company (B-Line) located in downtown Portland, Oregon as an empirical study. The results showed that the electric tricycle logistics system had significantly reduced greenhouse-gas emissions and was twice as efficient as the conventional logistics system [9]. Navarro et al. built a smart logistics solution in Barcelona and Valencia, combining electric tricycles and trans-shipment terminals (or Urban Consolidation Centres) for last-mile distribution. In-depth analysis of these two cities was performed from a variety of perspectives, such as the economy, transport operations, transport energy, environment, and society; The experiment revealed that using this solution can save 2 ton of CO2 per year [10]. Figliozzi et al. proposed a lifecycle emissions minimization model to compare the carbon dioxide emissions of electric tricycles and traditional diesel-powered van in urban transportation, the use of small tricycles in dense service areas yielded the lowest lifecycle emissions. An analysis carried out in Portland, Oregon, the study suggested that lifecycle emissions per customer were reduced by at least six times when using tricycles [11]. Saenz et al. compared the carbon emissions of electric tricycle logistics services with traditional van logistics services. The results indicated that tricycles are more competitive and efficient than diesel vans in densely congested areas, and electric tricycles can reduce CO2 emissions by between 50% and 70% [12]. Leonardi et al. analyzed the environmental impact of clean vehicles, especially tricycles and cycles in urban freight. A trial was conducted in which a major stationery and office supplies company providing a delivery service to customers in central London, replacing their diesel vans with electric tricycles and electric vans. The research declared that a 14% reduction in total distance shipped and a 55% reduction in CO2 emissions per package respectively when using electric tricycles [13]. Bi K proposed a new collaborative distribution model based on an intelligent end-service station (IESS) and conducted an empirical study on five courier companies in Beijing. The model result demonstrated that the collaborative distribution using energy vehicles can greatly reduce carbon emissions and improve the overall loading rate of vehicles [14]. Mello et al. proposed an assessment procedure, which aimed to reconcile economic, environmental, and social aspects in the selection of alternatives for last mile delivery. The procedure signified that the electric tricycle alternative is feasible in the economic, environmental, and social aspects and the maintenance of the level of service [15]. Chawalit et al. established a model considering time cost and driver cost to analyze the competitiveness of electric tricycles and traditional diesel-powered vans. The model testified that electric tricycles are more competitive than diesel-powered vans in dense urban centers, and that the cost of drivers greatly affected the competitiveness of tricycles, but were hardly affected by the cost of electricity or diesel [16]. Marujo et al. evaluated last-mile distribution operations at a mobile warehouse in Rio de Janeiro, indicating that using cargo tricycles and mobile depots in the last mile delivery can significantly reduce greenhouse gas emissions and be cost-effective compared to traditional modes of transportation [17].

2.2. Electric Cargo Bikes

There has been research on electric cargo bikes (2, 3, or 4 wheelers, either electric or conventional). Melo and Baptista studied electric cargo bikes to replaced conventional cargo cars in urban logistics and estimated total transportation costs, emission costs, and labor cost. The results demonstrated that in areas with a maximum linear distance of about 2 km, cargo bikes can replace up to 10% of conventional trucks without changing the overall network efficiency. In addition, the CO2 emission impact of urban logistics can be reduced by up to 73% [18]. Sheth et al. presented a cost function to compare the route cost of a cargo truck and an Electric Assist (EA) cargo bicycle with three or four wheels in last-mile distribution. The results demonstrated that (EA) cargo bikes are more cost-effective than cargo trucks for package delivery routes of less than two kilometers and in areas with high residential and vehicle densities. [19]. Schliwa et al. proposes a cycle logistics solution for last-mile freight transport with electrically-assisted standard bicycles, cargo bikes, and cargo tricycles, declaring that application of cycle logistics in last mile delivery not only contributes to the decarbonization of urban freight transport but also represents an important opportunity to improve the overall quality of life as well as the intelligence and competitiveness of cities. [20]. Gruber et al. used a binary logit model to study dispatchers’ willingness to use electric cargo bikes. The study found that electric range, purchase price, and publicly available information on electric cargo bikes significantly impacted dispatchers’ willingness to use electric cargo bikes [21]. Basing their work on the theory of planned behavior (TPB), Xiangqian and Jianping constructed a structural equation (SEM), conducted a questionnaire survey on potential consumers in Beijing, and analyzed the factors that affect consumers’ willingness to buy electric vehicles, demonstrating that attitude, perceived behavior control, cognitive status, product perception, and monetary incentive policy measures significantly positively affect consumers’ intentions to purchase electric vehicles [22]. At the level of policy intervention, the relevant transportation departments in various countries have formulated corresponding normative documents to promote the distribution of electric vehicles. FedEx launched a cargo bike pilot program in 2009 through Earth Smart initiative. In anticipation of the expansion of the bikeway network, a small fleet of electric-assisted bicycles were deployed in Paris. The electric-assisted cargo bikes had a capacity of 53 cubic feet (1.5 cubic meters), a speed of 12 mph (20 km/h), and a range of 25 miles (40 km) or 6 h. These bikes perform well both economically and environmentally [23].

2.3. Satisfaction Studies

Exploring the satisfaction of dispatchers can not only improve the last-mile distribution service quality and customer satisfaction, but also enable the development of reasonable policies based on the demands of dispatchers. Some scholars focus on studying customer satisfaction in different industries. For example, Shen et al. measured passenger satisfaction with the services provided by rail operating companies and established an evaluation index system including three levels to obtain satisfaction indices and quantify passenger satisfaction. The results indicated that perceived value and perceived quality have the greatest direct impact on passenger satisfaction [24]. Zhang et al. proposed a public-transportation passenger-satisfaction evaluation method based on Partial Least Squares (PLS) and Structural Equation Model (SEM). The results demonstrated that there is a significant positive correlation between passenger expectations, passenger perceived value, passenger loyalty, and passenger satisfaction [25]. Farooq et al. collected data from 460 respondents by using self-administered questionnaires. Moreover, the variance-based structural equation model (PLS-SEM) was constructed to evaluate the quality of services offered by Malaysia Airlines and customer satisfaction. Findings of this research revealed that service quality provided airlines, especially personnel service and image positively influence customer satisfaction [26]. Zhou and Zhang conducted a satisfaction survey of customers using OFO bike-sharing services in Ningbo, China, and established a Service-satisfaction-loyalty model based on structural equation model (SEM). Results showed that perceived service quality of bicycles has a significant impact on customer satisfaction [27]. Zhen and Tang proposed multiple regression and importance-performance analysis to determine the impact factors for the Shanghai-Nanjing high-speed rail. The results showed that the most important factors related to passenger satisfaction were employee attitudes, ease of ticket purchase and convenience of access travel [28]. Duy Quy et al. proposed partial least squares structural equation modeling (PLS-SEM) approach to understand the complexity of factors affecting passenger satisfaction and loyalty of ride hailing services. The results revealed that perceived benefits, perceived promotions, and perceived service quality of booking app directly affect passenger satisfaction and loyalty [29].

2.4. Summary

As is evident from the above review of previous studies on use of tricycles and cargo bikes for last-mile services, scholars targeting last-mile distribution services mainly focus on the solution of the overall delivery system, the competitiveness between electric tricycles and cargo vans, and the energy saving effect of tricycles. With regard to the research on satisfaction, previous research mostly explored from the customer perspective and lacked research on dispatchers’ satisfaction with the use of electric tricycles in the last-mile distribution process. Furthermore, the use of urban transportation carriers is greatly influenced by transportation policies, and the passenger satisfaction evaluation system of other industries cannot effectively reflect dispatchers’ satisfaction with the use of electric tricycles in urban last-mile distribution. To complete the gap, the factors influencing the dispatchers’ satisfaction under the policy intervention are investigated. The structural equation model is constructed to quantitatively analyze the influence of various factors on the dispatchers’ satisfaction. Exploring this current research topic can not only make up for the deficiencies of existing research, but also has significant implications for the improvement of policies related to electric tricycles, which in turn will promote the promotion and application of electric tricycles in the logistics industry.

3. Data Collection

A questionnaire survey was conducted in Nanjing from 1 April 2021 to 30 April 2021, using electric tricycle logistics dispatchers as the research object. The questionnaire includes four parts: individual attributes of logistics dispatchers, problems of electric tricycles under the current policy, advantages of electric tricycle distribution, and satisfaction. The results are shown in Table 1 below. The study sorted dispatchers according to certain attributes, such as gender, age, education level, monthly income, and time engaged in delivery, and there is a precedent of using these attributes in [29,30,31]. The problems associated with electric tricycles under the current policy include 12 topics from A1–A12, which are confirmed in [8,18,32,33,34,35]. The advantages of electric tricycle distribution contain 6 topics from C1–C6, which are tested in [8,18,36,37,38,39]. The questionnaire on the factors influencing satisfaction was measured by using the classic Likert five-point scale. The Likert five-point scale also captures the relationships in SEM [40,41,42]. 1 = very important, 2 = important, 3 = average, 4 = unimportant, and 5 = very unimportant. A total of 204 valid data were obtained by eliminating missing and abnormal samples. Table 2 shows summary statistics for each question from 204 dispatchers, including maximum, minimum, mean, and standard deviation.
The composition of individual attributes of the samples is shown in Table 3, in which the proportions of male and female logistics dispatchers are 84.31% and 15.69%, respectively, indicating that logistics dispatchers are mainly male; ages are mostly distributed between 23~35 years old; the education of the logistics dispatchers is mostly concentrated in middle school and high school; the average income is mostly distributed between 4500~6000; most of the logistics dispatchers are engaged in express delivery for 3 to 12 months. The data shows that most of the logistics dispatchers are mainly young men with medium education, and they tend to work as dispatchers for a relatively short time, because the last-mile logistics dispatch work has the characteristics of solitary, labor-intensive, etc.

4. Data Analysis

Since no substantive theoretical model of dispatchers’ satisfaction exists in the current literature, exploratory factor analysis (EFA) is used to obtain an empirical factor model, thereby obtaining the main part of the structural equation [43]. KMO and Bartlett sphericity test are used to judge whether the data are suitable for factor analysis. Generally, the value of KMO reaches 0.6 to meet the conditions for continuing to do exploratory factor analysis [44]. The closer the value of KMO is to 1, the higher the correlation of variables, and the more suitable for exploratory factor analysis [45].
This study mainly used principal component factor analysis and orthogonal rotation method to conduct exploratory factor analysis on 18 measurement variables. The KMO = 0.821 (>0.6) and Bartlett’s spherical test showed p < 0.05, and the results were statistically significant, indicating that the obtained data were suitable for factor analysis. In order to ensure that the MSA values of the anti-image matrix are greater than 0.5, the common degree of each measurement variable is greater than 0.4, and the loading coefficient is greater than 0.5 [46]. Four measured variables (A7, A9, C3, and C5) were removed by multiple manipulations and comparisons in SPSS.
Principal component factor analysis and orthogonal rotation were performed again on the remaining 14 measured variables, and the results showed that KMO = 0.837 (>0.6), Bartlett’s sphericity test significance p < 0.05. Factor analysis gravel plot is shown in Figure 1, indicating that four principal components could be extracted and the cumulative variance contribution was 58.93% (cumulative variance contribution greater than 50% meets the requirement [45,47]).
The names of the four latent variables and the loading coefficients of each item are shown in 
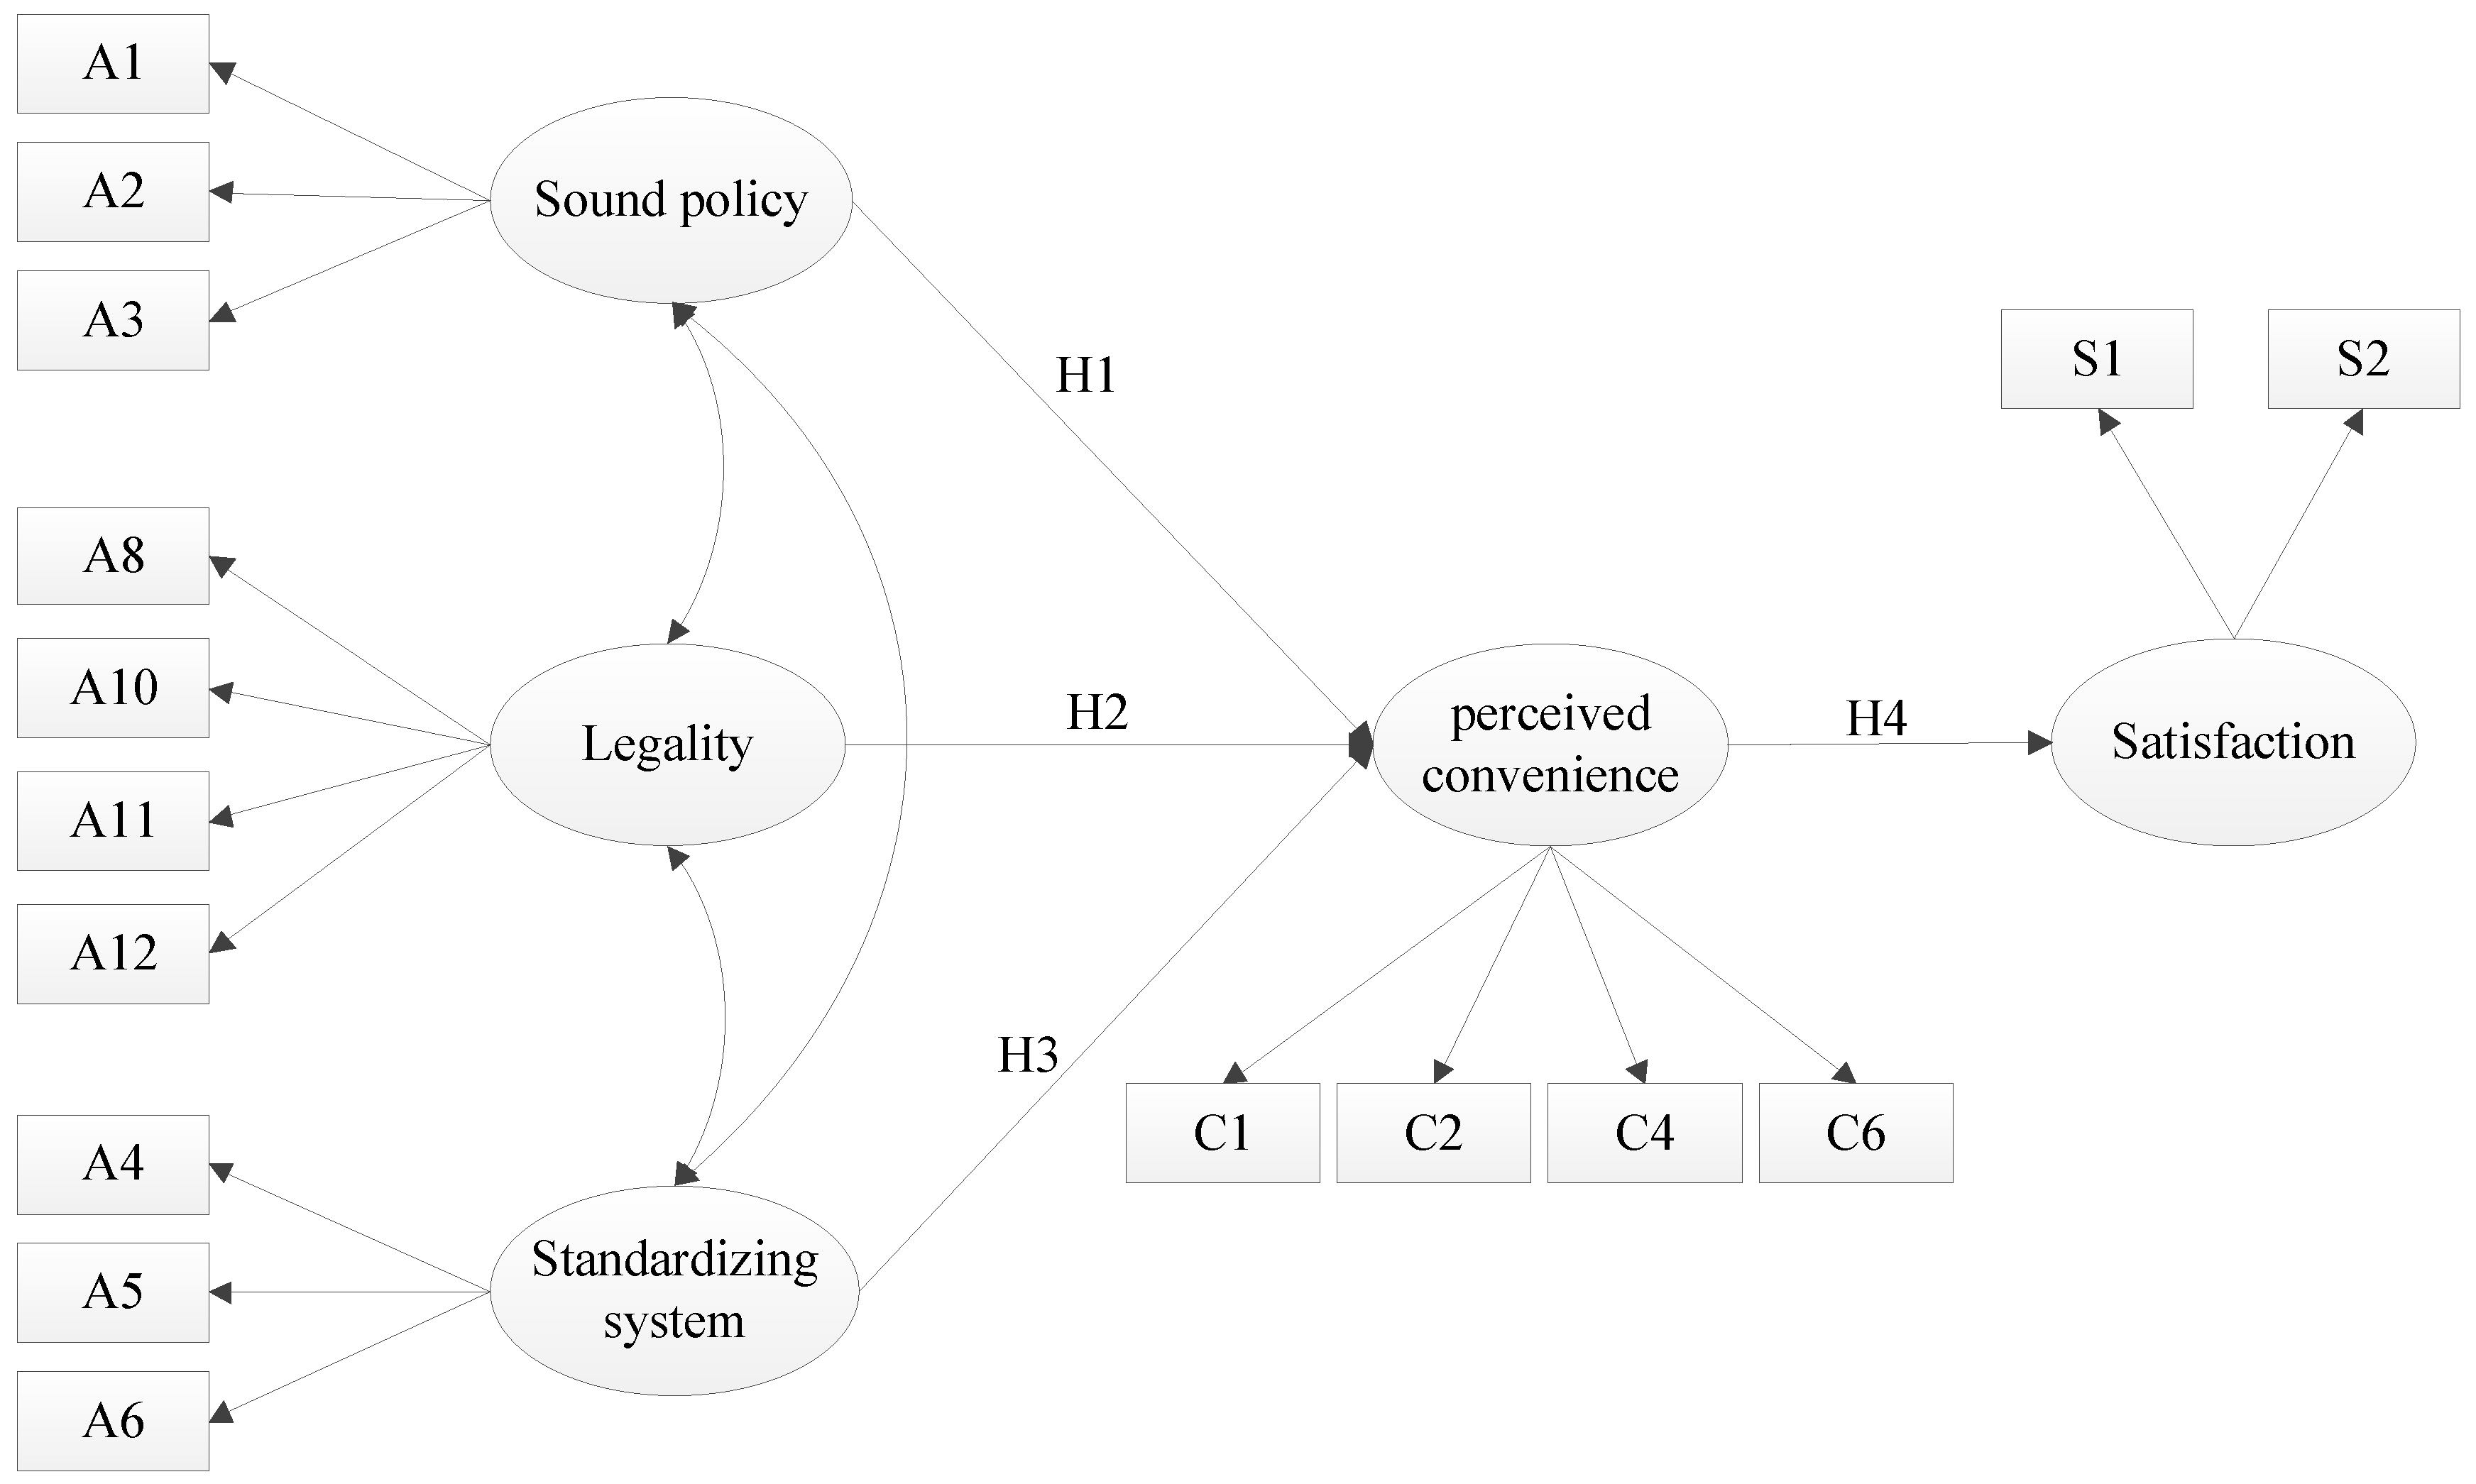
Table 4. Latent variable 1 contains classification/sub-regional management, traffic safety management, and subsidy policy, respectively. Currently, electric tricycles are not managed by sub-regions, which leads to the disorderly development of electric tricycles. The related traffic safety management policy is not perfect, and the subsidy is insufficient. These measured variables all point to the urgent need for better policies for dispatchers. Therefore, latent variable 1 is named sound policy, Cronbach’s α coefficient is 0.801, the eigenvalue is 2.768, and the explanation contribution rate is 17.30%. Latent variable 2 contains improving traffic regulations, solving for legal transport on the road, improving the design of delivery vehicles, and establishing quality standards, respectively, as current policies specify the specifications of electric tricycles, such as speed, vehicle height, width, and load capacity. Electric tricycles that do not meet the policy requirements cannot perform last-mile distribution services. Therefore, improving the design of delivery vehicles, establishing quality standards, solving for legal transport on the road, and improving traffic regulations are all aimed at giving electric tricycles a legal status. Therefore, latent variable 2 is named legality, the Cronbach’s α coefficient is 0.759, the eigenvalue is 2.738, and the explanation contribution rate is 17.11%. Latent variable 3 contains higher flexible access roads, low carbon and environmental protection, no driving qualification requirement, and low cost of purchasing the electric tricycle, respectively. These variables all respond to the convenience of electric tricycles. Therefore, latent variable 3 is named as a perceived convenience, Cronbach’s alpha coefficient is 0.726, the eigenvalue is 2563, and the explanation contribution rate is 16.02%. Latent variable 4 contains the regulating of the license plate system, the regulating the driver’s license system, and the strengthening safety education, respectively. All four variables reflect the current policy requirements for the standardizing system. Therefore, latent variable 4 is named standardizing system, Cronbach’s alpha coefficient is 0.774, the eigenvalue is 1.359, and the explanation contribution rate is 8.496%.

5. Model Building

In order to accurately portray the factors influencing the dispatchers’ satisfaction, a structural equation model was chosen to carry out the study of the relationship between the variables.

5.1. Structural Equation Modeling

Structural Equation Modeling (SEM) is a statistical method to analyze the relationship between variables based on the covariance matrix of variables, including measurement models and structural models [48,49,50]. Structural equation modeling, although simple, is effective in dealing with other influence factor studies and satisfaction studies [29,51,52]. As a statistical method for analyzing the relationship between variables, the structural equation modeling (SEM) can deal with the complex relationship between various variables and has been widely used in satisfaction analysis in several industries, such as passenger satisfaction in transportation modes of rail transit [24], public transit [25], high-speed rail [53], and airlines [26]. Endogenous variables refer to the variables to be determined by the structural equation model. Endogenous variables can be accounted for within the model system, and exogenous variables themselves cannot be accounted for in the model system. Some literature suggest that the current situation also appears in endogenous variables, and the future situation appears in the exogenous variables [24,25,26].
The structural model mainly describes the relationship between the latent variables, and the mathematical expression is as follows:
η = B η + Γ ξ + ζ
where
  • η = m × 1 vector of the endogenous latent variables
  • ξ = n × 1 vector of the exogenous latent variables
  • B = m × m matrix of the path coefficients associated with η
  • Γ = m × n matrix of the path coefficients associated with ξ and η
  • ζ = m × 1 vector of error terms associated with the endogenous variables.
The measurement model represents the relationship between manifest variables on latent variables, and the mathematical expression are as follows:
x = Λ x ξ + δ
y = Λ y η + ε
where
  • x = column q vector related to the exogenous manifest variables
  • Λ x = q × n structural loading coefficient matrix for the effects of the exogenous manifest variables on exogenous latent variables
  • y = column q vector related to the endogenous manifest variables
  • Λ y = p × m structural loading coefficient matrix for the effects of the endogenous manifest variables on endogenous latent variables
  • δ = column q vector related to the exogenous manifest errors
  • ε = column q vector related to the endogenous manifest errors

5.2. Model Hypothesis

According to the results from the SPSS factor analysis, this study makes the following hypotheses about the relationship between sound policy, legality, perceived convenience, standardizing system, and satisfaction:
In previous studies, the relationship between policy and perceived value has long been explored in different fields. Policy is one of the factors that influence customers’ behavior in choosing a brand [54]. Preferential pricing policies lead to higher perceived value of customers in terms of marketing efficiency [55]. In addition, fiscal policy enhances the impact of perceived value on customers’ purchase intentions [56]. Based on the above discussion, the following hypothesis of sound policy and perceived convenience is proposed:
Hypothesis 1 (H1).
Sound policy has a positive and significant direct effect on the perceived convenience of electric tricycles.
The relationship between legitimacy and perceived value is also tested, and Yang argues that the legality of mobile transactions contributes to the perceived value of consumers [57]. Therefore, the following hypothesis about legality and perceived convenience is proposed:
Hypothesis 2 (H2).
Legality has a positive and significant direct effect on the perceived convenience of electric tricycles.
Hypothesis 3 (H3).
Standardizing system has a positive and significant direct effect on the perceived convenience of electric tricycles.
The relationship between perceived value and satisfaction has been widely studied. Chen concluded that perceived value has a significant positive effect on airline passenger satisfaction [58]. Jen concluded that perceived value is the most important influencing factor on passengers’ behavioral intentions and passenger satisfaction [59]. Andreas used structural equation modeling to confirm that perceived value has a greater impact on customer satisfaction than perceived quality [60]. Based on the above literature, the following hypothesis of this study is established.
Hypothesis 4 (H4).
Perceived convenience of electric tricycles has a positive and significant direct effect on the satisfaction.
The modeling of the satisfaction structure equation of the electric tricycle dispatchers is shown in Figure 2.

6. Analysis

The study used AMOS software to establish a structural equation model of dispatcher’ satisfaction, input data on the influencing variables into the model, and perform fit calculations and tests.

6.1. Model Fit Test

The model is established by AMOS and the path fitting calculation and test are performed on all sample data, and Chi-squared degrees of freedom ratio (χ2/df), Comparative Fit Index (CFI), Increased Fit Index (IFI), Comparative Fit Index (CFI), Parsimony Comparative Fit Index (PCFI), Parsimony Baseline Fit Index (PNFI), and Root Mean Square of Approximation Error (RMSEA) are selected for model fit test [61,62,63]. The final model fit index is shown in Table 5, which shows that the model fit meets the requirements.

6.2. Discussion of Model
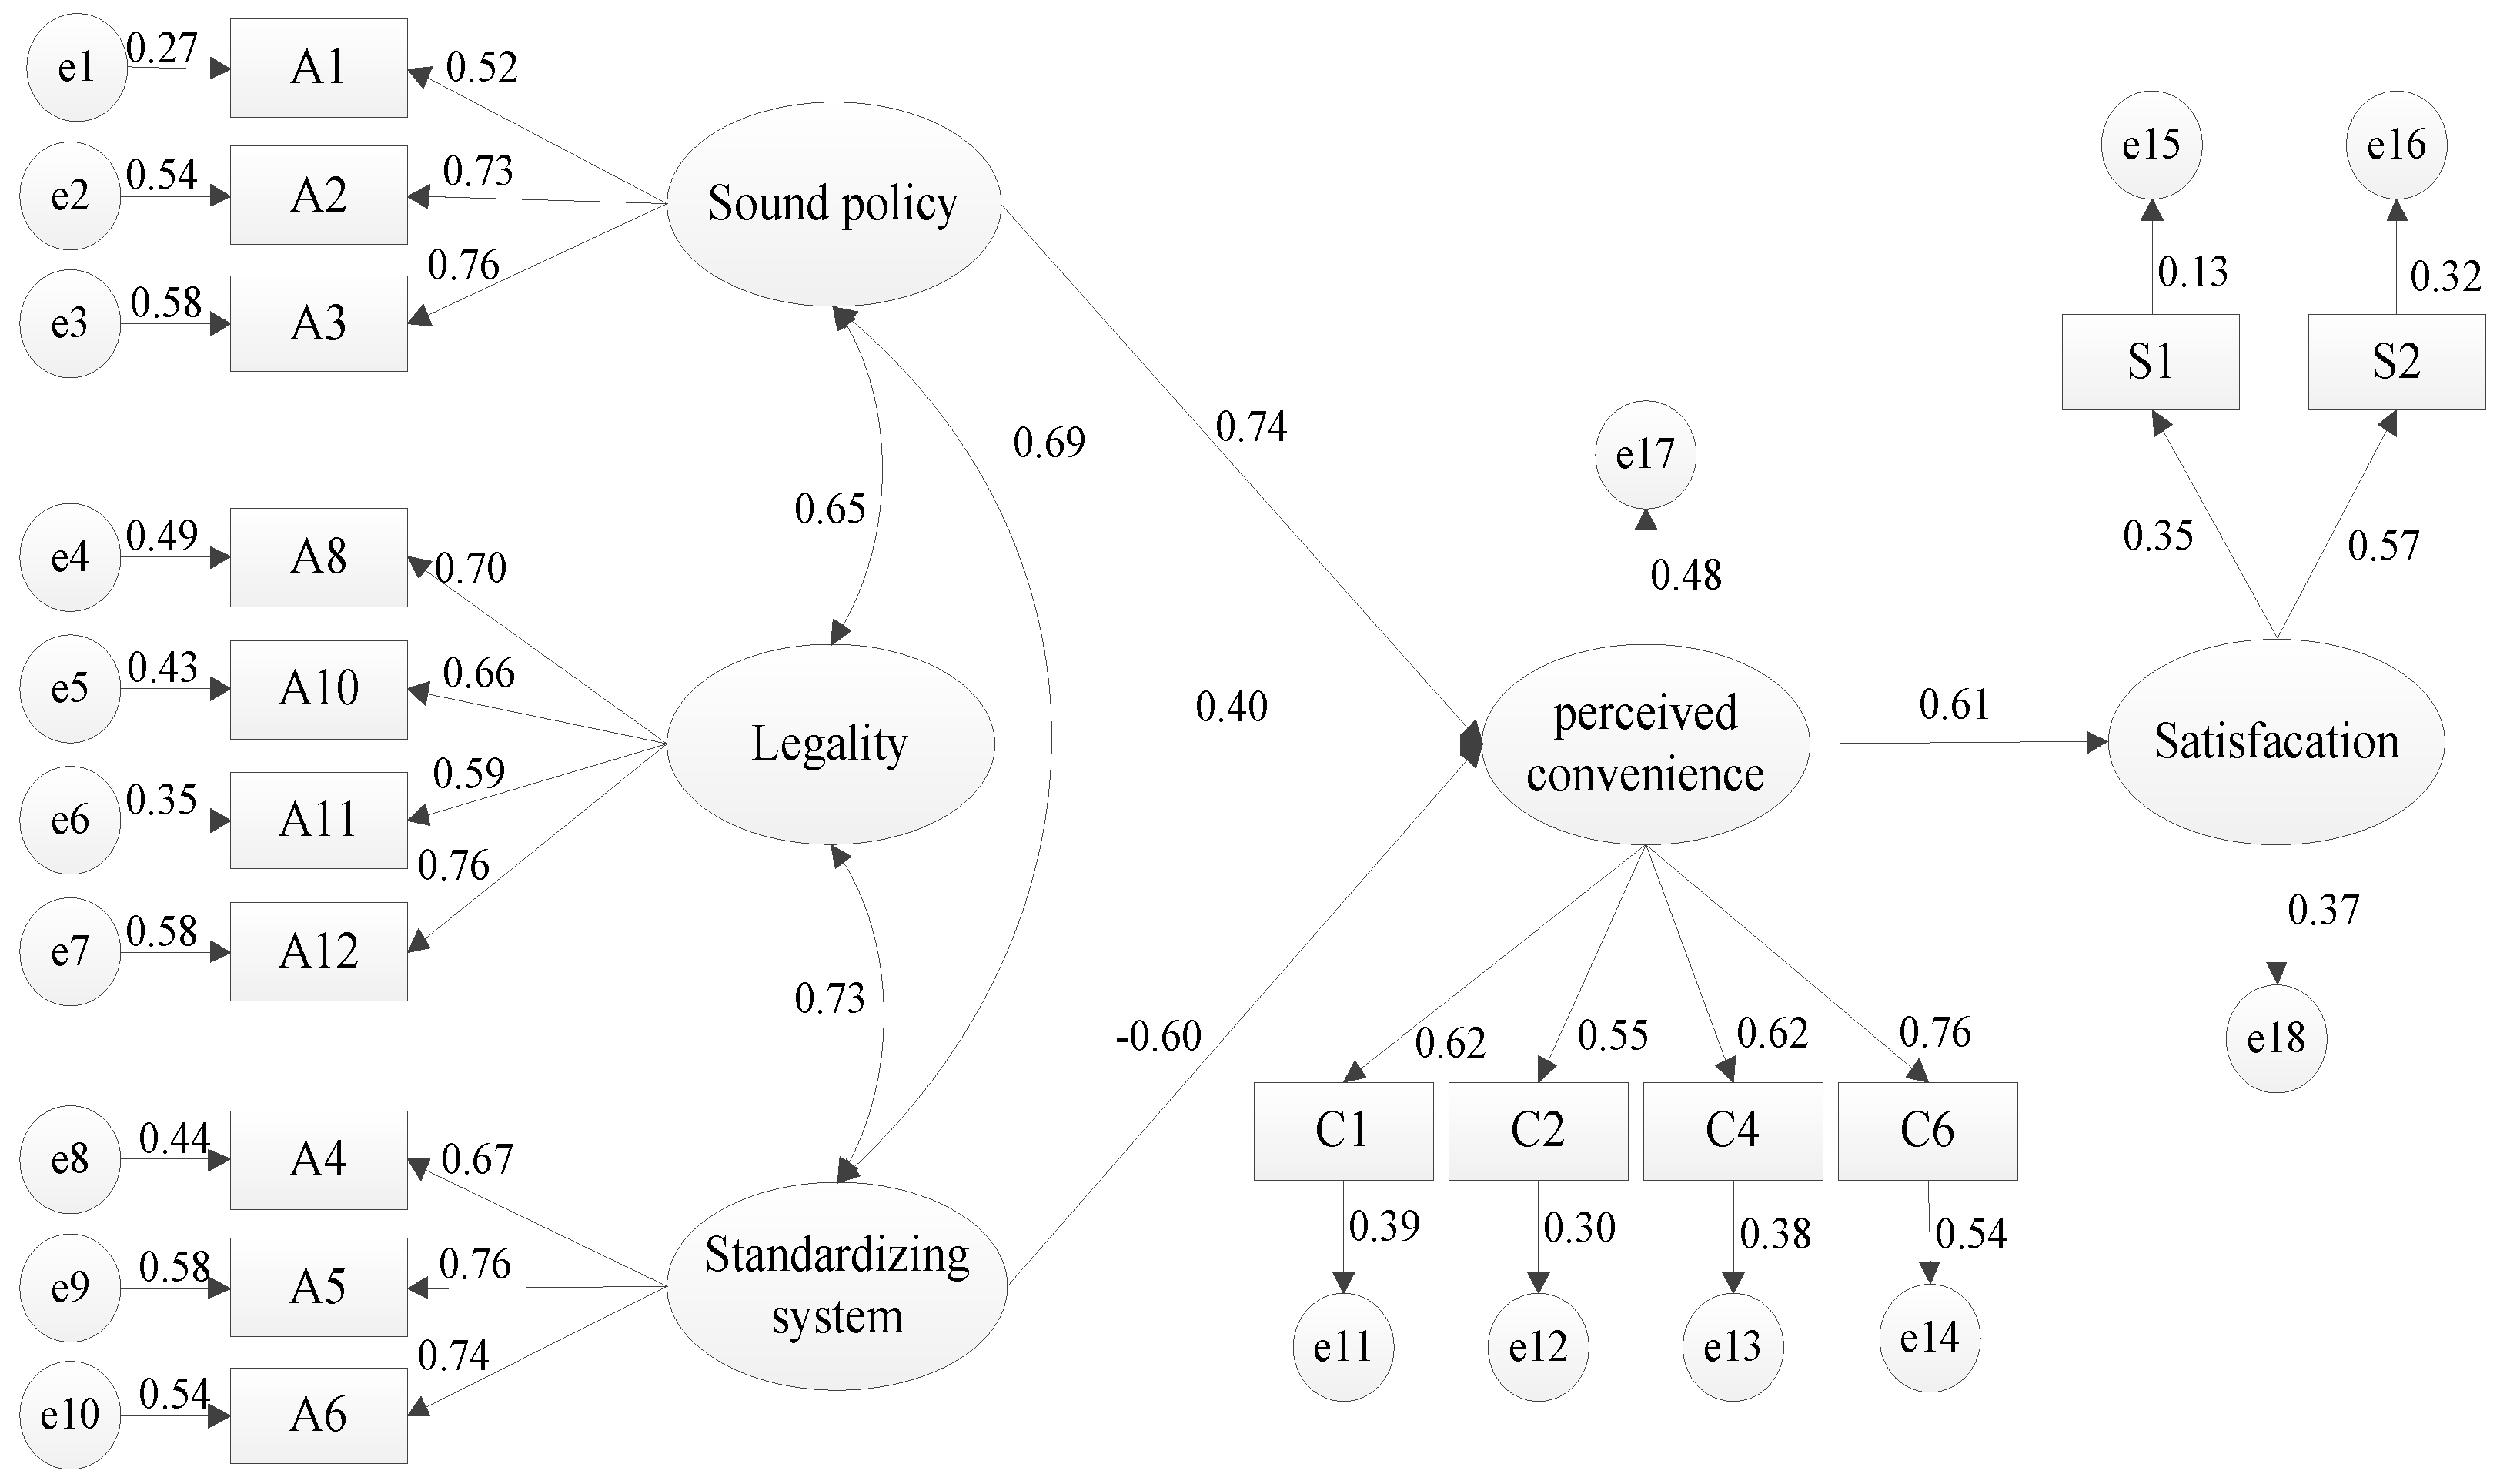
It can be seen from Figure 3 that the path coefficient between sound policy and perceived convenience is 0.74, indicating that there is a significant positive correlation between sound policy and perceived convenience. That is, sound policy leads to higher perceived convenience for logistics dispatchers. The more perfect the electric tricycle policy is, the easier it will be to induce a higher level of perceived convenience for logistics dispatchers. Hypothesis 1 is true. Among the three manifest variables of sound policies, the loading coefficient of classification/Sub-regional management is 0.52, the loading coefficient of traffic safety management is 0.73, and the loading coefficient of subsidy policy is 0.76. It can be shown that the subsidy policy has a greater impact on the sound policy, followed by traffic safety management. Li and Wang also concluded that the subsidy policy has a significant impact on consumers’ purchase of new energy vehicles, which in turn affects consumers’ satisfaction with new energy vehicles [64,65]. It indicates that the logistics dispatchers pay more attention to the subsidy policy and traffic safety management policy of electric tricycles in terms of the policy. On the one hand, the current subsidy policy for electric tricycles is insufficient because the subsidy policy can relieve the financial pressure on dispatchers and express companies and increase the income of dispatchers. On the other hand, it shows that there is currently a lack of policies for the traffic safety management of electric tricycles to ensure the safety of logistics dispatchers during the delivery process and the orderly delivery service of electric tricycles [66].
The path coefficient between legality and perceived convenience is 0.40, and the path coefficient is relatively high, indicating that legality has a positive and significant direct influence on the perceived convenience. That is, the legality makes the logistics dispatchers generate higher perceived convenience. Hypothesis 2 is true. Among the four manifest variables of legality, the loading coefficient of improving traffic regulations is 0.70, the loading coefficient of solving for legal transport on the road is 0.66, the loading coefficient of improving the design of electric tricycles is 0.59, and the loading coefficient of establishing quality standards is 0.76. It can be demonstrated that the loading coefficients of establishing quality standards and improving traffic regulations are more than 0.7. It reveals that the logistics dispatchers are more concerned about the current quality standards of electric tricycles and improve the traffic regulations of electric tricycles. On the one hand, determining the quality standards of electric tricycles is beneficial for logistics dispatchers to clarify the distribution specifications; on the other hand, improving the traffic regulations of electric tricycles to determine the legal status of electric tricycles for last-mile distribution.
The path coefficient between the standardizing system and the perceived convenience of electric tricycles is −0.60, indicating that there is a significant negative correlation between the standardizing system and the perceived convenience. The standardizing system reduces the perceived convenience level of logistics dispatchers when the electric tricycle system is more regulated. Hypothesis 3 is not true. Among the three manifest variables of the standardizing system, the loading coefficient of regulating the license plate system is 0.67, the loading coefficient of regulation of the driver’s license system is 0.76, and the loading coefficient of strengthening safety education is 0.74, which shows that regulation of the driver’s license system has the greatest impact on the standardizing system, followed by strengthening safety education. This is different from the results obtained by Zhang [8], who found that most drivers believe that an electric tricycle driver’s license is needed to prevent traffic accidents and thus improve driver satisfaction. However, the result demonstrates that the regulation of the driver’s license system and the strengthening of safety education limit the last-mile distribution service of dispatcher to a greater extent. On the one hand, regulating the driver’s license system brings additional time and money cost to logistics dispatchers; on the other hand, strengthening safety education also brings additional time cost to logistics dispatchers. Therefore, regulating the driver’s license system and strengthening safety education may cause logistics dispatchers to leave the last-mile delivery market, while discouraging potential logistics dispatchers from entering the last-mile distribution market.
The path coefficient between perceived convenience and logistics dispatcher satisfaction is 0.61, indicating that there is a significant positive correlation between perceived convenience and satisfaction, and perceived convenience contribute to higher satisfaction for logistics dispatchers. Hypothesis 4 is true. Among the four manifest variables of perceived convenience, the loading coefficient of higher flexible access roads is 0.62, the loading coefficient of low carbon and environmental protection is 0.55, the loading coefficient of no driving qualification requirement is 0.62, and the loading coefficient of low cost of purchasing the electric tricycle is 0.74. It can be seen that the low cost of purchasing the electric tricycle has the greatest impact on perceived convenience, followed by no driving qualification requirement and higher flexible access roads. It declares that logistics dispatchers pay more attention to the cost of electric tricycles. Huang X found that the cost of new energy vehicles and monetary incentives can increase consumers’ willingness to buy [22]. The finding is also in line with the current new policies for electric tricycles. The new policy increases the cost of electric tricycles, restricts the development of electric tricycles, and increases the operating cost to the express industry. In addition, no driving qualification requirement allows the dispatcher to quickly engage in last-mile distribution services, which can promote a potential dispatcher to engage in last-mile distribution services. In addition, electric tricycles can flexibly enter and exit the road, the distribution in high-density residential and commercial areas is more flexible, thereby improving the distribution efficiency of dispatchers [16,19].
Among the two manifest variables of satisfaction, the loading coefficient of dispatcher satisfaction is 0.35, and the loading coefficient of improving customer satisfaction is 0.57, which shows that the satisfaction of logistics customers has a great influence on the dispatchers’ satisfaction. These findings are similar to Süleyman and Joseph [67,68]. It testifies that distribution dispatchers are more concerned about the satisfaction of logistics customers because the satisfaction of logistics customers directly affects the income of logistics dispatchers.
The effect of each latent variable on the dispatchers’ satisfaction is shown in Table 6. Among them, sound policy (0.448) and legality (0.242) have an indirect positive effect on satisfaction, while the standardizing system (−0.366) has an indirect negative impact on satisfaction. It demonstrates that sound policy and legality can increase the satisfaction of electric-tricycle dispatchers, while the standardizing system decreases the satisfaction of dispatchers, showing that the current logistics dispatchers urgently need to introduce a reasonable electric tricycle policy as well as to make electric tricycles have the legal authority to carry out distribution services under the new policy. In addition, the strict system for electric tricycles affects the distribution service of the distribution dispatcher.

6.3. Policy Recommendations

With the rapid development of the logistics industry, the trend of using electric tricycles instead of traditional distribution vans for last-mile distribution services is becoming more and more obvious. However, traffic problems caused by the uncontrolled growth of electric tricycles and policy interventions can hinder the use of electric tricycles by dispatchers. Therefore, understanding satisfaction factors of dispatchers under policy interventions allows them to make full use of the electric tricycles’ advantages.
As shown in the structural equation for satisfaction, improving perceived convenience is a key factor influencing dispatchers’ satisfaction, and it was also found that the low cost of purchasing the electric tricycle and no driving qualification requirement had the greatest impact on perceived convenience. In addition, sound policy likewise increases the dispatchers’ satisfaction, with subsidy policy having the greatest impact on sound policy. Therefore, a subsidy policy for the purchase and use of electric tricycles needs to be established. On the one hand, compared with traditional diesel-powered vans, low-cost electric tricycles are more popular among dispatchers, and electric tricycles have the characteristics of low-carbon emissions and environmental protection, and their application in urban distribution systems can effectively alleviate energy pressure and reduce environmental pollution. On the other hand, adequate subsidies are conducive to pushing electric tricycle manufacturers to invest more in research and development costs. These subsidies have a positive impact on the promotion of clean energy vehicles, and they lay the foundation for the implementation of other related policies.
In addition, this study finds that a standardizing system reduces the satisfaction of dispatchers, with the regulation of the driver’s license system being the greatest impact of the standardizing system. With the intervention of the policy, the government implementing the policy sets the standards for dispatchers to use electric tricycles for last-mile distribution services. The standards require dispatchers to obtain an electric tricycle driver’s license and purchase electric tricycle insurance before they can engage in distribution services, and the number of electric tricycle licenses is limited. Most dispatchers are forced to leave the last-mile delivery market. Therefore, it is necessary to lower the standard using electric tricycles. On the one hand, compared with traditional diesel-powered vans, electric tricycles are easy to maneuver and take up little road area. Therefore, the standard of using electric tricycles should be lowered, and it is important to improve the number of electric tricycle licenses for express delivery. On the other hand, the reduced standard of using electric tricycles help attract potential dispatchers to enter the distribution market and can improve the efficiency of last-mile distribution services.
Improving traffic regulations for electric tricycles gives them legal status in last-mile delivery services and protects the legal rights of dispatchers. Currently, policies specifically designed for electric tricycles and drivers are experiencing difficulties in implementation, which affects overall distribution efficiency and leads to customer dissatisfaction with distribution services. Therefore, the policies introduced should be clearly articulated and explained, and the requirements and scenarios for using electric tricycles should be clearly defined to avoid misunderstandings between dispatchers and customers.

7. Conclusions

This study explores the factors influencing satisfaction from the perspective of the dispatchers, which has not been well explained in the traffic behavior literature. A structural equation model with sound policy, legality, standardizing system, perceived convenience, and satisfaction as latent variables was constructed based on questionnaire data of 204 electric tricycle dispatchers under policy intervention in Nanjing. The results are as follows: The correlation coefficients between the perceived convenience, sound policy, legality and the dispatchers’ satisfaction is 0.606, 0.448 and 0.242, respectively. However, the correlation coefficients between the standardizing system and the dispatchers’ satisfaction is −0.366. In addition, the results of this study can help policy makers and enterprises better understand the precise needs of dispatchers for electric tricycles, provide support for formulating and improving policies, and promote the widespread application of electric tricycles in last-mile logistics services. For dispatchers, appropriate subsidy policies, lower standards for the use of electric tricycles, and improved traffic regulations can go a long way in improving their own satisfaction.
Some limitations that provide research directions for future research exist in this study. First, the current study was conducted only in Nanjing, where electric tricycle policy was introduced. Therefore, the generalizability of the findings to other cities is limited. It is recommended to explore the similarities and differences among cities, especially those that have implemented electric tricycle policies. Second, in addition to policy interventions that affect the dispatchers’ satisfaction of electric tricycle, they are also affected by the vehicle’s own characteristics (cruising range, speed limit, load capacity), weather conditions, and road conditions. In the next study, these factors should be taken into account alongside the dispatchers’ satisfaction levels, which will further reveal the demand for electric tricycle standards by dispatchers under the policy intervention. Third, while the satisfaction of dispatchers was studied, the opinions of other participants also needed to be considered. Therefore, future research should consider exploring the dispatchers’ satisfaction from the perspective of customers, stakeholders, and so on, and then more comprehensively elaborate the dispatchers’ satisfaction under policy interventions. Finally, the SEM did not test the moderating effects of the attribute characteristics of the respondents in this study (gender, age, income, and education) on the relationship between the variables and satisfaction. These effects could be explored in future studies with the help of multicohort analysis in PLS.

Author Contributions

J.X. and X.L.: Formal analysis, Data curation, Writing—original draft. M.D.: Formal analysis, Data curation, Writing-original draft, Writing—review & editing. Y.P.: Writing-review & editing. All authors have read and agreed to the published version of the manuscript.

Funding

This work was supported by Scientific Research Startup Fund for Advanced Talents of Nanjing Forestry University (No. 163106065), Industry-university Collaboration and Collaborative Education Project (No. 202102136046), and Supply-demand Connection and Employment Education Project (No. 20220102887).

Acknowledgments

We are grateful for valuable suggestions from the editor, anonymous reviewers and our colleagues, feedback that ultimately improved the article.

Conflicts of Interest

The authors declare no conflict of interest.

References

  1. Statistical Bulletin on National Economic and Social Development of the People’s Republic of China for 2021. Available online: http://www.stats.gov.cn/xxgk/sjfb/zxfb2020/202202/t20220228_1827971.html (accessed on 28 February 2021).
  2. The State Post Bureau Announces the Operation of the Postal Industry in 2021. Available online: http://www.spb.gov.cn/gjyzj/c100276/202201/74c80cf2fd7b44c3aa5d6facb464bcb8.shtml (accessed on 14 January 2022).
  3. Cleophas, C.; Cottrill, C.; Ehmke, J.F.; Tierney, K. Collaborative urban transportation: Recent advances in theory and practice. Eur. J. Oper. Res. 2019, 273, 801–816. [Google Scholar] [CrossRef]
  4. Janjevic, M.; Winkenbach, M. Characterizing urban last-mile distribution strategies in mature and emerging e-commerce markets. Transp. Res. A-Policy 2020, 133, 164–196. [Google Scholar] [CrossRef]
  5. Esper, T.L.; Jensen, T.D.; Turnipseed, F.L.; Burton, S. The last mile: An examination of effects of online retail delivery strategies on consumers. J. Bus. Logist. 2003, 24, 177–203. [Google Scholar] [CrossRef]
  6. Gevaers, R.; Van de Voorde, E.; Vanelslander, T. Characteristics and typology of last-mile logistics from an innovation perspective in an urban context. In City Distribution and Urban Freight Transport; Edward Elgar Publishing: Cheltenham, UK, 2011. [Google Scholar]
  7. Serrano-Hernandez, A.; Ballano, A.; Faulin, J. Selecting Freight Transportation Modes in Last-Mile Urban Distribution in Pamplona (Spain): An Option for Drone Delivery in Smart Cities. Energies 2021, 14, 4748. [Google Scholar] [CrossRef]
  8. Zhang, Y.; Chen, J.; Li, X.; Zhong, M. Exploring logistics dispatcher’s preference in electric tricycle related policies: The case of China. J. Clean. Prod. 2019, 230, 835–843. [Google Scholar] [CrossRef]
  9. Saenz-Esteruelas, J.; Figliozzi, M.; Serrano, A.; Faulin, J. Electrifying last-mile deliveries: A carbon footprint comparison between internal combustion engine and electric vehicles. In Proceedings of the International Conference on Smart Cities, Paris, France, 18–19 July 2016; pp. 76–84. [Google Scholar]
  10. Navarro, C.; Roca-Riu, M.; Furió, S.; Estrada, M. Designing new models for energy efficiency in urban freight transport for smart cities and its application to the Spanish case. Transp. Res. Procedia 2016, 12, 314–324. [Google Scholar] [CrossRef] [Green Version]
  11. Figliozzi, M.; Saenz, J.; Faulin, J. Minimization of urban freight distribution lifecycle CO2e emissions: Results from an optimization model and a real-world case study. Transp. Policy 2020, 86, 60–68. [Google Scholar] [CrossRef]
  12. Saenz, J.; Figliozzi, M.; Faulin, J. Assessment of the carbon footprint reductions of tricycle logistics services. Transp. Res. Rec. 2016, 2570, 48–56. [Google Scholar] [CrossRef] [Green Version]
  13. Leonardi, J.; Browne, M.; Allen, J. Before-after assessment of a logistics trial with clean urban freight vehicles: A case study in London. Procedia-Soc. Behav. Sci. 2012, 39, 146–157. [Google Scholar] [CrossRef] [Green Version]
  14. Bi, K.; Yang, M.; Zhou, X.; Zahid, L.; Zhu, Y.; Sun, Z. Reducing carbon emissions from collaborative distribution: A case study of urban express in China. Environ. Sci. Pollut. Res. 2020, 27, 16215–16230. [Google Scholar] [CrossRef]
  15. De Mello Bandeira, R.A.; Goes, G.V.; Gonçalves, D.N.S.; de Almeida, D.A.M.; de Oliveira, C.M. Electric vehicles in the last mile of urban freight transportation: A sustainability assessment of postal deliveries in Rio de Janeiro-Brazil. Transp. Res. D-Transp. Environ. 2019, 67, 491–502. [Google Scholar] [CrossRef]
  16. Tipagornwong, C.; Figliozzi, M. Analysis of competitiveness of freight tricycle delivery services in urban areas. Transp. Res. Rec. 2014, 2410, 76–84. [Google Scholar] [CrossRef] [Green Version]
  17. Marujo, L.G.; Goes, G.V.; D’Agosto, M.A.; Ferreira, A.F.; Winkenbach, M.; Bandeira, R.A. Assessing the sustainability of mobile depots: The case of urban freight distribution in Rio de Janeiro. Transp. Res. D-Transp. Environ. 2018, 62, 256–267. [Google Scholar] [CrossRef]
  18. Melo, S.; Baptista, P. Evaluating the impacts of using cargo cycles on urban logistics: Integrating traffic, environmental and operational boundaries. Eur. Transp. Res. Rev. 2017, 9, 30. [Google Scholar] [CrossRef] [Green Version]
  19. Sheth, M.; Butrina, P.; Goodchild, A.; McCormack, E. Measuring delivery route cost trade-offs between electric-assist cargo bicycles and delivery trucks in dense urban areas. Eur. Transp. Res. Rev. 2019, 11, 11. [Google Scholar] [CrossRef] [Green Version]
  20. Schliwa, G.; Armitage, R.; Aziz, S.; Evans, J.; Rhoades, J. Sustainable city logistics—Making cargo cycles viable for urban freight transport. Res. Transp. Bus. Manag. 2015, 15, 50–57. [Google Scholar] [CrossRef] [Green Version]
  21. Gruber, J.; Kihm, A.; Lenz, B. A new vehicle for urban freight? An ex-ante evaluation of electric cargo bikes in courier services. Res. Transp. Bus. Manag. 2014, 11, 53–62. [Google Scholar] [CrossRef] [Green Version]
  22. Huang, X.; Ge, J. Electric vehicle development in Beijing: An analysis of consumer purchase intention. J. Clean. Prod. 2019, 216, 361–372. [Google Scholar] [CrossRef]
  23. FedEx Express and Urban-Cab Join Forces for Ecological Deliveries. About FedEx. Available online: https://about.van.fedex.com/newsroom/fedex-express-and-urban-cab-join-forces-for-ecological-deliveries/ (accessed on 19 July 2017).
  24. Shen, W.; Xiao, W.; Wang, X. Passenger satisfaction evaluation model for Urban rail transit: A structural equation modeling based on partial least squares. Transp. Policy 2016, 46, 20–31. [Google Scholar] [CrossRef]
  25. Zhang, C.; Liu, Y.; Lu, W.; Xiao, G. Evaluating passenger satisfaction index based on PLS-SEM model: Evidence from Chinese public transport service. Transp. Res. A-Policy 2019, 120, 149–164. [Google Scholar] [CrossRef]
  26. Farooq, M.S.; Salam, M.; Fayolle, A.; Jaafar, N.; Ayupp, K. Impact of service quality on customer satisfaction in Malaysia airlines: A PLS-SEM approach. J. Air Transp. Manag. 2018, 67, 169–180. [Google Scholar] [CrossRef]
  27. Zhou, Z.; Zhang, Z. Customer satisfaction of bicycle sharing: Studying perceived service quality with SEM model. Int. J. Logist.-Res. Appl. 2019, 22, 437–448. [Google Scholar] [CrossRef]
  28. Zhen, F.; Cao, J.; Tang, J. Exploring correlates of passenger satisfaction and service improvement priorities of the Shanghai-Nanjing High Speed Rail. J. Transp. Land Use 2018, 11, 559–573. [Google Scholar] [CrossRef] [Green Version]
  29. Nguyen-Phuoc, D.Q.; Su, D.N.; Tran, P.T.K.; Le, D.-T.T.; Johnson, L.W. Factors influencing customer’s loyalty towards ride-hailing taxi services–A case study of Vietnam. Transp. Res. A-Policy 2020, 134, 96–112. [Google Scholar] [CrossRef]
  30. Li, X.; Du, M.; Zhang, Y.; Yang, J. Identifying the factors influencing the choice of different ride-hailing services in Shenzhen, China. Travel Behav. Soc. 2022, 29, 53–64. [Google Scholar] [CrossRef]
  31. Nguyen-Phuoc, D.Q.; Oviedo-Trespalacios, O.; Vo, N.S.; Le, P.T.; Van Nguyen, T. How does perceived risk affect passenger satisfaction and loyalty towards ride-sourcing services? Transp. Res. D-Transp. Environ. 2021, 97, 102921. [Google Scholar] [CrossRef]
  32. Broadbent, G.H.; Drozdzewski, D.; Metternicht, G. Electric vehicle adoption: An analysis of best practice and pitfalls for policy making from experiences of Europe and the US. Geogr. Compass 2018, 12, e12358. [Google Scholar] [CrossRef]
  33. Haustein, S.; Jensen, A.F.; Cherchi, E. Battery electric vehicle adoption in Denmark and Sweden: Recent changes, related factors and policy implications. Energy Policy 2021, 149, 112096. [Google Scholar] [CrossRef]
  34. Ijaz, M.; Zahid, M.; Jamal, A. A comparative study of machine learning classifiers for injury severity prediction of crashes involving three-wheeled motorized rickshaw. Accid. Anal. Prev. 2021, 154, 106094. [Google Scholar] [CrossRef]
  35. Lee, K.; Chae, J.; Kim, J. A courier service with electric bicycles in an Urban Area: The case in Seoul. Sustainability-Basel 2019, 11, 1255. [Google Scholar] [CrossRef] [Green Version]
  36. Fishman, E.; Washington, S.; Haworth, N. Barriers and facilitators to public bicycle scheme use: A qualitative approach. Transp. Res. F-Traffic 2012, 15, 686–698. [Google Scholar] [CrossRef] [Green Version]
  37. Leger, S.J.; Dean, J.L.; Edge, S.; Casello, J.M. “If I had a regular bicycle, I wouldn’t be out riding anymore”: Perspectives on the potential of e-bikes to support active living and independent mobility among older adults in Waterloo, Canada. Transp. Res. A-Policy 2019, 123, 240–254. [Google Scholar] [CrossRef]
  38. Lin, X.; Wells, P.; Sovacool, B.K. Benign mobility? Electric bicycles, sustainable transport consumption behaviour and socio-technical transitions in Nanjing, China. Transp. Res. A-Policy 2017, 103, 223–234. [Google Scholar] [CrossRef] [Green Version]
  39. Wang, Y.; Sun, S. Does large scale free-floating bike sharing really improve the sustainability of urban transportation? Empirical evidence from Beijing. Sustain. Cities Soc. 2022, 76, 103533. [Google Scholar] [CrossRef]
  40. Cheng, C.C.; Chiu, S.-I.; Hu, H.-Y.; Chang, Y.-Y. A study on exploring the relationship between customer satisfaction and loyalty in the fast food industry: With relationship inertia as a mediator. S. Afr. J. Bus. Manag. 2011, 5, 5118–5126. [Google Scholar]
  41. Kim, Y.; Wang, Q.; Roh, T. Do information and service quality affect perceived privacy protection, satisfaction, and loyalty? Evidence from a Chinese O2O-based mobile shopping application. Telemat. Inform. 2021, 56, 101483. [Google Scholar] [CrossRef]
  42. Vuong, B.; Tung, D.; Tushar, H.; Quan, T.; Giao, H. Determinates of factors influencing job satisfaction and organizational loyalty. Manag. Sci. Lett. 2021, 11, 203–212. [Google Scholar] [CrossRef]
  43. Al-Mahameed, F.J.; Qin, X.; Schneider, R.J.; Shaon, M.R.R. Analyzing pedestrian and bicyclist crashes at the corridor level: Structural equation modeling approach. Transp. Res. Rec. 2019, 2673, 308–318. [Google Scholar] [CrossRef]
  44. Schreiber, J.B.; Nora, A.; Stage, F.K.; Barlow, E.A.; King, J. Reporting structural equation modeling and confirmatory factor analysis results: A review. J. Educ. Res. 2006, 99, 323–338. [Google Scholar] [CrossRef]
  45. Kaiser, H.F. An index of factorial simplicity. Psychometrika 1974, 39, 31–36. [Google Scholar] [CrossRef]
  46. Garrido, M.; Hansen, S.K.; Yaari, R.; Hawlena, H. A model selection approach to structural equation modelling: A critical evaluation and a road map for ecologists. Methods Ecol. Evol. 2022, 13, 42–53. [Google Scholar] [CrossRef]
  47. Hair, J.F.; Black, W.; Babin, B.J.; Anderson, R.E. Multivariate Data Analysis: A Global Perspective, 7th ed.; Prentice Hall: Upper Saddle River, NJ, USA, 2009. [Google Scholar]
  48. Fan, X.; Thompson, B.; Wang, L. Effects of sample size, estimation methods, and model specification on structural equation modeling fit indexes. Struct. Equ. Model. 1999, 6, 56–83. [Google Scholar] [CrossRef]
  49. Gefen, D.; Straub, D.; Boudreau, M.-C. Structural equation modeling and regression: Guidelines for research practice. Commun. Assoc. Inf. Syst. 2000, 4, 7. [Google Scholar] [CrossRef] [Green Version]
  50. Lei, P.W.; Wu, Q. Introduction to structural equation modeling: Issues and practical considerations. Educ. Meas. Issues Pract. 2007, 26, 33–43. [Google Scholar] [CrossRef]
  51. Bo, X.; Skitmore, M.; Bo, X.; Masrom, M.A.; Ye, K.; Bridge, A. Examining the influence of participant performance factors on contractor satisfaction: A structural equation model. Int. J. Proj. Manag. 2014, 32, 482–491. [Google Scholar]
  52. Ramli, A.; Akasah, Z.A.; Masirin, M.I.M. Safety and health factors influencing performance of Malaysian low-cost housing: Structural Equation Modeling (SEM) approach. Procedia-Soc. Behav. Sci. 2014, 129, 475–482. [Google Scholar] [CrossRef] [Green Version]
  53. Chou, P.-F.; Lu, C.-S.; Chang, Y.-H. Effects of service quality and customer satisfaction on customer loyalty in high-speed rail services in Taiwan. Transp. A 2014, 10, 917–945. [Google Scholar] [CrossRef]
  54. Sanchez, J.; Callarisa, L.; Rodriguez, R.M.; Moliner, M.A. Perceived value of the purchase of a tourism product. Tour. Manag. 2006, 27, 394–409. [Google Scholar] [CrossRef]
  55. Angelis, V.A.; Lymperopoulos, C.; Dimaki, K. Customers’ perceived value for private and state-controlled Hellenic banks. J. Financ. Serv. Mark. 2005, 9, 360–374. [Google Scholar] [CrossRef]
  56. Kim, M.-K.; Oh, J.; Park, J.-H.; Joo, C. Perceived value and adoption intention for electric vehicles in Korea: Moderating effects of environmental traits and government supports. Energy 2018, 159, 799–809. [Google Scholar] [CrossRef]
  57. Yang, Y.; Liu, Y.; Li, H.; Yu, B. Understanding perceived risks in mobile payment acceptance. Ind. Manag. Data Syst. 2015, 115, 253–269. [Google Scholar] [CrossRef]
  58. Chen, C.-F. Investigating structural relationships between service quality, perceived value, satisfaction, and behavioral intentions for air passengers: Evidence from Taiwan. Transp. Res. A-Policy 2008, 42, 709–717. [Google Scholar] [CrossRef]
  59. Jen, W.; Tu, R.; Lu, T. Managing passenger behavioral intention: An integrated framework for service quality, satisfaction, perceived value, and switching barriers. Transportation 2011, 38, 321–342. [Google Scholar] [CrossRef]
  60. Samudro, A.; Sumarwan, U.; Simanjuntak, M.; Yusuf, E. Assessing the effects of perceived quality and perceived value on customer satisfaction. Manag. Sci. Lett. 2020, 10, 1077–1084. [Google Scholar] [CrossRef]
  61. Barrett, P. Structural equation modelling: Adjudging model fit. Personal. Individ. Differ. 2007, 42, 815–824. [Google Scholar] [CrossRef]
  62. Bollen, K.A. A new incremental fit index for general structural equation models. Sociol. Methods Res. 1989, 17, 303–316. [Google Scholar] [CrossRef]
  63. Doll, W.J.; Xia, W.; Torkzadeh, G. A confirmatory factor analysis of the end-user computing satisfaction instrument. MIS Q. 1994, 18, 453–461. [Google Scholar] [CrossRef]
  64. Li, W.; Long, R.; Chen, H. Consumers’ evaluation of national new energy vehicle policy in China: An analysis based on a four paradigm model. Energy Policy 2016, 99, 33–41. [Google Scholar] [CrossRef]
  65. Wang, Z.; Wang, C.; Hao, Y. Influencing factors of private purchasing intentions of new energy vehicles in China. J. Renew. Sustain. Energy 2013, 5, 063133. [Google Scholar] [CrossRef]
  66. Jiang, K.; Shao, C.; Feng, Z.; Yue, Q.; Yu, Z.; Zhu, S.; Huang, Z. The impact of e-bus satisfaction on driving behaviour: A questionnaire-based study on e-bus drivers. Transp. Res. F-Traffic 2021, 83, 238–251. [Google Scholar] [CrossRef]
  67. Barutçu, S. E-customer satisfaction in the e-tailing industry: An empirical survey for Turkish e-customers. Ege Acad. Rev. 2010, 10, 15–35. [Google Scholar] [CrossRef] [Green Version]
  68. Kaswengi, J.; Lambey-Checchin, C. How logistics service quality and product quality matter in the retailer–customer relationship of food drive-throughs: The role of perceived convenience. Int. J. Phys. Distrib. Logist. Manag. 2020, 50, 535–555. [Google Scholar] [CrossRef]
Figure 1. Gravel diagram.
Sustainability 14 07638 g001
Figure 2. Structural equation model of dispatcher satisfaction.
Sustainability 14 07638 g002
Figure 3. Model standardization path coefficient.
Sustainability 14 07638 g003
Table 1. Questionnaire information.
Measurement VariableSymbol
Classification/Sub-regional managementA1
Traffic safety managementA2
Subsidy policyA3
Regulation of the license plate systemA4
Regulation of the driver’s license systemA5
Strengthening safety educationA6
Solving the positioning problemA7
Improving traffic regulationsA8
Improving charging facilitiesA9
Solving for legal transport on the roadA10
Improving the design of electric tricyclesA11
Establishing quality standardsA12
Higher flexible access roadsC1
Low carbon and environmental protectionC2
Low maintenance costC3
No driving qualification requirementC4
Low dispatch costC5
Low cost of purchasing the electric tricycleC6
Dispatcher satisfactionS1
Improving customer satisfactionS2
Table 2. Summary statistics of satisfaction.
ItemMinMaxMeanStdItemMinMaxMeanStd
A1152.271.06A11152.090.96
A2151.941.00A12152.031.02
A3151.900.93C1152.000.96
A4152.071.08C2152.030.96
A5152.211.08C3152.060.98
A6152.040.90C4152.320.96
A7152.111.02C5152.110.95
A8151.770.92C6152.000.95
A9152.241.02S1152.450.95
A10151.790.94S2152.200.94
Table 3. Individual attributes of dispatchers.
AttributesDistributionFrequency%
GenderMale17284.31%
Female3215.69%
Age19~22 years125.88%
23~30 years9044.12%
31~35 years7235.29%
36~45 years2612.75%
>46 years41.96%
Education levelBelow middle school125.88%
Middle school7134.80%
High school9245.10%
Bachelor’s degree2713.24%
Master’s degree20.98%
Monthly income (CNY)<35004019.16%
3501~45006531.86%
4501~60007134.8%
6001~90002411.76%
>900141.96%
Engaged in delivery time<3 months188.82%
3~6 months3718.14%
6~12 months14973.04%
1~3 years00%
>3 years00%
Table 4. Principal Component Analysis Results.
VariableSymbolCoefficientVariableSymbolCoefficient
Sound policyA10.769LegalityA80.757
A20.629A100.690
A30.579A110.702
--A120.731
Perceived convenienceC10.785Standardizing systemA40.637
C20.650A50.627
C40.638A60.604
C60.758--
Table 5. Goodness of fit indexes.
Indexesχ2/dfGFIIFICFIPCFIPNFIRMSEA
Standard<3>0.9>0.9>0.9>0.5>0.5<0.08
Model1.9140.9020.9090.9060.7330.6680.067
Table 6. Effects of latent variables on dispatcher satisfaction.
EffectSound PolicyLegalityStandardizing SystemPerceived Convenience
direct effect---0.606
indirect effect0.4480.242−0.366-
total effect0.4480.242−0.3660.606
Publisher’s Note: MDPI stays neutral with regard to jurisdictional claims in published maps and institutional affiliations.

