Systematic Review

Are Millets More Effective in Managing Hyperlipidaemia and Obesity than Major Cereal Staples? A Systematic Review and Meta-Analysis

1
Enabling System Transformation (EST), International Crops Research Institute for the Semi-Arid Tropics (ICRISAT), Hyderabad 502324, India
2
Ostrom Center for Advanced Studies on Natural Resources Governance, Asian Institute of Technology, Khlong Luang 12120, Thailand
3
One Acre Fund, KG 7 Ave, BHC House, Kigali, Rwanda
4
Choosing FOOD3050, Brisbane, QLD 4160, Australia
5
Institute for Food, Nutrition and Health, University of Reading, Reading RG6 6EU, UK
6
National Institute of Nutrition (NIN), Hyderabad 500007, India
7
National Technical Board of Nutrition, Government of India (GoI), New Delhi 110001, India
*
Author to whom correspondence should be addressed.
Sustainability 2022, 14(11), 6659; https://doi.org/10.3390/su14116659
Submission received: 27 April 2022 / Revised: 20 May 2022 / Accepted: 23 May 2022 / Published: 29 May 2022

Abstract

:
Millets are important staples across developing countries in Asia and Africa. A previous systematic review and meta-analysis showed that eating millets significantly controlled hyperlipidaemia and obesity by focusing on a comparison of pre- and post-intervention measurements. This study further provides meta-analysis of the effects of the consumption of millets on hyperlipidaemia and obesity by analysing millets against other staple grains using the difference-in-differences method, where the effects were computed on the Standardised Mean Difference scale. Thus, only studies that included a control group as well as the baseline were included. The results from twelve eligible studies on blood lipid profile show significant (p < 0.05) favourable effects of consuming millets compared to other staples (rice, wheat, and quinoa). Specifically, the effects on total cholesterol, triacylglycerol, and very low-density lipoprotein cholesterol levels were −0.44, −0.29, and −0.41, respectively (p < 0.05), while the effect on the high-density lipoprotein cholesterol level was +0.59 (p < 0.05). In addition, the effects on low-density lipoprotein cholesterol and the body mass index were −0.60 and −0.29, respectively, with p = 0.06 each. While this study strengthens the evidence that the consumption of millets contributes to reducing the risks of hyperlipidaemia, and therefore cardiovascular diseases, more detailed and rigorous studies are recommended.

1. Introduction

The Lancet commission report emphasises that among more than 14,000 edible plant species that exist on the planet, 150 to 200 are consumed by humans. However, rice, wheat, and maize account for 60% of total caloric intake [1]. With significantly higher investments in these major crops over the decades, millet species and varieties and their value chain advancements were comparatively stagnant while their consumption significantly decreased over the decades [2]. However, there is a recent resurgence in attention to the need for increasing biodiversity on farms and in diets, including revamped interest in millets, as supported by scientific promotion of millets being smart food that is “good for you, the planet, and the farmer” [3]. Their nutritional and health benefits are widely recognised, and several pieces of evidence were recently produced to validate those claims. Millets help in managing type 2 diabetes, moderating blood lipid profile, raising haemoglobin levels, and thereby reducing anaemia [4,5,6].
The impact of eating millets on lipid profile was critically reviewed by Anitha et al. (2021b), who focused on studies on changes in outcome parameters in millets-consuming groups. The study [5] shows that consumption of millets led to improvement in blood lipid profile and reduction in the BMI. However, it calls for additional data and analysis to enhance these claims. The current study aims to further strengthen this evidence by employing the difference-in-differences (DID) method, where the treatment group consumed millets and the control group consumed major staple foods.
Review Question: Does consumption of millets help manage blood lipid profile and obesity compared to major staple foods?

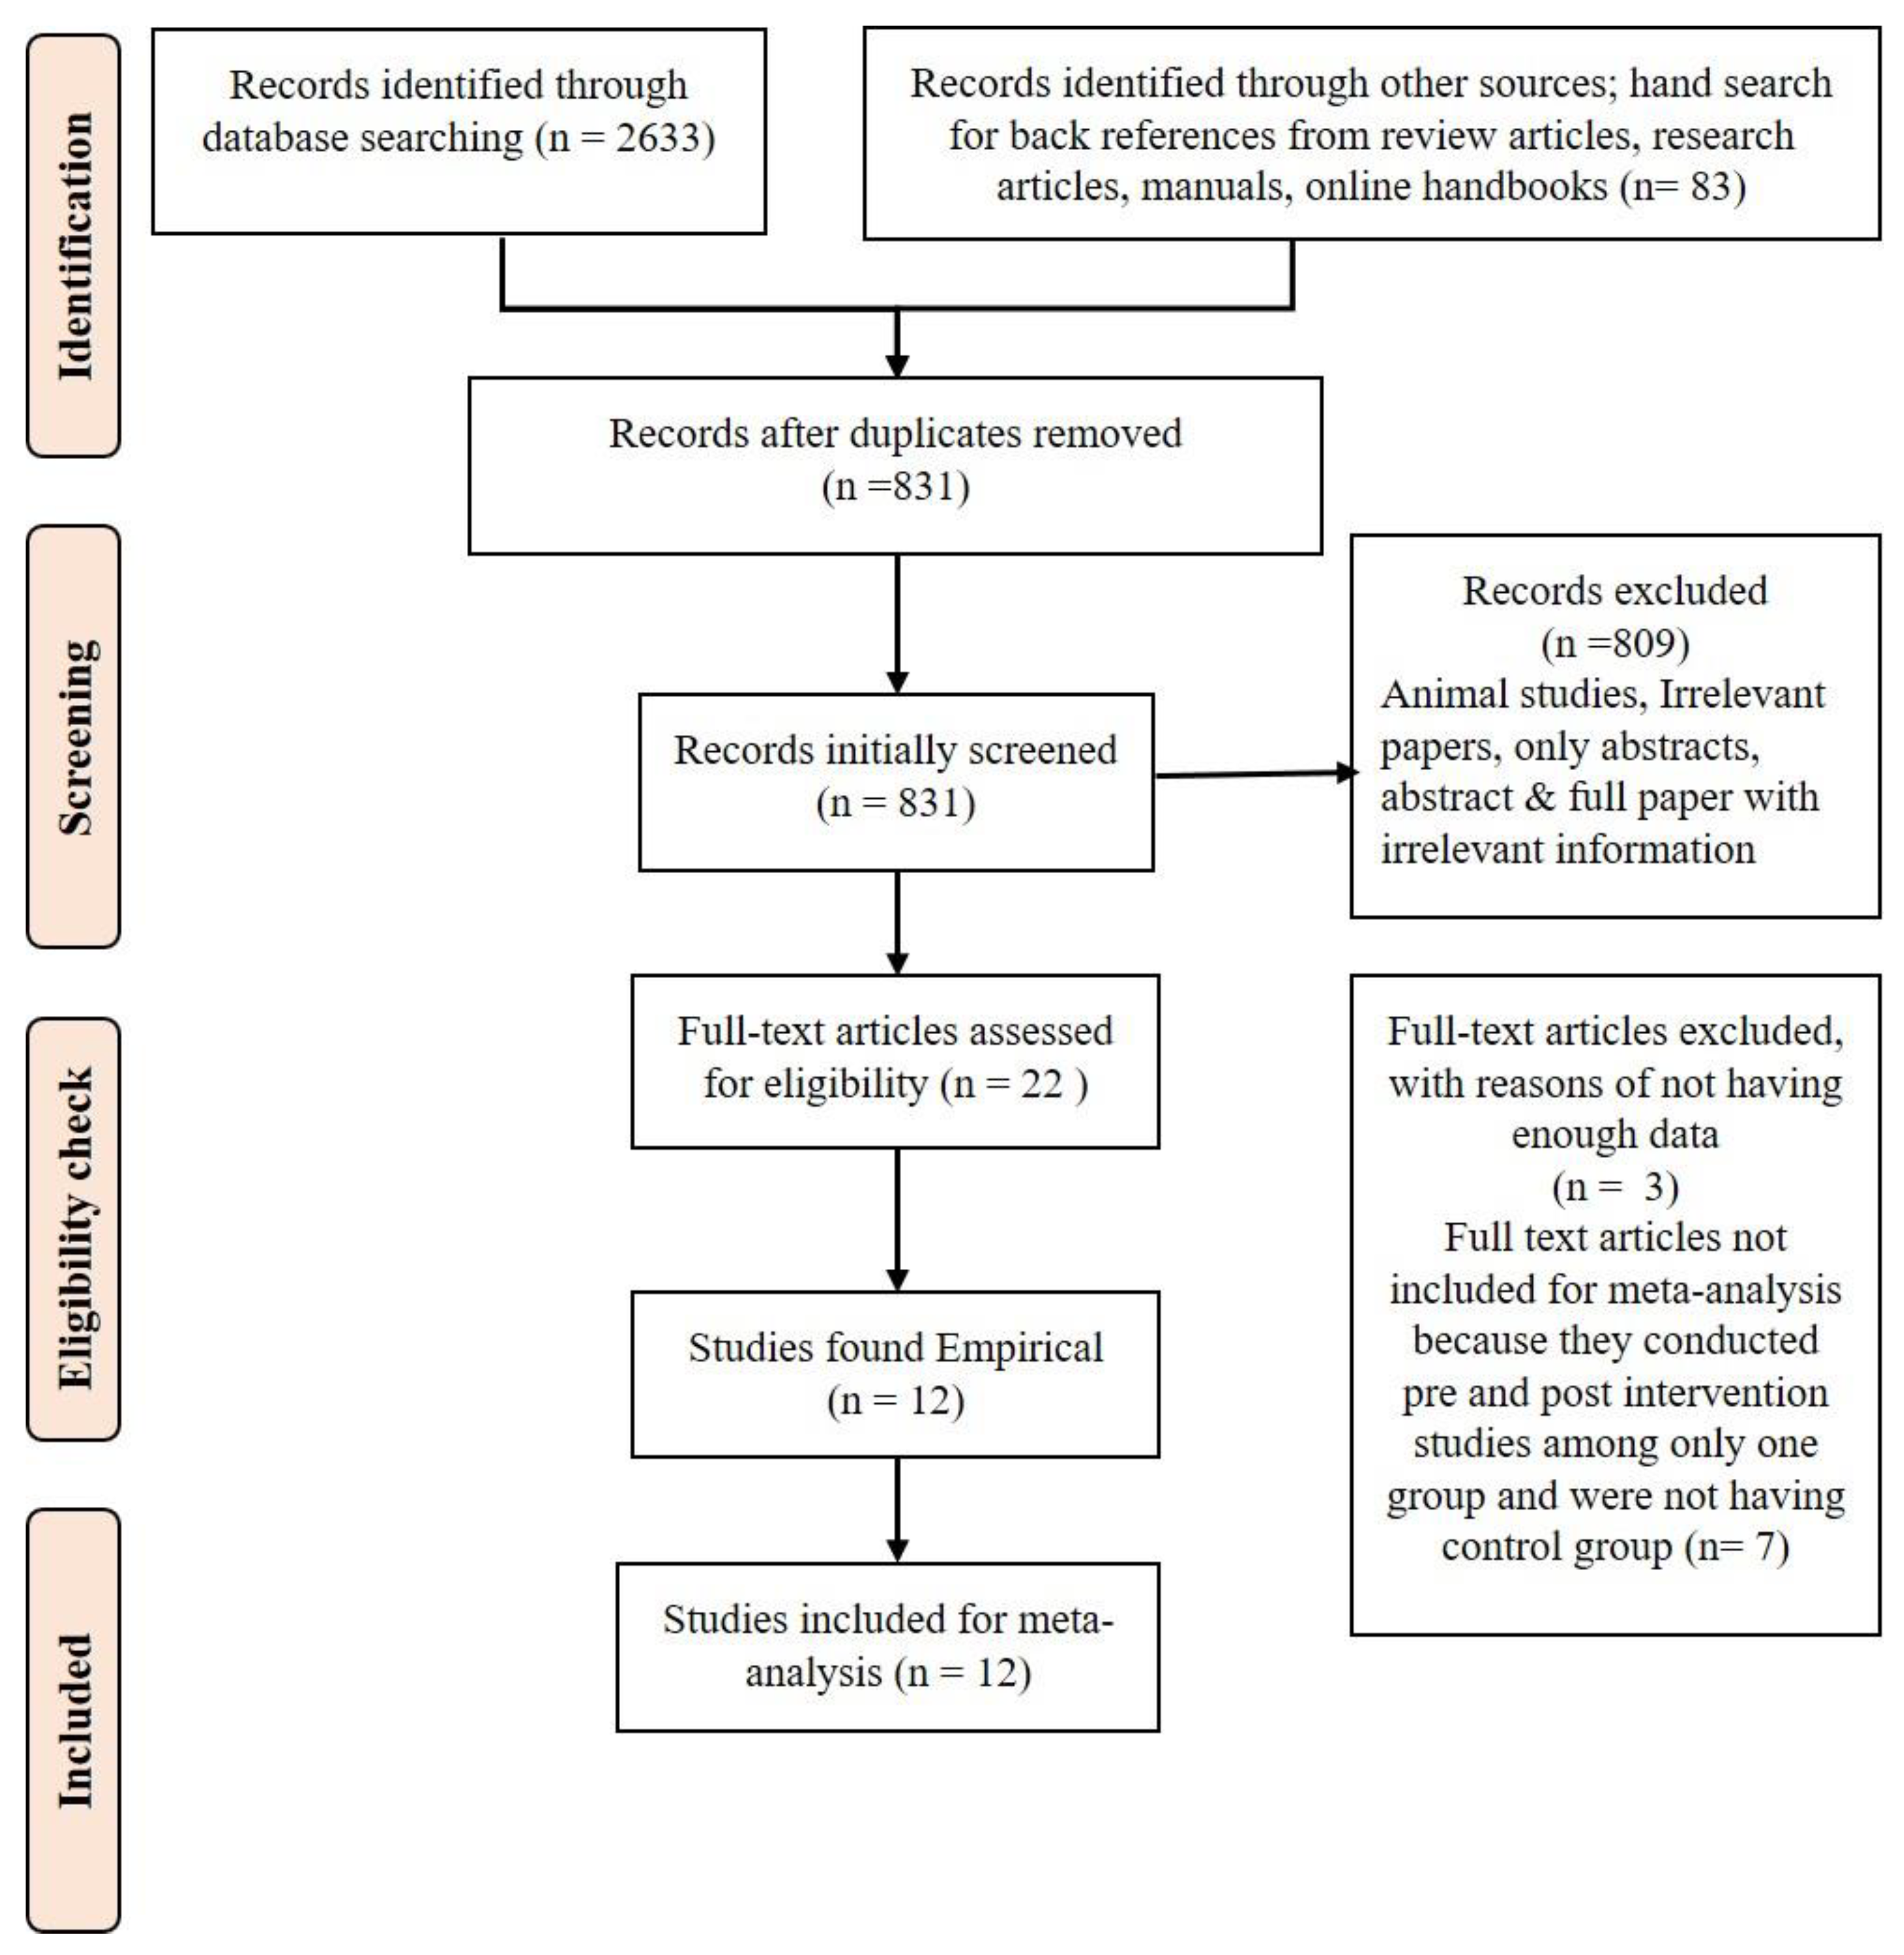
2. Materials and Methods

2.1. Study Period

The study period extended from 3 October 2017 to 1 December 2021. A 27-item PRISMA checklist [7,8] was used in this process. The protocol has been registered in 26 March 2021 at “research registry” (www.researchregistry.com) with the registration number “reviewregistry1123”.

2.2. Information Sources

Only articles in English were considered for the study. The first step was to undertake a scoping of all the studies on the designated topic and related to the research question as guided by Atkinson and Cipriani (2018) [9]. Google Scholar, Scopus, Web of Science, PubMed, and CAB abstracts were used for the scoping. The online protocol (reviewregistry1123) and Supplementary Table S1 provide details of the study strategy and keywords used to conduct the search. The results of the scoping process were screened further to check for relevance, complete availability of data, and the quality of the original articles using inclusion and exclusion criteria [5]. Authors of the papers were contacted for missing data.

2.3. Inclusion Criteria

Relevant studies published between January 2010 and March 2021 were used to extract data if they satisfied the following inclusion criteria for primary outcomes: 1. randomised controlled trials analysing the efficacy of millet-based diets compared to any other staple-based diets and reporting the results of primary outcomes of this study such as total cholesterol (TC), triacylglycerols, low-density lipoprotein cholesterol (LDL-C), very low-density lipoprotein cholesterol (VLDL-C), and/or high-density lipoprotein cholesterol (HDL-C); 2. inclusive of any age bracket, gender, or ethnic group and testing the effect of eating millets on blood lipid profile; and 3. studies reporting on BMI, a secondary outcome of this study.

2.4. Exclusion Criteria

Studies excluded were review articles, those without a control group, cross-sectional studies, and animal studies. The authors were contacted when data were incomplete, and the studies were excluded when the minimum required data were not made accessible.

2.5. Data Extraction

Key details, including author information, year of publication, age and gender of the people studied, countries where the studies were undertaken, study method, the number of samples, and the description of the food and how it was prepared (cooked/processed) for both the test and control foods were collated from every study. The numerical variables analysed included mean changes in levels of TC, triacylglycerol, VLDL-C, LDL-C, HDL-C (mg/dL.), and BMI (kg/m2). The data were extracted and reviewed by two independent reviewers (S.A. and T.W.T.) and entered into an Excel sheet [10]. The effects of millet-based diets on lipid profile were captured using the difference-in-differences (DID) method. The DID incorporates the differences in changes in measurements from pre-intervention to post-intervention between the intervention group and control group. These values were extracted directly from the paper. However, where changes were not provided, the differences in mean changes were calculated as the difference between the baseline mean and the end-line mean. If the SDs of the changes from the baseline in both groups were missing, these were also computed from the data. The SDs of the changes were computed using the formula below:
S D E , c h a n g e   = S D E ,   b a s e l i n e 2 + S D E ,   f i n a l 2 ( 2 × r × S D E ,   b a s e l i n e × S D E ,   f i n a l   )    
where r represents the correlation coefficient between the baseline and end-line values and was assumed to be 0.5, and E is the experiment or intervention group, which is replaced by C for the control group. In each case, mean standard error (SEM or SE) values were provided in the original paper, and then SE values were converted into SD values using the formula:
S D = S E × N    

2.6. GRADE to Assess the Quality of Evidence

The GRADE approach was used to assess and rate the quality of the original articles used in the meta-analysis, as described by Cochrane author resources [11]: 1. risk of bias, 2. inconsistency, 3. indirectness, 4. imprecision, and 5. publication bias were determined and rated based on the intensity of bias. The GRADE assessment was independently undertaken by two authors of this study (S.A. and R.B.). If there was a disagreement on the assessment, another author (T.W.T.) of this paper was involved for the final decision. Overall assessment of each eligible study was conducted rather than assessment of individual outcomes.

2.7. Summary Measures and Result Synthesis
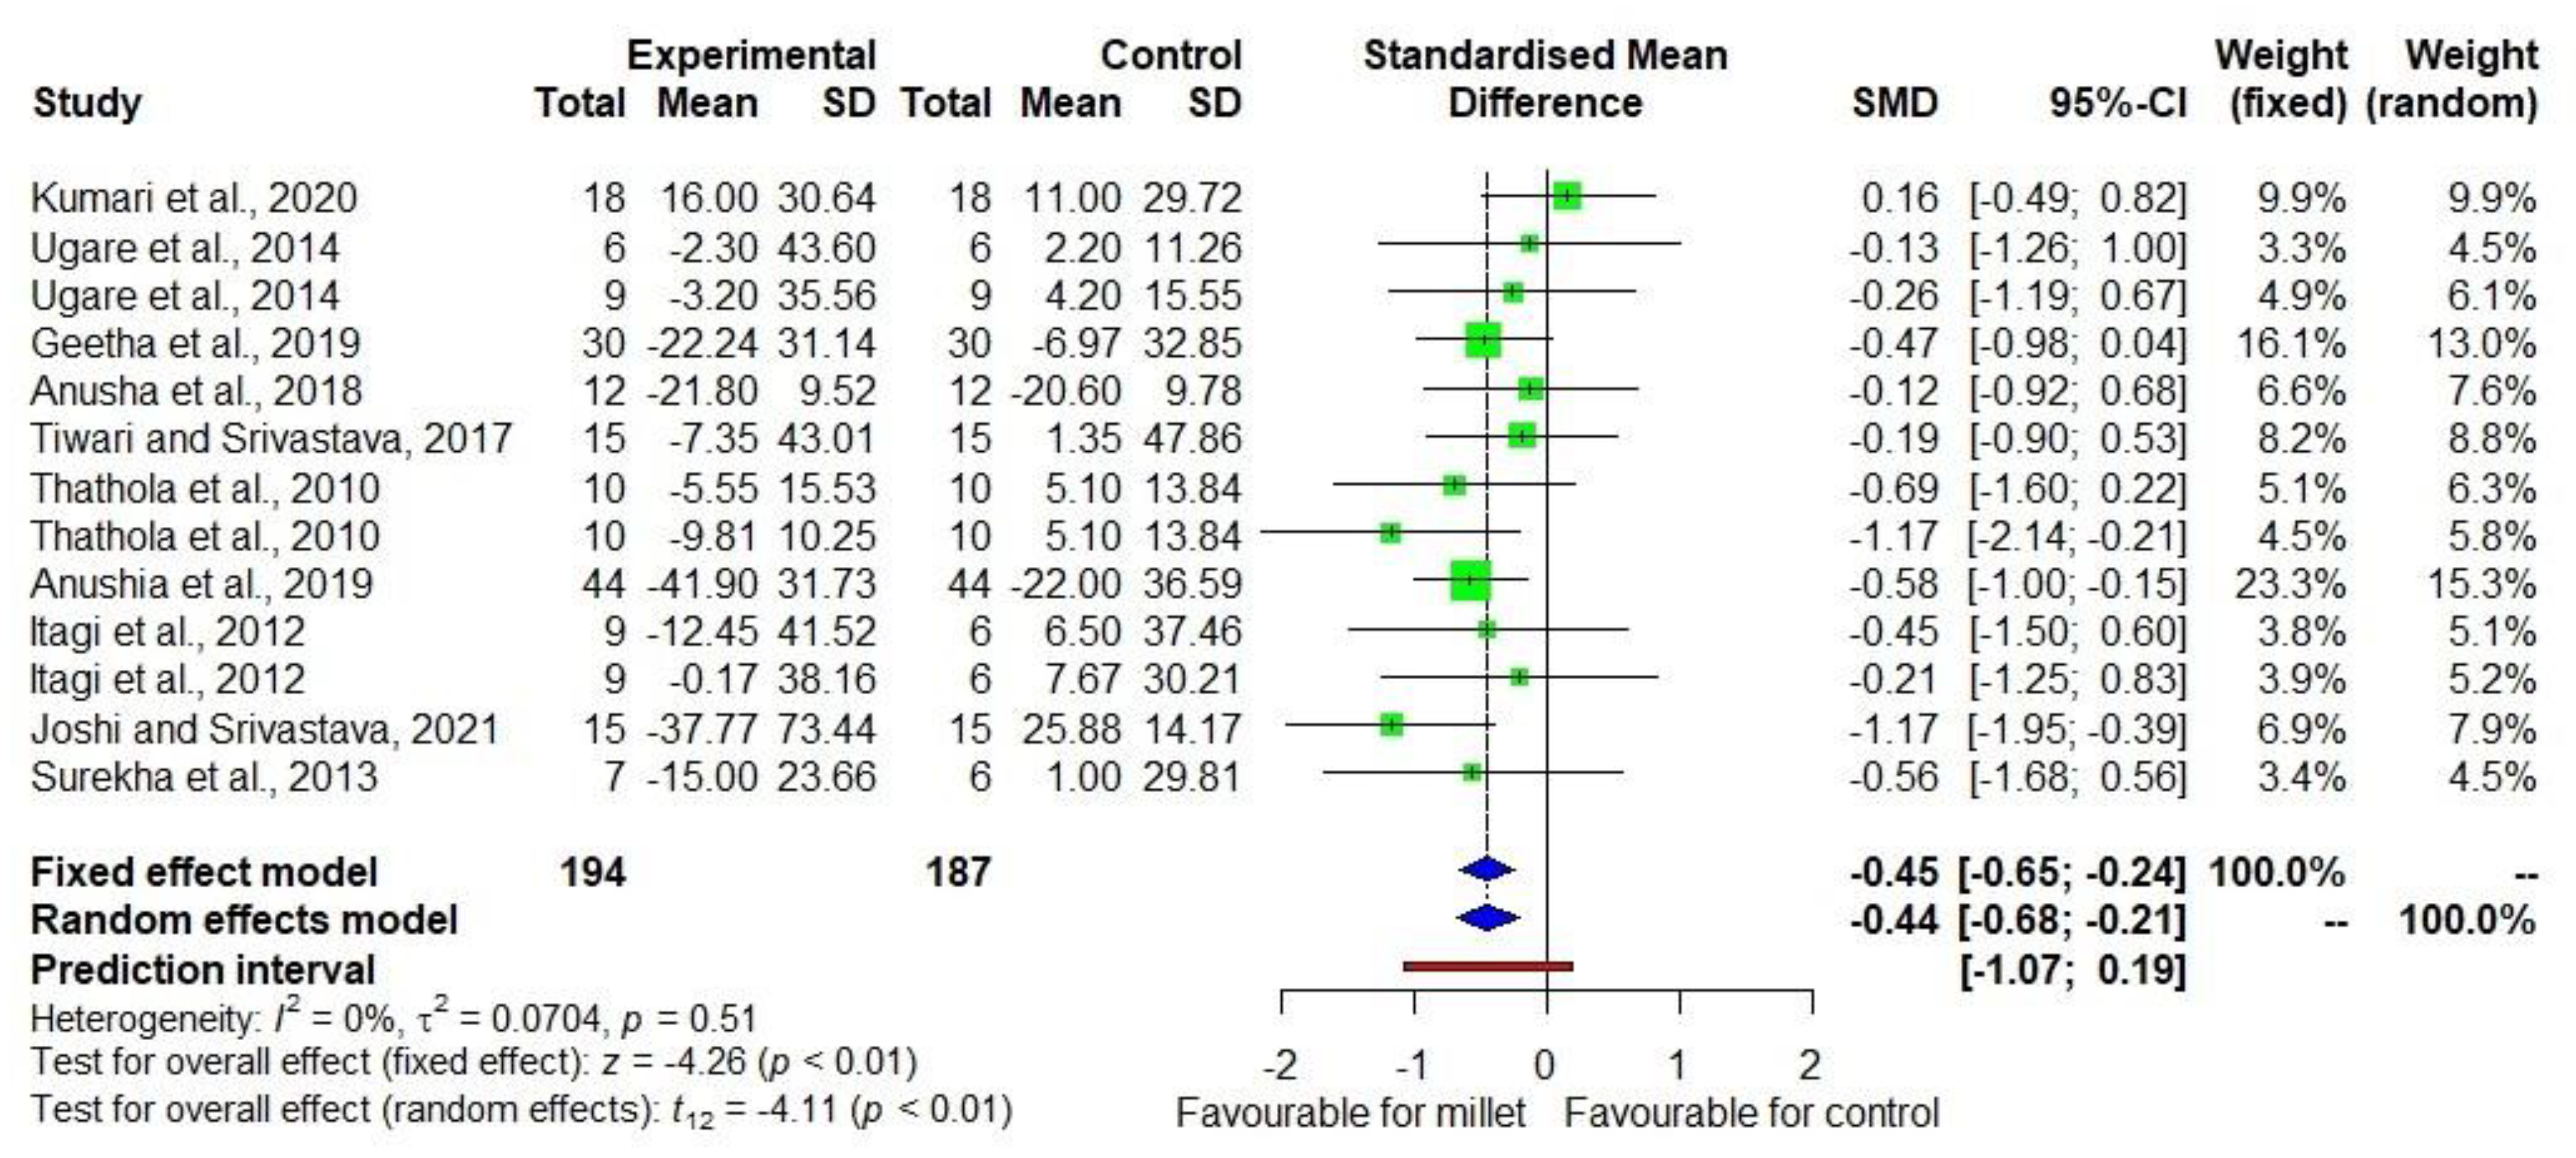
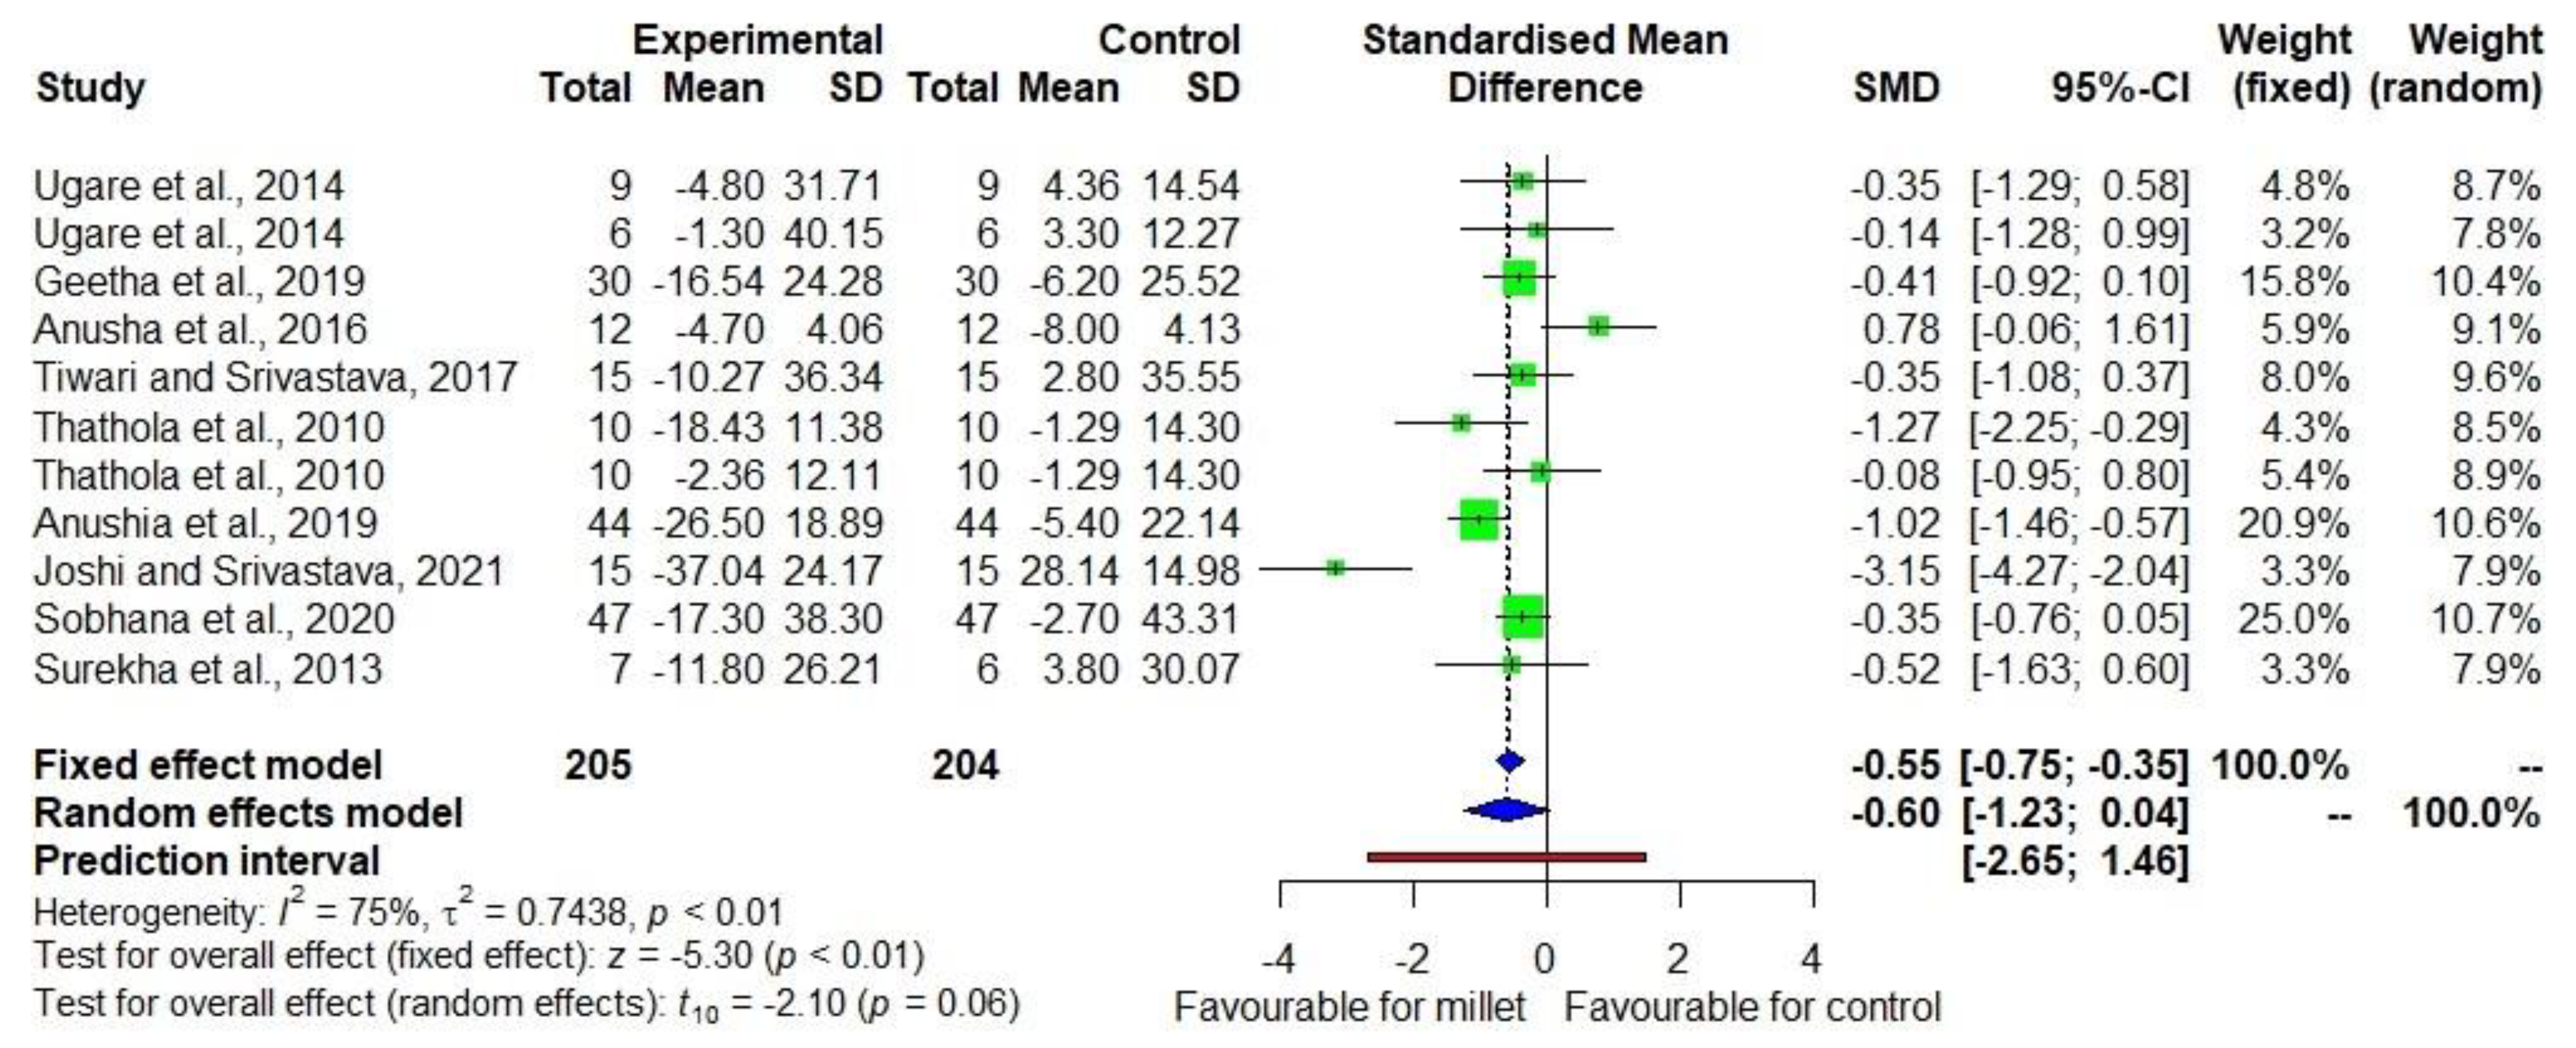
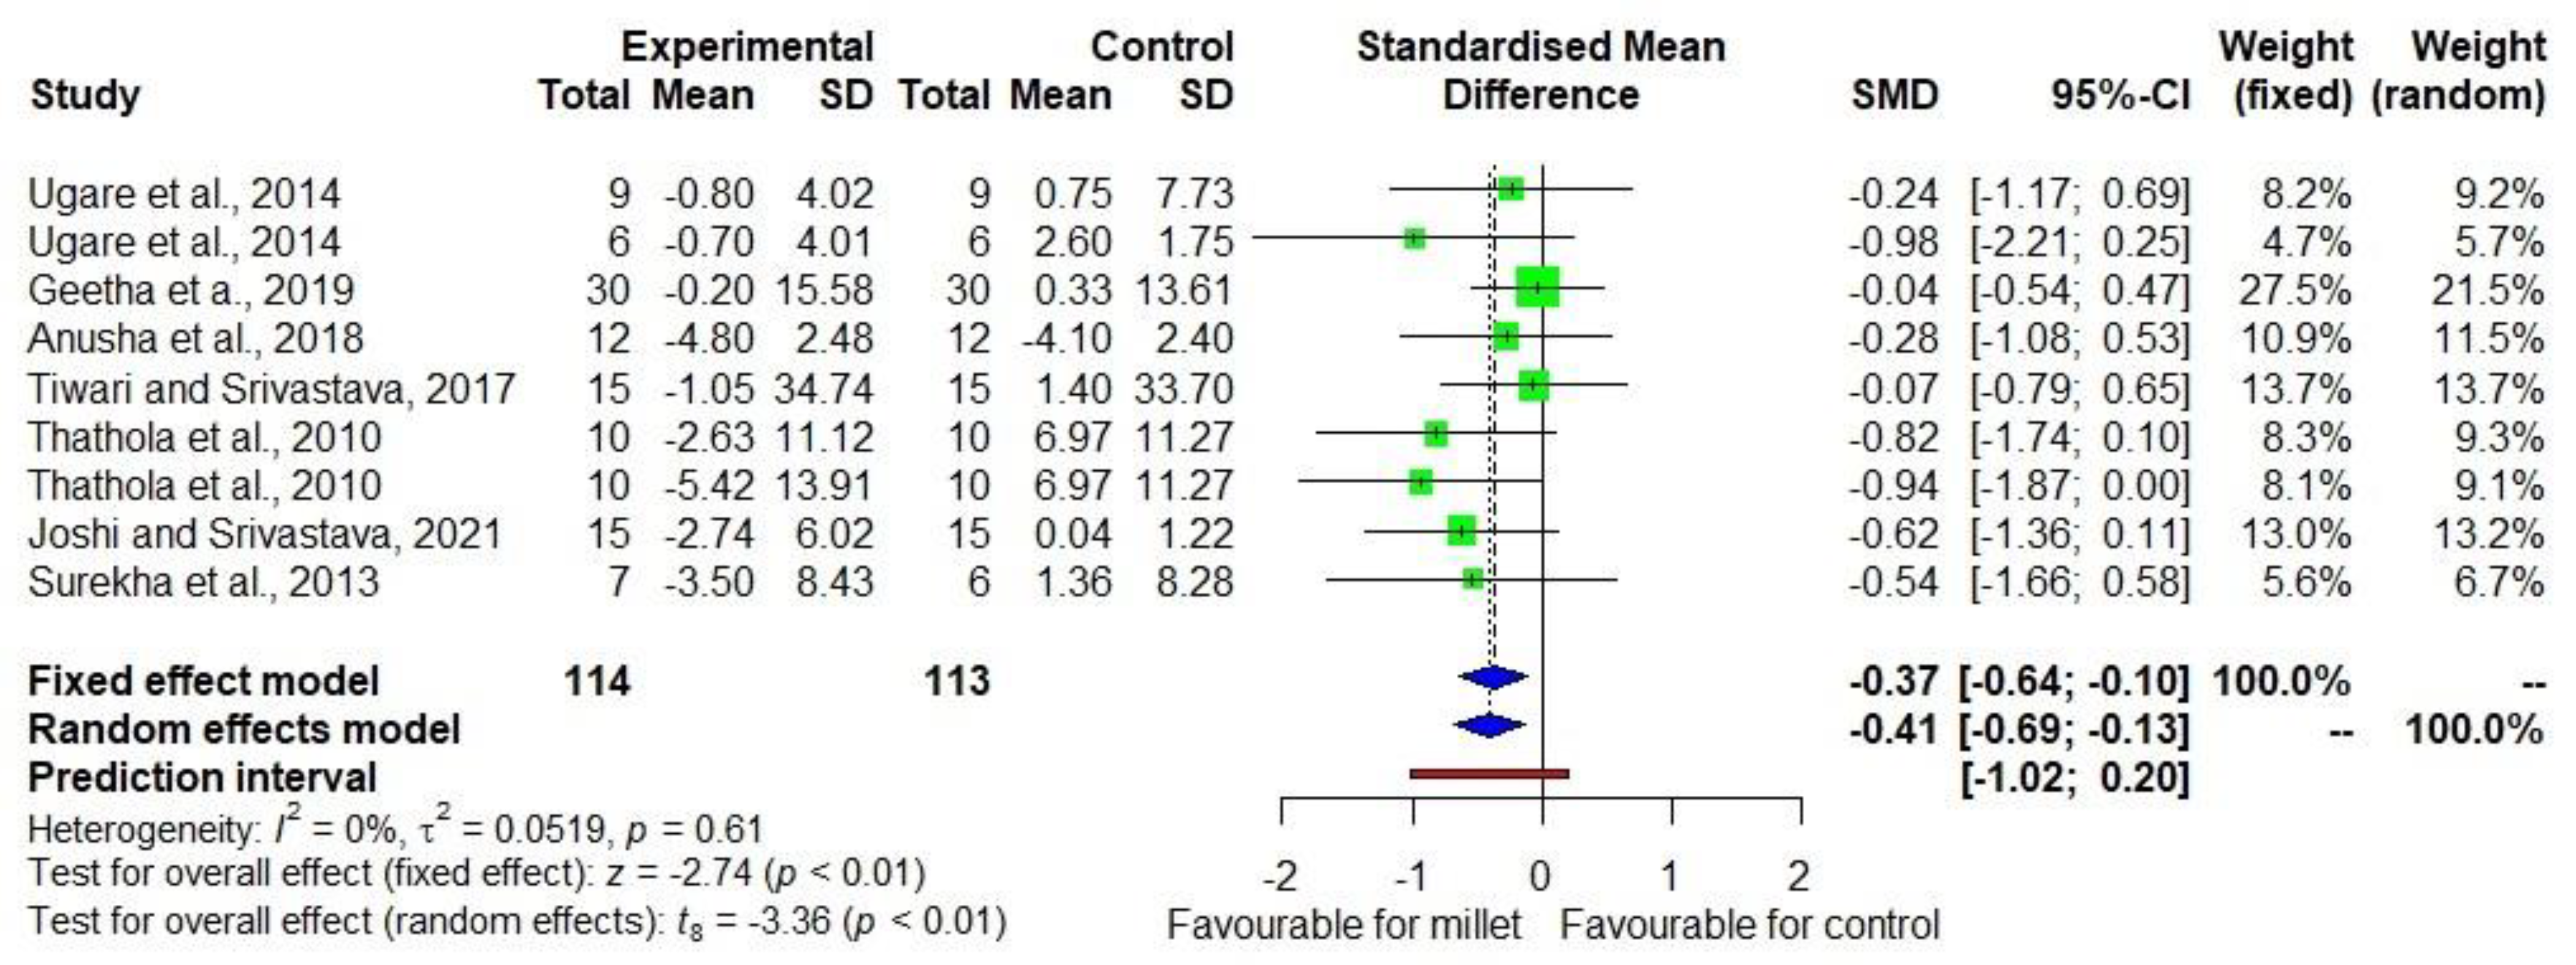
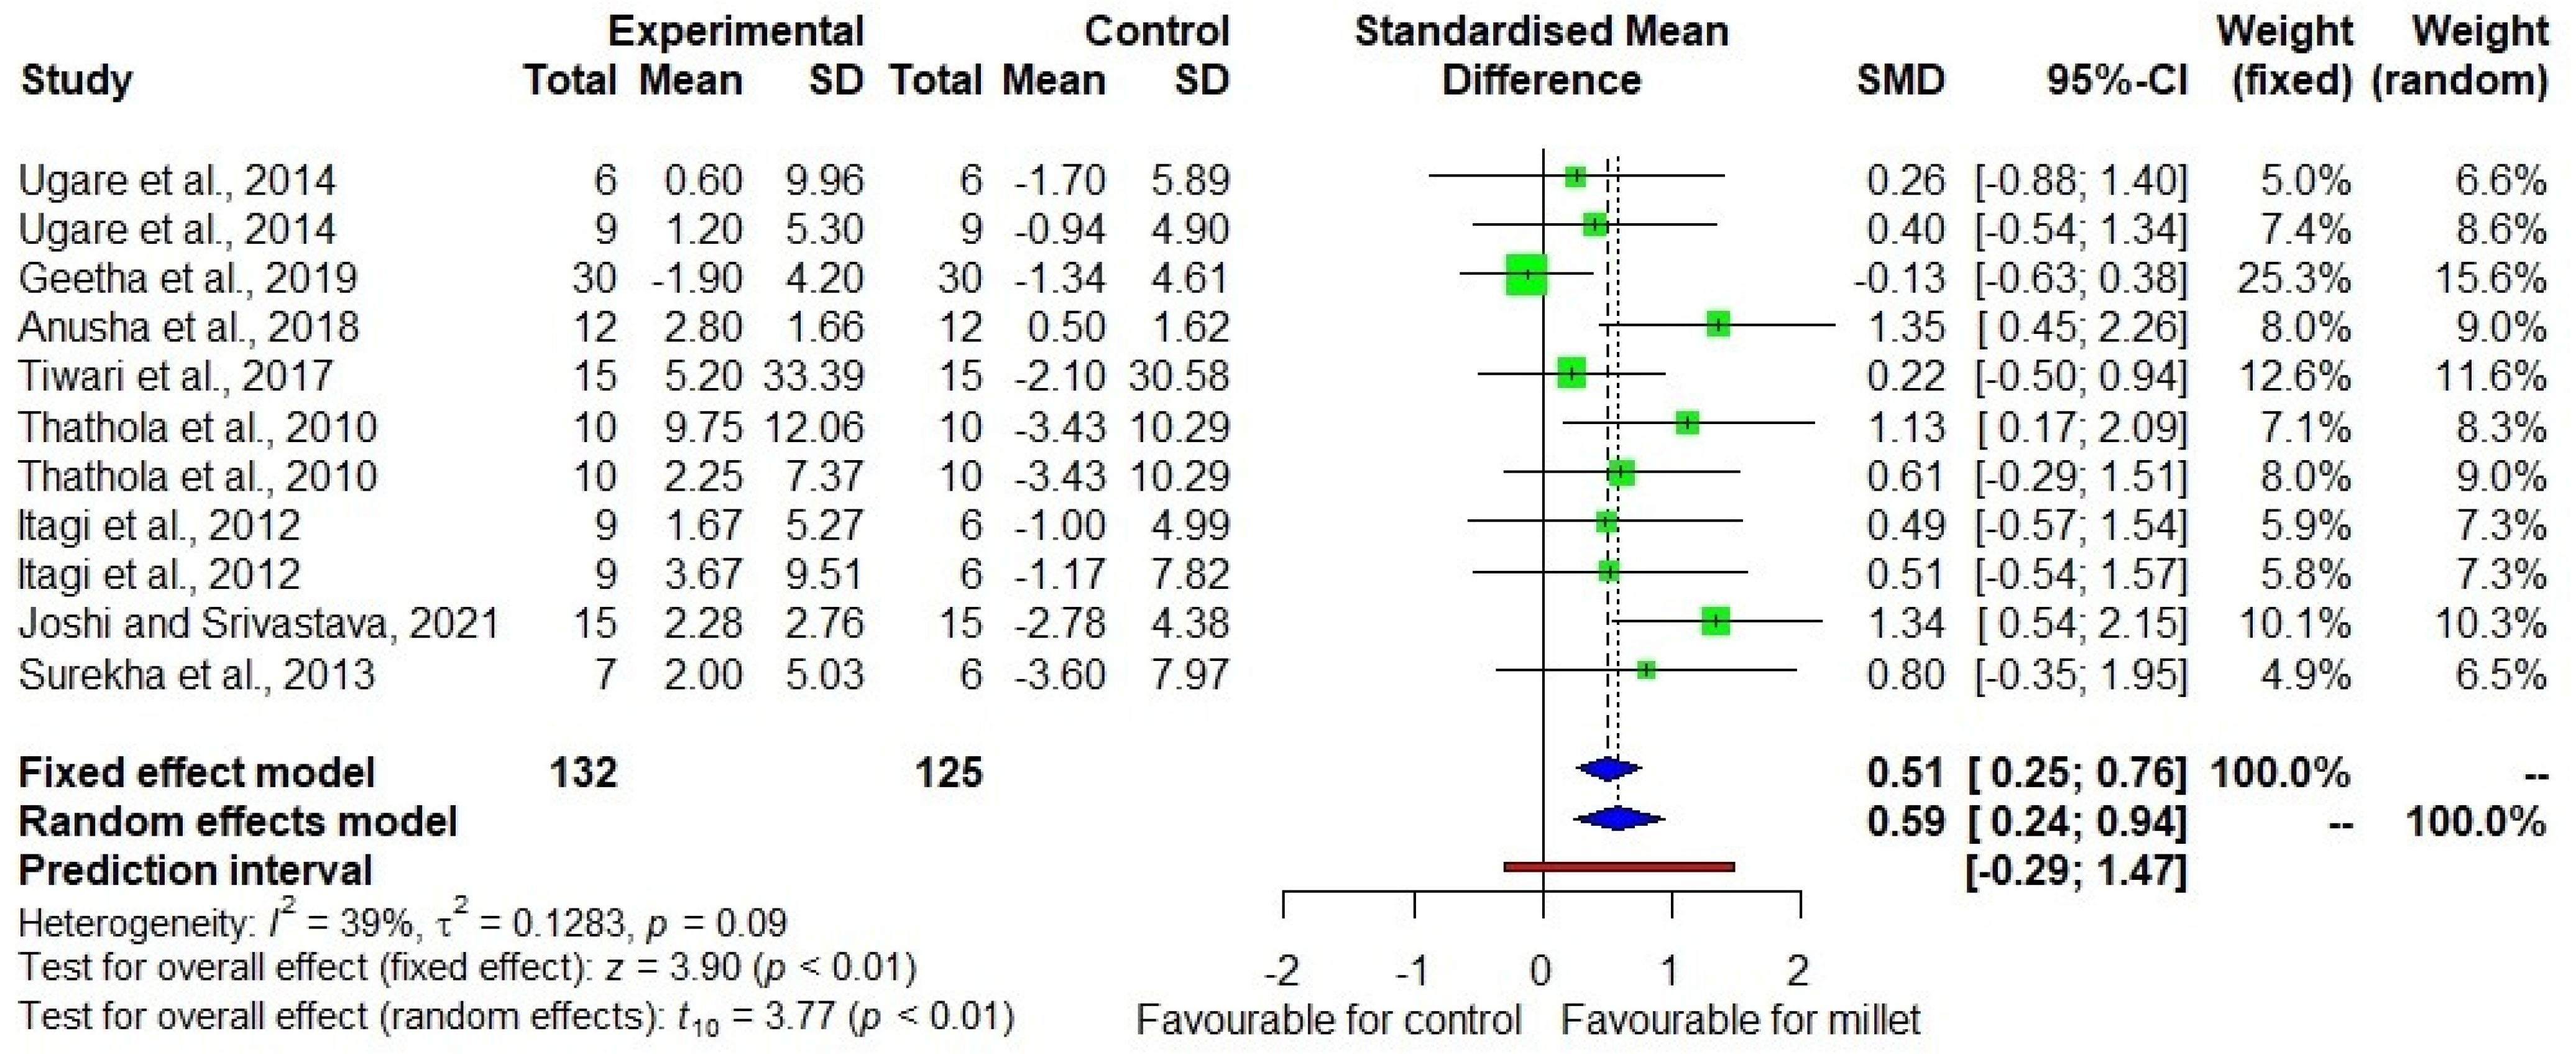
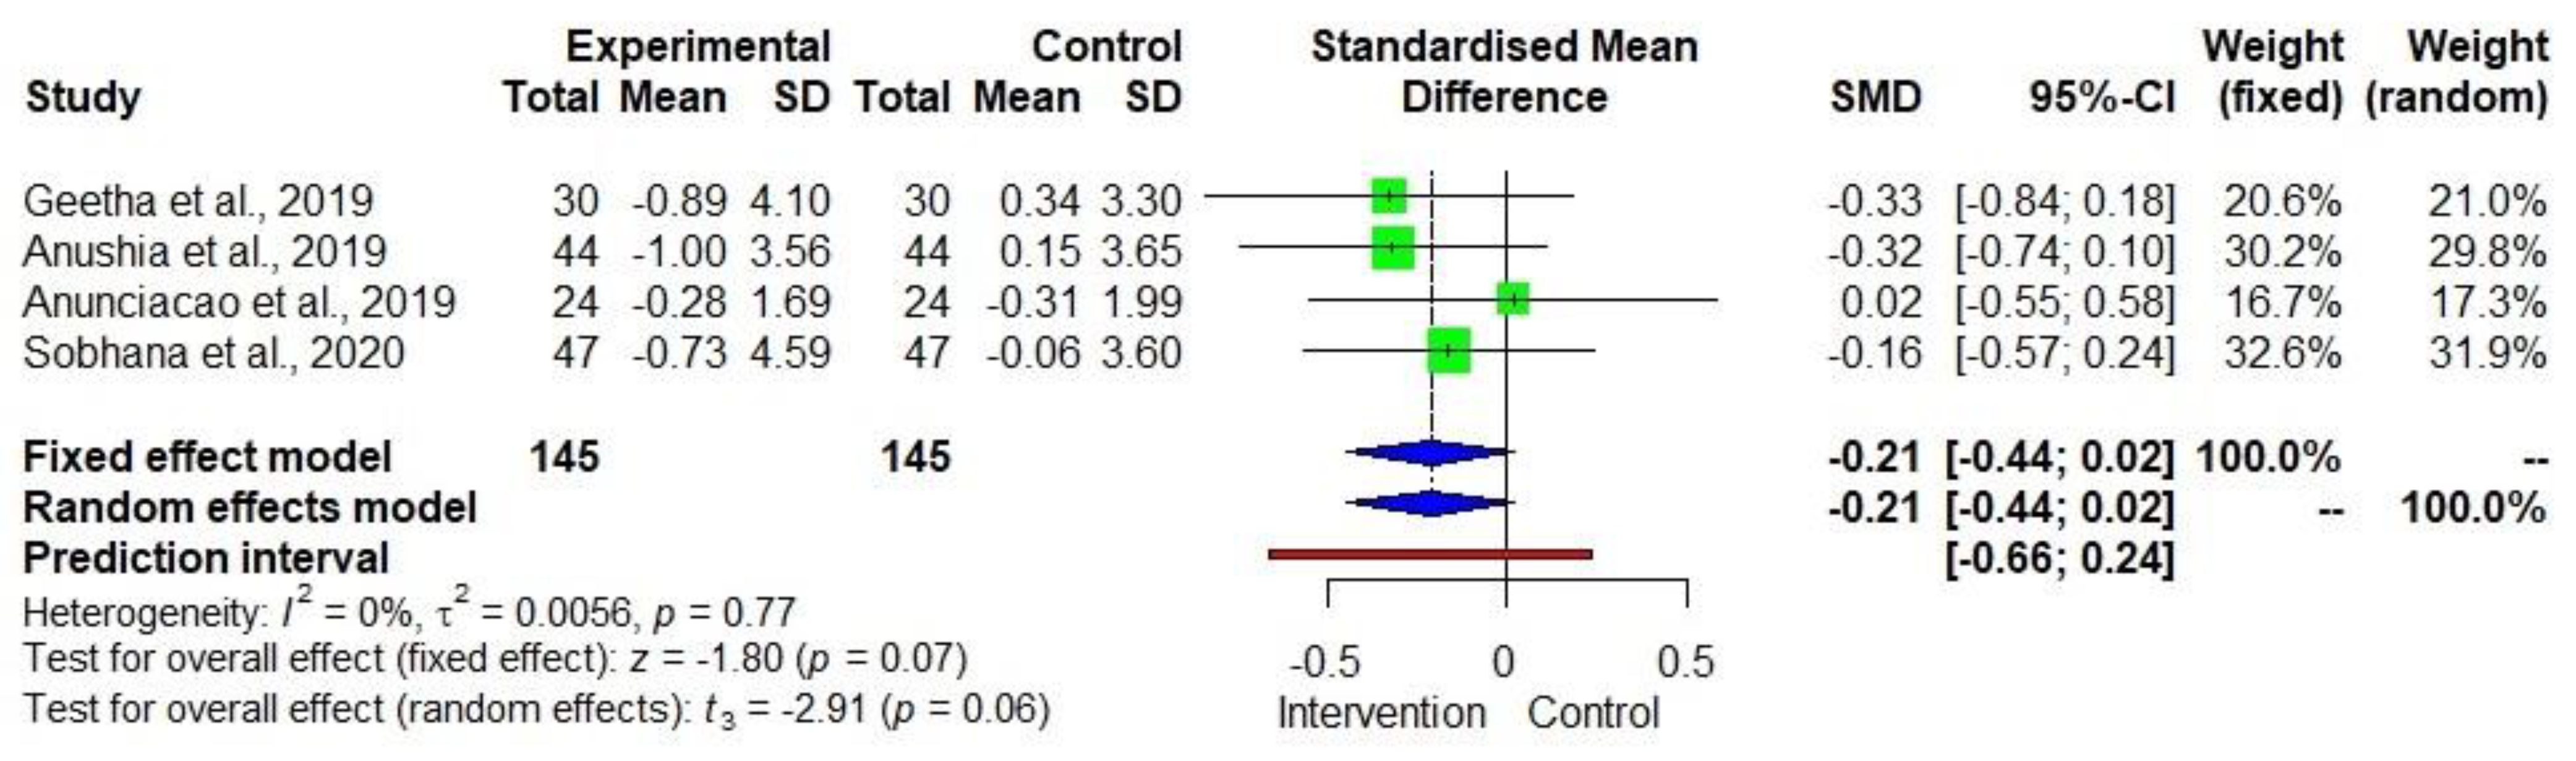
Three authors were involved in the process of data verification and analysis (S.A., T.W.T., and R.B.). The changes in mean and SDs from the baseline to end-line in the two groups were incorporated into the calculation of the DID in the form of the Standardised Mean Difference (SMD) along with a 95% confidence interval (CI) [12,13,14,15,16,17]. The fixed effect model or the random effect model was used to determine the statistical significance of the effect size. In this study, both are presented in the forest plot chart, but the random effect model was mainly used for explanation purposes. The forest plot was obtained using R Studio version 4.1.1 (Vienna, Austria) (2021) [12]. Funnel plots were drawn to visually inspect the presence of publication bias [13,14,15,16,17,18].

3. Results

Twelve studies were included in the meta-analysis. The PRISMA flow diagram (Figure 1) illustrates the systematic process involved in selecting the eligible articles. Details of study characteristics are given in Supplementary Table S2.
Figure 2 shows the DID in TC level among ten [19,20,21,22,23,24,25,26,27,28] studies with low heterogeneity (I2 = 0). The effect size was −0.44 with a 95% CI of −0.68 to −0.21. The reduction in TC was 6.6% (p = 0.011) in the millet consuming group while there was no significant change (p = 0.311) in the control group consuming other staples (Supplementary Table S3).
Figure 3 shows the DID in triacylglycerol level among nine studies [20,21,22,23,24,25,26,27,28] with low heterogeneity (I2 = 0). The effect size was −0.29 with a 95% CI of −0.46 to −0.13. There was an 8.2% decrease (p = 0.002) in triacylglycerol in the treatment group while there was no significant change (p = 0.480) in the control group (Supplementary Table S3).
Figure 4 shows the DID in LDL-C level among seven studies [20,21,22,23,24,25,27,28,29] with moderate heterogeneity (I2 = 75). The effect size was −0.60 with a 95% CI of −1.23 to +0.04. However, the p-value was relatively small (p = 0.06) despite the small sample size. While a 11.7% decrease (p = 0.003) in LDL-C was observed in the treatment group, no significant decrease (p = 1.000) was found in the control group (Supplementary Table S3).
Figure 5 shows the DID in VLDL-C level among seven studies [20,21,22,23,24,27,28] with low heterogeneity (I2 = 0). The effect size was −0.41 with a 95% CI of −0.69 to −0.13. There was a 7.9% decrease (p = 0.003) in VLDL-C in the treatment group while there was no significant decrease (p = 1.000) in the control group (Supplementary Table S3).
Figure 6 shows the DID in HDL-C level among eight studies [20,21,22,23,24,26,27,28] with low heterogeneity (I2 = 39). The effect size was +0.59 with a 95% CI of +0.24 to +0.94, indicating the favourable direction of the effect. There was a 6.1% increase (p = 0.010) in HDL-C in the treatment group while there was a 4.6% decrease (p = 0.004) in the control group (Supplementary Table S3).
Figure 7 shows the DID in BMI among four studies [21,25,29,30] with low heterogeneity (I2 = 0). The effect size was −0.21 with a 95% CI of −0.44 to +0.02. However, the p-value was relatively small (p = 0.06) despite the small sample size. The BMI decrease in the treatment group was weakly significant (−2.5%, p = 0.068) while there was no significant change (p = 0.715) in the control group (Supplementary Table S3).
Funnel plot for each outcome was created using the trim-and-fit model, which is presented in Supplementary Figures S1–S6. The plot appears symmetrical, due to the absence of bias and heterogeneity.

4. Discussions

Most studies included in this review executed randomised controlled trials. However, none of them detailed how the treatment and control groups were assigned. The blinding of the experiments was also not ensured in any of the studies, though admittedly, millets’ texture and appearance are not similar to that of rice, wheat, or quinoa, and therefore blinding is not feasible, especially in India, where people can easily recognise millets. Therefore, participants’ allocation concealment was a risk arising from the articles used in this study.
The heterogeneity (I2) of outcomes varied from 0% to 75%, indicating that there was only moderate heterogeneity possibly due the varying duration of studies. The homogeneity could have resulted from the studies that were conducted in less diverse geographical regions (i.e., most studies were conducted in India). Subgroup analysis was not conducted, as few studies included each type of millets or other staple (e.g., there was only one study conducted with sorghum as a food for the intervention group and one study used quinoa as a food for the control group). Therefore, regardless of the type of millets, the study tested millets against the other staples (rice, wheat, and quinoa).
There was neither indirectness nor inconsistency identified during the GRADE assessment. The symmetric funnel plot shows that there was slight publication bias, which could have stemmed from the smaller number of studies. This is evident from the studies that are scattered in the middle and base of the triangle, which is basically due to the effect estimates from the smaller number of studies [31]. Therefore, the quality of the obtained evidence was rated as moderate. While the evidence remains valuable, it is recommended that more studies be conducted with higher rigour, across geographical regions with various types of millets, to reinforce the volume and credibility of the evidence.
The previous meta-analysis conducted by Anitha et al. (2021) [5] on the effects of millet consumption focused on changes in lipid profile in the millet-consuming group, which led to lower individual heterogeneity than in observational cross-sectional studies comparing the two groups without baseline data. The limitation of Anitha et al. (2021) [5], however, was the use of studies conducted without a control group to account for any counterfactual changes that would have occurred even without the intervention. To further test and/or strengthen the evidence, the present paper employed the DID estimator, which overcomes the previous limitation.
In the current study, the amount of millet consumed was reported by nine out of the twelve studies. An average of 92.8 ± 44.4 g (40–200 g) of millets was consumed by the intervention group for a duration ranging between 28 and 120 days. The meta-analysis identified significant beneficial effects of millet consumption on TC, triacylglycerol, LDL-C, VLDL-C, and HDL-C levels, in which the control groups consumed diets based on rice, wheat, and/or quinoa. Although the amount of the millet consumed varied among these studies, it is noteworthy that all the studies except one reported > 60 g of millets consumption per meal and that to have sustainable benefit, it is important to continue after experiencing the reduction in lipid profile to continuously manage it. The finding is consistent with the previous meta-analysis of before–after millet consumption comparison. With regard to BMI, although the effects were not significant at the 5% level, the p-value was relatively small (0.06). In particular, LDL-C had a very small p-value (0.01) in the fixed-effect model.
Not many studies have analysed the effects of millets consumption on the BMI, six of which were included in Anitha et al. [5], and four were eligible for the current study. It is recommended that more studies be undertaken to enhance the understanding of the impact of millets-based human diets on BMI or obesity.
Another limitation of the present study is that there was insufficient information regarding the control diets. For studies conducted in India, it can be assumed that their typical diets were based on rice and/or wheat. One study was conducted in Sri Lanka by feeding finger millet and another study in Brazil by feeding quinoa to the control group, for which the dietary context is unknown. Furthermore, the quantity of millets and control food consumed in the experiments was uneven across the studies, and none of the studies mentioned whether the quantity of millets/control foods consumed everyday was of constant quantity. These limitations hinder the formulation of dietary guidelines. While the current study could be relevant to locations with similar dietary characteristics, it would be useful to collect evidence from various locations for external validity.
Further studies should therefore provide detailed information on the control diets and on the species and varieties of millets as well as the food preparation methods used. This information will help implement millet-based food programmes aimed at mitigating hyperlipidaemia and consequently reducing the risk of cardiovascular diseases (CVD).
In all likelihood, the identified effects of millet consumption on blood lipid profile and hyperlipidaemia imply potential for integration of millets into contemporary diets as well as nutrition programmes for reducing the risks of CVD. In this regard, further research should measure a more extensive range of CVD risk markers, including measures of vascular functions, to accumulate data on the value of millets in diets and their implications for CVD.

5. Conclusions

The study enhanced evidence that regular consumption of millets helps reduce blood TC, triacylglycerol, LDL-C, and VLDL-C levels, while increasing HDL-C, thereby managing hyperlipidaemia. This implies that millets consumption can potentially contribute to reducing the risk of CVD and non-alcoholic fatty liver disease. However, further studies are recommended to accumulate evidence and deepen the insights into the efficacy of dietary millets.

Supplementary Materials

The following supporting information can be downloaded at: https://www.mdpi.com/article/10.3390/su14116659/s1, Table S1: Search strategy and keywords used to identify relevant papers; Table S2: Study characteristics of the eligible studies used in the meta-analysis; Table S3: Changes in blood lipid profile and BMI; Figure S1: Total cholesterol funnel plot; Figure S2: Triacylglycerol funnel plot; Figure S3: LDL-C funnel plot; Figure S4: VLDL-C funnel plot; Figure S5: HDL-C funnel plot; Figure S6: BMI funnel plot.

Author Contributions

Conceptualization, S.A.; methodology, S.A.; software, S.A., T.W.T. and R.B.; validation, S.A., T.W.T. and R.B.; data curation, S.A. and T.W.T.; writing—original draft preparation, S.A., J.K.-P., T.W.T., D.I.G.; writing—review and editing, A.R., R.K.B. All authors have read and agreed to the published version of the manuscript.

Funding

The systematic review is supported by the Smart Food endowment fund.

Informed Consent Statement

Not applicable.

Data Availability Statement

The original contributions presented in the study are included in the article/supplementary material, and further inquiries can be directed to the corresponding author/s.

Acknowledgments

The authors would like to acknowledge Yakima D. Vogtschmidt, Institute for Food, Nutrition and Health, University of Reading, Reading RG6 6EU, UK, for verifying and reviewing the correctness of the methodology used in this paper. The authors also thank Ramesh Kotnana for obtaining articles.

Conflicts of Interest

The authors declare no conflict of interest.

References

  1. Willett, W.; Rockström, J.; Loken, B.; Springmann, M.; Lang, T.; Vermeulen, S.; Garnett, T.; Tilman, D.; DeClerck, F.; Wood, A.; et al. Food in the Anthropocene: The EAT-Lancet commission on healthy diets from sustainable food systems. Lancet 2019, 393, 447–492. [Google Scholar] [CrossRef]
  2. Vidal, A.; Jeantet, F.; Fellus, E.; De Nardi, C.; Kane-Potaka, J. Staple Crop Diversification Why and How to Diversify from the Big Five Crops (Wheat, Rice, Maize, Potato & Soy), World Business Council for Sustainable Development and One Planet Business for Biodiversity. 2020. Available online: https://www.wbcsd.org/download/file/12605 (accessed on 13 February 2021).
  3. Kane-Potaka, J.; Poole, N.; Diama, A.; Kumar, P.; Anitha, S.; Akinbamijo, O. The Smart Food Approach: The importance of the triple bottom line and diversifying staples. In Orphan Crops for Sustainable Food and Nutrition Security; Padulosi, S., Israel Oliver King, E.D., Hunter, D., Swaminathan, M.S., Eds.; Routledge Taylor & Francis Group: New York, NY, USA, 2022; pp. 327–334. [Google Scholar]
  4. Anitha, S.; Kane-Potaka, J.; Tsusaka, T.W.; Botha, R.; Rajendran, A.; Givens, D.I.; Parasannanavar, D.J.; Subramaniam, K.; Prasad, K.D.V.; Vetriventhan, M.; et al. A systematic review and meta-analysis of the potential of millets and sorghum for managing and preventing diabetes mellitus. Front. Nutr. 2021, 8, 687428. [Google Scholar] [CrossRef]
  5. Anitha, S.; Botha, R.; Kane-Potaka, J.; Givens, D.I.; Rajendran, A.; Tsusaka, T.W.; Bhandari, R.K. Can millet consumption help to manage hyperlipidaemia and obesity—A systematic review and meta-analysis. Front. Nutr. 2021, 8, 700778. [Google Scholar] [CrossRef]
  6. Anitha, S.; Kane-Potaka, J.; Botha, R.; Givens, D.I.; Sulaiman, N.L.B.; Upadhyay, S.; Vetriventhan, M.; Tsusaka, T.W.; Parasannanavar, D.J.; Longvah, T.; et al. Millets can have a major impact on improving iron status, haemoglobin level and in reducing iron deficiency anaemia—A systematic review and meta-analysis. Front. Nutr. 2021, 712, 725529. [Google Scholar] [CrossRef]
  7. Mohar, D.; Liberati, A.; Tetzlaff, J.; Altman, D.G.; PRISMA Group. Preferred reporting items for systematic reviews and meta-analysis: The PRISMA statement. Open Med. 2009, 3, 123–130. [Google Scholar]
  8. Page, M.J.; McKenzie, J.E.; Bossuyt, P.M.; Boutron, I.; Hoffmann, T.C.; Mulrow, C.D.; Shamseer, L.; Tetzlaff, J.M.; Akl, E.A.; Brennan, S.E.; et al. The PRISMA 2020 statement: An updated guideline for reporting systematic reviews. BMJ 2021, 88, 105906. [Google Scholar]
  9. Atkinson, L.Z.; Cipriani, A. How to carry out a literature search for a systematic review: A practical guide. BJP Sych. Adv. 2018, 24, 74–82. [Google Scholar] [CrossRef]
  10. Harrer, M.; Cuijpers, P.; Furukawa, T.A.; Ebert, D.D. Doing Meta-Analysis with R: A Hands-On Guide. 2019. Available online: https://bookdown.org/MathiasHarrer/Doing_Meta_Analysis_in_R/ (accessed on 28 February 2021).
  11. Ryan, R.; Hill, S. How to GRADE the Quality of the Evidence? Cochrane Consumers and Communication Group. Version 3.0. 2016. Available online: http://cccrg.cochrance.org/author-resources (accessed on 7 December 2021).
  12. R Core Team. R: A Language and Environment for Statistical Computing; R Foundation for Statistical Computing: Vienna, Austria, 2021; Available online: https://www.R-project.org/ (accessed on 1 March 2021).
  13. Balduzzi, S.; Rücker, G.; Schwarzer, G. How to perform a meta-analysis with R: A practical tutorial? Evid. Based Ment. Health 2019, 22, 153–160. [Google Scholar] [CrossRef]
  14. Bell, A.; Fairbrother, M.; Jones, K. Fixed and random effects models: Making an informed choice. Qual. Quant. 2019, 53, 1051–1074. [Google Scholar] [CrossRef]
  15. Higgins, J.P.T.; Thomas, J.; Chandler, J.; Cumpston, M.; Li, T.; Page, M.J. Cochrane Handbook for Systematic Reviews of Interventions Version 6.2 (Updated February 2021); Welch, V.A., Ed.; Cochrane: London, UK, 2021; Available online: www.training.cochrane.org/handbook (accessed on 13 April 2021).
  16. Ahn, E.; Kang, H. Introduction to systematic review and meta-analysis. Korean J. Anaesthesiol. 2019, 71, 103–112. [Google Scholar] [CrossRef]
  17. Hak, T.; Van Rhee, H.J.; Suurmond, R. How to Interpret Results of Meta-Analysis; Erasmus Rotterdam Institute of Management: Rotterdam, The Netherlands, 2016; pp. 1–2. Available online: https://www.erim.eur.nl/research-support/metaessentials/downloads (accessed on 26 April 2021).
  18. Isreal, H.; Richter, R.P. A guide to understanding meta-analysis. J. Orthop. Sports Phys. Ther. 2011, 41, 496–504. [Google Scholar] [CrossRef]
  19. Kumari, D.; Chandrasekara, A.; Athukorale, P.; Shahidi, F. Finger millet porridges subjected to different processing conditions showed low glycemic index and variable efficacy on plasma antioxidant capacity of healthy adults. Food Prod. Process. Nutr. 2020, 2, 13. [Google Scholar] [CrossRef]
  20. Ugare, R.; Chimmad, B.; Naik, R.; Bharati, P.; Itagi, S. Glycemic index and significance of barnyard millet (Echinochloa frumentacae) in type II diabetics. J. Food Sci. Technol. 2014, 51, 392–395. [Google Scholar] [CrossRef]
  21. Geetha, K.; Yankanchi, M.G.; Hiremath, N. Effect of high fibre food mix on lipid profile and body weight in obese subjects. Biomed. Res. 2019, 30, 655–658. [Google Scholar]
  22. Anusha, B.; Hymavathi, T.V.; Vijayalaskhmi, V.; Reddy, P.; Robert, T.P. Lipid lowering effects of foxtail millet (Setaria italic) and Quinoa (Chenopodium quinoawild) in pre-diabetics. J. Pharm. Res. Int. 2018, 24, 1–7. [Google Scholar] [CrossRef]
  23. Tiwari, N. Srivastava. Effect of finger millet (Eleusine coracana) buns supplementation on serum glucose and serum lipids level in type 2 diabetics. Asian J. Dairy Food Res. 2017, 36, 337–340. [Google Scholar] [CrossRef]
  24. Thathola, A.; Srivastava, S.; Singh, G. Effect of foxtail millet (Setaria Italica) supplementation on serum glucose, serum lipids and glycosylated haemoglobin in type 2 diabetics. Diabetol. Croatica. 2011, 40, 23–29. [Google Scholar]
  25. Anushia, K.; Uma Mageshwari, J.; Trueman, P.; Viswanathan, V. The effect of millet supplementation on weight and lipid profile. TAPI J. 2019, 13, 1–7. [Google Scholar]
  26. Itagi, S.; Naik, R.; Bharati, P.; Sharma, P. Readymade foxtail millet mix for diabetics. Int. J. Sci. Nat. 2012, 3, 47–50. [Google Scholar]
  27. Joshi, S.; Srivastava, S. Hypoglycemic and hypolipidemic effect of barnyard millet consumption in type 2 diabetic subjects. Int. J. Curr. Microbiol. Appl. Sci. 2021, 10, 467–477. [Google Scholar]
  28. Surekha, N.; Chimmad, B.V.; Naik, R.S. Hypoglycaemic and hypolipidemic efficacy of barnyard millet (Echinochloa frumentacea Link) based health food. Asian J. Home Sci. 2013, 8, 383–387. [Google Scholar]
  29. Sobhana, P.P.; Kandlakunta, B.; Nagaraju, R.; Thappatla, D.; Epparapalli, S.; Vemula, S.R.; Govaravarapu, S.M.; Korrapati, D. Human clinical trial to assess the effect of consumption of multigrain Indian bread on glycemic regulation in type 2 diabetic participants. J. Food Biochem. 2020, 44, 1–10. [Google Scholar] [CrossRef] [PubMed]
  30. Anunciacao, P.C.; Cardoso, L.D.M.; Alfenas, R.D.C.G.; Queiroz, V.A.V.; Carvalho, C.W.P.; Martino, H.S.D.; Pinheiro-SantAna, H.M. Extruded sorghum consumption assoicated with a caloric restricted diet reduces body fat in overweight men: A randomized controlled trial. Food Res. Int. 2019, 119, 693–700. [Google Scholar] [CrossRef] [PubMed]
  31. Stern, J.A.C.; Sutton, A.J.; Loannidis, J.P.A.; Terrin, N.; Jones, D.R.; Lau, J.; Carpenter, J.; Rücker, G.; Harbord, R.M.; Schmid, C.H.; et al. Recommendations for examining and interpreting funnel plot asymmetry in meta-analyses of randomised controlled trials. BMJ 2011, 342, 4002. [Google Scholar] [CrossRef]
Figure 1. PRISMA flow diagram of the systematic review and meta-analysis.
Sustainability 14 06659 g001
Figure 2. Forest plot showing effects of millets vs. conventional staples consumption on total cho-lesterol levels [19,20,21,22,23,24,25,26,27,28].
Sustainability 14 06659 g002
Figure 3. Forest plot showing the effects of millets vs. conventional staples consumption on triacylglycerol levels [20,21,22,23,24,25,26,27,28].
Sustainability 14 06659 g003
Figure 4. Forest plot showing the effects of millets vs. conventional staples consumption on low-density lipoprotein cholesterol (LDL-C) levels [20,21,22,23,24,25,27,28,29].
Sustainability 14 06659 g004
Figure 5. Forest plot showing the effects size of millets vs. conventional staples consumption on very low-density lipoprotein cholesterol (VLDL-C) levels [20,21,22,23,24,27,28].
Sustainability 14 06659 g005
Figure 6. Forest plot showing the effect size of millet vs. conventional staples consumption on high-density lipoprotein cholesterol (HDL-C) levels [20,21,22,23,24,26,27,28].
Sustainability 14 06659 g006
Figure 7. Forest plot showing the effects of millets vs. conventional staples consumption on the body mass index (BMI) [21,25,29,30].
Sustainability 14 06659 g007
Publisher’s Note: MDPI stays neutral with regard to jurisdictional claims in published maps and institutional affiliations.

