
Simulating Socio-Technical Transitions of Photovoltaics Using Empirically Based Hybrid Simulation-Optimization Approach


1
Department of Mechanical and Industrial Engineering, Universitas Gadjah Mada (UGM), Yogyakarta 55281, Indonesia
2
Department of Industrial Engineering, Sultan Agung Islamic University, Semarang 50112, Indonesia
*
Author to whom correspondence should be addressed.
Sustainability 2022, 14(9), 5411; https://doi.org/10.3390/su14095411
Submission received: 26 February 2022
/
Revised: 1 April 2022
/
Accepted: 26 April 2022
/
Published: 30 April 2022
(This article belongs to the Special Issue Sustainability of Energy Transition Scenarios: Economic, Resource Availability, and Environmental Impacts)
Abstract
:Energy transitions as socio-technical processes involves interactions among different actors such as households, firms, and government, thus requiring an integrated approach to explore the transition’s dynamics. The present study aims to simulate the socio-technical transitions of photovoltaics (PV) in Indonesia using an empirically based hybrid simulation-optimization model. The model involves households’ decision-making, PV supply chain, and government interventions. The hybrid simulation-optimization model consists of integer linear programming to optimize PV’s supply chain configuration which was embedded within agent-based modeling and simulation (ABM). The empirical data involving 413 households from 34 provinces in Indonesia was acquired from a survey that was specifically designed based on the Unified Theory of Acceptance and Use of Technology 2 (UTAUT2) to specify and parameterize the model. Export tariff regulation, incentives for PV investment, environmental campaigns, and the combinations of those interventions were evaluated. The findings demonstrate that all of the interventions increase the intention toward PV, but the intention is not necessarily translated into adoption due to either financial or facility constraints. The findings highlight the necessity to include both demand and supply aspects endogenously in the transition model. The export tariffs combined with the incentives, followed by the export tariffs combined with the campaigns, is found to be preferable due to low supply chain unit cost and high reduction of greenhouse gas. Managerial implications and future research are discussed.
1. Introduction
Indonesia’s electricity production is still dominated by fossil fuels, where coal is the largest source of energy (66.30%), followed by gas (16.80%) and oil (2.54%) [1]. Although renewable energy contributed 14.71% of electricity by the end of 2020, the Indonesian government targets 23% of renewable energy by 2025. The depletion of fossil resources and environmental issues, including commitments to the Paris Agreement, demand an accelerated transition to renewable energy sources. Indonesia has various renewable energy potentials, such as solar, hydro, wind, geothermal, and bioenergy. Solar photovoltaics (PV) has a tremendous potential reaching 207.8 GW or 46.7% of Indonesia’s total renewable energy potential [1]. The significant potential of its mature technology and its ability to be applied in a modular manner makes solar energy a renewable energy widely developed.
In 2017, the Indonesian government promoted PV technology through various programs by granting a 50 Wp Solar Home System (SHS) grant for households without access to electricity and a rooftop photovoltaic program for those on-grid. This is in addition to the National Movement for One Million Solar Roofs (GSSA) for industrial sectors. By the end of 2020, about 2566 customers of PLN (Perusahaan Listrik Negara), an electricity state-owned company, had installed on-grid PV with a total capacity of 18 MW [2]. Despite various implemented PV programs to encourage its installation in Indonesia, only 35 MW was acquired by July 2021, which is still far from the target of 3.5 GW by 2025.
Energy transitions are viewed as an interactive complex system involving various stakeholders such as users, firms, and government, aimed at driving socio-technical dynamics. Therefore, this study aims to develop an integrated model using an empirically based hybrid simulation-optimization approach to simulate the socio-technical transitions of photovoltaics in Indonesia. The developed model integrates behavioral (i.e., psychological and social), technological factors, economic factors, and governmental regulation. Households decide on the adoption or non-adoption of PV, while firms make investments and optimize their supply chain to provide PV and its supporting service. The government provides regulation, economic incentives, or other interventions. The interactions among the households, the firms, and the government exist dynamically, which led to the selection of a hybrid simulation-optimization approach as a methodological approach for the present study. An integer linear programming used to determine the optimized PV supply chain configuration was embedded in a simulation model developed using agent-based modeling and simulation (ABM). The ABM simulates household decision-making which is dynamically influenced by the PV providers and governmental interventions. The empirical survey consisting of 413 respondents representing the population from all 34 provinces in Indonesia was collected in 2020. The developed hybrid model was then used as an experimental tool to evaluate potential interventions in further supporting PV uptake in Indonesia.
The mechanism underlying the dynamic pattern of PV adoption needs to be understood to formulate the effective and efficient interventions needed to accelerate PV diffusion. The adoption of renewable energy normally faces challenges due to individual heterogeneity [3], complex interactions [4,5], high initial investment costs, and imperfect information [6], sometimes leading to the emergence of irrational decision-making processes [7]. Aggregate models such as the Bass model [8], which generalize the diffusion process based on differential equations, cannot capture individual interactions [9], individuals’ heterogeneity, and the complex dynamics of social processes that shape the diffusion [10]. Therefore, ABM is a promising approach for simulating energy transitions due to its ability to model the decision-making of various stakeholders as well as interaction among stakeholders and with other environments [7]. As an innovation, the PV technology requires a high level of information regarding financing, installation, operation, and maintenance to facilitate its adoption. The existence of local solar companies plays an essential role in providing information to increase relative advantages and reduce the complexity perceived by potential adopters [6]. The absence of facilities within households’ reach is perceived as a lack of support from the industry for adoption, thereby impacting household decisions to adopt PV. This condition is in line with the findings of preliminary research, which stated that the absence of local solar company services hinders PV adoption in rural areas of India [11] and Indonesia [12]. Ideally, interventions should be targeted to both the demand and supply sides [13]. Therefore, the present study incorporates both demand (which is influenced by households’ decision-making) and supply (which is influenced by the network of PV supply chain) in the developed model. Most PV transitions have modeled the supply element exogenously [14,15]; therefore, this study aims to model the supply aspect endogenously, which interacts with the demand aspect. The novelty of the present study has lied in the development of an integrated model that addresses endogenously both the demand aspects involving psychological and social factors in decision-making and the supply aspects dealing with technical factors of PV infrastructures, in addition to governmental interventions. The study has also applied a hybrid simulation-optimization model of the PV system, which is still little explored in the existing PV literature.
The main contributions of this study are therefore as follows. Firstly, it provides an integrated model to address the supply and demands aspects of the PV transitions, thereby facilitating comprehensive perspectives on the energy transition of PV. Secondly, it developed a hybrid simulation-optimization model parameterized with the empirical data, which has not been developed in the previous literature on the PV transition. Thirdly, the study provides a practical contribution by providing a decision-making support tool to evaluate the potential interventions favoring PV adoption in Indonesia.
This research is organized as follows: Section 2 describes modeling energy transitions of photovoltaics, followed by a proposed methodological approach, an empirically based hybrid simulation-optimization, in Section 3. Section 4 provides the simulation results, closing with a critical evaluation of the methodological approach in Section 5 and a conclusion in Section 6.
2. Modeling Energy Transitions of Photovoltaics
Several studies have been conducted on modeling energy transitions. This section briefly reviews the existing PV literature on the influential factors of the PV transition and the approach to modeling its transition process.
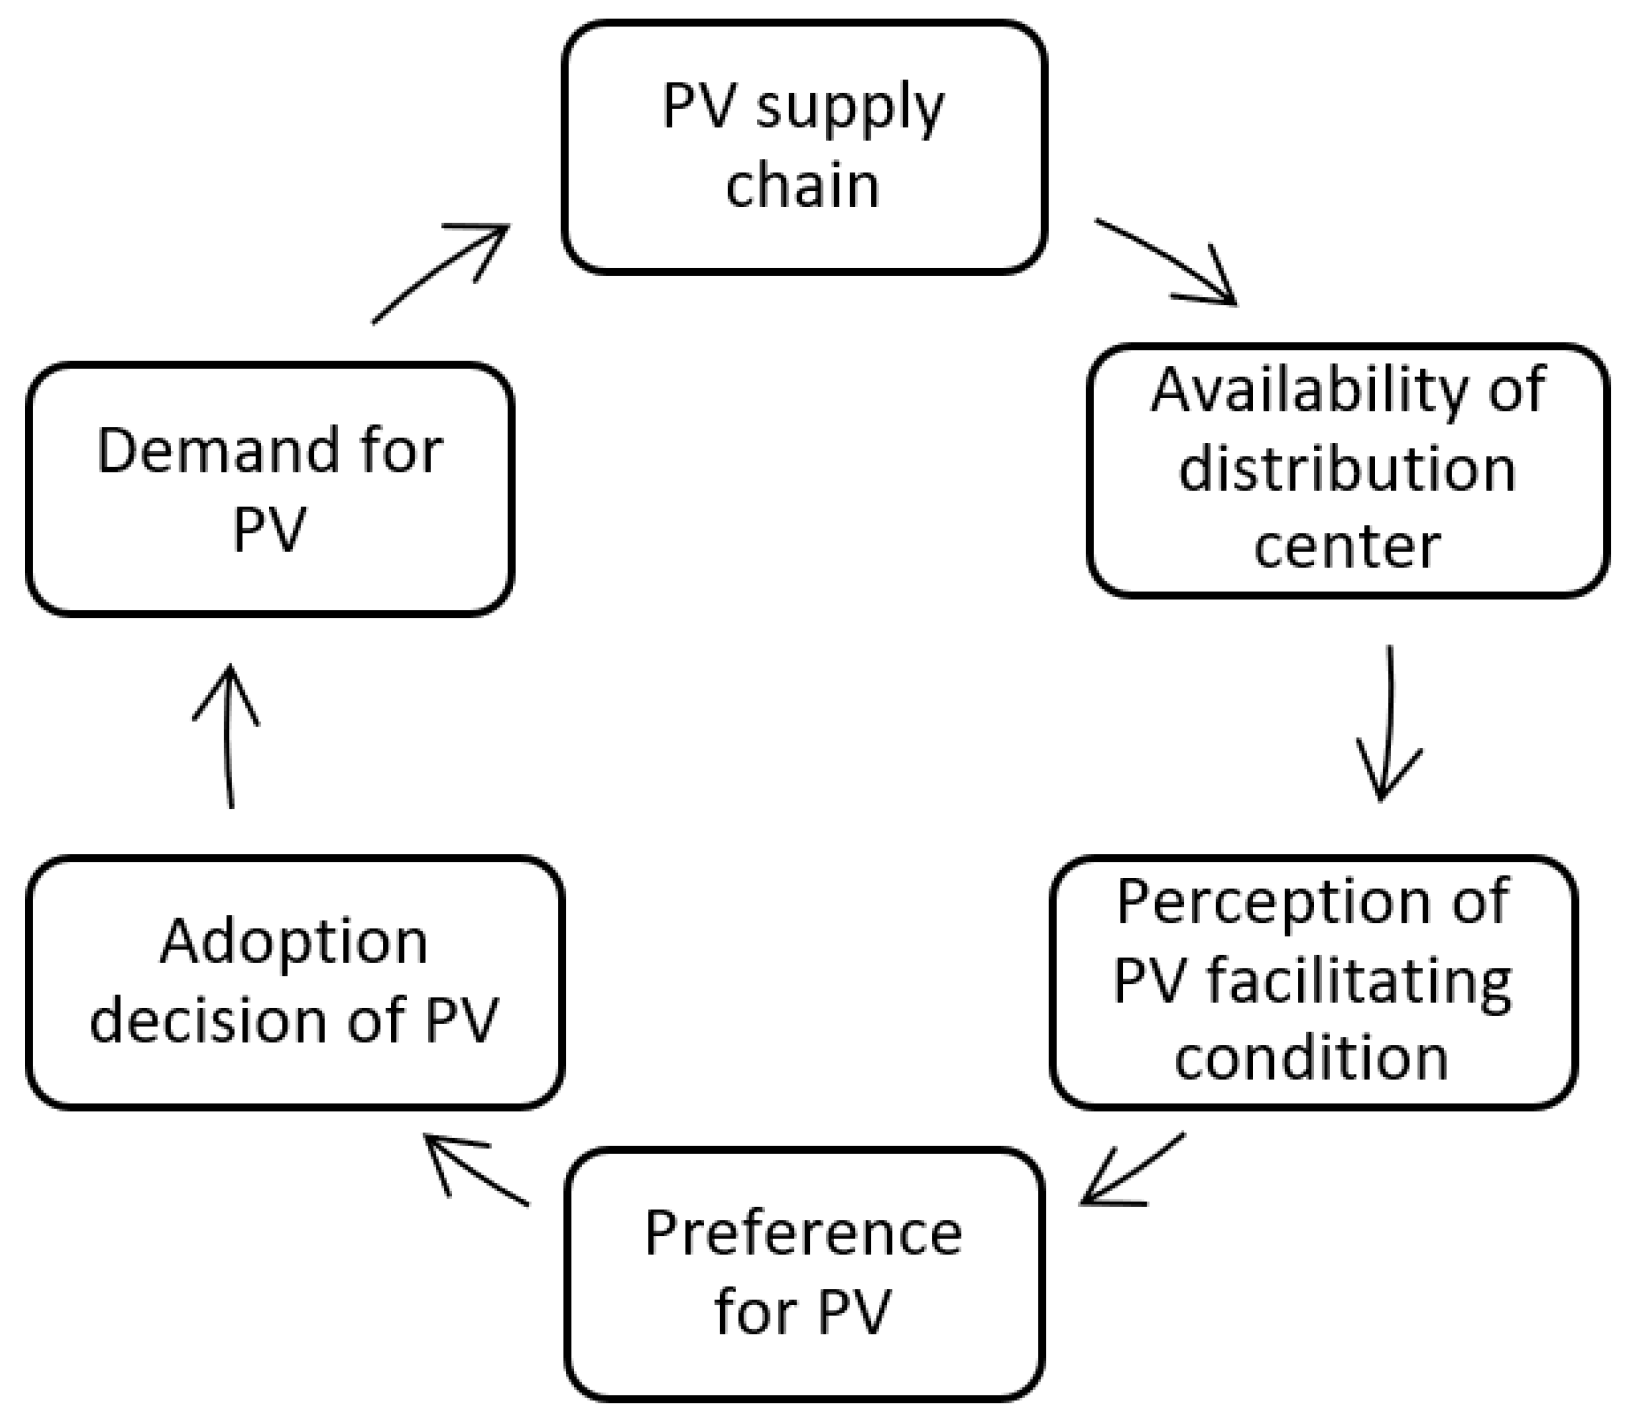
The adoption and diffusion model, which is widely used in modeling energy transition, generally focuses on two factors, i.e., attitudes and finances [16]. Numerous studies have analyzed the rate of PV adoption by considering both factors simultaneously in which financial factor was used as constraints in behavioral models [17]. Some studies such as Rai and Robinson [18] incorporated behavioral and financial factors in the adoption model to provide more opportunities to study each factor comprehensively. In PV adoption modeling, behavioral and financial factors have been discussed in many studies [19]. However, none of them evaluated the availability of supporting facilities from the PV firms. On the other hand, the sufficient availability of PV has been crucial in Indonesia [20], which explains the slow diffusion process. Figure 1 shows the relationship between the PV adoption decision and its supply chain. The PV firms normally use the estimated demands to plan and design the optimized supply chain to meet the demands. Their distribution center (DC) provides PV and its supporting services, thus creating confidence concerning PV systems’ reliability and easy access to households. These facilitating conditions directly influence actual behavior [21]. This is resonated by the Theory of Planned Behavior (TPB) [22], which modeled facilitating conditions as a direct antecedent of actual behavior. In this study, the adoption of PV depends on the available and easy services provided by PV firms. In turn, the supply chain configuration is influenced by the demand for PV. This phenomenon, indicating a chicken-egg problem, is illustrated in Figure 1.
The ABM approach has also been widely used to model residential rooftop solar PV adoption for policy evaluation, for instance, Zhang et al. [23] developed ABM combined with logistic regression considering net present value, house characteristics, and peer effects to investigate policies promoting PV in California, US. Palmer et al. [24] considered financial, income, environmental, and communication factors in simulating residential rooftop PV system diffusion. The ABM has also been used to evaluate distributed solar energy models [14], and various energy policies related to PV such as investment tax credits and feed-in tariffs on adoption [25] and net meter rates [26,27].
Due to the complexity of the PV system, a hybrid simulation approach has been applied in several PV studies to obtain a more detailed model structure, as opposed to a simplified structure commonly used in most policy models. A two-tier hybrid framework combining two simulation models, i.e., ABM and system dynamics, was developed to study the effectiveness of various policies (both incentives and regulations) on PV adoption in Arizona [25]. The high-level model used the agent-based model to simulate customer behavior in adopting a PV system by considering the payback period, income, neighboring effects, and advertising. The payback period was calculated at low-level modeling considering the hourly electricity consumption of individual households. To better represent the spatial aspect and social network, several studies have integrated GIS (Geographic Information System) within ABM to model social network structure and visualize the spatial pattern of the adoption [5,28].
In addition to the hybrid simulation model, the hybrid simulation-optimization approach has also been applied in some applications, such as for evaluating the optimized configurations of the electricity generation system. Bjelić and Rajaković [29] applied simulation-based optimization using EnergyPLAN and a generic optimization program (GenOpt) to obtain the optimized sustainable national energy system in terms of the total system cost. Similarly, Mahbub et al. [30] also used EnergyPLAN and an optimization approach of genetic algorithm (GA) to optimize energy configuration. However, different from Bjelić and Rajaković [29], Mahbub et al. [30] deployed a multi-objective GA that considered both total cost and carbon emission as conflicting objectives. Atabaki et al. [31] applied simulation and optimization which was combined with multi-criteria decision making in determining the weights of sustainability indicators, i.e., techno-economic, social, and environmental indicators. While the aforementioned studies used simulation-based optimization for national-scale energy planning, Hosseinalizadeh et al. [32] used a similar approach to obtain the optimized configuration of the stand-alone hybrid renewable energy system involving wind turbines, photovoltaic, and fuel cells. Moreover, the hybrid simulation-optimization model has been applied in the supply chain context. For instance, Sopha et al. [33] evaluated the dynamic optimal routing under uncertain demands. In PV studies, the approach has been implemented by Ramshani et al. [16] in modeling the optimal green roof and/or photovoltaic panel installation settings for a given building and used these technical factors in the attitudinal model, which considered demographic factors and household characteristics in Knoxville City (US). The developed model of the present study differs from that of Ramshani et al. [16] with respect to the developed model in which, instead of optimizing available options of PV settings in building at the micro-level, the present study optimizes the PV supply chain configuration at the macro-level. Moreover, the present study models the PV system on a nationwide scale in a developing country where the PV supply is found to be an issue [19], whereas Ramshani et al. [16] assumed that the different options of PV supply are already available, and the model was developed in a city level.
Whereas most previous PV studies have focused on the demand side, only very few studies have focused on the supply side of the PV system. Chen et al. [34] investigated the effect of the subsidy reallocation from households to the PV industry using the game theory approach, while Nasirov et al. [35] explored the income tax credits for construction companies installing a PV system. The present study models both supply and demand aspects as well as their interactions. Furthermore, the developed hybrid simulation-optimization approach used GIS data to represent real geographical locations which were crucial in modeling social influence and the PV supply chain.
3. Empirically Based Hybrid Simulation-Optimization Approach
This section describes the methodological approach in the present study, consisting of the hybrid simulation-optimization model and empirical data collection. This section is divided into five sub-sections: agent-based modeling and simulation of PV adoption decision, embedded optimization model of PV supply chain, performance indicators, verification and validation, and scenario development.
The hybrid simulation-optimization approach was selected due to the necessity to cover both supply and demand aspects endogenously in PV transition. The simulation is needed to address household heterogeneity and techno-economic aspects (bottom-up approach). On the other hand, the optimization model optimizes with the objective given constraints (top-down approach) [36], which is useful to evaluate an optimized PV supply chain.
The hybrid simulation-optimization model aims at understanding the mechanism underlying PV’s socio-technical dynamics and exploring potential interventions to support higher PV uptake. The model was developed in three stages: model specification, parameterization, as well as verification, and validation. The model specification was used to identify components through literature reviews and an empirical study. The literature review identified influential variables and their relationships to the adoption of PV technology. An empirical survey was conducted to obtain representative data for the population studied. The instrument for the survey was based on the Unified Theory of Acceptance and Use of Technology 2 (UTAUT2), a behavioral model that extends the traditional behavioral models to include more factors other than subjective norms [37,38]. From a practical standpoint, a rich understanding can help stakeholders in the PV industry to create more effective policies and more efficient programs [39,40]. The developed model addresses the decision-making process to capture psychological, financial, and technical factors to better represent households’ decisions.
Model parameterization refers to the process of selecting the values of the model parameter to reproduce the observed patterns in the real world. The direct calibration method was used in research where empirical data was directly used to parameterize initial conditions and model parameters. The model parameterization was based on the empirical survey conducted in November 2020 using 450 responses. However, 30 responses did not meet the requirements because they were not homeowners and decision-makers, and 7 responses provided incomplete responses to the key questions, hence, only a total of 413 responses were left for analysis. The respondents consisted of 46 PV users, and the rest had not used the PV system. A statistical test was conducted to evaluate whether the sample was equally distributed to all 34 provinces in Indonesia. Based on Central Statistical Agency (BPS) [41], the statistical test indicates non-significant difference between the sample distribution and Indonesian population (χ2 = 20.46; df = 33; p = 0.958). It indicates that the sample is well-represented by the population concerning provincial distribution. The model validation was conducted by comparing the simulation results with independent source. The empirical data used in model specification was different from that used for calibration, so that a self-evident model was avoided.
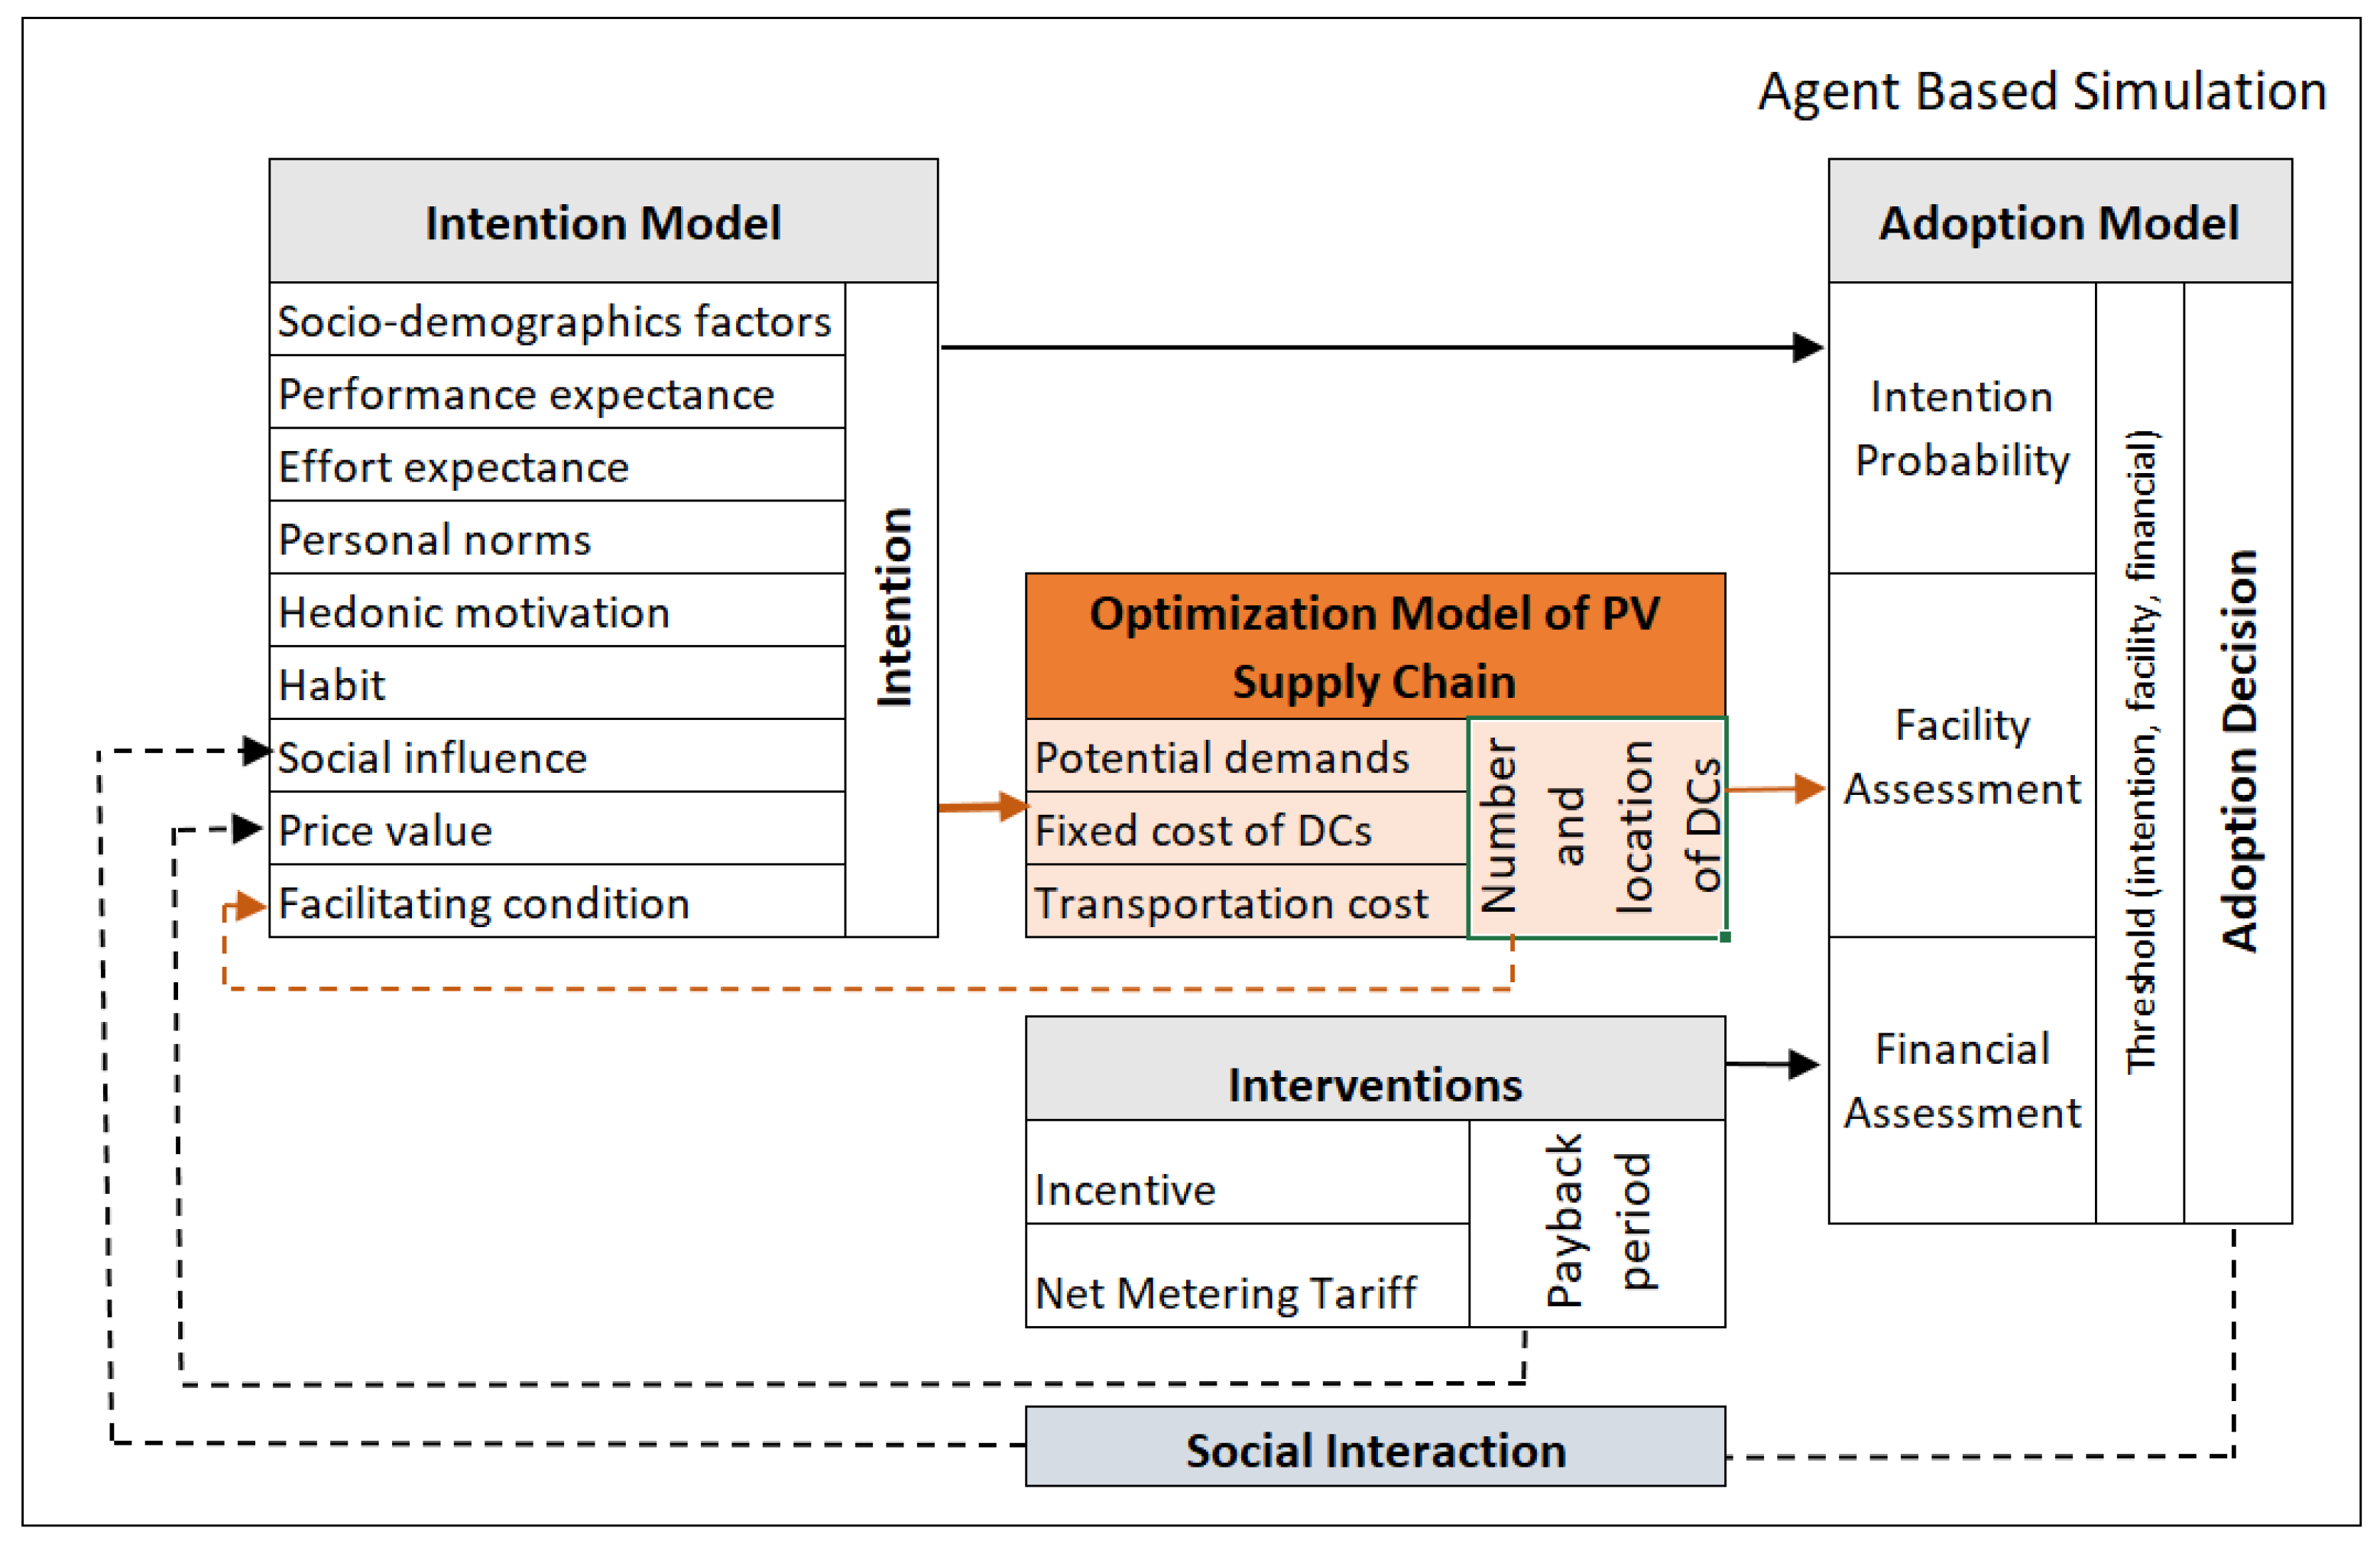
Figure 2 shows the conceptual framework of the hybrid simulation-optimization model indicating the model variables and their relationships. The optimization model, embedded in a simulation model, was used to optimize the PV supply chain network configuration. The simulation model simulates household adoption decision-making, which is influenced by the supply chain network configuration, the interventions, and the intention model.
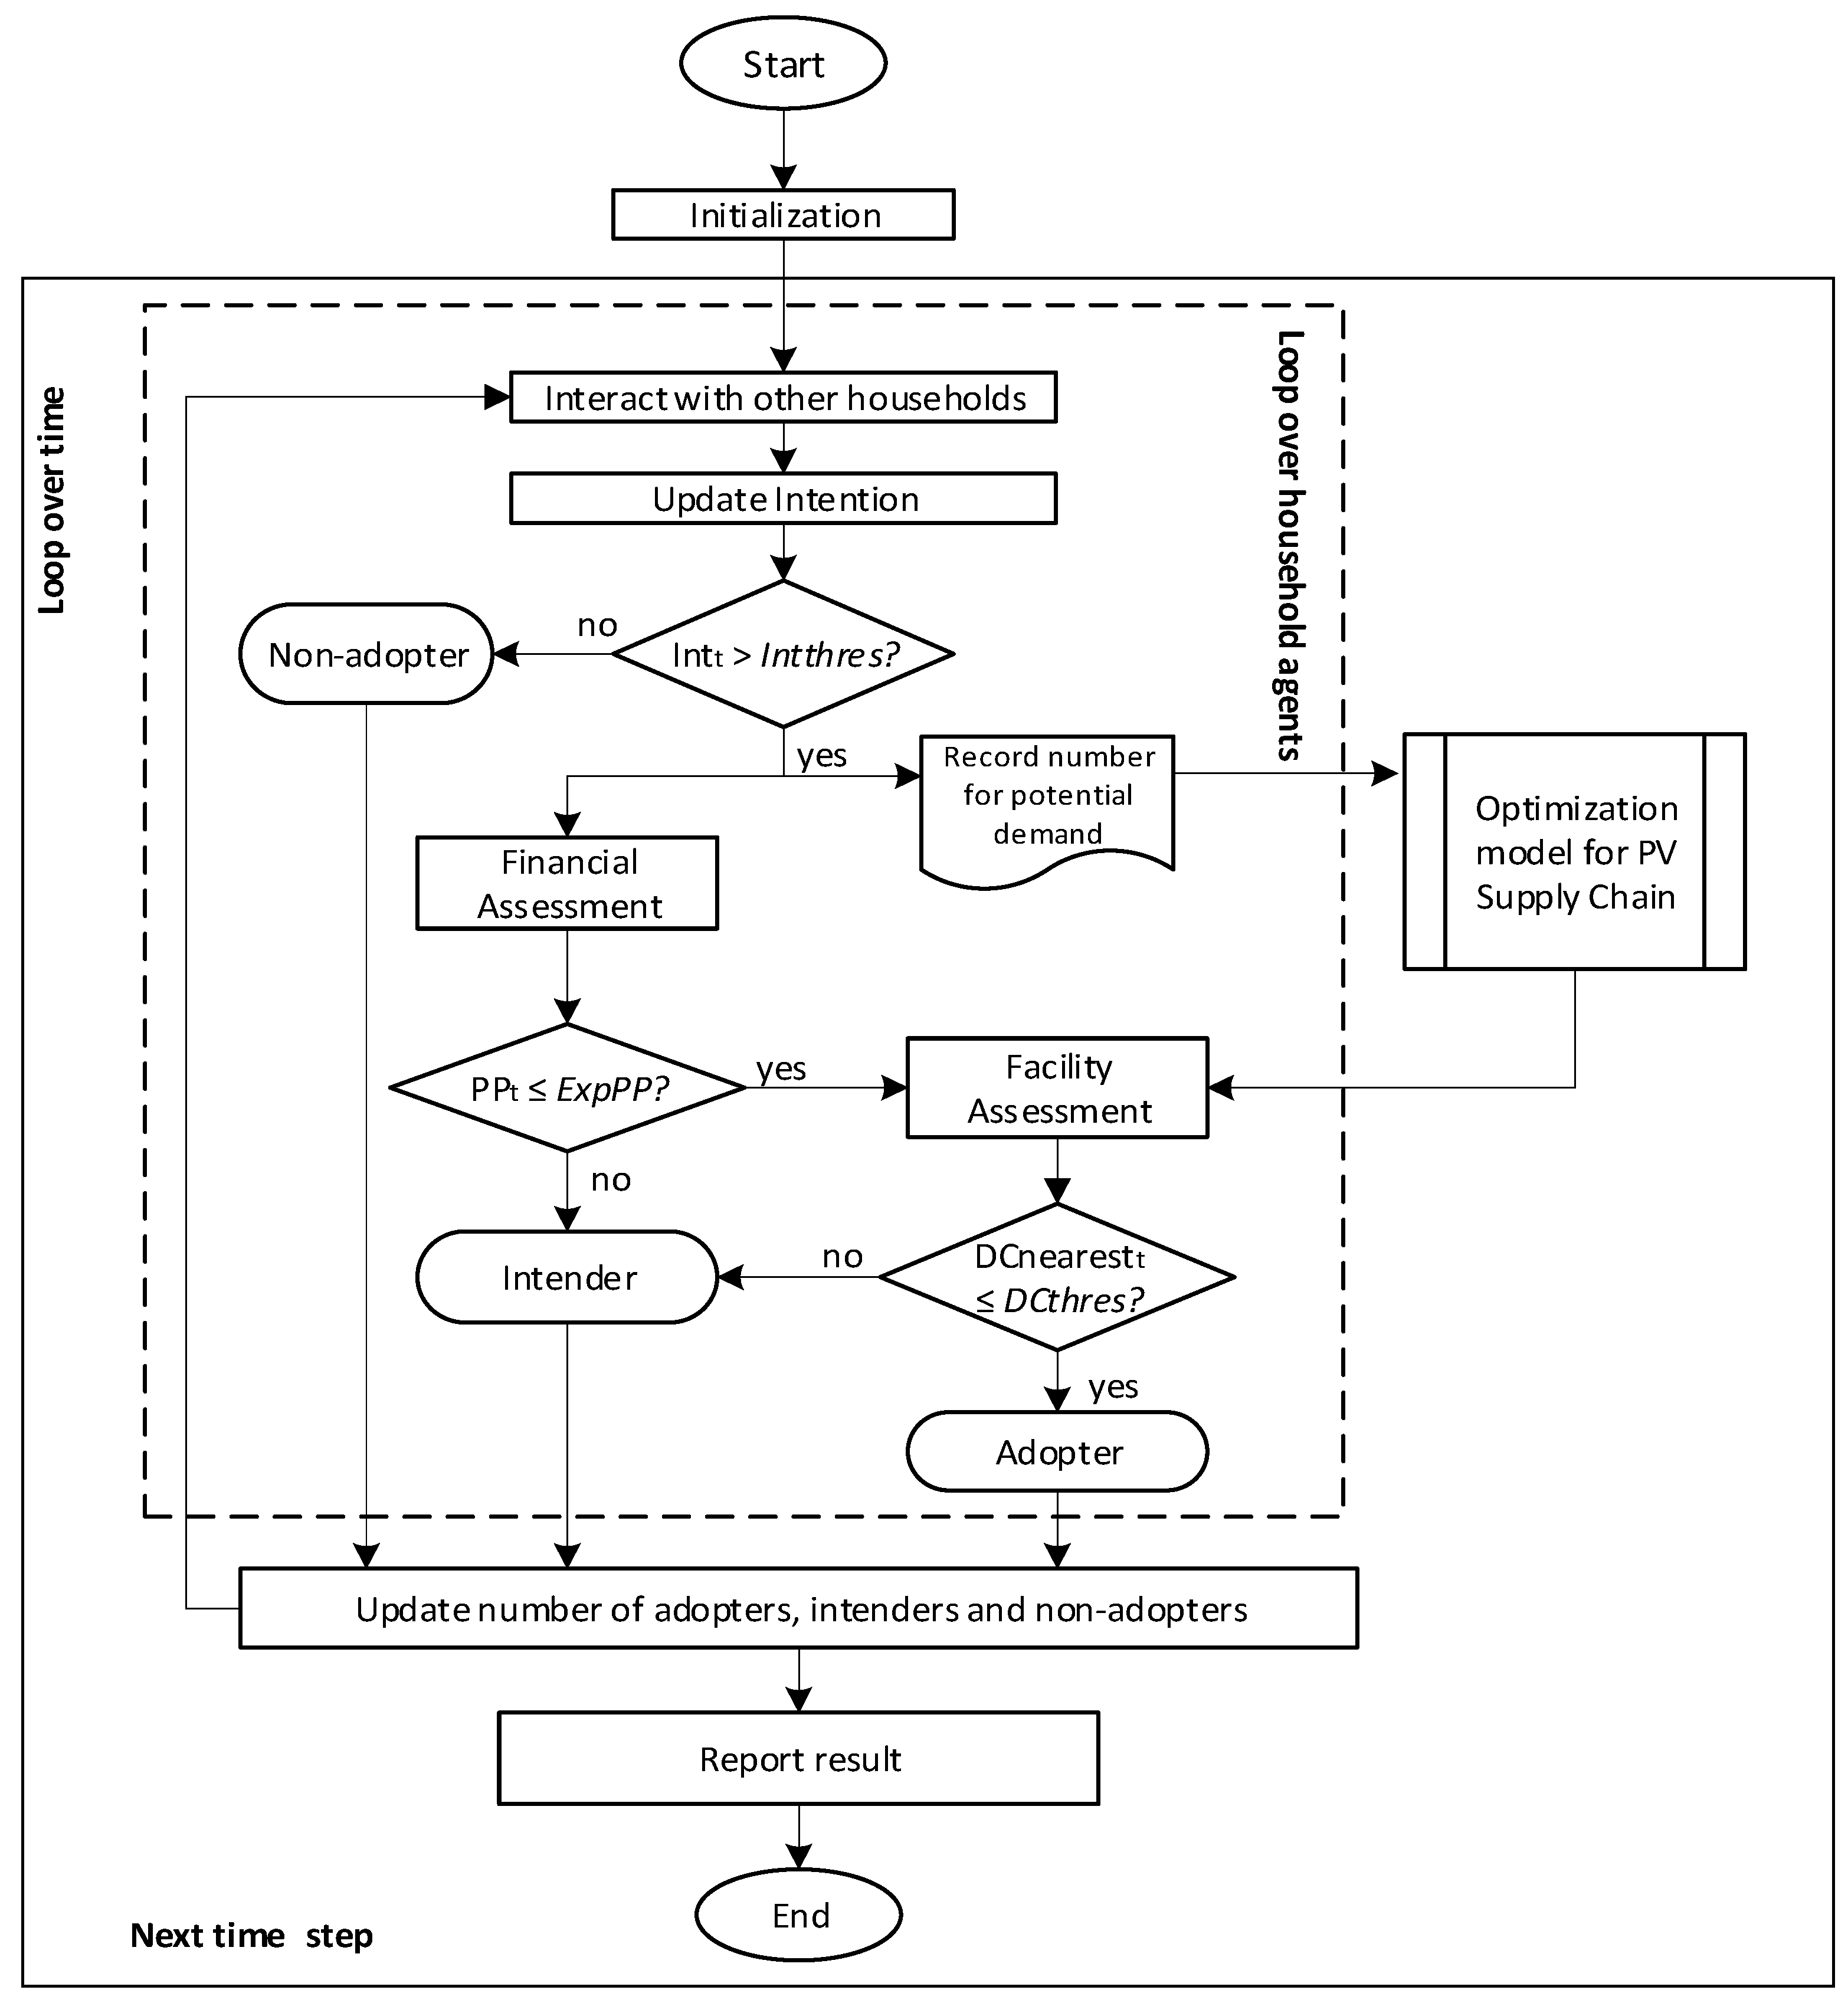
The conceptual framework was then implemented in the computer simulation based on the process scheduling as shown in Figure 3. The simulation starts with initialization to represent the condition in 2018, in which only 351 people adopted the PV system, corresponding to 5 household agents in the model. The household agents are placed in their geographical location. The PV Distribution Center (DCs) as PV and service providers are located according to their actual location. The electricity tariff is set based on the electricity price for the group of 1300 W and above, i.e., Indonesian Rupiah (IDR) 1445/kWh. PV investment cost is based on data from the International Renewable Energy Agency [42], which is recorded as much as USD 1375/kWp and USD 1154/kWp in 2018 and 2019, respectively, with a predicted decrease of 12% in subsequent years. The PV investment provisions refer to the MEMR (Ministry of Energy and Mineral Resources) Regulation No. 49 of 2018, which enables rooftop PV users to install up to 100% of their grid-installed capacity.
At each time step, each household interacts with others in their social network. The interactions may influence their intention to adopt the PV system. The study categorizes the households into three PV adoption states, i.e., adopter, intender, and non-adopter. According to Bondio et al. [43], adopters are homeowners who have adopted the PV system, and intenders are those willing to buy it for at least the next three years. Meanwhile, the non-intenders are households without plans to purchase and use the PV system. The intention of households toward the PV system is updated every time step. The number of households with intention larger than its threshold is used to estimate potential demand and fed into the optimization model. The results of the optimization model are recorded and used as an input into the adoption model. The households then perform financial and facility assessments. If both assessments meet their criteria, the households turn to the adopter; otherwise, they become intenders. Each household decision is recorded, and the number of adopters, intenders, and non-adopters is reported.
3.1. Agent-Based Modeling and Simulation of PV Adoption Decision
The agents in the model are households that are indecisive about adopting the PV system. Table 1 shows the variables of the household agents. There are two types of household agent variables, namely static and dynamic. Static variables do not change during the simulation, whereas dynamic variables change over time in some fashions, due to time change and/or change of other variables.
The behavioral model of adoption decision-making is based on UTAUT2 developed by Venkatesh et al. [44]. UTAUT2 has its roots in UTAUT [21], a behavioral model for identifying factors underlying technology adoption [40]. UTAUT was synthesized from the previous eight theories of diffusion namely Theory Reasoned Action [45], Technology Acceptance Model [46], Theory of Planned Behavior [47], Combined TPB-TAM [48], Motivational Model [49], Model of Personal Computer Utilization [50], Innovation Diffusion Theory [51], and Social Cognition Theory [52]. Therefore, by integrating these eight theories, it is found that performance expectance, effort expectance, social influence, and facilitating conditions influence intention directly, whereas intention is a direct predictor of adoption behavior [21]. The notable refinement in UTAUT2 is to evolve the model toward the use context by adding three constructs, i.e., hedonic motivation, price values, and habits, as other direct predictors of intention.
The UTAUT model was used to analyze the relationship between price value, social influence, and facilitation conditions on intentions of non-PV users in Malaysia, and the construct explained PV adoption in residential areas adequately [53]. The UTAUT2 has been used to build a quantitative model to identify factors and their relative impact on the purchase intention of domestic rooftop PV buyers in India [54]. Due to its comprehensiveness in addressing potential factors explaining PV adoption, the UTAUT2 was selected as a theoretical basis for PV adoption decision making by Indonesian households which are to be implemented in the present study. Given that personal norms also play a role in explaining environmental behavior in the Indonesian context such as demonstrated by Sopha [55], the present study has extended the UTAUT2 to include personal norms as a direct determinant of intention. Personal norms have been evidenced as influential factors in explaining PV adoption in some studies [3,56]. The description of each construct in this study is shown in Table 2. In addition, socio-demographic variables such as age, income, education, and electricity access were also considered in the model.
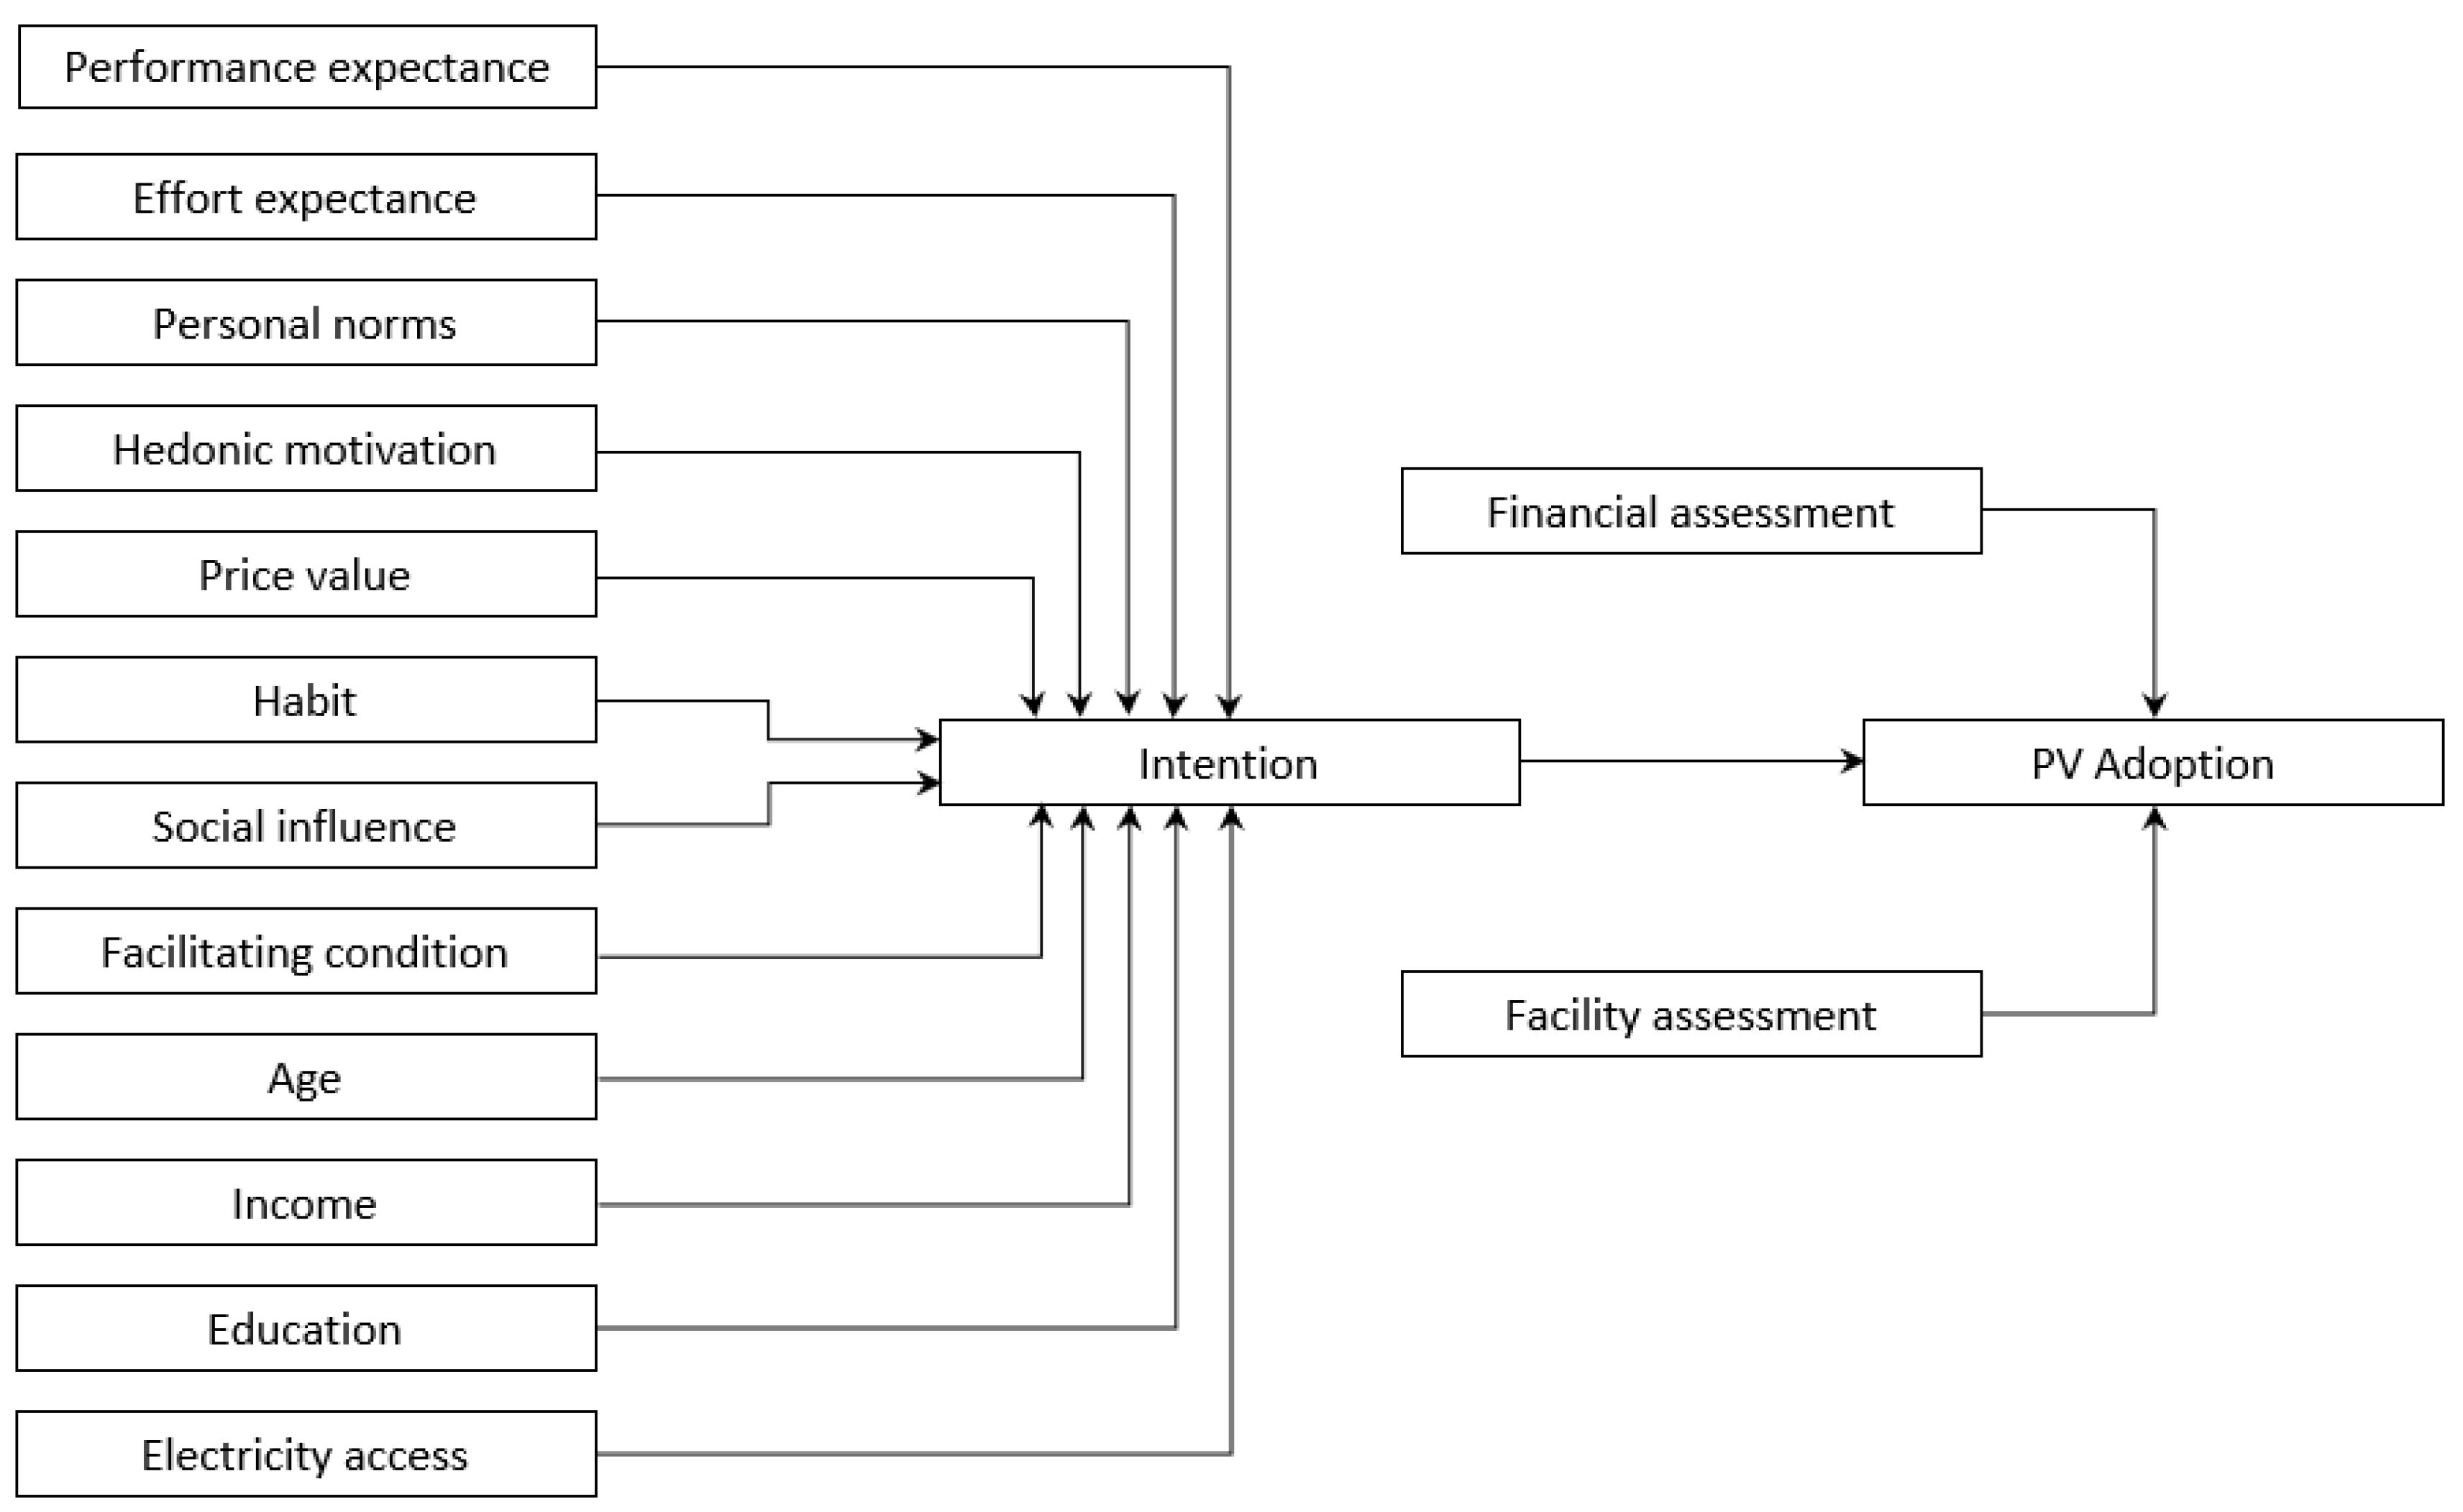
Several studies have shown that intention is not corresponding to actual behavior [4,43], rather the adoption behavior is also influenced by facilitating conditions that may favor or hinder the intention [21,44]. Facilitating condition is defined as the individuals’ perception of the resources and support available to perform a behavior [21]. Furthermore, Klöckner et al. [57] identified that structural/facilities, economic, effort, time consumption, low consumer efficacy, and lack of trustworthy and relevant information were the most important barriers to energy efficiency. The PV firms providing PV infrastructure influence household agents in terms of the perceived relative advantage and complexity of using the PV [58], implying that PV availability controls the adoption behavior. In addition, perceived affordability is often cited as the most critical barrier to adoption [59]. According to Vasseur and Kemp [60], financial aspects require in-depth analysis, with the financial assessment conducted to control an individual’s ability to perform behavior using the PV system. Subsequently, both facility assessment and financial assessment are direct predictors of PV adoption, in addition to the intention. Figure 4 presents the households’ decision-making on PV adoption developed in the present study.
The intention was evaluated using logistic regression based on Equation (1) using the factors specified in the household adoption decision-making in Figure 4. Due to its ability to statistically compare two discrete categories [61], logistic regression was selected. The coefficients of the regression were obtained from the empirical survey and presented in Table 3. Performance expectance, personal norms, price value, social influence, facilitating conditions, and age, are found to be statistically significant to influence the intention to adopt PV. The implementation of these variables in the model is discussed in the following.
As specified in Table 1, some variables such as effort expectance, personal norms, hedonic motivation, habit, income, education, and electricity access are static during the simulation, whereas performance expectance, price value, perceived facilitating condition, social influence, and age are updated every time-step, which is discussed as follows.
Performance expectance (PEt) represents the perceived benefits of saving electricity bills due to the use of PV, which is influenced by the export tariff. The performance expectance at time = 0 (PE0), which varied among the household agents, was acquired from the survey. According to the current regulation, the current export tariff, which was used as a basis, is 65%, indicating the reduction percentage of an electricity bill due to electricity export to the PLN grid. Every 1 kWh of PV electricity exported to the PLN grid, will be valued at 0.65 kWh. The PEt is updated when the change of export tariff exists, otherwise, it does not change. When the change of export tariff occurs, the PEt is updated following Equation (2), in which the performance expectance is set to its maximum value of 10 when the export tariff is larger or at least similar to the expected export tariff (ExpTariff), otherwise, the performance expectance is gradually increased based on the gap between actual and expected export tariff.
Price value (PValt) is defined as the perceived investment cost of PV at time t, in which the value changes with the change of PV investment cost (PVcostdecreaset), which is influenced by the economies of scale—the more PV is produced, the less the investment cost for PV. The perceived investment cost of PV at the start of the simulation (PVal0) and the expected cost decrease (ExpPVcostdecrease), which are heterogeneous among the household agents, were obtained from the empirical survey. The PValt value of 10 indicates that high perceived investment cost, whereas the PValt value of 1 indicates a low perceived investment cost, achieved when the PVcostdecreaset is equal to or larger than ExpPVcostdecrease. The perceived investment cost for PV changes over time due to the cost decrease of PV, which is evaluated using Equation (3) as the following,
Facilitating Condition (FCt) corresponds to the perceived facilitating condition at time t, which varies over time depending on the availability of PV facilities, i.e., DCs with their role to provide information, services, procurement, installation, and maintenance of PV. According to Palm [62], getting a trusted, professional, and competent installation company is currently a demand for PV adoption. At every time step, the household agent evaluates the presence of the nearest DCs, which are obtained from the optimization model. The FCt becomes a maximum value of 10 when the household agent can find the nearest DCs within its threshold distance (DCthres). Otherwise, the FCt is gradually decreased based on the actual and preferred DC location. Assuming that FC0, which was acquired from the empirical survey, is the perceived facilitating condition at the start of the simulation, and DCnearest0, based on existing DCs, is the nearest DCs at the start of the simulation, the FCt is then evaluated using Equation (4) as follow,
Social influence (SI) may also change, depending on the interactions of the household agents with other agents in their social network. The number of peers and the social network structure is used to quantify the SI, which is measured using the percentage of peers in the network who has already used the PV system. The number of peers was obtained from the empirical survey and the structure of the social network follows a small-world network structure in which the household agents interact with other households within spatial proximity and other households with similar attributes. Roger [51] stated that individuals usually interact with people living nearby (neighbors) and other people with similar attributes such as social status, beliefs, education, and others [51]. Another dynamic variable, age (At), changes every time step. Given that each time step in the simulation represents one month, the age is updated by adding the factor of 1/12.
When the household agent has its intention (Intt), which exceeds its intention threshold (Intthres), the household agent will evaluate both financial assessment and facility assessment. The procedures for financial assessment involve the calculation of electricity generated by PV (EPVt), annual cash flow at time t (Rt), investment cost for PV (I0), and eventually the NPV. The amount of electricity generated by the PV (EPVt) is a function of the capacity factor (CF), which was set to 16% based on IRENA [38]; therefore, in one year the PV production becomes:
EPVt = PVcapt × CF × 24 × 365
The annual cash flow Rt consists of two components Rsavet and Rmaint. Rsavet includes the benefits derived from PV installation, such as the decrease in electricity bills due to the direct use of the electricity generated by the PV and the income from selling the extra ones generated at the national electricity grid. Rmaint is the estimated annual maintenance cost of the PV, approximated as a certain percentage m of I0, which was set to 1%. Estimated savings are a function of the amount of electricity generated by the PV (EPVt), its percentage output directly used by households (Du), the price of electricity from the utility (PEl-import), and the selling price of PV electricity to the power company according to applicable policies (PEl_export).
Rt = Rsavet − Rmaint
Rsavet = EPVt (Du × PEl-import) + ((1 − Du) × PEl_export
Rmaint = m × I0
The investment costs (I0) are the product of the PV capacity (PVcap) and the price installed per kWp of the PV system (PVP) following Equation (9).
The NPV is evaluated as the sum of the discounted cash flows (Rt) of the PV system, given the initial investment costs (I0) and the interest rate (i) following the equation below,
The payback period (PPt) is defined as the year (t) when Net Present Value (NPV) turns from negative to positive. If PPt ≤ expected payback period (ExpPP), the value of financial assessment is set to 1, indicating worthy investment, and 0 otherwise, following Equation (11).
For facility assessment, the optimization model has evaluated the new configuration of the PV supply chain network. The household agent then evaluates the nearest DCs. When the location of the nearest DCs is within its preference, the value of facility assessment is set to 1, and 0 otherwise, following Equation (12).
The adoption decision is then evaluated based on intention, financial assessment, and facility assessment, according to the framework in Figure 4. The household agents evaluate intentions using Equation (1). If the intention value is less than its threshold, the household agents become non-adopters. Otherwise, the household agents carry out facility assessment and financial assessment. Following Equation (13), the household agents become adopter when both facility assessment and financial assessment are equal to 1, indicating that the household agent would receive sufficient support and profitable investment respectively, otherwise the household agent becomes intender.
The number of adopters, in turn, affects social influence. In addition, the number of intenders is regarded as potential demand for the PV supply chain, which is discussed in Section 3.2. The agent-based simulation was implemented using Netlogo [63].
3.2. Embedded Optimization Model of PV Supply Chain
The optimization model of the PV supply chain aims to determine the optimized PV supply chain with respect to the number and the location of DCs for the PV system. The integer linear programming using the Fixed Costs Capacitated Facility Location model (FC-CFLM) was developed to evaluate the optimal settings that minimize distribution costs in a two-echelon PV supply chain, which includes PV manufacturer—distribution center (DC)—household agents. The optimization model considers three different capacities of DCs, i.e., low (2500 kWp), medium (5000 kWp), and large (10,000 kWp). Higher capacity exhibits economies of scale. The medium DC has twice the capacity of the small size with a fixed cost that is less than twice of the small DC, while the large DC is quadrupled at a fixed cost of only three times the small DC. The objective of FC-CFLM is to minimize the total fixed costs associated with opening DCs and the transportation cost from manufacturers to DCs and from DCs to household agents. The fixed cost is a one-time expenditure that varies with the capacity, whereas the transportation cost is based on distance and transported quantity. The notations used in the mathematical model are shown below,
- Sets:
- K: set of all household agents with intention (Intt) larger than the threshold (Intthres) indexed with k
- J: set of all DC candidates indexed with j
- C: set of the capacity of DCs indexed with c
- I: set of manufacturers indexed with i
- T: set of the period (year) indexed with t
- Parameters:
- Fjc: Fixed cost for opening DC j with capacity c
- Cij: Transportation cost from the manufacturer i to facility/DC j
- Cjk: Transportation cost from DC j to household k
- Wjc: Capacity of DC jc
- Si: Capacity of manufacturer i
- dkt: Demand of household agent k in period t
- Decision variables:
- Yjc: A binary variable that is equal to 1 if DC j with capacity c is open, otherwise zero.
- Xijt: The number of products shipped from manufacturer I to facility/DCj in period t
- Zjkt: The number of products shipped from DC j to household k in period t.
The FC-CFLM is formulated as the following:
- Objective function
- Subject to
The objective function in Equation (14) minimizes the total supply chain cost. The first part is the fixed cost for opening DCs. The second is the transportation cost from the factory to the DC, while the third is the transportation cost from DC to the household. The first constraint in Equation (15) ensures that the quantity shipped from plants i to all DCj in period t does not exceed the supply capacity of factory i. Equation (16) ensures that the number of products sent to all k households from DCj in period t does not exceed the capacity. Meanwhile, Equation (17) ensures that in period t, the number of products sent from DCj to all households K does not exceed the number of goods sent from all manufacturers. Equation (18) constraints that the number of products sent from all DCj to K household agents needs to be equal to the demand of k household agents. Equation (19) ensures Yj becomes DCj when it is opened and 0 when closed. Equation (20) is a non-negative constraint. The optimization model is solved using OpenSolver [64].
The number of households who have intention larger than its intention threshold was entered into the optimization model as dkt variable. The optimization model results in the optimized number and location of DCs to meet the predicted PV demand. The optimized DCs are then set into the simulation model. The procedure is iterated at every time step.
3.3. Performance Indicators
Three performance indicators, i.e., adoption rate, supply chain unit cost, and total greenhouse gases (GHG) reduction were applied to represent the socio-technical, financial, and environmental performance of the PV system. The adoption rate was measured based on Equation (21).
where a ∈ A, the set of household agents with PV adoption state (Adoptt) equal to adopter. The financial performance was measured by supply chain unit cost corresponding to the supply chain cost for every 1 kWp of the installed PV system, which was calculated using Equation (22).
The total supply chain cost is calculated based on Equation (14). Accumulated PVcapt represents the accumulated installed PV system.
The environmental performance was measured by evaluating the potential reduction of GHG following Equation (23). The GHG emission factors based on life-cycle assessment (LCA) for the Indonesian context were acquired from Wiloso et al. [65] who calculated that coal power plants, the dominant electricity power plants in Indonesia, releases GHG emissions of 1.12 kgCO2-eq/Wh and Widiyanto et al. [66] who estimated that PV generated GHG emissions of 0.053 kg CO2-eq/Wh. EPVt corresponding to the electricity generated by the PV system was calculated based on Equation (5).
3.4. Verification and Validation
Verification is to ensure that the model has been implemented following the intended operational procedures and does not contain errors. Two verification techniques, i.e., a structured debugging walk-through and unit testing, were applied. The structured debugging walk-through was conducted through code checking, whereas unit testing was carried out by gradually analyzing a sequence of functions, procedures, and sub-models for overall simulation [67]. Validation is aimed at assessing the ability of the model to represent the real-world system. The developed model was validated with respect to the conceptual model, data, and output. The developed model has been based on strong and valid theoretical models, which were then parameterized with the empirical data relevant to the studied case. All the data was acquired from the empirical survey, and none was estimated.
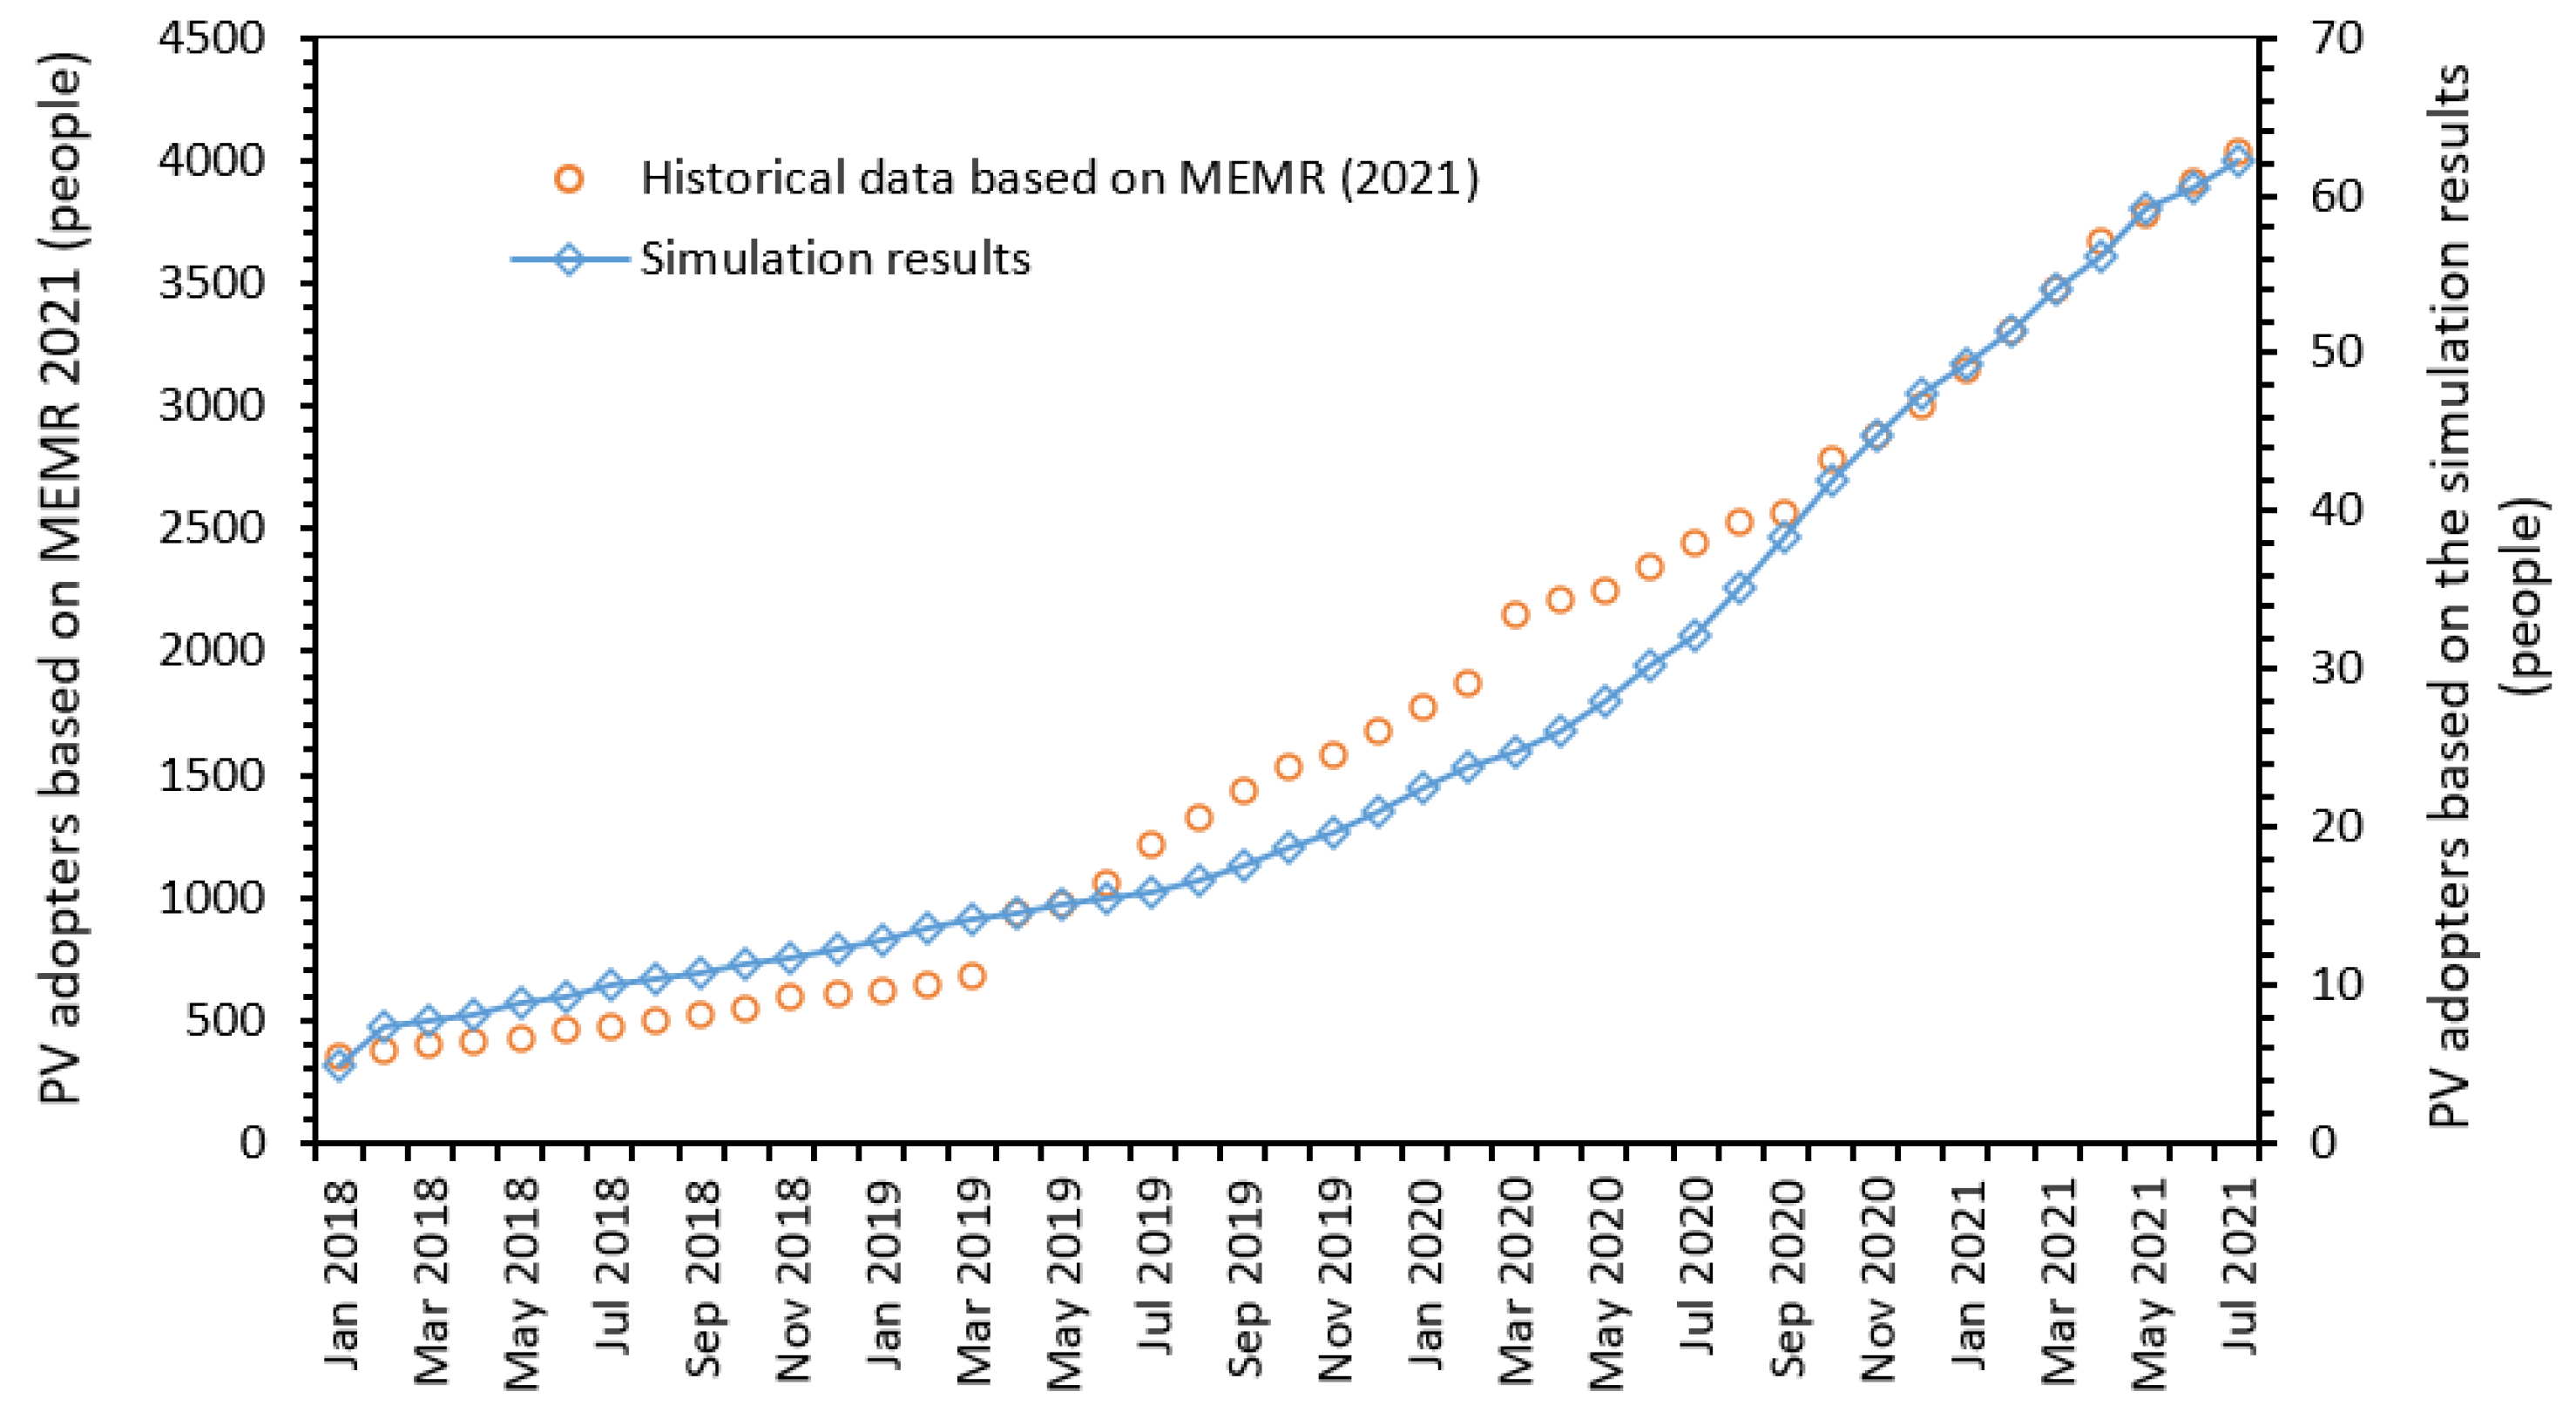
The model output was validated at both the macro and micro levels. In terms of macro validation, Figure 5 shows a non-significant difference between the simulation results of the PV adopters and the actual PV on-grid users from the MEMR [2] from January 2018 to July 2021 (t = −0.005, df = 42, p = 0.996).
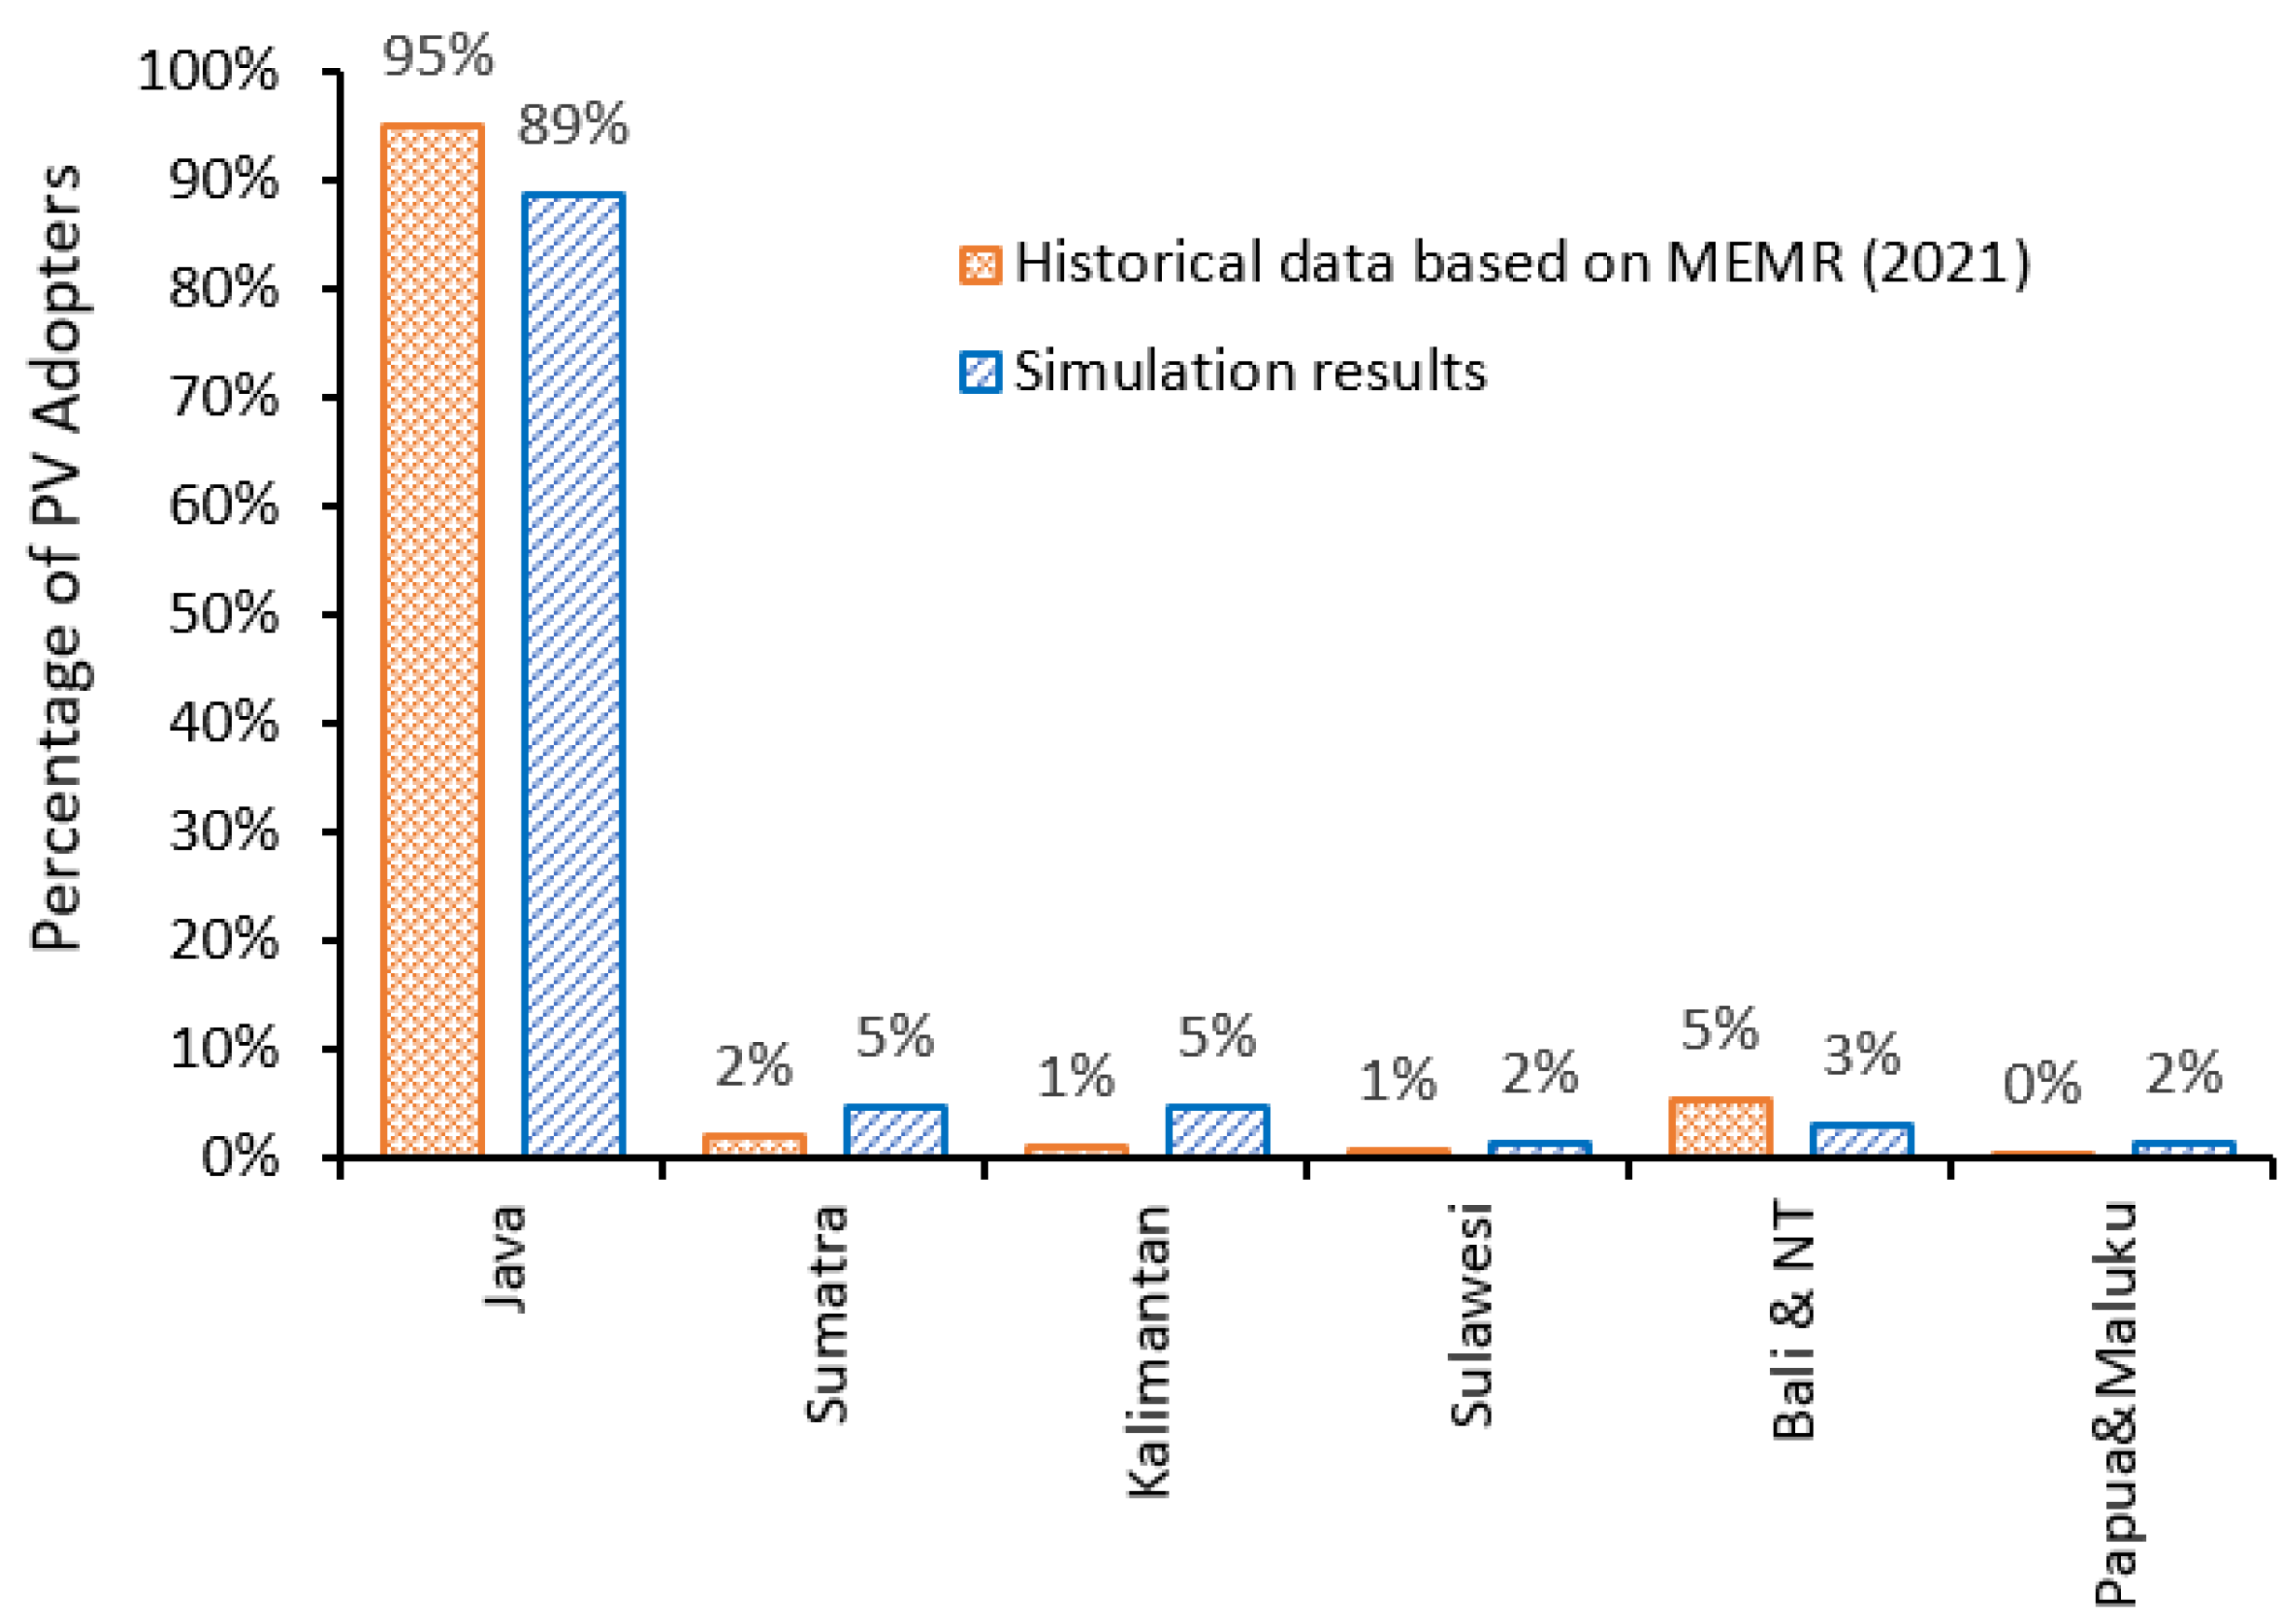
At the micro-level, a validation test was conducted to evaluate the distribution of PV adopters at the end of 2021 concerning the geographical region, as shown in Figure 6. Statistical analysis indicates the non-significant difference in the geographical distribution of the PV adopters between the simulated data and the actual data according to MEMR (χ2 = 7835; df = 5; p = 11.070). Thus, the hybrid model has been able to reproduce the pattern of historical data of PV users both at the macro and micro levels.
3.5. Scenario Development
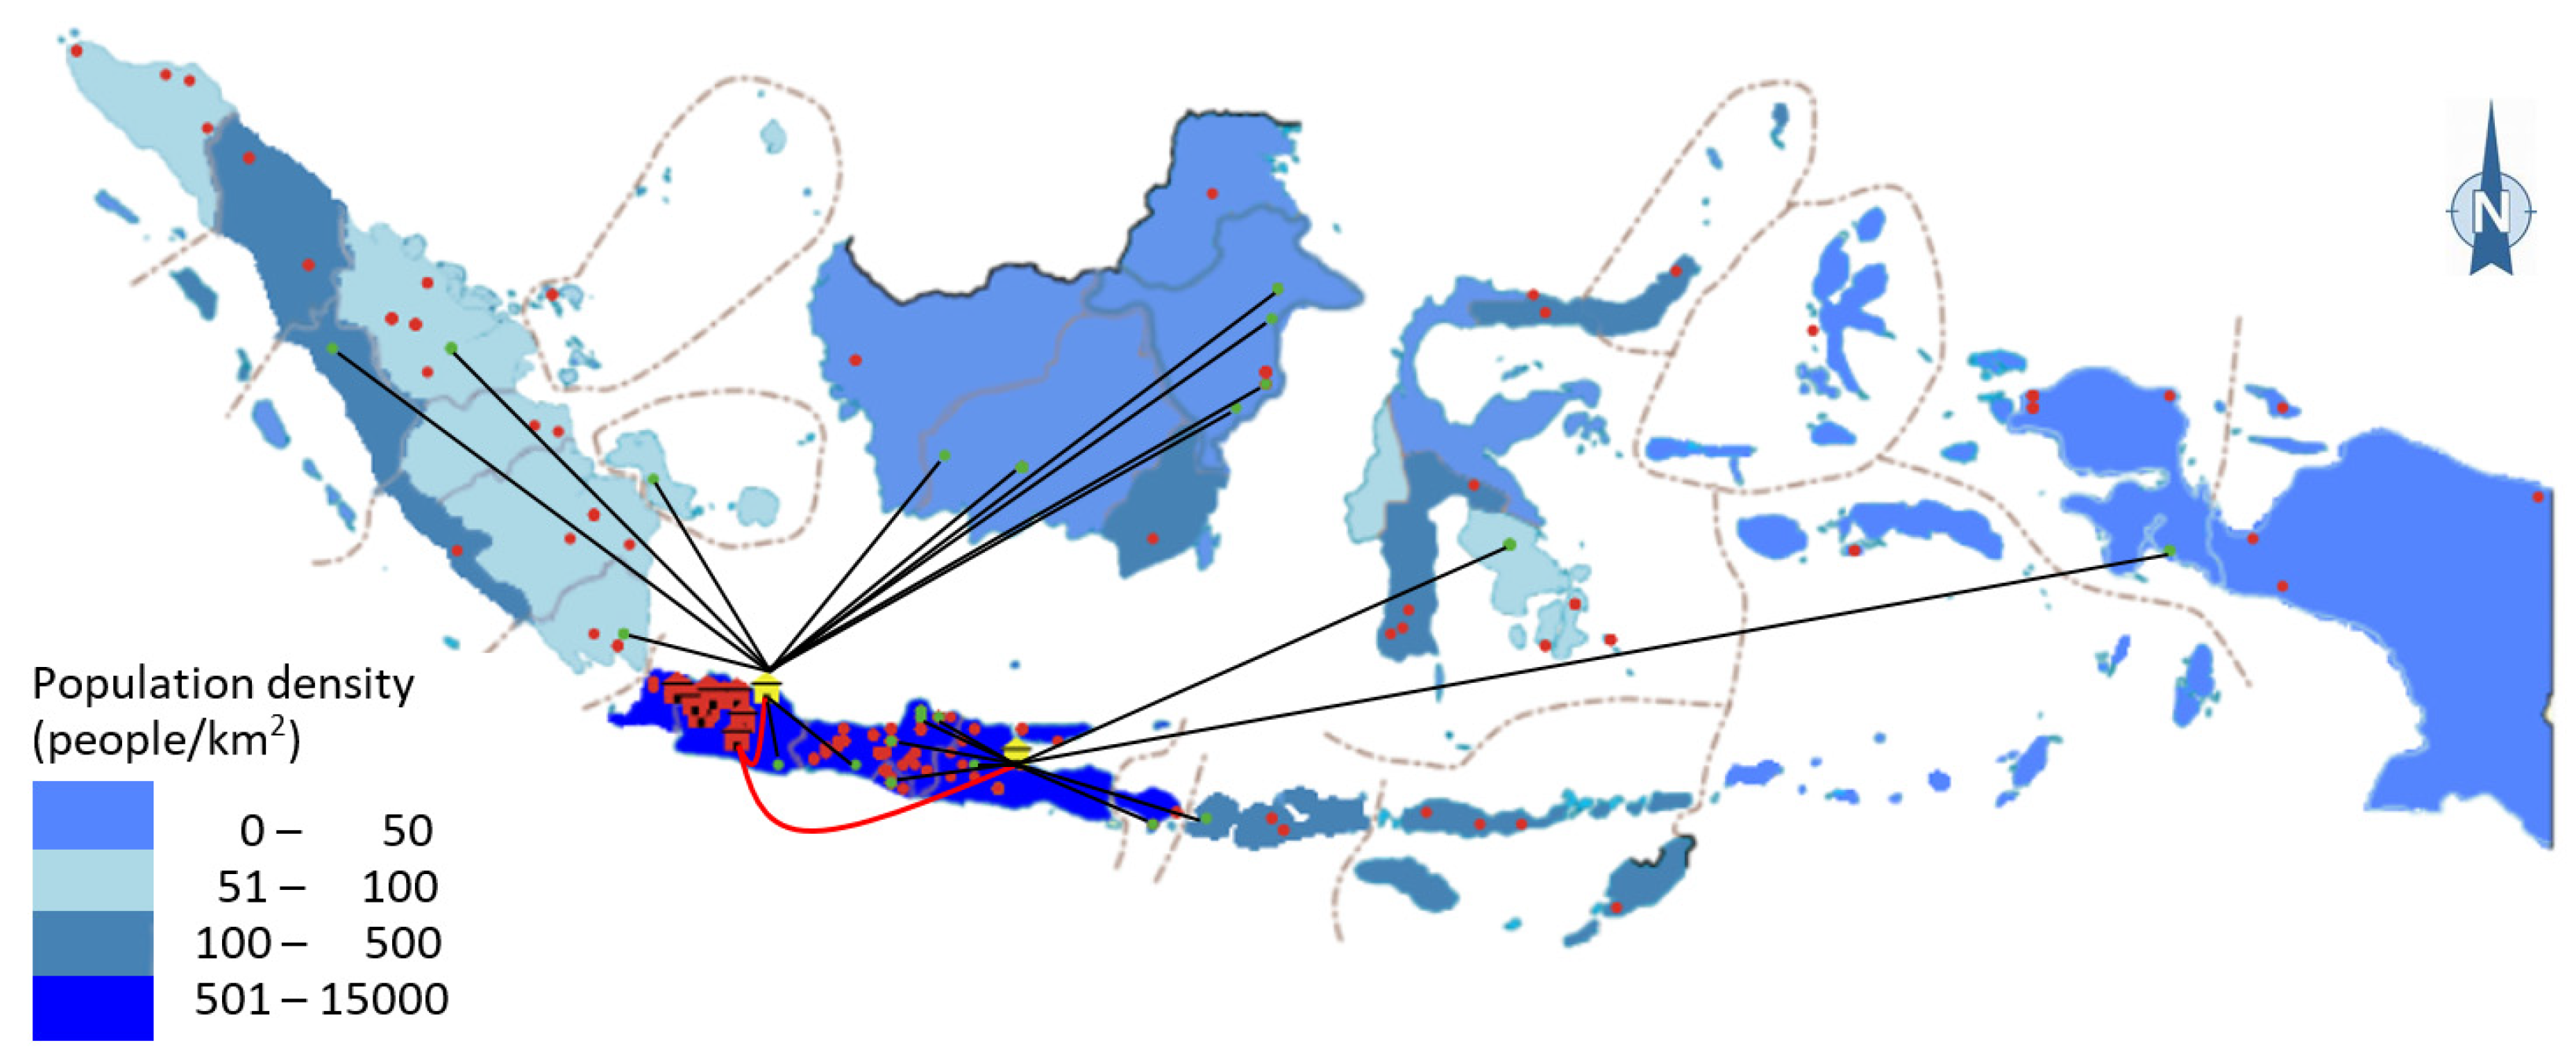
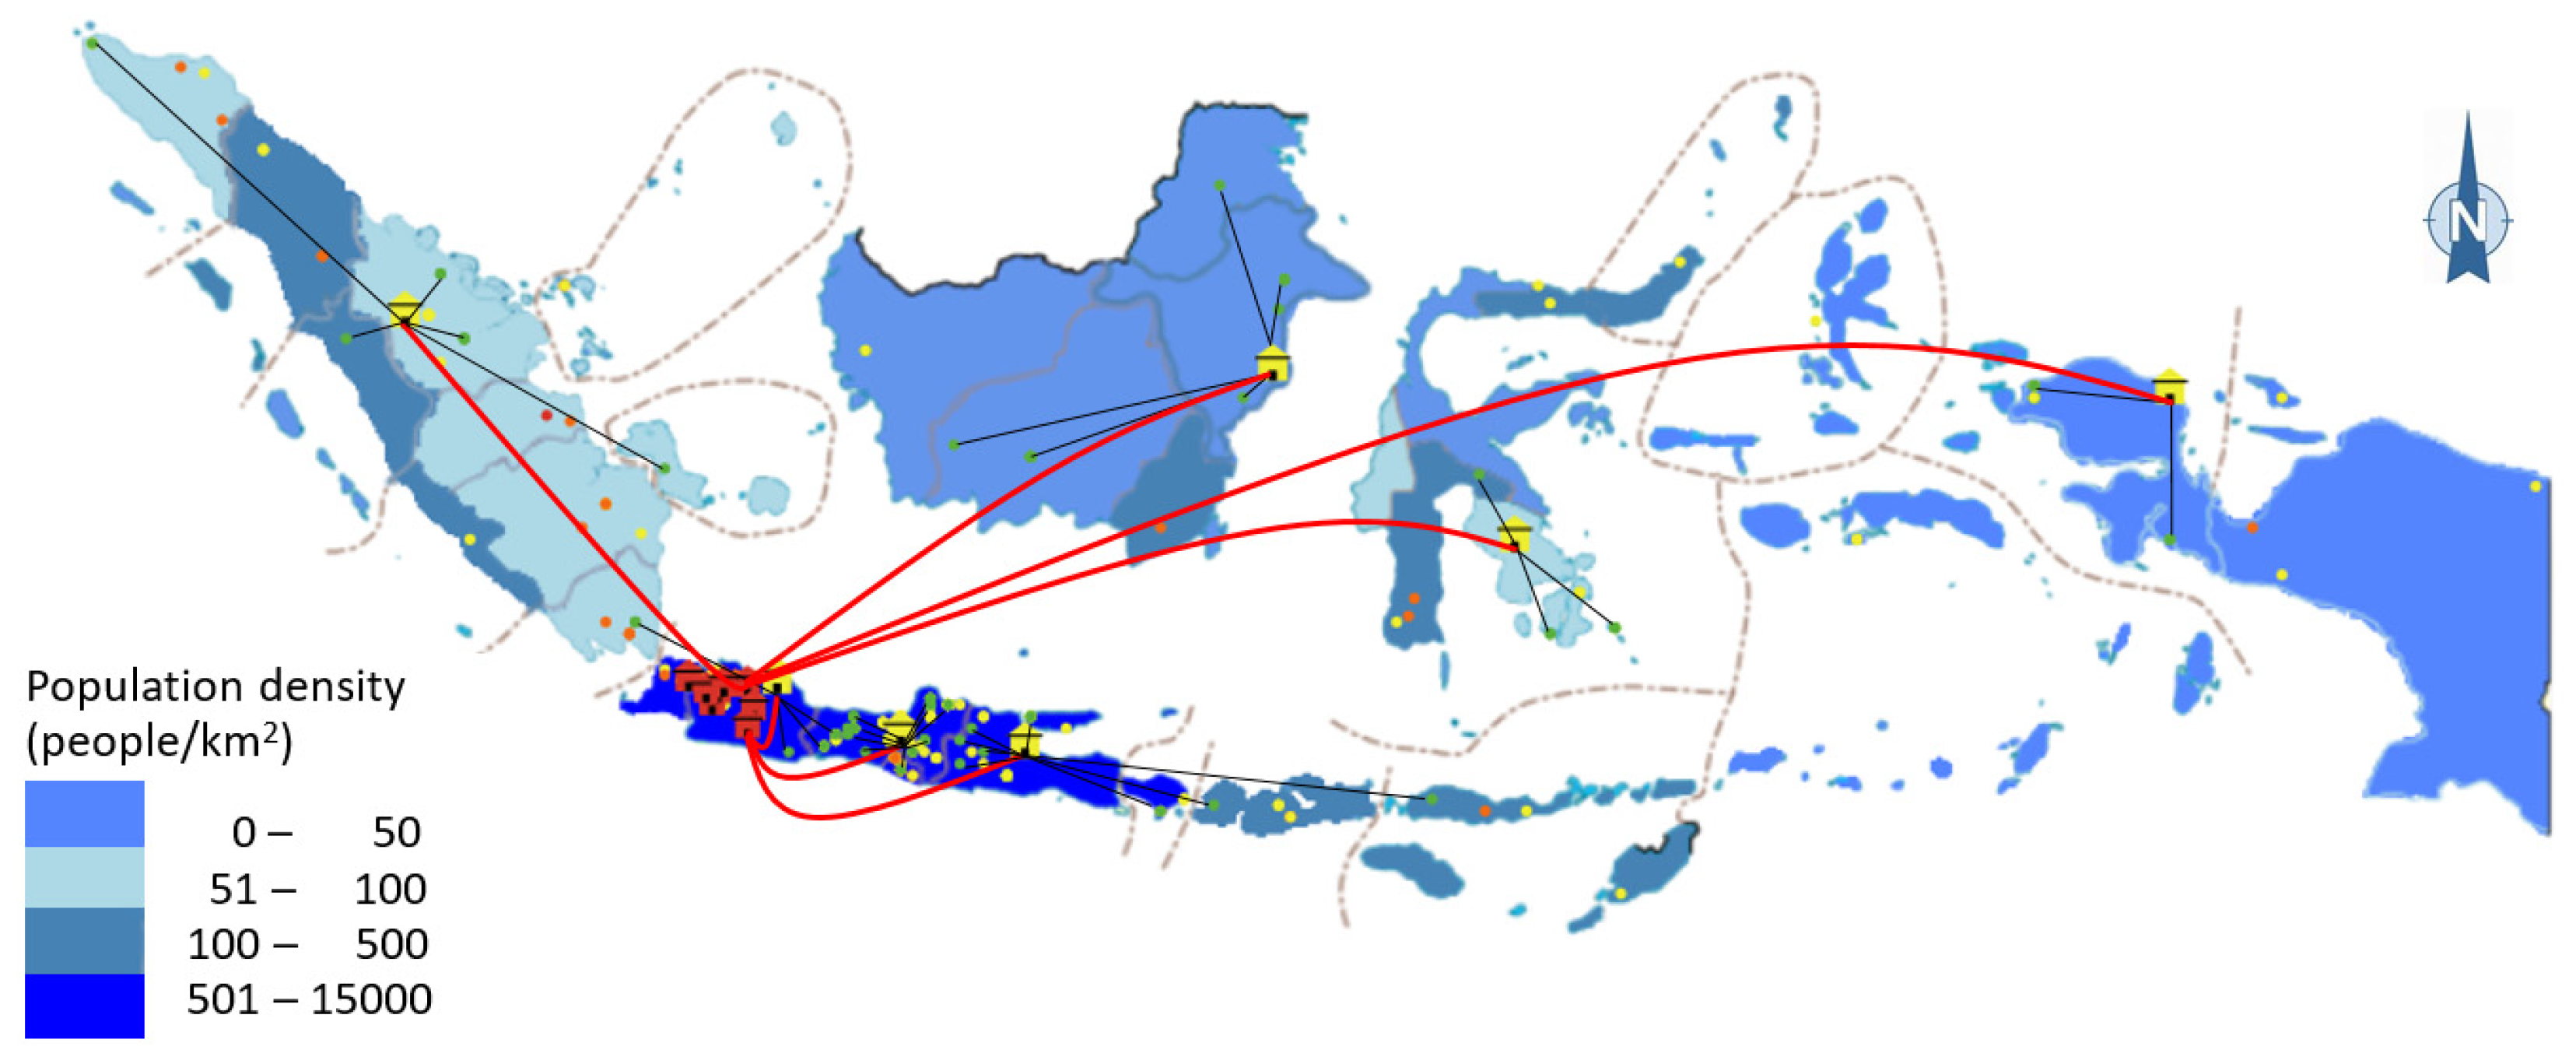
The motivation for building the model is to provide an experimental tool for policymakers to examine potential interventions toward PV adoption. The simulation for scenarios was initialized to mimic the condition in mid-2021 representing 63 PV adopters in the simulation model, eleven PV manufacturers located in West Java, and two DCs located in Jakarta and East Java based on data from the Association of Indonesian Solar Module Manufacturers (APAMSI) [68] as shown in Figure 7.
The baseline scenario (S0) represents the current condition where PV adoption is regulated based on MEMR Ministry Regulation No. 49 of 2018 in which the export tariff is set to 65%. Three scenarios, targeted at households, ranging from export tariff regulation, incentives for PV investment, environmental campaigns, and combined interventions were developed. The simulation for each scenario is run until the year 2040.
3.5.1. Export Tariff Regulation (S1)
To encourage the development of PV diffusion, the Indonesian government has issued MEMR Regulation No. 26. 2021 (Reg 26), as a replacement for MEMR Regulation No. 49. 2018 (Reg 49). One of the essential points in Reg 26 is the increase of the export-import multiplier (export tariff) from 65% to 100%. Based on this regulation, excess electricity from the PV system can be exported to the PLN grid at an export rate of 100%—every 1 Wh of PV electricity exported to the PLN grid reduces 1 Wh of electricity bill in the following month. The export tariff will influence the perception of savings due to the adopted PV system through Performance Expectance (PEt).
3.5.2. Incentives for PV Investment (S2)
One of the obstacles to adopting the PV system is the high initial investment cost. In February 2022, the Indonesian government, through the MEMR together with the United Nations Development Program (UNDP), has just launched a financing incentive program for rooftop PV. An incentive of IDR 1,450,000 per kWp from the Sustainable Energy Fund (SEF) grant is provided for PV installation by 2022. It is believed that providing incentives for PV investment will increase households’ affordability and hence induce adoption. This scenario aims at evaluating the effectiveness of the incentive implemented in 2022. Unlike Scenario 1, this scenario seems to be a short-term intervention because it is only introduced in the first year (investment).
3.5.3. Environmental Campaign (S3)
Adopting the PV system is pro-environmental behavior relevant to household agents’ values with the obligation to use environmentally friendly technology. Therefore, educational activities, promotions, and campaigns are expected to influence households’ intention to adopt PV systems. Unlike the two previous scenarios, the present scenario is considered a soft intervention. This scenario uses personal norms, which initially vary among the household agents, to be assigned to 10, indicating that all households in the simulation feel obliged to use the PV system.
3.5.4. Combined Interventions
In addition to individual intervention, the combined interventions are also worth exploring. Three combination scenarios are examined; increasing export tariffs combined with the environmental campaign (S4a), increasing export tariffs combined with the incentives (S4b), and the combination of the three aforementioned interventions (S4c). Table 4 presents parameter settings for each scenario.
4. Results and Discussion
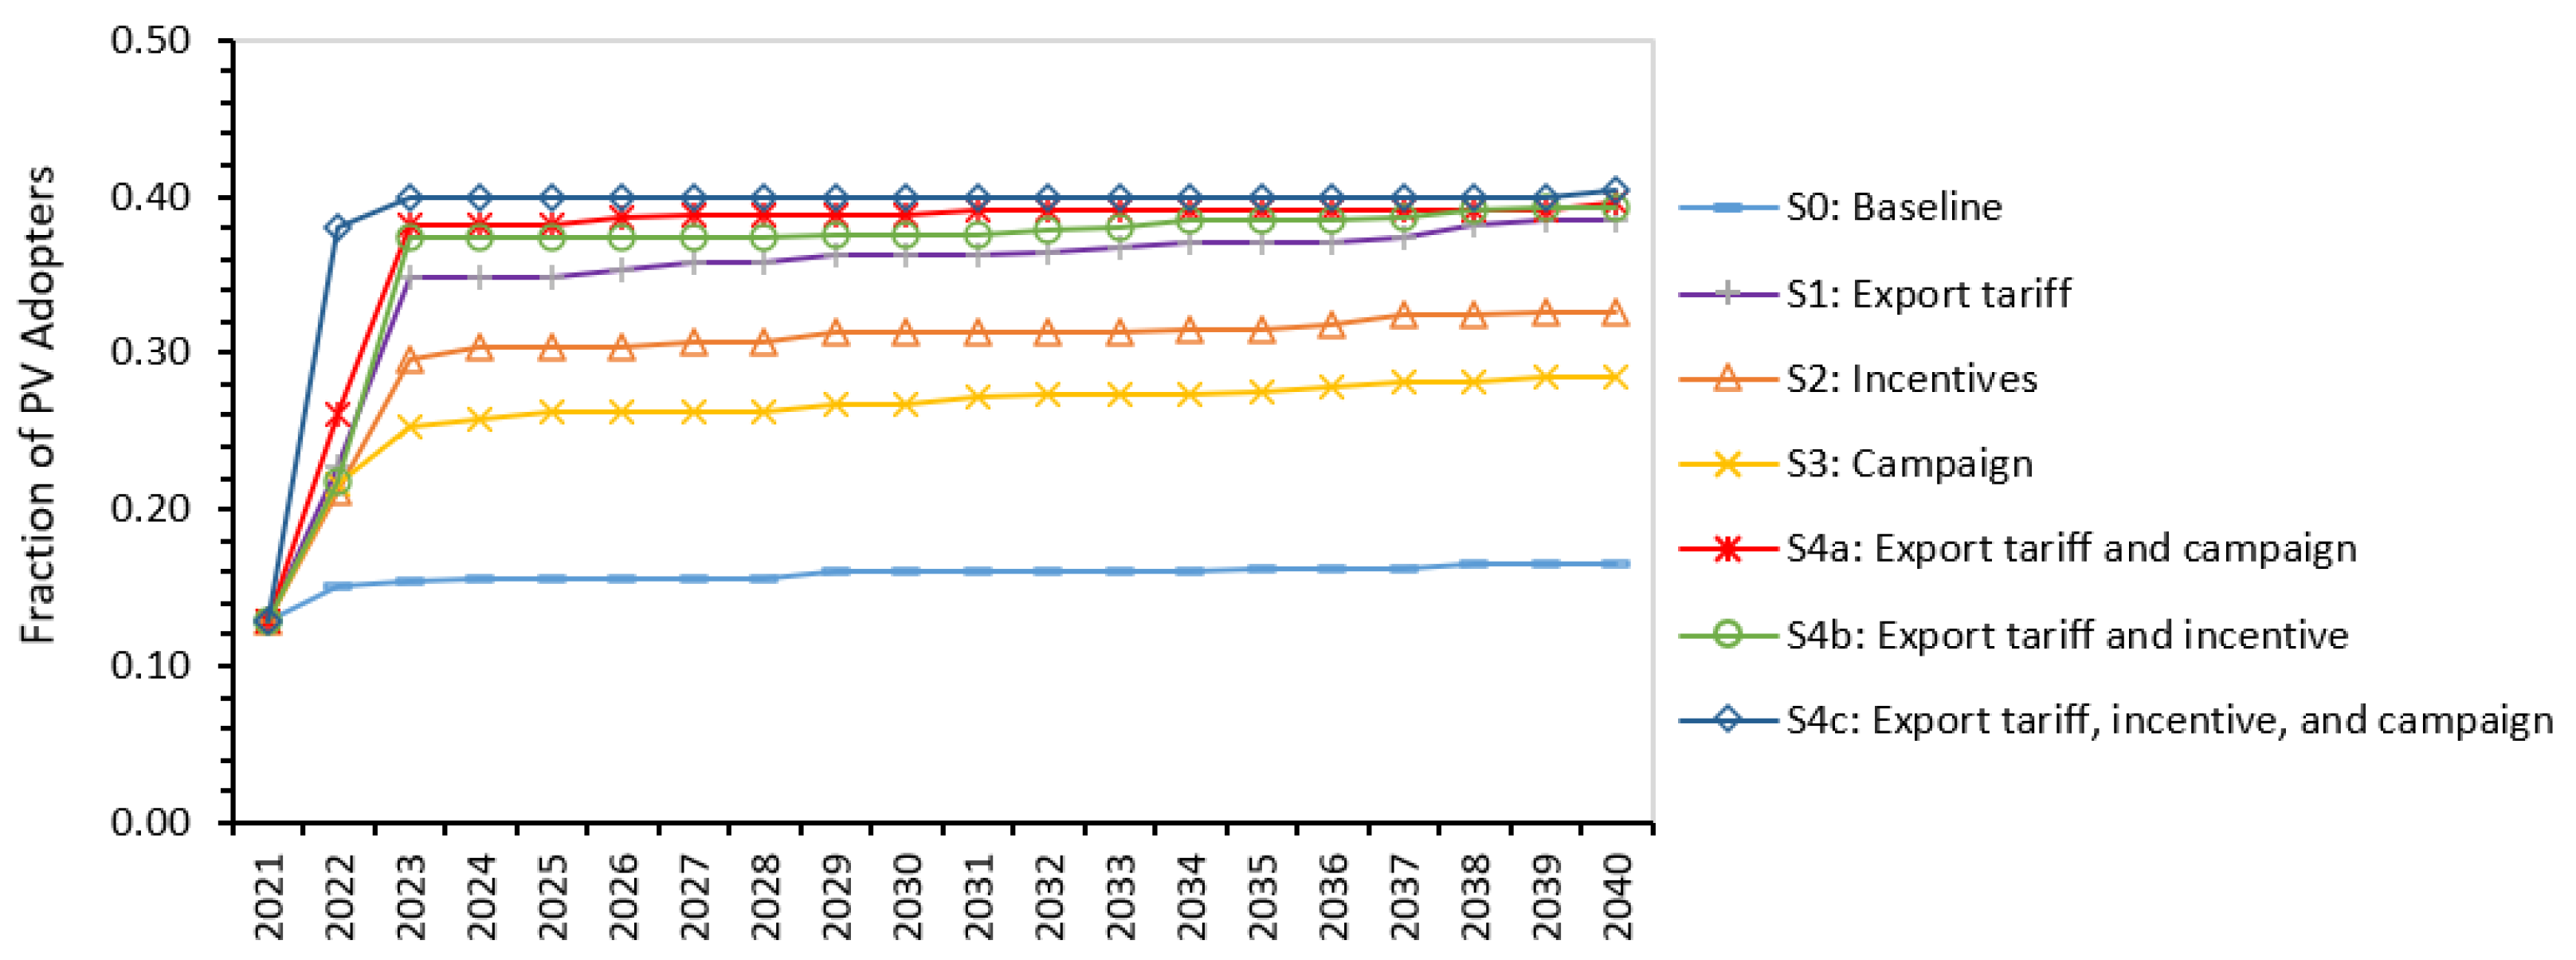
Figure 8 indicates that the baseline scenario can only achieve 16% of PV adopters in 2040. When the environmental campaign is introduced, the adopters would reach 28%, followed by providing incentives to generate 33% of PV adopters, and regulation on export tariffs to gain 38% of PV adopters. The findings are supported by Irsyad et al. [26], who demonstrated that export tariff was found the most effective policy encouraging people to adopt PV, and Setyawati et al. [69], who interviewed 973 PLN customers and found that changes in export rates attract intention and increase the perceived financial benefits of the PV system.
It is observed that combined interventions result in higher PV adopters in comparison to individual intervention, which is supported by Sopha et al. [16] in the case of green vehicle adoption in Indonesia. It is interesting to note that the increasing PV adopters due to the combined interventions are not similar to the sum of single interventions. It can be argued that similar households have been affected by those interventions, thus the combination of the interventions does not add significant household shifting. It seems that 40% of PV adopters are self-sustaining, although it is not likely to drive further diffusion. However, the combined interventions help faster adoption. It only takes two years for the combination of the three interventions (S4c) to achieve the highest PV adopters of 40%. The combination of increasing export tariffs and environmental campaigns can achieve similar PV adopters in 18 years, and the combined intervention of increasing export tariffs and incentives takes even longer. It is also worthy to note that soft intervention such as campaigns has resulted in the least PV adopters compared to regulation and financial interventions, which is in line with that of Ramshani et al. [19]. However, when considering the resources needed for implementing the intervention, the environmental campaign may be preferable due to fewer required resources.
The spatial result of the combined three interventions (S4c) is presented in Figure 9. It is observed that the PV adopters are distributed at least in the five biggest islands. Nevertheless, most PV adopters are located on Java Island. Similar results were also reported by Irsyad [26]. The simulation results further demonstrate that PV adoption is higher in areas with more adopters, indicating the effect of the social network, which is in line with the findings of the previous studies [18,70]. The highest adopters are located in Central Java. Non-adopters exist in 14 out of 34 provinces, particularly those provinces with no DCs. Concerning the PV supply chain, three large capacity DCs (10,000 kWp) are established in Java, one medium-capacity DC (5000 kWp) in East Kalimantan, and three other small-capacity DCs (5000 kWp) in Riau, Southeast Sulawesi, and West Papua.
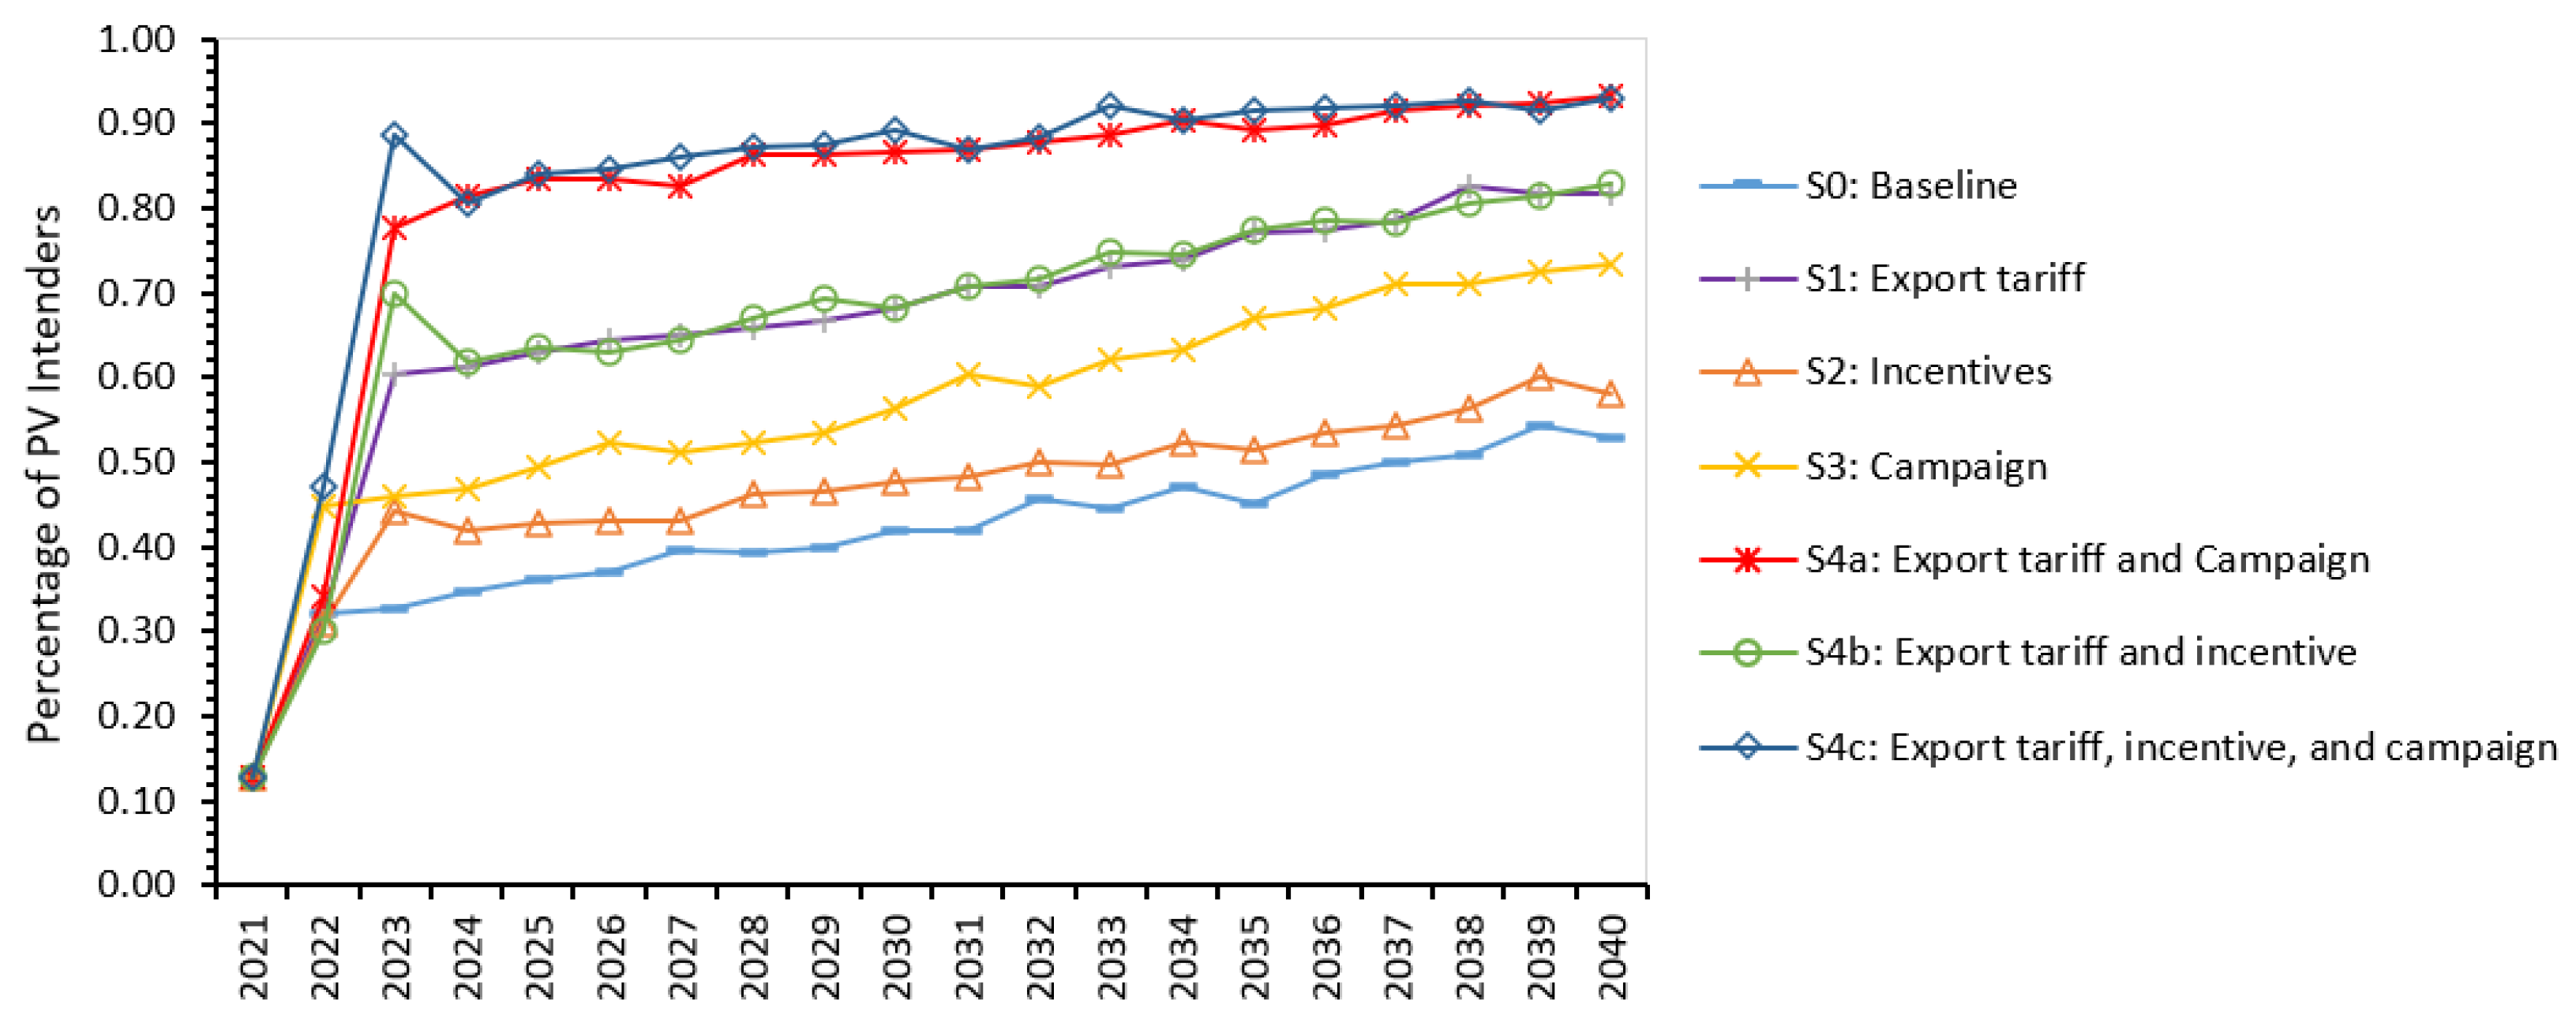
Further investigation on the mechanism of household decision-making was conducted. Figure 10 presents the percentage of the households who intend to adopt the PV system (intender), which is increasing over time in all scenarios with various rates. When compared to Figure 8, it can be observed that there exists a gap between the adoption behavior and the intention. A significant difference is observed between the number of intenders and adopters in the baseline scenario (t = 12,158, df = 38, p < 0.001) and in the combined export tariff, incentives, and campaign scenario (t = 9837, df = 38, p < 0.001). Similar results are also found for the rest of the scenarios. The finding confirms the empirical evidence of the previous studies which demonstrated that the intention is not always translated into the adoption behavior such as Bondio et al. [39]. Based on Nurwidiana et al. [23], which was also supported by Klöckner et al. [57] in a more general context, financial aspects and PV facilities may hinder PV adoption in Indonesia.
It is also interesting to note that for the incentive scenario (S2), the intenders are the lowest and show a non-significant difference with baseline scenario (S0) (t = −1.690, df = 38, p = 0.099). It implies that providing incentives does not generate more intenders but helps existing intenders to proceed to the adoption. When the PV investment is relaxed, the existing intenders would likely shift to be adopters. It is observable that the number of intenders is slightly increasing in 2023 but then decreasing once the incentive is no longer available. A similar result was also demonstrated by Palmer et al. [24], who investigated the effect of incentives on PV diffusion in Italy. The Italian government has implemented PV incentives since 2005 and succeeded in increasing the diffusion of PV until 2012. However, due to the high cost of incentives, the Italian government introduced a 10% incentive reduction every 6 months since 2012. It was reported that the adoption rate decreased rapidly from 2012 to 2021. On the other hand, Zhao et al. [25] evidenced that giving incentives with a fixed value for 20 years increased the number of PV adopters in Tucson and New York.
It is also interesting to note that the campaign scenario (S3) results in higher intenders. The campaign informs the public of the benefits of using green technology, thus improving a positive mindset towards PV and subsequently increasing intention to adopt. Similar findings have been demonstrated by Ramshani et al. [16] who pointed out that the campaign played a role in lowering the intention threshold in the early years, but incentives resulted in higher adoption rates in later years. It indicates that campaigns can help increase the intention, and incentives support the affordability of the households. It suggests that soft intervention can be combined with other interventions.
The PV infrastructures and support services indeed affect the adoption. The present study, therefore, addresses dynamic PV supply chain network configuration, which was optimized over time, depending on the expected increase of the potential adopters. Further investigation was conducted to evaluate the effect of the dynamic PV supply chain and the static PV supply chain based on the existing PV supply chain network configuration (with only two distribution centers and without any further improvement), as shown in Figure 11.
Figure 11 demonstrates that the PV supply chain network configuration needs to be regularly developed to keep up with the needs of potential adopters for PV. Significant difference on the PV adopters was observed between dynamic supply chain and static supply chain (t = −9895, df = 38, p < 0.001). It clearly shows that the existing PV supply chain configuration can only facilitate 24% of the PV adopters. The finding has demonstrated the necessity to model the supply aspect following changes in the demand aspect, which is one of the main contributions of the present study. It is evidenced that the stagnant development of PV facilities in the model will limit further PV adoption.
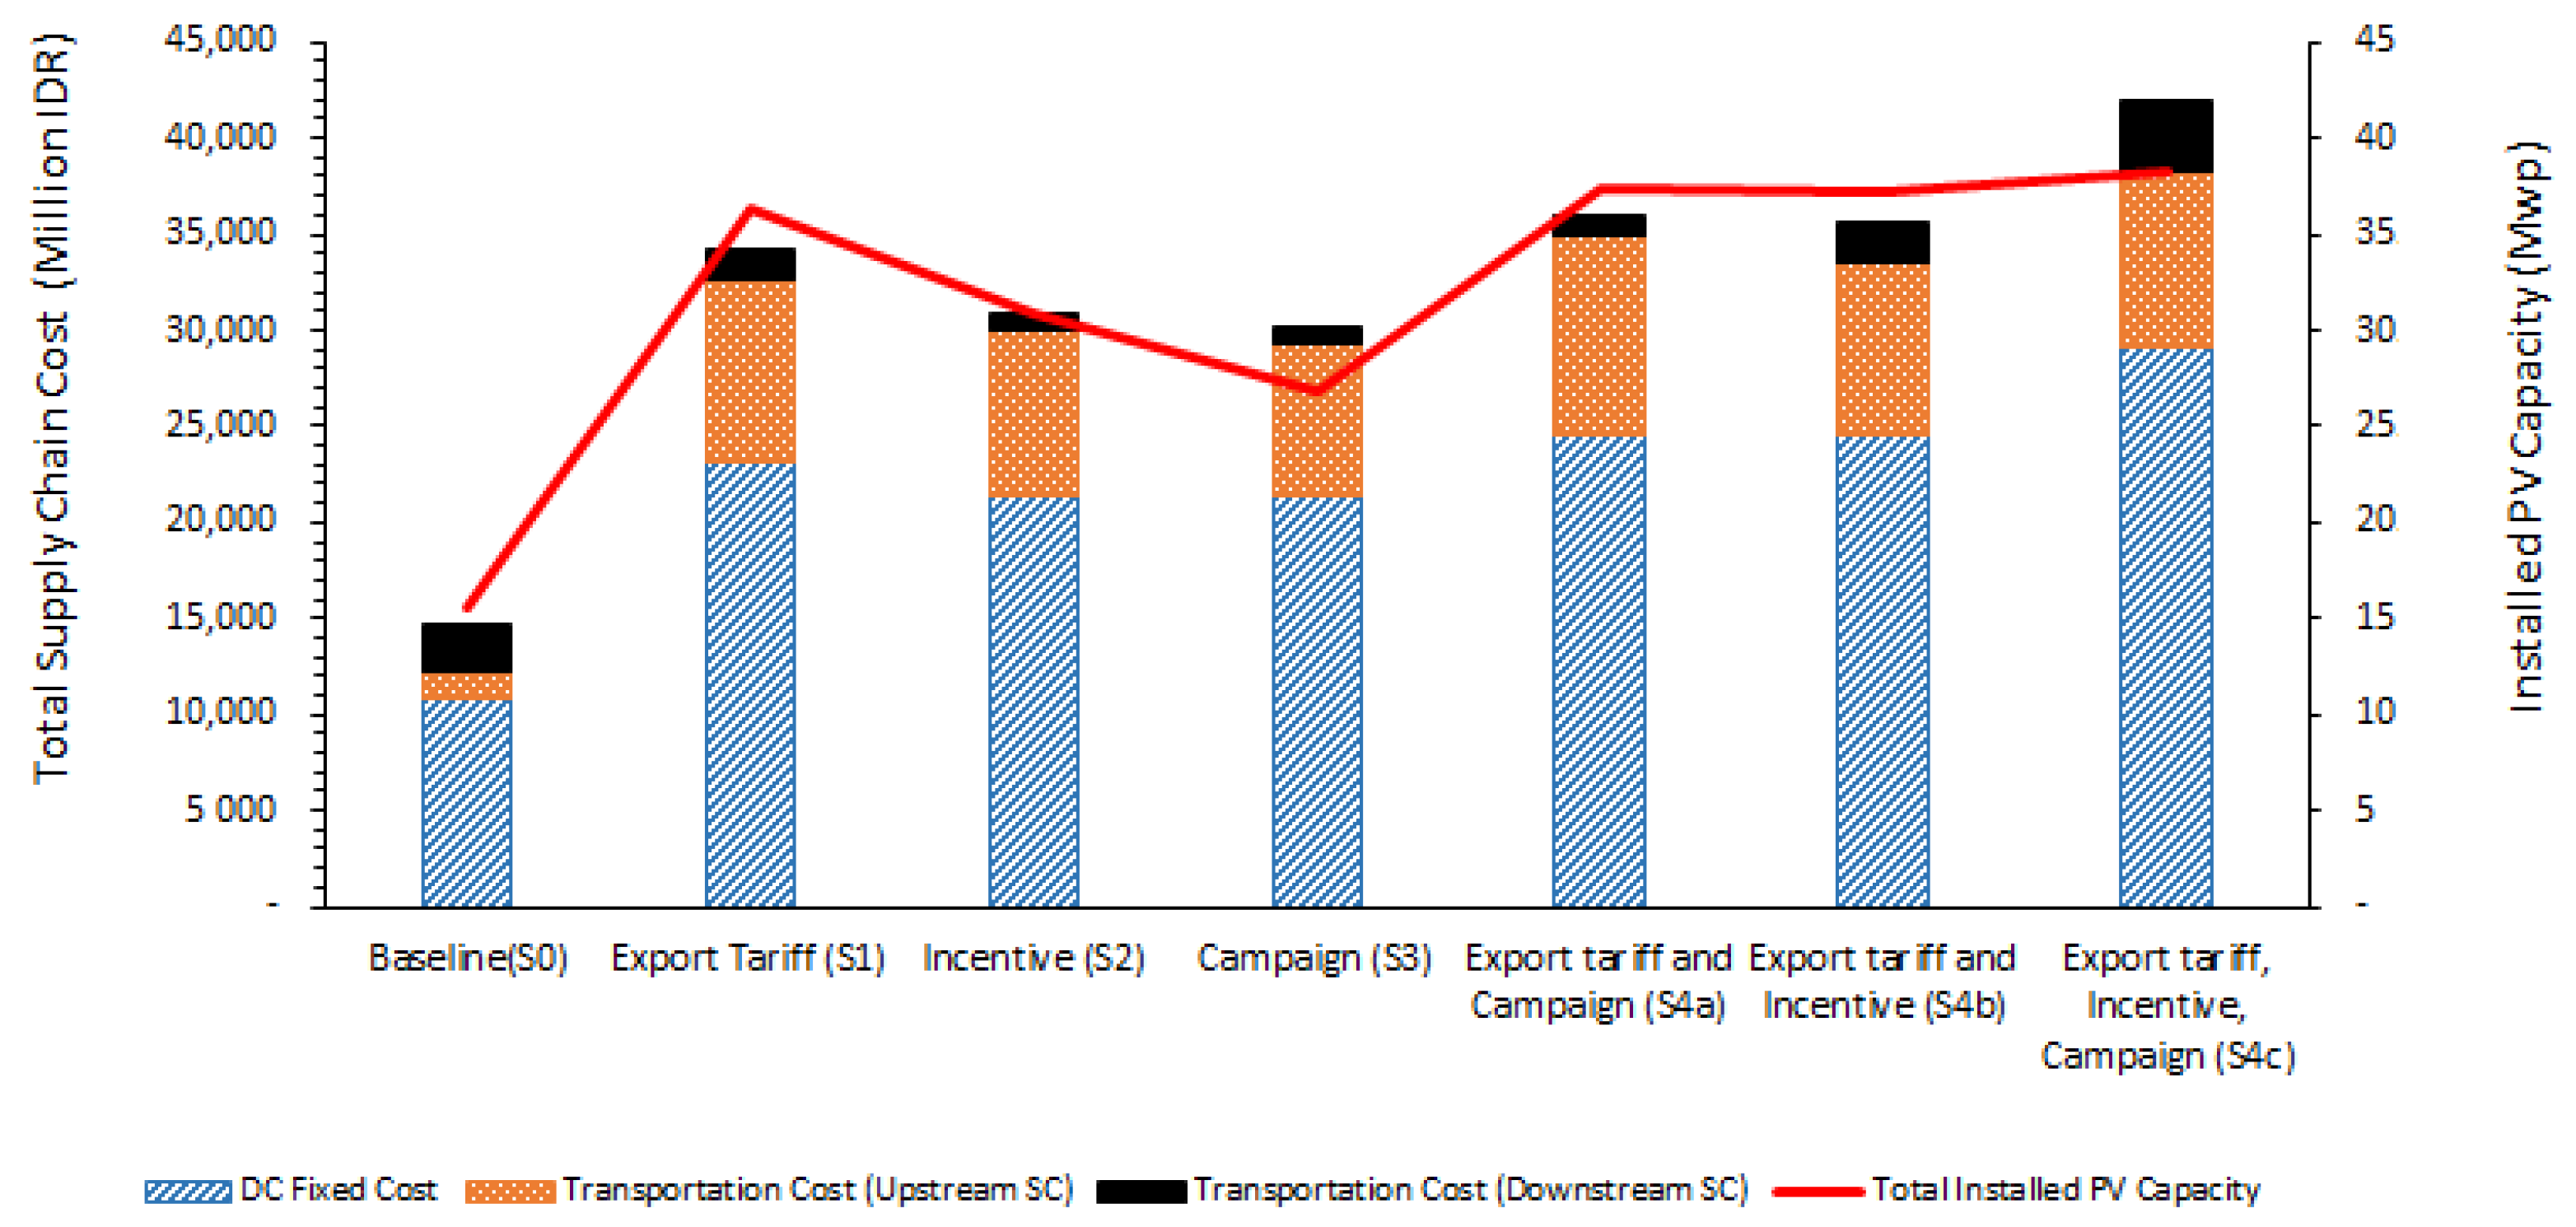
Due to the changes in the PV supply chain, it is, therefore, necessary to evaluate the impact of the changes on the total cost of the PV supply chain. Figure 12 presents the total cost of the supply chain and the installed PV capacity for all scenarios. It demonstrates that the expansion of the PV supply chain is necessary to support the increase of the installed PV system. The findings also indicate that the cost for DC establishment is the highest cost component, followed by the transportation cost from PV vendors to the DCs. Predictably, the highest investment cost is attributable to the combination of the three interventions to offset the high level of PV adoption. Given that the supply chain cost is highly dependent on the installed PV capacity, it is necessary to evaluate the supply chain unit cost.
Table 5 presents the supply chain unit cost and the supply chain configuration for all scenarios. The export tariff scenario (S1) provides the least supply chain unit cost, whereas the combination of three interventions (S4c) has the highest unit cost, indicating the high efficiency of S1 due to economies of scale. The supply chain configuration for S1 requires seven DCs, consisting of one large, two medium, and four small capacities. A similar configuration was obtained for the combined intervention of export tariffs and incentives or campaigns. The supply chain configuration for S4c involves three large, one medium, and three small DCs, whereas the optimized supply chain for incentive scenario (S2) is six DCs, consisting of one large, two medium, and three small DCs, similar to that of campaign scenario (S3).
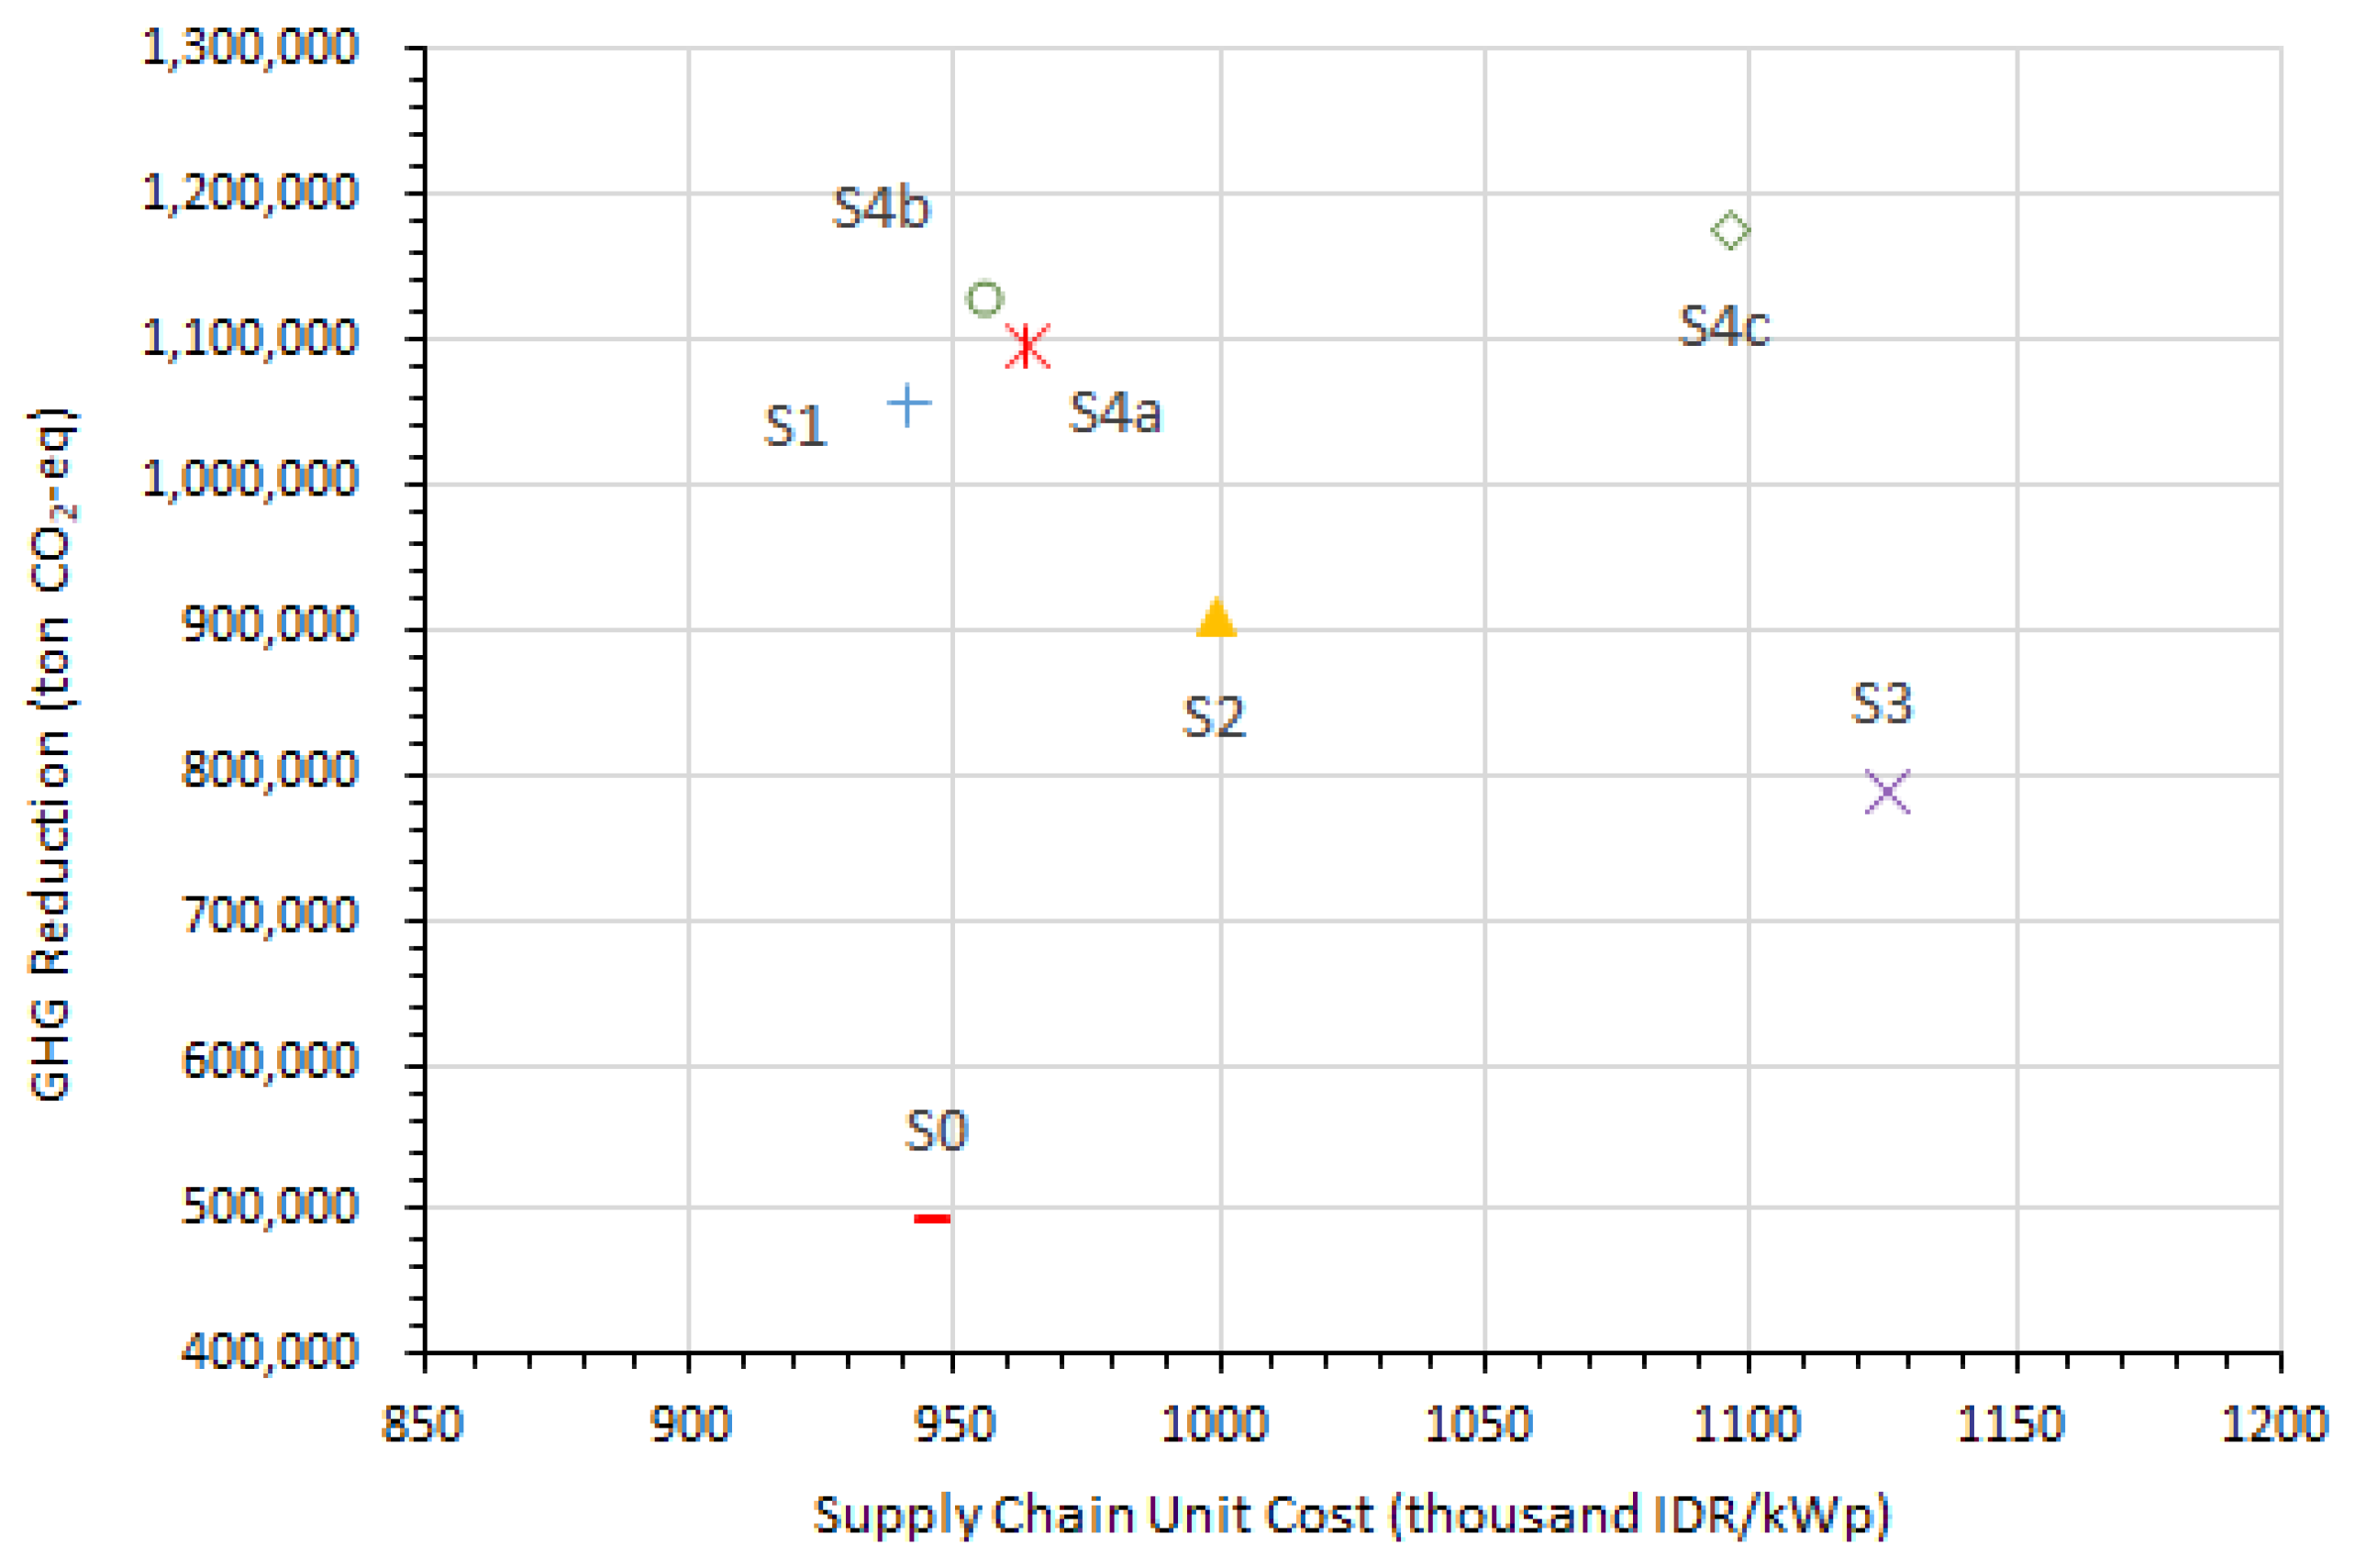
With respect to the environmental performance of the system, the environmental benefits measured by the potential for GHG reduction due to the shift from electricity generated by coal to solar electricity were evaluated and shown in Table 5. Figure 13 presents the trade-off between the supply chain unit cost and the environmental benefit for all scenarios. It can be observed that the baseline scenario (S0) performed the worst. Among single interventions, the export tariff scenario (S1) performs best. Better performance is obtained when the export tariff scenario (S1) is combined with incentives (S4b) or campaigns (S4a). The combination results in a 1% increase in supply chain costs and provides a 3% reduction in GHG. However, when all three interventions were introduced, it leads to a 16% increase in supply chain costs but only an 11% increase in GHG reduction.
Based on the aforementioned findings, it can be summarized that both supply and demand aspects should be modeled endogenously when modeling PV transitions because the inability to expand the PV facilities and services will eventually hinder further uptake. The evidence in which intention is not always translated into adoption behavior indicates the necessity to understand inhibiting factors toward the adoption. Both financial aspects and insufficient PV facilities are evidenced to be barriers to PV adoption. It appears that the intervention that provides long-term benefits such as regulation on export tariffs, instead of short-term benefits such as incentives for PV installment, would assist higher PV adopters. It is also important to note that increasing export tariffs should be combined with other interventions such as incentives and environmental campaigns to gain full benefits to both economic and environmental performances.
5. Methodological Reflections and Model Limitations
The modeling is carried out using a hybrid simulation-optimization, which was grounded by empirical data. The hybrid simulation-optimization approach enables to model the dynamic interaction between the supply-side and the demand-side, which is required for a better understanding of PV adoption and diffusion. The decision-making model was built based on the literature and empirical survey, thus providing a solid basis for the developed model. This also ensures calibration has been performed on the developed model. The validated hybrid simulation-optimization model allows conducting a series of policy intervention scenarios to help design effective and efficient interventions.
However, the developed model has some drawbacks. First, a similar PV price is implemented for all provinces, ignoring the differences in economic disparities. Second, the perception of the PV system is represented by regression weights, which are assumed to be constant over the simulation time. Therefore, a new survey might be needed assuming that perceptions can change in response to events. Third, all locations in the optimization model have an equal chance to be selected as DC locations, hence further development is needed by giving higher weight to locations with denser adopters. Finally, the model only focuses on the decision-making of households. Hereafter, the model can be extended to capture PV use for non-residential buildings.
6. Conclusions
This research provides a better understanding of the PV transition in Indonesian households by developing an integrated model to include both demand and supply aspects endogenously using a hybrid simulation-optimization approach. The developed model was specified and parameterized by empirical data through a specifically designed survey. The scenario analysis illustrates the applicability of the developed model to assess the effect of the interventions on PV adoption and the required supply chain configuration. All interventions except the incentives were able to increase the intention toward the PV system. However, the gap between the intention and the adoption behavior due to financial and facility constraints is observed. Therefore, it is necessary to provide support to both constraints through export tariffs, incentives, and other interventions on the supply side. The dynamic supply chain configuration is therefore required to provide continuous support to both existing and potential adopters.
Managerial implications are discussed in the following. The findings imply that it is necessary to address the whole system including the demand and supply aspects because those two aspects interplay with each other. Hence, it implies that future interventions should not only be introduced on the demand side but also on the supply side, which is worth exploring for future research. The fact that psychological factors play a role in energy decision-making indicates that economic interventions (e.g., investment incentives, export tariffs) should be complemented with soft interventions to accelerate PV adoption further without adding significant resources. The comprehensive model addressing technical, psychological, social, and financial components helps to understand the mechanism of energy decision-making so that appropriate intervention can be introduced at a specific stage in the decision-making process without additional resources. Last but not least, given that further self-sustaining diffusion has not yet been achieved, further investigation on understanding the critical mass of PV adoption is required and thus proposed as potential future research.
Author Contributions
Conceptualization, N.N., B.M.S. and A.W.; methodology, N.N. and B.M.S.; software, N.N.; validation, N.N. and B.M.S.; formal analysis, N.N. and B.M.S.; investigation, N.N. and B.M.S.; resources, N.N.; data curation, N.N.; writing—original draft preparation, N.N. and B.M.S.; writing—review and editing, B.M.S. and A.W.; visualization, N.N. and B.M.S.; supervision, B.M.S. and A.W. All authors have read and agreed to the published version of the manuscript.
Funding
Indonesian Ministry of Education and Culture: Doctoral Dissertation Research (PDD) grant scheme 2022.
Institutional Review Board Statement
The study involved humans as respondents to the survey (non-interventional study). No experiments or clinical trials were conducted. The study and its instruments were reviewed and approved by the Department of Mechanical and Industrial Engineering, Universitas Gadjah Mada.
Informed Consent Statement
Informed consent was obtained from all respondents involved in the study.
Data Availability Statement
Not applicable.
Acknowledgments
We would like to thank the survey respondents for taking the time to answer the questionnaire and the reviewers of this paper for their valuable comments.
Conflicts of Interest
The authors declare no conflict of interest.
References
- MEMR. Rencana Usaha Penyediaan Tenaga Listrik (RUPTL) PT PLN (Persero) 2021–2030. Rencana Usaha Penyediaan Tenaga List. 2021–2030; MEMR: Jakarta, Indonesia, 2021.
- MEMR. Laporan Kinerja DitJen EBTKE Tahun 2020; MEMR: Jakarta, Indonesia, 2020.
- De Groote, O.; Pepermans, G.; Verboven, F. Heterogeneity in the adoption of photovoltaic systems in Flanders. Energy Econ. 2016, 59, 45–57. [Google Scholar] [CrossRef] [Green Version]
- Kowalska-Pyzalska, A. What makes consumers adopt to innovative energy services in the energy market? A review of incentives and barriers. Renew. Sustain. Energy Rev. 2018, 82, 3570–3581. [Google Scholar] [CrossRef]
- Robinson, S.A.; Rai, V. Determinants of spatio-temporal patterns of energy technology adoption: An agent-based modeling approach. Appl. Energy 2015, 151, 273–284. [Google Scholar] [CrossRef] [Green Version]
- Karakaya, E.; Hidalgo, A.; Nuur, C. Motivators for adoption of photovoltaic systems at grid parity: A case study from Southern Germany. Renew. Sustain. Energy Rev. 2015, 43, 1090–1098. [Google Scholar] [CrossRef] [Green Version]
- Moglia, M.; Cook, S.; McGregor, J. A review of Agent-Based Modelling of technology diffusion with special reference to residential energy efficiency. Sustain. Cities Soc. 2017, 31, 173–182. [Google Scholar] [CrossRef]
- Bass, F.M. A New-Product Growth Model for Consumer Durables. Manag. Sci. 1969, 15, 215–227. [Google Scholar] [CrossRef]
- Zhang, H.; Vorobeychik, Y. Empirically grounded agent-based models of innovation diffusion: A critical review. Artif. Intell. Rev. 2019, 52, 707–741. [Google Scholar] [CrossRef] [Green Version]
- Kiesling, E.; Günther, M.; Stummer, C.; Wakolbinger, L.M. Agent-based simulation of innovation diffusion: A review. Cent. Eur. J. Oper. Res. 2012, 20, 183–230. [Google Scholar] [CrossRef]
- Joshi, L.; Kumar, P. Adoption of solar photovoltaic lighting in rural India: Role of localization strategy. Energy Build. 2019, 202, 109370. [Google Scholar] [CrossRef]
- Sovacool, B.K. Success and failure in the political economy of solar electrification: Lessons from World Bank Solar Home System (SHS) projects in Sri Lanka and Indonesia. Energy Policy 2018, 123, 482–493. [Google Scholar] [CrossRef]
- Sopha, B.M.; Klöckner, C.A.; Febrianti, D. Using agent-based modeling to explore policy options supporting adoption of natural gas vehicles in Indonesia. J. Environ. Psychol. 2017, 52, 149–165. [Google Scholar] [CrossRef]
- Mittal, A.; Krejci, C.C.; Dorneich, M.C. An agent-based approach to designing residential renewable energy systems. Renew. Sustain. Energy Rev. 2019, 112, 1008–1020. [Google Scholar] [CrossRef]
- Carrillo-Hermosilla, J. A policy approach to the environmental impacts of technological lock-in. Ecol. Econ. 2006, 58, 717–742. [Google Scholar] [CrossRef]
- Ramshani, M.; Li, X.; Khojandi, A.; Omitaomu, O. An agent-based approach to study the diffusion rate and the effect of policies on joint placement of photovoltaic panels and green roof under climate change uncertainty. Appl. Energy 2020, 261, 114402. [Google Scholar] [CrossRef]
- Bollinger, B.; Gillingham, K. Peer effects in the diffusion of solar photovoltaic panels. Mark. Sci. 2012, 31, 900–912. [Google Scholar] [CrossRef] [Green Version]
- Rai, V.; Robinson, S.A. Agent-based modeling of energy technology adoption: Empirical integration of social, behavioral, economic, and environmental factors. Environ. Model. Softw. 2015, 70, 163–177. [Google Scholar] [CrossRef] [Green Version]
- Nurwidiana, N.; Sopha, B.M.; Widyaparaga, A. Modelling photovoltaic system adoption for households: A systematic literature review. Evergreen 2021, 8, 69–81. [Google Scholar] [CrossRef]
- Sovacool, B.K.; D’Agostino, A.L.; Jain Bambawale, M. The socio-technical barriers to Solar Home Systems (SHS) in Papua New Guinea: “Choosing pigs, prostitutes, and poker chips over panels”. Energy Policy 2011, 39, 1532–1542. [Google Scholar] [CrossRef]
- Venkatesh, V.; Morris, M.G.; Davis, G.B.; Davis, F.D. User Acceptance of Information Technology: Toward A Unified View. MIS Q. 2003, 27, 425–478. [Google Scholar] [CrossRef] [Green Version]
- Ajzen, I. The theory of planned behavior. In Handbook of Theories of Social Psychology: Volume 1; SAGE: Southern Oaks, CA, USA, 2012; pp. 438–459. [Google Scholar] [CrossRef]
- Zhang, H.; Vorobeychik, Y.; Letchford, J.; Lakkaraju, K. Predicting rooftop solar adoption using agent-based modeling. In Proceedings of the AAAI Fall Symposium—Technical Report, Arlington, VA, USA, 13–15 November 2014; Volume FS, pp. 44–51. [Google Scholar]
- Palmer, J.; Sorda, G.; Madlener, R. Modeling the diffusion of residential photovoltaic systems in Italy: An agent-based simulation. Technol. Forecast. Soc. Change 2015, 99, 106–131. [Google Scholar] [CrossRef]
- Zhao, J.; Mazhari, E.; Celik, N.; Son, Y.J. Hybrid agent-based simulation for policy evaluation of solar power generation systems. Simul. Model. Pract. Theory 2011, 19, 2189–2205. [Google Scholar] [CrossRef]
- Al Irsyad, M.I.; Halog, A.; Nepal, R. Estimating the impacts of financing support policies towards photovoltaic market in Indonesia: A social-energy-economy-environment model simulation. J. Environ. Manag. 2019, 230, 464–473. [Google Scholar] [CrossRef] [PubMed]
- Dong, C.; Sigrin, B. Using willingness to pay to forecast the adoption of solar photovoltaics: A “parameterization + calibration” approach. Energy Policy 2019, 129, 100–110. [Google Scholar] [CrossRef]
- Robinson, S.A.; Stringer, M.; Rai, V.; Tondon, A. GIS-Integrated Agent-Based Model of Residential Solar PV Diffusion. In Proceedings of the 32nd USAEE/IAEE North American Conference, Anchorage, AK, USA, 28–31 July 2013; pp. 1–19. [Google Scholar]
- Bjelić, I.B.; Rajaković, N. Simulation-based optimization of sustainable national energy systems. Energy 2015, 91, 1087–1098. [Google Scholar] [CrossRef]
- Mahbub, M.S.; Cozzini, M.; Østergaard, P.A.; Alberti, F. Combining multi-objective evolutionary algorithms and descriptive analytical modelling in energy scenario design. Appl. Energy 2016, 164, 140–151. [Google Scholar] [CrossRef]
- Atabaki, M.S.; Mohammadi, M.; Aryanpur, V. An integrated simulation-optimization modelling approach for sustainability assessment of electricity generation system. Sustain. Energy Technol. Assess. 2022, 52, 102010. [Google Scholar] [CrossRef]
- Hosseinalizadeh, R.; Shakouri, G.H.; Amalnick, M.S.; Taghipour, P. Economic sizing of a hybrid (PV-WT-FC) renewable energy system (HRES) for stand-alone usages by an optimization-simulation model: Case study of Iran. Renew. Sustain. Energy Rev. 2016, 54, 139–150. [Google Scholar] [CrossRef] [Green Version]
- Sopha, B.M.; Siagian, A.; Maria, A.; Asih, S. Simulating Dynamic Vehicle Routing Problem Using Agent-Based Modeling and Simulation. In Proceedings of the 2016 IEEE International Conference on Industrial Engineering and Engineering Management (IEEM), Bali, Indonesia, 4–7 December 2016; pp. 1335–1339. [Google Scholar] [CrossRef]
- Chen, Z.; Cheung, K.C.K.; Qi, X. Subsidy policies and operational strategies for multiple competing photovoltaic supply chains. Flex. Serv. Manuf. J. 2021, 33, 914–955. [Google Scholar] [CrossRef]
- Nasirov, S.; Carredano, N.; Agostini, C.A.; Silva, C. Public perception and adoption of Solar Water Heating systems in Chile: The role of supply side income tax credits. Renew. Sustain. Energy Rev. 2021, 135, 110389. [Google Scholar] [CrossRef]
- Hansen, P.; Liu, X.; Morrison, G.M. Agent-based modelling and socio-technical energy transitions: A systematic literature review. Energy Res. Soc. Sci. 2019, 49, 41–52. [Google Scholar] [CrossRef]
- Saleh, A.M.; Haris, A.; Ahmad, N. Towards a UTAUT-based model for the intention to use solar water heaters by Libyan households. Int. J. Energy Econ. Policy 2014, 4, 26–31. [Google Scholar]
- Aggarwal, A.K.; Syed, A.A.; Garg, S. Factors driving Indian consumer’s purchase intention of roof top solar. Int. J. Energy Sect. Manag. 2019, 13, 539–555. [Google Scholar] [CrossRef]
- Lescevica, M.; Ginters, E.; Mazza, R. Unified theory of acceptance and use of technology (UTAUT) for market analysis of FP7 CHOReOS products. Procedia Comput. Sci. 2013, 26, 51–68. [Google Scholar] [CrossRef] [Green Version]
- Williams, M.D.; Rana, N.P.; Dwivedi, Y.K. The unified theory of acceptance and use of technology (UTAUT): A literature review. J. Enterp. Inf. Manag. 2015, 28, 443–448. [Google Scholar] [CrossRef] [Green Version]
- BPS. Available online: https://www.bps.go.id/indicator/12/153/1/banyaknya-rumah-tangga.html (accessed on 11 March 2021).
- IRENA. Renewable Power Generation Cost in 2019; IRENA: Abu Dhabi, United Arab Emirates, 2019. [Google Scholar]
- Bondio, S.; Shahnazari, M.; McHugh, A. The technology of the middle class: Understanding the fulfilment of adoption intentions in Queensland’s rapid uptake residential solar photovoltaics market. Renew. Sustain. Energy Rev. 2018, 93, 642–651. [Google Scholar] [CrossRef]
- Venkatesh, V.; James, T.; Xu, X. Unified Theory of Acceptance and Use of Technology: A Synthesis and the Road Ahead. J. Assoc. Inf. Syst. 2016, 17, 328–376. [Google Scholar] [CrossRef]
- Fishbein, M.; Ajzen, I. Belief, Attitude, Intention, and Behavior: An Introduction to Theory and Research; Addision-Wesley: Boston, MA, USA, 1975. [Google Scholar]
- Davis, F.D. A Technology Acceptance Model for Empirically Testing New End-User Information Systems: Theory and Result. Ph.D. Thesis, Massachusetts Institute of Technology, Cambridge, MA, USA, 1986. [Google Scholar]
- Ajzen, I. The theory of planned behavior. Organ. Behav. Hum. Decis. Process. 1991, 50, 179–211. [Google Scholar] [CrossRef]
- Taylor, S.; Todd, P.A. Understanding information technology usage: A test of competing models. Inf. Syst. Res. 1995, 6, 144–176. [Google Scholar] [CrossRef]
- Davis, F.D.; Bagozzi, R.P.; Warshaw, P.R. Extrinsic and Intrinsic Motivation to Use Computers in the Workplace. J. Appl. Soc. Psychol. 1992, 22, 1111–1132. [Google Scholar] [CrossRef]
- Thompson, R.L.; Higgins, C.A.; Howell, J.M. Personal Computing: Toward a Conceptual Model of Utilization. MIS Q. 1991, 15, 125–143. [Google Scholar] [CrossRef]
- Roger, E.M. Diffusion of Innovation, 4th ed.; Free Press: New York, NY, USA, 2010. [Google Scholar]
- Bandura, A. Social Foundations of Thought and Action: A Social Cognitive Theory. In The Health Psychology Reader; Prentice Hall: Hoboken, NJ, USA, 1986. [Google Scholar]
- Lau, L.S.; Choong, Y.O.; Wei, C.Y.; Seow, A.N.; Choong, C.K.; Senadjki, A.; Ching, S.L. Investigating nonusers’ behavioural intention towards solar photovoltaic technology in Malaysia: The role of knowledge transmission and price value. Energy Policy 2020, 144, 111651. [Google Scholar] [CrossRef]
- Aggarwal, A.K.; Syed, A.A.; Garg, S. Diffusion of RT Solar PV in Suburbs of Delhi/NCR, India: Triggers of Architect Recommendation Intent. Vision 2021, 25, 285–299. [Google Scholar] [CrossRef]
- Sopha, B.M. Sustainable paper consumption: Exploring behavioral factors. Soc. Sci. 2013, 2, 270–283. [Google Scholar] [CrossRef] [Green Version]
- Wolske, K.S.; Stern, P.C.; Dietz, T. Explaining interest in adopting residential solar photovoltaic systems in the United States: Toward an integration of behavioral theories. Energy Res. Soc. Sci. 2017, 25, 134–151. [Google Scholar] [CrossRef]
- Klöckner, C.A.; Sopha, B.M.; Matthies, E.; Bjørnstad, E. Energy efficiency in Norwegian households—Identifying motivators and barriers with a focus group approach. Int. J. Environ. Sustain. Dev. 2013, 12, 396–415. [Google Scholar] [CrossRef] [Green Version]
- Karakaya, E.; Sriwannawit, P. Barriers to the adoption of photovoltaic systems: The state of the art. Renew. Sustain. Energy Rev. 2015, 49, 60–66. [Google Scholar] [CrossRef] [Green Version]
- Londo, M.; Matton, R.; Usmani, O.; van Klaveren, M.; Tigchelaar, C.; Brunsting, S. Alternatives for current net metering policy for solar PV in the Netherlands: A comparison of impacts on business case and purchasing behaviour of private homeowners, and on governmental costs. Renew. Energy 2020, 147, 903–915. [Google Scholar] [CrossRef]
- Vasseur, V.; Kemp, R. The adoption of PV in the Netherlands: A statistical analysis of adoption factors. Renew. Sustain. Energy Rev. 2015, 41, 483–494. [Google Scholar] [CrossRef]
- Hosmer, D.; Lemeshow, S.; Sturdivant, R. Introduction to the Logistic Regression Model; John Wiley & Sons: Hoboken, NJ, USA, 2013; pp. 1–31. [Google Scholar]
- Palm, J. Household installation of solar panels—Motives and barriers in a 10-year perspective. Energy Policy 2018, 113, 1–8. [Google Scholar] [CrossRef] [Green Version]
- Wilensky, U. Netlogo; Center for Connected Learning and Computer-Based Modeling, Northwestern University: Evanston, IL, USA, 1999. [Google Scholar]
- Mason, A.J. OpenSolver—An Open Source Add-in to Solve Linear and Integer Progammes in Excel. In Operations Research Proceedings 2011; Springer: Berlin/Heidelberg, Germany, 2012; pp. 401–406. [Google Scholar] [CrossRef]
- Wiloso, E.I.; Setiawan, A.A.R.; Prasetia, H.; Muryanto; Wiloso, A.R.; Subyakto; Sudiana, I.M.; Lestari, R.; Nugroho, S.; Hermawan, D.; et al. Production of sorghum pellets for electricity generation in Indonesia: A life cycle assessment. Biofuel Res. J. 2020, 7, 1178–1194. [Google Scholar] [CrossRef]
- Widiyanto, A.; Kato, S.; Maruyama, N. Environmental impact analysis of Indonesian electric generation systems. JSME Int. J. Ser. B Fluids Therm. Eng. 2003, 46, 650–659. [Google Scholar] [CrossRef] [Green Version]
- Sopha, B.M.; Sakti, S. Pemodelan dan Simulasi Berbasis Agen, 1st ed.; Gadjah mada Univercity Press: Yogyakarya, Indonesia, 2020. [Google Scholar]
- APAMSI Daftar Anggota. Available online: https://neo.apamsi.org/keanggotaan/daftar-anggota/ (accessed on 20 June 2021).
- Setyawati, D. Analysis of perceptions towards the rooftop photovoltaic solar system policy in Indonesia. Energy Policy 2020, 144, 111569. [Google Scholar] [CrossRef]
- Busic-Sontic, A.; Fuerst, F. Does your personality shape your reaction to your neighbours’ behaviour? A spatial study of the diffusion of solar panels. Energy Build. 2018, 158, 1275–1285. [Google Scholar] [CrossRef] [Green Version]
Figure 1.
Relationship between PV adoption decision and PV supply chain.

Figure 2.
A conceptual framework of empirically based hybrid simulation-optimization model.

Figure 3.
Flowchart of the implemented simulation model (Note: the definition of the variables is described in Table 1).
Figure 3.
Flowchart of the implemented simulation model (Note: the definition of the variables is described in Table 1).

Figure 4.
A framework of household adoption decision-making, modified from UTAUT2 [44].
Figure 4.
A framework of household adoption decision-making, modified from UTAUT2 [44].

Figure 5.
Number of adopters from simulation results in 2018–2021 vs. MEMR data (macro validation).

Figure 6.
Percentage of intender for a different region in the second quarter of 2021 based on the most frequent single run (micro validation).
Figure 6.
Percentage of intender for a different region in the second quarter of 2021 based on the most frequent single run (micro validation).

Figure 7.
Spatial visualization of the simulation model (Note: red houses represent PV manufacturers, yellow houses represent DCs, red lines represent manufacturers—DCs network, black lines represent DCs—PV adopters’ network, green dots represent adopters, yellow dots represent intenders, red dots represent non-adopters. The figure is the screenshot of the simulation model which was developed in NetLogo using GIS data [63].

Figure 8.
PV adopters for various scenarios.

Figure 9.
Spatial results for PV adopters in the combined intervention of export tariff, incentives, and campaign (S4c) in 2040. The figure is the screenshot of the simulation results developed in NetLogo using GIS data [63].
Figure 9.
Spatial results for PV adopters in the combined intervention of export tariff, incentives, and campaign (S4c) in 2040. The figure is the screenshot of the simulation results developed in NetLogo using GIS data [63].

Figure 10.
PV intenders for various scenarios.

Figure 11.
PV intenders for static and dynamic supply chain configuration for various scenarios.

Figure 12.
Total supply chain cost and installed PV capacity for all scenarios.

Figure 13.
The trade-off between supply chain unit cost and GHG reduction.


Table 1.
Household agent variables.
| Symbol | Household Agent Variables | Possible Values | Type | Source |
|---|---|---|---|---|
| ID | Household ID number | 0–436 (437 household agents) | Static | Survey |
| At | Age of respondents | 21–64 years | Dynamic * | Survey |
| Inc | Income level | Household income | Static | Survey |
| Ed | Education level | 1 = Elementary school 2 = High school 3 = University 4 = Postgraduate | Static | Survey |
| R | Region | 1 = Java and surrounding islands 2 = Sumatra and surrounding islands 3 = Kalimantan and surrounding islands 4 = Sulawesi and surrounding islands 5 = Bali, Nusa Tenggara, and surrounding islands 6 = Maluku, Papua, and surrounding islands | Static | Survey |
| EA | Electricity access | 1 = No access to electricity 2 = less than 1300 W 3 = 1300 W 4 = 2200 W 5 = 3500–5500 W 6 = more than 5500 W | Static | Survey |
| SI | Social influence (percentage of peers who installs PV | 1 = 0%; 2 = 1–5%; 3 = 6–10%; 4 = 11–20%, 5 = more than 20% | Dynamic ** | Survey |
| Peers | Number of peers with who communicated about energy or PV | 1–30 peers | Static | Survey |
| Intthres | Intention threshold | 0 (no intention)–1 (high intention) | Static | Survey |
| DCthres | DCs/facilities’ location threshold | 1 = within the similar province with the household agent 2 = within the similar region with the household agent 3 = within the country | Static | Survey |
| PN | Personal norms | 1 (low)–10 (high) | Static | Survey |
| PEt | Performance expectance at time t | 1 (low)–10 (high) | Dynamic ** | Equation (2) |
| EE | Effort expectance | 1 (low)–10 (high) | Static | Survey |
| HM | Hedonic motivation | 1 (low)–10 (high) | Static | Survey |
| HB | Habit | 1 (low)–10 (high) | Static | Survey |
| PValt | Perceived investment cost for PV at time t | 1 (very cheap)–10 (very expensive) | Dynamic ** | Equation (3) |
| FCt | Perceived facilitating condition at time t | 1 (inaccessible)–10 (highly accessible) | Dynamic ** | Equation (4) |
| ExpPP | Expected payback period | 7–20 years | Static | Survey |
| ExpPVcostdecrease | Expected PV cost decrease | 0–100% | Static | Survey |
| ExpTariff | Expected export tariff | 0–100% | Static | Survey |
| DCnearestt | Nearest DCs (facilities) at time t | 1 = Nearest DCs/facilities are located in similar province 2 = Nearest DCs/facilities are located in similar regions 3 = Nearest DCs/facilities are located in the country | Dynamic ** | Optimization model |
| Intt | Intention toward PV at time t | 0 (no intention)–1 (high intention) | Dynamic ** | Equation (1) |
| Adoptt | PV adoption state at time t | adopter, intender, non-adopter | Dynamic ** | Equation (13) |
Note: * changes due to time; ** changes due to changes on other variables.
Table 2.
The description of constructs used in the intention model.
| Construct | Description |
|---|---|
| Performance expectance (PE) | Households’ perceived usefulness of a PV to lower their electricity bills and decrease the use of natural resources |
| Effort expectance (EE) | Households’ comfort level in using the system and ease of adoption |
| Hedonic motivation (HM) | The influence of hedonic (emotive) parameters such as keeping up with new technology on the household purchase decision |
| Price value (PVal) | The perceived investment cost for PV |
| Habit (HB) | The degree to which households tend to perform behaviors automatically from learning accustoming due to familiarity with technical knowledge |
| Facilitating condition (FC) | The degree to which a household believes that the technical and organizational infrastructure such as after-sales service for maintenance is in place to support the use of the technology |
| Social influence (SI) | The influence of others’ opinions about the acceptance and usage of new technology |
| Personal norms (PN) | The degree of feeling responsible for protecting the environment, moral obligation to reduce fossil fuel energy |
Table 3.
Coefficients of the intention predictors obtained from the empirical survey.
| Predictors | Coefficient Symbol | Coefficient | Wald χ2 | df | p-Value | Odds Ratio |
|---|---|---|---|---|---|---|
| Constant | −9.179 | 32.666 | 1 | 0.000 *** | 0.000 | |
| Performance expectance (PE) | 0.358 | 10.929 | 1 | 0.000 *** | 1.430 | |
| Effort expectance (EE) | 0.155 | 2.103 | 1 | 0.147 ns | 1.168 | |
| Personal norms (PN) | 0.286 | 6.926 | 1 | 0.008 ** | 1.331 | |
| Hedonic motivation (HM) | 0.027 | 0.127 | 1 | 0.722 ns | 1.027 | |
| Price value (PVal) | −0.259 | 9.921 | 1 | 0.002 ** | 0.772 | |
| Habit (HB) | 0.013 | 0.013 | 1 | 0.909 ns | 1.013 | |
| Social influence (SI) | 0.409 | 3.184 | 1 | 0.074 ms | 1.505 | |
| Facilitating condition (FC) | 0.162 | 5.744 | 1 | 0.017 * | 1.176 | |
| Age (A) | 0.047 | 7.089 | 1 | 0.008 ** | 1.048 | |
| Income (Inc) | 0.008 | 0.382 | 1 | 0.537 ns | 1.008 | |
| Education (Ed) | 0.111 | 0.274 | 1 | 0.601 ns | 1.118 | |
| Electricity access (EA) | 0.170 | 1.016 | 1 | 0.313 ns | 1.186 |
Note: *** p < 0.001; ** p < 0.01; * p < 0,05, ms marginal significant, ns not significant.
Table 4.
Parameter settings for the developed scenarios.
| Scenario | Baseline | Export Tariff | Incentives | Campaign | Combined Interventions | |||
|---|---|---|---|---|---|---|---|---|
| Parameters | S0 | S1 | S2 | S3 | S4a Export Tariff and Campaign | S4b Export Tariff and Incentives | S4c Export Tariff, Incentives, and Campaign | |
| Export Tariff (%) | 65 | 100 | 65 | 65 | - | 65 | 100 | |
| PV cost decrease (thousand IDR/kWp) | - | - | 1450 * | - | - | 1450 * | 1450 * | |
| Personal Norms | Based on survey | Based on survey | Based on survey | 10 | 10 | Based on survey | 10 | |
Note: * introduced in the year 2022.
Table 5.
Performance comparison.
| Scenario | Number of DCs | Financial Performance | Environmental Performance | |||
|---|---|---|---|---|---|---|
| Total Supply Chain Cost (Million IDR) | PV Capacity Installed (MWp) | Supply Chain Unit Cost (Thousand IDR/kWp) | PV Electricity Generated (MWh) | GHG Reduction (ton CO2-eq) | ||
| S0: Baseline | 2 | 14,698 | 15.54 | 946 | 462,353 | 493,330 |
| S1: Export tariff | 7 | 34,193 | 36.33 | 941 | 990,931 | 1,057,324 |
| S2: Incentive | 6 | 30,845 | 30.88 | 999 | 852,961 | 910,110 |
| S3: Campaign | 6 | 30,253 | 26.88 | 1125 | 741,052 | 790,703 |
| S4: Export tariff and campaign | 7 | 36,008 | 37.38 | 963 | 1,028,336 | 1,097,235 |
| S4b: Export tariff and incentive | 7 | 35,538 | 37.17 | 956 | 1,056,544 | 1,127,332 |
| S4c: Export tariff, incentive, and campaign | 7 | 41,901 | 38.22 | 1096 | 1,101,920 | 1,175,749 |
Publisher’s Note: MDPI stays neutral with regard to jurisdictional claims in published maps and institutional affiliations. |
© 2022 by the authors. Licensee MDPI, Basel, Switzerland. This article is an open access article distributed under the terms and conditions of the Creative Commons Attribution (CC BY) license (https://creativecommons.org/licenses/by/4.0/).
Share and Cite
MDPI and ACS Style
Nurwidiana, N.; Sopha, B.M.; Widyaparaga, A. Simulating Socio-Technical Transitions of Photovoltaics Using Empirically Based Hybrid Simulation-Optimization Approach. Sustainability 2022, 14, 5411. https://doi.org/10.3390/su14095411
AMA Style
Nurwidiana N, Sopha BM, Widyaparaga A. Simulating Socio-Technical Transitions of Photovoltaics Using Empirically Based Hybrid Simulation-Optimization Approach. Sustainability. 2022; 14(9):5411. https://doi.org/10.3390/su14095411
Chicago/Turabian StyleNurwidiana, Nurwidiana, Bertha Maya Sopha, and Adhika Widyaparaga. 2022. "Simulating Socio-Technical Transitions of Photovoltaics Using Empirically Based Hybrid Simulation-Optimization Approach" Sustainability 14, no. 9: 5411. https://doi.org/10.3390/su14095411
Note that from the first issue of 2016, this journal uses article numbers instead of page numbers. See further details here.