
Assessing Carbon Pools of Three Indigenous Agroforestry Systems in the Southeastern Rift-Valley Landscapes, Ethiopia


1
Department of Forest Biodiversity and Nature Conservation, Federal Research and Training Centre for Forests, Natural Hazards and Landscape, Seckendorff-Gudent-Weg 8, A-1131 Vienna, Austria
2
Department of Forest and Soil Sciences, Institute of Forest Ecology, University of Natural Resources and Life Sciences (BOKU), Peter-Jordan-Strasse 82, 1190 Vienna, Austria
3
Department of Agroforestry, Wondogenet College of Forestry and Natural Resources, Hawassa University, Shashemene P.O. Box 128, Ethiopia
*
Author to whom correspondence should be addressed.
Sustainability 2022, 14(8), 4716; https://doi.org/10.3390/su14084716
Submission received: 28 February 2022
/
Revised: 31 March 2022
/
Accepted: 11 April 2022
/
Published: 14 April 2022
(This article belongs to the Topic Sustainable Built Environment)
Abstract
:The role of agroforestry (AF) systems in providing ecosystem services is very crucial. The greatest considerable increase in carbon (C) storage is often attained by moving from lower biomass land-use systems to tree-based systems such as AF. However, for estimation of C stocks in indigenous AF systems of southeastern Rift-Valley landscapes, Ethiopia, the data are scarce. This study was aimed to investigate the biomass, biomass carbon (BC), and soil organic carbon (SOC) stock of Enset-based, Enset-Coffee-based, and Coffee-Fruit-tree-Enset based AF systems. Comparison of SOC stock of AF systems against their adjacent monocrop farms was also investigated. Research questions were initiated to answer whether C stocks among the three AF systems vary because of different management systems and how biomass C stock is influenced by species abundance, diversity, and richness in the AF systems. The study was carried out at three selected sites in the Dilla Zuria district of Gedeo zone. Twenty farms (total of 60) representative of each AF system were arbitrarily selected and inventoried, and the biomass C stocks estimated. Ten adjacent monocrop farms which were related to each AF system were selected in a purposive manner for comparison of SOC stock. Inventory and soil sampling were employed in the 10 × 10 m farm plot. The mean AGB ranged from 81.1 to 255.9 t ha−1 and for BGB from 26.9 to 72.2 t ha−1. The highest C stock was found in Coffee–Fruittree–Enset based (233.3 ± 81.0 t ha−1), and the lowest was in Coffee–Enset based AF system (190.1 ± 29.8 t ha−1). The result showed that SOC stocks were not statistically significant between the three AF systems, although they showed a significant difference in their BC stock. The C stocks of the investigated AF systems are considerably higher than those reported for some tropical forests and AF systems. The SOC of AF systems is significantly higher than the ones for the adjacent monocrop farms. Therefore, it can be understood that the studied AF systems are storing significant amounts of C in their biomass as well as in soil. This considerable C storage by these systems might contribute to climate change mitigation.
Keywords:
biomass; carbon pool; indigenous agroforestry system; coffee; Enset; southeastern Ethiopia1. Introduction
Agroforestry (AF) practices integrate trees and shrubs in the farmlands and the implementation of agroforestry in a given landscape plays a meaningful role in moderating the effects of climate change through sequestration of carbon (C) [1,2,3]. Agroforestry is recognized as one of the greenhouse gas lessening strategies under the Kyoto Protocol, which was adopted in 1997. As a result, the sequestration potential of agroforestry systems has gained the attention of many countries throughout the world, prompting them to concentrate on it. Several authors have suggested that trees in agroforestry practices absorb and store larger quantities of atmospheric carbon dioxide (CO2) than do the herbaceous seasonal or annual crops and pastures [4,5,6]. This is because incorporation of perennial trees and shrubs in croplands and pastures would result in higher C sequestration both in biomass and the soil [5,7]. Therefore, improving C stock in farmlands by introducing AF practices could be a potential option to mitigate climate change impacts [1]. Worldwide, the whole land area covered with various types of AF systems is projected to be around 1.6 × 10⁹ hectares, with an aboveground biomass sequestration potential of 1.1–2.2 billion t C in the coming 50 years [8]. Furthermore, [9] reported that the Earth’s area that is appropriate for practicing agroforestry is approximately 222 × 107 hectare (ha), and if AF systems are turned into effect on these suitable areas, then more than 55.3 billion t C could be stored in the terrestrial ecosystems during the next 50 years. The amount of C sequestered in an AF system mainly depends on the species composition, arrangement, and role of components within the system, which in turn is determined by the ecological and socioeconomic aspects [10,11].
The capacity of AF systems to store C varies among different agroecological landscapes. As a result, the storage potential for semiarid, subhumid, humid, and temperate regions is estimated at 9, 21, 50, and 63 t C ha−1, respectively [12]. Extensive reviews by [13] for West African Sahel countries (extending from arid Sahara Desert to humid region Guinea) reported biomass C stocks ranging from 22.2 to 70.8 t C ha−1. There are many similar studies conducted in various regions of the continents [14,15,16,17]. As reports showed globally, the total biomass C stock for AF systems ranges between 12 and 228 t C ha−1 [10,18]. Another study by [19] reported that AF practices stored C ranging from 0.29 to 15.21 t C ha−1 yr−1 in their aboveground biomass and can have from 30 to 300 t C ha−1 in their soil down to one-meter depth. Soil C stock for the 0–60 cm soil layer differs among different land uses and regions. For instance, the C stock in the abovementioned soil layer is 121–123 t ha−1 for tropical forests and 110–117 t ha−1 for tropical savanna [20]. Some studies conducted in southern Ethiopia by [21,22,23] showed that the indigenous AF systems have a great potential in sequestering a significant quantity of C. Species composition of the AF, age, geographical location [24], previous land use [25,26], climate, soil characteristics, the method of combining crops and trees, and handling technique [15,27,28] are some of the factors that have a great influence on the variation in C sequestration potential of these systems.
The entire area covered by AF systems in Ethiopia is not well recorded, although according to some estimates based on satellite imagery for the base year 2006, roughly 2.32 million ha are classified AF land-use [29]. However, this figure did not include scattered trees on crop and grazing lands due to some reasons. The latest estimate by [30] projected the AF area in the country to 16 million ha by 2020. Agroforestry practices in Gedeo zone of southern Ethiopia are known to have a long traditional and to be indigenous in nature. Gedeo agroforests are also a well-known land-use system, and it is believed to have self-sustaining and self-regulating attributes compared to other land-use systems in the area [31]. Studies have been conducted by different researchers in Ethiopia [32,33,34,35] on the aspects of management of AF systems, component interaction in these systems, and determinants for diversity and composition in AF and additional ecosystems services in Gedeo zone and other locations. Some studies were already conducted by [23,36] on C stocks in AF systems in Gedeo and nearby regions. However, the study and comparison of carbon stocks in three indigenous AF systems, such as Enset based, Coffee–Enset (C–E) based, and Coffee–Fruit-tree–Enset (C–Ft–E) based agroforestry (AF) systems, is thought to be highly relevant and complementary to the existing research findings. Furthermore, this study used C stocks for monocrop systems as a control, which was not done in a prior study at the same location [22].
The general objective of this study was to determine and compare the C stock of the three AF systems and also relate them to traditional field-crop agriculture. The specific objectives were (1) to determine and compare the biomass of the fruit and nonfruit trees, coffee, enset, and litter of the three AF systems; (2) to determine and compare the C stocks among the studied AF systems and (3) to compare the C stock of AF and adjacent field-crop agriculture as control. Research was initiated to answer the following questions: Could carbon stocks among the three indigenous AF systems vary because of different management systems? Is there a difference in soil organic carbon stock among the three AF systems and in relation to field-crop agriculture? Is biomass carbon stock affected by the species abundance, diversity, and richness in the three AF systems?
2. Materials and Methods
2.1. Study Area and Sites
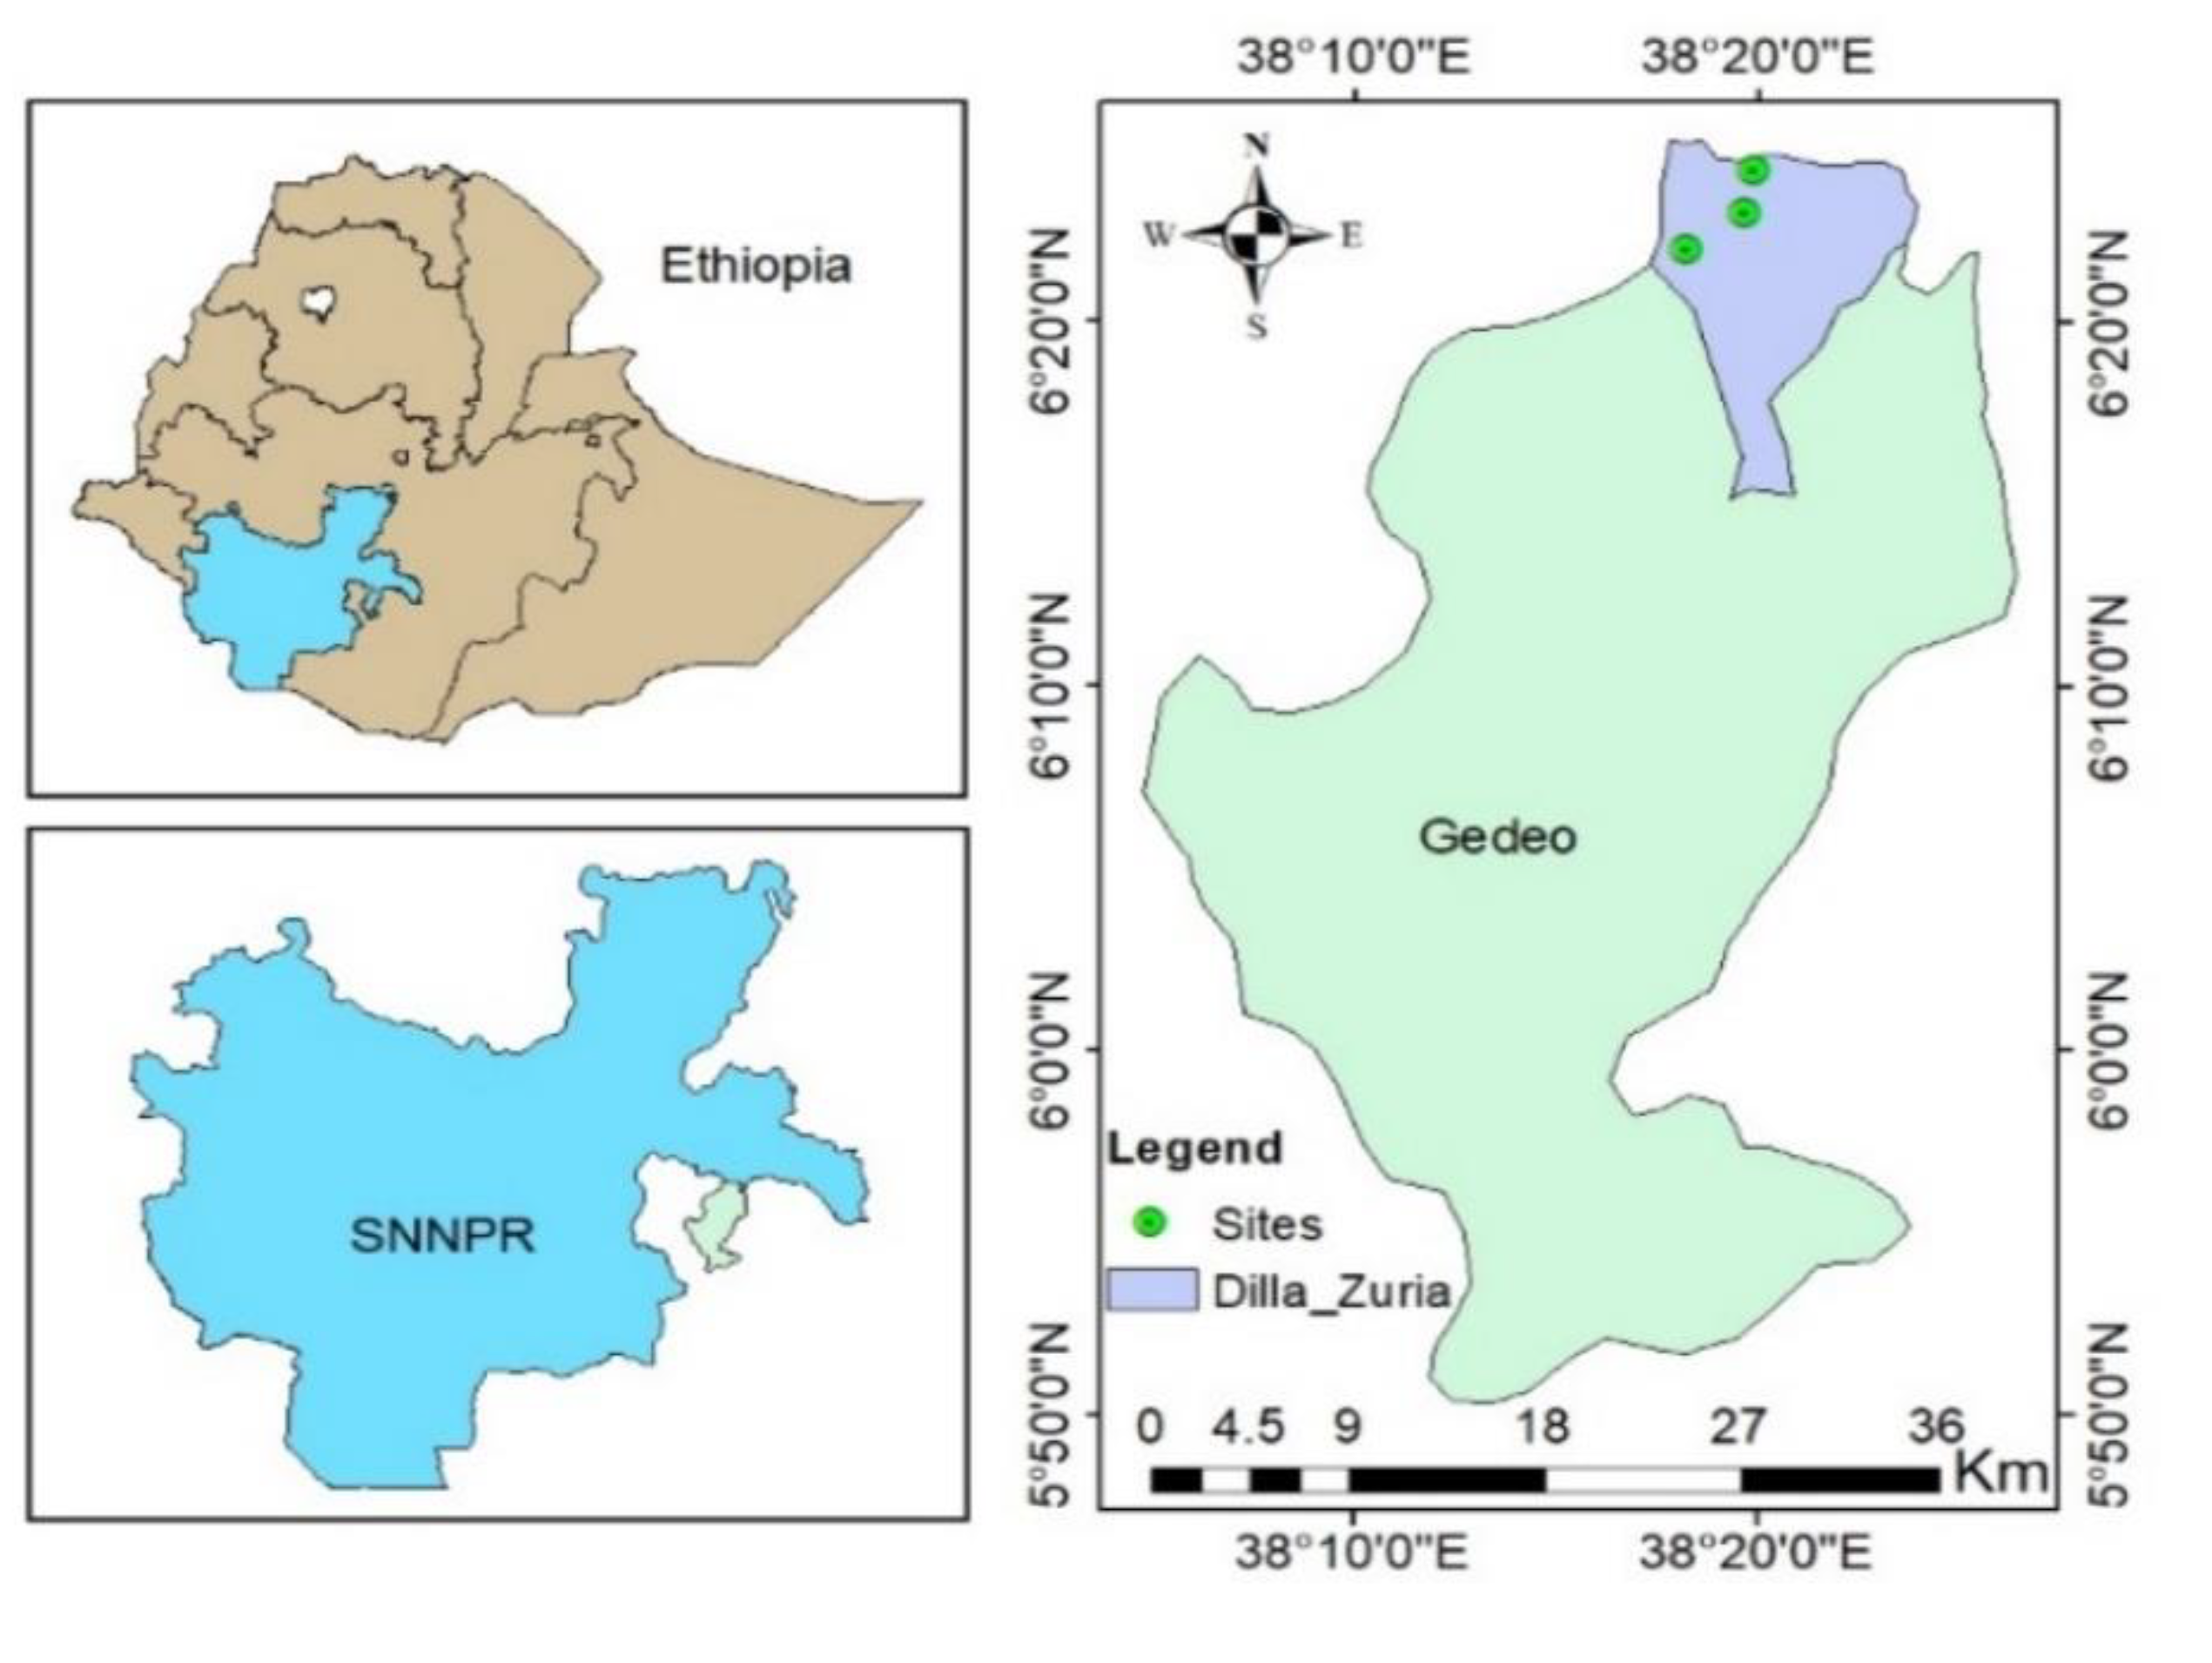
This research was carried out in the Dilla Zuria district of Gedeo zone, Southern Nations, Nationalities, and Peoples Regional State (SNNPRs), Ethiopia (Figure 1). Geographically, it is located between 5°50′26″ and 6°12′48″ N latitude and 38°03′02″ and 38°18′59″ E longitude. Elevation in the study area ranges between 1300 and 3064 m above sea level (m asl). According to the meteorological data of 9 years, the annual rainfall ranged from 1127 to 1624 mm, and the mean monthly air temperature ranged from 13 to 28 °C [37]. The entire area of the zone is 134,700 ha, which is divided into different land-use types, such as agricultural land and AF together which accounts 94.5%, along with grassland (1.4%), wetland (0.8%), natural forest (0.5%) plantations (0.1%), and others (2.7%) [38]. The soil type is Nitisol and the texture is predominantly clay. The livelihood of the community under this district is mainly dependent on AF practice. They use mixed farming, including nonfruit trees, fruit trees, crops, vegetables, spices production, and very limited animal husbandry focused on oxen, goats, and sheep fattening. Although there are several types of AF systems practiced by the farmers, the main and most common are (1) Enset based AF system (mainly practiced at the Sisota site), (2) Enset–Coffee based AF system (practiced at the Golla site), and (3) C–Ft–E based AF system (practiced at the Chichu site); see Table 1 for detailed information.
2.2. Characteristics of the Three Indigenous Agroforestry Systems That Relate to the Study
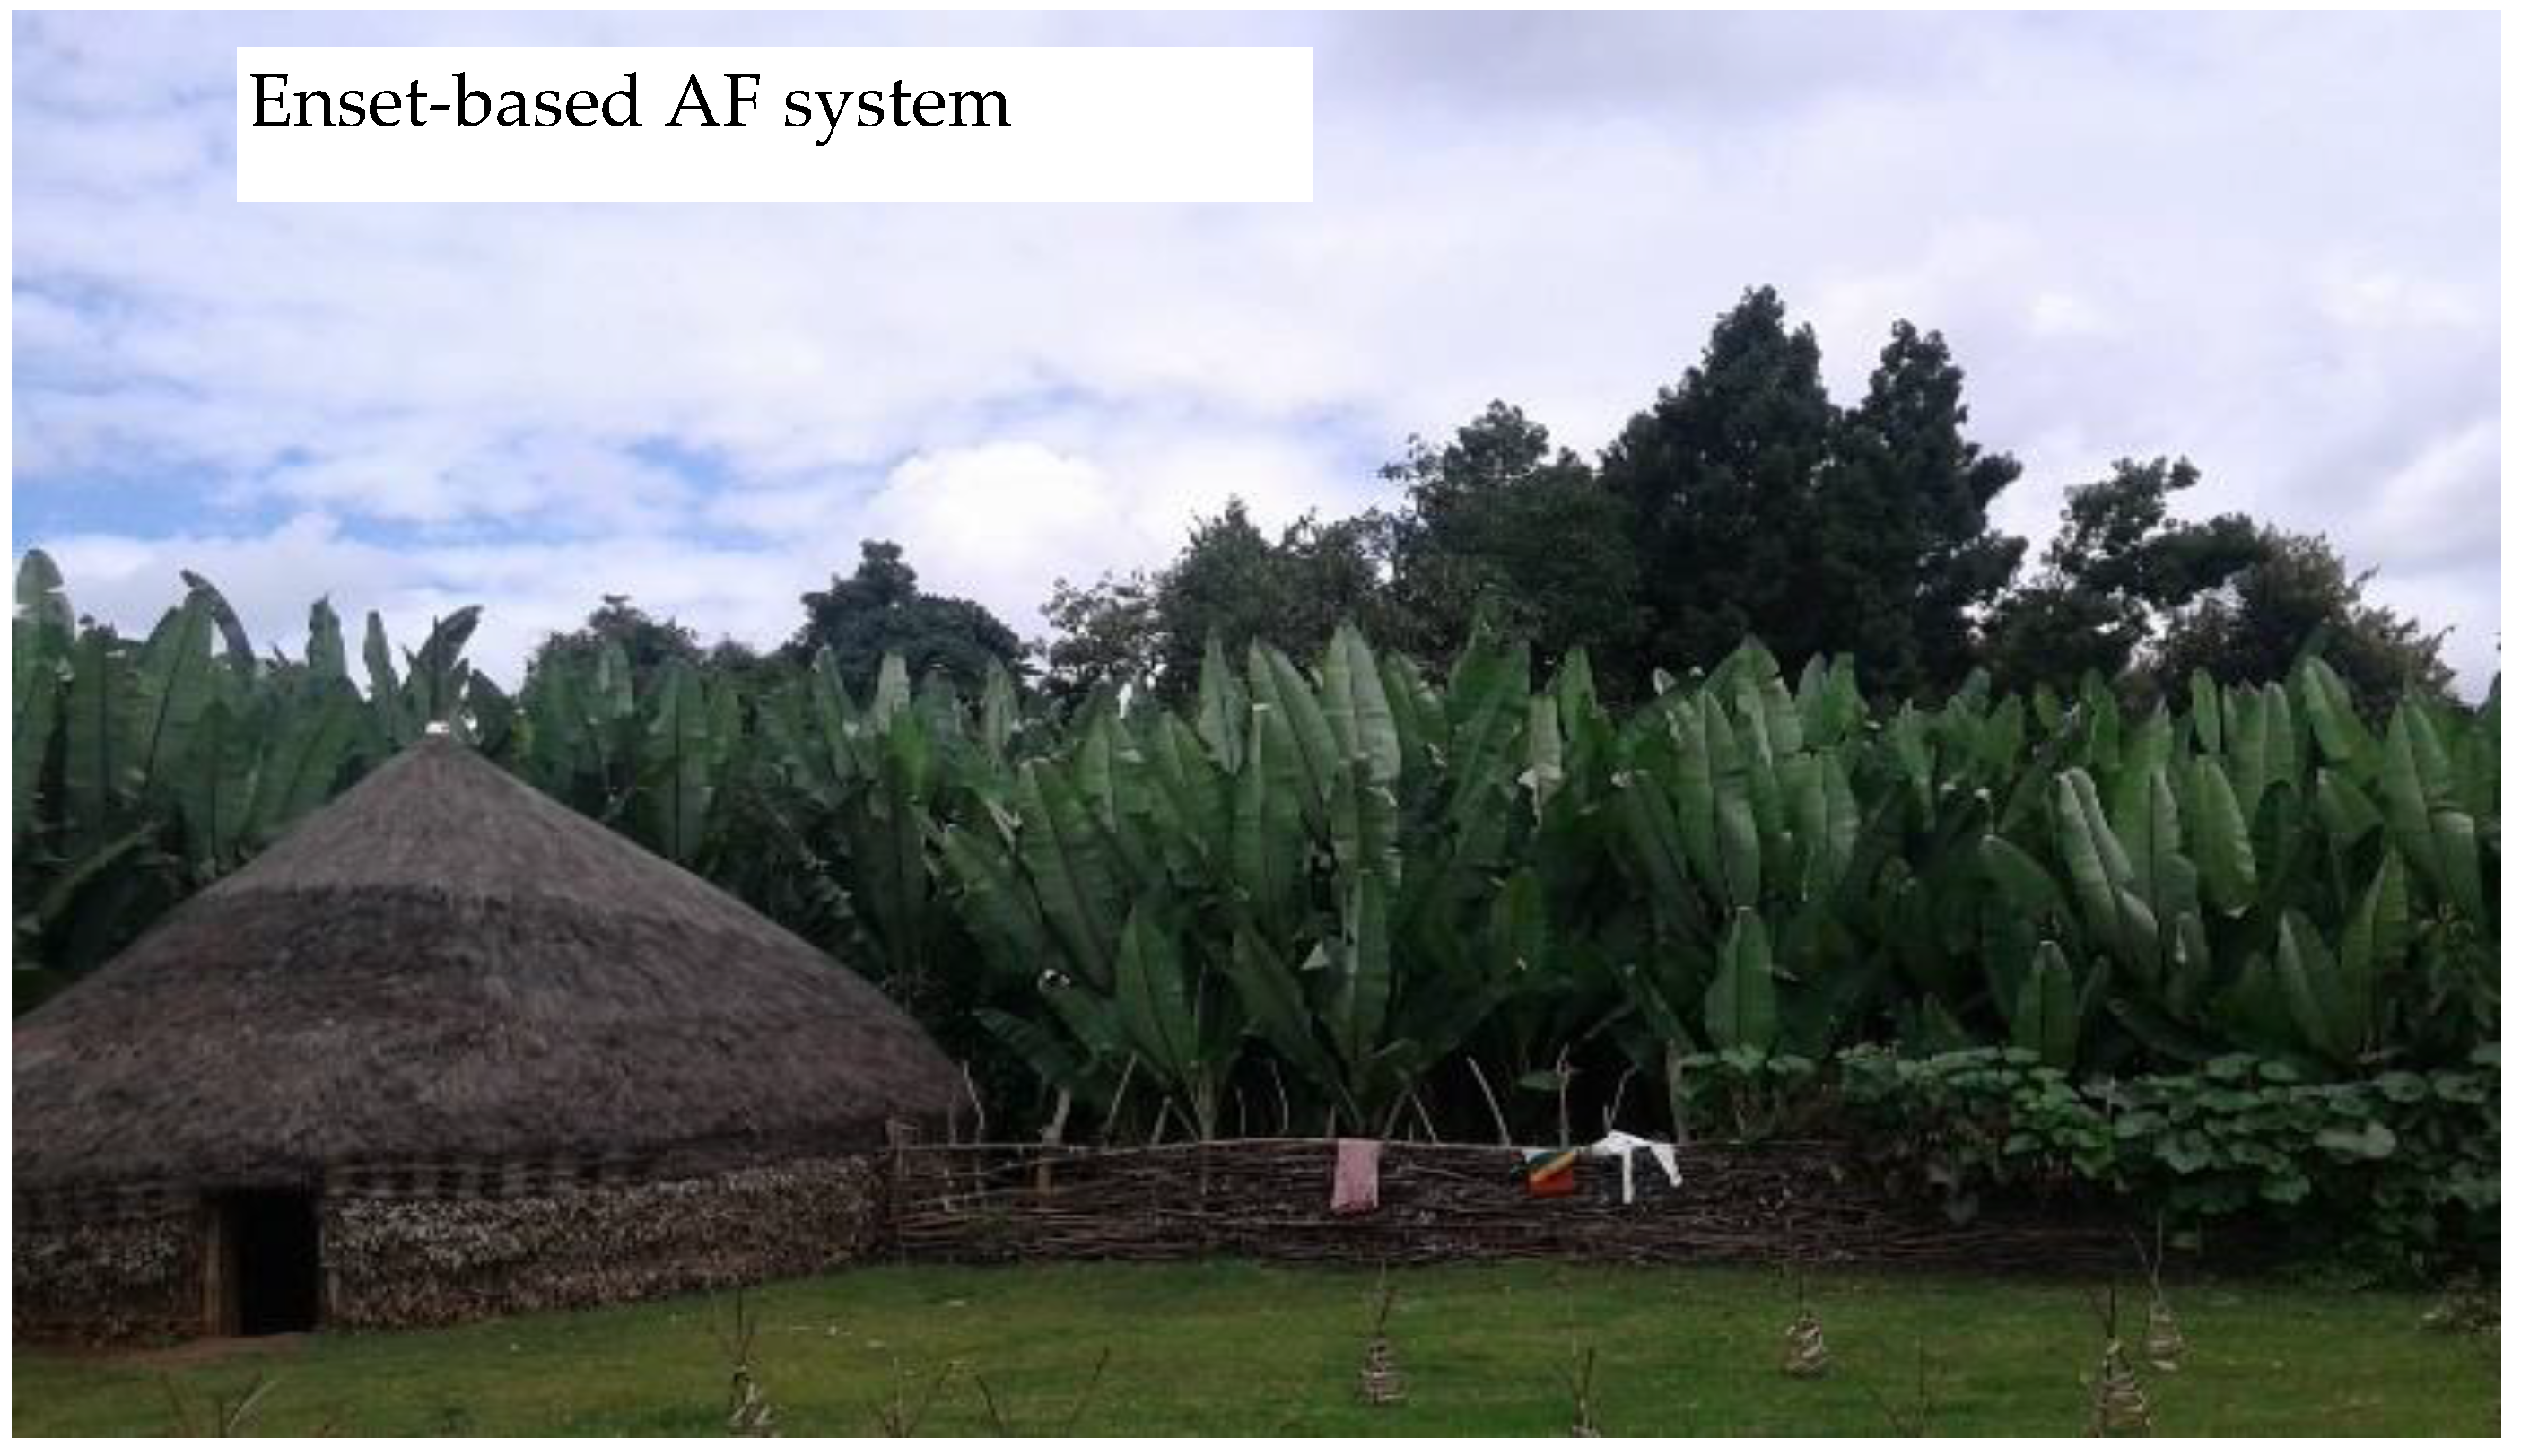
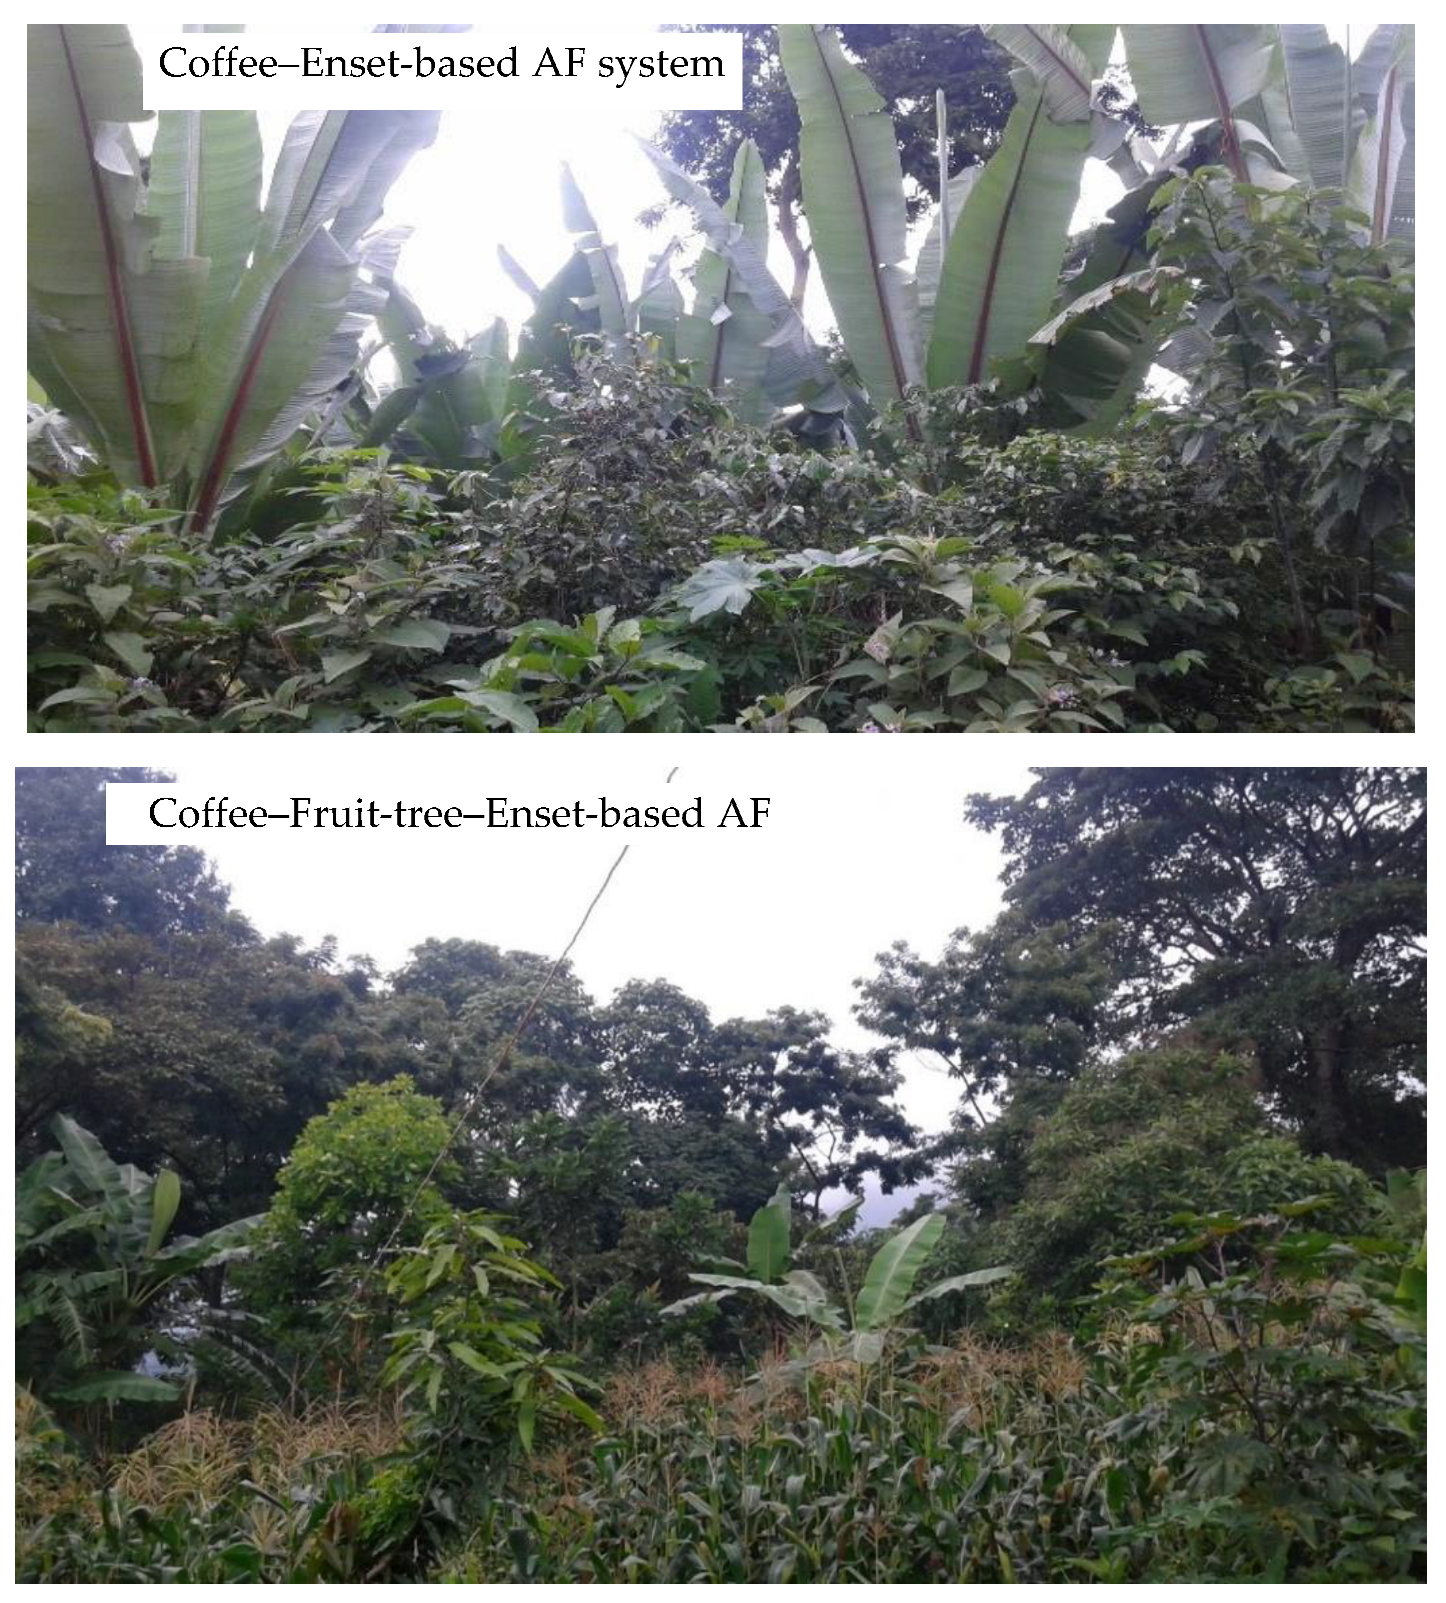
A brief description about the abovementioned AF systems is given in Section 2.2.1–2.2.3 and a photograph of each AF system is shown in Figure 2.
2.2.1. Enset Based Agroforestry System
Enset based AF systems are common in central, southwestern, and southern Ethiopia [39,40,41]. The areal coverage of enset in this system could be approximately within a range of 60–70% of the farm total depending on the presence of other plant species and their composition. Enset (Ensete ventricosum) is one of the species from the Musaceae family, which is also commonly known as false banana. This perennial species is native and domesticated as one of the important crops in Ethiopia. The enset can be either cultivated in monospecific plantations or in mixture with a rotation period of 3 to 15 years [42,43]. To bear flowers and then set seed, the plant might take 9 or more years [44]. Enset is among homegarden crops known for its high energy content [45].
2.2.2. Coffee–Enset Based Agroforestry System
The Coffee–Enset based agroforestry (C–E based AF) system is one of the traditional AF homegardens in southern Ethiopia [39]. The system is suitably practiced in an altitude range between 1500 and 2300 m asl. In this altitude, moisture and temperature conditions are expected to be conducive for these AF practices. The two dominant native perennial crops in this AF are enset and coffee, which comprise more than 60% in each farm [32]. Enset is a staple food crop, and coffee (Coffea arabica) serves as a cash crop. Coffee also contributes more than 60% of export income in Ethiopia and has been sold as organic [46,47]. Owing to their great socioeconomic and ecological benefits in the farming system of the study area, the crops can be deemed as “keystone” species in south Ethiopian AF. Coffee–Enset based AF systems harbor several native woody species (Cordia africana, Millettia forginea, roots (ginger, sweet potato), and annual crops (maize) favorably growing in intimate association with enset and coffee.
2.2.3. Coffee–Fruit-Tree–Enset Based Agroforestry System
Multipurpose tree/shrub species such as coffee, enset, several fruits, and annual crops, vegetables, medicinal plants, and livestock are components of the Coffee–Fruit-tree–Enset (C–Ft–E) based agroforestry system. Under this type of indigenous AF system, coffee, fruit tree, and enset have a greater share, and the remaining components such as vegetables, spices, and livestock are still included [48]. The proportional area for coffee, fruit tree, and enset is approximately 20–25% for each component. In the C–Ft–E based AF system, fruit trees such as Persea americana Mill., Mangifera indica L. Casimiroa edulis Lal Llave and Lex., etc., are in a mixture with coffee and enset. In addition, nonfruit trees, for instance Cordia africana, Milletia ferruginea, Ficus vasta, and Ficus sur, are also incorporated and mainly used as a shade for coffee. Communities practicing this type of AF system are self-sufficient in fuel wood, and the fruit trees and coffee account for 47% and 45% of their annual income, respectively [48].
2.3. Sampling Design and Data Collection
2.3.1. Inventory for Biomass Estimation
The agroforestry systems were selected at similar altitudinal locations gradient of the landscape to minimize variation in climatic variables and slope. Within each AF study site, 20 AF farms (60 farms in total) were randomly selected, and ten adjacent monocrop farms (30 farms in total) were selected in a purposive manner. The altitude, slope, GPS location, agroforestry type, age of each agroforestry, and monocrop farm and site history were also recorded.
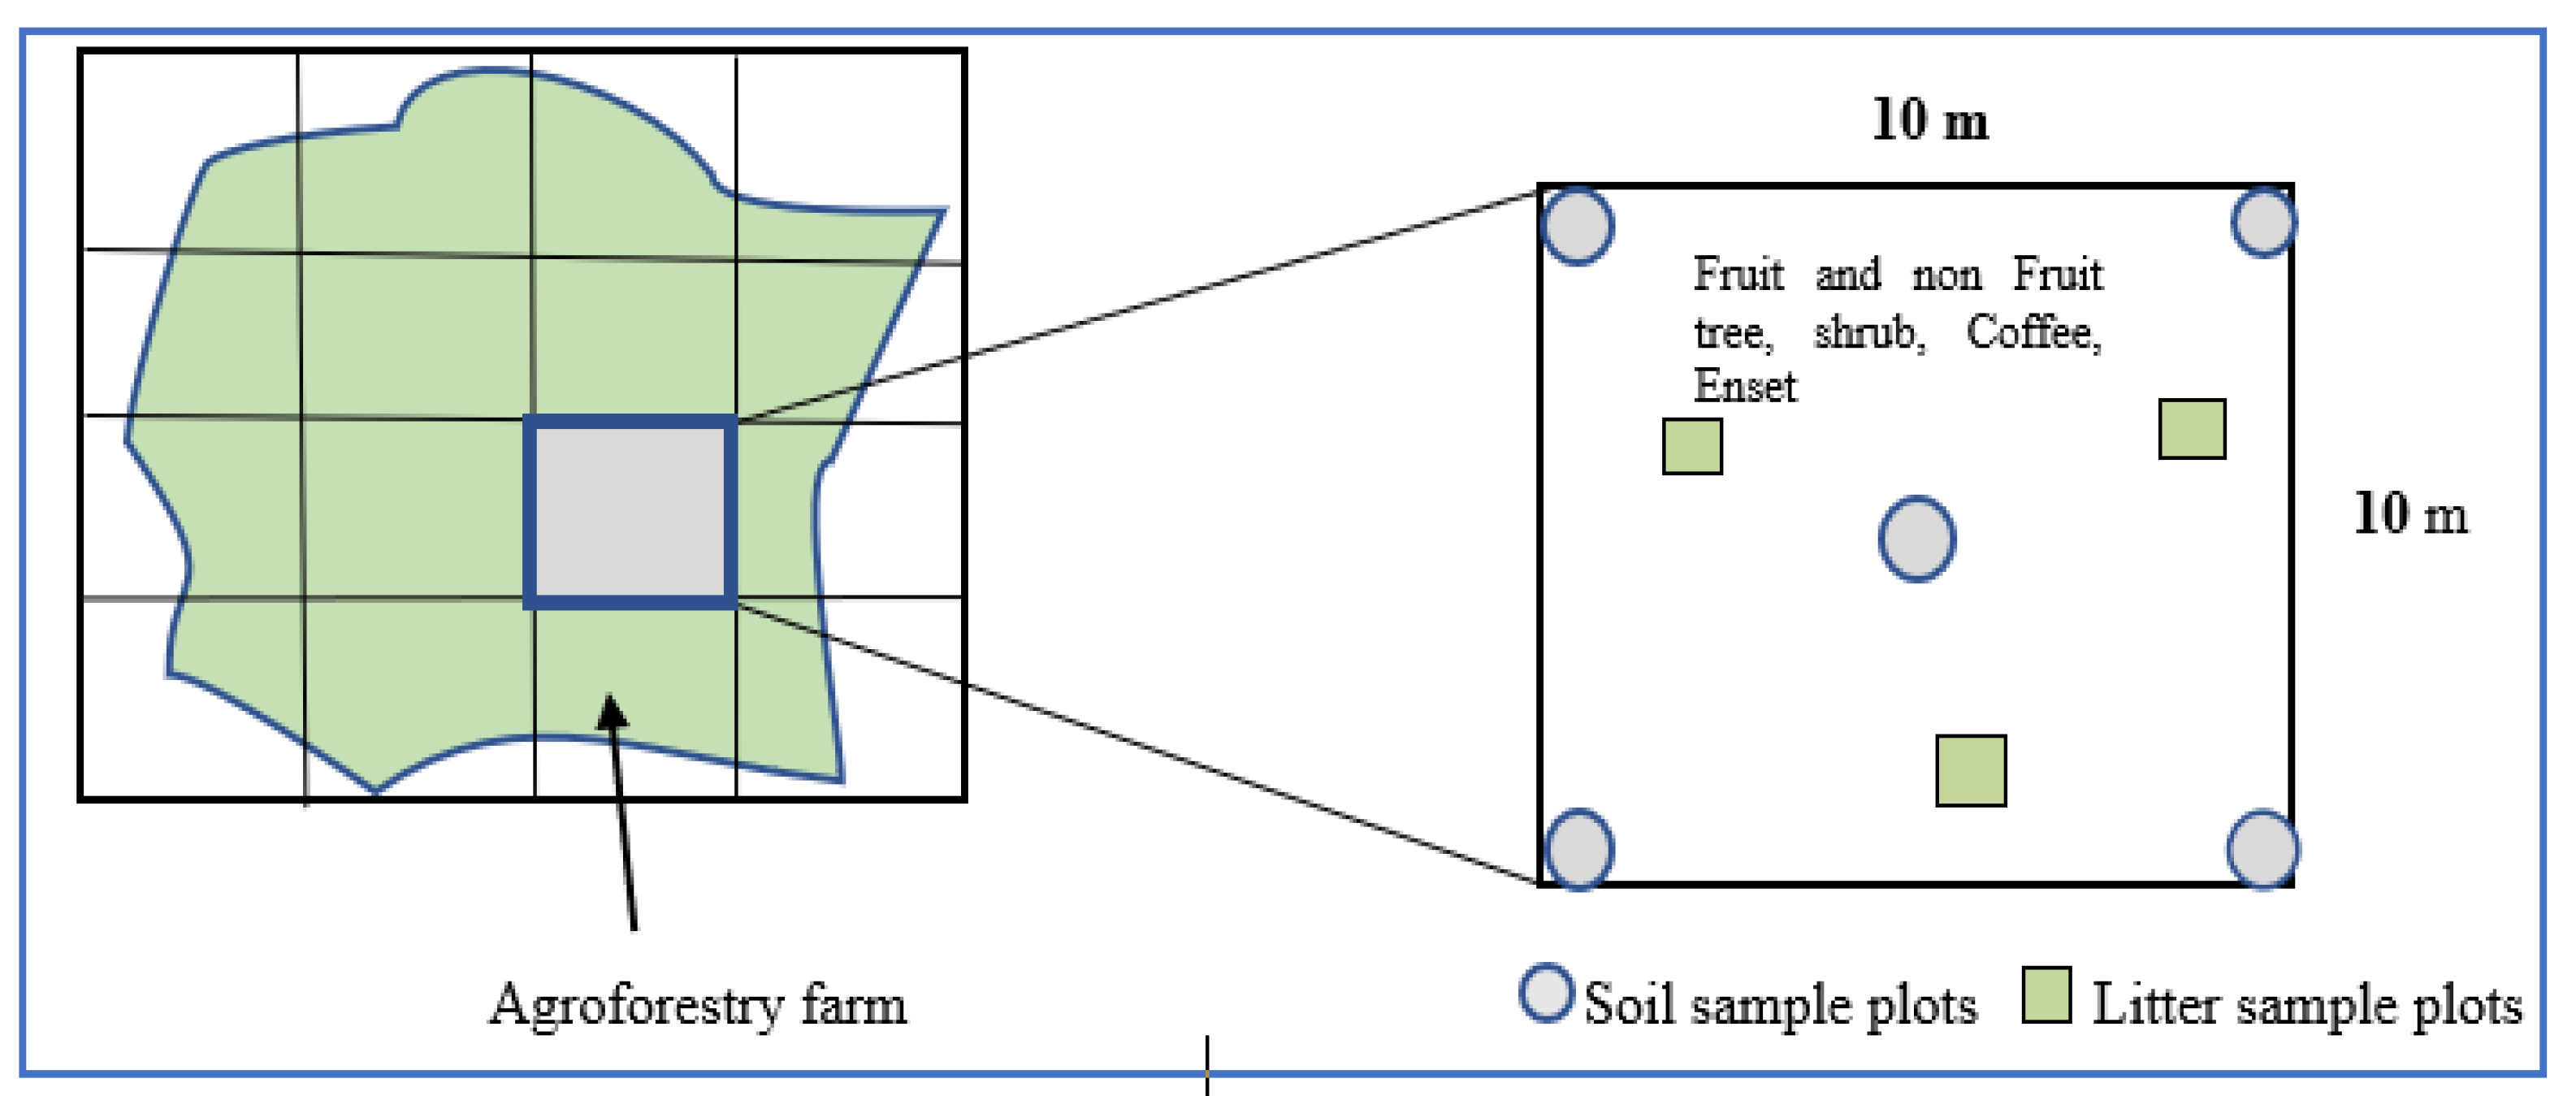
A nested quadrat with 10 × 10 m size was established in each AF farm for the inventory of trees/shrubs, coffee, and enset (Figure 3). The inventory was aimed to obtain data for the biomass estimation. The size of the quadrats and sampling size coincided with recommended practice in the literature for similar AF farms [36]. In some cases, the size of the quadrant might occupy the whole farm. Because of the small size of some farms, cost, and time-related issues, the size of the quadrant was limited to 100 m2. Within each quadrant, three 50 × 50 cm small plots for litter sampling were laid out (Figure 3). In addition, five circular plots at four corners of the quadrant and one in the center were determined for soil sampling.
Measurements such as diameter at breast height (DBH, cm ±0.1), total height (h, m ±0.1) of all trees and shrubs (single and multistemmed) having a breast height diameter ≥2.5 cm and height ≥1.5 m was made. For coffee plants (in C–E based and C–Ft–E based AF systems), the stem diameter at stump height (40 cm), d40, was also measured. For Enset based AF systems, the basal diameter of the pseudostem (height of 10 cm, d10) of plants one-year-old or older was measured. Stem diameter measurements (DBH, d10, and d40) were taken using a caliper in two vertical directions to minimize measuring error. The two values were averaged and later used in successive computations.
2.3.2. Biomass and Determination of Biomass C Stocks
Estimation of total aboveground biomass (AGB) and belowground biomass (BGB) (t ha−1) of fruit trees and nonfruit trees and shrubs, enset, and coffee plants were done for the 60 farms (20 farms from each AF). However, 30 farms (10 farms from each AF) were randomly selected, and the biomass C stocks (t C ha−1) were estimated. Unlike the fine roots and herbs C stocks of the trees and shrubs, the enset, coffee, and litter were computed. For some reason, fine roots and herbs were excluded from the computation. The biomass in natural forest/AF could be estimated by both destructive and nondestructive methods. In this study, allometric equations (which are nondestructive) were used. This is because destructive tree harvesting is too costly, labor-intensive, and time-consuming for both AGB and BGB determination. Furthermore, farmers may demand compensating payments for the sampled trees because they may be harvested at the wrong time and/or production is less due to premature cutting.
To compute the AGB and BGB, and their respective C stocks, a plant species inventory followed by the application of allometric equations was performed. These equations were developed by [49,50,51,52]. The reason for adopting these allometric equations is because the study site in which the equation was developed had a similar environmental setting (climate and soils) to our research sites and showed the highest R2, the smallest error of prediction values, and used only DBH for trees [49,50,51,52]. In addition, the similarity in type of plant, plant architecture, and species could be a reason to adapt these equations to this study [51,52]. For instance, [49] developed an equation to estimate AGB of trees grown in AF systems in western Kenya:
where AGB (kg dry matter /plant) = aboveground biomass, d (cm) = diameter at breast height, and ρ is species wood density (g cm−3).
AGB = 0.225 × d2.341 × ρ0.73 R2 = 98; n = 72
However, to estimate the AGB (kg dry matter/plant) of the coffee and enset plants, an allometric equation, which was developed by [52] and [51], respectively, was adopted
where d40 (cm) = stem diameter of the coffee plant at 40 cm height, d10 (cm) = the basal diameter of the enset pseudo stem at 10 cm height, and h (m) = total height.
AGBcoffee = 0.147 × d402 R2 = 0.80, n = 31
ln (AGBenset) = −6.57 + 2.316ln(d10) + 0.124 ln(h); R2 = 0.91, n = 40
For estimating the BGB (stump plus coarse roots (>2 cm)) for trees and shrubs, including coffee, the following allometric equation [50] was used:
where BGB (kg dry matter/plant) = belowground biomass and d (cm) = diameter at breast height.
BGB = 0.490 AGB0.923 R2 = 0.95, n = 72
However, to estimate the BGB of enset (corm plus attached proximal roots), the allometric equation developed by [52] was used:
where BGBenset (kg dry matter/plant) = enset belowground biomass and d10 (cm) = the basal diameter of the enset pseudostem at 10 cm height.
BGBenset = 7 × 10⁻⁶ × d104.083; R2 = 0.68, n = 40
Note: n (in all the formulas) is the number of individual plants that were sampled the development of the allometric equation.
The biomass of litter was determined from samples collected from the three 50 × 50 cm plots within the 10 × 10 m inventory quadrant. Three samples were taken from each quadrant, and later single composite sample was taken for C measurement and analysis.
The BGB and AGB C stocks were determined using content C% in each component. It was computed from organic matter content determined as loss-on-ignition (LOI; ignition at 550 °C for 2 h) and an assumed C content of organic matter of 44% [22]. Accordingly, the C content of 48% for fruit and nonfruit trees and shrubs, 43% for coffee, 41% for enset, and 29% for litter were used [22]. The sum of aboveground and belowground biomass C provided the total biomass C stock for that specific farm or site.
2.3.3. Soil Sampling and Determination of Soil Organic Carbon Stocks
Soil samples were taken from the four corners and center of each 10 × 10 m inventory quadrant, and then a composite soil was used to determine SOC. This was done for soil depths at 0–20 and 20–40 cm. It was assumed that taking samples down to 40 cm soil depth might be sufficient. The total number of samples were 60 for the AF systems and 60 for the adjacent monocrop farms. The sampling depth was chosen concerning the cost for soil analysis and to have a uniform and complete sampling procedure, since the method should be used for the selected AF farms and monocrop farms. The sampling was employed for all three AF systems together with the adjacent monocrop farms. Both gravimetric and volumetric soil sampling methods were employed. The volumetric soil sampling was employed in the middle of each 10 × 10 m inventory quadrant. Volumetric sampling was carried out to obtain soil samples for determination of bulk density, and gravimetric sampling for SOC determination. A 200–250 mg soil sample from each of the 120 samples was weighed, and the SOC content was determined by a LECO TruSpec CN analyzer (ÖNORM L1080). The soil C stocks (t C ha−1) were computed by multiplying the C content (%), bulk density (g cm−3), and layer thickness (cm). The total SOC stock is the summed value of the two layers (0–20 and 20–40 cm). AF C stocks in the study sites were calculated by adding total biomass C and SOC up to 40 cm depth.
2.4. Statistical Analysis
The biomass (t ha−1) of the trees and shrubs, coffee, and enset, was estimated for all 60 farms (smallholdings) using the allometric equations. However, the AF C stocks (t ha−1) were calculated only for the 30 farms (smallholdings), implying ten farms from each AF system. This was because the soil and litter samples were only taken from 30 randomly selected AF farms. The biomass and biomass C stocks for each AF were expressed using the mean, minimum, maximum, and standard deviation statistics. To test for differences in the biomass, biomass C, and soil C between the three AF systems, a one-way ANOVA followed by post hoc testing (Fisher’s LSD test) was used. Levene’s test was conducted to check the homogeneity of variances. Linear regression analysis was also conducted to analyze the relationship between some parameters. Similarly, the soil C stocks for 30 monocrop farms adjacent to the AF farms were also calculated layer by layer and their means were compared. For comparison, a pairwise two-tailed t-test was conducted. The statistical analyses were done using Statistical Package for Social Sciences, IBM SPSS version 26 (SPSS Inc., Chicago, IL, USA, 2019).
3. Results
3.1. Biomass and Biomass Carbon Stocks
The aboveground and belowground biomass and biomass C stock of three AF systems were estimated and the estimation was made for each plant species within the inventoried quadrant. AF system mean AGB and BGB t ha−1 and the biomass values of components of the AF are displayed in Table 2 and Table 3, respectively. The mean AGB ranged from 81.1 t ha−1 (Enset based AF) to 255.9 t ha−1 (C–Ft–E based AF system) and for BGB from 26.9 t ha−1 (Enset based AF system) to 72.2 t ha−1 (C–Ft–E based AF system) (Table 2). The AGB was by far higher than the BGB across all the AF systems. In C–Ft–E AF, the AGB was even 3.5-fold compared to its respective BGB, which is extremely high. The total calculated biomass values in the studied three AF systems ranged from 108.0 to 328.1 t ha−1. The one-way ANOVA followed by post hoc testing (Fisher’s LSD test) (n = 20) results showed that the mean AGB, BGB, and total (aboveground plus belowground) between the three AF systems was significant at (p < 0.05) (Table 2). In general, the biomass t ha−1 is in the order: C–Ft–E based AF > C–E based AF > Enset based AF.
The biomass contribution from individual components (e.g., fruit tree, nonfruit tree, enset, and coffee) to the each of the three AF systems was computed. As shown by the results in Table 3, the contribution was higher from the woody fruit and nonfruit trees across all the AF systems. The contribution from nonfruit trees and shrubs was relatively higher in all AF systems except in C–Ft–E based. The result of one-way ANOVA followed by post hoc testing (Fisher’s LSD test) (n = 20) showed that the total biomass of fruit trees and nonfruit trees in C–Ft–E based AF system was significantly different at (p < 0.05) from both Enset based and C–E based AF systems, but Enset based and C–E based AF were not significantly different (Table 3).
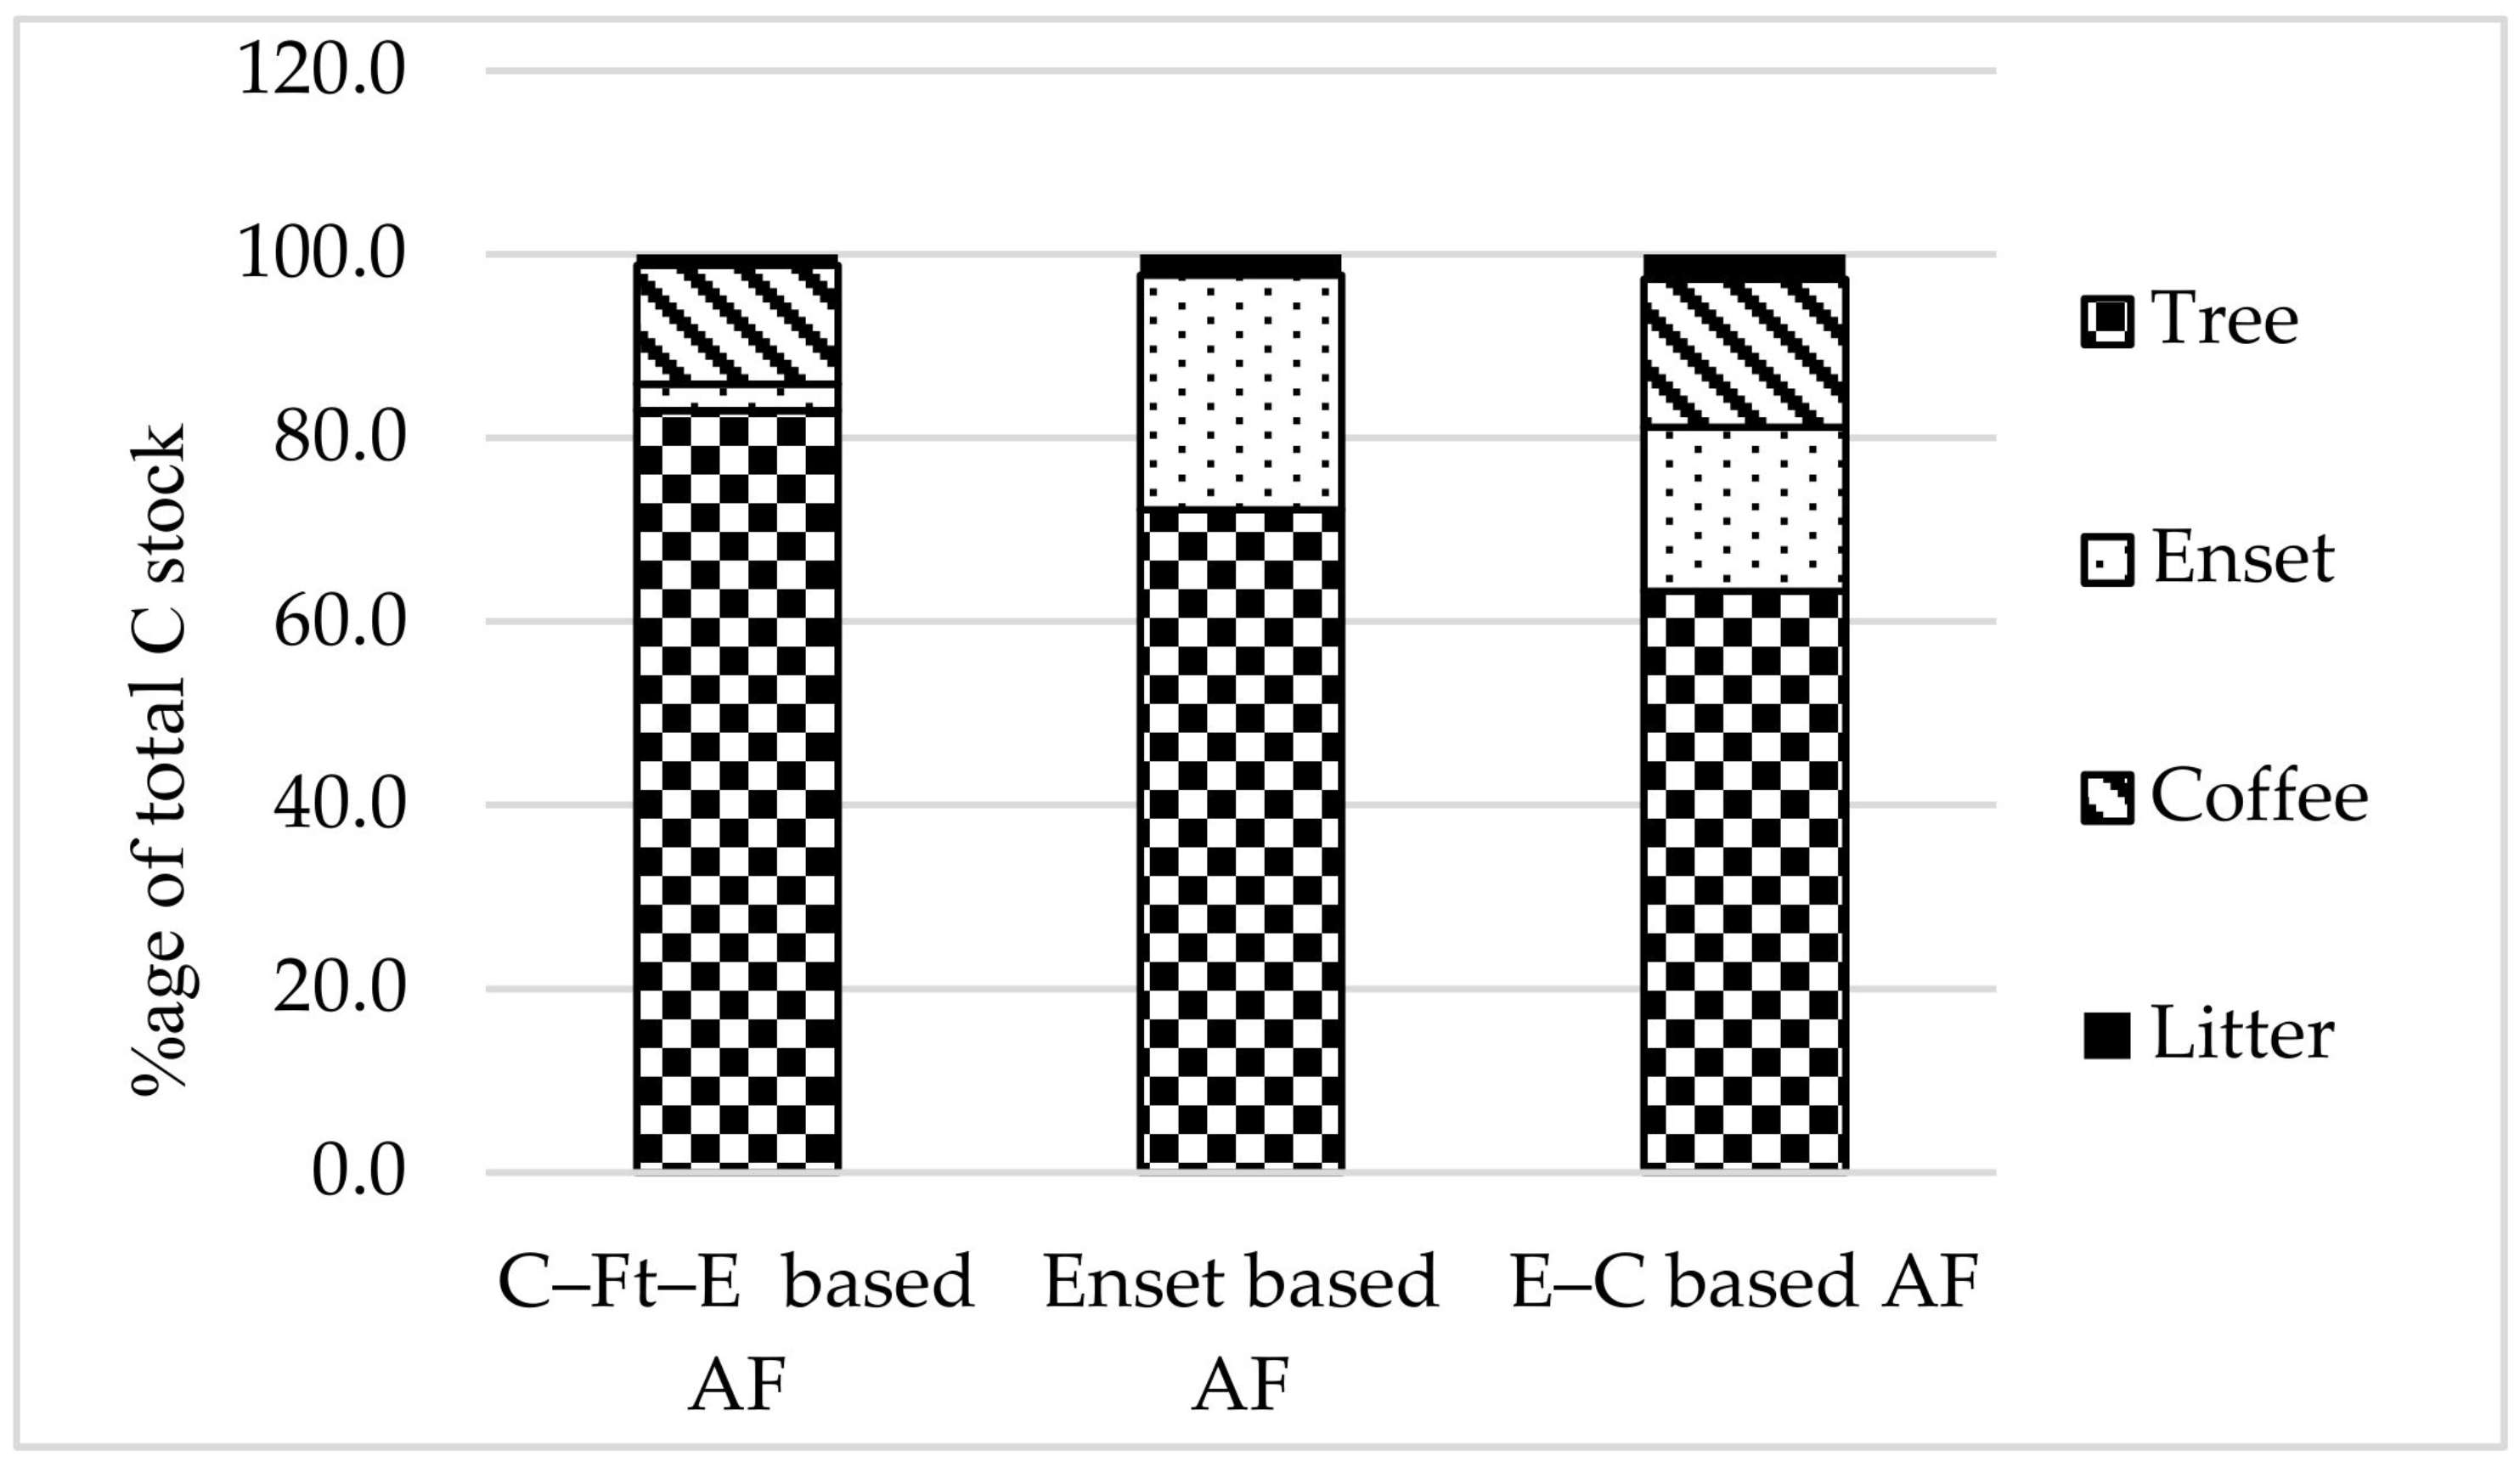
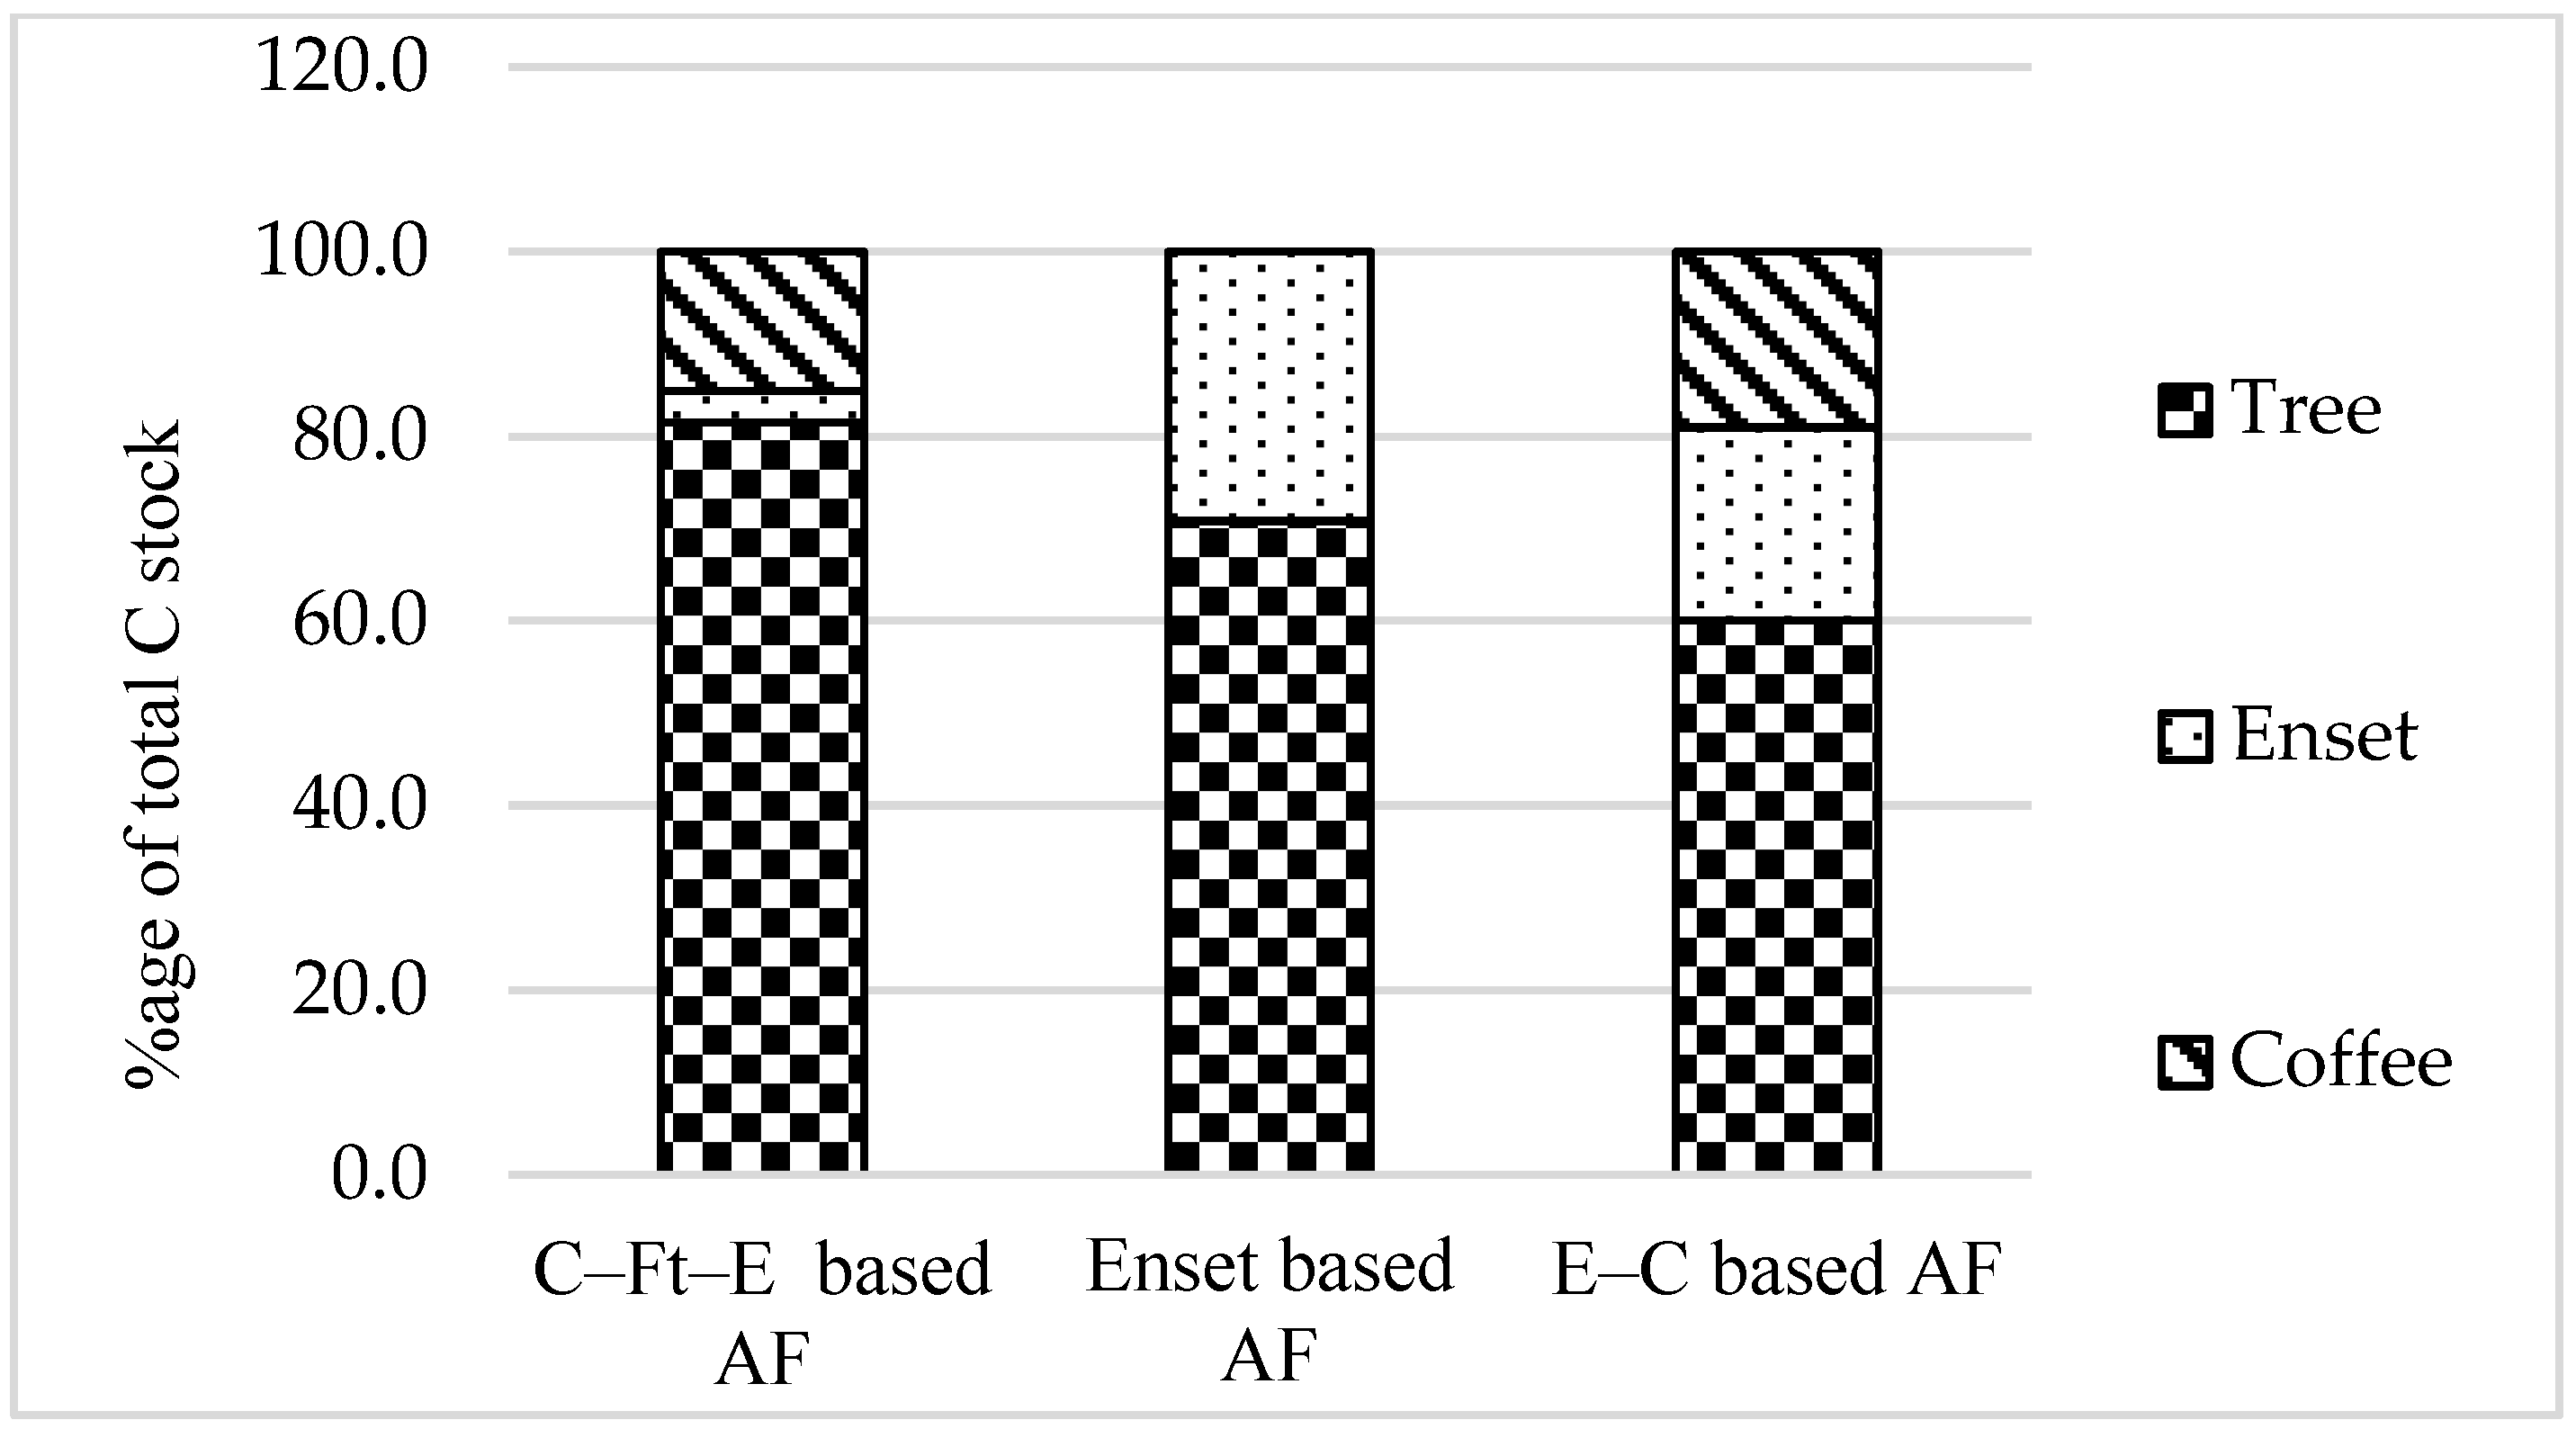
Regarding the C stock, only 10 out of the 20 farms were randomly selected and computed for their biomass C stocks. This is because the numbers of farms where we obtained soil and litter samples were only from the ten farms. In addition, soil sample collection from monocrop farms was only carried out on 30 smallholdings (10 for each), which are adjacent to the AF farms. Therefore, to estimate ecosystem C stock, a uniform representation of samples from all components (standing biomass, litter, and soil) is very important. The AGB carbon stock ranged from 10.2 to 212.9 t ha−1 across the three AF systems, while the average C stock in BGB ranged from 2.9 to 56.1 t ha−1. In the case of individual AF farms, the highest total biomass C stock was recorded in the C–Ft–E based AF system (269 t ha−1), and the least was in an Enset based AF system (13 t ha−1). The ratio of mean AGB to BGB carbon stock was 3.4, 3.1, and 3.0 for C–Ft–E based, Enset based, and C–E based AF systems, respectively. The share of fruit and nonfruit woody species in the total AGB carbon stock was estimated at 83%, 72%, and 63% for C–Ft–E based, Enset based, and E–C based AF systems, respectively (Figure 4). The share of trees (fruit trees and nonfruit trees) in the total BGB C stock was estimated at 82%, 71%, and 60% in C–Ft–E, Enset based, and E–C based AF systems, respectively (Figure 5). On average, trees accounted for 73% in AGB and 71% in BGB C stock across all smallholdings. The results of the statistical analysis showed that the total mean biomass C stock of C–Ft–E based AF was significantly different at (p < 0.05) from both Enset based and C–E based, but Enset based and C–E based AF were not significantly different. We hypothesized that biomass C stocks would differ significantly amongst AF systems, and our findings supported this hypothesis. In general, the total biomass C stock of the AF systems is in the order C–Ft–E based AF > Enset based AF > C–E based AF (Table 3).
3.2. Soil Organic Carbon Stock
In the current study, considering all the individual farms, the greater SOC stock was found in C–E based AF, which is 190 t ha−1, while the least was found in C–Ft–E based AF with a value of 86 t ha−1. From the total SOC stock (0–40 cm), the upper soil layer (0–20 cm) contributed an average of 60.3%, 56%, and 55.1% for C–Ft–E based AF, Enset based AF, and C–E based AF, respectively. The highest total mean SOC stock for the AF systems was found in Enset based (146.1 t ha−1) and the least was in C–Ft–E based AF (125.5 t ha−1). The results of ANOVA analysis showed that the mean SOC stock was not significantly different among the AF systems at (p < 0.05) (Table 4). In general, the total mean SOC stock of the AF systems is in the order Enset based > C–E based > C–Ft–E based AF system.
3.3. Ecosystem Carbon Stocks
The mean AF total C stock for C–Ft–E based was relatively high and the least was recorded in C–E based AF (Table 4). The result of one-way ANOVA followed by post hoc testing (Fisher’s LSD test) (n = 10) at (p < 0.05) showed that the total AF C stock and SOC stock were not statistically significant among the three AF systems, although they showed a significant difference in their biomass carbon (BC) stock.
Total AF C stock of individual AF smallholdings in this study ranged between 132.0 t ha−1 (Enset based AF) and 356.4 t ha−1 (C–Ft–E based AF). The mean biomass C stock fraction of the total AF C stock was 46%, 26%, and 27% for C–Ft–E based AF, Enset based AF, and C–E based AF, respectively. Except for C–Ft–E based; the remaining two AF systems had a greater contribution from the SOC (about 2.8 times the biomass C) to their respective total AF carbon stock. The SOC exceeds the biomass C across all AF systems (Figure 6), and there was a difference in SOC to total biomass C stock ratio among the AF systems. The highest proportion of SOC (0–40 cm) to total biomass C stock was found in Enset based AF with a value of 2.82, and the least was in C–Ft–E based AF with a value of 1.16. The contribution of SOC to the total AF C stock was 54% for C–Ft–E based, 74% for Ensetbased, and 73% for C–E based AF.
3.4. Correlation between Biomass Carbon and SOC of Agroforestry Systems
For the ten selected farms in all three AF systems, the result of Pearson correlation (two-tailed significance difference) showed that biomass C stock and SOC stocks had r-values of −0.005 for C–Ft–E based AF, 0.5 for Enset based AF, and −0.3 for C–E based AF (Appendix A). The correlation under Enset based AF showed a positive and a slightly higher value, but it was not statistically significant. A correlation analysis of SOC stock with other factors such as slope percent and wealth status of the households (rich, medium, and poor) was conducted. In addition, a correlation of SOC stock, number of livestock units owned, and age of the AF farm was conducted. These factors were believed to act as proxy variables for the intensity of biomass extraction from the AF system and thus affect the SOC stock on each farm. Accordingly, the correlation results of SOC stock with the farm’s age showed a positive correlation with r-values 0.7, 0.64, and 0.44 for Ensetbased, C–E based, and C–Ft–E based AF systems, respectively. The r-values under Ensetbased and C–E based AF systems were statistically significant. Most AF farms that have an older age showed a higher amount of SOC stock. However, SOC stock was negatively correlated with slope percent and showed r-values −0.61, −0.55, and −0.21 for Enset based, C–E based, and C–Ft–E based AF systems, respectively.
The correlation results of SOC stock with the households’ wealth status (rich, medium, and poor) showed that there is higher SOC stock on farms owned by wealthy farmers across the three AF systems. A positive correlation was observed with r-values of 0.37, 0.47, and 0.34 for Enset based, C–E based, and C–Ft–E based AF systems. However, SOC was negatively correlated with the number of livestock units owned by the practitioners. The correlation results showed that the relationship between SOC stock and the number of livestock under Enset based AF was statistically significant with an r-value of −0.66. However, the r-values for C–E based and C–Ft–E based AF systems were −0.49 and −0.31, respectively, and were not significant.
3.5. Relationship between Biomass C and Abundance, Shannon Diversity, Marglef’s Richness
The bivariate correlation analysis results showed that the quantity of biomass carbon (BC) stock was positively correlated with mean species richness, mean abundance, and diversity in all AF systems except in C–Ft–E based AF. Under the C–Ft–E based AF system, the relationship between total BC and diversity was negative. From all AF systems, the strongest correlation between BC and plant species richness was observed in C–E based AF with an r-value of 0.52. A weak correlation was observed in BC stock with plant diversity (r = −0.32) for the C–Ft–E based AF system. The BC stock was more positively correlated with species richness (r = 0.49, r = 0.44, r = 0.52) for C–Ft–E based, Enset based, and C–E based AF, respectively, than the other variables.
3.6. Soil Organic Carbon Stocks of AF Systems versus Their Adjacent Monocrop Farms
A pairwise comparison was conducted to determine the SOC stocks of three AF systems and their adjacent monocrop farming systems. The mean total SOC stock of the three investigated AF systems was higher than in the adjacent monocrop farms. According to the results of paired two-tailed t-test, C–Ft–E based AF and C–E based AF showed a statistically highly significant difference compared to the respective monocrop smallholding. However, the SOC stock of the Enset based AF system did not significantly differ from its adjacent monocrop plots (Table 5).
4. Discussion
4.1. Biomass, Biomass Carbon, Soil Organic Carbon, and Ecosystem Carbon Stocks
For a mitigation of the rising CO2 in the atmosphere, C stores in biomass are only of major importance when they are deposited in longer-lived biomass such as the woody components of AF, etc. [10]. Another advantage of having these perennial systems is that C sequestration does not have to end after harvesting the wood component because the boles, stems, or branches can also store carbon if processed in any form of long-lasting products [53]. The mean aboveground and belowground biomass values of the current study are higher than the values reported by [36] in indigenous AF systems. Both studies were conducted in the same zone of the region but different specific research sites. The author reported values from 34.9–59.2 t ha−1 for AGB to 11.6–19.2 t ha−1 for BGB. Results of this study were also relatively higher than the Coffee–Albizia association AF in southwestern Togo, which had an average value of 140 t ha−1 in its aboveground and 32 t ha−1 in belowground [15]. The total calculated biomass values in the studied three AF systems ranged from 108.0 to 328.1 t ha−1 for two of the three AF systems, which were lower than Cacao agroforests of Cameroon (304 t ha−1) [54]. However, the total biomass values in our study are still greater than the global average values reported for forests and some tropical AF practices (149 t ha−1), as reported in [55]. The variation in biomass among different AF systems might be attributed to several factors, for instance, the types of trees and shrubs included, environmental conditions, type of soil, level of land degradation, and age of the AF system [10]. Very low land degradation, good environmental conditions, and longer-aged AF systems probably show high biomass production and storage. The studied AF systems being permanent systems with very little land degradation and of older age, exhibited larger biomass.
The total biomass of fruit and nonfruit trees in the C–Ft–E based AF system was significantly different compared to the two remaining systems. This might be due to C–Ft–Ebased AF having a much larger number of fruit trees with vigorous growth and thus accumulated more biomass both aboveground and belowground. The contribution of enset, coffee, and litter to the mean aboveground and belowground biomass C stock of the AF system was by far lower than the contribution from trees across all AF systems. Similar studies also reported greater C contribution from trees [22,23].
Concerning individual AF farms, the highest total biomass C stock recorded in the current study was substantially higher when compared with shaded Coffee AF systems in southwestern Togo, reported by [15] with a value of 82 t ha−1, tree–enset based homegarden AF systems of Hawassa Zuria district (20–50 t ha−1; [54]), and Enset based, Enset–Coffee based, and Fruit–Coffee AF systems in a region similar to where our study was conducted (22–122 t ha−1; [22]). Additionally, [13] did extensive reviews on the biomass C stocks for West African Sahel countries. In their study, areas that encompassed extremely arid and humid regions of Guinea reported values ranging from 22.2 to 70.8 t ha−1. These C values are lower than values reported in the current study. In a review on biomass C stock of AF systems globally, [10,18] reported ranges from 12 to 228 t ha−1. Therefore, it is possible to summarize that the biomass C stocks of the studied AF systems fall within the global value range for AF systems and compare favorably to those of tropical forests and savanna in Brazil [56]. However, our results are lower than tropical Cocoa-based AF systems (304 t ha−1) reported in Cameroon [54]. The high biomass C stock reported in this study, specifically in the C–Ft–E based AF system, is due to higher tree density, a high number of fruit and nonfruit trees growing vigorously, and their considerable age. Similarly, [57] and [58] pointed out that variance in the biomass C stock is influenced by a variety of factors, including tree age, species, density, and type and extent of management employed by the practitioner. Similarly, the sort of allometric equation utilized by different researchers to estimate biomass C stock could also cause discrepancies in the reported numbers [59].
The soil is considered a compartment of terrestrial ecosystems where a higher quantity of organic C is stored [60], and it is estimated 2300 billion tonnes globally within one-meter soil depth [61]. This value is nearly 4.5 times the C stored in vegetation (610 billion tonnes). Higher SOC stocks are regularly observed in the uppermost soil horizons because they receive the initial organic matter input from falling litter either by leaching or by biogenic activity. This pattern is universally encouraged in most terrestrial ecosystems [62]. Similarly, in this study, the greater share of SOC was found in the upper layer (0–20 cm). The highest total mean SOC stock in Enset based AF could be attributed to practitioners’ efforts to trim down old enset leaves and mulch the ground, together with slower mineralization rates due to the higher altitude (colder weather condition) [22]. From these results, AF, which had the highest biomass, showed lower SOC stock and vice versa. The canopy closure and shading under C–Ft–E based AF is higher compared to Enset based AF system. However, the average SOC stock under C–Ft–E based AF was lower due to high decomposition rate of the biomass assisted by high temperature and better nutrient recycling.
The average SOC stock value (137.1 t ha−1) of all AF systems (0–40 cm) in this study was comparable with the global average, 121–123 and 110–117 t C ha−1 (0–60 cm soil depth), for tropical forests and tropical savanna, respectively [20]. However, the values were considerably higher than those reported for lowland homegardens of southern Tigrai in Ethiopia (109.75 t C ha−1, 0–60 cm soil depth; [16]) and semiarid Acacia etabica woodland in southern Ethiopia (43 t C ha−1) [63]. AF systems in other tropical regions were reported, such as: homegarden AF systems of humid lowlands with a tree density of >750 stems ha−1 (70–120 t C ha−1); silvopastures (grazing and fodder) of humid lowlands with a tree density of >25 stems ha−1 (80–120 t C ha−1); humid lowland and tropical highland wood lots >10 years old (80–100 t C ha−1); humid lowland tree intercropping with a tree density of >100 stems ha−1 (50–120 t C ha−1) [5]; and for AF systems in central India (27 t C ha−1) [64]. These reports showed a lower SOC stock than the AF systems of the current study. The mean SOC stock value for soil depth 0–20 cm under C–Ft–E, Enset based, and C–E based AF systems of this study was, however, lower than that reported for Inga-shade organic coffee systems, Taungya systems, and polyculture–shade nonorganic coffee systems in Chiapas, Mexico [62].
Depending on the ecosystem type, the amount of total AF C stock fluctuates substantially from one AF practice to the next and from region to region. The insignificant difference in total AF C stock and SOC stock between the investigated AF systems was because high biomass C stock does not mean it yields high SOC stock. This is because the increase or decrease in SOC is highly affected by other factors such as management and extraction of biomass from the components of AF system, and soil management and land-use history [5]. These additional factors may play an important role in the SOC dynamics. The contribution of SOC to the total AF C stock was higher in Enset based AF. This finding is consistent with the study reported by [22]. The relation between biomass C stock and SOC stock is discussed in detail in Section 4.2.
The type of ecosystem and latitude also affects C stock distribution between biomass and soil. The biomass C and SOC stocks (for 1 m soil depth) showed variation among different forest ecosystems of the globe [14]. For instance, the highest SOC stocks were at high latitudes (343 t ha−1), and the lowest was at low latitudes (121 t ha−1). The highest biomass C stocks were in low latitudes, whereas the lowest was in high latitudes [14]. The authors added the proportion of forest ecosystem C stock in biomass increased toward the tropics, from 16% at high latitudes to 50% at low latitudes. In general, most organic matter storage in tropical forests resides in biomass, which is followed by soil and litter with values of 58%, 41%, and 1%, respectively [65].
The average total AF C stock (biomass plus SOC) of the studied AF systems (207.1 t ha−1) were higher than reported for lowland homegardens of southern Tigrai in Ethiopia, which have 148.3 t ha−1 for 60 cm soil depth [16]. They were 2.5 times higher than shaded coffee plantations of southwestern Togo [15]. It was also reported in a similar range in the shade-grown Coffee system of Indonesia 82 t ha−1 for 40 cm soil depth [17]. Considering the C stock values reported above, we can say that the studied AF systems sequester considerably more C than other tree-based ecosystems generally do in the tropics. However, it was lower than the tropical forest biomes (244 t ha−1) [14].
4.2. Correlation between Biomass Carbon and SOC of Agroforestry Systems
The relationship between biomass carbon (BC) stock and soil organic carbon (SOC) stocks of AF systems can vary depending on different factors. Considering vegetation as one of the many factors influencing SOC stocks [66,67], studies conducted in wide areas of the tropics showed that a consistent addition of tree/shrub prunings and their root turnover over the years have contributed to the accumulation of SOC [8]. Results that support the contribution of biomass C to the SOC were reported from different countries. For example, a trial of hedgerow intercropping that incorporated Giliricidia sepium and Leucaena leucocephala was done for 12 years in Nigerian Alfisol. As a result of incorporating the trees, the surface SOC was increased by 15% (2.38 t ha−1); [68]. Similarly, after a five-year trial of hedgerow intercropping that incorporated Inga edulis on a Typic Paleudult soil in Peru, an increase of 12% (0.23 t ha−1) SOC stock was also observed [69]. On the contrary, having more tree cover in a given land use may not necessarily produce additional SOC stocks to the system. It is also affected by the existing extent of soil disturbances and other human interferences, especially extraction of biomass or AF products [70]. This might be the reason why a very weak correlation between biomass and SOC under C–Ft–E based AF and C–E based AF was found. Other authors [71] also explained that SOC stock was influenced mainly by soil properties, although topography and vegetation had an insignificant impact. Additionally, [10] revealed that the contribution of biomass C stock to SOC stocks at farm and landscape level was attributed to factors such as soil types, precipitation, landuse, and land management.
In general, the relationship between the two variables may also be affected by other factors such as tree management (pruning, lopping, pollarding, etc.) and land-use history [5]. Furthermore, the age of the AF system; the type, number, and rotation age of tree species included [12]; elevation and climate [10,62]; soil type; and soil properties [71] might affect the relationship. The findings of the current study are consistent with several other studies where biomass C stock and SOC stocks showed a very weak relationship, even negatively correlated [35,53,72].
Higher SOC stock in older AF systems points toward a lasting accumulation of organic matter over the years and an aggradation of soils from AF practices. From the r-values, it can be understood that most AF farms with lower slope percent showed a higher SOC stock. This may be due to more pronounced biomass incorporation into the soil in gentle slope AF farms as a result of the accumulation of biomass by gravity. In the upper slope position, where loss of organic matter is more than in gentle lower slopes, are typically accumulation sites. The r-value under the C–Ft–E based AF system was very low. This implies farms that are situated in lower elevation and gentler slope areas are less affected by slope percent for their SOC stock.
From these results, it can be understood that richer households have less tendency for using biomass from trees and shrubs for the purpose of house construction, cooking, and other uses. In addition, richer households have larger landholdings and thus extraction of biomass per unit area of the AF farm may be less than that for poor households. However, poor people are more or less dependent on biomass for different uses and thus lessen the biomass input to the soil. It was assumed that households with more livestock could utilize more biomass as forage than those who have less livestock. This implies that if significant biomass is consumed by the livestock, the biomass input returned as a litter to the soil could be dramatically decreased. As a result, practitioners who have more livestock showed comparatively less SOC stock under their AF farms than those with fewer livestock. Therefore, in the current study SOC, was negatively correlated with the number of livestock.
4.3. Relationship between Biomass C and Abundance, Shannon Diversity, Marglef’s Richness
The level of biomass carbon stock of AF systems could also be affected by structure and composition of the tree species, for instance, the abundance, diversity, and richness of tree/shrub species within the AF system. The relationship between BC and plant diversity observed in C–Ft–E based AF of the current study is consistent with the homegarden AF of southern Ethiopia, in which [21] reported a weak correlation between woody species diversity and biomass C stock. This implies that high plant diversity might not be linked to greater BC stock. It may be rather due to the fact that these AF systems encounter more human interference and greater disturbance levels, which resulted in lower number of plants and lower biomass production [73]. Socioeconomic factors may also play an important role.
The correlation between BC and species richness in C–E based AF was strong and positive. Similar results were reported by [22,23], who conducted research in Enset Coffee-tree agroforests. We hypothesized in the current study that plant abundance had a strong correlation with BC stock rather than with plant richness. However, a weaker correlation of plant abundance with BC stock was found compared to the correlation of BC stock with plant richness. The authors of [74] emphasized that C stock of AF systems depends more on their functional diversity than on woody and nonwoody plant species diversity; [75] and [76] also pointed out the biomass increment is more likely dependent on tree richness than tree diversity, thus AF systems, which have greater richness, are expected to produce more biomass and then greater biomass C.
The benefits of AF acquired from enhanced C sequestration are a promising incentive to introduce AF practices. This, in turn, contributes to sustainable land use in tropical regions [77]. Considerably high C stocks in the studied AF systems can be a convincing argument that they make a significant contribution to C sequestration and climate change mitigation when compared to some other land-uses. The upcoming success in C trading and payments through the operation of payment for ecosystem services and REDD+ programs could help local communities maintain AF systems by utilizing these incentives [78]. In addition, the financial cost needed to sequester C through AF is expected to be much lower (approximately $1–69/t C, median $13/t C) than through other CO2 mitigating options [78]. This is because some costs related to tree planting and management, land management, and planting material could be easily offset by the monetary gains from the multiple AF products and C trading incentives.
4.4. Soil Organic Carbon Stocks of AF Systems versus Their Adjacent Monocrop Farms
The higher litter input from tree and shrubs in AF systems adds more decayed plant material to the soil and thus has the capability to increase SOC through the decomposition process [79,80,81]. It is not surprising to see greater SOC stock in AF systems than the adjacent monocrop farms, but the aim was to investigate the extent of significant difference. The difference was highly significant except for Enset based AF. The reason for insignificant difference in Enset based AF versus its adjacent monocrop farms may be due to soil management employed to these monocrop farms, such as addition of livestock manure, ashes, and compost by farm owners. The high amount of SOC stock in the three AF systems may be due to the AF systems having more litterfall, which contributes organic matter to the soil, while in monocropped fields a smaller amount of crop residue might be left in the field. Another reason could be due to the lignified cells found in tree litter, branches, bark, roots, etc., which could lead to C stabilization and slower mineralization in the soil [82]. The slower oxidation rate of organic matter under tree shade [83], the addition of root exudates [84], and accumulation of more organic matter as a result of fine root degradation in the underground [85] may also initiate higher SOC stock. Similar results were reported by [75], who found higher SOC stock in homegarden AF than food-crop monoculture land; [86] homegarden AF systems showed 114% greater SOC stock than rice paddies, and [79] observed increased soil organic C by 11–52% in AF systems compared to monocropped fields. Additionally, in a study which was conducted by [87] in central Amazonia, Brazil, similar levels of SOC under AF were reported. Therefore, we can understand that AF systems have higher SOC levels than monocropped fields, even occasionally at a similar level with forest areas, depending on the plant mixture and management of the AF system.
5. Conclusion and Recommendations
Higher C stores, either aboveground or belowground, are achieved when the land-use systems integrate perennial plant species, and an effective management is employed. Agricultural techniques that integrate sufficient trees and shrubs, for example, AF systems, have a higher C repository. As several authors reported, most C sink in AF land-use systems happens in the soil. Similarly, the investigated AF systems showed a higher SOC stock. This is a good advantage to sequester more C in the system sustainably because soils have the capacity to maintain and store most C fractions for a longer period than biomass. From the findings of the current study, it can be understood that the variation in biomass and total C stock among the AF systems is mainly influenced by altitude, silvicultural management, types of trees and shrubs included, and density of the stand. Relatively higher C stock in the indigenous AF systems of the southeastern Rift-Valley landscapes in Ethiopia is an indicator of their potential to serve as large sinks for C. As a result, these landuse systems might have a great role in sequestering significant amounts of C and thus contributing to mitigate climate change. Quantifying the C stock and understanding the potential of the studied AF systems to store C may help to design and develop climate change mitigation strategies. It further contributes to developing a national policy concerning the mitigation of climate change and the implementation of international mechanisms such as REDD+ (Reducing Emission from Deforestation and Forest Degradation) and CDM (Clean Development Mechanism).
To maintain and utilize the great potential of AF systems to sequester C sustainably, the government should consider ways to expand these practices to different parts of the country. A strategy that benefits AF practitioners from carbon trading should also be designed and planned. This would encourage farmers to conserve woody and nonwoody perennial plants for the long-term, thus fostering more C to be stored in the biomass and in soil permanently. This could be accomplished by linking with governmental or nongovernmental projects working on carbon trading.
Author Contributions
H.M.T. generated the idea and study design, collected data, carried out the laboratory work, data analysis, and write up. M.N. and H.H. supported in study design, and read, reviewed, and shaped the manuscript to the present form. D.L.G. also reviewed the manuscript. All authors have read and agreed to the published version of the manuscript.
Funding
Austrian Partnership Program in Higher Education and Research Development (APPEAR) and International Foundation for Science (IFS Grant. #D/6183–1) supported this research as part of a Ph.D. study.
Institutional Review Board Statement
Not applicable.
Informed Consent Statement
Not applicable.
Data Availability Statement
This is not applicable to this article since no datasets were generated.
Acknowledgments
We are grateful to the Austrian Partnership Program in Higher Education and Research Development (APPEAR) for giving H.M.T. a scholarship award to pursue study in Austria. H.M.T. acknowledges financial support from the International Foundation for Science (IFS Grant. #D/6183–1) and Federal Research and Training Center for Forests, Natural Hazards and Landscape, Department of Biodiversity and Nature Conservation, Vienna, Austria. H.M.T. is grateful to Herbert Hager and Mesele Negash for their indispensable support from the beginning to the end, and also extends gratitude to Douglas L. Godbold for his valuable review. The University of Natural Resource and Life Sciences (BOKU), Institute of Forest Ecology, Austria, and Hawassa University, Wondo Genet College of Forestry and Natural Resources, Ethiopia, are also acknowledged for offering the postgraduate study opportunity. We are also indebted to Gedeo zone experts and the farmers for allowing us to visit and carry out this study on their farms and for providing marvelous experiences.
Conflicts of Interest
We declare that there are no conflicts of interest.
Appendix A

Table A1.
Correlation between BC stock and SOC stock in the three AF systems.
| BC Stock of C–Ft–E Based AF | SOC Stock of C–Ft–E Based AF | BC Stock of Enset Based AF | SOC Stock of Enset Based AF | BC Stock of C–E Based AF | SOC Stock of C–E Based AF | ||
|---|---|---|---|---|---|---|---|
| BC stock of C–Ft–E based AF | Pearson Correlation | 1 | |||||
| Sig. (2-tailed) | |||||||
| N | 10 | ||||||
| SOC stock of C–Ft–E based AF | Pearson Correlation | −0.005 | 1 | ||||
| Sig. (2-tailed) | 0.989 | ||||||
| N | 10 | 10 | |||||
| BC stock of Enset based AF | Pearson Correlation | 0.184 | −0.186 | 1 | |||
| Sig. (2-tailed) | 0.612 | 0.606 | |||||
| N | 10 | 10 | 10 | ||||
| SOC stock of Ensetbased AF | Pearson Correlation | 0.080 | 0.055 | 0.458 | 1 | ||
| Sig. (2-tailed) | 0.825 | 0.881 | 0.183 | ||||
| N | 10 | 10 | 10 | 10 | |||
| BC stock of C–E based AF | Pearson Correlation | −0.088 | −0.069 | 0.029 | −0.527 | 1 | |
| Sig. (2-tailed) | 0.810 | 0.850 | 0.937 | 0.117 | |||
| N | 10 | 10 | 10 | 10 | 10 | ||
| SOC stock of C–E based AF | Pearson Correlation | −0.552 | .008 | −0.412 | 0.415 | −0.246 | 1 |
| Sig. (2-tailed) N | 0.098 10 | 0.983 10 | 0.237 10 | 0.233 10 | 0.493 10 | 10 |
References
- Gebremeskel, D.; Birhane, E.; Rannestad, M.M.; Gebre, S.; Tesfay, G. Biomass and soil carbon stocks of Rhamnus prinoides based agroforestry practice with varied density in the drylands of Northern Ethiopia. Agrofor. Syst. 2021, 95, 1275–1293. [Google Scholar] [CrossRef]
- Morgan, J.A.; Follett, R.F.; Allen, L.H.; Del Grosso, S.; Derner, J.D.; Dijkstra, F.; Franzluebbers, A.; Fry, R.; Paustian, K.; Schoeneberger, M.M. Carbon sequestration in agricultural lands of the United States. J. Soil Water Conserv. 2010, 65, 6A–13A. [Google Scholar] [CrossRef] [Green Version]
- Schoeneberger, M.M. Agroforestry: Working trees for sequestering carbon on agricultural lands. Agrofor. Syst. 2009, 75, 27–37. [Google Scholar] [CrossRef] [Green Version]
- Kirby, K.R.; Potvin, C. Variation in carbon storage among tree species: Implications for the management of a small-scale carbon sink project. For. Ecol. Manag. 2007, 246, 208–221. [Google Scholar] [CrossRef]
- Nair, P.R.; Nair, V.D.; Kumar, B.M.; Haile, S.G. Soil carbon sequestration in tropical agroforestry systems: A feasibility appraisal. Environ. Sci. Policy 2009, 12, 1099–1111. [Google Scholar] [CrossRef]
- Sharrow, S.; Ismail, S. Carbon and nitrogen storage in agroforests, tree plantations, and pastures in western Oregon, USA. Agrofor. Syst. 2004, 60, 123–130. [Google Scholar] [CrossRef]
- Haile, S.G.; Nair, P.K.R.; Nair, V.D. Carbon Storage of Different Soil-Size Fractions in Florida Silvopastoral Systems. J. Environ. Qual. 2008, 37, 1789–1797. [Google Scholar] [CrossRef] [PubMed]
- Lorenz, K.; Lal, R. Soil organic carbon sequestration in agroforestry systems. A review. Agron. Sustain. Dev. 2014, 34, 443–454. [Google Scholar] [CrossRef] [Green Version]
- Zomer, R.; Neufeldt, H.; Xu, J.; Ahrends, A.; Bossio, D.; Trabucco, A.; Van Noordwijk, M.; Wang, M. Global Tree Cover and Biomass Carbon on Agricultural Land: The contribution of agroforestry to global and national carbon budgets. Sci. Rep. 2016, 6, 29987. [Google Scholar] [CrossRef] [Green Version]
- Albrecht, A.; Kandji, S.T. Carbon sequestration in tropical agroforestry systems. Agric. Ecosyst. Environ. 2003, 99, 15–27. [Google Scholar] [CrossRef]
- Nair, P.K.R.; Kumar, B.M.; Nair, V.D. Agroforestry as a strategy for carbon sequestration. J. Plant Nutr. Soil Sci. 2009, 172, 10–23. [Google Scholar] [CrossRef]
- Montagnini, F.; Nair, P.K.R. Carbon sequestration: An underexploited environmental benefit of agroforestry systems. Agrofor. Syst. 2004, 61–62, 281–295. [Google Scholar] [CrossRef]
- Luedeling, E.; Neufeldt, H. Carbon sequestration potential of parkland agroforestry in the Sahel. Clim. Chang. 2012, 115, 443–461. [Google Scholar] [CrossRef] [Green Version]
- Dixon, R.K.; Solomon, A.M.; Brown, S.; Houghton, R.A.; Trexier, M.C.; Wisniewski, J. Carbon Pools and Flux of Global Forest Ecosystems. Science 1994, 263, 185–190. [Google Scholar] [CrossRef] [PubMed]
- Dossa, E.L.; Fernandes, E.C.M.; Reid, W.S.; Ezui, K. Above- and belowground biomass, nutrient and carbon stocks contrasting an open-grown and a shaded coffee plantation. Agrofor. Syst. 2007, 72, 103–115. [Google Scholar] [CrossRef]
- Siyum, G.E.; Tassew, T. The Use of Homegarden Agroforestry Systems for Climate Change Mitigation in Lowlands of Southern Tigray, Northern Ethiopia. Asian Soil Res. J. 2019, 2, 1–13. [Google Scholar] [CrossRef] [Green Version]
- Van Noordwijk, M.; Rahayu, S.; Hairiah, K.; Wulan, Y.C.; Farida, A.; Verbist, B. Carbon Stock Assessment for a Forest to Coffee Conversion Landscape in Sumber-Jaya (Lampung, Indonesia): From Allometric Equations to Land Use Change Analysis; Science in China Series C-Life Sciences; Suppl. Science in China Press: Beijing, China, 2002; Volume 45, pp. 75–86. [Google Scholar]
- Dixon, R.K. Agroforestry systems: Sources of sinks of greenhouse gases? Agrofor. Syst. 1995, 31, 99–116. [Google Scholar] [CrossRef]
- Nair, P.K. and Nair, V.D. Carbon storage in North American agroforestry systems. In The Potential of U.S. Forest Soils to Sequester Carbon and Mitigate the Greenhouse Effect; Kimble, J., Heath, L.S., Birdsey, R.A., Lal, R., Eds.; CRC Press: Boca Raton, FL, USA, 2003; pp. 333–346. [Google Scholar]
- Lal, R. Soil carbon sequestration to mitigate climate change. Geoderma 2004, 123, 1–22. [Google Scholar] [CrossRef]
- Birhane, E.; Ahmed, S.; Hailemariam, M.; Negash, M.; Rannestad, M.M.; Norgrove, L. Carbon stock and woody species diversity in homegarden agroforestry along an elevation gradient in southern Ethiopia. Agrofor. Syst. 2020, 94, 1099–1110. [Google Scholar] [CrossRef]
- Negash, M.; Starr, M. Biomass and soil carbon stocks of indigenous agroforestry systems on the south-eastern Rift Valley escarpment, Ethiopia. Plant Soil 2015, 393, 95–107. [Google Scholar] [CrossRef]
- Seta, T.; Demissew, S. Diversity and standing carbon stocks of native agroforestry trees in Wenago district, Ethiopia. J. Emerg. Trends Eng. Appl. Sci. (JETEAS) 2014, 5, 125–132. [Google Scholar]
- Jose, S. Agroforestry for ecosystem services and environmental benefits: An overview. Agrofor. Syst. 2009, 76, 1–10. [Google Scholar] [CrossRef]
- Mutuo, P.K.; Cadisch, G.; Albrecht, A.; Palm, C.A.; Verchot, L. Potential of agroforestry for carbon sequestration and mitigation of greenhouse gas emissions from soils in the tropics. Nutr. Cycl. Agroecosystems 2005, 71, 43–54. [Google Scholar] [CrossRef]
- Sauer, T.J.; Cambardella, C.A.; Brandle, J.R. Soil carbon and tree litter dynamics in a red cedar–scotch pine shelterbelt. Agrofor. Syst. 2007, 71, 163–174. [Google Scholar] [CrossRef] [Green Version]
- Pandey, D.N. Carbon sequestration in agroforestry systems. Clim. Policy 2002, 2, 367–377. [Google Scholar] [CrossRef]
- Schulp, C.J.; Nabuurs, G.-J.; Verburg, P.H.; de Waal, R.W. Effect of tree species on carbon stocks in forest floor and mineral soil and implications for soil carbon inventories. For. Ecol. Manag. 2008, 256, 482–490. [Google Scholar] [CrossRef]
- Brown, S.; Lugo, A.E. The Storage and Production of Organic Matter in Tropical Forests and Their Role in the Global Carbon Cycle. Biotropica 1982, 14, 161. [Google Scholar] [CrossRef]
- Franks, P.; Hou-Jones, X.; Fikreyesus, D.; Sintayehu, M.; Mamuye, S.; Danso, E.Y.; Meshack, C.K.; McNicol, I.; Van Soesbergen, A. Reconciling forest Conservation with Food Production in Sub-Saharan Africa: Case Studies from Ethiopia, Ghana and Tanzania; International Institute for Environment and Development: London, UK, 2017; p. 111. [Google Scholar]
- Kanshie, T.K. Five thousand years of sustainability?: A case study on Gedeo land use (Southern Ethiopia). Ph.D. Dissertation, Wageningen University, Wageningen, The Netherlands, 2002; p. 295. [Google Scholar]
- Abebe, T. Determinants of crop diversity and composition in Enset-Coffee agroforestry homegardens of Southern Ethiopia. J. Agric. Rural. Dev. Trop. Subtrop. 2013, 114, 29–38. [Google Scholar]
- Asfaw, Z.; Ågren, G.I. Farmers’ local knowledge and topsoil properties of agroforestry practices in Sidama, Southern Ethiopia. Agrofor. Syst. 2007, 71, 35–48. [Google Scholar] [CrossRef]
- Negash, M. Trees Management and Livelihoods in Gedeo’s Agroforests, Ethiopia. For. Trees Livelihoods 2007, 17, 157–168. [Google Scholar] [CrossRef]
- Negash, M.; Abdulkadir, A.; Hagberg, S. Farmers’ planting practices of Eucalyptus in Enset-Coffee based agroforestry system of Sidama, Ethiopia. Ethiop. J. Nat. Resour. 2005, 7, 239–251. [Google Scholar]
- Negash, M. The indigenous agroforestry systems of the south-eastern Rift Valley escarpment, Ethiopia: Their biodiversity, carbon stocks, and litterfall. Viikki Tropical Resources Institute (VITRI). Ph.D. Dissertation, University of Helsinki, Helsinki, Finland, 2013; p. 62. [Google Scholar]
- National Meteorology Agency. Climatic Data of South Nations and Nationalities Peoples Regional State; National Meteorology Agency: Hawassa, Ethiopia, 2019. [Google Scholar]
- Mebrate, B.T. Agroforestry Practices in Gedeo Zone, Ethiopia: A Geographical Analysis. Ph.D. Dissertation, Panjab University, Chandigarh, India, 2007; p. 188. [Google Scholar]
- Abebe, T. Diversity in Homegarden Agroforestry Systems of Southern Ethiopia. Ph.D. Thesis, Wageningen University, Wageningen, The Netherlands , 2005; p. 143. [Google Scholar]
- Asfaw, Z. Tree Species Diversity, Topsoil Conditions and Arbuscular Mycorrhizal Association in the Sidama Traditional Agroforestry Land Use, Southern Ethiopia. Ph.D. Dissertation, Swedish University of Agricultural Sciences, Department of Forest Management and Products, SLU, Uppsala, Sweden, 2003; p. 263. [Google Scholar]
- Bekele-Tesemma, A. Profitable Agroforestry Innovations for Eastern Africa: Experience from 10 Agroclimatic Zones of Ethiopia, India, Kenya, Tanzania, and Uganda; Regional Land Management Unit: Nairobi, Kenya, 2008; p. 374. [Google Scholar]
- Brandt, S.; Spring, A.; Hiebsch, C.; McCabe, J.T.; Tabogie, E.; Diro, M.; Wolde-michael, G.; Yntiso, G.; Shigeta, M.; Tesfaye, S. The “Tree against Hunger”. In Enset-Based Agricultural Systems in Ethiopia; American Association for the Advancement of Science: New York, NY, USA, 1997; p. 55. [Google Scholar]
- Zewdie, S.; Fetene, M.; Olsson, M. Fine root vertical distribution and temporal dynamics in mature stands of two enset (Enset ventricosum Welw Cheesman) clones. Plant Soil 2008, 305, 227–236. [Google Scholar] [CrossRef]
- Bizuayehu, T. On Sidama folk identification, naming, and classification of cultivated enset (Ensete ventricosum) varieties. Genet. Resour. Crop Evol. 2008, 55, 1359–1370. [Google Scholar] [CrossRef]
- Abebe, T.; Bongers, F. Land-use dynamics in enset-based agroforestry homegardens in Ethiopia. In Forest-People Interfaces; Arts, B., van Bommel, S., Ros-Tonen, M., Verschoor, G., Eds.; Wageningen Academic Publishers: Wageningen, The Netherlands, 2012; pp. 69–85. [Google Scholar]
- Labouisse, J.-P.; Bellachew, B.; Kotecha, S.; Bertrand, B. Current status of coffee (Coffea arabica L.) genetic resources in Ethiopia: Implications for conservation. Genet. Resour. Crop. Evol. 2008, 55, 1079–1093. [Google Scholar] [CrossRef]
- Muleta, D.; Assefa, F.; Nemomissa, S.; Granhall, U. Composition of coffee shade tree species and density of indigenous arbuscular mycorrhizal fungi (AMF) spores in Bonga natural coffee forest, southwestern Ethiopia. For. Ecol. Manag. 2007, 241, 145–154. [Google Scholar] [CrossRef]
- Asfaw, Z.; Mulata, Y.; Assefa, B.; Abebe, T.; Duna, S.; Mulugeta, G.; Mebrahten, H.; Kassa, H. Enhancing the Role of Forestry in Building Climate Resilient Green Economy in Ethiopia: Strategy for Scalling Up Effective Forest Management Practices in Southern Nations, Nationalities and Peoples Regional State with Particular an Emphasis on Agroforestry; Center for International Forestry Research (CIFOR): Bogor, Indonesia, 2015; p. 66. [Google Scholar]
- Kuyah, S.; Dietz, J.; Muthuri, C.; Jamnadass, R.; Mwangi, P.; Coe, R.; Neufeldt, H. Allometric equations for estimating biomass in agricultural landscapes: I. Aboveground biomass. Agric. Ecosyst. Environ. 2012, 158, 216–224. [Google Scholar] [CrossRef]
- Kuyah, S.; Dietz, J.; Muthuri, C.; Jamnadass, R.; Mwangi, P.; Coe, R.; Neufeldt, H. Allometric equations for estimating biomass in agricultural landscapes: II. Belowground biomass. Agric. Ecosyst. Environ. 2012, 158, 225–234. [Google Scholar] [CrossRef]
- Negash, M.; Starr, M.; Kanninen, M. Allometric equations for biomass estimation of Enset (Ensete ventricosum) grown in indigenous agroforestry systems in the Rift Valley escarpment of southern-eastern Ethiopia. Agrofor. Syst. 2012, 87, 571–581. [Google Scholar] [CrossRef]
- Negash, M.; Starr, M.; Kanninen, M.; Berhe, L. Allometric equations for estimating aboveground biomass of Coffea arabica L. grown in the Rift Valley escarpment of Ethiopia. Agrofor. Syst. 2013, 87, 953–966. [Google Scholar] [CrossRef]
- Roy, C. Options techniques et socio-economiques de reduction des emissions de CO2 et d’augmentation des stocks de carbone. Technical and socio-economical options for decreasing CO2 emissions and developing carbon fixation. Comptes Rendus-Acad. D Agric. Fr. 1999, 85, 311–320. [Google Scholar]
- Duguma, B.; Gockowski, J.; Bakala, J. Smallholder Cacao (Theobroma cacao Linn.) cultivation in agroforestry systems of West and Central Africa: Challenges and opportunities. Agrofor. Syst. 2001, 51, 177–188. [Google Scholar] [CrossRef]
- Food and Agriculture Organization (FAO). Global Forest Resource Assessment, Main Report no. 163.FAO (Food and Agriculture Organization of the United Nations); Food and Agriculture Organization (FAO): Rome, Italy, 2010. [Google Scholar]
- Silva, L.C.R.; Hoffmann, W.A.; Rossatto, D.R.; Haridasan, M.; Franco, A.C.; Horwath, W.R. Can savannas become forests? A coupled analysis of nutrient stocks and fire thresholds in central Brazil. Plant Soil 2013, 373, 829–842. [Google Scholar] [CrossRef]
- Charles, R.; Munishi, P.; Nzunda, E. Agroforestry as adaptation strategy under climate change in Mwanga District, Kilimanjaro, Tanzania. Int. J. Env. Prot. 2013, 3, 29–38. [Google Scholar]
- Tadesse, A.B.M.; Bajigo, M.T.A. Estimation of Carbon Stored in Agroforestry Practices in Gununo Watershed, Wolayitta Zone, Ethiopia. J. Ecosyst. Ecography 2015, 5, 1–5. [Google Scholar] [CrossRef]
- Kumar, B.M. Carbon sequestration potential of tropical homegardens. In Tropical Homegardens; Kumar, B.M., Nair, P.K.R., Eds.; Advances in Agroforestry: New York, NY, USA, 2006; Volume 3, pp. 185–204. [Google Scholar] [CrossRef]
- Batjes, N.H. Total carbon and nitrogen in the soils of the world. Eur. J. Soil Sci. 1996, 47, 151–163. [Google Scholar] [CrossRef]
- Srivastava, P.; Kumar, A.; Behera, S.K.; Sharma, Y.K.; Singh, N. Soil carbon sequestration: An innovative strategy for reducing atmospheric carbon dioxide concentration. Biodivers. Conserv. 2012, 21, 1343–1358. [Google Scholar] [CrossRef]
- Soto-Pinto, L.; Anzueto, M.; Mendoza, J.; Ferrer, G.J.; De Jong, B. Carbon sequestration through agroforestry in indigenous communities of Chiapas, Mexico. Agrofor. Syst. 2009, 78, 39–51. [Google Scholar] [CrossRef]
- Lemenih, M.; Itanna, F. Soil carbon stocks and turnovers in various vegetation types and arable lands along an elevation gradient in southern Ethiopia. Geoderma 2004, 123, 177–188. [Google Scholar] [CrossRef]
- Swamy, S.; Puri, S. Biomass production and C-sequestration of Gmelina arborea in plantation and agroforestry system in India. Agrofor. Syst. 2005, 64, 181–195. [Google Scholar] [CrossRef]
- Brown, S.; Grais, A.; Ambagis, S. Baseline GHG Emissions from the Agricultural Sector and Mitigation Potential in Countries of East and West Africa; CCAFS Working Paper No. 13; CGIAR Research Program on Climate Change, Agriculture and Food Security (CCAFS): Copenhagen, Denmark., 2012; Available online: www.ccafs.cgiar.org (accessed on 10 September 2020).
- Oueslati, I.; Allamano, P.; Bonifacio, E.; Claps, P. Vegetation and Topographic Control on Spatial Variability of Soil Organic Carbon. Pedosphere 2013, 23, 48–58. [Google Scholar] [CrossRef] [Green Version]
- Sun, W.; Zhu, H.; Guo, S. Soil organic carbon as a function of land use and topography on the Loess Plateau of China. Ecol. Eng. 2015, 83, 249–257. [Google Scholar] [CrossRef]
- Kang, B.T.; Caveness, F.E.; Tian, G.; Kolawole, G.O. Longterm alley cropping with four hedgerow species on an Alfisol in southwestern Nigeria–effect on crop performance, soil chemical properties and nematode population. Nutr. Cycl. Agroecosystems 1999, 54, 145–155. [Google Scholar] [CrossRef]
- Alegre, J. Soil and water conservation by contour hedging in the humid tropics of Peru. Agric. Ecosyst. Environ. 1996, 57, 17–25. [Google Scholar] [CrossRef]
- Kirsten, M.; Kaaya, A.; Klinger, T.; Feger, K.-H. Stocks of soil organic carbon in forest ecosystems of the Eastern Usambara Mountains, Tanzania. CATENA 2016, 137, 651–659. [Google Scholar] [CrossRef]
- Kinoshita, R.; Roupsard, O.; Chevallier, T.; Albrecht, A.; Taugourdeau, S.; Ahmed, Z.; van Es, H.M. Large topsoil organic carbon variability is controlled by Andisol properties and effectively assessed by VNIR spectroscopy in a coffee agroforestry system of Costa Rica. Geoderma 2016, 262, 254–265. [Google Scholar] [CrossRef]
- Noponen, M.R.; Edwards-Jones, G.; Haggar, J.P.; Soto, G.; Attarzadeh, N.; Healey, J.R. Greenhouse gas emissions in coffee grown with differing input levels under conventional and organic management. Agric. Ecosyst. Environ. 2012, 151, 6–15. [Google Scholar] [CrossRef] [Green Version]
- Richards, M.B.; Méndez, V.E. Interactions between Carbon Sequestration and Shade Tree Diversity in a Smallholder Coffee Cooperative in El Salvador. Conserv. Biol. 2013, 28, 489–497. [Google Scholar] [CrossRef]
- Thompson, I.D.; Ferreira, J.; Gardner, T.; Guariguata, M.; Koh, L.P.; Okabe, K.; Barlow, K.V.; Kurz, W.A.; Spalding, M.; van Vliet, N. Forest Biodiversity, Carbon and Other Ecosystem Services: Relationships and Impacts of Deforestation and Forest Degradation. Understanding Relationships between Biodiversity, Carbon, Forests and People: The Key to Achieving REDD+ Objectives; A Global Assessment Report IUFRO World Series; IUFRO: Vienna, Austria, 2012; Volume 31, pp. 21–51. [Google Scholar]
- Henry, M.; Tittonell, P.; Manlay, R.; Bernoux, M.; Albrecht, A.; Vanlauwe, B. Biodiversity, carbon stocks and sequestration potential in aboveground biomass in smallholder farming systems of western Kenya. Agric. Ecosyst. Environ. 2009, 129, 238–252. [Google Scholar] [CrossRef]
- Mandal, R.A.; Jha, P.K.; Dutta, I.C.; Thapa, U.; Karmacharya, S.B. Carbon Sequestration in Tropical and Subtropical Plant Species in Collaborative and Community Forests of Nepal. Adv. Ecol. 2016, 2016, 1529703. [Google Scholar] [CrossRef] [Green Version]
- Takimoto, A.; Nair, V.D.; Nair, P.K.R. Contribution of trees to soil carbon sequestration under agroforestry systems in the West African Sahel. Agrofor. Syst. 2008, 76, 11–25. [Google Scholar] [CrossRef]
- Thangata, P.; Hildebrand, P. Carbon stock and sequestration potential of agroforestry systems in smallholder agroecosystems of sub-Saharan Africa: Mechanisms for ‘reducing emissions from deforestation and forest degradation’ (REDD+). Agric. Ecosyst. Environ. 2012, 158, 172–183. [Google Scholar] [CrossRef]
- Kaur, B.; Gupta, S.; Singh, G. Soil carbon, microbial activity and nitrogen availability in agroforestry systems on moderately alkaline soils in northern India. Appl. Soil Ecol. 2000, 15, 283–294. [Google Scholar] [CrossRef]
- Lehmann, J.; Peter, I.; Steglich, C.; Gebauer, G.; Huwe, B.; Zech, W. Below-ground interactions in dryland agroforestry. For. Ecol. Manag. 1998, 111, 157–169. [Google Scholar] [CrossRef]
- Sarvade, S.; Singh, R.; Prasad, H.; Prasad, D. Agroforestry practices for improving soil nutrient status. Pop. Kheti 2014, 2, 60–64. [Google Scholar]
- Six, J.; Conant, R.T.; Paul, E.A.; Paustian, K. Stabilization mechanisms of soil organic matter: Implications for C-saturation of soils. Plant Soil 2002, 241, 155–176. [Google Scholar] [CrossRef]
- Gill, A.S.; Burman, D. Production management of field crops in agroforestry systems. In Recent Advances in Agronomy; Singh, G., Kolar, J.S.W., Sekhon, H.S., Eds.; Indian Society of Agronomy: New Delhi, India, 2002; pp. 523–542. [Google Scholar]
- Bertin, C.; Yang, X.; Weston, L.A. The role of root exudates and allelochemicals in the rhizosphere. Plant Soil 2003, 256, 67–83. [Google Scholar] [CrossRef]
- Komicha, N.D.; Nigatu, L.; Mohamed, M. Physico-chemical properties of soil under the canopies of Faidherbia albida (Delile) A. Chev and Acacia tortilis (Forssk.) Hayen in park land agroforestry system in Central Rift Valley, Ethiopia. J. Hortic. For. 2018, 10, 113–126. [Google Scholar] [CrossRef] [Green Version]
- Saha, S.K.; Nair, P.K.R.; Nair, V.D.; Kumar, B.M. Carbon storage in relation to soil size-fractions under tropical tree-based land-use systems. Plant Soil 2009, 328, 433–446. [Google Scholar] [CrossRef]
- Alfaia, S.S.; Ribeiro, G.A.; Nobre, A.D.; Luizão, R.C.; Luizão, F.J. Evaluation of soil fertility in smallholder agroforestry systems and pastures in western Amazonia. Agric. Ecosyst. Environ. 2004, 102, 409–414. [Google Scholar] [CrossRef]
Figure 1.
Map of the study site.

Figure 2.
The three studied agroforestry systems.


Figure 3.
Sample plot layout for inventory of trees, shrubs, coffee, and enset plants (10 × 10 m), soil sample points (circular points), and litter (50 × 50 cm squares).
Figure 3.
Sample plot layout for inventory of trees, shrubs, coffee, and enset plants (10 × 10 m), soil sample points (circular points), and litter (50 × 50 cm squares).

Figure 4.
Proportion of C stock of each component in the aboveground biomass. C–Ft–E AF= Coffee–Fruit-tree–Enset based agroforestry; C–E based AF = Coffee–Enset based agroforestry.
Figure 4.
Proportion of C stock of each component in the aboveground biomass. C–Ft–E AF= Coffee–Fruit-tree–Enset based agroforestry; C–E based AF = Coffee–Enset based agroforestry.

Figure 5.
Proportion of carbon stock of each component in the belowground biomass. C–Ft–E AF= Coffee–Fruit-tree–Enset based agroforestry; C–E AF = Coffee–Enset based agroforestry.
Figure 5.
Proportion of carbon stock of each component in the belowground biomass. C–Ft–E AF= Coffee–Fruit-tree–Enset based agroforestry; C–E AF = Coffee–Enset based agroforestry.

Figure 6.
Agroforestry total carbon stocks (including trees, shrubs, coffee, enset, stumps, and large roots, SOC 0–40 cm) (t ha−1) by AF system.
Figure 6.
Agroforestry total carbon stocks (including trees, shrubs, coffee, enset, stumps, and large roots, SOC 0–40 cm) (t ha−1) by AF system.

Table 1.
Characteristics of the research sites.
| Characteristics | Research Sites | ||
|---|---|---|---|
| Sisota | Golla | Chichu | |
| Location | Dilla Zuria district, SNNPRS | Dilla Zuria district, SNNPRs | Dilla Zuria district, SNNPRS |
| Altitude | 1760–1830 m asl | 1665–1732 m asl | 1544–1587 m asl |
| Topography | Steep slope land feature, azimuth: southwest facing | Slightly steep to medium, azimuth: southwest facing | Gentle slope, azimuth: southwest facing |
| Plant species coverage | Enset-dominated | Coffee and enset-dominated | Fruit tree-, coffee-, and enset- dominated |
| AF handling activity | Tree trimming, lopping, tightening, ripping of unwanted plants. Enset leaves and foliage of Millettia sp. used for manuring and floor covering | Trimming, lopping, pollarding, tightening, ripping of unwanted plants. Enset leaves, herbaceous plants and foliage of Millettia spp. used for manuring and floor covering | Tree trimming, pollarding. Farm house waste, ash and coffee peelings used as compost |
| Major food and cash crops, vegetables | Enset, taro, yam, kale | Coffee, enset, banana, taro, yam, sweet potatoes | Fruit, coffee, enset maize, haricot bean, sweet potatoes |
| Average distance from the next town (market) | 10 km | 8 km | 5 km |
Table 2.
Mean (±SD) (n = 20), AGB, BGB, and total (aboveground plus belowground) biomass (t ha−1) for each of the three studied AF systems, and results of one-way ANOVAs (at α = 0.05, significant differences between AF systems are indicated).
Table 2.
Mean (±SD) (n = 20), AGB, BGB, and total (aboveground plus belowground) biomass (t ha−1) for each of the three studied AF systems, and results of one-way ANOVAs (at α = 0.05, significant differences between AF systems are indicated).
| Biomass | C–Ft–E AF | Enset AF | C–E AF | F | p |
|---|---|---|---|---|---|
| Aboveground biomass a | 255.9 ± 294.0 | 81.1 ± 69.0 | 126.7 ± 145.1 | 4.4 | 0.017 |
| Belowground biomass b | 72.2 ± 69.9 | 26.9 ± 21.1 | 39.4 ± 39.4 | 4.8 | 0.012 |
| Agroforestry total biomass | 328.1 ± 364 | 108.0 ± 90.0 | 166.1 ± 184.4 | 4.5 | 0.016 |
a trees, coffee, enset. b stumps, coarse roots (enset corm + proximal roots), and fine roots.
Table 3.
Mean (±SD) total biomass (t ha−1) of woody, enset, and coffee components grown in three AF systems. Within each AF system having the same letter are not significantly different at (p < 0.05) from each other (Fisher LSD test; n = 20 for each AF system).
Table 3.
Mean (±SD) total biomass (t ha−1) of woody, enset, and coffee components grown in three AF systems. Within each AF system having the same letter are not significantly different at (p < 0.05) from each other (Fisher LSD test; n = 20 for each AF system).
| Agroforestry System | Woody | Enset | Coffee | Agroforestry Total Biomass | ||
|---|---|---|---|---|---|---|
| Fruit | Nonfruit | Total | ||||
| C–Ft–E based AF | 154.1 ± 158.8 a | 141.6 ± 283 a | 295.7 ± 372.0 a | 6.8 ± 3.7 a | 25.6 ± 41.5 a | 328.1 ± 364 a |
| Enset based AF | 29.7 ± 61.2 b | 45.3 ± 67.2 a | 75.0 ± 94.0 b | 29.0 ± 15.6 ab | - | 108.0 ± 90 b |
| C–E based AF | 31.7 ± 132.4 b | 97.7 ± 128.9 a | 129.4 ± 186.4 b | 19.1 ± 10.2 ac | 17.6 ± 6.5 a | 166.1 ± 184 b |
C–Ft–E based AF = Coffee–Fruit tree–Enset based agroforestry; Enset based AF = Enset based agroforestry; C–E based AF = Coffee–Enset based agroforestry system.
Table 4.
Mean (±SD; n = 10) BC, SOC (0–40 cm), and AF total C stock (t ha−1) for the three AF systems, and results of one-way ANOVAs (at α = 0.05).
Table 4.
Mean (±SD; n = 10) BC, SOC (0–40 cm), and AF total C stock (t ha−1) for the three AF systems, and results of one-way ANOVAs (at α = 0.05).
| C Stock | C–Ft–E AF | Enset AF | C–E AF | F | p |
|---|---|---|---|---|---|
| Aboveground C a | 83.8 ± 63.0 | 39.1 ± 32.0 | 37.8 ± 17.3 | 3.9 | 0.033 |
| Belowground C b | 24.4 ± 16.2 | 12.6 ± 9.7 | 12.7 ± 5.8 | 3.6 | 0.042 |
| Total biomass | 108.2 ± 79.2 a | 51.7 ± 41.7 b | 50.5 ± 23.1 b | 3.8 | 0.034 |
| SOC 0–20 | 75.7 ± 14.2 | 81.7 ± 14.4 | 76.9 ±18.3 | 0.4 | 0.665 |
| SOC 20–40 | 49.8 ± 7.5 | 64.4 ± 16.3 | 62.7 ± 21.2 | 8.9 | 0.103 |
| SOC 0–40 | 125.5 ± 17.3 a | 146.1 ± 26.5 a | 139.6 ± 25.4 a | 14.7 | 0.152 |
| Agroforestry total | 233.3 ± 81.0 a | 197.8 ± 58.7 a | 190.1 ± 29.8 a | 0.1 | 0.243 |
a trees, coffee, enset, and litter. b stumps, coarse roots, enset (corm + proximal roots), and fine roots.
Table 5.
Mean (±SD; n = 10), SOC stock (0–40 cm, t ha−1) for the three studied AF systems and their adjacent monocrop plot and results of paired sample two-tailed t-test.
Table 5.
Mean (±SD; n = 10), SOC stock (0–40 cm, t ha−1) for the three studied AF systems and their adjacent monocrop plot and results of paired sample two-tailed t-test.
| Land Use Type | n | Mean ± SD | t | df | Sig. (2-Tailed) | |
|---|---|---|---|---|---|---|
| Pair 1 | SOC Coffee–Ft–Enset AF | 10 | 125.5 ± 17.3 | 5.0 | 9 | 0.001 ** |
| SOC monocrop plot | 10 | 90.5 ± 15.3 | ||||
| Pair 2 | SOC Enset based AF | 10 | 146.1 ± 26.5 | 0.4 | 9 | 0.688 NS |
| SOC monocrop plot | 10 | 141.8 ± 28.1 | ||||
| Pair 3 | SOC Coffee–Enset AF | 10 | 139.6 ± 25.4 | 5.4 | 9 | 0.000 ** |
| SOC monocrop plot | 10 | 95.3 ± 14.6 |
** Significant at the 0.01 level (two-tailed). * Significant at the 0.05 level (two-tailed). NS—not significant.
Publisher’s Note: MDPI stays neutral with regard to jurisdictional claims in published maps and institutional affiliations. |
© 2022 by the authors. Licensee MDPI, Basel, Switzerland. This article is an open access article distributed under the terms and conditions of the Creative Commons Attribution (CC BY) license (https://creativecommons.org/licenses/by/4.0/).
Share and Cite
MDPI and ACS Style
Tesfay, H.M.; Negash, M.; Godbold, D.L.; Hager, H. Assessing Carbon Pools of Three Indigenous Agroforestry Systems in the Southeastern Rift-Valley Landscapes, Ethiopia. Sustainability 2022, 14, 4716. https://doi.org/10.3390/su14084716
AMA Style
Tesfay HM, Negash M, Godbold DL, Hager H. Assessing Carbon Pools of Three Indigenous Agroforestry Systems in the Southeastern Rift-Valley Landscapes, Ethiopia. Sustainability. 2022; 14(8):4716. https://doi.org/10.3390/su14084716
Chicago/Turabian StyleTesfay, Hafte Mebrahten, Mesele Negash, Douglas L. Godbold, and Herbert Hager. 2022. "Assessing Carbon Pools of Three Indigenous Agroforestry Systems in the Southeastern Rift-Valley Landscapes, Ethiopia" Sustainability 14, no. 8: 4716. https://doi.org/10.3390/su14084716
Note that from the first issue of 2016, this journal uses article numbers instead of page numbers. See further details here.