
Spatiotemporal Evolution of the Environmental Adaptability Efficiency of the Agricultural System in China

1
School of Architecture and Urban Planning, Lanzhou Jiaotong University, Lanzhou 730070, China
2
College of Geography and Environmental Science, Northwest Normal University, Lanzhou 730070, China
*
Author to whom correspondence should be addressed.
Sustainability 2022, 14(6), 3685; https://doi.org/10.3390/su14063685
Submission received: 23 February 2022
/
Revised: 18 March 2022
/
Accepted: 20 March 2022
/
Published: 21 March 2022
(This article belongs to the Collection Sustainability in Agricultural Systems and Ecosystem Services)
Abstract
:Since its emergence, the development of agriculture has always been closely related to changes in the natural environment. The productivity and development of agriculture largely depend on natural conditions and agriculture and has an important impact on the environment. The development of modern conventional agriculture has also led to a series of ecological, economic, and social problems that threaten human development and sustenance. China has historically been heavily reliant on agriculture and provides food and clothing for approximately 22% of the world’s population while only accounting for 9% of the world’s cultivated land and 6% of freshwater resources. Since the 21st century, the agricultural development of China has faced increasing resource and environmental constraints due to rapid industrialization and urbanization. Based on the perspective of efficiency evolution, data envelopment analysis (DEA) and spatial autocorrelation analysis (SAA) were used to test the environment adaptability efficiency within China’s agricultural systems across 30 provinces, autonomous regions, and municipalities, and explore its temporal and spatial evolution patterns and characteristics. Our study thus possesses both theoretical and practical significance. Furthermore, this study would enable the development of methods to assess China’s agricultural systems, in addition to providing a theoretical basis and guidelines for the creation of sustainable agriculture development strategies both in China and in other countries and regions. The following are the main conclusions of this study: (1) from 2000 to 2018, the overall environmental adaptability efficiency within China’s agricultural systems exhibited a gradual upward trend, achieving a transition from medium-level efficiency towards high-level efficiency, and the environmental adaptability of agricultural systems continued to increase. However, a certain gap remained between the level achieved and the DEA’s level of effectiveness, and therefore additional efforts are required to close this gap. (2) The environmental adaptability efficiency within China’s agricultural system showed a significant positive correlation in spatial distribution. Particularly, clear spatial aggregation characteristics were observed at the provincial level, which was also characterized by strong features of spatial dependence and spatial heterogeneity. Moreover, the degree of spatial aggregation increased gradually over time. High-value areas were mainly located along the southeast coastal area, whereas low-value areas were primarily located in the inland areas of the northwest. Therefore, environmental adaptability efficiency generally followed a northwest-southeast spatial distribution.
1. Introduction
Since the emergence of agriculture, its development has been closely associated with changes in the natural environment. The productivity and development of agriculture depends largely on nature and agriculture and has a considerable impact on the environment. All countries in the world have experienced, or are experiencing, the transition from primitive agriculture to traditional agriculture and modern agriculture [1]. However, the development of conventional modern agriculture has also brought a series of ecological, economic, and social problems that threaten human survival and development. In the future, agriculture will face unprecedented pressure, such as a high demand for food brought about by the rapid growth of the global population, an increasing demand for land, water and energy, and the threat of global climate change to agricultural production.
As a large traditional agricultural country, China provides food and clothing for approximately 22% of the world’s population, whereas it represents 9% of the world’s cultivated land and 6% of freshwater resources. However, due to significant regional differences within China’s agricultural systems and its long-term reliance on resource-based economic development, the contradiction between energy conservation, emission reduction, and the development of agricultural production has escalated, which has imposed a substantial impact on the development of agricultural production and the economy [2]. Since the 21st century, the agricultural development of China has faced increasing resource and environmental constraints due to rapid industrialization and urbanization.
Foreign research on agricultural systems mainly focuses on improving the stability, self-recovery capacity, and sustainability of agricultural ecosystems, especially farmlands. Therefore, due to the excessive consumption of resources and environmental impacts of agriculture, green agriculture and ecological agriculture have recently garnered increasing attention. For example, Walters et al. analyzed the systematic interaction between several influencing factors and the economic, environmental, and social sustainability of agricultural production [3]. Furthermore, Sanaullah et al. compared the impacts of traditional and conservational agricultural management systems on land ecosystem functions from the perspective of environmental sustainability and soil quality [4]. Huyghe et al. assessed the resilience, vulnerability, and stability of agricultural systems, and elucidated the role of these concepts in solving agronomic problems [5]. Barati et al. applied the Micmac and Analytic Hierarchy Process (AHP) methods to comprehensively manage a selection of key strategic variables of agricultural systems [6]. Olde et al. summarized the appropriate indicators for evaluating agricultural sustainability [7]. Anas et al. tested effective strategies for improving rice yield and quality when organic and inorganic nitrogen fertilizers were applied together [8]. Ruhollah et al. evaluated the land suitability for the cultivation of two main crops [9]. Wassmann et al. analyzed the relationship between adaptation, food security, and mitigation, which the authors considered the key pillars of agricultural development [10]. Mekonnen et al. studied the interactions between different elements of agricultural innovation systems to analyze agricultural technology efficiency in developing countries [11]. Aklilu et al. evaluated the advantages and constraints of agricultural extension systems, and provided suggestions on the status quo, optimal conditions, solutions, and their expansion opportunities among small-scale irrigation users [12]. Kallenbach et al. considered three complex influencing factors of the agricultural ecosystem and analyzed how to improve the capacity of soil carbon storage [13]. Finally, Bunting et al. used the Drive force-Pressure-State-Impact-Response (DPSIR) framework to assess the contribution of shrimp-rice agroecosystems to social-ecological resilience [14].
Domestic research on agricultural systems has mainly focused on the perspectives of ecological civilization and sustainable development, and assesses the ecological efficiency of agricultural systems, their modernization levels, and associated innovations to maximize the use of agricultural resources and effective protection of the ecological environment. For example, Niu evaluated the agroecological civilization index of various provinces and typical regions in China [15]. Additionally, Zhang studied the level of agricultural development in the Yangtze River Delta and its spatial differentiation characteristics [16]. Wang conducted research on the development status, regional differences, and influencing factors of China’s agroecological efficiency [17]. Ding et al. measured the efficiency of regional agricultural innovation systems across provinces in China and analyzed the major influencing factors [18]. Pang conducted a comprehensive spatiotemporal measurement to assess China’s regional agroecological efficiency and analyzed the associated influencing factors [19]. Hu et al. [20] and Liu et al. [21] examined the agroecological efficiency of the Jiangsu and Anhui provinces, respectively.
Early overseas research on adaptability sought to determine how to adapt to global environmental changes in the 1990s. As relevant research has become more specific, it has gradually developed and expanded into the field of development and assessment of sustainability capability. Currently, relevant research mainly focuses on defining adaptability, the differentiation of related concepts, and the development and assessment of an adaptive framework. For example, Brown proposed that adaptability itself represents a comprehensive process [22]. Moreover, Sandra analyzed the adaptations of small farming systems to climate variability [23]. Massimo et al. evaluated adaptation options in Italian agricultural farming systems [24]. Chen et al. evaluated the intensification and diversification of adaptation activities at a global scale [25]. Panda analyzed the concept of adaptability in agricultural systems [26]. Eakin et al. investigated the impacts of cognition and institution on farmers’ adaptability to agricultural transformation and change [27]. Vervoort assessed the current challenges in agriculture development and food security in the context of climate change [28]. Steward et al. analyzed the adaptability of corn production to climate stress [29]. Dogulu et al. analyzed the priorities and measures for adaptation activities in response to regional climate change [30]. John et al. evaluated the implementation of innovations for climate change adaptation in crop-based systems [31]. Kasturi analyzed South Asia’s adaptability to climate change and various measures for such an adaptation [32]. Finally, Adger believed that adaptability is a key component of the concept of vulnerability [33].
Since the mid-1990s, domestic researchers have gradually started to focus on the topic of adaptability, especially the interpretation of this concept, the selection and assessment of adaptive indicators, and the selection of adaptability strategies. For example, Zhao et al. summarized a method, framework, and evaluation index system for adaptive research [34]. Su et al. reviewed and commented on the adaptability of the social-ecological system of tourist destinations [35]. Li et al. analyzed the temporal and spatial differences and factors that influence the environmental adaptability of the human-sea interaction and its socioeconomic implications in the Bohai Economic Rim [36]. Wu et al. analyzed the adaptability types, degree, and influencing factors of farmers’ adaptability towards rural tourism in traditional villages [37]. Shi established the ecological adaptability theory of the rural human settlement environmental planning in Chongqing and performed an empirical analysis [38]. Zhang et al. analyzed the characteristics of the current landscape system and its adaptation to global change [39]. Yin et al. analyzed the adaptability of farmers belonging to different adaptation types and associated influencing factors [40]. He et al. analyzed the adaptability of different types of land-lost farmers in urban fringe areas, as well as the factors that limited their adaptive capacity [41]. Xu analyzed the environmental adaptability of the Longdong Loess Plateau agricultural system [42].
Current studies on agricultural development have produced promising results. However, there are still many limitations that must be addressed. Firstly, from a research scope and entry point perspective, very few studies have assessed the adaptability of agricultural and environmental systems. Particularly, studies on the environmental adaptability of agricultural systems are quite limited, and the available research is in its preliminary exploration stage. Secondly, from the perspective of research ideas and methods, very few studies have combined spatial analysis models and geographic information system (GIS) technology while also considering spatial and temporal dimensions to obtain comprehensive and integrated measurements of environmental adaptability in agricultural systems. Therefore, the present study sought to bridge this knowledge gap. Specifically, this study takes the environmental adaptability of agricultural systems as the entry point to enrich and improve the research on the adaptability of agricultural and environmental systems. Furthermore, based on GIS technology and a spatial analysis model, the spatial and temporal integrated measurements of the environmental adaptability of agricultural systems were obtained to enrich and improve the current research ideas and methods.
Based on the perspective of efficiency evolution, the present study applies data envelopment analysis (DEA) and spatial autocorrelation analysis (SAA) to test environment adaptability efficiency within China’s agricultural systems across 30 provinces, autonomous regions, and municipalities, and explores its temporal and spatial evolution patterns and characteristics. Therefore, this study has considerable theoretical and practical significance. Particularly, this study can contribute to the enrichment and development of the methods used to assess China’s agricultural systems. Additionally, our study provides a theoretical basis and decision support for China to formulate a sustainable development strategy of regional agricultural systems, as well as a reference for other countries and regions.
2. Data and Methodology
2.1. Indicator System and Data Sources
The establishment of the indicator system of this study is based on the existing research results of other scholars [43,44,45,46]. Here, we selected representative indicators that are frequently used and meet the research requirements, after which an input-output indicator system for measuring environmental adaptability efficiency within China’s agricultural systems was established (Table 1). This study is based on data obtained between 2000 and 2018 from a variety of sources, including the China Statistical Yearbook, the China Rural Statistical Yearbook, the China Agricultural Statistics Yearbook, statistical yearbooks of various provinces (autonomous regions and municipalities directly under the central government), the National Economic and Social Development Statistical Bulletin, Environmental Bulletins, and other relevant materials and documents.
2.2. Research Method
2.2.1. DEA Model
Efficiency measurement methods mainly include life cycle evaluation, stochastic frontier analysis and DEA model. Life cycle evaluation is highly subjective, and its regional comparability is poor, as this method is much better suited for the comparison of individual products and industries. The stochastic frontier analysis method can only be used to assess single output problems and has poor ability to deal with multiple output problems. DEA model is a non-parametric analysis method, which can well deal with the problem of multi-input and multi-output. The measurement of efficiency can better reflect the real situation and meet the actual demand. Therefore, this research chooses DEA model.
In this study, a slack based model with undesirable outputs (SBM-Undesirable) was used to measure the environmental adaptability efficiency within China’s agricultural systems based on the following assumptions [47,48,49,50,51]: there are n decision-making units, m input indicators, s1 expected outputs indicators, and s2 unexpected outputs indicators. represents the m-th input indicator of the i-th decision-making unit, means the s1-th expected output indicator of the i-th decision-making unit, is the s2-th unexpected output indicator of the i-th decision-making unit, R represents the real number matrix of input, expected and unexpected output. The input matrix X, expected output matrix Y, and unexpected output matrix Z of the i-th decision-making unit were then calculated as follows:
The production set of all possible decision-making units is:
In this formula, P(x) represents the production set, x is the input indicator set, y is the expected output indicator set, z is the unexpected output indicator set, λ represents the vector density, and X, Y, Z are the input matrix, expected output matrix and unexpected output matrix respectively.
The mathematical form of the model is:
in Formulas (3) and (4), is the objective function value of the SBM-Undesirable model, and the value range is [0, 1], N is the number of inputs (x), M is the number of expected outputs (y), I is the number of undesirable outputs (b), represent the n-th input, m-th expected output, and i-th undesirable output, respectively, st represents the constraint conditions of the objective function, represent the slack variable of the input, expected output, and undesirable output, respectively, K means the number of decision-making units, and k is the k-th decision-making unit, xnk, ymk and bik are the n-th input vector, the m-th expected output and the i-th undesirable output of the k-th decision-making unit, respectively, and is a density vector that represents the weight of each element. The decision-making unit was deemed valid if = 1 and = 0. Otherwise, the decision-making unit was considered invalid, meaning that the input or output variables could be further improved.
2.2.2. Global Spatial Autocorrelation Analysis (Global Moran’s I)
The spatial pattern of environmental adaptability efficiency within China’s agricultural systems was analyzed using the spatial autocorrelation model, and the global Moran’s I index was implemented to establish whether an aggregation or dispersion pattern existed in the region using the following formula [47,52,53,54]:
where I is the value of Global Moran’s I, n is the number of evaluation objects, is the average value of the attribute values of all evaluation objects, is the attribute value of the i-th evaluation object, is the attribute value of the j-th evaluation object, and is the spatial weight matrix.
To further assess whether a spatial autocorrelation pattern existed in the region, a significance test was conducted for I using the following formula:
where Z is the global Moran’s I test value, I is the value of Global Moran’s I, E(I) is the expected value of I, and Var(I) is the variance of I. The uncertainty analysis in the spatial autocorrelation model is relatively complicated, there are many factors to consider, and the interpretability of the calculation results can be reduced. Therefore, uncertainty analysis was not conducted in this research.
2.2.3. Hotspot Analysis (Local Getis-Ord G* Exponent)
Hotspot analysis (local Getis-ORD G* index) was conducted to characterize the spatial dependence and heterogeneity of environmental adaptability efficiency within China’s agricultural systems, as well as to examine the characteristics and patterns of local spatial autocorrelation using the following formula [55,56,57]:
where is the observed value of region i, n is the number of evaluation objects, and is the spatial weight matrix. represents a local G statistic, significantly positive values suggest that the value around region i is relatively high, and region I can be categorized as a hotspot. Otherwise, it is categorized as a coldspot.
3. Results and Discussion
3.1. Spatiotemporal Evolution of Environmental Adaptability Efficiency within China’s Agricultural Systems
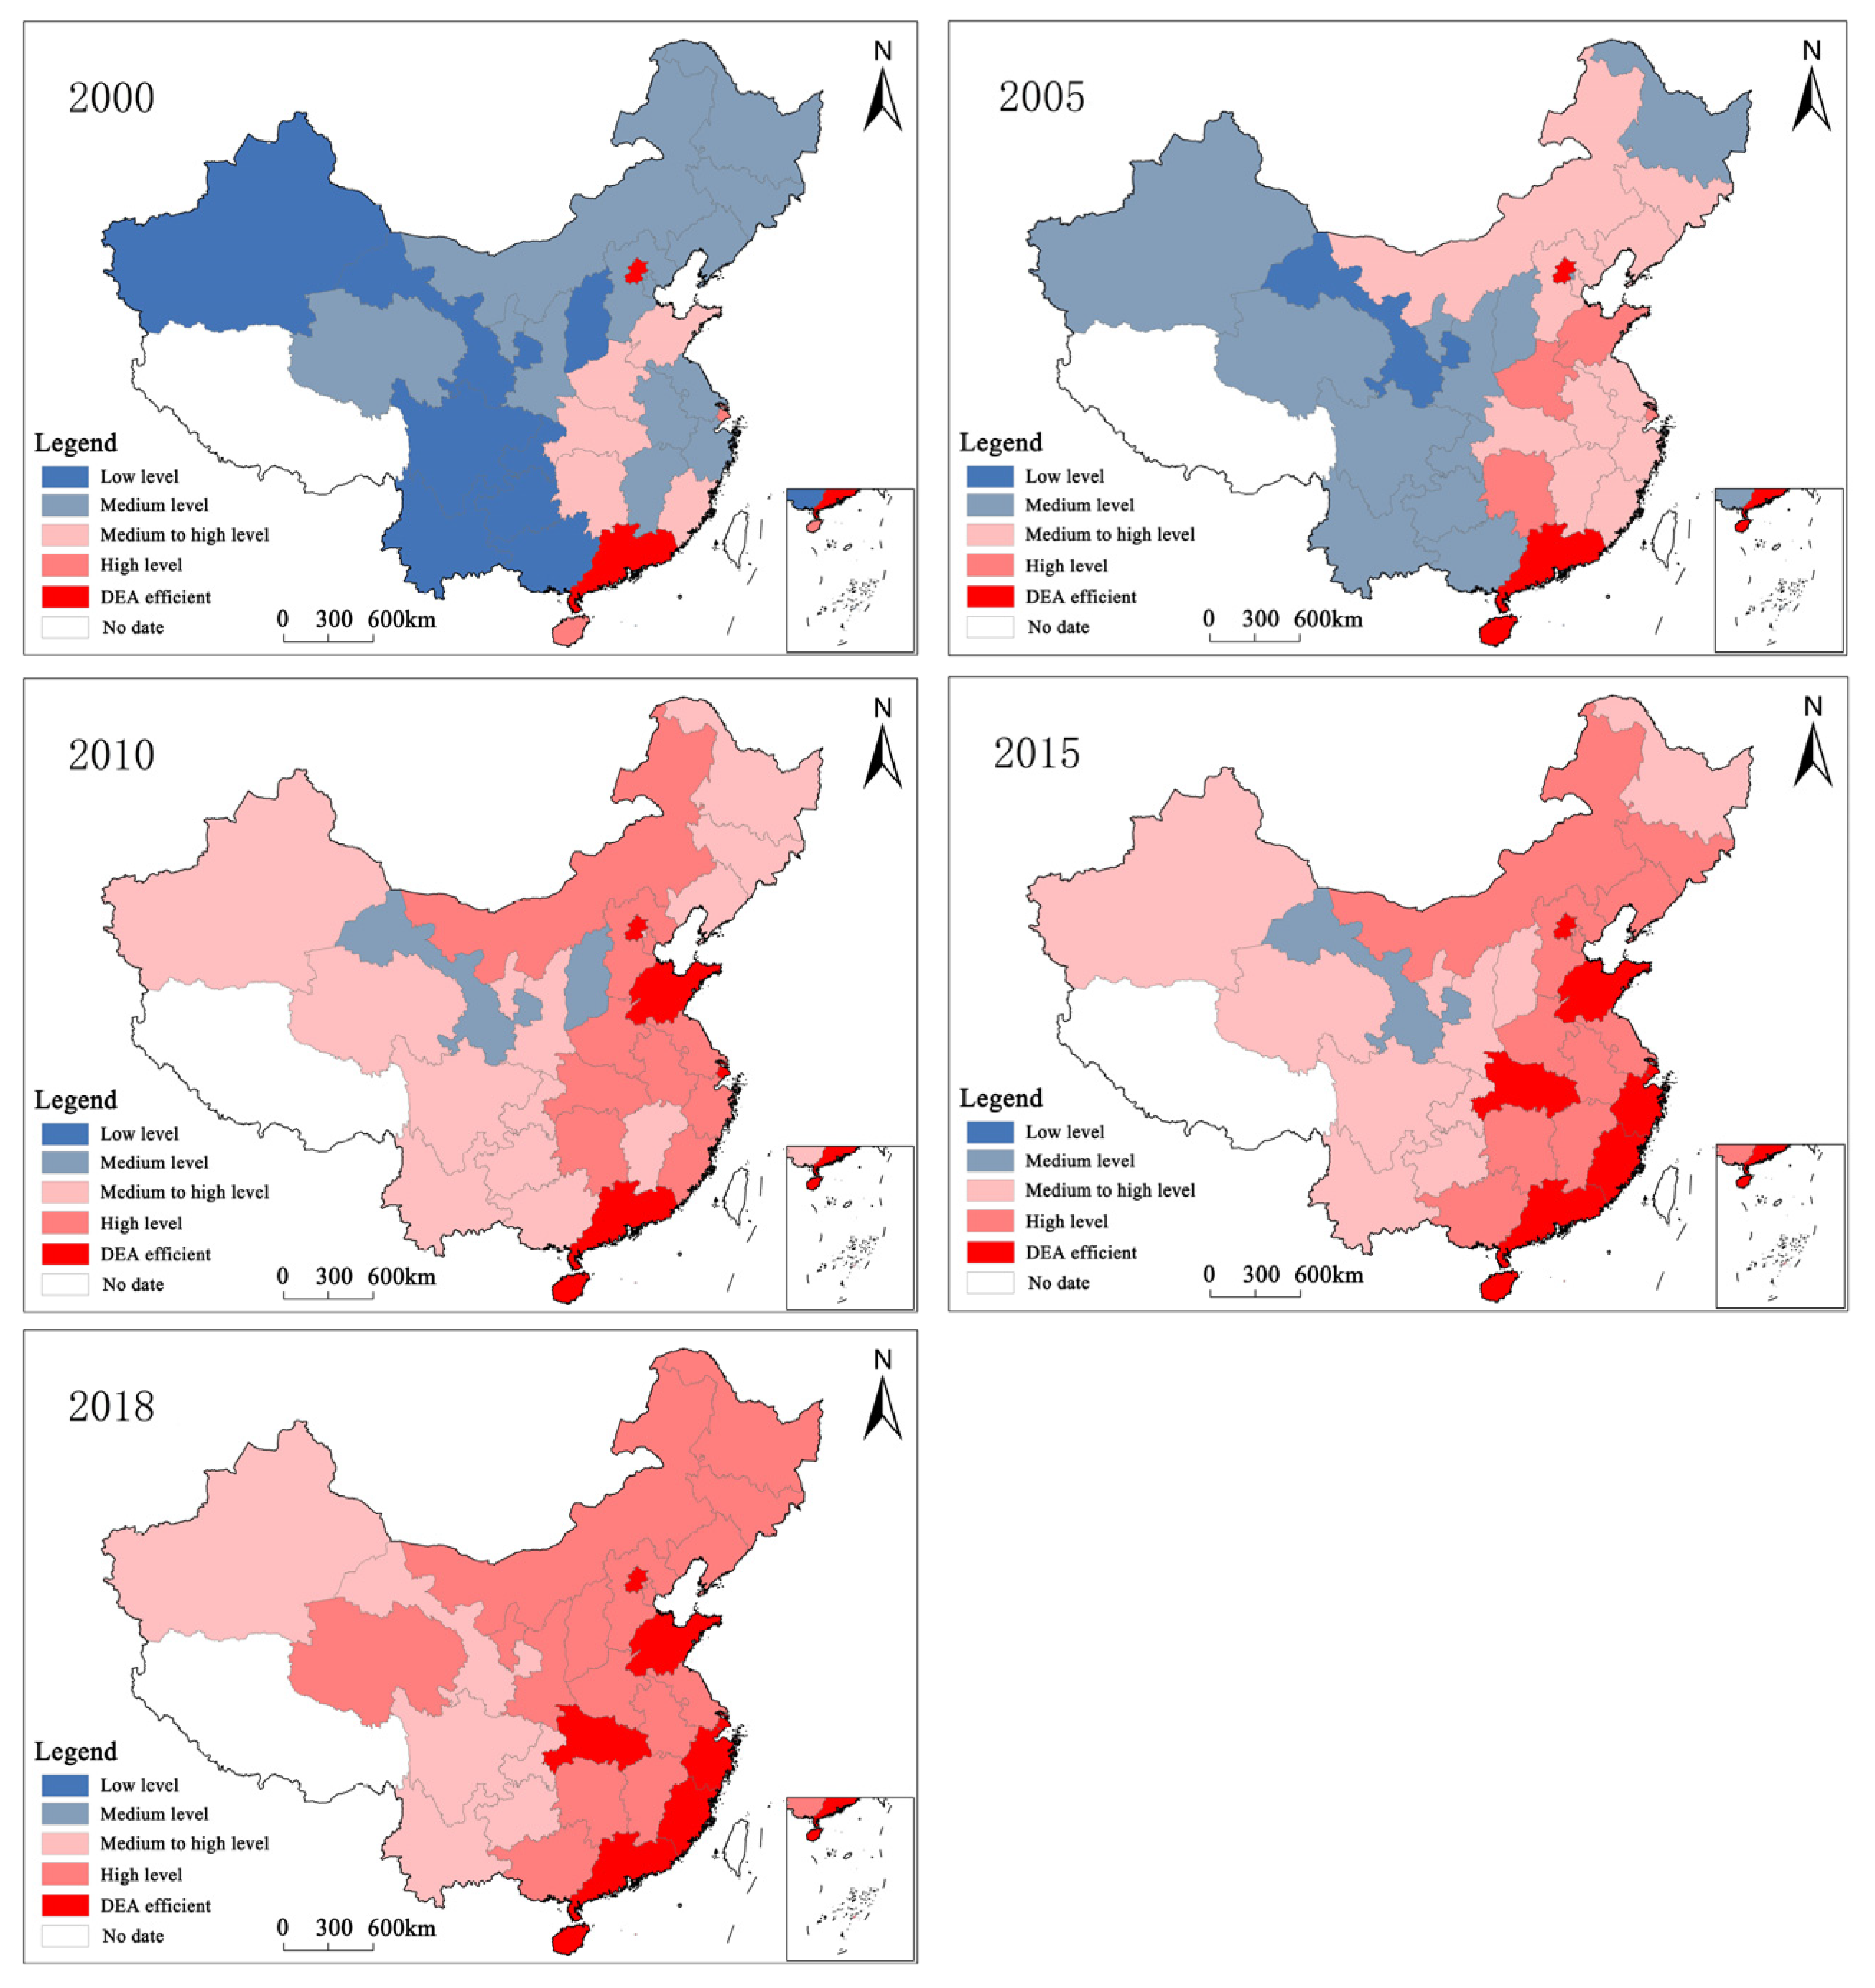
The adaptability efficiency of agricultural systems within 30 provinces of China between 2000 and 2018 was calculated using the SBM-Undesirable model (Table 2). According to the calculation results and relevant literature [17], and considering the actual situation, the degree of environmental adaptability efficiency within China’s agricultural systems was categorized (Table 3). Moreover, a distribution diagram of the degree of environmental adaptability efficiency within China’s agricultural systems for each province in 2000, 2005, 2010, 2015, and 2018 was also created (Figure 1).
Between 2000 and 2018, the average value of environmental adaptability efficiency within China’s agricultural systems exhibited a steady upward trend, thus transitioning from a medium level to a high level. This suggests that the overall environmental adaptability efficiency within China’s agricultural systems is continuously rising. However, a certain gap remains between the level achieved and DEA’s level of effectiveness, meaning that additional efforts are required to fill this gap.
In 2000, Beijing and Guangdong stood out as province-level cities or provinces with the highest degree of environmental adaptability efficiency within China’s agricultural systems, and both reached the DEA’s level of effectiveness. Furthermore, Shanghai and Hainan reached high levels, Fujian and Henan were at medium to high levels, Tianjin and Hebei were at medium levels, and Shanxi and Gansu were at low levels. This was largely attributed to the socioeconomic development level of each region, in addition to agricultural production technology and capital investment. In 2005, the number of low-level provinces decreased, whereas the number of high-level provinces increased, especially in the southeastern coastal areas. Beijing, Guangdong, and Hainan displayed the highest level of efficiency, and reached the DEA’s level of effectiveness. Shanghai and Shandong reached high levels, Hebei and Tianjin were at a medium to high levels, Shanxi and Heilongjiang were at medium levels, and the Gansu province was at a relatively low level. This was mainly due to the rapid economic development of southeast coastal areas, as well as increased agricultural production level and financial support. In 2010, the number of provinces with medium and high levels increased significantly, and provinces with low levels no longer existed. Beijing and Shanghai displayed the highest level of efficiency and reached the DEA’s level of effectiveness. Tianjin and Hebei were at high levels, Jilin and Liaoning were at medium to high levels, and Gansu and Shanxi were at medium levels. This was mainly due to the economic growth of China’s inland areas, and the improvement of agricultural resources and agricultural production level. In 2015, the number of provinces reaching the DEA’s level of effectiveness increased significantly, and the majority of the provinces were distributed across the eastern and southeastern coastal areas. Beijing and Shanghai displayed the highest level of efficiency and reached the DEA’s level of effectiveness. Hebei and Tianjin were at high levels, Shanxi and Sichuan were at medium to high levels, and Gansu was at a medium level. This is mainly due to the overall improvement of China’s economic development level, as well as the improvement of agricultural production level. In 2018, there was a rapid increase in the number of provinces at high levels and above, middle-level and low-level provinces no longer existed, and the gap between the various provinces became narrower. Beijing and Shanghai displayed the highest level of efficiency and reached the DEA’s level of effectiveness. Hebei and Tianjin were at high levels, and Chongqing and Sichuan were at medium to high levels. This was mainly due to the narrowing of the economic development gap between different regions in China, improved investment and agricultural production level, and increased awareness of consumption safety. Overall, between 2000 and 2018, the environmental adaptability efficiency within China’s agricultural systems maintained a relatively fast growth rate, the number of provinces at medium and high levels gradually increased, and the gap between provinces displayed a narrowing trend. The environmental adaptability efficiency within China’s agricultural systems was higher in the southeast region and lower in the northwest region. It decreased from the southeast coastal areas towards the northwest inland region, thus exhibiting a northwest-southeast spatial distribution pattern.
3.2. Spatial Aggregation Characteristics of Environmental Adaptability Efficiency within China’s Agricultural Systems
3.2.1. Global Spatial Autocorrelation Analysis
Global spatial autocorrelation reflects the features of an attribute in a global space. This parameter can be used to reflect whether the environmental adaptability efficiency of China’s agricultural system is spatially dependent, as well as to explore its spatial agglomeration mode. The value range of the global spatial autocorrelation index is [–1, 1]. If this value exceeds 0, the spatial correlation is considered positive; if it is below 0, spatial correlation is negative; if it is equal to 0, it has no spatial correlation. The global Moran’s I index of environmental adaptability efficiency within China’s agricultural system was determined between 2000 and 2018 (Table 4). The Z values were greater than 1.96 and this effect was significant at a 5% level. Therefore, between 2000 and 2018, the environmental adaptability efficiency within China’s agricultural systems exhibited a significantly positive correlation with spatial distribution. Moreover, adjacent provinces with high (low) efficiency displayed aggregation patterns, and the aggregation characteristics were obvious at the provincial level. More specifically, provinces with different efficiency levels were not randomly distributed but displayed high (low) regional spatial aggregation patterns. Moreover, provinces tended to be surrounded or located close to other provinces with similar efficiency levels, either low or high. The global Moran’s I index exhibited an upward trend, suggesting that its degree of spatial autocorrelation kept gradually increasing. More specifically, the degree of spatial aggregation distribution for provinces with high or low efficiency levels exhibited and overall increase throughout the study period.
3.2.2. Hotspot Analysis
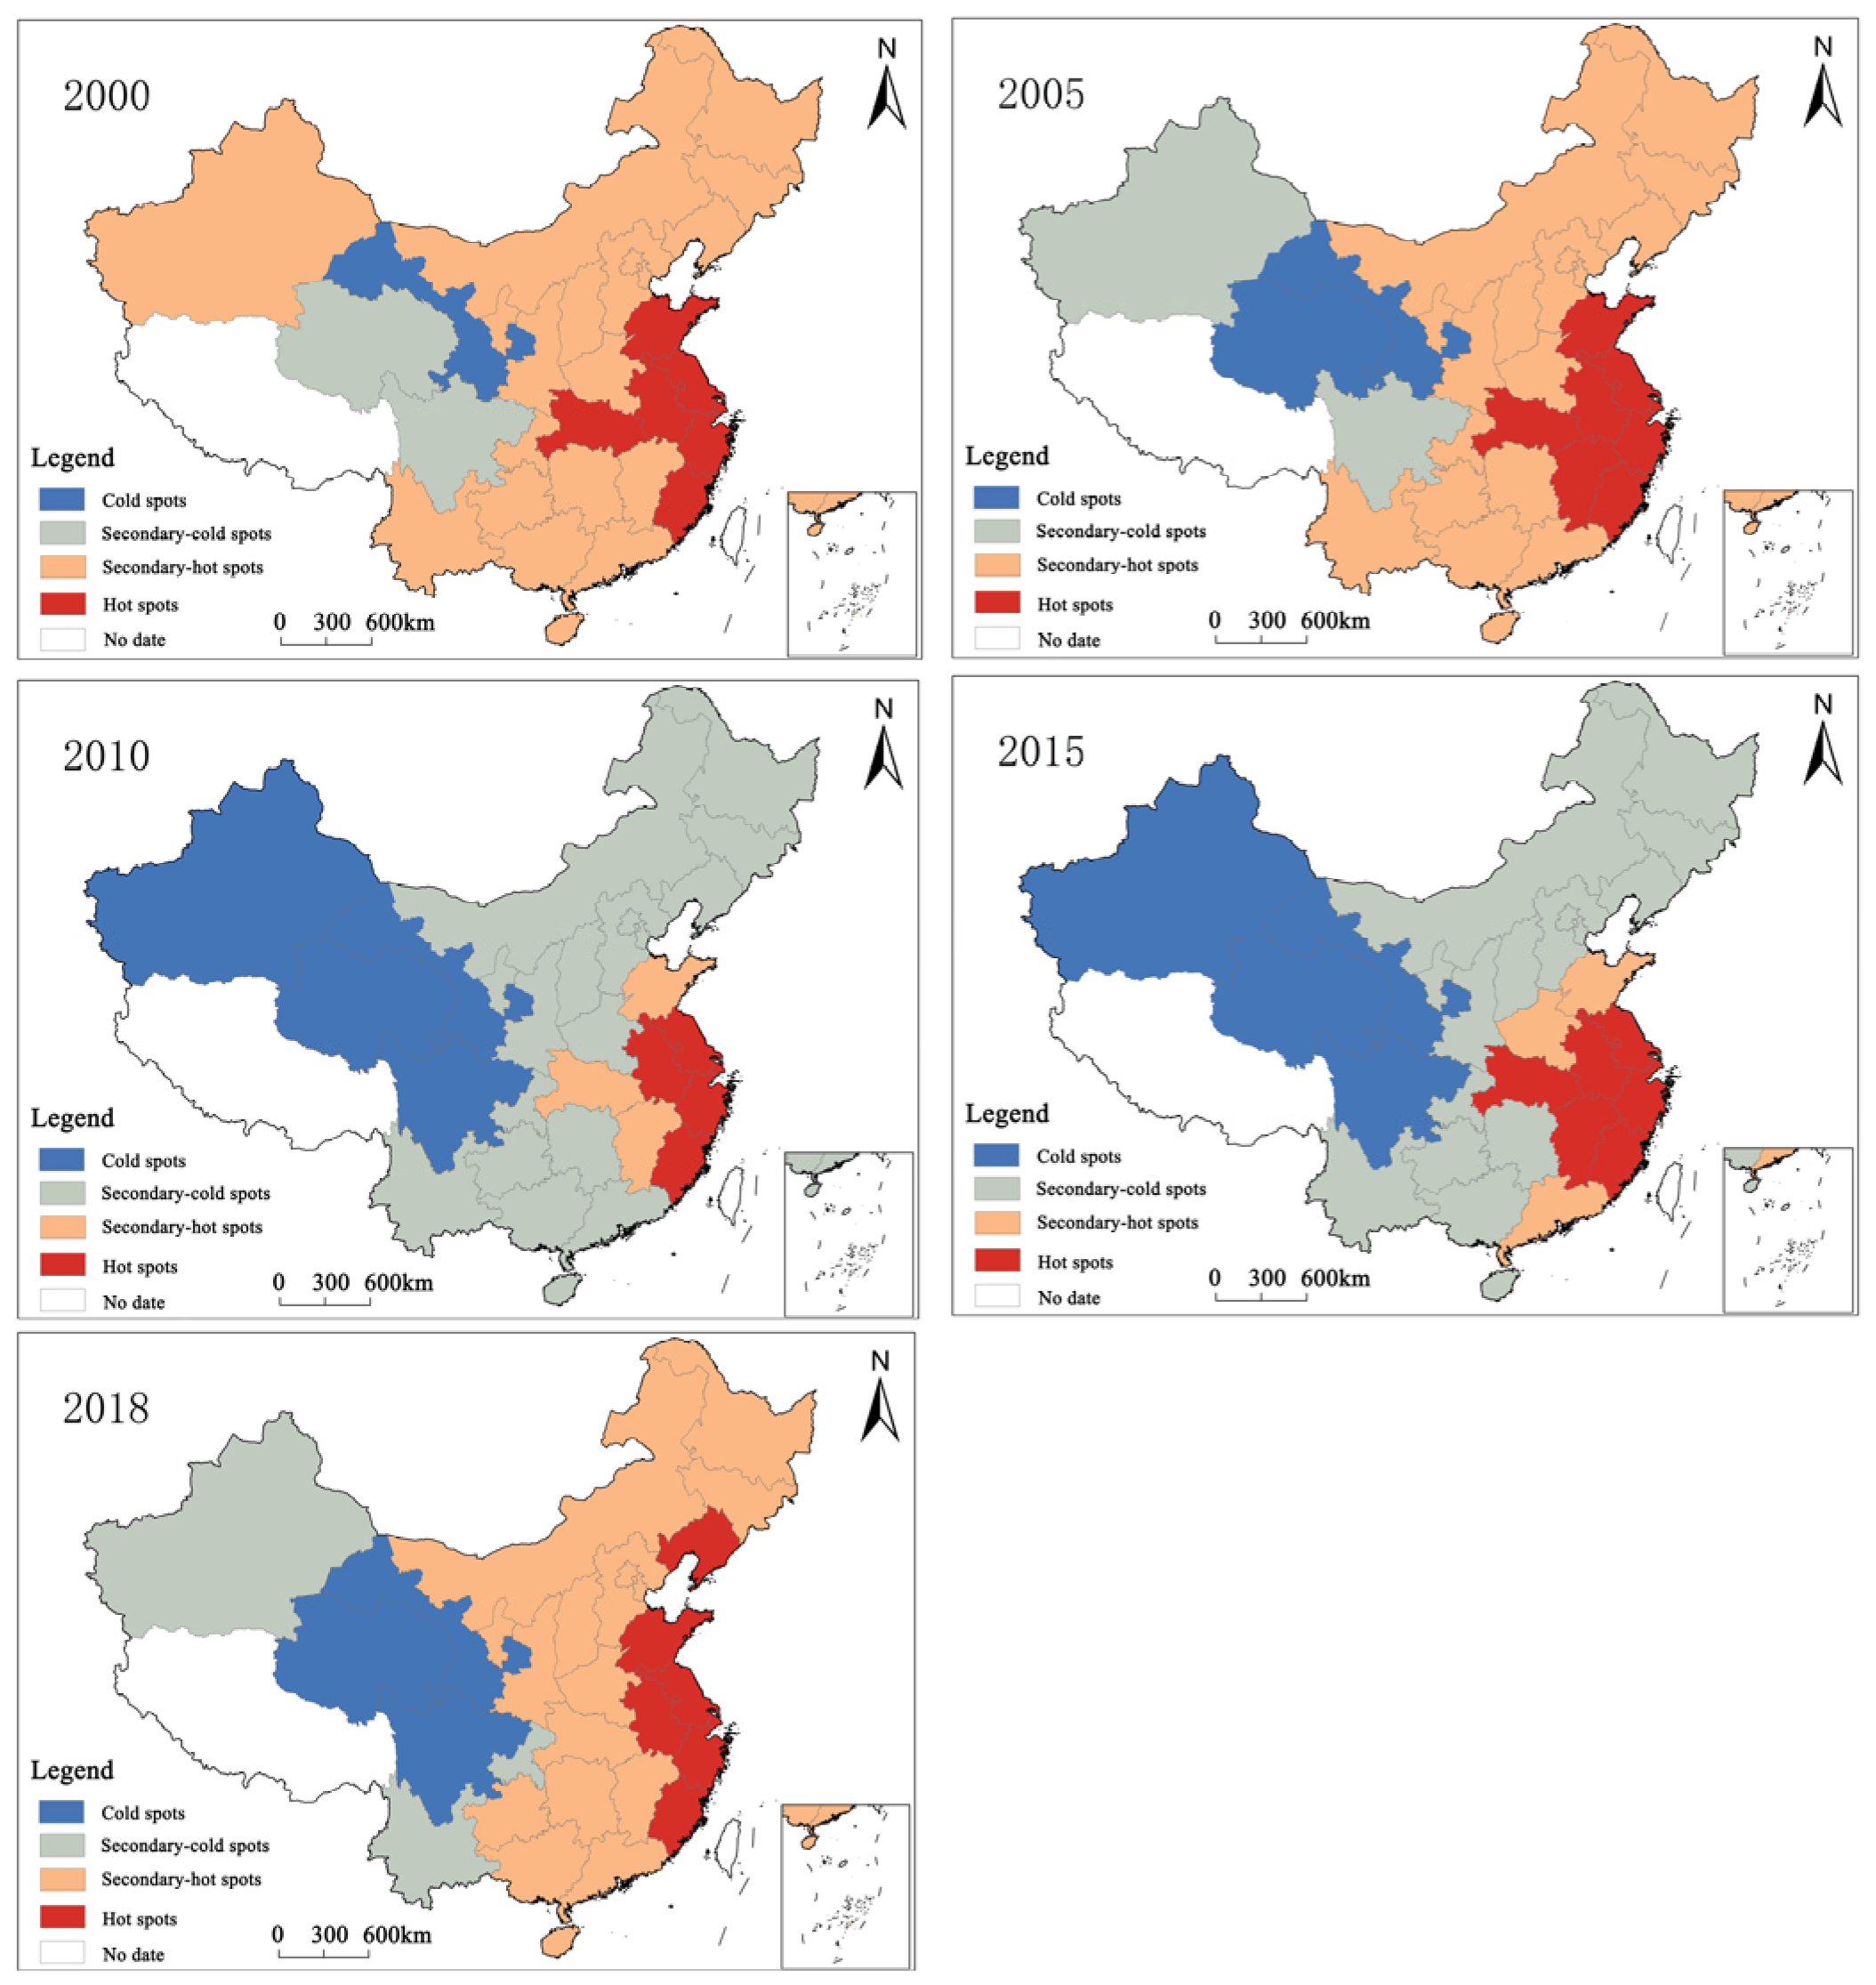
In this study, local spatial autocorrelation analysis was conducted for the years 2000, 2005, 2010, 2015, and 2018 to characterize the environmental adaptability efficiency within China’s agricultural systems. The degree of correlation between the attribute value of each spatial unit and the attribute value of its neighboring spatial unit were characterized based on coldspots, secondary coldspots, secondary hotspots, and hotspots. This approach allowed for the analysis of the local spatial relationships in the study region (Figure 2).
In 2000, seven provinces were categorized as hotspots (including Shanghai and Jiangsu), the Gansu province was categorized as a coldspot, Qinghai and Sichuan were categorized as secondary coldspots, and the remaining 20 provinces were categorized as secondary hotspots, accounting for 67% of all provinces and exhibiting the widest distribution. High-value areas were mainly distributed in an aggregated manner. In 2005, the number of hotspot provinces increased to eight (including Shanghai and Jiangsu), the number of coldspot provinces increased to two (Gansu and Qinghai), the number of secondary coldspot provinces remained at two (Xinjiang and Sichuan), and the number of secondary hotspot provinces decreased to eighteen, accounting for 60% all provinces and still exhibiting the widest distribution. Again, high-value areas appeared strongly aggregated. In 2010, the number of hotspot provinces decreased to five (including Shanghai and Jiangsu), the number of secondary hotspot provinces decreased to three (including Shandong and Jiangxi), the number of coldspot provinces increased to four (including Qinghai and Sichuan), and the number of secondary coldspot provinces increased to eighteen, accounting for 60% of all provinces and with the widest distribution. The aggregation range of high-value areas shrunk, whereas the aggregation range of low-value areas expanded greatly, resulting in an aggregation distribution pattern dominated by low-value areas. In 2015, the number of hotspot provinces increased to seven (including Jiangxi and Hubei), the number of secondary hotspot provinces remained as three (including Shandong and Guangdong), the number of coldspot provinces remained as four (including Qinghai and Sichuan), and the number of secondary coldspot provinces was further reduced to sixteen, accounting for 53% of all provinces and exhibiting the widest distribution. Additionally, low-value areas were mainly distributed in an aggregated manner. In 2018, the number of hotspot provinces remained as seven (including Shandong and Liaoning), the number of coldspot provinces was reduced to three (including Qinghai and Gansu), the number of secondary coldspot provinces decreased to three (including Xinjiang and Yunnan), and the number of secondary hotspot provinces increased to seventeen, accounting for 57% of the total number of provinces and with the widest distribution. The aggregation range of low-value areas shrunk, whereas the aggregation range of high-value areas expanded, with the distribution of high-value areas becoming dominant.
Overall, the environmental adaptation efficiency within China’s agricultural systems displayed obvious spatial aggregation characteristics between 2000 and 2018, which was also characterized by strong features of spatial dependence and spatial heterogeneity. Additionally, the degree of spatial aggregation in terms of high-value areas and low-value areas was enhanced. The aggregations of high-value areas were mainly distributed in the southeast coastal area, whereas the aggregations of low-value areas were mainly located in the inland areas of the northwest, exhibiting an overall northwest-southeast spatial distribution pattern.
3.3. Discussion
Recent studies have also analyzed regional environmental adaptation efficiency and have reached similar conclusions. For instance, Akbar et al. used the SBM-Undesirable model to calculate the agricultural ecological efficiency of 31 provinces in China from 2007 to 2017 and reached conclusions that were consistent to those reported herein. China’s agricultural ecological efficiency generally showed an upward trend; however, the regional differences were obvious, and efficiency was higher in the eastern region compared to the central and western regions [58]. Based on panel data from 2003 to 2013, Pang conducted a study on agricultural ecological efficiency in China. The authors reported that China’s agricultural ecological efficiency is at a medium level, and the overall trend is fluctuating [19]. Bagheri et al. used the data envelopment analysis (DEA) method to estimate the agricultural environmental efficiency of different provinces in Iran, and the results indicated that agricultural environmental efficiency decreased with higher levels of greenhouse gas emissions [59]. Zheng et al. used the DEA model to calculate the agricultural ecological efficiency of Gansu Province from 2000 to 2014, and the results showed that the agricultural ecological efficiency was generally low and showed an upward trend [60]. Wu et al. used DEA model to study the ecological efficiency of agricultural land in Henan Province from 2012 to 2016, and the results showed that the overall agroecological efficiency level was low [61]. Nsiah et al. used the DEA model to study agricultural productivity and the determinants of agricultural production in 49 African countries. The authors reported that agricultural aid, agricultural infrastructure development, sanitation, and good governance are the main drivers of agricultural efficiency growth [62]. Linh et al. used DEA model to analyze agricultural productivity and environmental efficiency in nine eastern Asian countries. Interestingly, large differences in agricultural productivity and environmental performance were identified between the nine countries [63]. Anik et al. assessed agricultural productivity in South Asian countries and found that they exhibited different rates of agricultural productivity [64].
Sustainable agricultural development is unquestionably crucial for any country or region. Therefore, additional efforts are needed to improve the current environmental protection strategies for agricultural systems, as well as to develop eco-friendly agriculture practices, promote agricultural waste recycling and reduce or eliminate the impacts of reusing such waste, increase innovation in agricultural science and technology, and improve the agricultural infrastructure so that the environmental adaptability efficiency within China’s agricultural systems can be effectively improved. Of course, our study had a series of limitations. For example, the factors that affect the environmental adaptability efficiency of agricultural systems are diverse, and such influencing factors could vary for different agricultural industries. Moreover, due to the difficulty of obtaining relevant basic data, no specific quantitative analysis was conducted in the present study. Future research should therefore consider these limitations to further improve research quality.
4. Conclusions
Between 2000 and 2018, the overall environmental adaptability efficiency within China’s agricultural systems showed a gradual upward trend, achieving a transition from medium-level efficiency towards high-level efficiency, and the environmental adaptability of agricultural systems continued to increase. However, a certain gap remained between the level achieved and the DEA’s level of effectiveness, meaning that additional efforts are required to fill this gap. Additionally, the environmental adaptability efficiency within China’s agricultural systems kept a relatively fast growth rate, the number of provinces at medium and high levels had gradually increased, and the gap between the provinces generally displayed a narrowing trend. The environmental adaptability efficiency within China’s agricultural systems was high in the southeast region, and low in the northwest region, thus exhibiting a northwest-southeast spatial distribution pattern.
Between 2000 and 2018, the environmental adaptability efficiency within China’s agricultural systems exhibited a significant positive correlation in spatial distribution. Moreover, adjacent provinces with high (low) efficiency tended to aggregate. Specifically, provinces tended to be surrounded or located near other provinces with similar efficiency levels, either high or low. The environmental adaptability efficiency within China’s agricultural systems exhibited strong spatial aggregation at the provincial level, which was also characterized by strong features of spatial dependence and spatial heterogeneity. Furthermore, the degree of spatial aggregation increased gradually over time. High-value area aggregates were primarily located in the southeast coastal area, whereas low-value area aggregations were mainly found in the inland areas of the northwest, thus exhibiting a northwest-to-southeast spatial distribution pattern.
Author Contributions
X.T. and C.L. designed the study and wrote the paper. P.M. analyzed the data. W.C. contributed to data collection and processing. All authors have read and agreed to the published version of the manuscript.
Funding
This study was funded by the National Natural Science Foundation of China (Grant Nos. 42061054, 41561110, 52068040) and by the Science and Technology program of Gansu Province (Grant Nos. 20CX4ZA039 and 21JR1RA234).
Institutional Review Board Statement
Not applicable.
Informed Consent Statement
Not applicable.
Data Availability Statement
The data used to support the findings of this study are available from the corresponding author upon request.
Acknowledgments
We thank the anonymous reviewers and all editors that participated in the revision process.
Conflicts of Interest
The authors declare no conflict of interest.
References
- Ning, X.J. Research on Environmental Adaptability of Major Grain Crops in China under Climate Change. Ph.D. Thesis, Henan University, Kaifeng, China, 2016. (In Chinese). [Google Scholar]
- Lu, C.Y.; Wang, T.; Lu, C.P. Dynamic Simulation of Sustainable Development in the Loess Plateau region of Longdong-A Case study of Qingyang City, Gansu Province. Resour. Dev. Mark. 2017, 33, 20–26. (In Chinese) [Google Scholar]
- Walters, J.P.; Archer, D.W. Exploring agricultural production systems and their fundamental components with system dynamics modelling. Ecol. Model. 2016, 333, 51–65. [Google Scholar] [CrossRef] [Green Version]
- Sanaullah, M.; Usman, M. Terrestrial ecosystem functioning affected by agricultural management systems: A review. Soil Tillage Res. 2020, 196, 104464. [Google Scholar] [CrossRef]
- Urruty, N.; Lefebvre, D.T.; Huyghe, C. Stability, robustness, vulnerability and resilience of agricultural systems. A review. Agron. Sustain. Dev. 2016, 36, 15. [Google Scholar] [CrossRef] [Green Version]
- Barati, A.A.; Azadi, H.; Marchand, F. Determining Key Agricultural Strategic Factors Using AHP-MICMAC. Sustainability 2019, 11, 3947. [Google Scholar] [CrossRef] [Green Version]
- Olde, E.M.; Moller, H. When experts disagree: The need to rethink indicator selection for assessing sustainability of agriculture. Environ. Dev. Sustain. 2016, 19, 1327–1342. [Google Scholar] [CrossRef] [Green Version]
- Iqbal, A.; He, L. Organic Manure Coupled with Inorganic Fertilizer: An Approach for the Sustainable Production of Rice by Improving Soil Properties and Nitrogen Use Efficiency. Agronomy 2019, 9, 651. [Google Scholar] [CrossRef] [Green Version]
- Taghizadeh-Mehrjardi, R.; Nabiollahi, K.; Rasoli, K.; Kerry, R.; Scholten, T. Land Suitability Assessment and Agricultural Production Sustainability Using Machine Learning Models. Agronomy 2020, 10, 573. [Google Scholar] [CrossRef]
- Wassmann, R.; Villanueva, J. Adaptation, mitigation and food security: Multi-criteria ranking system for climate-smart agriculture technologies illustrated for rainfed rice in Laos. Glob. Food Secur. 2019, 23, 33–40. [Google Scholar] [CrossRef]
- Mekonnen, D.K.; Spielman, D.J. Innovation systems and technical efficiency in developing-country agriculture. Agric. Econ. 2015, 46, 689–702. [Google Scholar] [CrossRef] [Green Version]
- Aklilu, N.; Abiy, A. Agricultural extension for enhancing productivity and poverty alleviation in small scale irrigation agriculture for sustainable development in Ethiopia. Afr. J. Agric. Res. 2016, 11, 171–183. [Google Scholar] [CrossRef] [Green Version]
- Kallenbach, C.M.; Wallenstein, M.D. Managing Agroecosystems for Soil Microbial Carbon Use Efficiency: Ecological Unknowns, Potential Outcomes, and a Path Forward. Front. Microbiol. 2019, 10, 1146. [Google Scholar] [CrossRef] [PubMed] [Green Version]
- Bunting, S.W.; Kundu, N. Evaluating the contribution of diversified shrimp-rice agroecosystems in Bangladesh and West Bengal, India to social-ecological resilience. Ocean Coast. Manag. 2017, 148, 63–74. [Google Scholar] [CrossRef]
- Niu, M.J. Evaluation and Optimization of China’s Agricultural Spatial Pattern from the Perspective of Ecological Civilization. Ph.D. Thesis, Chinese Academy of Agricultural Sciences, Beijing, China, 2016. (In Chinese). [Google Scholar]
- Zhang, R.T. Evaluation and spatial differentiation of agricultural modernization in the Yangtze River Delta. China Agric. Resour. Reg. Plan. 2015, 2, 113–119. (In Chinese) [Google Scholar]
- Wang, B.Y. Comprehensive Evaluation and systematic diagnosis of Agricultural Ecological Development in China. Financ. Sci. 2018, 8, 107–120. (In Chinese) [Google Scholar]
- Ding, X.H.; Wang, L.Y. Study on the efficiency of regional agricultural innovation system considering ecological environmental effects under the strategy of rural revitalization. Sci. Technol. Manag. Res. 2018, 38, 230–237. (In Chinese) [Google Scholar]
- Pang, J.X. Research on China’s Agricultural Ecological Efficiency. Ph.D. Thesis, Lanzhou University, Lanzhou, China, 2016. (In Chinese). [Google Scholar]
- Hu, W.W.; Yu, S. Spatial and temporal difference analysis of Agricultural ecological efficiency in Jiangsu Province based on DeA-Malmquist model. Water Soil Conserv. Bull. 2018, 38, 303–308. [Google Scholar]
- Liu, P.L.; Huang, C. Research on agricultural ecological efficiency in Anhui Province based on DEA-Malmquist model. J. Inn. Mong. Agric. Univ. Soc. Sci. Ed. 2019, 3, 60–67. (In Chinese) [Google Scholar]
- Brown, K.; Westaway, E. Agency, Capacity, and Resilience to Environmental Change: Lessons from Human Development, Well-Being, and Disasters. Soc. Sci. Electron. Publ. 2011, 36, 321–342. [Google Scholar] [CrossRef]
- Bhatasara, S. Understanding adaptation to climate variability in smallholder farming systems in eastern Zimbabwe: A sociological perspective. Rev. Agric. Food Environ. Stud. 2018, 25, 149–166. [Google Scholar] [CrossRef] [Green Version]
- Menenti, M.; Alfieri, S.M. Adaptation of Irrigated and Rainfed Agriculture to Climate Change: The Vulnerability of Production Systems and the Potential of Intraspecific Biodiversity (Case Studies in Italy). In Handbook of Climate Change Adaptation; Springer: Berlin/Heidelberg, Germany, 2013; ISBN 978-3-642-40455-9. [Google Scholar]
- Chen, M.J.; Bruno, W. Diversification and intensification of agricultural adaptation from global to local scales. PLoS ONE 2018, 13, e0196392. [Google Scholar] [CrossRef] [PubMed]
- Panda, A. Transformational adaptation of agricultural systems to climate change. Wiley Interdiscip. Rev. Clim. Change 2018, 9, e520. [Google Scholar] [CrossRef]
- Eakin, H.; York, A. Cognitive and institutional influences on farmers’ adaptive capacity: Insights into barriers and opportunities for transformative change in central Arizona. Reg. Environ. Change 2015, 16, 801–814. [Google Scholar] [CrossRef]
- Vervoort, J.M. Challenges to scenario-guided adaptive action on food security under climate change. Glob. Environ. Change 2014, 28, 383–394. [Google Scholar] [CrossRef] [Green Version]
- Steward, P.R.; Dougill, A.J. The adaptive capacity of maize-based conservation agriculture systems to climate stress in tropical and subtropical environments: A meta-regression of yields. Agric. Ecosyst. Environ. 2018, 251, 194–202. [Google Scholar] [CrossRef]
- Dogulu, N.; Kentel, E. Prioritization and selection of climate change adaptation measures: A review of the literature. In Proceedings of the 36th IAHR World Congress, At Den Haag, The Netherlands, 28 June–3 July 2015. [Google Scholar]
- John, S.T.; Margaret, N. Uptake of Knowledge and Technologies for Adaptation to Climate Change in Crop Production Systems in Uganda: A Review. Adv. Res. 2017, 11, 1–14. [Google Scholar]
- Kasturi, D. Climate Change Adaptation in the Framework of Regional Cooperation in South Asia. Carbon Clim. Law Rev. 2015, 1, 40–54. [Google Scholar]
- Adger, W.N. Institutional Adaptation to Environmental Risk under the Transition in Vietnam. Ann. Assoc. Am. Geogr. 2015, 90, 738–758. [Google Scholar] [CrossRef]
- Zhao, C.H.; Yang, X.Z. Research progress and Enlightenment of Adaptability at home and abroad. Yunnan Geogr. Environ. Res. 2019, 3, 65–76. (In Chinese) [Google Scholar]
- Su, F.; Mo, X.H. Research progress on the adaptability of social-ecological systems in tourist destinations. Geogr. Sci. 2020, 40, 280–288. (In Chinese) [Google Scholar]
- Li, B.; Shi, L.Y. Spatial and temporal differences in environmental adaptability of the sea economic system in the Bohai Rim Region and its influencing factors. Chin. J. Geogr. 2018, 73, 1121–1132. (In Chinese) [Google Scholar]
- Wu, J.L.; Zhou, C.S. Evaluation of Rural Tourism Adaptability and Influencing Factors of Traditional Village Farmers-Based on a Survey of 6 Villages in Xiangxi Prefecture. Geogr. Sci. 2018, 38, 755–763. (In Chinese) [Google Scholar]
- Shi, J.Y. Study on the Ecological Adaptability of Chongqing Rural Human Settlement Environment Planning. Ph.D. Thesis, Chongqing University, Chongqing, China, 2018. (In Chinese). [Google Scholar]
- Zhang, X.F.; Peng, J. Adaptation characteristics of Landscape Ecology in the Context of global change. Prog. Geogr. Sci. 2017, 36, 1167–1175. (In Chinese) [Google Scholar]
- Yin, S.; Chen, J. Research on the adaptability of farmers under drought stress-Based on the survey data of farmers in Minqin Oasis. Prog. Geogr. Sci. 2016, 35, 644–654. (In Chinese) [Google Scholar]
- He, Y.B.; Huang, X.J. Research on the adaptability of land-lost farmers in urban fringe areas under the background of rapid urbanization: Taking Xi’an as an example. Geogr. Res. 2017, 2, 226–240. (In Chinese) [Google Scholar]
- Xu, L. Environmental Adaptability and Productivity Control of the Agricultural System on the Longdong Loess Plateau. Ph.D. Thesis, Lanzhou University, Lanzhou, China, 2015. (In Chinese). [Google Scholar]
- Lu, C.Y.; Li, W.L. Research on the Comprehensive Measurement of the Coordinated Development of Regional Economy-Society-Resources-Environment-Taking Qingyang City, Gansu Province as an Example. Resour. Dev. Mark. 2017, 33, 916–921. (In Chinese) [Google Scholar]
- Liu, X.; Su, M.L. Construction and Application of Agricultural Modernization Evaluation Index System. Chin. Mark. 2016, 20, 84–85. (In Chinese) [Google Scholar]
- Tian, Y.; Zhang, J.B. Dynamics and Trend Evolution of Agricultural Carbon emission distribution in China—Based on panel data analysis of 31 provinces (municipalities, autonomous regions) from 2002 to 2011. China Popul. Resour. Environ. 2014, 24, 91–98. (In Chinese) [Google Scholar]
- Bai, T.J. Research on China’s Grey Water Footprint. Master’s Thesis, Liaoning Normal University, Dalian, China, 2018. (In Chinese). [Google Scholar]
- Lu, C.Y.; Meng, P. Assessing the Economic-Environmental Efficiency of Energy Consumption and Spatial Patterns in China. Sustainability 2019, 11, 591. [Google Scholar] [CrossRef] [Green Version]
- Tone, K. A slacks-based measure of super-efficiency in data envelopment analysis. Eur. J. Oper. Res. 2002, 143, 32–41. [Google Scholar] [CrossRef] [Green Version]
- Feng, Y.J.; Qi, Q. Temporal and spatial evolution and Driving Factors of Agro-ecological Efficiency in China. Water Soil Conserv. Bull. 2018, 38, 260–268. (In Chinese) [Google Scholar]
- Zheng, D.F.; Hao, S. Research on time-space differentiation of agricultural ecological efficiency evaluation based on DEA-ESDA. Geogr. Sci. 2018, 3, 419–427. (In Chinese) [Google Scholar]
- Hou, M.Y.; Yao, S.B. Temporal and Spatial Evolution and Trend Prediction of Agro-ecological Efficiency in China from 1978 to 2016. Acta Geoica Sin. 2015, 73, 2168–2183. (In Chinese) [Google Scholar]
- Yuan, C.G.; Liang, L.T. Analysis on the spatial difference of land economic density in industrial agglomeration areas in Henan Province. Reg. Res. Dev. 2019, 5, 25–29. (In Chinese) [Google Scholar]
- Gao, C.C.; Zhu, H.F. Dynamic evolution of regional economic spatial difference in Hunan Province based on spatial statistical analysis. Mapp. Spat. Geogr. Inf. 2019, 42, 46–51. (In Chinese) [Google Scholar]
- Zhang, H.J.; Zhao, W.F. Analysis of the temporal and spatial evolution of regional economic differences in Anhui Province based on GeoDa. J. Hunan Univ. Technol. 2019, 4, 66–72. (In Chinese) [Google Scholar]
- Fang, L.; Wang, X.Y. Evaluation and Spatiotemporal evolution of Agro-economic System in Guanzhong. Financ. Econ. Theory Res. 2019, 3, 60–67. (In Chinese) [Google Scholar]
- Shen, W. Research on the Spatial and temporal pattern and Influencing factors of urban ecological carrying Capacity in city clusters in the middle Reaches of the Yangtze River. Master’s Thesis, Henan University, Kaifeng, China, 2018. (In Chinese). [Google Scholar]
- Feng, H. Comprehensive Evaluation and Spatial Dynamic Analysis of the Carrying Capacity of Resources and Environment in Chongqing at the County Scale. Master’s Thesis, Southwest University, Chongqi, China, 2017. (In Chinese). [Google Scholar]
- Akbar, U.; Li, Q.L.; Akmal, M.A.; Shakib, M.; Iqbal, W. Nexus between agro-ecological efficiency and carbon emission transfer: Evidence from China. Environ. Sci. Pollut. Res. Int. 2021, 28, 18995–19007. [Google Scholar] [CrossRef]
- Zheng, D.F.; Hao, S.; Sun, C.Z. Evaluation of Agricultural Ecological Efficiency and Its Spatial-temporal Differentiation Based on DEA-ESDA. Sci. Geogr. Sin. 2018, 38, 419–427. (In Chinese) [Google Scholar]
- Wu, Z.H.; Lei, L. Study on Agricultural Land Ecological Efficiency Based on Three-Phase DEA Model: Taking Henan Province as an Example. Ecol. Econ. 2018, 34, 76–80. (In Chinese) [Google Scholar]
- Bagheri, P.; Abedi, S.; Sarajug, F.B. Environmental Efficiency in Agricultural Sector. In The Economics of Agriculture and Natural Resources, 1st ed.; Rashidghalam, M., Ed.; Springer: Singapore, 2020; pp. 183–201. [Google Scholar]
- Nsiah, C.; Fayissa, B. Trends in agricultural production efficiency and their implications on food security in Sub-Saharan African countries. Afr. Dev. Rev. 2019, 31, 28–42. [Google Scholar] [CrossRef] [Green Version]
- Linh, L.T.; Lee, P.; Chung, P.K.; Rebecca, H.C. Evaluation of total factor productivity and environmental efficiency of agriculture in nine East Asian countries. Agric. Econ. 2019, 65, 249–258. [Google Scholar] [CrossRef]
- Anik, A.R.; Rahman, S.; Sarker, J.R. Agricultural Productivity Growth and the Role of Capital in South Asia (1980–2013). Sustainability 2017, 9, 470. [Google Scholar] [CrossRef] [Green Version]
Figure 1.
Distribution map of environmental adaptability efficiency within China’s agricultural systems.
Figure 1.
Distribution map of environmental adaptability efficiency within China’s agricultural systems.

Figure 2.
Spatial evolution of coldspots and hotspots of environmental adaptability efficiency within China’s agricultural systems.
Figure 2.
Spatial evolution of coldspots and hotspots of environmental adaptability efficiency within China’s agricultural systems.


Table 1.
Indicator system used for assessing environmental adaptability efficiency within China’s agricultural systems.
Table 1.
Indicator system used for assessing environmental adaptability efficiency within China’s agricultural systems.
| The Target Layer | The Standard Layer | The Index Layer | Unit | |
|---|---|---|---|---|
| Environmental adaptation efficiency within China’s agricultural systems | Input indicators | Total area of cultivated land | hm2 | |
| Agricultural practitioner | number of people | |||
| The amount of fertilizer applied | ton | |||
| The amount of pesticide applied | ton | |||
| The quantity of plastic film used | ton | |||
| Effective irrigation area | hm2 | |||
| Total power of agricultural machinery | kW | |||
| Output indicators | Agricultural economic system | Utilization rate of cultivated land | % | |
| Agricultural labor productivity | China Yuan/number of people | |||
| Farmland productivity | China Yuan/hm2 | |||
| Agricultural social system | Engel’s coefficient for rural residents | % | ||
| Per capita income of farmers | China Yuan | |||
| Ratio of working population in agriculture | % | |||
| Agricultural environmental system | Carbon dioxide emission intensity in agriculture | ton/China Yuan | ||
| Soil erosion rate | % | |||
| Grey water footprint in agriculture | m3 | |||
Table 2.
Environmental adaptability efficiency within China’s agricultural systems.
| Province | 2000 | 2005 | 2010 | 2015 | 2018 | AVG |
|---|---|---|---|---|---|---|
| Beijing | 1.00 | 1.00 | 1.00 | 1.00 | 1.00 | 1.00 |
| Tianjin | 0.56 | 0.70 | 0.89 | 0.99 | 0.98 | 0.83 |
| Hebei | 0.51 | 0.69 | 0.85 | 0.92 | 0.96 | 0.77 |
| Shanxi | 0.31 | 0.43 | 0.55 | 0.78 | 0.80 | 0.56 |
| Inner Mongolia | 0.53 | 0.75 | 0.85 | 0.93 | 0.97 | 0.80 |
| Liaoning | 0.51 | 0.73 | 0.79 | 0.86 | 0.96 | 0.75 |
| Jilin | 0.50 | 0.61 | 0.72 | 0.82 | 0.92 | 0.71 |
| Heilongjiang | 0.49 | 0.60 | 0.67 | 0.79 | 0.90 | 0.68 |
| Shanghai | 0.81 | 0.98 | 1.00 | 1.00 | 1.00 | 0.97 |
| Jiangsu | 0.54 | 0.74 | 0.80 | 0.93 | 0.95 | 0.79 |
| Zhejiang | 0.60 | 0.77 | 0.89 | 1.00 | 1.00 | 0.86 |
| Anhui | 0.57 | 0.78 | 0.84 | 0.95 | 0.99 | 0.83 |
| Fujian | 0.64 | 0.67 | 0.89 | 1.00 | 1.00 | 0.86 |
| Jiangxi | 0.43 | 0.67 | 0.77 | 0.87 | 0.94 | 0.73 |
| Shandong | 0.77 | 0.93 | 1.00 | 1.00 | 1.00 | 0.95 |
| Henan | 0.66 | 0.86 | 0.86 | 0.94 | 0.98 | 0.86 |
| Hubei | 0.60 | 0.73 | 0.89 | 1.00 | 1.00 | 0.85 |
| Hunan | 0.65 | 0.81 | 0.92 | 0.96 | 0.98 | 0.85 |
| Guangdong | 1.00 | 1.00 | 1.00 | 1.00 | 1.00 | 1.00 |
| Guangxi | 0.40 | 0.58 | 0.78 | 0.88 | 0.94 | 0.71 |
| Hainan | 0.82 | 1.00 | 1.00 | 1.00 | 1.00 | 0.98 |
| Chongqing | 0.37 | 0.54 | 0.62 | 0.76 | 0.79 | 0.62 |
| Sichuan | 0.38 | 0.57 | 0.65 | 0.78 | 0.80 | 0.64 |
| Guizhou | 0.35 | 0.53 | 0.64 | 0.75 | 0.78 | 0.61 |
| Yunnan | 0.36 | 0.48 | 0.66 | 0.79 | 0.79 | 0.61 |
| Shannxi | 0.44 | 0.54 | 0.63 | 0.79 | 0.89 | 0.63 |
| Gansu | 0.31 | 0.40 | 0.47 | 0.59 | 0.68 | 0.47 |
| Qinghai | 0.40 | 0.57 | 0.71 | 0.79 | 0.85 | 0.67 |
| Ningxia | 0.41 | 0.52 | 0.62 | 0.75 | 0.81 | 0.60 |
| Xinjiang | 0.35 | 0.51 | 0.64 | 0.71 | 0.79 | 0.60 |
| AVG | 0.54 | 0.69 | 0.79 | 0.88 | 0.92 | 0.76 |
Table 3.
Ranking of China’s agricultural systems according to the degree of environmental adaptability efficiency.
Table 3.
Ranking of China’s agricultural systems according to the degree of environmental adaptability efficiency.
| Rank | Low-Level | Medium-Level | Medium to High-Level | High-Level | DEA’s Level of Effectiveness |
|---|---|---|---|---|---|
| Efficiency range | (0, 0.4] | (0.4, 0.6] | (0.6, 0.8] | (0.8, 1) | 1 |
Table 4.
Global Moran’s I Index of environmental adaptability efficiency within China’s agricultural systems.
Table 4.
Global Moran’s I Index of environmental adaptability efficiency within China’s agricultural systems.
| Year | Moran’s I | Z | P |
|---|---|---|---|
| 2000 | 0.156 | 2.592 | 0.010 |
| 2001 | 0.223 | 3.462 | 0.001 |
| 2002 | 0.265 | 3.995 | 0.000 |
| 2003 | 0.302 | 4.416 | 0.000 |
| 2004 | 0.222 | 3.358 | 0.001 |
| 2005 | 0.225 | 3.380 | 0.001 |
| 2006 | 0.344 | 4.946 | 0.000 |
| 2007 | 0.312 | 4.514 | 0.000 |
| 2008 | 0.313 | 4.511 | 0.000 |
| 2009 | 0.317 | 4.549 | 0.000 |
| 2010 | 0.333 | 4.731 | 0.000 |
| 2011 | 0.322 | 4.594 | 0.000 |
| 2012 | 0.362 | 5.097 | 0.000 |
| 2013 | 0.314 | 4.480 | 0.000 |
| 2014 | 0.322 | 4.595 | 0.000 |
| 2015 | 0.370 | 5.209 | 0.000 |
| 2016 | 0.405 | 5.668 | 0.000 |
| 2017 | 0.397 | 5.544 | 0.000 |
| 2018 | 0.376 | 5.297 | 0.000 |
Publisher’s Note: MDPI stays neutral with regard to jurisdictional claims in published maps and institutional affiliations. |
© 2022 by the authors. Licensee MDPI, Basel, Switzerland. This article is an open access article distributed under the terms and conditions of the Creative Commons Attribution (CC BY) license (https://creativecommons.org/licenses/by/4.0/).
Share and Cite
MDPI and ACS Style
Tang, X.; Lu, C.; Meng, P.; Cheng, W. Spatiotemporal Evolution of the Environmental Adaptability Efficiency of the Agricultural System in China. Sustainability 2022, 14, 3685. https://doi.org/10.3390/su14063685
AMA Style
Tang X, Lu C, Meng P, Cheng W. Spatiotemporal Evolution of the Environmental Adaptability Efficiency of the Agricultural System in China. Sustainability. 2022; 14(6):3685. https://doi.org/10.3390/su14063685
Chicago/Turabian StyleTang, Xianglong, Chenyu Lu, Peng Meng, and Wei Cheng. 2022. "Spatiotemporal Evolution of the Environmental Adaptability Efficiency of the Agricultural System in China" Sustainability 14, no. 6: 3685. https://doi.org/10.3390/su14063685
Note that from the first issue of 2016, this journal uses article numbers instead of page numbers. See further details here.