Article

Temporal and Spatial Analysis of Coastal Water Quality to Support Application of Whiteleg Shrimp Litopenaeus vannamei Intensive Pond Technology

1
Research Institute for Coastal Aquaculture and Fisheries Extension, Maros 90512, South Sulawesi, Indonesia
2
Department of Chemical Engineering, Fajar University, Makassar 90231, South Sulawesi, Indonesia
3
Fishery Faculty, Cokroaminoto University of Makassar, Makassar 90245, South Sulawesi, Indonesia
*
Author to whom correspondence should be addressed.
Sustainability 2022, 14(5), 2659; https://doi.org/10.3390/su14052659
Submission received: 29 December 2021 / Revised: 31 January 2022 / Accepted: 22 February 2022 / Published: 24 February 2022

Abstract

:
The study aimed to determine the performance of whiteleg shrimp culture in relation to temporal and spatial aspects and characteristics and water quality status. Measurement and sampling of water were carried out before stocking/initial stocking of culture whiteleg shrimp (rainy season) and end of culture/after harvesting of whiteleg shrimp (dry season) at two locations in the coastal area of Bulukumba Regency, namely Bonto Bahari Subdistrict (BB) and Gantarang Subdistrict (GT), and one location as a control, namely in the coastal area of Ujung Loe Subdistrict. Variables measured and analyzed included temperature, salinity, pH, dissolved oxygen, nitrate, nitrite, ammonia, phosphate, total suspended solids, and total organic matter. Data were analyzed by descriptive statistics, multivariate statistics, and non-parametric statistics. Water quality status was determined using the Storet (Storage and Retrieval) method. The results showed that the culture of whiteleg shrimp was technology intensive with a stocking density of 110–220 ind/m2 with productivity between 13.9 and 44.4 tons/ha/cycle. The predicted waste load of N is 28.00 tons/cycle and P reaches 6.61 tons/cycle. Another result was that changes in water quality status during the rainy season were classified as moderately polluted at the BB location and complying with quality standards at the GT location. In the dry season, both locations were categorized as heavily polluted. Variables of water quality that caused the decrease in water quality status in both locations (BB and GT) were observed to increase salinity, nitrate concentration, and ammonia concentration and decreased dissolved oxygen concentration in the dry season. It is recommended to carry out proper feed management, use of probiotics, and increase the capacity and capability of wastewater treatment plants to reduce ammonia and nitrate concentrations in water in coastal areas. It is necessary to determine a more precise time for whiteleg shrimp stocking by reducing the possibility that whiteleg shrimp culture will still occur at the dry season’s peak.

1. Introduction

Coastal areas, seas, and small islands have strategic significance in building the nation and the welfare of the people in Indonesia, which is an archipelagic country. This is due to the enormous wealth of natural resources, both biological and non-biological. The coastal area is dynamic, unique, and vulnerable to environmental changes [1,2,3]. Various human activities on land and sea encourage environmental changes in coastal areas [4,5,6,7].
Commodities that are the mainstay for culture in ponds include shrimp, both tiger shrimp (Penaeus monodon) and whiteleg shrimp (Litopenaeus vannamei). Whiteleg shrimp is still a strategic support for achieving the national shrimp production target. Whiteleg shrimp culture technology in ponds consists of traditional, traditional plus, semi-intensive, intensive, and super-intensive [8,9,10,11]. Intensification of whiteleg shrimp culture uses more efficient land and higher productivity [9,10,12,13,14] and reduces land use costs by more than 90%/kg shrimp [12]. Higher culture technology results in higher production and more efficient energy use, namely energy costs that are 74–89% lower than lower culture technology operations [15]. Efforts to produce more shrimp in shrimp culture with intensive technology, pond farmers can increase production to meet the needs of shrimp demand without putting pressure and burden on the contribution of waste to natural resources [13,16]. On the other hand, the intensification of whiteleg shrimp culture ponds can negatively impact polluting waste in the aquatic environment in coastal areas [9,12,17,18,19]. Waste from whiteleg shrimp ponds can come from shrimp feed and feces. Less optimal use of feed or excessive feeding will lead to the accumulation of organic matter [14,20,21,22]. Feeds from intensive technology have been a significant source of waste in aquaculture systems [23,24]. High concentrations of nutrient waste discharged from shrimp ponds can cause eutrophication in coastal areas receiving waste [10,11,17]. Whiteleg shrimp feces contain dry matter, crude protein, total amino acids [25], dissolved organic matter, and particulate organic matter [26,27], which can also become waste in coastal areas.
In addition to whiteleg shrimp culture waste, which can affect water quality in coastal areas, seasons can also influence water quality characteristics. Different seasons can impact different water quality characteristics and status [12,28,29]. Water quality is a term that describes the suitability or suitability of water for a particular use or for sustaining various uses or processes [30,31,32]. Water quality status is the condition of water quality that shows that it is polluted or unpolluted in a water source within a particular time.
Determination of water quality status is one of the first steps in monitoring and preventing water quality degradation [33,34,35]. This determination will support sustainable development goals (SDGs), mainly target 14.1, which is to prevent and significantly reduce all types of pollution of marine and coastal areas, particularly from land-based activities, including marine debris and nutrient pollution. The target set by the United Nations is expected to be realized in 2025.
Bulukumba Regency, South Sulawesi Province, Indonesia, is one of the centers for whiteleg shrimp. Ponds in Bulukumba Regency cover an area of ±3875 ha. Ponds in Bulukumba Regency are managed with three levels of technology, namely traditional, semi-intensive, and intensive technologies. Intensive technology whiteleg shrimp culture ponds in Bulukumba Regency are found in three subdistricts, Bonto Bahari, Ujung Bulu, and Gantarang, but are dominantly found in Bonto Bahari (BB) and Gantarang (GT) subdistricts.
Two methods commonly used in determining the water quality status in Indonesia are the Storage and Retrieval (Storet) method and the Pollution Index (IP) [30]. These two methods have been widely applied in determining water quality status due to activities that can generate waste but have not been used in intensive technology whiteleg shrimp farming activities. Previous research in the coastal area of Lampung Bay, Lampung Province, Indonesia [36], concluded that the Storet method is more accurate, logical, and effective than the IP method in determining water quality status [36,37]. Determining the status of water quality based on water quality characteristics will provide initial information about water quality in coastal areas receiving intensive shrimp culture waste for the sustainability of the functions of the coastal areas of the sea. In the Flores Sea, the Taka Bonerate National Park was designated a UNESCO Biosphere Reserve in 2015 [38,39,40]. Taka Bonerate National Park, which is located in the Selayar Islands Regency, South Sulawesi Province, has an area of 530,765 ha, which has an atoll area of 220,000 ha, which is the largest atoll or coral reef in Indonesia and Southeast Asia and the third largest in the world after Kwajalein Atoll (Marshall Islands) and Suvadiva Atoll (Maldive Islands) [41]. In areas where there are very dense activities around the atoll, negative impacts can be received by pollution, nutrient enrichment, changes in construction in the field (dredging for boat access, filling for housing construction, sand mining, and others), and exploitation of enormous resources [38,39,40]. This condition emphasizes the importance of information on the characteristics and status of water quality both temporally (different seasons) and spatially (different places) so that shrimp production in ponds and the condition of coastal ecosystems can be improved and sustainable [5,42].
The research we conducted aimed to determine the performance of whiteleg shrimp culture concerning water quality characteristics and the water quality status in the coastal areas of aquaculture ponds at different times and places in the coastal area of Bulukumba Regency, especially in two locations, namely BB and GT [5,30,42,43]. This study pays excellent attention to the development of whiteleg shrimp aquaculture in coastal areas widespread in Indonesia. The model applies intensive technology based on natural regulation and control of water characteristics, quality and spatial, and efforts to reduce the burden of waste on the coastal environment. It is hoped that the quality of the aquatic environment will remain under control to create sustainable shrimp farming with an environmentally friendly concept by relying on natural conditions. The results of this study are expected to contribute important information for environmental protection and management of coastal areas so that the environment remains of sustainable quality.

2. Materials and Methods

2.1. Research Site and Time

The method used in this research is a survey method. The survey was carried out from 28 May to 5 June 2021 (before stocking/initial stocking of the culture of whiteleg shrimp coincides with the rainy season) and from 28 August to 6 September 2021 (end of culture/after harvesting of whiteleg shrimp coincides with the dry season) which was carried out in the coastal areas of Bonto Bahari (BB) and Gantarang (GT) subdistricts. Whiteleg shrimp culture by applying intensive pond technology. As a control location, the coastal area of Ujung Loe (UL) Subdistrict is located between the BB and GT (Figure 1). A total of 12 transects perpendicular to the coastline and 3 transects parallel to the coastline, or 36 points of water sampling stations, were determined in the field for BB (Figure 2) and GT (Figure 3). While at the control location (UL), 6 transects perpendicular to the coastline and 3 transects parallel to the coastline were determined, or 18 points of water sampling stations in the field (Figure 4). The distance between transects parallel to the coastline was about 125, 350, and 675 m from the coastline in BB, GT, and UL. The distance between transects perpendicular to the coastline was about 375, 600, and 800 m in BB, GT, and UL, respectively. The transect of BB and GT is located in a coastal area where intensive technology whiteleg shrimp ponds are located on the mainland. The position of the station points is known by using the Global Positioning System (GPS).

2.2. Data Collection

The data were collected in the form of primary data and secondary data. Primary data collection during the first survey was carried out in the rainy season and primary data collection during the second survey was carried out in the dry season. Water quality variables that were measured and analyzed were following Ministry of Environment (ME) Guidelines No. 51 of 2004, concerning Seawater Quality Standards for Marine Biota [44], and Minister of Marine Affairs and Fisheries (MMAF) Regulation No. 75/Permen-KP/2016, concerning General Guidelines for Grow-out of Tiger Shrimp (Penaeus monodon) and Whiteleg Shrimp (Litopenaeus vannamei) [45]. Water quality variables measured directly in the field were temperature, salinity, pH, and dissolved oxygen with YSI Pro Plus, which was carried out between 08:30 and 12:00 Central Indonesia Time. Another variable was taking water samples using the Kemmerer Water Sampler. At each sampling point, water samples were taken at one point. Water samples were taken at two depths: surface (approximately 0.2 × water depth) and bottom (approximately 0.8 × water depth). Water samples from both depths were composited to represent a single point. The water samples were preserved following the instructions APHA-AWWA-WEF (2012) [46]. The water sample was then brought to the laboratory for analysis. Other primary data in whiteleg shrimp culture management were obtained through interviews with whiteleg shrimp culture managers and structured observations in ponds using a questionnaire.
Secondary data from monthly rainfall data from the last five years (2016–2020) in BB and GT subdistricts were obtained from the Maros Class I Climatology Station in Maros Regency, South Sulawesi Province. Rainfall data at the BB location was from the station located in Bonto Bahari, while the rainfall data at the GT location was from the station in Bonto Macinna.

2.3. Sample Analysis

Analysis of water quality variables consisting of ammonia, nitrate, nitrite, phosphate, total suspended solids, and total organic matter was carried out at the Water Laboratory of the Research Institute for Coastal Aquaculture and Fisheries Extension (RICAFE) in Maros Regency, South Sulawesi Province. Ammonia was analyzed by the phenate method. Nitrate was analyzed by the sodium reduction method. Nitrite was analyzed by the colorimetric method. Phosphate was analyzed by the ascorbic acid method. Total suspended solids were analyzed by the gravimetric method. Total organic matter was analyzed by the titrimetric method following the guidelines of APHA-AWWA-WEF (2012) [46].

2.4. Data Analysis

Estimates of the effluent load from intensive technology whiteleg shrimp ponds were determined based on the guidelines of Teichert-Coddington et al. (1991) [47]. Rainfall data were analyzed to determine the number of dry months (rainfall <60 mm/month) according to the instructions of Schmidt and Ferguson (1951) [48]. The same rainfall data were also used to determine the Q value as the basis for determining climate type, following the instructions for determining the climate classification according to Schmidt and Ferguson (1951) [48]. These rainfall data analysis results were also used to determine the time of measurement and sampling of water in the field.
Nonparametric statistics, namely the Mann–Whitney Test, were used to determine the difference between each water quality variable at different times and places. Before the nonparametric statistical test, the data normality test was performed using the Shapiro–Wilk Test [49]. The significance level was set at 5 and 10% or p < 0.10. Pearson correlation was used to measure the strength and direction of the linear relationship of two water quality variables. The Mann–Whitney Test and the Shapiro–Wilk Test were carried out with the help of the International Business Machines (IBM) Statistical Package for the Social Sciences (SPSS) program, Statistics Version 25.
Data analysis with descriptive statistics was carried out to determine the minimum, maximum, average, and standard deviation values of the data for each water quality variable. The results of the analysis were evaluated by comparing the quality standards of seawater standards based on the ME Decree concerning Seawater Quality Standards for Marine Biota [30] and the MMAF Regulations concerning General Guidelines for Grow-out Tiger Shrimp (Penaeus monodon) and Whiteleg Shrimp (Litopenaeus vannamei) [45]. Water quality status was determined using the Storet method developed by the United States Environmental Protection Agency (US-EPA) (2002) [43]. Score determination is based on the number of samples and physical and chemical variables. Water quality status is classified into four classes: (1) class A: very good, score = 0: complying quality standards; (2) class B: good, score = −1 to −10: lightly polluted; (3) class C: moderate, score = −11 to −30: moderately polluted; and (4) class D: poor, score < −31: heavily polluted [50]. The water quality status is compared between different times and places.

3. Results

3.1. Whiteleg Shrimp Culture Performance

Intensive technology whiteleg shrimp culture in ponds of Bulukumba Regency is mostly carried out in two subdistricts: BB and GT. In BB, there are five intensive technology whiteleg shrimp farming businesses, but only three of them were operational at the time of the research (Table 1). All ponds are constructed with High-Density Polyethylene (HDPE). The pond area varies from 1600 to 4000 m2, with a total of 78 ponds. According to the level of technology applied, namely intensive technology, the stocking density varied from 110 to 150 ind/m2 in BB. In GT, there are three intensive technology whiteleg shrimp farming businesses. Like the ponds in BB, the intensive technology whiteleg shrimp ponds in GT are also constructed with HDPE. The ponds area is relatively the same as in the BB, which is from 1900 to 4500 m2. According to the technology applied, namely intensive technology whiteleg shrimp culture, the stocking density applied ranges from 100 to 220 ind/m2 in GT. Pond productivity can reach 44.4 tons/ha/cycle in BB and 30.0 tons/ha/cycle in GT. The feed conversion ratio (FCR) ranged between 1.2:1 and 1.7:1.
Based on the data obtained from each intensive technology whiteleg shrimp farming business in Bulukumba Regency, the production potential of whiteleg shrimp can be determined in the data (Table 2). Potential production can reach 1615 tons/year (1 year = 2 cycles) on a total pond area of ±37.00 ha in BB and ±1578 tons/year (1 year = 2 cycles) on a total pond area of ±32.60 ha in GT. It is estimated that the total N waste load reaches ±28.33 tons/year and P reaches ±6.69 tons/year, which is wasted into the coastal area of the culture location in BB and ±27.68 tons/year N and ±6.53 tons/year P is wasted into the coastal area of GT.
Each whiteleg shrimp pond in Bulukumba Regency has a Wastewater Treatment Plant (WWTP) pond with an area ranging from ±0.15 to ±1.50 ha. The calculation results show that the WWTP pond area only ranges from 3.42 to 15.84% of the total pond area or also ranges from 3.42 to 15.84% of the total pond volume because, in general, the water level is high in the grow-out pond and is relatively the same as the water level in the WWTP pond.

3.2. Water Quality Characteristics

The water quality in the coastal areas of BB and GT locations, both in the rainy and dry seasons, is shown in the data (Table 3 and Table 4), respectively. The difference in water quality between the coastal areas of the BB and GT locations as well as UL locations (control) in the rainy seasons are presented in the data (Table 5 and Table 6), respectively.
The results of statistical analysis showed that the water temperature was significantly different (p < 0.01) between the rainy and dry seasons with lower water temperatures in the dry season in BB (Table 3). The water temperature in the coastal area of GT in the rainy season is on average 28.84 °C, and in the dry season, the average is 28.43 °C. As a comparison, the results of the statistical analysis also showed that the water temperature was very significantly different (p < 0.01) between the rainy and dry seasons, with the water temperature also being lower in the dry season in GT (Table 4). In the rainy and dry seasons, the water temperature in the coastal areas of BT and GT is relatively the same as the water temperature in the coastal areas of UL, which is the control location (Table 5 and Table 6). In addition, there is a trend of relatively higher water salinity on transects close to the coastline (transect A) than transects farther from the coastline (transects B and C), both in BB and GT during the rainy and dry seasons (Table 7 and Table 8).
The average water salinity in the coastal areas of BB is 33.870 ppt in the rainy season and an average of 38.493 ppt in the dry season. The results of statistical analysis showed that the water salinity was very significantly different (p < 0.01) between the rainy and dry seasons with higher water salinity in the dry season in BB (Table 3). Water salinity in the coastal area of GT in the rainy season is around an average of 33.566 ppt and an average of 36.404 ppt in the dry season. The results of the statistical analysis also showed that the water salinity was very significantly different (p < 0.01) between the rainy and dry seasons with higher water salinity in the dry season in GT (Table 4). In the rainy season, the water salinity in the coastal areas of BB and GT is relatively the same as the water salinity in the coastal areas of UL, but in the dry season, the water salinity of UL is between the salinity of BB and GT (Table 5 and Table 6). One of the causes of differences in salinity in different seasons is the difference in rainfall. Monthly rainfall in BB and GT is presented in Figure 5. From Figure 5, it can be seen that the peak of the rainy season in Bulukumba Regency occurs in May and June, while the peak of the dry season occurs in August and September. In Table 7, it can be seen that there is a tendency for lower water salinity on transect A than transect B and C, both in BB and GT in different seasons.
The pH of water in the coastal areas of BB and GT was higher and significantly different (p < 0.05) in the rainy season compared to the dry season (Table 3 and Table 4). Comparative data in the coastal area of UL found that the water pH is 8.404 ± 0.057 in the rainy season and 8.232 ± 0.280 in the dry season (Table 5 and Table 6). The pH value of water is positively correlated with dissolved oxygen concentration [51,52]. This pH can also be seen in this study, which shows that water also shows low dissolved oxygen concentrations (Table 3 and Table 4).
The concentration of nitrate in the coastal areas of BB and GT in the dry season increased very drastically. It was very significantly different (p < 0.01) with the concentration of nitrate in the rainy season (Table 3 and Table 4). The average nitrate concentrations in the coastal areas of BB and GT are 0.00010 and 0.00031 mg/L, respectively, in the rainy season and increase to 0.13966 and 0.27675 mg/L, respectively, in the dry season, or an increase of more than 800 times.
The complexity of water quality variables in intensive technology whiteleg shrimp ponds is known as an N compound other than nitrate. These compounds arise from the N cycle process, with some of the main ingredients being shrimp feed residues and shrimp feces [53,54,55]. Table 5 and Table 6 show that the ammonia concentration is higher in the dry season when compared to the rainy season in the coastal areas of BB and GT. The primary source of ammonia compounds in shrimp farming systems comes from supplementary feed and direct excretion of cultured aquatic organisms. The ammonia concentration in the pond system will be directly proportional to the amount of feed entering [56]. There is a tendency to decrease the concentration of ammonia and nitrate on transects farther from the coastline (Table 7).
Unlike the forms of N compounds, namely ammonia and nitrate, which increase in the dry season, another form of N, nitrite, occurs. On the contrary, the concentration decreases during the dry season in the coastal area of the Bulukumba Regency. Nitrite is usually found in tiny amounts because it is unstable in dissolved oxygen. This condition is found in the coastal area of Bulukumba Regency with low nitrite concentrations when nitrate and ammonia concentrations are high. A nitrite is an intermediate form between ammonia and nitrate (nitrification) and between nitrate and N gas (denitrification) [7,55,57]. The low concentration of nitrite in the coastal area of Bulukumba Regency can support it as a source of water for whiteleg shrimp culture. The recommended nitrite concentration for whiteleg shrimp culture is lower than 1 mg/L [45].
Generally, P is not toxic to humans, animals, and fish/shrimp. However, excessive P accompanied by the presence of N can stimulate the explosion of algae populations in the waters. The phosphate concentration found in the coastal area of BB was lower in the dry season and was very significantly different (p < 0.01) from the rainy season. The same thing was also found in the coastal area of GT. Namely, the phosphate concentration was lower in the dry season than the rainy season, although not significantly different (p > 0.01).
Total suspended solids and total organic matter can be used as references in determining the level of pollution that occurs [17,58]. Total suspended solids and total organic matter decreased and were significantly different (p < 0.01) in the dry season compared to the rainy season (Table 3 and Table 4). Total suspended solids and total organic matter in the coastal area of BB are low. The statistical analysis results show a very significant difference (p < 0.01) with the concentration of total suspended solids and total organic matter in the coastal area of GT (Table 5 and Table 6).

3.3. Water Quality Status

Analysis of determining the status of water quality was performed using the Storet method. The result shows that the water quality in the coastal area of BB is categorized as Class C or moderate or moderately polluted in the rainy season with a total score of −16, and the status changes to Class D or poor or heavily polluted. The dry season had a total score of −44 (Table 9 and Figure 6). The only variable that causes the water quality status to be classified as moderately polluted during the rainy season is the pH of the water, which exceeds 8.5. In the dry season, the water quality status becomes heavily polluted in the coastal areas of BB as a result of salinity exceeding 34 ppt, dissolved oxygen concentration lower than 5.0 mg/L, and nitrate concentration exceeding 0.008 mg/L.
The water quality status in the coastal area of GT is classified as Class A or very good or complying with quality standards with a total score of 0 in the rainy season and turns into heavily polluted with total score of −56 in the dry season (Table 10 and Figure 6). The variables that cause a decrease in water quality status in the coastal area of GT during the dry season are salinity that exceeds 34 ppt, dissolved oxygen concentration lower than 5.0 mg/L, ammonia concentration that exceeds 0.3 mg/L, and nitrate concentration which exceeds 0.008 mg/L.
Based on Figure 6 above, by applying the Storet method and relatively the same water quality variables (temperature, salinity, pH, dissolved oxygen, ammonia, nitrate, nitrite, and phosphate), data were obtained at BB and GT locations. This condition is similar to the coastal area of shrimp farming in Bangkalan Regency, East Java Province. It is reported that water quality status is in the moderately polluted category (total score −23) and heavily polluted (total score −36), which is thought to be one of the causes of whiteleg shrimp pond waste without going through WWTP [37].

4. Discussion

4.1. Whiteleg Shrimp Culture Performance

The productivity of whiteleg shrimp ponds reaches 17.5–44.4 tons/ha/cycle at a stocking density of 110–150 ind/m2 in BB and 13.9–30.0 tons/ha/cycle at a stocking density of 100–220 ind/m2 in GT. At a stocking density of 133 ind/m2, also classified as intensive technology, a 17.1 tons/ha/cycle production can be obtained [59]. The high stocking density in intensive technology whiteleg shrimp culture, such as in Bulukumba Regency, has consequences on the waste load that can affect the feasibility of shrimp habitat and the aquatic environment in coastal areas around shrimp farming. Shrimp culture technology should not only focus on increasing productivity and product quality but should also be able to reduce negative social and environmental impacts [19,60]. Waste originating from intensive ponds consists of feed that is wasted during culture and feed that is not digested by shrimp that is wasted through feces and excretion of shrimp during rearing. Aquaculture business is a significant contributor to the increase in waste and toxic compounds in the form of ammonia as the primary nitrogen waste [19,61]. About 20–30% of the total N and P content in the feed will be wasted in the aquatic environment [62]. For nutrient waste load from whiteleg shrimp feed in ponds measuring 2500 m2 with a stocking density of 150 ind/m2, the total N was 13.84 g/kg shrimp and P reached 8.09 g/kg shrimp [63]. The amount of feed wasted into the environment from intensive/super-intensive whiteleg shrimp ponds was 24.32% of the total feed used [64]. It is estimated that about 572 tons/year of feed is wasted in the coastal environment of BB. About 537 tons/year is wasted in the environment in the coastal area of GT.
The WWTP pond in the BB pond has a different construction from the WWTP pond in GT. The WWTP pond dyke in BB is lined with HDPE or made of concrete, but the base of the pond is not constructed of concrete or is not lined with HDPE or lined with HDPE with holes, allowing infiltration of pond effluent into the ground. BB’s intensive technology whiteleg shrimp pond soil is classified as Typic Hapludalfs soil subgroup and classified as Mediterranean or Alfisol soil great group. Mediterranean soils develop from limestone parent material with low organic matter concentrations, moderate to high base saturation, heavy texture with a lumpy soil structure, and soil reactions from slightly acidic to slightly alkaline [65,66]. Mediterranean soils have clay deposits on the horizon known as argillic horizons. Clay buried in the lower horizon comes from above, washed down with percolation water movements [66,67]. Thus, this relatively dense argillic horizon causes the percolation rate to be hampered. The soil is quickly saturated with water and is easily eroded [67,68]. It is suspected that the waste liquid from intensive technology whiteleg shrimp ponds with WWTP pond as applied in BB is eventually discharged into BB’s coastal area through the water flow. Waste is wasted on the coast because the wastewater cannot penetrate the argillic horizon. However, a particular study is needed on the construction of the WWTP pond to see its ability as an efficient and effective intensive whiteleg shrimp WWTP pond in more detail.

4.2. Water Quality Characteristics

Water quality is a measure of the condition of water in terms of its physical, chemical, and biological characteristics. Water quality for aquaculture also shows a measure of water conditions relative to the needs of biota. Water quality is often a standard measure of the health condition of aquatic ecosystems [61,69,70]. In general, the temperature of sea waters in Indonesia has a fairly wide range. Characteristics of different temperatures can be caused by topography or water depth associated with differences in sunlight penetration. The water temperature for marine biota and intensive technology whiteleg shrimp culture ranges from 28 to 30 °C [44,45].
Water temperature is influenced by season, latitude, altitude above sea level, time of day, air circulation, cloud cover, and the flow and depth of water bodies [71]. A sudden change in the current pattern can also lower the water temperature [72]. The water temperature in the coastal area of BB is 28.59 ± 0.18 °C in the rainy season and 28.14 ± 0.22 °C in the dry season. Water temperature in coastal areas is higher in the rainy season (June–September) than in the dry season (December–March) in Bangkok and Samut Prakam, Thailand [28]. Other data, in the west season or rainy season in the waters of Manado Bay, North Sulawesi Province, Indonesia, is characterized by a powerful west wind accompanied by waves and currents causing the penetration of sunlight to the sea surface are not practical so that the water temperature is low [70]. The average sea surface temperature in Indonesian waters, including in the Flores Sea, is generally higher in the west season (rainy season) than in the east season (dry season) [73]. The research locations in BB and GT are in the Flores Sea, with lower water temperatures found in September measurements, namely in the dry season. The statistical analysis results between the water temperature in BB and GT showed significantly different results (p < 0.05), with the water temperature in BB being lower than in GT in the rainy and dry seasons. The lower water temperature in BB is made possible by the higher water depth in the coastal area of BB compared to GT. The depth of the waters in the coastal area of BB reaches about 20 m, while in the GT, it only reaches about 10 m. Seawater temperature is influenced by sea depth, wind speed, sunlight conditions, and the strength of the vertical temperature [74,75,76]. High water temperature was found in the water samples taken from the sampling point nearby the coastline (transect A) due to the shallow waters area. This is different from the water temperature on the transect perpendicular to the coastline, where there is no particular water temperature pattern in the BB and GT coastal areas.
Water salinity describes the total solids in the water after all the carbonates have been converted to oxides. Chlorides have replaced all the bromides and iodides, and all organic matter has been oxidized. One factor influencing salinity distribution in the waters is the amount of freshwater that enters marine waters [69,77]. In shallower waters, such as in the GT coastal area, freshwater intrusion can spread to the bottom of the water so that the water salinity becomes lower and is very significantly different (p < 0.01) from salinity in the BB coastal area both during the rainy season (Table 5) and during the dry season (Table 6). Another cause is higher salinity in BB’s coastal areas than GT due to lower rainfall (1428 vs. 1936 mm/year) and deeper waters (20 vs. 10 m). Based on the results of the climate analysis, it was obtained that the value of Q = 0.80 or classified as climate type D or moderate climate in BB and the value of Q = 0.29 or classified as climate type B or wet climate in GT. From another analysis, based on the number of dry months, it was found that there were four dry months in BB and two dry months in GT. The three analyses carried out on rainfall data show that BB is drier than GT, so it impacts high salinity in the coastal area of BB, as previously described. A significantly negative correlation was found between mean monthly salinity and monthly rainfall [78]. It has been reported that there is an increase in salinity in the waters around the BB and GT coasts, namely the southern region of Sulawesi, including the Flores Sea, during the dry season as a result of water masses from the Banda Sea with high water salinity entering these waters [79]. Seasonal changes can result in temperature and water salinity [70,79,80]. Intensive technology whiteleg shrimp culture activities do not influence the increase in water salinity in the dry season in the two subdistricts. However, it is more dominant due to the influence of the season, namely measurements made in the dry season. This is reinforced by the results of salinity measurements in the UL, which also increases during the dry season, even though there is no intensive technology whiteleg shrimp pond in this location.
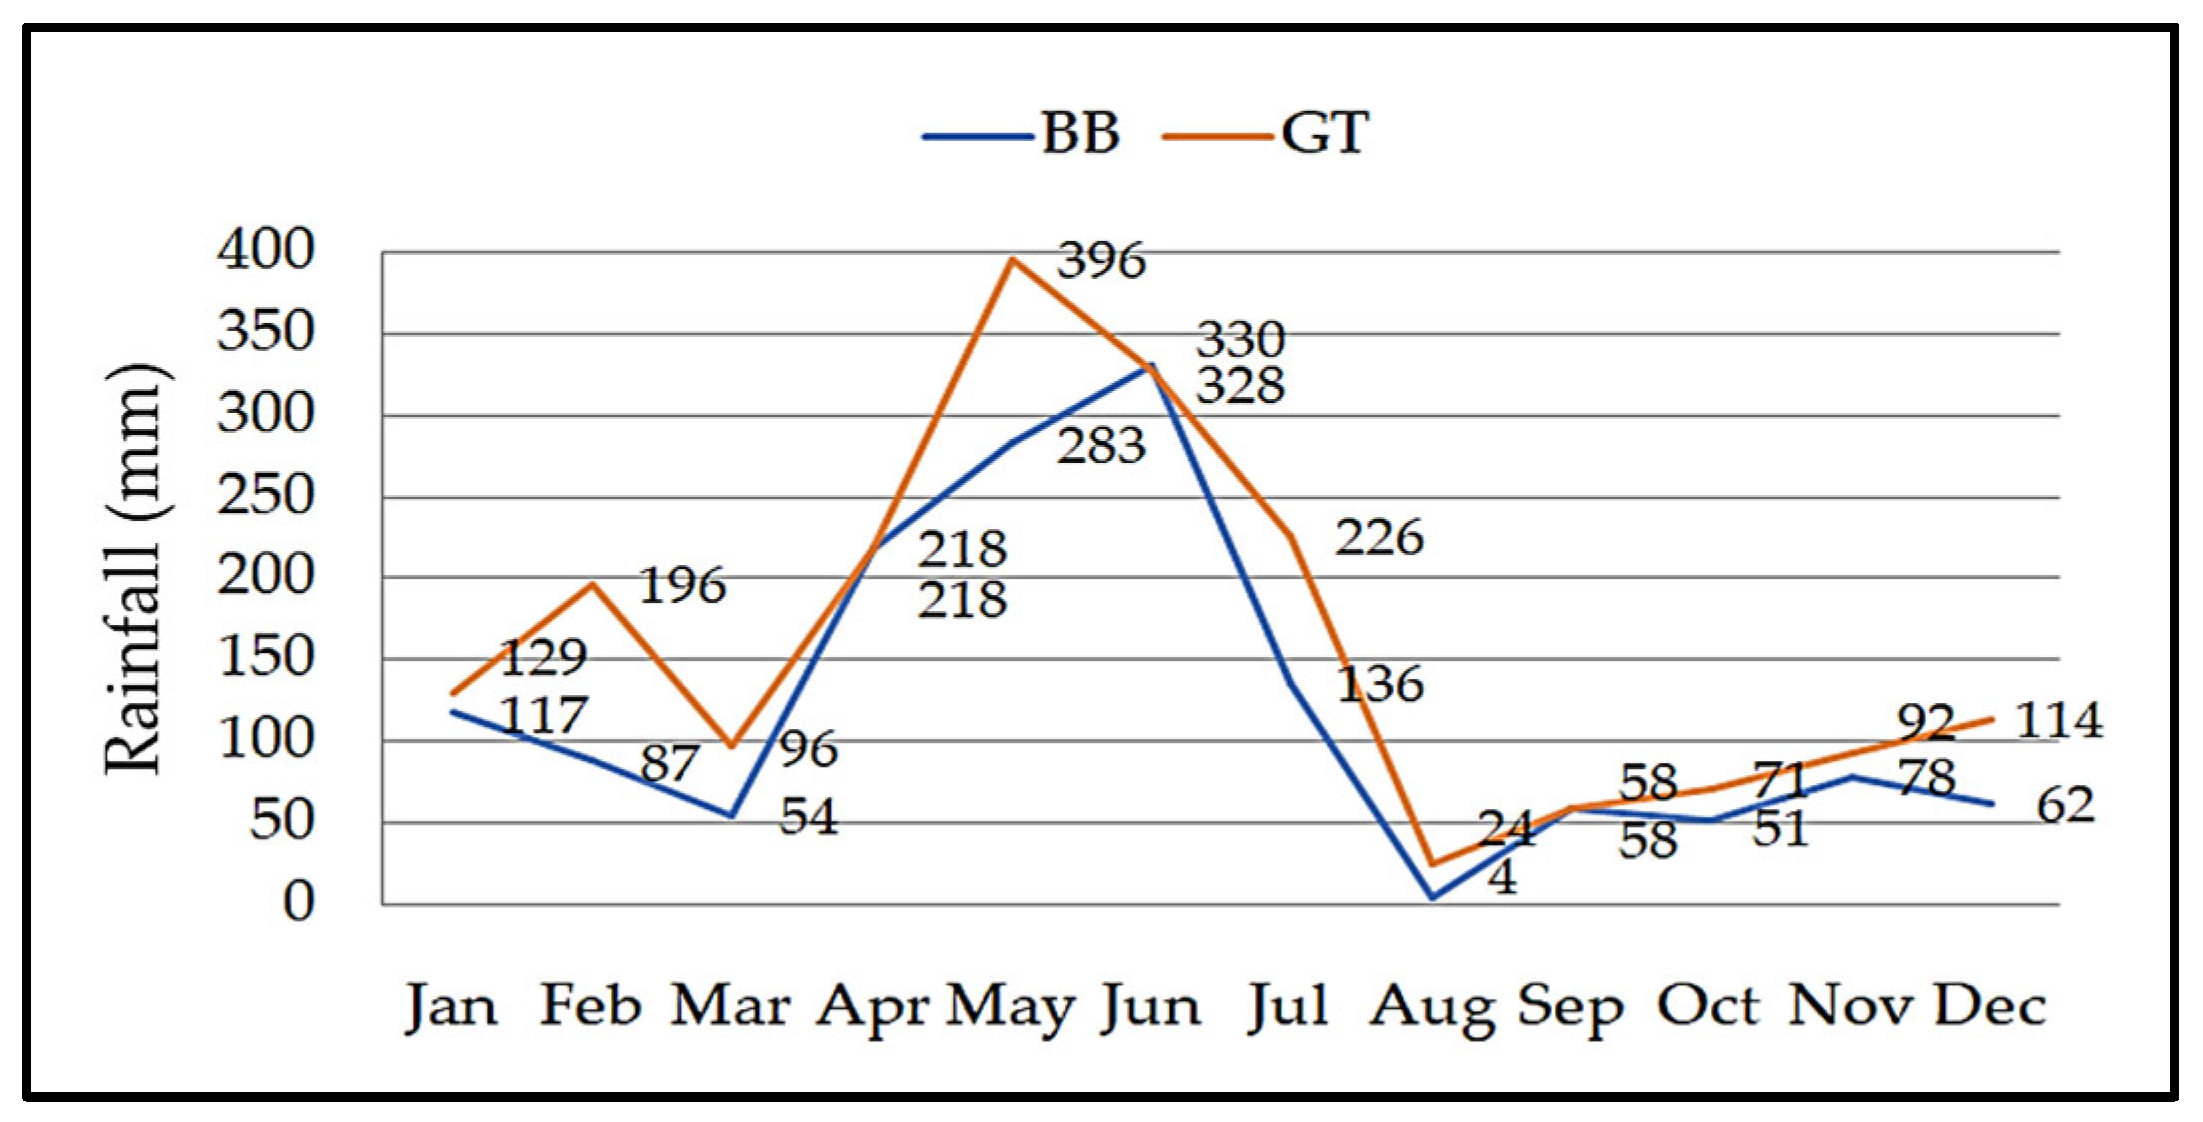
In the rainy season, it is known as a mighty west wind accompanied by waves and currents that cause the evaporation rate to be hampered so that it is thought that it can withstand increased salinity [70]. In addition, the low salinity of the water during the rainy season it is suspected that there is freshwater runoff from the land, which causes lower water salinity, because the measurement time in the rainy season is the peak of the rainy season in BB and GT (Figure 5 and Figure 6). The 32 rivers are flowing in the Bulukumba Regency area. The four large rivers have abundant water resources throughout the year, including Bialo, Binjawang, Balantiyeng, and Anyorang Rivers.
The low water salinity was found on transects close to the coastline. The salinity differences may have been caused by freshwater intrusion, which affects the salinity of water samples taken from sampling points nearby the land. Among the factors affecting salinity distribution in general waters is the freshwater flow that goes into the seawater [81]. In shallower waters, the freshwater intrusion can reach the bottom of the waters, causing low salinity. On the contrary, salinity in open seawaters is not affected by freshwater intrusion from the land, which causes high salinity [82].
The water pH in the coastal areas of the two subdistricts can be used as a water source for shrimp farming because the pH of good source water for intensive technology whiteleg shrimp culture is 7.5–8.5 [45]. Suitable water pH for marine biota ranges between 7.0 and 8.5 [44]. A small amount of organic material can cause the low pH of the water from the land carried through the river. It results from organic matter originating from whiteleg shrimp ponds and other acidic activities on land, which can decrease the water’s pH because the decomposition process of organic matter can produce acidic compounds. In addition, with the increase in the amount of waste, the pH of the water will decrease. This decrease is due to the increase in CO2 concentration due to the respiration process carried out by various microorganisms [22,83,84]. Generally, water pH increases in the rainy season and decreases in the dry season, which means that seasonal differences are an essential factor influencing water pH. As with water salinity, there is a tendency for higher water pH on transects farther from the coastline (Table 7). pH values of waters increase as the waters become closer to the open seawaters. If not managed, it will harm aquatic organisms in coastal areas.
Dissolved oxygen is one of the most critical environmental variables directly affecting production and growth through metabolism and environmental conditions. Dissolved oxygen concentration in water can affect the growth, FCR, and carrying capacity of waters. Dissolved oxygen concentration in the rainy season was higher and significantly different (p < 0.01) with dissolved oxygen in the dry season in the waters of BB and GT. The low concentration of dissolved oxygen in the dry season in both BB and GT coastal areas is thought to result from waste from intensive technology whiteleg shrimp ponds decomposed by microbes that use a lot of dissolved oxygen. Various processes decrease dissolved oxygen concentration when nutrients are high, including nitrate [17,70,85,86]. It was also found that the concentration of dissolved oxygen was lower in the nearshore transect (transect A) than other transects due to higher effluent near the coast that could require dissolved oxygen for its decomposition.
The low concentration of dissolved oxygen in the dry season measured in August and September can also be caused by low sea waves. Waves or ocean waves increase dissolved oxygen [87,88], so low waves in August and September also impact low dissolved oxygen concentrations. September, October, and November are the lowest sea waves in the Flores Sea [89]. The dissolved oxygen concentration was lower in the dry season than in the rainy season in the coastal area of Lampung Bay, Lampung Province [36]. Dissolved oxygen good for marine biota is more significant than 5.0 mg/L [44]. Dissolved oxygen in both source and rearing water for intensive whiteleg shrimp culture is greater than 4 mg/L [45].
Nutrients in the context of water quality are molecules in water that can be directly used by biota for cell growth [90,91]. Nutrients widely used by aquatic organisms, including seaweed, are ammonia, nitrate, nitrite, and phosphate [92,93]. In general, nitrate is the essential nutrient that determines the growth of plankton and higher plants in marine waters.
Besides supplementary feed and direct excretion of cultured aquatic organisms, other ammonia sources are thought to come from fertilizers used on land for agricultural activities carried to coastal areas. Sources of ammonia in waters come from fertilizers and feed [94,95]. Surface runoff from settlements generally contains higher nitrate and ammonia concentrations than forests, while fertilizer on agricultural land produces high nitrate and moderate ammonia [96]. It is suspected that the increase in ammonia concentration in the coastal area of Bulukumba Regency comes from intensive technology whiteleg shrimp aquaculture ponds in the form of leftover feed and feces of whiteleg shrimp as well as other activities that use fertilizers.
The same study results were higher phosphate concentrations in the rainy season than in other seasons [36,70]. The low phosphate concentration in the coastal area of GT is thought to be utilized by seaweed cultured in the area. The area of seaweed Kappaphycus alvarezii culture in the coastal area of Bulukumba Regency will reach 3766 ha in 2020 [97]. It is known that besides N, other nutrients needed by seaweed are P. Phosphate is the P form that is absorbed by seaweed [98,99,100]. Elemental P is an essential material for higher plants and aquatic algae, so this element is a limiting factor for aquatic plants and algae and significantly affects aquatic productivity [101,102]. Seaweed requires P for growth because it is the main constituent of Ribonucleic acid (RNA) and consequently is involved in protein synthesis [103,104]. In addition, the term “overconsumption” in aquatic algae is also known, namely when the water contains sufficient P, the aquatic algae accumulate P in the cells exceeding their needs [103]. The excess P absorbed will be utilized when the waters lack P so that seaweed can still grow for some time during periods of P supply shortage. The average phosphate concentration is 0.06622 ± 0.01945 mg/L in coastal areas of BB and 0.09993 ± 0.10077 mg/L in the coastal area of the GT during the rainy season. An average of 0.03586 ± 0.04285 mg/L in the coastal area of BB and 0.09167 ± 0.06966 mg/L in the coastal area of GT during the dry season, when compared with the ideal concentration for seaweed growth habitat, which is 1.0–3.2 mg/L [105], this situation is still far from optimal. Although there is no seaweed culture in BB, the decrease in phosphate concentration is thought to be due to the relatively small source of phosphate other than the aquaculture pond in BB in the dry season. In GT, there are agricultural activities such as rice fields that use many fertilizers, including SP-36 fertilizer, which contains phosphate, which can contribute phosphate compounds in the coastal area of GT. In the mainland part of BB, the land use is in the form of less productive forests, so the source of phosphate is thought to only come from intensive whiteleg shrimp pond waste. This assumption is reinforced by data on very low phosphate concentrations in UL (control) in the dry season (Table 6) due to the absence of a phosphate source originating from intensive technology whiteleg shrimp ponds. The phosphate concentration in the source and rearing water of good whiteleg shrimp ranged between 0.01 and 5.0 mg/L [45].
Excess or lack of phosphate concentration in aquaculture has an unfavorable impact on the cultured organisms. Excess or lack of a chemical substance in water will cause physiological disturbances in aquatic organisms [106]. Although it is estimated that there is P waste of ±13.22 tons/year or 6.61 tons/cycle from intensive technology whiteleg shrimp culture wasted in the coastal area of Bulukumba Regency, the concentration is still relatively low and supports seaweed culture.
The chemical characteristics of the water govern the solubility of inorganic phosphorus in aquatic systems. There is a very close and positive relationship between phosphate and water pH, which means that the higher the pH, the higher the phosphate concentration. However, it has been reported that the solubility of inorganic phosphorus will decrease at a water pH greater than 9.0 [107]. In this case, the pH of water in the coastal area of Bulukumba Regency is still in the range of water pH, which allows an increase in phosphate with an increase in water pH.
The total suspended solids concentration is less than 80 mg/L and the total organic matter concentration is less than 90 mg/L, supporting technology intensive whiteleg shrimp culture [45]. The deeper water depths in the coastal area of BB impact and reduce the agitation of the seabed so that the concentration of total suspended solids will be lower [108]. On the other hand, the relatively shallow water depth in the coastal area of GT results in more significant seabed agitation resulting in a higher total suspended solids concentration. Another factor that is thought to affect the total suspended solids in the coastal area of Bulukumba Regency is the sea waves, so that when the sea waves are low, namely measurements in the dry season, the concentration of total suspended solids is low. High sea speed and waves cause high total suspended solids [108,109]. Spatially and temporally, the presence and condition of total suspended solids in coastal areas can be influenced by several factors such as ocean currents, tides, river discharge, and land cover [110,111]. It is suspected that these various factors can cause a decrease in the concentration of total suspended solids and total organic matter in the coastal area of Bulukumba Regency during the dry season.

4.3. Water Quality Status

One of the causes of the decline in the environmental quality of coastal waters is the discharge of aquaculture waste during operations which contains high concentrations of organic matter and nutrients. This condition is a consequence of the input of pond production facilities in aquaculture, resulting in residual feed and feces dissolved into the surrounding waters [19,112,113]. In commercial aquaculture, 30% of the total feed given is not consumed by fish/shrimp, and about 25–30% of the feed consumed will be excreted [114]. The amount of N and P present in the feed will be retained in fish/shrimp meat between 25–30%, and the rest is wasted in the aquatic environment [114]. Estimated nutrient load sourced from feed that is wasted into the coastal waters of Bulukumba Regency in the form of N reaches ± 56.01 tons/year and P reaches ± 13.22 tons/year in whiteleg shrimp culture with stocking densities of 100 up to 220 ind/m2 in ponds with a total area of ±69.60 ha (Table 2). Ten water quality variables are used to determine water quality status in coastal areas. Only four water quality variables cause water quality in the coastal area of Bulukumba Regency to be heavily polluted, namely high salinity, low dissolved oxygen, and high nitrate and ammonia concentrations in the dry season. At high salinity (hyperosmotic), as found in the coastal area of Bulukumba Regency during the dry season, shrimp growth will be disrupted due to the disturbed osmoregulation process. If the energy used for osmoregulation activity increases, the energy for growth decreases, thereby reducing the growth rate of aquatic organisms [115,116]. Meanwhile, dissolved oxygen in water can be reduced due to respiration and decomposition of organic matter on the bottom of the water [117,118], causing a decrease in dissolved oxygen in water, where a decrease in dissolved oxygen concentration to a critical point will cause hypoxia. Hypoxia (dissolved oxygen concentration <2.0 mg/L or about 30% saturation) is a phenomenon that occurs in the aquatic environment due to a decrease in dissolved oxygen concentration to a limit that can contribute greatly to a decrease in the growth and reproduction ability of aquatic organisms and even death of aquatic organisms in the water [119,120,121].
A nitrate is a form of N that is less toxic than nitrite and ammonia, but it can be toxic to shrimp at high concentrations. Shrimp exposed to high nitrate concentrations for a long time showed shorter antennae length, gill abnormalities, and hepatopancreas blisters [122,123]. Short antennae and gill abnormalities are often considered early clinical signs of declining shrimp health [122]. Several cases state that excessive ammonia concentrations can cause severe water problems [55]. Such conditions can be caused by the contribution of N originating from the mainland. A significant N contribution comes from fisheries, including from intensive and super-intensive technologies whiteleg shrimp aquaculture ponds [10,11,64]. N penetration also occurs in agriculture, agrochemical, forestry, animal husbandry, and other sectors. The effect of ammonia on shrimp is the narrowing of the gill surface; consequently, the rate of gas exchange in the gills is reduced [124,125]. In addition, other effects are a decrease in the number of blood cells, a decrease in the concentration of oxygen in the blood, a decrease in physical resistance and resistance to disease, and structural damage to various types of shrimp organs. Several research results state that the accumulation of ammonia in aquaculture water causes various kinds of damage to aquatic organisms, especially damage to the function and structure of body organs [126,127]. The concentration of ammonia strongly influences the toxicity of nitrite in the waters; if the concentration of the two variables is high, they are a stressor for shrimp and fish cultured so that shrimp and fish are more susceptible to disease [128]. Ammonia can be reduced directly by assimilating heterotrophic bacteria, algae, and other aquatic plants [129,130]. Probiotics are heterotrophic bacteria commonly given to aquaculture in ponds because they can improve pond water quality by reducing total organic matter, ammonia, nitrate, and nitrite of water [91,131] or, in general, efforts are needed for proper water management. In addition, to obtain water for whiteleg shrimp culture with lower concentrations of ammonia and nitrate in BB and GT, it is advisable to take water from a location far from the coastline. It was mentioned earlier that the concentration of ammonia and nitrate becomes lower the farther from the coastline (Table 7).
Nutrient enrichment can also reduce the brightness level by stimulating the growth of phytoplankton in water bodies. Increased nutrient concentrations can cause negative coral responses such as decreased reproductive success, calcification rate, and skeleton density [38,132]. These nutrients can also stimulate macroalgae growth, which can cause coral death due to algal overgrowth [40,133,134]. Knowing the level and source of nitrate and ammonia pollution can be used to control nitrogen inputs and further determine more sustainable water management in coastal areas.
Changes in the status of water quality from complying with quality standards and being polluted in the rainy season to being heavily polluted in the dry season, apart from being suspected of having a load of waste originating from whiteleg shrimp culture, it is also suspected to be due to the influence of the season. Measurements and water sampling carried out in August and September coincided with the peak of the dry season at the site, which resulted in increased salinity and relatively small dilution of nutrients in coastal areas [135]. The timing of stocking in whiteleg shrimp culture ponds in Bulukumba Regency needs to be carried out appropriately. Information has been obtained that one of the problems with whiteleg shrimp culture in Bulukumba Regency is climatic conditions that do not support intensive technology whiteleg shrimp culture [136].
The research results are expected to provide basic information regarding the characteristics and status of water quality in the area. The findings of this study indicate that greater awareness of the environmental impact of intensive whiteleg shrimp ponds and climate is needed if the whiteleg shrimp aquaculture industry is to be developed and fulfills sustainable elements. Suppose the coastal area ecosystem must be protected for the future. It is not easy to present the best option for managing coastal area resources without monitoring water quality temporally and spatially [137,138]. The results of this assessment should be followed by regular monitoring of water quality. So that it is hoped a healthy aquatic ecosystem will be created that can impact the increase and sustainability of intensive technology whiteleg shrimp aquaculture production and coastal ecosystems where Taka Bonerate National Park is found, which has thus been designated as a UNESCO Biosphere Reserve; the bioecological balance of the elements that make up the ecosystem in coastal areas, including coral reefs, is an essential key. Therefore, maintaining a balanced level of biodiversity and density between all ecosystem components must be one of the targets and priorities in the coastal area management strategy to achieve a sustainable environment.

5. Conclusions

The intensive technology whiteleg shrimp culture in Bulukumba Regency is carried out with a stocking density of 110 to 220 ind/m2 with the productivity of ±13.9 tons/ha/cycle up to ±44.4 tons/ha/cycle. The predicted waste load of N is ±28.00 tons/cycle and P reaches ±6.61 tons/cycle. There was a change in the status of water quality before stocking/initial stocking of the culture of whiteleg shrimp (rainy season) in the category of Class C or moderate (moderately polluted) in the BB coastal area and the Class A category or very good (complying quality standard) in the GT coastal area. Both locations were categorized as Class D or poor (heavily polluted) at the end of culture or after harvesting whiteleg (dry season). Water quality variables that cause a decrease in water quality status in the coastal area of Bulukumba Regency are an increase in salinity, nitrate concentration, and ammonia concentration and a decrease in dissolved oxygen concentration at the end of the culture of whiteleg shrimp (dry season). It is recommended to carry out proper feed management and use of probiotics to reduce ammonia and nitrate concentrations in water in coastal areas. Moreover, increasing the capacity and capability of the WWTP pond for intensive technology whiteleg shrimp ponds in the Bulukumba Regency is needed. This increase minimizes the burden of waste dumped into coastal areas and a detailed study of the use of WWTP pond with absorption systems in Mediterranean soils and the application of intensive technology. It is necessary to determine a more precise time for whiteleg shrimp stocking by reducing the possibility that whiteleg shrimp culture will still occur at the dry season’s peak.

Author Contributions

Conceptualization, A.M., M.P., I.M.; methodology, A.M., M.P., I.M.; software, A.M., I.M.; validation, A.M., M.P., A.A., E.R., R.A., E.A.H., K.K., E.S., A.S.; formal analysis, A.M., E.R., R.A., H.S.S., S.S.; investigation, A.M., A.A., E.R., E.A.H., K.K., E.S., A.S.; resources, A.M., M.P.; data curation, A.M., A.A., M.P., R.A.; writing—original draft preparation, A.M., M.P., E.R., I.M., K.N.; writing—review and editing, A.M., M.P., H.S.S., S.S., I.M., K.N.; visualization, A.M., A.A., R.A., K.K.; supervision, A.M., E.R.; project administration, A.M., M.P., E.R., R.A.; funding acquisition, A.M., M.P. All authors have read and agreed to the published version of the manuscript.

Funding

This research was financed from the Budget Implementation Entry List No.: DIPA-031.12.2.403828/2021 of RICAFE in the 2021 Fiscal Year.

Institutional Review Board Statement

Not applicable.

Informed Consent Statement

Not applicable.

Data Availability Statement

Not applicable.

Acknowledgments

We would like to thank the Engineering Technicians of the RICAFE. They have assisted in taking water samples in the field and analyzing them in the laboratory. Thanks are also conveyed to the Bulukumba Regency Fisheries Extension for their assistance during the implementation of research in the field. Thanks are also due to the funders of this research who were financed from the RICAFE Budget Implementation Entry List for the 2021 Fiscal Year. To all the co-authors, I would like to express my gratitude for their contribution in the preparation and writing of this article.

Conflicts of Interest

The authors declare no conflict of interest.

References

  1. Barnard, P.L.; Erikson, L.H.; Foxgrover, A.C.; Hart, J.A.F.; Limber, P.; O’Neill, A.C.; Van Ormondt, M.; Vitousek, S.; Wood, N.; Hayden, M.K.; et al. Dynamic flood modeling essential to assess the coastal impacts of climate change. Sci. Rep. 2019, 9, 4309. [Google Scholar] [CrossRef] [PubMed] [Green Version]
  2. Cortés, A.; Casillas-Hernández, R.; Cambeses-Franco, C.; Bórquez-López, R.; Magallón-Barajas, F.; Quadros-Seiffert, W.; Feijoo, G.; Moreira, M.T. Eco-efficiency assessment of shrimp aquaculture production in Mexico. Aquaculture 2021, 544, 737145. [Google Scholar] [CrossRef]
  3. Bongarts Lebbe, T.; Rey-Valette, H.; Chaumillon, É.; Camus, G.; Almar, R.; Cazenave, A.; Claudet, J.; Rocle, N.; Meur-Férec, C.; Viard, F.; et al. Designing coastal adaptation strategies to tackle sea level rise. Front. Mar. Sci. 2021, 8, 1640. [Google Scholar] [CrossRef]
  4. Cabral, H.; Fonseca, V.; Sousa, T.; Leal, M.C. Synergistic effects of climate change and marine pollution: An overlooked interaction in coastal and estuarine areas. Int. J. Environ. Res. Public Health 2019, 16, 2737. [Google Scholar] [CrossRef] [PubMed] [Green Version]
  5. Mustafa, A.; Hasnawi, H.; Tarunamulia, T.; Selamat, M.B.; Samawi, M.F. Distribution of heavy metal pollutants in coastal waters used to supply nearby shrimp ponds and their mitigation in Jabon District, East Java Province. J. Ris. Akuakultur 2019, 14, 127–138. (In Indonesian) [Google Scholar] [CrossRef]
  6. Thushari, G.; Senevirathna, J. Plastic pollution in the marine environment. Heliyon 2020, 6, e04709. [Google Scholar] [CrossRef]
  7. De Melo, F.P.; Ferreira, M.G.P.; Braga, Í.F.M.; Correia, E.d.S. Toxicity of nitrite on shrimp Litopenaeus vannamei reared in clear water and biofloc systems. B. Inst. Pesca 2018, 42, 855–865. [Google Scholar]
  8. Gusmawati, N.; Soulard, B.; Selmaoui-Folcher, N.; Proisy, C.; Mustafa, A.; Le Gendre, R.; Laugier, T.; Lemonnier, H. Surveying shrimp aquaculture pond activity using multitemporal VHSR satellite images-case study from the Perancak estuary, Bali, Indonesia. Mar. Pollut. Bull. 2018, 131, 49–60. [Google Scholar] [CrossRef] [Green Version]
  9. Marzuki, I.; Bachtiar, E.; Alwi, R.S.; Kamaruddin, M.; Iryani, A.S. Chitosan Performance of Shrimp Shells in The Biosorption Ion Metal of Cadmium, Lead and Nickel Based on Variations Ph Interaction; Atlantis Press: Amsterdam, The Netherlands, 2019; Volume 165, pp. 6–11. [Google Scholar]
  10. Syah, R.; Makmur, M.; Fahrur, M. Budidaya Udang Vaname Dengan Padat Penebaran Tinggi. Media Akuakultur. 2017, 12, 19–26. (In Indonesian) [Google Scholar] [CrossRef] [Green Version]
  11. Syah, R.; Makmur, M.; Undu, M.C. Estimation of feed nutrient waste load and carrying capacity of coastal areas for super-intensive vaname shrimp ponds. J. Ris. Akuakultur 2014, 9, 439–448. (In Indonesian) [Google Scholar] [CrossRef] [Green Version]
  12. Nguyen, T.A.T.; Jolly, C. Is super-intensification the solution to shrimp production and export sustainability? Sustainability 2019, 11, 5277. [Google Scholar] [CrossRef] [Green Version]
  13. Nguyen, K.A.T.; Nguyen, T.A.T.; Jolly, C.; Nguelifack, B.M. Economic Efficiency of extensive and intensive shrimp production under conditions of disease and natural disaster risks in Khánh Hòa and Trà Vinh provinces, Vietnam. Sustainability 2020, 12, 2140. [Google Scholar] [CrossRef] [Green Version]
  14. Marzuki, I.; Kamaruddin, M.; Ahmad, R. Identification of marine sponges-symbiotic bacteria and their application in degrading polycyclic aromatic hydrocarbons. Biodiversitas J. Biol. Divers. 2021, 22, 1481–1488. [Google Scholar] [CrossRef]
  15. Engle, C.R.; McNevin, A.; Racine, P.; Boyd, C.E.; Paungkaew, D.; Viriyatum, R.; Tinh, H.Q.; Minh, H.N. Economics of sustainable intensification of aquaculture: Evidence from shrimp farms in Vietnam and Thailand. J. World Aquac. Soc. 2017, 48, 227–239. [Google Scholar] [CrossRef] [Green Version]
  16. Paul, B.G.; Vogl, C.R. Key performance characteristics of organic shrimp aquaculture in Southwest Bangladesh. Sustainability 2012, 4, 995–1012. [Google Scholar] [CrossRef] [Green Version]
  17. Bui, T.D.; Luong-Van, J.; Austin, C.M. Impact of shrimp farm effluent on water quality in coastal areas of the world Heritage-Listed Ha Long Bay. Am. J. Environ. Sci. 2012, 8, 104–116. [Google Scholar] [CrossRef] [Green Version]
  18. Chaikaew, P.; Rugkarn, N.; Pongpipatwattana, V.; Kanokkantapong, V. Enhancing ecological-economic efficiency of intensive shrimp farm through in-out nutrient budget and feed conversion ratio. Sustain. Environ. Res. 2019, 29, 1–11. [Google Scholar] [CrossRef] [Green Version]
  19. Iber, B.T.; Kasan, N.A. Recent advances in Shrimp aquaculture wastewater management. Heliyon 2021, 7, 9. [Google Scholar] [CrossRef]
  20. Avnimelech, Y. Shrimp and fish pond soils: Processes and management. Aquaculture 2003, 220, 549–567. [Google Scholar] [CrossRef] [Green Version]
  21. Kallenbach, C.M.; Frey, S.D.; Grandy, A.S. Direct evidence for microbial-derived soil organic matter formation and its ecophysiological controls. Nat. Commun. 2016, 7, 13630. [Google Scholar] [CrossRef]
  22. Ayilara, M.S.; Olanrewaju, O.S.; Babalola, O.O.; Odeyemi, O. Waste Management through composting: Challenges and potentials. Sustainability 2020, 12, 4456. [Google Scholar] [CrossRef]
  23. Martins, C.; Eding, E.; Verdegem, M.; Heinsbroek, L.; Schneider, O.; Blancheton, J.; D’Orbcastel, E.R.; Verreth, J. New developments in recirculating aquaculture systems in Europe: A perspective on environmental sustainability. Aquac. Eng. 2010, 43, 83–93. [Google Scholar] [CrossRef] [Green Version]
  24. Olusegun, A.; Babatunde, D.; Abiodun, O. Haematological Response of clarias Gariepinus juveniles rearedin treated wastewater after waste solids removal using alum or moringa oleifera seed powder. Int. J. Aquac. 2016, 6, 1–8. [Google Scholar] [CrossRef]
  25. Cavazos, V.; Alonso, D. Effect of feces leaching on apparent digestibility coefficients of Pacific white shrimp (Litopenaeus vannamei). Hidrobiológica 2017, 27, 353–357. [Google Scholar] [CrossRef]
  26. Pomeroy, L.; Williams, P.L.; Azam, F.; Hobbie, J. The microbial loop. Oceanography 2007, 20, 28–33. [Google Scholar] [CrossRef]
  27. Beardsley, C.; Moss, S.; Malfatti, F.; Azam, F. Quantitative role of shrimp fecal bacteria in organic matter fluxes in a recirculating shrimp aquaculture system. FEMS Microbiol. Ecol. 2011, 77, 134–145. [Google Scholar] [CrossRef] [Green Version]
  28. Vinitnantharat, S.; Patanachan, P.; Pansuk, P. Effect of Season on Water Quality of Extensive and Intensive Seabass Culture Ponds and Associated Canals. Veridian E-J. Sci. Technol. Silpakorn Univ. 2019, 6, 1–15. Available online: https://www.researchgate.net/publication/338335533_Effect_of_Season_on_Water_Quality_of_Extensive_and_Intensive_Seabass_Culture_Ponds_and_Associated_Canals (accessed on 9 September 2021).
  29. Moon, Y.-E.; Kim, H.-S. Inter-Annual and seasonal variations of water quality and trophic status of a reservoir with fluctuating monsoon precipitation. Int. J. Environ. Res. Public Health 2021, 18, 8499. [Google Scholar] [CrossRef]
  30. State Minister for Environment. Decree of the State Minister of the Environment Number: 115 of 2003 about Guidelines for Determining the Status of Water Quality; State Minister for Environment: Jakarta, Indonesia, 2003; Volume 15, p. 2003. Available online: https://luk.staff.ugm.ac.id/atur/sda/KepmenLH115-2003StatusMutuAir.pdf (accessed on 12 February 2021). (In Indonesian)
  31. Sun, W.; Xia, C.; Xu, M.; Guo, J.; Sun, G. Application of modified water quality indices as indicators to assess the spatial and temporal trends of water quality in the Dongjiang River. Ecol. Indic. 2016, 66, 306–312. [Google Scholar] [CrossRef]
  32. de Lima, G.N.; Lombardo, M.A.; Magaña, V. Urban water supply and the changes in the precipitation patterns in the metropolitan area of São Paulo–Brazil. Appl. Geogr. 2018, 94, 223–229. [Google Scholar] [CrossRef] [Green Version]
  33. Effendi, H.; Wardiatno, Y. Water quality status of Ciambulawung River, Banten Province, based on pollution index and NSF-WQI. Procedia Environ. Sci. 2015, 24, 228–237. [Google Scholar] [CrossRef] [Green Version]
  34. Dunca, A.-M. Water pollution and water quality assessment of major transboundary rivers from banat (Romania). J. Chem. 2018, 2018, 1–8. [Google Scholar] [CrossRef] [Green Version]
  35. Liu, Y.; Zhang, J.; Zhao, Y. The Risk Assessment of river water pollution based on a modified non-linear model. Water 2018, 10, 362. [Google Scholar] [CrossRef] [Green Version]
  36. Barokah, G.R.; Ariyani, F.; Siregar, T.H. Comparison of Storet and pollution index method to assess the environmental pollution status: A case study from Lampung Bay, Indonesia. Squalen Bull. Mar. Fish. Postharvest Biotechnol. 2017, 12, 67–74. [Google Scholar] [CrossRef] [Green Version]
  37. Yusnita, E.A.; Triajie, H. Determination of water quality status in estuary waters of Bangkalan District Socah Subdistrict using Storet Method and Pollution Index. Juv.–J. Ilmu Kelaut. Dan Perikan. 2021, 2, 157–165. [Google Scholar] [CrossRef]
  38. Fabricius, K.E. Effects of terrestrial runoff on the ecology of corals and coral reefs: Review and synthesis. Mar. Pollut. Bull. 2005, 50, 125–146. [Google Scholar] [CrossRef] [PubMed]
  39. Riegl, B.M.; Sheppard, C.R.C.; Purkis, S.J. Human impact on atolls leads to coral loss and community Homogenisation: A modeling study. PLoS ONE 2012, 7, e36921. [Google Scholar] [CrossRef] [Green Version]
  40. D’Angelo, C.; Wiedenmann, J. Impacts of nutrient enrichment on coral reefs: New perspectives and implications for coastal management and reef survival. Curr. Opin. Environ. Sustain. 2014, 7, 82–93. [Google Scholar] [CrossRef] [Green Version]
  41. Garniati, L.; Iswadi, A.; Praptiwi, R.A.; Sugardjito, J. Towards sustainable marine and coastal planning for Taka Bonerate Kepulauan Selayar Biosphere Reserve: Indonesian case study to The global challenge research fund blue communities project. In Proceedings of the IOP Conference Series: Earth and Environmental Science, Palembang, Indonesia, 23 July 2018; IOP Publishing: Bristol, UK, 2019; Volume 298, p. 8. [Google Scholar]
  42. Ma, Z.; Song, X.; Wan, R.; Gao, L. A modified water quality index for intensive shrimp ponds of Litopenaeus vannamei. Ecol. Indic. 2013, 24, 287–293. [Google Scholar] [CrossRef]
  43. Armus, R.; Selry, C.; Marzuki, I.; Hasan, H.; Sapar, A. Investigation of potential marine bacterial isolates in biodegradation methods on hydrocarbon contamination. J. Physics. Conf. Ser. 2021, 1899, 012006. [Google Scholar] [CrossRef]
  44. Ministry of Environment. Decree of Minister of Environment Number 51 of 2004, Dated 8 April 2004 about the Standard Quality of Seawater for Marine Biota. Jakarta: Ministry of Environment, p. 10. 2004. Available online: https://ppkl.menlhk.go.id/website/filebox/824/191009100640Keputusan%20MENLH%20Nomor%2051%20tahun%202004%20%20tentang%20Baku%20Mutu%20Air%20Laut.pdf (accessed on 12 February 2021). (In Indonesian)
  45. Ministry of Marine Affairs and Fisheries. Regulation of the Minister of Marine Affairs and Fisheries of the Republic of Indonesia Number 75/Permen-KP/2016 about General Guidelines for Grow-out of Tiger Shrimp (Penaeus monodon) and Whiteleg Shrimp (Litopenaeus vannamei); Ministry of Marine Affairs and Fisheries: Jakarta, Indonesia, 2016; p. 43. Available online: https://bkipm.kkp.go.id/bkipmnew/public/files/regulasi/75-permen-kp-2016-ttg-pedoman-umum-pembesaran-udang-windu.pdf (accessed on 17 June 2020). (In Indonesian)
  46. American Public Health Association-[AWWA] American Water Works Association-[WEF] Water Environment Federation. Standard Methods for the Examination of Water and Wastewater, 22nd ed.; Rice, E.W., Baird, R.B., Eaton, A.D., Clesceri, L.S., Eds.; American Public Health Association-American Water Works Association-Water Environment Federation: Washington, DC, USA, 2012; p. 1496. Available online: https://www.amazon.it/Standard-Methods-Examination-Water-Wastewater/dp/0875530133 (accessed on 12 February 2015).
  47. Teichert-Coddington, D.; Rouse, D.; Potts, A.; Boyd, C. Treatment of harvest discharge from intensive shrimp ponds by settling. Aquac. Eng. 1999, 19, 147–161. [Google Scholar] [CrossRef]
  48. Schmidt, F.H.; Ferguson, J.H.A. Rainfall Type Based on Wet and Dry Period Ratios for Indonesia with Western New Gurinea; Kementerian Perhubungan, Djawatan Meteorologi dan Geofisik: Jakarta, Indonesia, 1951; Volume 42, p. 77. Available online: https://agris.fao.org/agris-search/search.do?recordID=US201300720509 (accessed on 27 March 2021).
  49. Ghasemi, A.; Zahediasl, S. Normality tests for statistical analysis: A guide for non-statisticians. Int. J. Endocrinol. Metab. 2012, 10, 486–489. [Google Scholar] [CrossRef] [Green Version]
  50. Canter, L.W. Environmental impact assessment. Impact Assess. 1982, 1, 6–40. [Google Scholar] [CrossRef]
  51. Zang, C.; Huang, S.; Wu, M.; Du, S.; Scholz, M.; Gao, F.; Lin, C.; Guo, Y.; Dong, Y. Comparison of Relationships Between pH, Dissolved Oxygen and Chlorophyll a for Aquaculture and Non-aquaculture Waters. Water Air Soil Pollut. 2011, 219, 157–174. [Google Scholar] [CrossRef]
  52. Sun, Y.; Zhu, L.; Xu, X.; Meng, Q.; Men, M.; Xu, B.; Deng, L. Correlation between ammonia-oxidizing microorganisms and environmental factors during cattle manure composting. Revista Argentina de Microbiología 2019, 51, 371–380. [Google Scholar] [CrossRef] [PubMed]
  53. Hargreaves, J.A. Nitrogen biogeochemistry of aquaculture ponds. Aquaculture 1998, 166, 181–212. [Google Scholar] [CrossRef]
  54. Kamaruddin, M.; Marzuki, I.; Burhan, A.; Ahmad, R. Screening acetylcholinesterase inhibitors from marine-derived actinomycetes by simple chromatography. In Proceedings of the IOP Conference Series: Earth and Environmental Science, Surabaya, Indonesia, 11 September 2020; IOP Publishing: Bristol, UK, 2021; Volume 679, p. 012011. [Google Scholar]
  55. Boyd, C.E. Guidelines for aquaculture effluent management at the farm-level. Aquaculture 2003, 226, 101–112. [Google Scholar] [CrossRef]
  56. Burford, M.; Smith, D.; Tabrett, S.; Coman, F.; Thompson, P.; Barclay, M.; Toscas, P. The effect of dietary protein on the growth and survival of the shrimp, Penaeus monodon in outdoor tanks. Aquac. Nutr. 2004, 10, 15–23. [Google Scholar] [CrossRef] [Green Version]
  57. Li, Y.-H.; Menviel, L.; Peng, T.-H. Nitrate deficits by nitrification and denitrification processes in the Indian Ocean. Deep Sea Res. Part. I Oceanogr. Res. Pap. 2006, 53, 94–110. [Google Scholar] [CrossRef]
  58. Saeed, M.O.; Al-Nomazi, M.A.; Al-Amoudi, A.S. Evaluating suitability of source water for a proposed SWRO plant location. Heliyon 2019, 5, e01119. [Google Scholar] [CrossRef] [Green Version]
  59. Kasan, N.A.; Kamaruzzan, A.S.; Rahim, A.I.A.; Ishak, A.N.; Jauhari, I.; Ikhwanuddin, M. Production of Pacific whiteleg shrimp, Litopenaeus vannamei through implementation of rapid biofloc technology. In Proceedings of the IOP Conference Series: Earth and Environmental Science, Makassar, Indonesia, 22 June 2019; IOP Publishing: Bristol, UK, 2019; Volume 370, p. 012005. [Google Scholar]
  60. Lebel, L.; Mungkung, R.; Gheewala, S.H.; Lebel, P. Innovation cycles, niches and sustainability in the shrimp aquaculture industry in Thailand. Environ. Sci. Policy 2010, 13, 291–302. [Google Scholar] [CrossRef]
  61. Boyd, C.E.; D’Abramo, L.R.; Glencross, B.D.; Huyben, D.C.; Juarez, L.M.; Lockwood, G.S.; McNevin, A.A.; Tacon, A.G.J.; Teletchea, F.; Tomasso, J.R., Jr.; et al. Achieving sustainable aquaculture: Historical and current perspectives and future needs and challenges. J. World Aquac. Soc. 2020, 51, 578–633. [Google Scholar] [CrossRef]
  62. Chatvijitkul, S.; Boyd, C.E.; Davis, D.A. Nitrogen, phosphorus, and carbon concentrations in some common aquaculture feeds. J. World Aquac. Soc. 2017, 49, 7. [Google Scholar] [CrossRef] [Green Version]
  63. Muqsith, A.; Harahab, N.; Mahmudi, M.; Fadjar, M. The estimation of loading feed nutrient waste from vannamei shrimp aquaculture pond and carrying capacity of coastal area in Banyuputih Sub-District Situbondo Regency. Int. Conf. Biol. Appl. Sci. (ICOBAS) 2019, 2120, 040037. [Google Scholar] [CrossRef]
  64. Paena, M.; Syamsuddin, R.; Rani, C.; Tandipayuk, H. Estimation of organic waste loads from shrimp pond superintensive that was disposed in the Labuange Bay waters. J. Ilmu Dan Teknol. Kelaut. Trop. 2020, 12, 509–518. (In Indonesian) [Google Scholar] [CrossRef]
  65. Torrent, J. Mediterranean Soils. In Encyclopedia of Soils in the Environment; Elsevier BV: Amsterdam, The Netherlands, 2005; pp. 418–427. [Google Scholar]
  66. Lucke, B.; Kemnitz, H.; Bäumler, R.; Schmidt, M. Red mediterranean soils in Jordan: New insights in their origin, genesis, and role as environmental archives. Catena 2014, 112, 4–24. [Google Scholar] [CrossRef] [Green Version]
  67. Spaargaren, O.; Deckers, J. Factors of soil formation | climate. In Encyclopedia of Soils in the Environment; Elsevier BV: Amsterdam, The Netherlands, 2005; pp. 512–520. [Google Scholar]
  68. White, A. Natural Weathering Rates of Silicate Minerals. Treatise Geochem. 2003, 5, 133–168. [Google Scholar] [CrossRef]
  69. Schnoor, J. Water quality and its sustainability introduction. Compr. Water Qual. Purif. 2014, 4, 1–40. [Google Scholar] [CrossRef]
  70. Patty, S.I.; Rizki, M.P.; Rifai, H.; Akbar, N.; Khairun, U. Water quality and sea pollution index in Manado Bay the view physical-chemical paramaters sea. J. Ilmu Kelaut. Kepul. 2019, 2, 1–13. (In Indonesian) [Google Scholar] [CrossRef] [Green Version]
  71. Yamanaka, M. Physical climatology of Indonesian maritime continent: An outline to comprehend observational studies. Atmos. Res. 2016, 178-179, 231–259. [Google Scholar] [CrossRef] [Green Version]
  72. Mimura, N. Sea-level rise caused by climate change and its implications for society. Proc. Jpn. Acad. Ser. B 2013, 89, 281–301. [Google Scholar] [CrossRef] [PubMed] [Green Version]
  73. Al Tanto, T. Deteksi Suhu Permukaan Laut (SPL) Menggunakan Satelit. J. Kelautan Indones. J. Mar. Sci. Technol. 2020, 13, 126–142. (In Indonesian) [Google Scholar] [CrossRef]
  74. Akbari, E.; Alavipanah, S.K.; Jeihouni, M.; Hajeb, M.; Haase, D.; Alavipanah, S. A Review of Ocean/Sea Subsurface Water Temperature Studies from Remote Sensing and Non-Remote Sensing Methods. Water 2017, 9, 936. [Google Scholar] [CrossRef] [Green Version]
  75. Girjatowicz, J.P.; Świątek, M. Effects of atmospheric circulation on water temperature along the southern Baltic Sea coast. Oceanologia 2018, 61, 38–49. [Google Scholar] [CrossRef]
  76. Norouzi, N. Climate change impacts on the water flow to the reservoir of the Dez Dam basin. Water Cycle 2020, 1, 113–120. [Google Scholar] [CrossRef]
  77. Cañedo-Argüelles, M.; Kefford, B.; Schäfer, R. Salt in freshwaters: Causes, effects and prospects-introduction to the theme issue. Philos. Trans. R. Soc. B Biol. Sci. 2019, 374, 20180002. [Google Scholar] [CrossRef]
  78. Zhou, F.; Lu, X.; Chen, F.; Zhu, Q.; Meng, Y.; Chen, C.; Lao, Q.; Zhang, S. Spatial-Monthly variations and influencing factors of dissolved oxygen in surface water of Zhanjiang Bay, China. J. Mar. Sci. Eng. 2020, 8, 403. [Google Scholar] [CrossRef]
  79. Bahiyah, A.; Wirasatriya, A.; Marwoto, J.; Handoyo, G.; Anugrah, D.S.P.A. Study of Seasonal Variation of Sea Surface Salinity in Java Sea and its Surrounding Seas using SMAP Satellite. IOP Conf. Series Earth Environ. Sci. 2019, 246, 12. [Google Scholar] [CrossRef]
  80. Skudra, M.; Lips, U. Characteristics and inter-annual changes in temperature, salinity and density distribution in the Gulf of Riga. Oceanologia 2017, 59, 37–48. [Google Scholar] [CrossRef] [Green Version]
  81. Sidabutar, E.A.; Brawijaya University; Sidabutar, E.A.; Sartimbul, A.; Handayani, M. The distribution of temperature, salinity, and dissolved oxygen to depth in the waters of the Prigi Bay, Trenggalek Regency. JFMR-J. Fish. Mar. Res. 2019, 3, 46–52. [Google Scholar] [CrossRef]
  82. Folorunso, A.F. Mapping a spatial salinity flow from seawater to groundwater using electrical resistivity topography techniques. Sci. Afr. 2021, 13, e00957. [Google Scholar] [CrossRef]
  83. Boyd, C.E. Pond water aeration systems. Aquac. Eng. 1998, 18, 9–40. [Google Scholar] [CrossRef]
  84. Dijkstra, P.; Thomas, S.C.; Heinrich, P.L.; Koch, G.W.; Schwartz, E.; Hungate, B.A. Effect of temperature on metabolic activity of intact microbial communities: Evidence for altered metabolic pathway activity but not for increased maintenance respiration and reduced carbon use efficiency. Soil Biol. Biochem. 2011, 43, 2023–2031. [Google Scholar] [CrossRef]
  85. Ospina-Álvarez, N.; Prego, R.; Alvarez, I.; DeCastro, M.; Alvarez-Ossorio, M.; Pazos, Y.; Campos, M.; Bernárdez, P.; Garcia-Soto, C.; Gomez-Gesteira, M.; et al. Oceanographical patterns during a summer upwelling–downwelling event in the Northern Galician Rias: Comparison with the whole Ria system (NW of Iberian Peninsula). Cont. Shelf Res. 2010, 30, 1362–1372. [Google Scholar] [CrossRef] [Green Version]
  86. Pauly, D. The gill-oxygen limitation theory (GOLT) and its critics. Sci. Adv. 2021, 7, eabc6050. [Google Scholar] [CrossRef]
  87. Yin, Z.; Wang, Y.; Liu, Y.; Gao, C.; Zhang, H. Laboratory Investigation on Hydrodynamic Performance of an Innovative Aeration Device with a Wave-Driven Heaving Buoy. Energies 2018, 11, 3262. [Google Scholar] [CrossRef] [Green Version]
  88. Comfort, C.M.; Walker, G.O.; McManus, M.A.; Fujimura, A.G.; Ostrander, C.E.; Donaldson, T.J. Physical dynamics of the reef flat, channel, and fore reef areas of a fringing reef embayment: An oceanographic study of Pago Bay, Guam. Reg. Stud. Mar. Sci. 2019, 31, 100740. [Google Scholar] [CrossRef]
  89. Marzuki, I.; Pratama, I.; Ismail, H.E.; Paserangi, I.; Kamaruddin, M.; Chaerul, M.; Ahmad, R. The Identification and Distribution Components of Polycyclic Aromatic Hydrocarbon Contaminants at the Port of Paotere, Makassar, South Sulawesi. In Proceedings of the IOP Conference Series: Earth and Environmental Science, Surabaya, Indonesia, 11 September 2020; IOP Publishing: Bristol, UK, 2021; Volume 679, p. 012017. [Google Scholar]
  90. Yang, X.E.; Wu, X.; Hao, H.L.; He, Z.L. Mechanisms and assessment of water eutrophication. J. Zhejiang Univ. Sci. B 2008, 9, 197–209. [Google Scholar] [CrossRef]
  91. Hlordzi, V.; Kuebutornye, F.K.; Afriyie, G.; Abarike, E.D.; Lu, Y.; Chi, S.; Anokyewaa, M.A. The use of Bacillus species in maintenance of water quality in aquaculture: A review. Aquac. Rep. 2020, 18, 100503. [Google Scholar] [CrossRef]
  92. Olanrewaju, O.S.; Tee, K.F.; Kader, A.S.A. Water quality test and site selection for suitable species for seaweed farm in east coast of Malaysia. Biosci. Biotechnol. Res. Asia 2015, 12, 33–39. [Google Scholar] [CrossRef]
  93. Seghetta, M.; Tørring, D.; Bruhn, A.; Thomsen, M. Bioextraction potential of seaweed in Denmark—An instrument for circular nutrient management. Sci. Total Environ. 2016, 563-564, 513–529. [Google Scholar] [CrossRef] [PubMed] [Green Version]
  94. McIsaac, G. Surface water pollution by nitrogen fertilizers. Encycl. Water Sci. 2003, 2003, 950–955. [Google Scholar] [CrossRef]
  95. Velthof, G.; van Bruggen, C.; Groenestein, C.; de Haan, B.; Hoogeveen, M.; Huijsmans, J. A model for inventory of ammonia emissions from agriculture in the Netherlands. Atmos. Environ. 2012, 46, 248–255. [Google Scholar] [CrossRef]
  96. Wurtsbaugh, W.A.; Paerl, H.W.; Dodds, W.K. Nutrients, eutrophication and harmful algal blooms along the freshwater to marine continuum. WIREs Water 2019, 6. [Google Scholar] [CrossRef]
  97. Lestari, H.A.; Samawi, M.F.; Faizal, A.; Moore, A.M.; Jompa, J. Physical and chemical parameters of estuarine waters around south Sulawesi. Indones. J. Geogr. 2021, 53, 373–387. [Google Scholar] [CrossRef]
  98. Yang, Y.-F.; Fei, X.-G.; Song, J.-M.; Hu, H.-Y.; Wang, G.-C.; Chung, I.K. Growth of Gracilaria lemaneiformis under different cultivation conditions and its effects on nutrient removal in Chinese coastal waters. Aquaculture 2006, 254, 248–255. [Google Scholar] [CrossRef]
  99. Tsagkamilis, P.; Danielidis, D.; Dring, M.J.; Katsaros, C. Removal of phosphate by the green seaweed Ulva lactuca in a small-scale sewage treatment plant (Ios Island, Aegean Sea, Greece). J. Appl. Phycol. 2009, 22, 331–339. [Google Scholar] [CrossRef]
  100. Roleda, M.Y.; Hurd, C.L. Seaweed nutrient physiology: Application of concepts to aquaculture and bioremediation. Phycol. 2019, 58, 552–562. [Google Scholar] [CrossRef] [Green Version]
  101. Guignard, M.S.; Leitch, A.R.; Acquisti, C.; Eizaguirre, C.; Elser, J.J.; Hessen, D.O.; Jeyasingh, P.D.; Neiman, M.; Richardson, A.E.; Soltis, P.S.; et al. Impacts of Nitrogen and Phosphorus: From Genomes to Natural Ecosystems and Agriculture. Front. Ecol. Evol. 2017, 5, 70. [Google Scholar] [CrossRef] [Green Version]
  102. Rusli, M.; Chaerul, M.; Marzuki, I. Adaptation of climate change to vulnerability of raw water availability in Bantaeng, South Sulawesi. J. Phys. Conf. Ser. 2021, 1899, 012062. [Google Scholar] [CrossRef]
  103. Douglas, E.; Haggitt, T.; Rees, T. Supply-and demand-driven phosphate uptake and tissue phosphorus in temperate seaweeds. Aquat. Biol. 2014, 23, 49–60. [Google Scholar] [CrossRef]
  104. Douglas, E.; Haggitt, T.; Rees, T. Relationship between tissue phosphorus and seawater phosphate in the brown alga Hormosira banksii. N. Z. J. Mar. Freshw. Res. 2014, 49, 64–68. [Google Scholar] [CrossRef]
  105. Lourenço, S.O.; Barbarino, E.; Nascimento, A.; Freitas, J.N.P.; Diniz, G.S. Tissue nitrogen and phosphorus in seaweeds in a tropical eutrophic environment: What a long-term study tells us. Eighteenth Int. Seaweed Symp. 2008, 1, 163–172. [Google Scholar] [CrossRef]
  106. Ali, H.; Khan, E.; Ilahi, I. Environmental Chemistry and Ecotoxicology of Hazardous Heavy Metals: Environmental Persistence, Toxicity, and Bioaccumulation. J. Chem. 2019, 2019, 6730305. [Google Scholar] [CrossRef] [Green Version]
  107. Diaz, O.; Reddy, K.; Moore, P. Solubility of inorganic phosphorus in stream water as influenced by pH and calcium concentration. Water Res. 1994, 28, 1755–1763. [Google Scholar] [CrossRef]
  108. Nurjaya, I.W.; Surbakati, H.; Natih, N.M.N. Model of Total Suspended Solid (TSS) distribution due to coastal mining in Western Coast of Kundur Island part of Berhala Strait. In Proceedings of the IOP Conference Series: Earth and Environmental Science, Bogor, Indonesia, 9–10 October 2018; IOP Publishing: Bristol, UK, 2019; Volume 278, p. 012056. [Google Scholar]
  109. Raposa, K.B.; Wasson, K.; Smith, E.; Crooks, J.A.; Delgado, P.; Fernald, S.H.; Ferner, M.C.; Helms, A.; Hice, L.A.; Mora, J.W.; et al. Assessing tidal marsh resilience to sea-level rise at broad geographic scales with multi-metric indices. Biol. Conserv. 2016, 204, 263–275. [Google Scholar] [CrossRef] [Green Version]
  110. Wang, C.; Li, W.; Chen, S.; Li, D.; Wang, D.; Liu, J. The spatial and temporal variation of total suspended solid concentration in Pearl River Estuary during 1987–2015 based on remote sensing. Sci. Total Environ. 2018, 618, 1125–1138. [Google Scholar] [CrossRef]
  111. Hiatt, M.; Snedden, G.; Day, J.W.; Rohli, R.; Nyman, J.A.; Lane, R.; Sharp, L.A. Drivers and impacts of water level fluctuations in the Mississippi River delta: Implications for delta restoration. Estuar. Coast. Shelf Sci. 2019, 224, 117–137. [Google Scholar] [CrossRef]
  112. Saiya, H.G.; Katoppo, D.R. Waste management of shrimp farms as starting point to develop integrated farming systems (Case study: Kuwaru Coast, Bantul, Yogyakarta, Indonesia). J. Degraded Min. Lands Manag. 2015, 3, 423–432. [Google Scholar] [CrossRef]
  113. Naylor, R.L.; Hardy, R.W.; Buschmann, A.H.; Bush, S.R.; Cao, L.; Klinger, D.H.; Little, D.C.; Lubchenco, J.; Shumway, S.E.; Troell, M. A 20-year retrospective review of global aquaculture. Nature 2021, 591, 551–563. [Google Scholar] [CrossRef]
  114. McDonald, M.; Tikkanen, C.; Axler, R.; Larsen, C.; Host, G. Fish simulation culture model (FIS-C): A bioenergetics based model for aquacultural wasteload application. Aquac. Eng. 1996, 15, 243–259. [Google Scholar] [CrossRef]
  115. Niklitschek, E.J.; Secor, D.H. Dissolved oxygen, temperature and salinity effects on the ecophysiology and survival of juvenile Atlantic sturgeon in estuarine waters: II. Model development and testing. J. Exp. Mar. Biol. Ecol. 2009, 381, S161–S172. [Google Scholar] [CrossRef]
  116. Stricker, E.M.; Verbalis, J.G. Water and salt intake and body fluid homeostasis. Fundam. Neurosci. 2013, 783–797. [Google Scholar] [CrossRef]
  117. Van Der Lee, G.H.; Kraak, M.H.S.; Verdonschot, R.C.M.; Vonk, J.A.; Verdonschot, P.F.M. Oxygen drives benthic-pelagic decomposition pathways in shallow wetlands. Sci. Rep. 2017, 7, 15051. [Google Scholar] [CrossRef] [PubMed] [Green Version]
  118. Leidonald, R.; Muhtadi, A.; Lesmana, I.; Harahap, Z.A.; Rahmadya, A. Profiles of temperature, salinity, dissolved oxygen, and pH in Tidal Lakes. IOP Conf. Series Earth Environ. Sci. 2019, 260, 012075. [Google Scholar] [CrossRef]
  119. Seitz, R.D.; Dauer, D.M.; Llansó, R.J.; Long, W.C. Broad-scale effects of hypoxia on benthic community structure in Chesapeake Bay, USA. J. Exp. Mar. Biol. Ecol. 2009, 381, S4–S12. [Google Scholar] [CrossRef]
  120. Friedrich, J.; Janssen, F.; Aleynik, D.; Bange, H.W.; Boltacheva, N.; Çagatay, M.N.; Dale, A.W.; Etiope, G.; Erdem, Z.; Geraga, M.; et al. Investigating hypoxia in aquatic environments: Diverse approaches to addressing a complex phenomenon. Biogeosciences 2014, 11, 1215–1259. [Google Scholar] [CrossRef] [Green Version]
  121. Kurniawan, R.; Habibie, M.N.; Suratno, S. Monthly ocean waves variation over Indonesia. J. Meteorol. dan Geofis. 2011, 12, 221–232. (In Indonesian) [Google Scholar] [CrossRef]
  122. Walker, P.J.; Winton, J.R. Emerging viral diseases of fish and shrimp. Veter-Res. 2010, 41, 51. [Google Scholar] [CrossRef] [Green Version]
  123. Furtado, P.S.; Campos, B.R.; Serra, F.P.; Klosterhoff, M.; Romano, L.A.; Wasielesky, W. Effects of nitrate toxicity in the Pacific white shrimp, Litopenaeus vannamei, reared with biofloc technology (BFT). Aquac. Int. 2014, 23, 315–327. [Google Scholar] [CrossRef]
  124. Hughes, G.M.; Morgan, M. The structure of fish gills in relation to their respiratory function. Biol. Rev. Camb. Philos. Soc. 2008, 48, 419–475. [Google Scholar] [CrossRef]
  125. Henry, R.P.; Lucu, Č.; Onken, H.; Weihrauch, D. Multiple functions of the crustacean gill: Osmotic/ionic regulation, acid-base balance, ammonia excretion, and bioaccumulation of toxic metals. Front. Physiol. 2012, 3, 431. [Google Scholar] [CrossRef] [PubMed] [Green Version]
  126. Zhao, M.; Yao, D.; Li, S.; Zhang, Y.; Aweya, J.J. Effects of ammonia on shrimp physiology and immunity: A review. Rev. Aquac. 2020, 12, 2194–2211. [Google Scholar] [CrossRef]
  127. Abakari, G.; Luo, G.; Kombat, E.O. Dynamics of nitrogenous compounds and their control in biofloc technology (BFT) systems: A review. Aquac. Fish. 2020, 6, 4414–4447. [Google Scholar] [CrossRef]
  128. Nkuba, A.C.; Mahasri, G.; Lastuti, N.D.R.; Mwendolwa, A.A. Correlation of Nitrite and Ammonia with Prevalence of Enterocytozoon hepatopenaei (EHP) in Shrimp (Litopenaeus vannamei) on Several Super-Intensive Ponds in East Java, Indonesia. J. Ilm. Perikan. dan Kelaut. 2021, 13, 58–67. [Google Scholar] [CrossRef]
  129. Yao, S.; Lyu, S.; An, Y.; Lu, J.; Gjermansen, C.; Schramm, A. Microalgae-bacteria symbiosis in microalgal growth and biofuel production: A review. J. Appl. Microbiol. 2019, 126, 359–368. [Google Scholar] [CrossRef]
  130. Han, P.; Lu, Q.; Fan, L.; Zhou, W. A Review on the Use of Microalgae for Sustainable Aquaculture. Appl. Sci. 2019, 9, 2377. [Google Scholar] [CrossRef] [Green Version]
  131. Padmavathi, P.; Sunitha, K.; Veeraiah, K. Efficacy of probiotics in improving water quality and bacterial flora in fish ponds. Afr. J. Microbiol. Res. 2012, 6, 7471–7478. [Google Scholar] [CrossRef]
  132. Marzuki, I.; Ali, M.Y.; Syarif, H.U.; Gusty, S.; Daris, L.; Nisaa, K. Investigation of Biodegradable Bac-te-ria as Bio indicators of the Presence of PAHs Contaminants in Marine Waters in the Marine Tourism Area of Makassar City. IOP Conf. Ser. Earth Environ. Sci. 2021, 750, 012006. [Google Scholar] [CrossRef]
  133. Dunn, J.G.; Sammarco, P.W.; LaFleur, G. Effects of phosphate on growth and skeletal density in the scleractinian coral Acropora muricata: A controlled experimental approach. J. Exp. Mar. Biol. Ecol. 2012, 411, 34–44. [Google Scholar] [CrossRef]
  134. Loya, Y.; Lubinevsky, H.; Rosenfeld, M.; Kramarsky-Winter, E. Nutrient enrichment caused by in situ fish farms at Eilat, Red Sea is detrimental to coral reproduction. Mar. Pollut. Bull. 2004, 49, 344–353. [Google Scholar] [CrossRef] [PubMed]
  135. DeGeorges, A.; Goreau, T.J.; Reilly, B. Land-Sourced pollution with an emphasis on domestic sewage: Lessons from the caribbean and implications for coastal development on Indian Ocean and Pacific coral reefs. Sustainability 2010, 2, 2919–2949. [Google Scholar] [CrossRef] [Green Version]
  136. Li, R.H.; Liu, S.M.; Li, Y.W.; Zhang, G.L.; Ren, J.L.; Zhang, J. Nutrient dynamics in tropical rivers, estuarine-lagoons, and coastal ecosystems along the eastern Hainan Island. Biogeosciences Discuss. 2013, 10, 9091–9147. [Google Scholar] [CrossRef] [Green Version]
  137. Mustafa, M.; Sugama, K.; Syah, R.; Kusnendar, E.; Paena, M.; Muliawan, I.; Suwoyo, H.S.; Asaad, A.I.J.; Asaf, R.; Ratnawati, E.; et al. Strategy for Development of Availability Pond Sustainable Super-intensive Technology Whiteleg Shrimp in South Sulawesi Province; Fisheries Research Center: Jakarta, Indonesia, 2021; p. 134. (In Indonesian)
  138. Sale, P.F.; Agardy, T.; Ainsworth, C.H.; Feist, B.; Bell, J.D.; Christie, P.; Hoegh-Guldberg, O.; Mumby, P.J.; Feary, D.A.; Saunders, M.I.; et al. Transforming management of tropical coastal seas to cope with challenges of the 21st century. Mar. Pollut. Bull. 2014, 85, 8–23. [Google Scholar] [CrossRef] [PubMed]
Figure 1. Study sites in coastal area of Bonto Bahari (BB), Ujung Loe (UL), and Gantarang (GT) subdistricts, Bulukumba Regency, South Sulawesi, Indonesia (courtesy of La Ode Muhamad Hafizt Akbar, RICAFE).
Sustainability 14 02659 g001
Figure 2. Station sampling and measuring water quality in the coastal area of whiteleg shrimp, Litopenaeus vannamei culture in Bonto Bahari (BB) Subdistrict, Bulukumba Regency, South Sulawesi Province, Indonesia (courtesy of La Ode Muhamad Hafizt Akbar, RICAFE).
Sustainability 14 02659 g002
Figure 3. Station sampling and measuring water quality in the coastal area of whiteleg shrimp, Litopenaeus vannamei culture in Gantarang (GT) Subdistrict, Bulukumba Regency, South Sulawesi Province, Indonesia (courtesy of La Ode Muhamad Hafizt Akbar, RICAFE).
Sustainability 14 02659 g003
Figure 4. Station sampling and measuring water quality as a control in the coastal area of Ujung Loe (UL) Subdistrict, Bulukumba Regency, South Sulawesi Province, Indonesia (courtesy of La Ode Muhamad Hafizt Akbar, RICAFE).
Sustainability 14 02659 g004
Figure 5. Fluctuations in average monthly rainfall in the coastal areas of Bulukumba Regency in the last five years, 2016–2020.
Sustainability 14 02659 g005
Figure 6. Status of water quality in the coastal area of Bulukumba Regency.
Sustainability 14 02659 g006
Table 1. Performance of intensive technology whiteleg shrimp aquaculture ponds.
VariableBB LocationGT Location
Pond constructionHDPEHDPE
Total land area (ha)20.00–40.003.50–45.00
Reservoir area (ha)0.29–2.000.50
WWTP area (ha)0.15–1.500.35–1.00
Number of ponds (unit)19–347–48
Pond area (m2)1600–40001900–5000
Total pond area (ha)4.39–12.242.60–17.28
WWTP pond volume to total pond (%)3.42–15.825.21–13.46
Stocking density (ind/m2)110–150100–220
Productivity (ton/ha/cycle)17.5–44.4 13.9–30.0
Feed conversion ratio1.2:1–1.7:11.4:1
Table 2. Production potential and estimated effluent load from intensive technology whiteleg shrimp aquaculture ponds.
SubdistrictIntensive Pond Area (ha)Number of Ponds (Unit)Total Area of Ponds (ha)Production Potential (Ton/Year)Estimated Feed (Ton/Year)Estimated Waste Load
ton N/Yearton P/Year
BB37.007826.111615235128.336.69
GT32.609034.551578220927.686.53
Total69.6016860.663193456056.0113.22
Table 3. Descriptive statistics and significance of water quality in coastal areas of intensive technology whiteleg shrimp aquaculture ponds in Bonto Bahari (BB) Subdistrict.
VariableMean ± SDSig.
Before Stocking/Initial of Culture (Rainy Season)End of Culture/After Harvesting (Dry Season)
Temperature (°C)28.59 ± 0.1828.14 ± 0.220.000 **
Salinity (ppt)33.870 ± 0.06838.493 ± 0.6160.000 **
pH8.504 ± 0.1168.086 ± 0.0510.000 **
Dissolved oxygen (mg/L)8.209 ± 0.5415.214 ± 0.6960.000 **
Ammonia (mg/L)0.08504 ± 0.020680.13616 ± 0.029790.000 **
Nitrate (mg/L)0.0001 ± 0.00000.13966 ± 0.052060.000 **
Nitrite (mg/L)0.02006 ± 0.019720.00020 ± 0.000290.000 **
Phosphate (mg/L)0.06622 ± 0.019450.03586 ± 0.042850.002 **
Total suspended solids (mg/L)22.6 ± 15.79.3 ± 3.00.000 **
Total organic matter (mg/L)67.126 ± 9.66331.257 ± 15.7970.000 **
**: significantly different.
Table 4. Descriptive statistics and significance of water quality in coastal areas of intensive technology whiteleg shrimp aquaculture ponds in Gantarang (GT) Subdistrict.
VariableMean ± SDSig.
Before Stocking/Initial of Culture (Rainy Season)End of Culture/
After Harvesting
(Dry Season)
Temperature (°C)28.84 ± 0.3128.43 ± 0.320.009 **
Salinity (ppt)33.566 ± 0.20036.404 ± 0.5710.000 **
pH8.393 ± 0.0948.320 ± 0.0330.015 *
Dissolved oxygen (mg/L)7.089 ± 0.6735.827 ± 0.6480.000 **
Ammonia (mg/L)0.09722 ± 0.026790.14769 ± 0.066670.052 ns
Nitrate (mg/L)0.00031 ± 0.000630.27675 ± 0.129650.000 **
Nitrite (mg/L)0.02782 ± 0.012720.00348 ± 0.007850.000 **
Phosphate (mg/L)0.09993 ± 0.100770.09167 ± 0.069660.902 ns
Total suspended solids (mg/L)30.6 ± 8.120.5 ± 8.00.009 **
Total organic matter (mg/L)66.295 ± 7.74336.751 ± 12.9480.000 **
*: significantly different, **: very significantly different, ns: not significant.
Table 5. Descriptive statistics and significance of water quality in coastal areas of intensive technology whiteleg shrimp ponds before stocking/initial of culture (rainy season).
VariableMean ± SD
BB Location *GT Location *UL Location (Control)
Temperature (°C)28.59 a ± 0.1828.84 b ± 0.3128.42 ± 0.57
Salinity (ppt)33.870 b ± 0.06833.566 a ± 0.20033.610 ± 0.060
pH8.504 b ± 0.1168.393 a ± 0.0948.404 ± 0.057
Dissolved oxygen (mg/L)8.209 b ± 0.5417.089 a ± 0.6737.476 ± 0.232
Ammonia (mg/L)0.08504 a ± 0.020680.09722 a ± 0.026790.06712 ± 0.04303
Nitrate (mg/L)0.00010 a ± 0.000000.00031 a ± 0.000630.00010 ± 0.00000
Nitrite (mg/L)0.02006 a ± 0.019720.02782 a ± 0.012720.01277 ± 0.00936
Phosphate (mg/L)0.06622 a ± 0.019450.09993 b ± 0.100770.05138 ± 0.02314
Total suspended solids (mg/L)22.6 a ± 15.730.6 a ± 8.130.1 ± 7.8
Total organic matter (mg/L)67.126 a ± 9.66366.295 a ± 7.74355.440 ± 9.464
*: the same superscript letters indicate statistically not significant differences (p > 0.05).
Table 6. Descriptive statistics and significance of water quality in coastal areas of intensive technology whiteleg shrimp ponds at the end of culture/after harvesting (dry season).
VariableMean ± SD
BB Location *GT Location *UL Location (Control)
Temperature (°C)28.14 a ± 0.2228.43 b ± 0.3228.41 ± 0.67
Salinity (ppt)38.493 b ± 0.61636.404 a ± 0.57136.054 ± 0.298
pH8.086 a ± 0.0518.320 b ± 0.0338.232 ± 0.280
Disssolved oxygen (mg/L)5.214 a ± 0.6965.827 b ± 0.6486.338 ± 0.618
Ammonia (mg/L)0.13616 a ± 0.029790.14769 a ± 0.066670.08127 ± 0.03903
Nitrate (mg/L)0.13966 a ± 0.052060.27675 b ± 0.129650.00173 ± 0.00190
Nitrite (mg/L)0.00020 a ± 0.000290.00348 a ± 0.007850.00626 ± 0.00590
Phosphate (mg/L)0.03586 a ± 0.042850.09167 b ± 0.069660.01339 ± 0.01702
Total suspended solids (mg/L)9.3 a ± 3.020.5 b ± 8.020.3 ± 3.4
Total organic matter (mg/L)31.257 a ± 15.79736.751 a ± 12.94835.820 ± 8.205
*: the same superscript letters indicate statistically insignificant differences (p > 0.05).
Table 7. The average value of water quality on transects parallel to the coastline in Bonto Bahari (BB) and Gantarang (GT) subdistricts at different seasons.
Location/TimeVariableTransect ATransect BTransect C
BB Location:
Before stocking/initial of culture (rainy season)Temperature (°C)28.6128.6127.69
Salinity (ppt)33.89733.90834.078
pH8.4738.4858.520
Dissolved oxygen (mg/L)7.9498.1268.115
Ammonia (mg/L)0.112390.077240.07300
Nitrate (mg/L)0.000100.000100.00010
Nitrite (mg/L)0.022190.020880.01398
Phosphate (mg/L)0.088730.065260.06666
Total suspended solids (mg/L)30.020.127.6
Total organic matter (mg/L67.94762.89761.069
End of culture/after harvesting (dry season)Temperature (°C)28.1328.0928.90
Salinity (ppt)38.27138.33738.466
pH8.0808.1068.386
Dissolved oxygen (mg/L)5.0785.2295.628
Ammonia (mg/L)0.137700.136660.12181
Nitrate (mg/L)0.167680.142960.14306
Nitrite (mg/L)0.004930.000370.00029
Phosphate (mg/L)0.074850.022080.05032
Total suspended solids (mg/L)12.511.710.2
Total organic matter (mg/L)33.70430.82635.345
GT Location:
Before stocking/initial of culture (rainy season)Temperature (°C)29.0828.8628.62
Salinity (ppt)33.55233.59633.651
pH8.3788.4208.432
Dissolved oxygen (mg/L)7.2607.5747.200
Ammonia (mg/L)0.109710.105100.06411
Nitrate (mg/L)0.000580.000100.00010
Nitrite (mg/L)0.035960.029630.01977
Phosphate (mg/L)0.119230.090600.06556
Total suspended solids (mg/L)30.428.921.9
Total organic matter (mg/L)70.70462.69566.785
End of culture/after harvesting (dry season)Temperature (°C)28.8328.5128.47
Salinity (ppt)37.12037.30937.318
pH8.2478.3038.309
Dissolved oxygen (mg/L)5.7466.1505.948
Ammonia (mg/L)0.171740.143650.14248
Nitrate (mg/L)0.340210.266590.26543
Nitrite (mg/L)0.002220.009200.00131
Phosphate (mg/L)0.074050.105130.07306
Total suspended solids (mg/L)36.321.434.8
Total organic matter (mg/L)43.56738.62634.754
Table 8. The average value of water quality on transects perpendicular to the coastline in Bonto Bahari (BB) and Gantarang (GT) subdistricts at different seasons.
Location/TimeVariableTransect I-IITransect III-IVTransect V-VITransect VII-VIIITransect IX-XTransect XI-XII
BB Location:
Before stocking/initial of culture (rainy season)Temperature (°C)27.3828.4228.6328.7728.6728.67
Salinity (ppt)34.18333.84033.91733.92233.90333.835
pH8.3128.4578.5958.5828.5128.565
Dissolved oxygen (mg/L)7.0308.3728.2208.0428.1628.790
Ammonia (mg/L)0.092450.081700.082900.074280.093380.09118
Nitrate (mg/L)0.000100.000100.000100.000100.000100.00010
Nitrite (mg/L)0.015820.019180.024620.017480.007950.01537
Phosphate (mg/L)0.066770.063480.073300.079600.083800.05930
Total suspended solids (mg/L)15.330.714.323.025.831.8
Total organic matter (mg/L)60.25765.12766.93166.06567.06761.581
End of culture/after harvesting (dry season)Temperature (°C)28.0728.0328.0528.0728.0828.13
Salinity (ppt)37.71038.66239.20538.66838.16237.797
pH8.0858.0578.0638.0988.0978.148
Dissolved oxygen (mg/L)5.4325.0274.6835.4105.6285.922
Ammonia (mg/L)0.109820.134250.132850.132570.131580.14295
Nitrate (mg/L)0.181650.144220.144400.148220.133870.11382
Nitrite (mg/L)0.000100.000730.000570.005570.000100.00010
Phosphate (mg/L)0.027520.052900.021520.075910.012490.03123
Total suspended solids (mg/L)9.810.011.29.713.513.5
Total organic matter (mg/L)47.72341.20515.70929.48434.88628.942
GT Location:
Before stocking/initial of culture (rainy season)Temperature (°C)28.4028.4728.4728.3028.2328.17
Salinity (ppt)33.61033.61033.58033.66333.68333.520
pH8.4408.4438.4138.3808.4608.393
Dissolved oxygen (mg/L)6.7436.6436.8737.3538.2137.677
Ammonia (mg/L)0.095800.097500.098370.073400.099430.08573
Nitrate (mg/L)0.000100.000100.000730.000100.000100.00010
Nitrite (mg/L)0.036230.019630.021930.028700.035970.02287
Phosphate (mg/L)0.168730.066000.077370.055000.061130.05493
Total suspended solids (mg/L)34.324.027.423.722.327.0
Total organic matter (mg/L)66.81667.33870.67572.21866.50355.763
End of culture/after harvesting (dry season)Temperature (°C)28.0728.0328.0528.8528.7328.78
Salinity (ppt)37.71037.66237.20536.69836.21236.252
pH8.0858.0578.0688.3108.2508.285
Dissolved oxygen (mg/L)5.4325.0274.6835.7335.8626.317
Ammonia (mg/L)0.109820.134250.132850.143670.169700.15195
Nitrate (mg/L)0.181650.144220.144400.311320.367950.32338
Nitrite (mg/L)0.000100.000730.000570.005550.001870.00283
Phosphate (mg/L)0.027520.052900.021520.142580.086170.06792
Total suspended solids (mg/L)9.810.011.232.523.324.5
Total organic matter (mg/L)47.72341.20515.70945.11639.64137.138
Table 9. Status of water quality in the coastal area of Bonto Bahari Subdistrict (BB).
Measurement TimeScore on LevelTotal ScoreWater Quality Status
MinimumMaximumAverage
Before stocking/initial of culture (rainy season)0−4−12−16Class C or moderate or moderately polluted
End of culture/after harvesting
(dry season)
−12−8−24−44Class D or poor or heavily polluted
Table 10. Status of water quality in the coastal area of Gantarang Subdistrict (GT).
Measurement TimeScore on LevelTotal ScoreWater Quality Status
MinimumMaximumAverage
Before stocking/initial of culture (rainy season)0000Class A or very good or complying quality standard
End of culture/after harvesting
(dry season)
−8−12−36−56Class D or poor or heavily polluted
Publisher’s Note: MDPI stays neutral with regard to jurisdictional claims in published maps and institutional affiliations.

