
Vulnerability Assessment of Target Shrimps and Bycatch Species from Industrial Shrimp Trawl Fishery in the Bay of Bengal, Bangladesh


Abstract
:1. Introduction
2. Materials and Methods
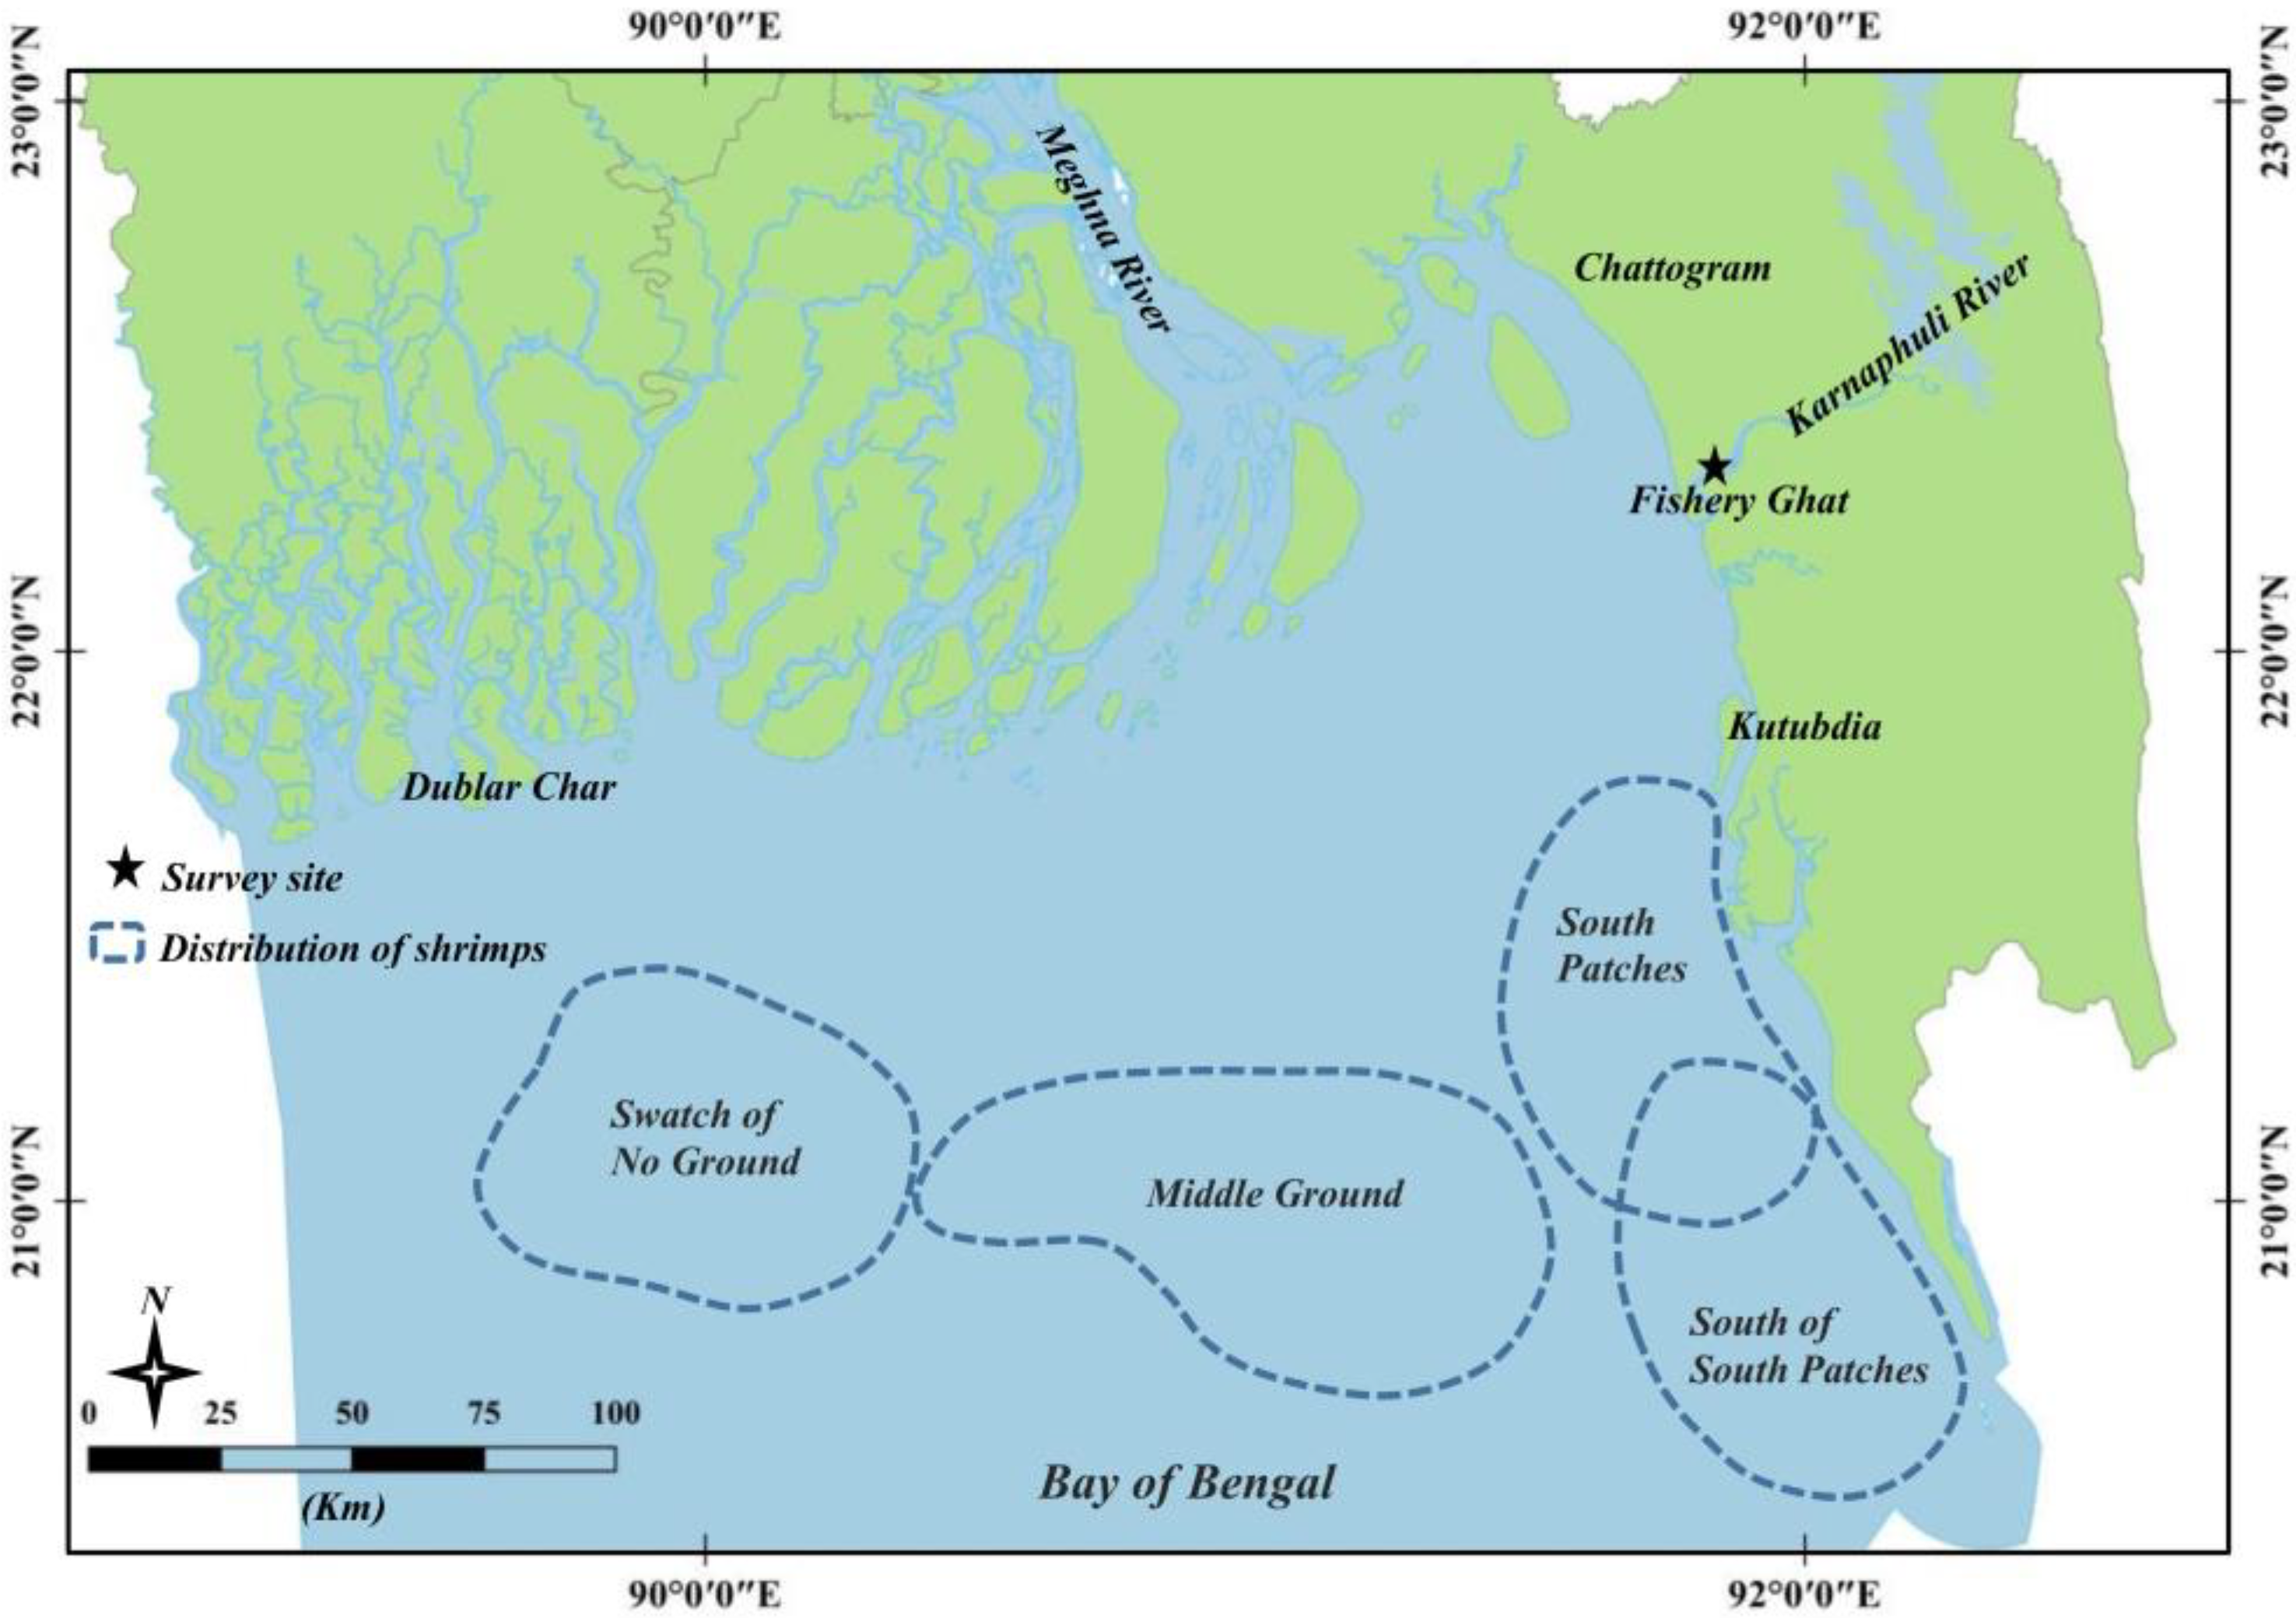
2.1. Shrimp Trawl Fishery
2.2. Species Identification
2.3. Focus Group Discussions
2.4. Productivity Susceptibility Analysis
2.4.1. Selection of Productivity and Susceptibility Attributes and Related Data Collection
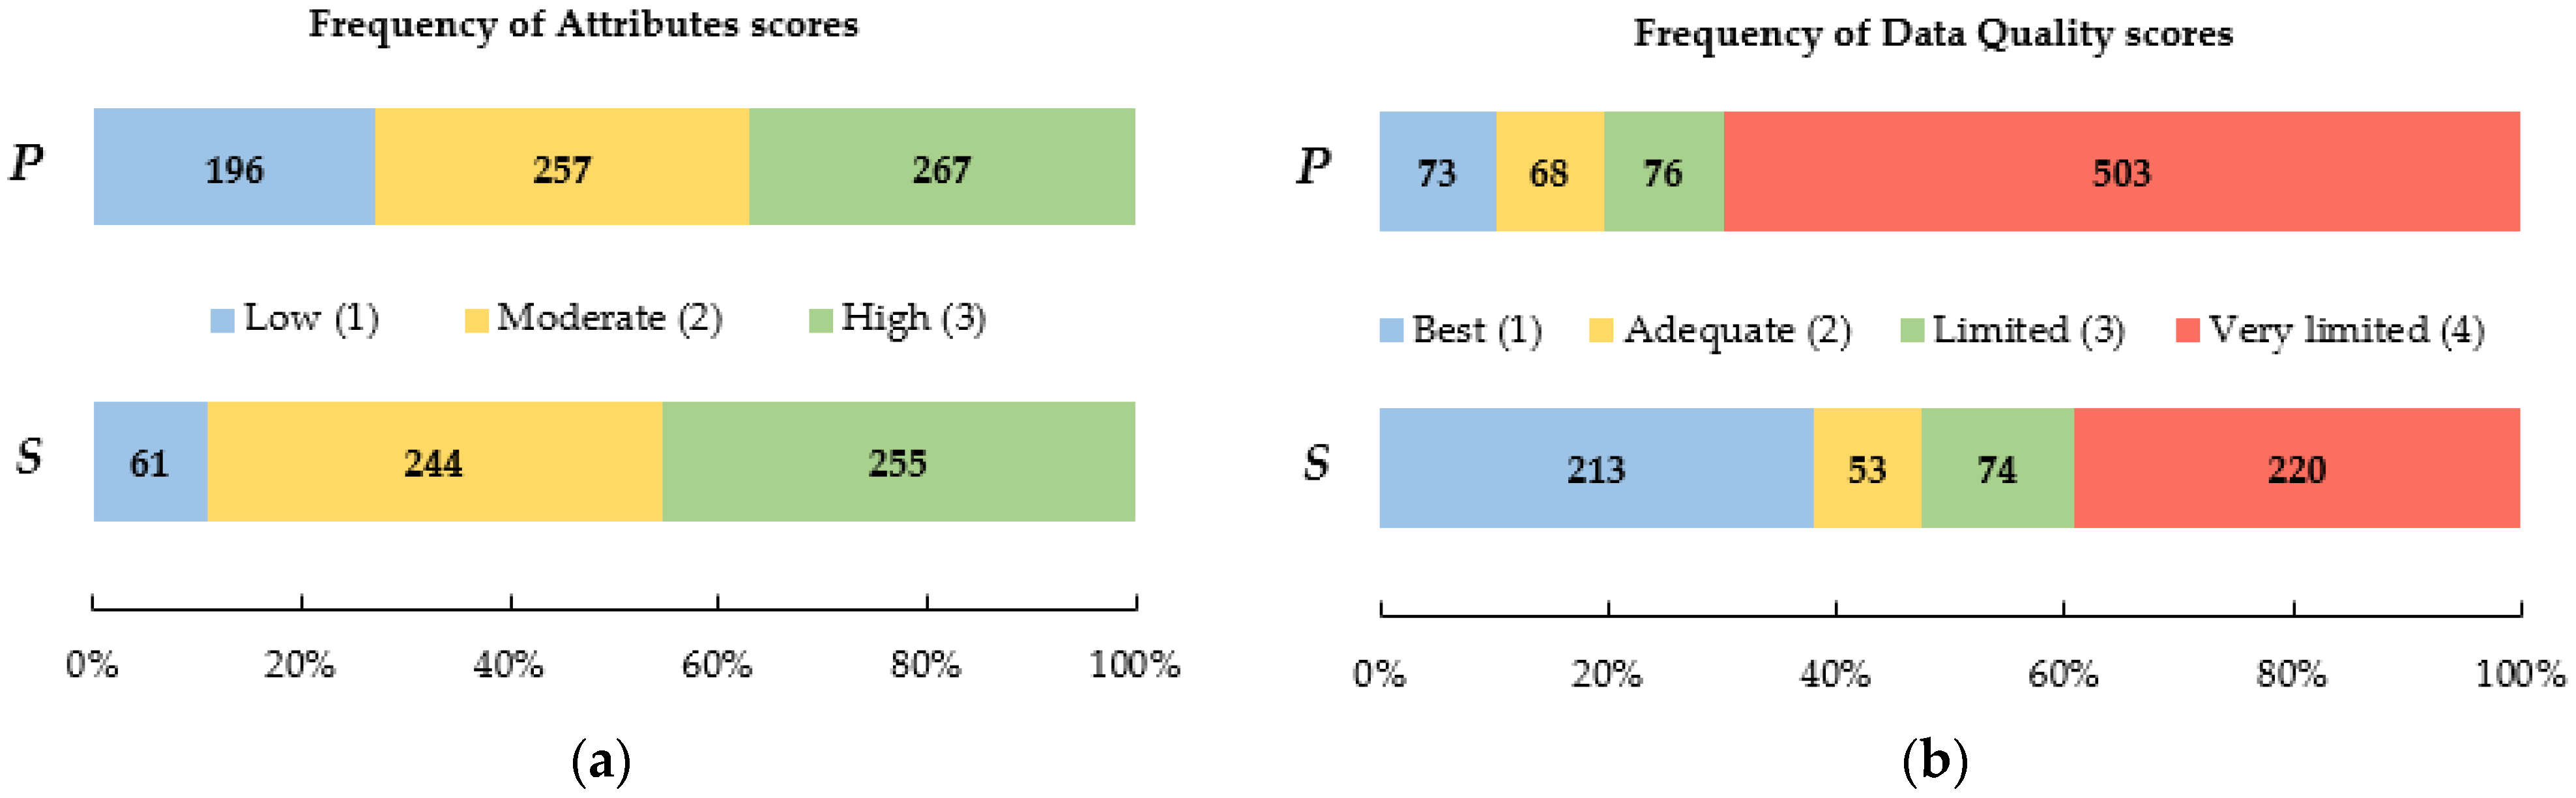
2.4.2. Data Scoring and Weighing
2.4.3. Vulnerability Analysis of the Identified Species
2.4.4. Data Quality Score and Category
2.5. Comparison of Species’ Vulnerability with Other Assessments
3. Results
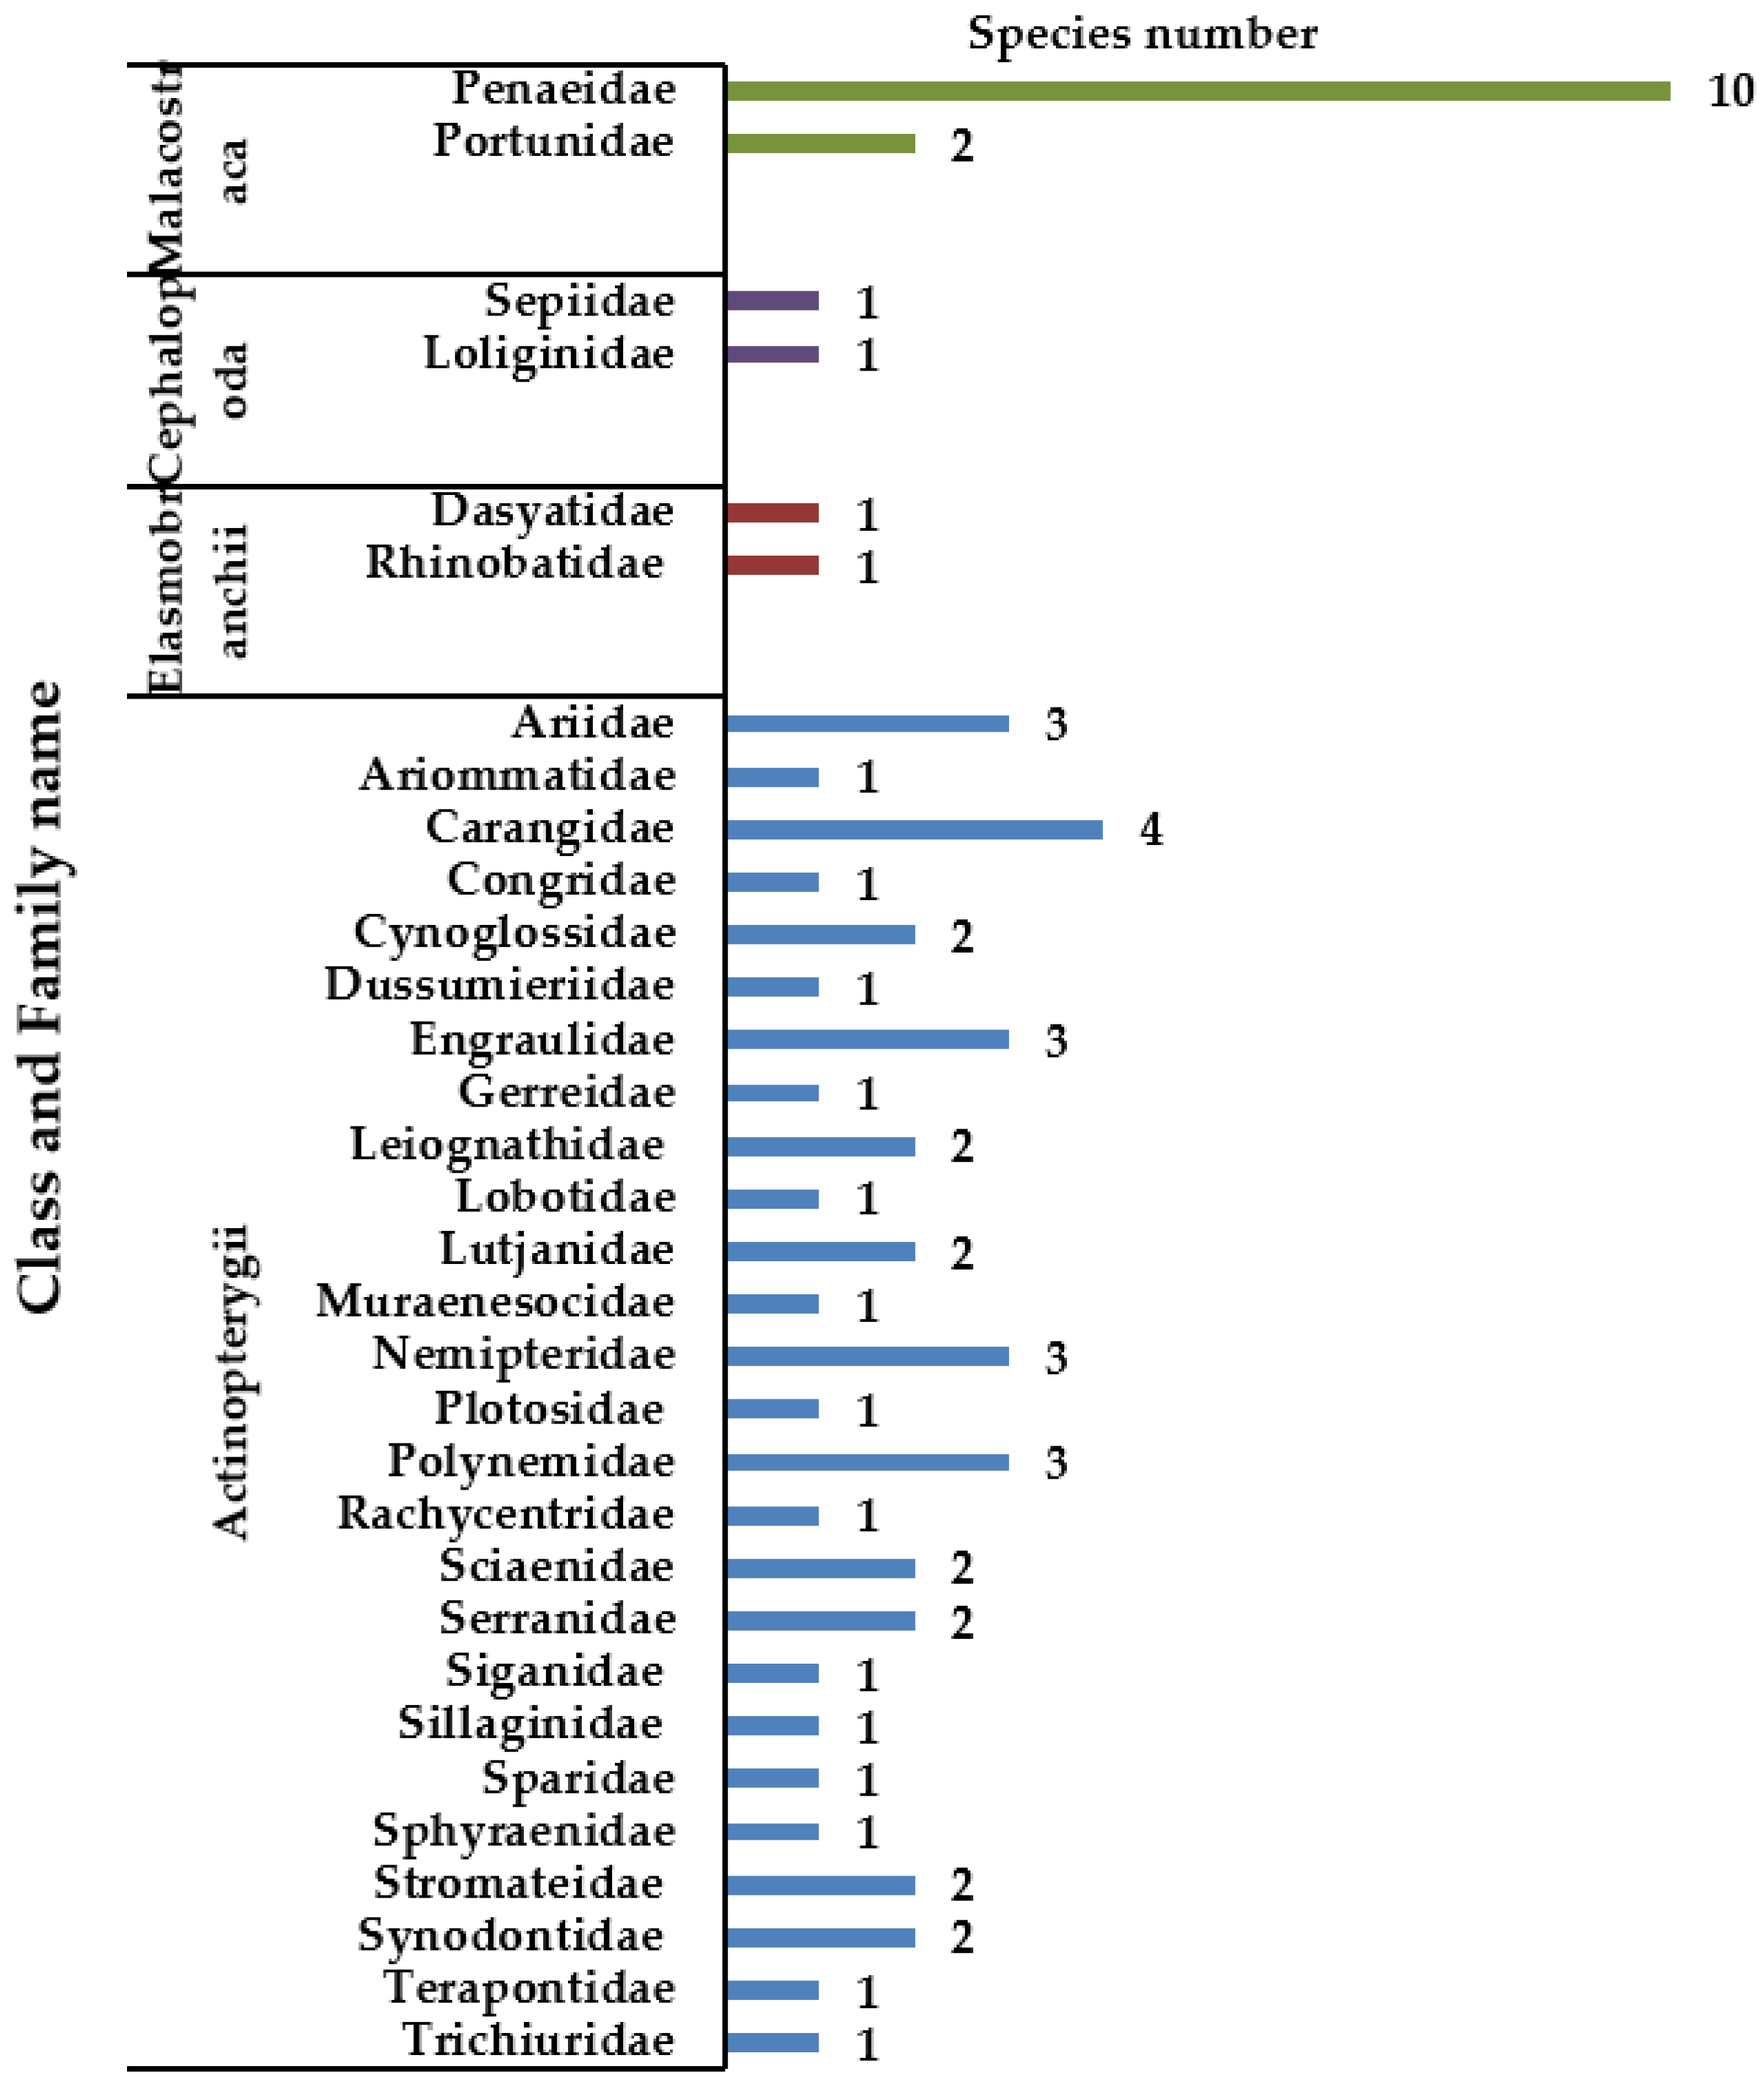
3.1. Composition of the Identified Species
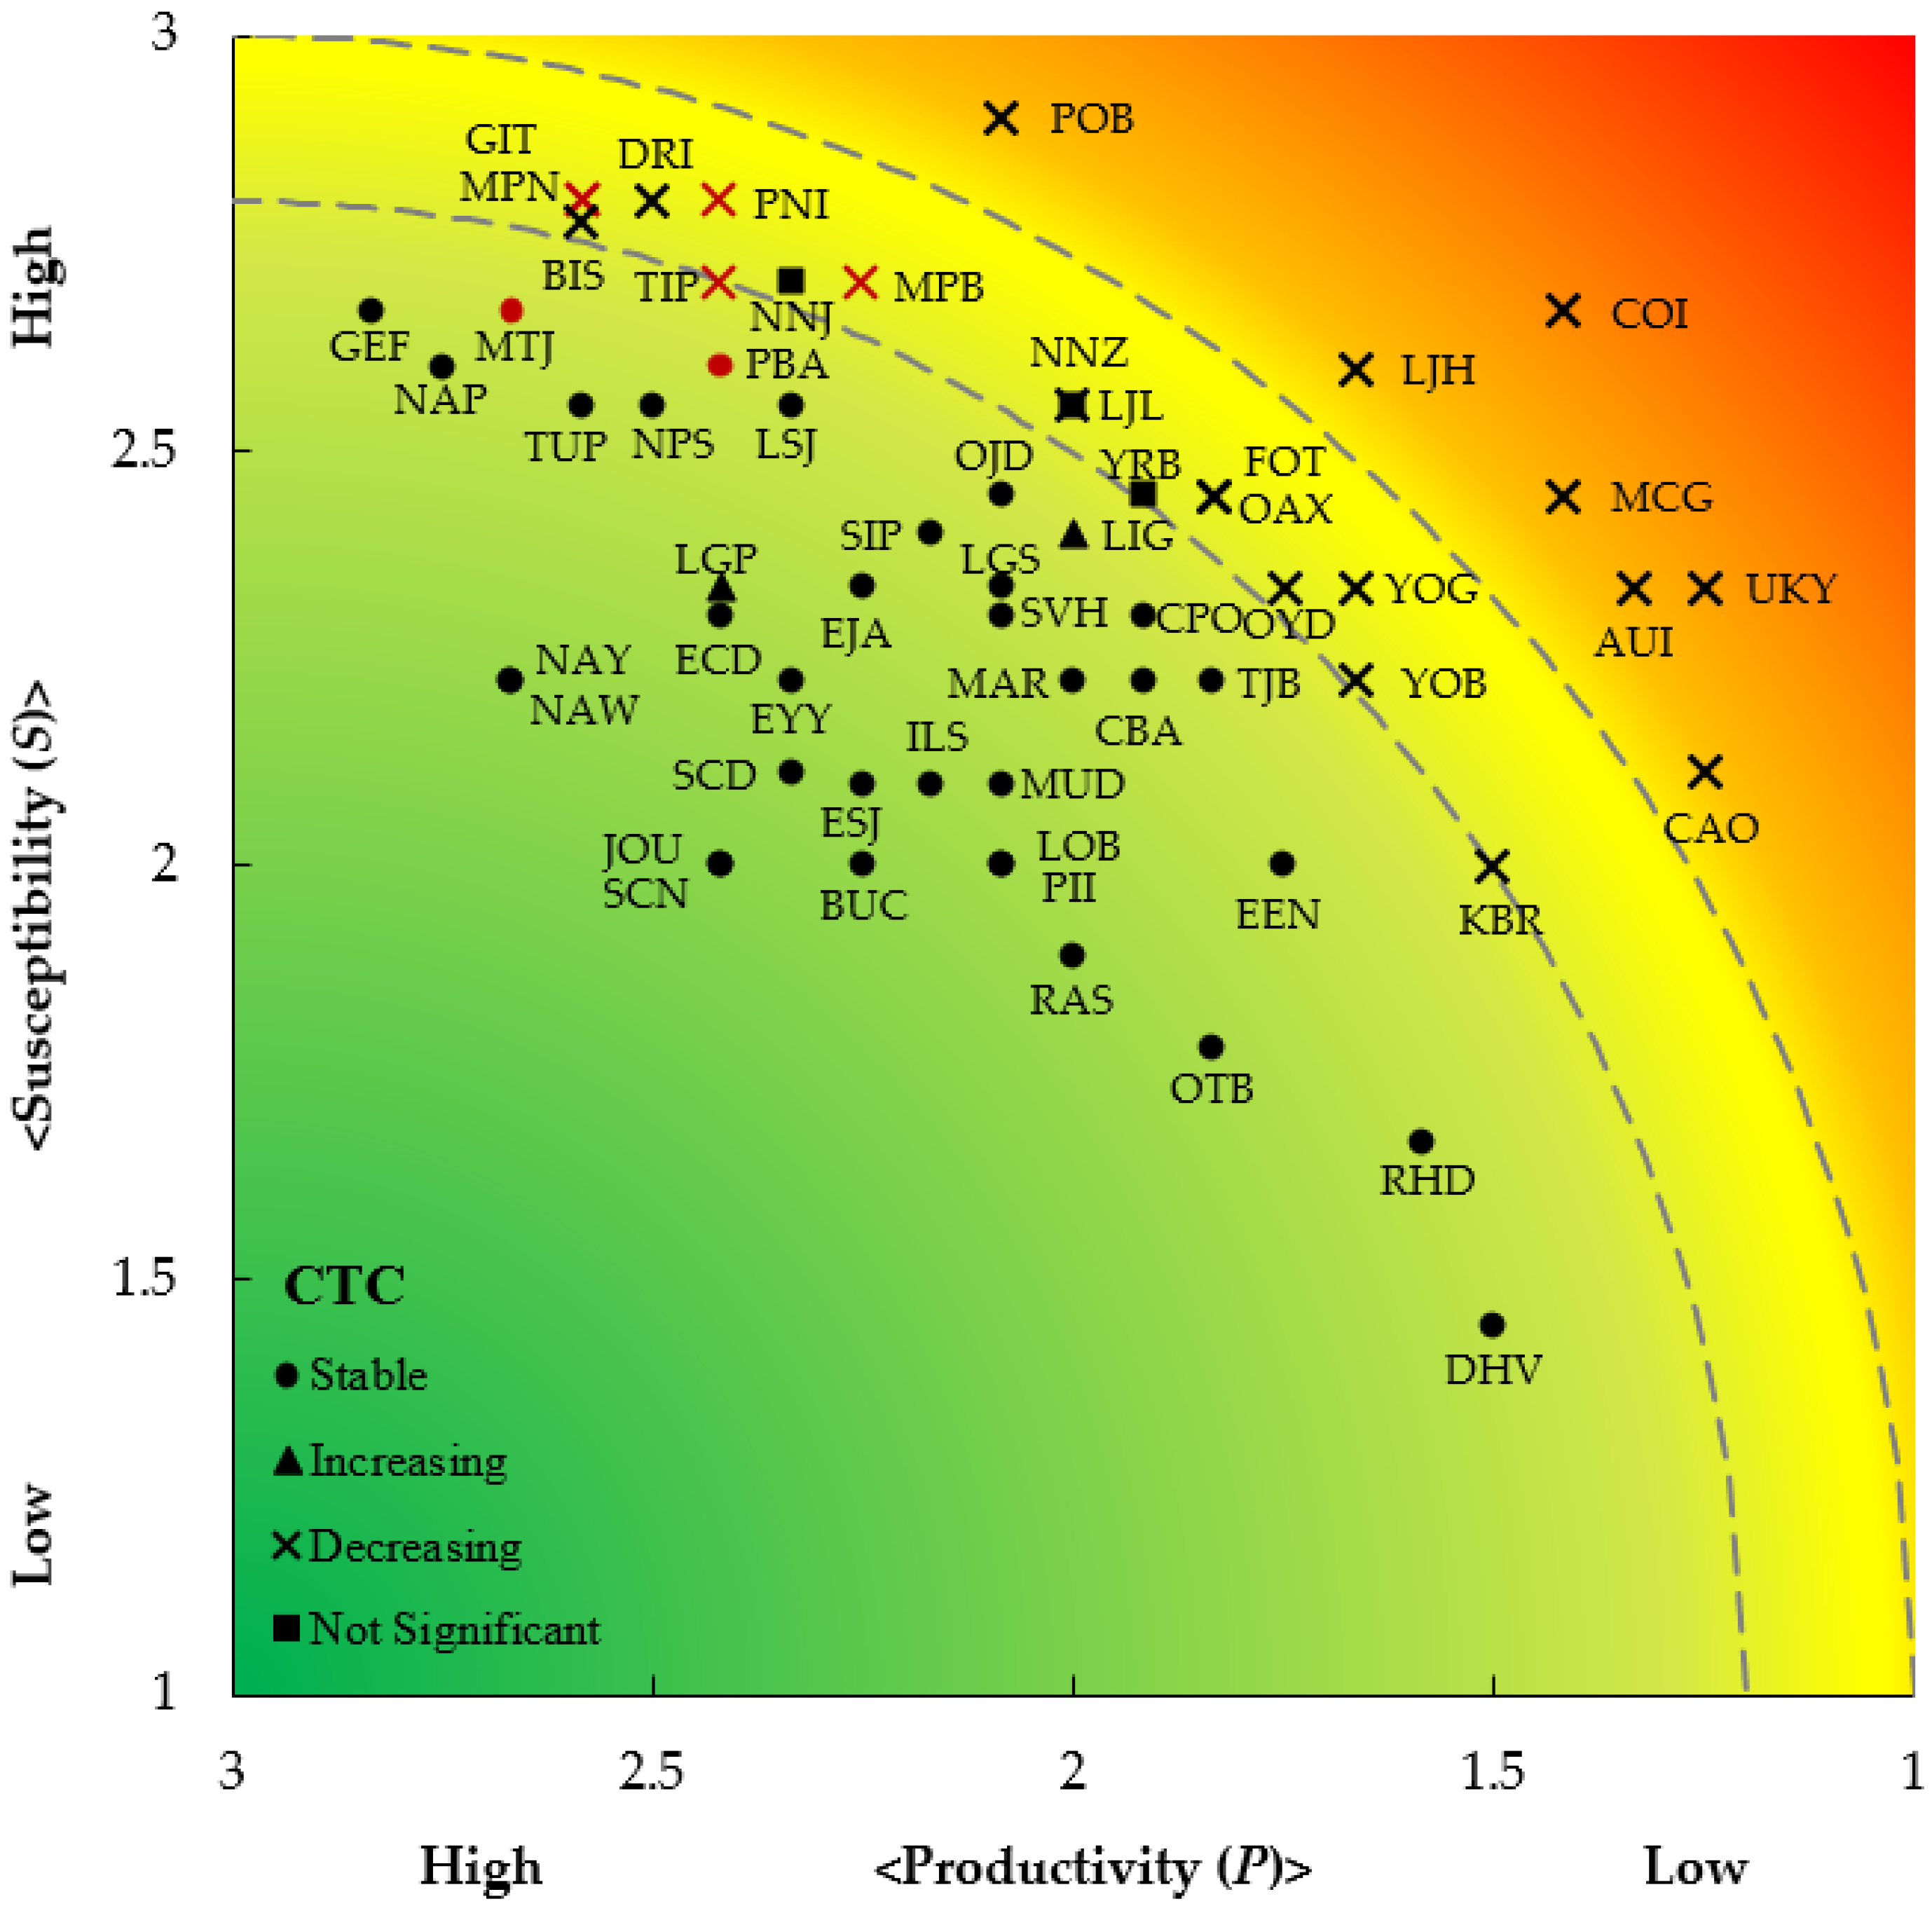
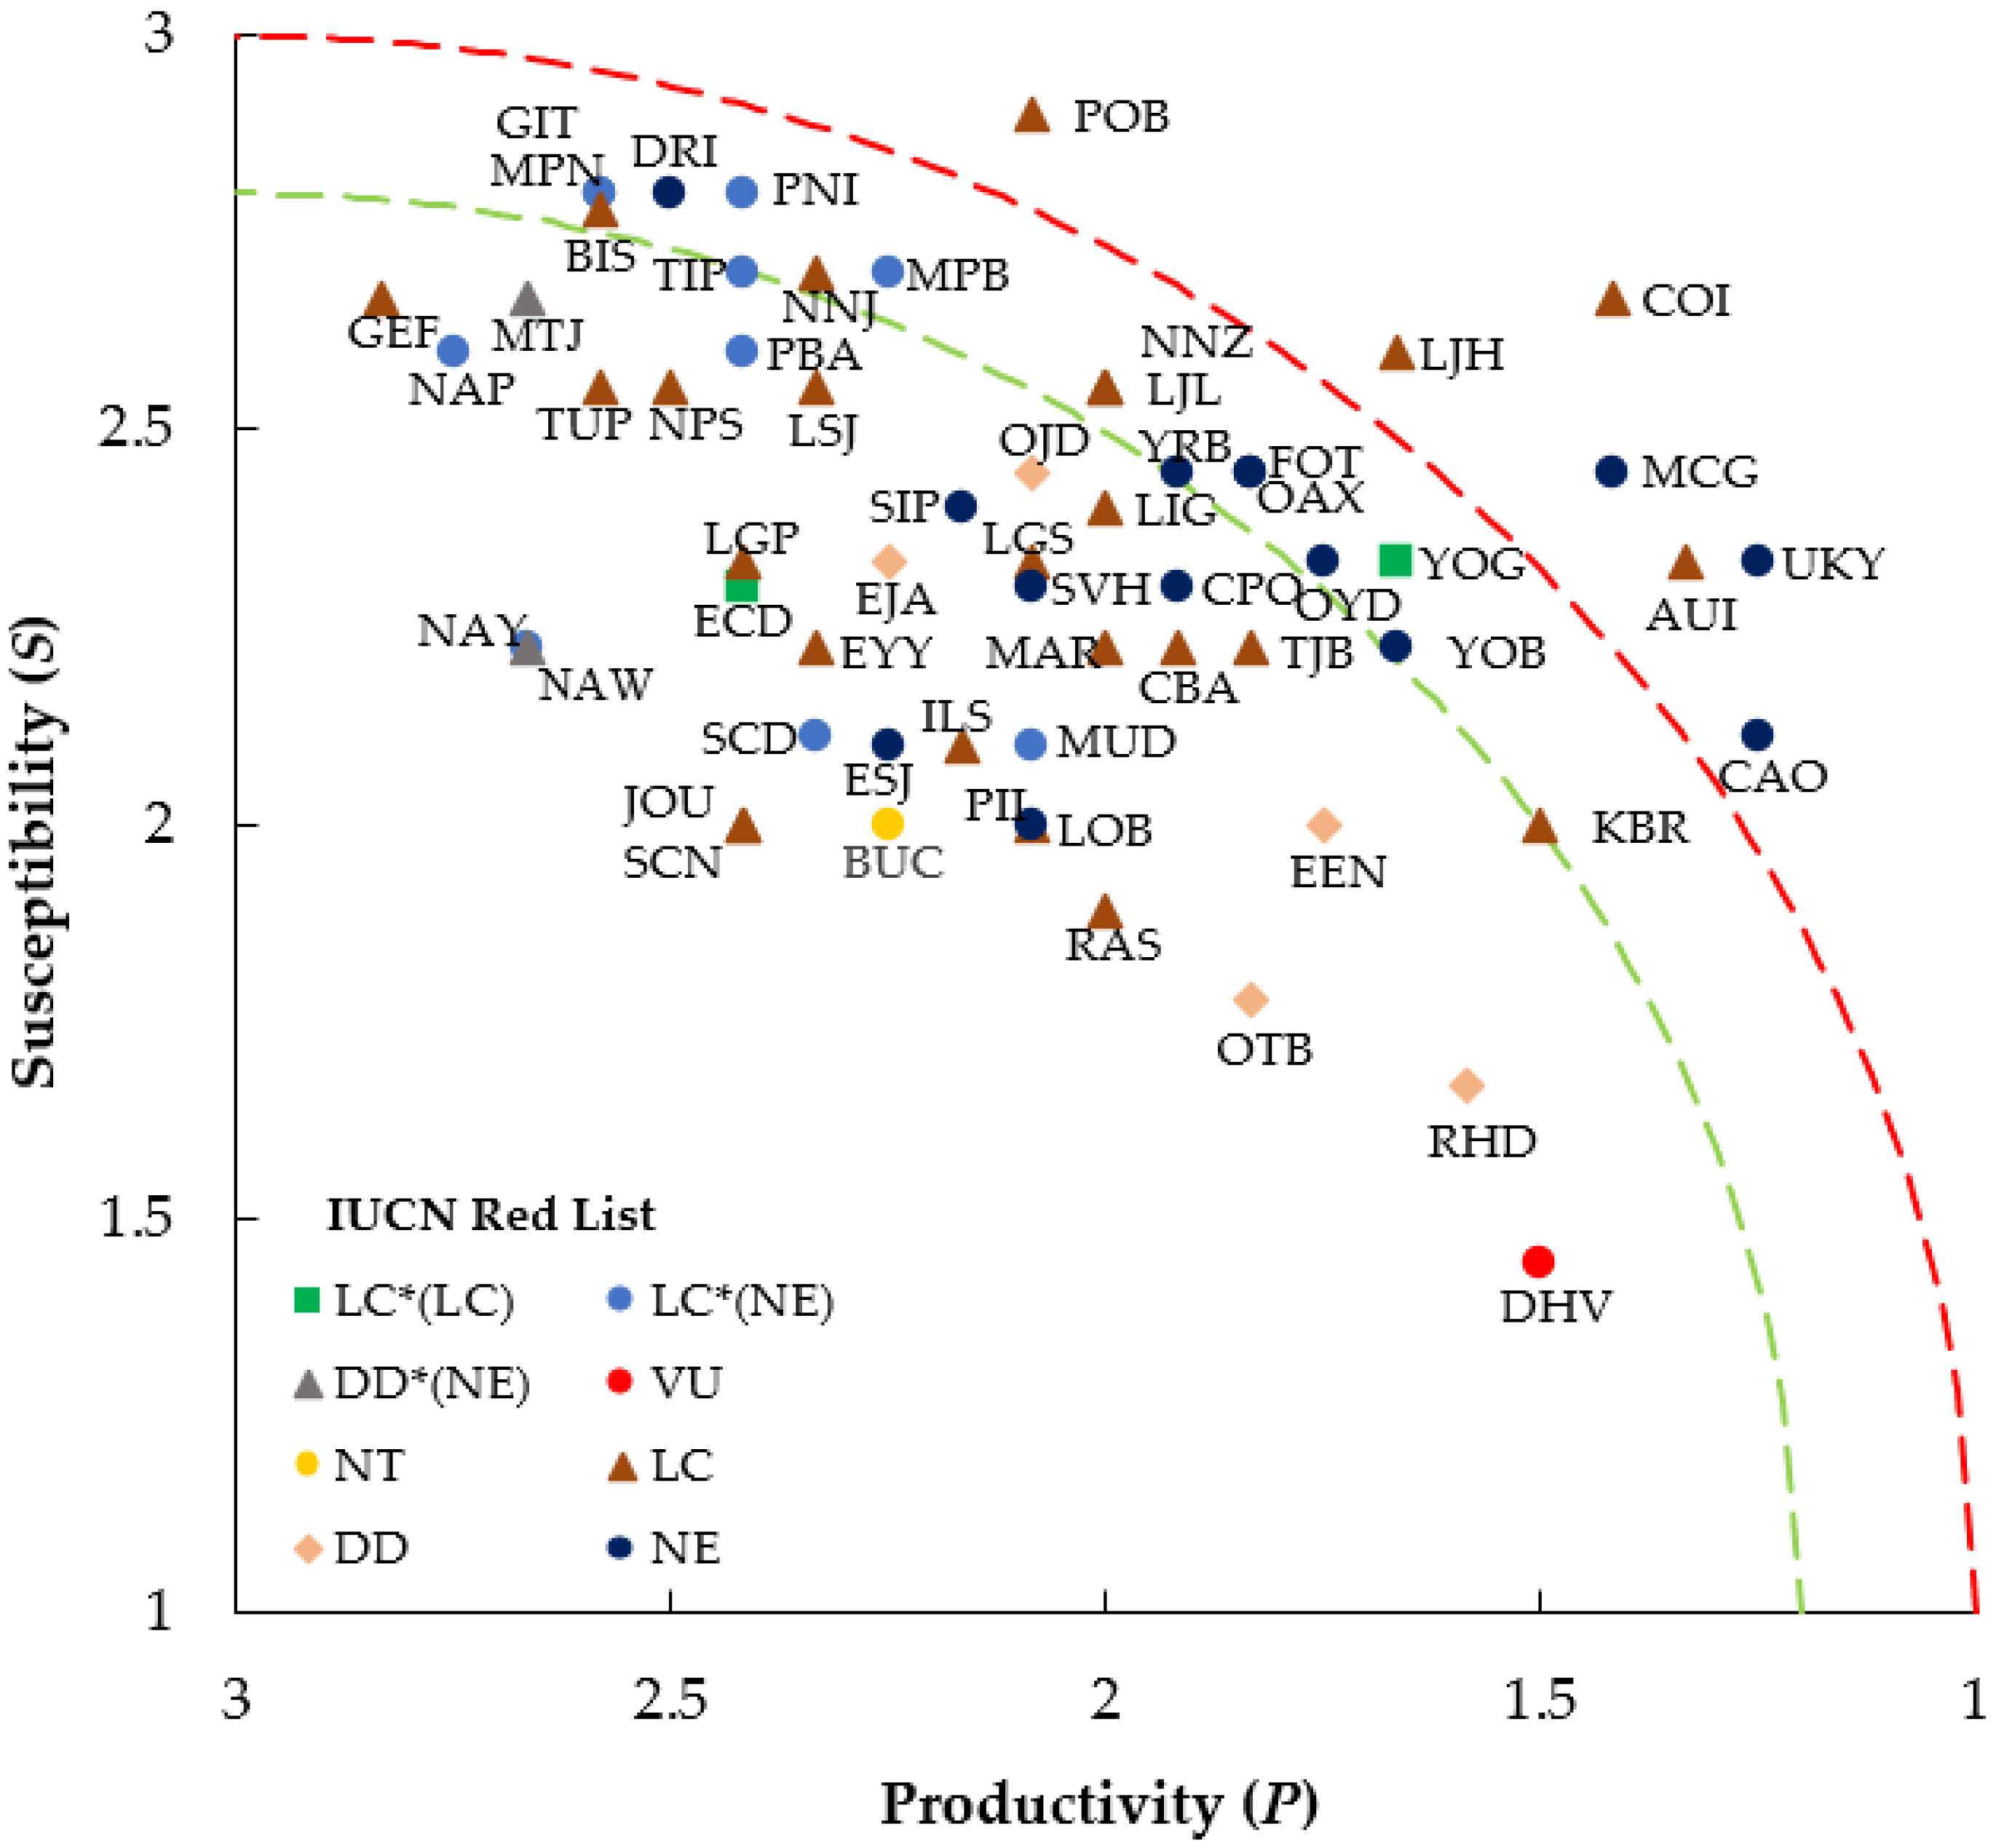
3.2. Vulnerability Assessment by Productivity Susceptibility Analysis
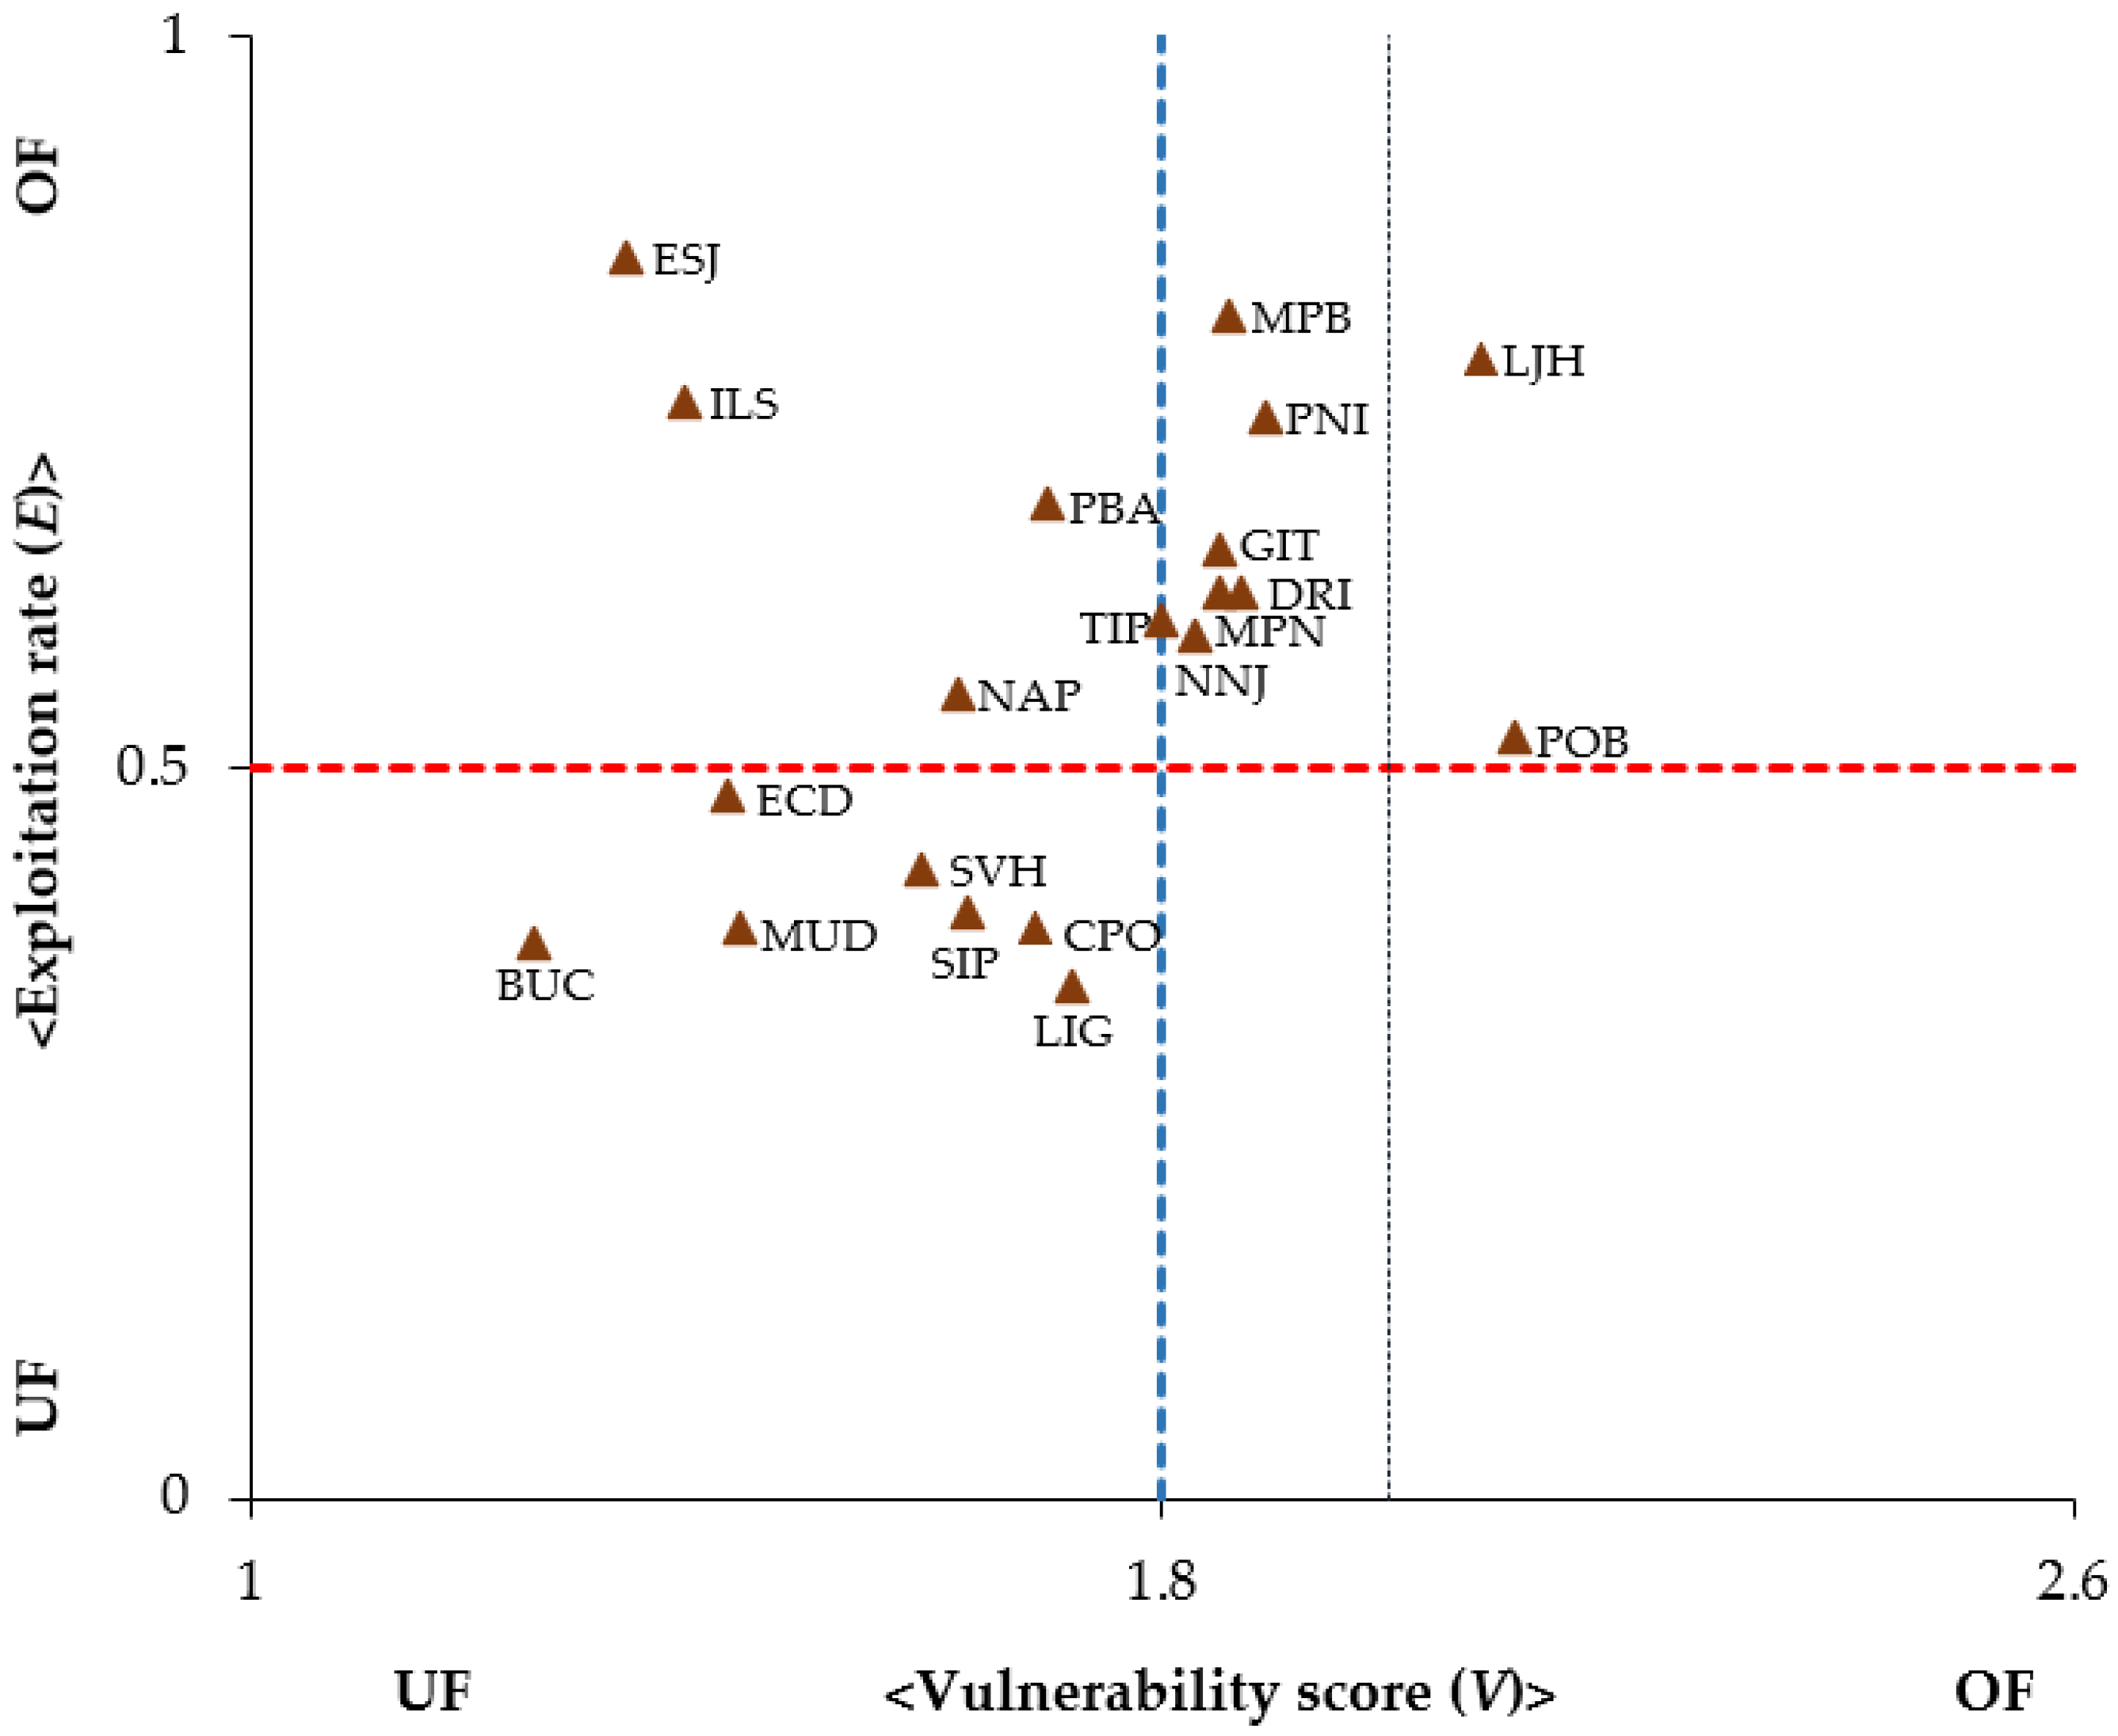
3.3. Comparison of Species’ Vulnerability with Other Assessments
4. Discussion
4.1. Composition of the Identified Species
4.2. Vulnerability Assessment by Productivity Susceptibility Analysis
4.3. Comparison of Species’ Vulnerability with Other Assessments
4.4. Impact of Management Strategy on the Identified Species
4.5. Limitations and Future Directions of This Research
5. Conclusions
Supplementary Materials
Author Contributions
Funding
Institutional Review Board Statement
Informed Consent Statement
Data Availability Statement
Acknowledgments
Conflicts of Interest
References
- Islam, M.S. Perspectives of the coastal and marine fisheries of the Bay of Bengal, Bangladesh. Ocean Coast. Manag. 2003, 46, 763–796. [Google Scholar] [CrossRef]
- Shamsuzzaman, M.M.; Islam, M.M.; Tania, N.J.; Al-Mamun, M.A.; Barman, P.P.; Xu, X. Fisheries resources of Bangladesh: Present status and future direction. Aquac. Fish. 2017, 2, 145–156. [Google Scholar] [CrossRef]
- Kumar, U.; Helen, A.M.; Das, J.; Parvez, M.S.; Biswas, S.K.; Ray, S. Unraveling the hidden truth in a poorly managed ecosystem: The case of discarded species of conservation interest in Bangladesh industrial marine fisheries. Reg. Stud. Mar. Sci. 2019, 32, 100813. [Google Scholar] [CrossRef]
- Barua, S.; Magnusson, A.; Humayun, N.M. Assessment of offshore shrimp stocks of Bangladesh based on commercial shrimp trawl logbook data. Indian J. Fish. 2018, 65, 1–6. [Google Scholar] [CrossRef] [Green Version]
- Fanning, L.P.; Chowdhury, S.R.; Uddin, M.S.; Al-Mamun, M.A. Marine Fisheries Survey Reports and Stock Assessment 2019; Department of Fisheries: Dhaka, Bangladesh, 2019; pp. 1–224. [Google Scholar]
- Hussain, M.G.; Hoq, M.E. Sustainable Management of Fisheries Resources of the Bay of Bengal-Compilation of National and Regional Workshop Reports; Bangladesh Fisheries Research Institute: Dhaka, Bangladesh, 2010; p. 122. [Google Scholar]
- Uddin, M.S.; Karim, E.; Hasan, S.J.; Barua, S.; Humayun, N.M. Catch composition for main marine shrimp species in Bangladesh. Bangladesh Res. Publ. J. 2012, 7, 91–98. [Google Scholar]
- Haque, A.B.; Cavanagh, R.D.; Seddon, N. Evaluating artisanal fishing of globally threatened sharks and rays in the Bay of Bengal, Bangladesh. PLoS ONE 2021, 16, e0256146. [Google Scholar] [CrossRef] [PubMed]
- Murshed-e-Jahan, K.; Belton, B.; Viswanathan, K.K. Communication strategies for managing coastal fisheries conflicts in Bangladesh. Ocean Coast. Manag. 2014, 92, 65–73. [Google Scholar] [CrossRef] [Green Version]
- Hilborn, R.; Amoroso, R.O.; Bogazzi, E.; Jensen, O.P.; Parma, A.M.; Szuwalski, C.; Walters, C.J. When does fishing forage species affect their predators? Fish. Res. 2017, 191, 211–221. [Google Scholar] [CrossRef]
- Gaichas, S.K.; DePiper, G.S.; Seagraves, R.J.; Muffley, B.W.; Sabo, M.G.; Colburn, L.L.; Loftus, A.J. Implementing ecosystem approaches to fishery management: Risk assessment in the US Mid-Atlantic. Front. Mar. Sci. 2018, 5, 442. [Google Scholar] [CrossRef]
- Townsend, H.; Harvey, C.J.; deReynier, Y.; Davis, D.; Zador, S.G.; Gaichas, S.; Weijerman, M.; Hazen, E.L.; Kaplan, I.C. Progress on implementing ecosystem-based fisheries management in the United States through the use of ecosystem models and analysis. Front. Mar. Sci. 2019, 6, 641. [Google Scholar] [CrossRef]
- Islam, M.M.; Begum, A.; Rahman, S.M.A.; Ullah, H. Seasonal fishery closure in the northern Bay of Bengal causes immediate but contrasting ecological and socioeconomic impacts. Front. Mar. Sci. 2021, 8, 704056. [Google Scholar] [CrossRef]
- Bornatowski, H.; Braga, R.R.; Vitule, J.R.S. Threats to sharks in a developing country: The need for effective and simple conservation measures. Nat. Conserv. 2014, 12, 11–18. [Google Scholar] [CrossRef] [Green Version]
- Clarke, T.M.; Espinoza, M.; Romero Chaves, R.; Wehrtmann, I.S. Assessing the vulnerability of demersal elasmobranchs to a data-poor shrimp trawl fishery in Costa Rica, Eastern Tropical Pacific. Biol. Conserv. 2018, 217, 321–328. [Google Scholar] [CrossRef]
- Duffy, L.M.; Lennert-Cody, C.E.; Olson, R.J.; Minte-Vera, C.V.; Griffiths, S.P. Assessing vulnerability of bycatch species in the tuna purse-seine fisheries of the eastern Pacific Ocean. Fish. Res. 2019, 219, 105316. [Google Scholar] [CrossRef]
- Ormseth, O.A.; Spencer, P.D. An assessment of vulnerability in Alaska groundfish. Fish. Res. 2011, 112, 127–133. [Google Scholar] [CrossRef]
- Stobutzki, I.; Miller, M.; Brewer, D. Sustainability of fishery bycatch: A process for assessing highly diverse and numerous bycatch. Environ. Conserv. 2001, 28, 167–181. [Google Scholar] [CrossRef]
- Patrick, W.S.; Spencer, P.; Link, J.; Cope, J.; Field, J.; Kobayashi, D.; Lawson, P.; Gedamke, T.; Cortés, E.; Ormseth, O.; et al. Using productivity and susceptibility indices to assess the vulnerability of United States fish stocks to overfishing. Fish. Bull. 2010, 108, 305–322. [Google Scholar]
- Osio, G.C.; Orio, A.; Millar, C.P. Assessing the vulnerability of Mediterranean demersal stocks and predicting exploitation status of un-assessed stocks. Fish. Res. 2015, 171, 110–121. [Google Scholar] [CrossRef]
- Hobday, A.J.; Smith, A.D.M.; Stobutzki, I.C.; Bulman, C.; Daley, R.; Dambacher, J.M.; Deng, R.A.; Dowdney, J.; Fuller, M.; Furlani, D.; et al. Ecological risk assessment for the effects of fishing. Fish. Res. 2011, 108, 372–384. [Google Scholar] [CrossRef]
- Rosenberg, A.; Agnew, D.; Babcock, E.; Cooper, A.; Mogensen, C.; O’Boyle, R.; Powers, J.; Stefánsson, G.; Swasey, J. Setting Annual Catch Limits for U.S. Fisheries: An Expert Working Group Report; MRAG Americas: Washington, DC, USA, 2007; pp. 1–36. [Google Scholar]
- MFO. Progress Report on Different Activities of Marine Fisheries Office; Marine Fisheries Office, Department of Fisheries: Chattogram, Bangladesh, 2019; pp. 1–139. [Google Scholar]
- Hossain, M.M.M. National Report of Bangladesh on Sustainable Management of the Bay of Bengal Large Marine Ecosystem (BOBLME); GCP/RAS/179/WBG (FAO); Institute of Marine Sciences and Fisheries (IMSF): Chattogram, Bangladesh, 2004; pp. 1–121. [Google Scholar]
- DoF. Yearbook of Fisheries Statistics of Bangladesh, 2018–2019; Fisheries Resources Survey System (FRSS), Department of Fisheries: Dhaka, Bangladesh, 2019; Volume 36, pp. 1–135. [Google Scholar]
- Ahmed, A.T.A.; Kabir, S.M.H.; Ahmed, M.; Rahman, A.K.A.; Haque, E.U.; Ahmed, Z.U.; Begum, Z.N.T.; Hassan, M.A.; Khondker, M. Encyclopedia of Flora and Fauna of Bangladesh: Arthropoda (Crustacea); Asiatic Society of Bangladesh: Dhaka, Bangladesh, 2008; Volume 18: Part II, p. 226. [Google Scholar]
- IUCN. Red List of Bangladesh: Crustaceans; International Union for Conservation of Nature, Bangladesh Country Office: Dhaka, Bangladesh, 2015; Volume 6, p. 256. [Google Scholar]
- Barua, S.; Akter, M.R.; Roy, B. Bangladesh National Report to the Scientific Committee of the Indian Ocean Tuna Commission; Department of Fisheries: Chattogram, Bangladesh, 2018; pp. 1–26. [Google Scholar]
- Quddus, M.M.A.; Shafi, M. The Fisheries Resources of the Bay of Bengal (in Bengali); Kabir Publications: Dhaka, Bangladesh, 1983; p. 535. [Google Scholar]
- Rahman, A.K.A.; Kabir, S.M.H.; Ahmad, M.; Ahmed, A.T.A.; Ahmed, Z.U.; Begum, Z.N.T.; Hassan, M.A.; Khondker, M. Encyclopedia of Flora and Fauna of Bangladesh: Marine Fishes; Asiatic Society of Bangladesh: Dhaka, Bangladesh, 2009; Volume 24, p. 485. [Google Scholar]
- Siddiqui, K.U.; Islam, M.A.; Kabir, S.M.H.; Ahmad, M.; Ahmed, A.T.A.; Rahman, A.K.A.; Haque, E.U.; Ahmed, Z.U.; Begum, Z.N.T.; Hassan, M.A.; et al. Encyclopedia of Flora and Fauna of Bangladesh: Molluscs; Asiatic Society of Bangladesh: Dhaka, Bangladesh, 2007; Volume 17, p. 415. [Google Scholar]
- Palomares, M.L.D.; Pauly, D. SeaLifeBase, World Wide Web Electronic Publication. 2021. Available online: www.sealifebase.org (accessed on 17 November 2021).
- Froese, R.; Pauly, D. FishBase, World Wide Web Electronic Publication. 2021. Available online: www.fishbase.org (accessed on 11 November 2021).
- Kumer, P.; Urbanc, M. Focus groups as a tool for conducting participatory research: A case study of small-scale forest management in Slovenia. In Participatory Research and Planning in Practice; Nared, J., Bole, D., Eds.; Springer Nature: Cham, Switzerland, 2020; pp. 207–220. [Google Scholar]
- Maynou, F.; Sardà, F. Influence of environmental factors on commercial trawl catches of Nephrops norvegicus (L.). ICES J. Mar. Sci. 2001, 58, 1318–1325. [Google Scholar] [CrossRef]
- McAllister, M.K.; Stanley, R.D.; Starr, P. Using experiments and expert judgment to model catchability of Pacific rockfishes in trawl surveys, with application to bocaccio (Sebastes paucispinis) off British Columbia. Fish. Bull. 2010, 108, 282–304. [Google Scholar]
- Faruque, H.; Matsuda, H. Assessing the vulnerability of bycatch species from Hilsa gillnet fishing using productivity susceptibility analysis: Insights from Bangladesh. Fish. Res. 2021, 234, 105808. [Google Scholar] [CrossRef]
- McCully Phillips, S.R.; Scott, F.; Ellis, J.R. Having confidence in productivity susceptibility analyses: A method for underpinning scientific advice on skate stocks? Fish. Res. 2015, 171, 87–100. [Google Scholar] [CrossRef]
- Mejía-Falla, P.A.; Castro, E.R.; Ballesteros, C.A.; Bent-Hooker, H.; Caldas, J.P.; Rojas, A.; Navia, A.F. Effect of a precautionary management measure on the vulnerability and ecological risk of elasmobranchs captured as target fisheries. Reg. Stud. Mar. Sci. 2019, 31, 100779. [Google Scholar] [CrossRef]
- Faruque, H.; Matsuda, H. Conservative scoring approach in productivity susceptibility analysis leads to an overestimation of vulnerability: A study from the Hilsa gillnet bycatch stocks of Bangladesh. Fishes 2021, 6, 33. [Google Scholar] [CrossRef]
- Lin, C.Y.; Wang, S.P.; Chiang, W.C.; Griffiths, S.; Yeh, H.M. Ecological risk assessment of species impacted by fisheries in waters off eastern Taiwan. Fish. Manag. Ecol. 2020, 27, 345–356. [Google Scholar] [CrossRef]
- Froese, R.; Binohlan, C. Empirical relationships to estimate asymptotic length, length at first maturity and length at maximum yield per recruit in fishes, with a simple method to evaluate length frequency data. J. Fish Biol. 2000, 56, 758–773. [Google Scholar] [CrossRef]
- Pauly, D. On the interrelationships between natural mortality, growth parameters, and mean environmental temperature in 175 fish stocks. ICES J. Mar. Sci. 1980, 39, 175–192. [Google Scholar] [CrossRef]
- Monterey Bay Aquarium. Blue Swimming Crab Portunus pelagicus, Vietnam and Gulf of Thailand, Bottom Gillnet, Pots, Set Gillnets, Traps; Seafood Watch Consulting Researcher: Monterey, CA, USA, 2018; pp. 1–68. [Google Scholar]
- Killen, S.S.; Nati, J.J.H.; Suski, C.D. Vulnerability of individual fish to capture by trawling is influenced by capacity for anaerobic metabolism. Proc. R. Soc. B Biol. Sci. 2015, 282, 20150603. [Google Scholar] [CrossRef] [Green Version]
- Funge-Smith, S.; Bennett, A. A fresh look at inland fisheries and their role in food security and livelihoods. Fish Fish. 2019, 20, 1176–1195. [Google Scholar] [CrossRef] [Green Version]
- IUCN. Red List of Bangladesh: Freshwater Fishes; International Union for Conservation of Nature, Bangladesh Country Office: Dhaka, Bangladesh, 2015; Volume 5, p. 360. [Google Scholar]
- IUCN. The IUCN Red List of Threatened Species. 2021. Available online: www.iucnredlist.org (accessed on 8 September 2021).
- Gulland, J.A. Estimation of mortality rates. Annex to Arctic fisheries working group report. Int. Counc. Explor. Sea CM 1971, 3, 9. [Google Scholar]
- Hoq, M.E.; Haroon, A.K.Y.; Chakraborty, S.C. Marine Fisheries of Bangladesh: Prospect and Potentialities; Bangladesh Fisheries Research Institute: Dhaka, Bangladesh, 2013; p. 120. [Google Scholar]
- Bastardie, F.; Brown, E.J.; Andonegi, E.; Arthur, R.; Beukhof, E.; Depestele, J.; Döring, R.; Eigaard, O.R.; García-Barón, I.; Llope, M.; et al. A review characterizing 25 ecosystem challenges to be addressed by an ecosystem approach to fisheries management in Europe. Front. Mar. Sci. 2021, 7, 1241. [Google Scholar] [CrossRef]
- Hordyk, A.R.; Carruthers, T.R. A quantitative evaluation of a qualitative risk assessment framework: Examining the assumptions and predictions of the productivity susceptibility analysis (PSA). PLoS ONE 2018, 13, e0198298. [Google Scholar] [CrossRef] [Green Version]
- Fauconnet, L.; Rochet, M.J. Fishing selectivity as an instrument to reach management objectives in an ecosystem approach to fisheries. Mar. Policy 2016, 64, 46–54. [Google Scholar] [CrossRef] [Green Version]
- Stepputtis, D.; Santos, J.; Herrmann, B.; Mieske, B. Broadening the horizon of size selectivity in trawl gears. Fish. Res. 2016, 184, 18–25. [Google Scholar] [CrossRef] [Green Version]
- Roy, B.J.; Singha, N.K.; Rahman, M.G.; Mohanta, S.K.; Nazrul, K.M.S.; Al-Mamun; Haroon, M.I. Production trends of different group of industrial marine fishes in Bangladesh. Int. J. Adv. Res. Biol. Sci. 2019, 6, 28–43. [Google Scholar]
- Alam, M.S.; Liu, Q.; Rashed-Un-nabi, M.; Al-Mamun, M.A. Fish stock assessment for data-poor fisheries, with a case study of tropical Hilsa Shad (Tenualosa ilisha) in the water of Bangladesh. Sustainability 2021, 13, 3604. [Google Scholar] [CrossRef]
- Griffiths, S.P.; Kesner-Reyes, K.; Garilao, C.; Duffy, L.M.; Román, M.H. Ecological assessment of the sustainable impacts of fisheries (EasI-FiSh): A flexible vulnerability assessment approach to quantify the cumulative impacts of fishing in data-limited settings. Mar. Ecol. Prog. Ser. 2019, 625, 89–113. [Google Scholar] [CrossRef]
- Liu, K.M.; Huang, L.H.; Su, K.Y.; Joung, S.J. Vulnerability assessment of pelagic sharks in the western north pacific by using an integrated ecological risk assessment. Animals 2021, 11, 2161. [Google Scholar] [CrossRef]
- Roy, B.; Singha, N.; Rhaman, M. Status and recorded of sharks and rays in the Bay of Bengal of Bangladesh region. Braz. J. Biol. Sci. 2015, 2, 343–367. [Google Scholar]
- Sarker, M.N.; Humayun, M.; Rahman, M.A.; Uddin, M.S. Population dynamics of Bombay Duck Harpodon nehereus (Hamilton, 1822) of the Bay of Bengal along Bangladesh coast. Bangladesh J. Zool. 2017, 45, 101–110. [Google Scholar] [CrossRef] [Green Version]
- Mustafa, M.G.; Ali, M.S.; Azadi, M.A. Some aspect of population dynamics of three Penaeid Shrimps (Penaeus monodon; Penaeus semisulcatus and Metapenaeus monoceros) from the Bay of Bengal, Bangladesh. Chittagong Univ. J. Sci. 2006, 30, 97–102. [Google Scholar]
- Hilborn, R.; Amoroso, R.O.; Anderson, C.M.; Baum, J.K.; Branch, T.A.; Costello, C.; De Moor, C.L.; Faraj, A.; Hively, D.; Jensen, O.P.; et al. Effective fisheries management instrumental in improving fish stock status. Proc. Natl. Acad. Sci. USA 2020, 117, 2218–2224. [Google Scholar] [CrossRef] [PubMed] [Green Version]
- Tu, C.Y.; Chen, K.T.; Hsieh, C.H. Fishing and temperature effects on the size structure of exploited fish stocks. Sci. Rep. 2018, 8, 7132. [Google Scholar] [CrossRef]
- Islam, M.M.; Shamsuzzaman, M.M.; Hoque Mozumder, M.M.; Xiangmin, X.; Ming, Y.; Abu Sayed Jewel, M. Exploitation and conservation of coastal and marine fisheries in Bangladesh: Do the fishery laws matter? Mar. Policy 2017, 76, 143–151. [Google Scholar] [CrossRef]
- Rahman, M.R. Blue economy and maritime cooperation in the Bay of Bengal: Role of Bangladesh. Procedia Eng. 2017, 194, 356–361. [Google Scholar] [CrossRef]
- Catedrilla, L.C.; Espectato, L.N.; Serofia, G.D.; Jimenez, C.N. Fisheries law enforcement and compliance in District 1, Iloilo Province, Philippines. Ocean Coast. Manag. 2012, 60, 31–37. [Google Scholar] [CrossRef]
- Zhang, J.; Hanner, R. Molecular approach to the identification of fish in the South China Sea. PLoS ONE 2012, 7, e30621. [Google Scholar] [CrossRef]
- Carruthers, T.R.; Punt, A.E.; Walters, C.J.; MacCall, A.; McAllister, M.K.; Dick, E.J.; Cope, J. Evaluating methods for setting catch limits in data-limited fisheries. Fish. Res. 2014, 153, 48–68. [Google Scholar] [CrossRef] [Green Version]
- De Bruyn, P.; Murua, H.; Aranda, M. The Precautionary approach to fisheries management: How this is taken into account by Tuna regional fisheries management organisations (RFMOs). Mar. Policy 2013, 38, 397–406. [Google Scholar] [CrossRef]
- Scott-Denton, E.; Cryer, P.F.; Duffin, B.V.; Duffy, M.R.; Gocke, J.P.; Harrelson, M.R.; Whatley, A.J.; Williams, J.A. Characterization of the U.S. Gulf of Mexico and South Atlantic Penaeidae and Rock Shrimp (Sicyoniidae) Fisheries through Mandatory Observer Coverage, from 2011 to 2016. Mar. Fish. Rev. 2016, 82, 17–46. [Google Scholar]
- Putman, N.F.; Gallaway, B.J. Using common age units to communicate the relative catch of Red Snapper in recreational, commercial, and Shrimp fisheries in the Gulf of Mexico. N. Am. J. Fish. Manag. 2020, 40, 232–241. [Google Scholar] [CrossRef]
- Gallaway, B.J.; Raborn, S.W.; Picariello, L.; Putman, N.F. Changes in Shrimping effort in the Gulf of Mexico and the impacts to Red Snapper. iScience 2020, 23, 101111. [Google Scholar] [CrossRef] [PubMed]
- Khan, M.G.; Alamgir, M.; Sada, M.N. The coastal fisheries of Bangladesh. In Status and Management of Tropical Coastal Fisheries in Asia; Silvestre, G., Pauly, D., Eds.; International Center for Living Aquatic Resources Management (ICLARM): Makati, Philippines, 1997; pp. 26–37. [Google Scholar]
- Khan, M.A.A.; Sada, N.U.; Chowdhury, Z.A. Status of the demersal fishery resources of Bangladesh. In Assessment, Management and Future Directions of Coastal Fisheries in Asian Countries; Silvestre, G., Garces, L., Stobutzki, I., Ahmed, M., Valmonte-Santos, R.A., Luna, C., Lachica-Aliño, L., Munro, P., Christensen, V., Pauly, D., Eds.; WorldFish Center: Penang, Malaysia, 2003; pp. 63–82. [Google Scholar]
- Amin, S.M.N.; Zafar, M. Studies on age and growth, exploitation level and virtual population analysis of Parapenaeopsis sculptilis shrimp from Bangladesh coastal water. J. NOAMI 2003, 20, 51–57. [Google Scholar]
- Zafar, M.; Amin, S.M.N.; Rahman, M.M. Population dynamics of Mud Crab (Scylla serrata) in the southeastern coastal region of Bangladesh. Asian Fish. Sci. 2006, 19, 43–50. [Google Scholar] [CrossRef]
- Humayun, M.; Khan, M.G.; Mustafa, M.G.; Sada, M.N.U.; Paul, S.C. Studies on some parameters of the population dynamics of the Butter Fish Ariomma indica Day from the Bay of Bengal. Bangladesh J. Zool. 1988, 16, 39–44. [Google Scholar]
- Mustafa, M.G. Trophic model of the coastal ecosystem in the waters of Bangladesh, Bay of Bengal. In Assessment, Management and Future Directions of Coastal Fisheries in Asian Countries; Silvestre, G., Garces, L., Stobutzki, I., Ahmed, M., Valmonte-Santos, R.A., Luna, C., Lachica-Aliño, L., Munro, P., Christensen, V., Pauly, D., Eds.; WorldFish Center: Penang, Malaysia, 2003; pp. 263–280. [Google Scholar]
- Mustafa, M.G.; Zafar, M.; Haque, M.A.; Amin, S.N. Population dynamics of the Ribbon Fish, Lepturacanthus savala (Cuvier 1829) from the north–eastern part of the Bay of Bengal. Bangladesh J. Fish. Res. 2000, 4, 179–184. [Google Scholar]
- Khan, M.G. Age, growth and mortality rates of the Red Snapper (Lutjanus johnii Bloch) of the Bay of Bengal, Bangladesh. Bangladesh J. Agric. 1986, 11, 49–61. [Google Scholar]
- Mustafa, M.G. Population Dynamics of Penaeid shrimps and Demersal finfishes from Trawl Fishery in the Bay of Bengal and Implications for Their Management. Ph.D. Thesis, Department of Zoology, University of Dhaka, Dhaka, Bangladesh, 1999. [Google Scholar]
- Mustafa, M.G.; Khan, M.G. Studies on some aspects of the population dynamics of Lizard Fish Saurida tumbil Blotch from the Bay of Bengal. Bangladesh J. Zool. 1988, 16, 77–84. [Google Scholar]
- O’Shea, O.R.; Braccini, M.; McAuley, R.; Speed, C.W.; Meekan, M.G. Growth of tropical Dasyatid Rays estimated using a multi-analytical approach. PLoS ONE 2013, 8, e77194. [Google Scholar] [CrossRef] [Green Version]
- Dulvy, N.K.; Reynolds, J.D. Evolutionary transitions among egg–laying, live–bearing and maternal inputs in Sharks and Rays. Proc. R. Soc. Lond. 1997, 264, 1309–1315. [Google Scholar] [CrossRef] [Green Version]
- Heemstra, P.C.; Heemstra, E. Coastal Fishes of Southern Africa; National Inquiry Service Centre (NISC) and South African Institute for Aquatic Biodiversity (SAIAB): Grahamstown, South Africa, 2004; p. 488. [Google Scholar]
- Compagno, L.J.V.; Ebert, D.A.; Smale, M.J. Guide to the Sharks and Rays of Southern Africa; New Holland (Publ.) Ltd.: London, UK, 1989; p. 158. [Google Scholar]
- Michael, S.W. Reef Sharks and Rays of the World: A Guide to their Identification, Behavior, and Ecology; Sea Challengers: Monterey, CA, USA, 1993; p. 107. [Google Scholar]
- Başusta, N.; Demirhan, S.A.; Çiçek, E.; Başusta, A.; Kuleli, T. Age and growth of the Common Guitarfish, Rhinobatos rhinobatos, in Iskenderun Bay (north-eastern Mediterranean, Turkey). J. Mar. Biol. Assoc. U.K. 2008, 88, 837–842. [Google Scholar] [CrossRef]
- Ismen, A.; Yigin, C.; Ismen, P. Age, growth, reproductive biology and feed of The Common Guitarfish (Rhinobatos rhinobatos Linnaeus, 1758) in Iskenderun Bay, the eastern Mediterranean Sea. Fish. Res. 2007, 84, 263–269. [Google Scholar] [CrossRef]
- Last, P.R.; White, W.T.; de Carvalho, M.R.; Séret, B.; Stehmann, M.F.W.; Naylor, G.J.P. Rays of the World; CSIRO Publishing: Clayton South, Australia, 2016; p. 790. [Google Scholar]
- Raje, S.G.; Sivakami, S.; Mohanraj, G.; Kumar, P.P.M.; Raju, A.; Joshi, K.K. An Atlas on the Elasmobranch Fishery Resources of India; Central Marine Fisheries Research Institute: Cochin, India, 2007; p. 253. [Google Scholar]
- O’Sullivan, S.; Moriarty, C.; FitzGerald, R.D.; Davenport, J.; Mulcahy, M.F. Age, growth and reproductive status of the European Conger Eel, Conger conger (L.) in Irish coastal waters. Fish. Res. 2003, 64, 55–69. [Google Scholar] [CrossRef]
- Allen, G.R.; Erdmann, M.V. Reef Fishes of the East Indies; Tropical Reef Research: Perth, Australia, 2012; Volumes I–III, p. 1260. [Google Scholar]
- Matić-Skoko, S.; Ferri, J.; Tutman, P.; Skaramuca, D.; Đikić, D.; Lisičić, D.; Franić, Z.; Skaramuca, B. The age, growth and feeding habits of the European Conger Eel, Conger conger (L.) in the Adriatic Sea. Mar. Biol. Res. 2012, 8, 1012–1018. [Google Scholar] [CrossRef]
- Daoudi, M.; Bouiadjra, B.B.; Charton, J.A.G.; Behmene, I.E.K.; Hemida, F. Growth and mortality of Conger conger (Linnaeus, 1758) (Pisces Congridae) in the Algerian basin. Biodivers. J. 2020, 11, 853–860. [Google Scholar] [CrossRef]
- Wheeler, A. Key to the Fishes of Northern Europe; Frederick Warne (Publ.) Ltd.: London, UK, 1978; p. 380. [Google Scholar]
- Göthel, H. Fauna Marina del Mediterráneo (in Spanish); Editorial Omega: Barcelona, Spain, 1992; p. 319. [Google Scholar]
- Amin, S.M.N.; Zafar, M. Studies on age, growth and virtual population analysis of Coilia dussumieri from the neritic water of Bangladesh. J. Biol. Sci. 2004, 4, 342–344. [Google Scholar]
- Fernandez, I.; Devaraj, M. Reproductive biology of the Gold Spotted Grenadier Anchovy, Coilia dussumieri (Cuvier and Valenciennes), along the northwest coast of India. Indian J. Fish. 1989, 36, 11–18. [Google Scholar]
- Breder, C.M.; Rosen, D.E. Modes of Reproduction in Fishes; T.F.H. (Tropical Fish Hobbyist) Publications: Neptune City, NJ, USA, 1966; p. 941. [Google Scholar]
- Gadgil, M. On some aspects of the biology of Coilia dussumieri (Cuv. and Val.). J. Bombay Nat. Hist. Soc. 1965, 64, 55–69. [Google Scholar]
- Nair, P.G.; Joseph, S.; Kripa, V.; Pillai, V.N. Population growth and maturity characteristics of Commerson’s Anchovy (Stolephorus commersonnii Lacepède, 1803) along the southwest coast of India. Indian J. Geo-Marine Sci. 2021, 50, 141–147. [Google Scholar]
- Andamari, R.; Milton, D.; Zubaidi, T. Reproductive biology of five species of Anchovies (Engraulidae) from Bima Bay, Sumbawa, Nusa Tenggara. Indones. J. Agric. Sci. 2002, 3, 37–42. [Google Scholar] [CrossRef] [Green Version]
- Whitehead, P.J.P.; Nelson, G.J.; Wongratana, T. Clupeoid Fishes of the World (Suborder Clupeoidei): An Annotated and Illustrated Catalogue of the Herrings, Sardines, Pilchards, Sprats, Shads, Anchovies and Wolf-Herrings; Food and Agriculture Organization (FAO) of the United Nations: Rome, Italy, 1988; Volume 7: Part 2, pp. 305–579. [Google Scholar]
- Hoedt, F.E. Age and growth of a Large Tropical Anchovy, Thryssa hamiltoni (Gray): A comparison of ageing techniques. Mar. Freshw. Res. 1992, 43, 953–971. [Google Scholar] [CrossRef]
- Varghese, M.; Thomas, V.J.; Sreekumar, K.M.; Mohan, S.; Joseph, S. Large sized Moustached Thryssa, Thryssa mystax (Bloch & Schneider, 1801) recorded from Cochin coast in Kerala. In The Marine Fisheries Information Service: Technical and Extension Series 217; Central Marine Fisheries Research Institute (CMFRI): Cochin, India, 2013; p. 30. [Google Scholar]
- Kende, D.R.; Nirmale, V.H.; Metar, S.Y.; Pawar, R.A. Studies on growth and mortality of Moustached Thryssa, Thryssa mystax (Schneider, 1801) along the Ratnagiri coast of Maharashtra, India. Indian J. Geo-Marine Sci. 2018, 47, 1065–1068. [Google Scholar]
- Kamal, M.M.; Sunarno, M.T.D. Biological reproductive of estuarine fish comparing between demersal (long tongue sole, Cynoglossus lingua) and pelagical: (mutached thryssa, Thryssa mystax) assemblages. Indones. Fish. Res. J. 2009, 15, 37–42. [Google Scholar] [CrossRef] [Green Version]
- Jeyaseelan, M.J.P. Manual of Fish Eggs and Larvae from Asian Mangrove Waters; United Nations Educational, Scientific and Cultural Organization (UNESCO): Paris, France, 1998; p. 193. [Google Scholar]
- Banerji, S.K.; Krishnan, T.S. Acceleration of assessment of fish populations and comparative studies of similar taxonomic groups. In Proceedings of the Symposium on Living Resources of the Seas around India; Central Marine Fisheries Research Institute (CMFRI): Cochin, India, 1973; pp. 158–175. [Google Scholar]
- Sawant, B.T.; Chakraborty, S.K.; Jaiswar, A.K.; Panda, D.; Bhagabati, S.K.; Sawant, P.B. Population parameters of the Catfishes, Arius caelatus (Valenciennes, 1830) and Arius tenuispinis (Day, 1877) from Mumbai waters. Indian J. Geo-Marine Sci. 2013, 42, 775–780. [Google Scholar]
- Menon, N.G.; Bande, V.N. Taxonomic considerations and general distribution of important Catfishes. In Marine Catfish Resources of India: Exploitation and Prospects 40; Central Marine Fisheries Research Institute (CMFRI): Cochin, India, 1987; pp. 5–11. [Google Scholar]
- Sultana, R.; Alam, M.S.; Nazrul, K.M.S.; Mamun, A.; Al–Mamun, M.A. Length–weight relationship and population dynamics study of the Giant Catfish (Arius thalassinus) in the Bay of Bengal coast of Bangladesh. Res. Agric. Livest. Fish. 2019, 6, 439–444. [Google Scholar] [CrossRef]
- Kamukuru, A.T.; Tamatamah, R.A. The distribution, biological characteristics and vulnerability of the Giant Sea Catfish, Arius thalassinus (Rüppell, 1837), to fishing at Mafia Island, Tanzania. West. Indian Ocean J. Mar. Sci. 2014, 13, 163–175. [Google Scholar]
- Kutsyna, D.N.; Ablyazova, E.R.; Truong, B.H.; Cu, N.D. The size–age structure, growth, and maturation of the Spotted Catfish Arius maculatus (Thunberg, 1792) (Siluriformes: Ariidae) from the Mekong Delta, Vietnam. Russ. J. Mar. Biol. 2021, 47, 56–63. [Google Scholar] [CrossRef]
- Randall, J.E. Coastal Fishes of Oman; University of Hawaii Press: Honolulu, HI, USA, 1995; p. 439. [Google Scholar]
- Chu, W.S.; Hou, Y.Y.; Ueng, Y.T.; Wang, J.P.; Chen, H.C. Estimates of age, growth and mortality of Spotted Catfish, Arius maculatus (Thunberg, 1792), off the coast of Yunlin, southwestern Taiwan. Afr. J. Biotechnol. 2011, 10, 15416–15421. [Google Scholar] [CrossRef] [Green Version]
- Bal, D.V.; Rao, K.V. Marine Fisheries of India; Tata McGraw–Hill Publishing Company Ltd.: New Delhi, India, 1984; p. 472. [Google Scholar]
- Bhaskar, B. Age and growth studies of the Thinspine Marine Catfish Plicofollis tenuispinis (Day, 1877) landed along the Veraval centre of the Saurashtra coast, India. Res. J. Mar. Sci. 2018, 6, 1–5. [Google Scholar]
- Farooq, N.; Qamar, N.; Rashid, S.; Panhwar, S.K. Length-weight relationship of eleven species of marine Catfishes from the northern Arabian Sea coast of Pakistan. Chin. J. Oceanol. Limnol. 2017, 35, 1218–1220. [Google Scholar] [CrossRef]
- Dan, S.S. Maturity, spawning and fecundity of Catfish Tachysurus tenuispinis (Day). Indian J. Fish. 1977, 24, 90–95. [Google Scholar]
- Vijayakumaran, K. Growth and mortality parameters and some aspects of biology of Striped Eel-Catfish Plotosus Lineatus (Thunberg) from north Andhra Pradesh coast. J. Mar. Biol. Assoc. India 1997, 39, 108–112. [Google Scholar]
- Thresher, R.E. Reproduction in Reef Fishes; T.F.H. (Tropical Fish Hobbyist) Publications: Neptune City, NJ, USA, 1984; p. 399. [Google Scholar]
- Shindo, S. Note on the study on the stock of Lizard Fish, Saurida tumbil in the East China Sea. In Proc. Indo-Pacific Fish. Council 13; Food and Agriculture Organization (FAO) of the United Nations: Wellington, New Zealand, 1972; pp. 298–305. [Google Scholar]
- Metar, S.Y.; Chakraborty, S.K.; Jaiswar, A.K.; Telvekar, P.A. Maturity, spawning and fecundity of Saurida tumbil (Bloch, 1795) from Mumbai Waters. J. Indian Fish. Assoc. 2009, 36, 35–40. [Google Scholar]
- Firdaus, M.; Soemarno; Bintoro, G.; Lelono, D.T.D. Growth and age structure of Nomei (Harpadon nehereus, Ham. 1822) in Juata Laut waters of Tarakan Island, North Borneo, Indonesian. Int. J. Sci. Basic Appl. Res. 2017, 31, 208–218. [Google Scholar]
- Fernandez, I.; Devaraj, M. Dynamics of the Bombay duck (Harpodon nehereus) stock along the northwest coast of India. Indian J. Fish. 1996, 43, 1–11. [Google Scholar]
- Ghosh, S.; Pillai, N.G.K.; Dhokia, H.K. Fishery and population dynamics of Harpadon nehereus (Ham.) off the Saurashtra coast. Indian J. Fish. 2009, 56, 13–19. [Google Scholar]
- Balli, J.J.; Chakraborty, S.K.; Jaiswar, A.K. Biology of Bombay duck, Harpodon nehereus (Ham., 1822), from Mumbai waters, India. J. Indian Fish. Assoc. 2006, 33, 1–10. [Google Scholar]
- Chakraborty, S.K.; Biradar, R.S.; Jaiswar, A.K.; Palaniswamy, R. Population Parameters of Some Commercially Important Fishery Resources of Mumbai Coast; Central Institute of Fisheries Education (CIFE): Mumbai, India, 2005; pp. 1–63. [Google Scholar]
- Kandula, S.; Shrikanya, K.V.L.; Iswarya Deepti, V.A. Species diversity and some aspects of reproductive biology and life history of Groupers (Pisces: Serranidae: Epinephelinae) off the central eastern coast of India. Mar. Biol. Res. 2014, 11, 18–33. [Google Scholar] [CrossRef] [Green Version]
- Heemstra, P.C.; Randall, J.E. Groupers of the World (Family Serranidae, Subfamily Epinephelinae): An Annotated and Illustrated Catalogue of the Grouper, Rockcod, Hind, Coral Grouper and Lyretail Species Known to Date; Food and Agriculture Organization (FAO) of the United Nations: Rome, Italy, 1993; Volume 16, p. 382. [Google Scholar]
- Meetei, K.B.; Haq, M.A.B.; Mary, R.; Ravichandran, S.; Tiwary, C. Maturation and spawning habits in Epinephelus malabaricus (Bloch and Scheneider, 1801) from Mandapam coastal waters, southeast coast of India. Solid State Technol. 2020, 63, 8127–8147. [Google Scholar]
- Kirubasankar, R.; Roy, S.D.; Grinson-George; Kamal-Sarma; Krishnan, P.; Kumar, S.R.; Kaliyamoorthy, M.; Goutham-Bharathi, M.P. Fishery and exploitation of Malabar Grouper, Epinephelus malabaricus (Bloch & Schneider 1801) from Andaman Islands. Asian Fish. Sci. 2013, 26, 167–175. [Google Scholar] [CrossRef]
- Abu El-Nasr, T.M.; El-Drawany, M.A. Some biological studies on Terapon puta (Cuvier, 1829) in the Lake Timsah, Egypt 1-age, growth and mortality of Terapon puta (Spinycheek Grunter). Merit Res. J. Agric. Sci. Soil Sci. 2017, 5, 108–114. [Google Scholar]
- Khan, M.A.; Imad, A. Population dynamics of Terapon Jarbua (Forskal) in coastal area of Pakistani waters. Pak. J. Mar. Sci. 2000, 9, 91–96. [Google Scholar]
- Nandikeswari, R.; Sambasivam, M.; Anandan, V. Estimation of fecundity and gonadosomatic index of Terapon jarbua from Pondicherry coast, India. Int. J. Nutr. Food Eng. 2014, 8, 61–65. [Google Scholar]
- Balon, E.K. Reproductive guilds of fishes: A proposal and definition. J. Fish. Res. Board Can. 1975, 32, 821–864. [Google Scholar] [CrossRef]
- Nandikeswari, R. Size at first maturity and maturity stages of Terapon jarbua (Forsskal, 1775) from Pondicherry coast, India. J. Fish. 2016, 4, 385–389. [Google Scholar] [CrossRef]
- Sawant, P.P.; Nirmale, V.H.; Metar, S.Y.; Bhosale, B.P.; Chogale, N.D. Biology of Indian Sand Whiting, Sillago sihama (Forsskal) along the Ratnagiri coast. Indian J. Geo-Marine Sci. 2017, 46, 1899–1907. [Google Scholar]
- El-Aiatt, A.A.O. Growth, mortality and yield per recruit of the Shrimp Scad (Alepes djedaba) from Mediterranean coast of Sinai Egypt. Abbassa Int. J. Aqua. 2018, 11, 86–108. [Google Scholar]
- Bandkar, D.S.; Nirmale, V.H.; Metar, S.Y.; Pawar, R.A. Estimation of population parameters of Shrimp Scad, Alepes djedaba (Forsskål, 1775) along the Ratnagiri coast of Maharashtra, India. J. Indian Fish. Assoc. 2019, 46, 67–73. [Google Scholar]
- Sajana, N.; Nandan, S.B.; Radhakrishnan, C.K. Feeding behaviour and reproductive biology of the Shrimp Scad Alepes djedaba (Forsskal, 1775) off Cochin coast, Kerala, south India. Indian J. Fish. 2019, 66, 32–40. [Google Scholar] [CrossRef]
- Smith-Vaniz, W.F. Carangidae. In Fishes of the North-Eastern Atlantic and the Mediterranean; Whitehead, P.J.P., Bauchot, M.L., Hureau, J.C., Nielsen, J., Tortonese, E., Eds.; United Nations Educational, Scientific and Cultural Organization (UNESCO): Paris, France, 1986; pp. 815–844. [Google Scholar]
- Reuben, S.; Kaslm, H.M.; Sivakami, S.; Nair, P.N.R.; Kurup, K.N.; Sivadas, M.; Noble, A.; Nair, K.V.S.; Raje, S.G. Fishery, biology and stock assessment of Carangid resources from the Indian seas. Indian J. Fish. 1992, 39, 195–234. [Google Scholar]
- Smith-Vaniz, W.F. Carangidae: Jacks and Scads (also Trevallies, Queenfishes, Runners, Amberjacks, Pilotfishes, Pampanos, etc.). In FAO Species Identification Guide for Fishery Purposes: The Living Marine Resources of the Western Central Pacific; Carpenter, K.E., Niem, V.H., Eds.; Food and Agriculture Organization (FAO) of the United Nations: Rome, Italy, 1999; Volume 4: Part 2, pp. 2659–2756. [Google Scholar]
- Rajesh, D.P.; Anjanayappa, H.N.; Prasad, L.G.; Benakappa, S. Population characteristics of Atropus atropos (Bloch and Schneider, 1801) from Mangalore coast, India. Int. J. Curr. Res. 2019, 11, 6574–6577. [Google Scholar] [CrossRef]
- Rajesh, D.P.; Anjanayappa, H.N.; Benakappa, S. Maturation and spawning frequencies of Atropus atropos from Mangalore coast, Karnataka, India. J. Fish. Life Sci. 2018, 3, 46–53. [Google Scholar]
- Noegroho, T.; Adrianto, L.; Sulistiono; Boer, M. Productivity and susceptibility analysis of Indo-Pacific King Mackerel in IFMA 711 waters. IOP Conf. Ser. Earth Environ. Sci. 2021, 744, 012049. [Google Scholar] [CrossRef]
- Panda, D.; Jaiswar, A.K.; Sarkar, S.D.; Chakraborty, S.K. Growth, mortality and exploitation of Bigeye Scad, Selar crumenophthalmus off Mumbai, north-west coast of India. J. Mar. Biol. Assoc. U.K. 2015, 96, 1411–1416. [Google Scholar] [CrossRef]
- Gallardo-Cabello, M.; Espino-Barr, E.; Puente-Gómez, M.; Garcia-Boa, A. Reproduction of Bigeye Scad Selar crumenophthalmus (Teleostei: Carangidae) in the Mexican Pacific coast. Asian J. Sci. Technol. 2017, 8, 4536–4542. [Google Scholar]
- Aprilla, R.M.; Musfidah, A.; Chaliluddin, M.A.; Damora, A.; Rusydi, I. Analysis of catch composition in Gampong Deah Raya, Syiah Kuala, Banda Aceh. IOP Conf. Ser. Earth Environ. Sci. 2021, 674, 012038. [Google Scholar] [CrossRef]
- Clarke, T.A.; Privitera, L.A. Reproductive biology of two Hawaiian pelagic Carangid fishes, the Bigeye Scad, Selar crumenophthalmus, and the Round Scad, Decapturus macarellus. Bull. Mar. Sci. 1995, 56, 33–47. [Google Scholar]
- Kamali, E.; Rastgoo, A.R.; Darvishi, M.; Dehghani, R. Determination of reproductive stages, sex ratio, length maturity and fecundity of Indian Driftfish in the Hormozgan Province. In The 6th Iranian Conference of Ichthyology; Shahid Bahonar University of Kerman: Kerman, Iran, 2018; pp. 55–56. [Google Scholar]
- Patzner, R.A. Reproductive strategies of fish. In Fish Reproduction: Cytology, Biology and Ecology; Rocha, M.J., Arukwe, A., Kapoor, B.G., Eds.; Chemical Rubber Company (CRC) Press: Boca Raton, FL, USA, 2008; pp. 311–350. [Google Scholar]
- Haedrich, R.L. Ariommidae. In FAO Species Identification Sheets for Fishery Purposes: Western Indian Ocean Fishing Area 51; Fischer, W., Bianchi, G., Eds.; Food and Agriculture Organization (FAO) of the United Nations: Rome, Italy, 1984; Volume I, pp. 1–4. [Google Scholar]
- Yadollahvand, R.; Rahnama, B. The age determination of Black Pomfret (Parastromateus niger), based on otolith cross sections in Iranian coast of Oman Sea. J. Aquac. Res. Dev. 2014, 5, 1000261. [Google Scholar] [CrossRef] [Green Version]
- Karim, E.; Liu, Q.; Rahman, M.F.; Khatun, M.H.; Barman, P.P.; Shamsuzzaman, M.M.; Mahmud, Y. Comparative assessment of population biology of three popular pomfret species, Pampus argenteus, Pampus chinensis and Parastromateus niger in the Bay of Bengal, Bangladesh. Iran. J. Fish. Sci. 2020, 19, 793–813. [Google Scholar] [CrossRef]
- Hoque, M.N.; Das, N.G.; Sharif, A.S.M.; Das, J.; Kamal, A.H.M. Maturation patterns of Black Pomfret (Parastromateus niger) from coastal waters of the Bay of Bengal, Bangladesh. J. Noakhali Sci. Technol. Univ. 2018, 2, 1–9. [Google Scholar]
- Hernando, A.M., Jr. Contributions to the Taxonomy and Biology of Formio niger (Bloch) in Lingayen Gulf. Master’s Thesis, College of Arts and Sciences, University of the Philippines Diliman, Quezon City, Philippines, 1981. [Google Scholar]
- Pauly, D. The use of pseudo catch-curve for the estimation of mortality rates in Leiognathus splendens (Pisces: Leiognathidae) in western Indonesian waters. Ber. Dtsch. Wiss. Komm. Meeresforsch. 1980, 28, 56–60. [Google Scholar]
- James, P.S.B.R.; Badrudeen, M. Studies on the maturation and spawning of the fishes of the family Leiognathidae from the seas around India. Indian J. Fish. 1986, 33, 1–26. [Google Scholar]
- Abraham, K.J.; Murty, V.S.R.; Joshi, K.K. Fishery and population dynamics of Silverbellies along the Kerala coast. Indian J. Fish. 2011, 58, 15–21. [Google Scholar]
- Abraham, K.J.; Murty, V.S.R.; Joshi, K.K. Reproductive biology of Leiognathus splendens (Cuvier) from Kochi, south-west coast of India. Indian J. Fish. 2011, 58, 23–31. [Google Scholar]
- Arora, H.L. A contribution to the biology of the Silver Belly, Leiognathus splendens (Cuv.). In Proc. Indo-Pacific Fish. Council 3; Food and Agriculture Organization (FAO) of the United Nations: Quezon City, Philippines, 1952; pp. 75–80. [Google Scholar]
- Sivashanthini, K. Population dynamics of a Whip-fin Silverbiddy Gerres filamentosus Cuvier, 1829 from the Parangipettai waters, southeast coast of India. Asian Fish. Sci. 2009, 22, 1149–1162. [Google Scholar] [CrossRef]
- Sivashanthini, K. Reproductive biology of the Whip-fin Silverbiddy Gerres filamentosus Cuvier, 1829 from the Parangipettai waters (SE coast of India). Asian Fish. Sci. 2008, 21, 127–145. [Google Scholar]
- Blaber, S.J.M. Fish and Fisheries of Tropical Estuaries; Chapman and Hall: London, UK, 1997; p. 367. [Google Scholar]
- Asim, M. Age and Growth through Scale, Otolith, Maturation and Fecundity of Common Snappers Lutjanus lutjanus and Lutjanus johnii (Family Lutjanidae) in Pakistani Waters with Special Reference to Distribution on Sindh Coast. Ph.D. Thesis, Department of Zoology, University of Karachi, Karachi, Pakistan, 2016. [Google Scholar]
- Allen, G.R. Snappers of the World: An Annotated and Illustrated Catalogue of Lutjanid Species Known to Date; Food and Agriculture Organization (FAO) of the United Nations: Rome, Italy, 1985; Volume 6, p. 208. [Google Scholar]
- Bouhlel, M. Poissons de Djibouti (in French); Resource Description and Access (RDA) International Inc.: Placerville, CA, USA, 1988; p. 416. [Google Scholar]
- Al Mamry, J.M.; McCarthy, I.D.; Richardson, C.A.; Ben Meriem, S. Biology of the Kingsoldier Bream (Argyrops spinifer, Forsskål 1775; Sparidae), from the Arabian Sea, Oman. J. Appl. Ichthyol. 2009, 25, 559–564. [Google Scholar] [CrossRef]
- Al-Kiyumi, F.; Mehanna, S.F.; Al-Kharusi, L. Growth, mortality and yield per recruit of the Kingsoldier Bream Argyrops spinifer (Sparidae) from the Oman coast of the Arabian Sea. Iran. J. Fish. Sci. 2013, 12, 737–748. [Google Scholar]
- El-Sayed, A.F.M.; Abdel-Bary, K. Population biology of Sparid fishes in Qatari waters. 1- Reproductive cycle and fecundity of Longspine Seabream, Argyrops spinifer (Forskal). Qatar Univ. Sci. J. 1993, 13, 177–181. [Google Scholar]
- Kalhoro, M.A.; Liu, Q.; Memon, K.H.; Chang, M.S.; Zhang, K. Population dynamics of Japanese Threadfin Bream Nemipterus japonicus from Pakistani waters. Acta Oceanol. Sin. 2014, 33, 49–57. [Google Scholar] [CrossRef]
- Manojkumar, P.P. Some aspects on the biology of Nemipterus japonicus (Bloch) from Veraval in Gujarat. Indian J. Fish. 2004, 51, 185–191. [Google Scholar]
- Erguden, D.; Turan, C.; Gurlek, M.; Yaglioglu, D.; Gungor, M. Age and growth of the Randall’s Threadfin Bream Nemipterus randalli (Russell, 1986), a recent Lessepsian migrant in Iskenderun Bay, northeastern Mediterranean. J. Appl. Ichthyol. 2010, 26, 441–444. [Google Scholar] [CrossRef]
- Kalhoro, M.A.; Tang, D.L.; Ye, H.J.; Morozov, E.; Liu, Q.; Memon, K.H.; Kalhoro, M.T. Population dynamics of Randall’s Threadfin Bream Nemipterus randalli from Pakistani waters, northern Arabian Sea. Indian J. Geo-Marine Sci. 2017, 46, 551–561. [Google Scholar]
- CMFRI. Annual Report 2011–2012; Central Marine Fisheries Research Institute: Cochin, India, 2012; p. 274. [Google Scholar]
- Russell, B.C. Nemipterid Fishes of the World (Threadfin Breams, Whiptail Breams, Monocle Breams, Dwarf Monocle Breams, and Coral Breams), Family Nemipteridae: An Annotated and Illustrated Catalogue of Nemipterid Species Known to Date; Food and Agriculture Organization (FAO) of the United Nations: Rome, Italy, 1990; Volume 12, p. 149. [Google Scholar]
- Demirci, S.; Demirci, A.; Simsek, E. Spawning season and size at maturity of a migrated fish, Randall’s Threadfin Bream (Nemipterus randalli) in Iskenderun Bay, northeastern Mediterranean, Turkey. Fresenius Environ. Bull. 2018, 27, 503–507. [Google Scholar]
- Balachandran, R.; Purushottama, G.B.; Zacharia, P.U.; Naik, M. Observations on the biology of Smooth Dwarf Monocle Bream, Parascolopsis aspinosa (Rao & Rao, 1981) from Mangaluru, southwest coast of India. J. Mar. Biol. Assoc. India 2020, 62, 5–12. [Google Scholar] [CrossRef]
- Naik, S.K. Some Studies on the Biology of Nemipterids of Goa Coast. Ph.D. Thesis, Department of Zoology, Goa University, Goa, India, 2000. [Google Scholar]
- Chakraborty, S.K. Growth, mortality and yield per recruit of Bearded Croaker Johnius dussumieri (Val.) from Mumbai waters. Indian J. Fish. 1997, 44, 45–49. [Google Scholar]
- Savant, V.V.; Bal, D.V. Maturation and spawning of Johnius dussumieri (Cuv. and Val.). In Indian Academy of Sciences, Proceedings—Section B; Indian Academy of Sciences: Bengaluru, India, 1969; Volume 70, pp. 66–79. [Google Scholar]
- Somasekharan Nair, K.V.S. Maturity and spawning of Johnius (Johnieops) sina (Cuvier) at Calicut during 1969–1972. Indian J. Fish. 1977, 24, 15–24. [Google Scholar]
- Sriramachandra Murty, V. Observations on some aspects of biology of the Croakers Johnius (Johnieops) dussumieri (Cuvier) and Johnius (Johnius) carutta Bloch from Kakinada. J. Mar. Biol. Assoc. India. 1979, 21, 77–85. [Google Scholar]
- Jarzhombek, A.A. Compilation of Studies on the Growth of Acanthopterygii (in Russian); Russian Federal Research Institute of Fisheries and Oceanography: Moscow, Russia, 2007; p. 86. [Google Scholar]
- Ghosh, S.; Mohanraj, G.; Asokan, P.K.; Dhokia, H.K.; Zala, M.S.; Bhint, H.M.; Anjani, S. Fishery and population dynamics of Protonibea diacanthus (Lacepede) and Otolithoides biauritus (Cantor) landed by trawlers at Vanakbara, Diu along the west coast of India. Indian J. Fish. 2010, 57, 15–20. [Google Scholar]
- Ghosh, S.; Mohanraj, G.; Asokan, P.K.; Dhokia, H.K.; Zala, M.S.; Bhint, H.M. Trophodynamics and reproductive biology of Otolithoides biauritus (Cantor) landed by trawlers at Vanakbara, Diu along the west coast of India. Indian J. Fish. 2009, 56, 261–265. [Google Scholar]
- Karna, S.K.; Sahoo, D.K.; Panda, S. Length–weight relationship (LWR), growth estimation and length at maturity of Eleutheronema tetradactylus in the Chilika Lagoon, India. South Asian J. Exp. Biol. 2012, 2, 97–102. [Google Scholar] [CrossRef]
- Nesarul, H.M.; Abu Hena, M.K.; Saifullah, S.M.; Idris, M.H. Breeding biology of Eleutheronema tetradactylum (Shaw, 1804) from the Bay of Bengal, Indian Ocean. World Appl. Sci. J. 2014, 30, 240–244. [Google Scholar] [CrossRef]
- Kailola, P.J.; Williams, M.J.; Stewart, P.C.; Reichelt, R.E.; McNee, A.; Grieve, C. Australian Fisheries Resources; Bureau of Resource Sciences: Canberra, Australia, 1993; p. 422. [Google Scholar]
- Menon, A.G.K.; Rao, M.B. Polynemidae. In FAO Species Identification Sheets for Fishery Purposes: Western Indian Ocean Fishing Area 51; Fischer, W., Bianchi, G., Eds.; Food and Agriculture Organization (FAO) of the United Nations: Rome, Italy, 1984; Volume III, pp. 1–10. [Google Scholar]
- Rao, T.R. Enhancement of Natural Populations of Moi (Polydactylus sexfilis) in Hawaii through the Release of Hatchery-Reared Juveniles: A Feasibility Study of Sea Ranching (Technical Report No. 33); Hawaii Institute of Marine Biology: Honolulu, HI, USA, 1977; pp. 1–46. [Google Scholar]
- Pakhmode, P.K.; Mohite, S.A.; Naik, S.D.; Mohite, A.S. Length–frequency analysis and length–weight relationship of Ribbon fish Lepturacanthus savala (Cuvier1829) off Ratnagiri coast Maharashtra. Int. J. Fish. Aquat. Stud. 2013, 1, 25–30. [Google Scholar]
- Azadi, M.A.; Ullah, M. Reproductive biology of the Ribbon fish, Lepturacanthus savala (Cuvier, 1829) from the Bay of Bengal, Bangladesh. Chittagong Univ. J. Biol. Sci. 2007, 2, 127–136. [Google Scholar]
- Nakamura, I.; Parin, N.V. Snake Mackerels and Cutlassfishes of the World (Families Gempylidae and Trichiuridae): An Annotated and Illustrated Catalogue of the Snake Mackerels, Snoeks, Escolars, Gemfishes, Sackfishes, Domine, Oilfish, Ncutlassfishes, Scabbardfishes, Hairtails, and Frostfishes Known to Date; Food and Agriculture Organization (FAO) of the United Nations: Rome, Italy, 1993; Volume 15, p. 136. [Google Scholar]
- Akhter, F.; Islam, M.M.; Mamun, M.M.U.; Zahangir, M.M. Gonadal maturation cycle of Silver Promfet (Pampus argenteus) from the Bay of Bengal, Bangladesh. In Proceedings of the 8th BFRF Biennaial Fisheries Conference and Research Fair, Dhaka, Bangladesh, 30–31 March 2019. [Google Scholar]
- Bunlipatanon, P.; Detsathit, S.; Soonsum, P. Reproductive Biology and Preliminary Study on Breeding of Grey Pomfret, Pampus chinensis (Euphrasen): Technical Paper No. 17; Krabi Coastal Aquaculture Station: Krabi, Thailand, 2002; pp. 1–32. [Google Scholar]
- Lee, D.W.; Kim, Y.M.; Hong, B.Q. Age and Growth of Silver Pomfret (Pampus argenteus) in Korean Waters; National Fisheries Research and Development Institute: Busan, Korea, 1992; pp. 31–40. [Google Scholar]
- Ghosh, S.; Mohanraj, G.; Asokan, P.K.; Dhokia, H.K.; Zala, M.S.; Bhint, H.M. Fishery and stock estimates of the Silver Pomfret, Pampus argenteus (Euphrasen), landed by gill netters at Veraval. Indian J. Fish. 2009, 56, 177–182. [Google Scholar]
- Armstrong, M.P.; Crabtree, R.E.; Murphy, M.D.; Muller, R.G. A Stock Assessment of Tripletail, Lobotes Surinamensis, in Florida Waters; Florida Marine Research Institute: St. Petersburg, FL, USA, 1996; pp. 1–32. [Google Scholar]
- Robins, C.R.; Ray, G.C. A Field Guide to Atlantic Coast Fishes of North America; Houghton Mifflin Harcourt: Boston, MA, USA, 1986; p. 512. [Google Scholar]
- Parr, R.T.; Bringolf, R.B.; Jennings, C.A. Efficacy of otoliths and first dorsal spines for preliminary age and growth determination in Atlantic Tripletails. Mar. Coast. Fish. 2018, 10, 71–79. [Google Scholar] [CrossRef] [Green Version]
- Jefferson, A.E.; Jargowsky, M.B.; Schrandt, M.N.; Cooper, P.T.; Powers, S.P.; Dindo, J.J.; Drymon, J.M. Age, growth, and mortality of Atlantic Tripletail in the North-Central Gulf of Mexico. Mar. Coast. Fish. 2021, 13, 183–199. [Google Scholar] [CrossRef]
- Brown–Peterson, N.J.; Franks, J.S. Aspects of the Reproductive Biology of Tripletail, Lobotes surinamensis, in the Northern Gulf of Mexico; Gulf Coast Research Laboratory: Ocean Springs, MS, USA, 2001; pp. 586–597. [Google Scholar]
- Parr, R.T. Age, Growth, and Reproductive Status of Tripletail (Lobotes surinamensis) in the Aggregation Nearshore Jekyll Island, GA, USA. Master’s Thesis, University of Georgia, Athens, GA, USA, 2011. [Google Scholar]
- Strelcheck, A.J.; Jackson, J.B.; Cowan, J.H., Jr.; Shipp, R.L. Age, growth, diet, and reproductive biology of the Tripletail, Lobotes surinamensis, from the North-Central Gulf of Mexico. Gulf Mex. Sci. 2004, 22, 1–9. [Google Scholar] [CrossRef]
- Parr, R.T.; Jennings, C.A.; Denslow, N.D.; Kroll, K.J.; Bringolf, R.B. Evaluation of reproductive status in Atlantic Tripletail by traditional and nonlethal approaches. Mar. Coast. Fish. 2016, 8, 16–22. [Google Scholar] [CrossRef] [Green Version]
- Baset, A.; Liu, Q.; Liao, B.; Waris, A.; Yanan, H.; Qingqing, Z. Population dynamics of Rainbow Sardines, Dussumieria acuta (Valenciennes, 1847) from Pakistani waters. Int. J. Aquac. Fish. Sci. 2020, 6, 29–34. [Google Scholar] [CrossRef]
- Halesha, K.; Anjanayappa, H.N.; Naik, M.; Naik, J.; Rajesh, D.P.; Nayana, P. Breeding biology of Rainbow Sardine, Dussumieria acuta from Mangaluru region. Biochem. Cell. Arch. 2017, 17, 327–331. [Google Scholar]
- Najmudeen, T.M.; Seetha, P.K.; Zacharia, P.U. Fishery and population dynamics of the Obtuse Barracuda Sphyraena obtusata (Cuvier) landed by trawlers at Cochin, south-west coast of India. Indian J. Fish. 2015, 62, 14–18. [Google Scholar]
- Sajeevan, M.K.; Kurup, B.M. Stock assessment of Cobia Rachycentron canadum (Linnaeus, 1766) occurring in north-west coast of India. Indian J. Geo-Marine Sci. 2016, 45, 378–387. [Google Scholar]
- Sajeevan, M.K.; Kurup, B.M. Fecundity and spawning frequency of Cobia, Rachycentron canadum (Linnaeus, 1766) from the north-west coast of India. Indian J. Geo-Marine Sci. 2016, 45, 933–936. [Google Scholar]
- Sajeevan, M.K.; Kurup, B.M. Maturity, spawning and feeding intensity of Cobia Rachycentron canadum (Linnaeus, 1766) in north-west coast of India. Iran. J. Fish. Sci. 2020, 19, 31–44. [Google Scholar] [CrossRef]
- Grandcourt, E.; Al Abdessalaam, T.; Francis, F.; Al Shamsi, A. Population biology and assessment of the White-Spotted Spinefoot, Siganus canaliculatus (Park, 1797), in the southern Arabian Gulf. J. Appl. Ichthyol. 2007, 23, 53–59. [Google Scholar] [CrossRef]
- Wambiji, N.; Ohtomi, J.; Fulanda, B.; Kimani, E.; Kulundu, N.; Hossain, Y. Morphometric relationship and condition factor of Siganus stellatus, S. canaliculatus and S. sutor (Pisces: Siganidae) from the western Indian Ocean waters. S. Pac. Stud. 2008, 29, 1–15. [Google Scholar]
- Anand, M.; Reddy, P.S.R. Age and growth studies on White-Spotted Rabbitfish Siganus canaliculatus (Park), from the Gulf of Mannar region South India. Indian J. Geo-Marine Sci. 2014, 43, 427–433. [Google Scholar]
- Latuconsina, H.; Affandi, R.; Kamal, M.M.; Butet, N.A. On the assessment of White-Spotted Rabbitfish (Siganus canaliculatus Park, 1797) stock in the Inner Ambon Bay, Indonesia. AACL Bioflux 2020, 13, 1827–1835. [Google Scholar]
- Al-Marzouqi, A.; Jayabalan, N.; Al-Nahdi, A.; Al-Anbory, I. Reproductive biology of the White-spotted Rabbitfish, Siganus canaliculatus (Park, 1797) in the Arabian Sea coast of Oman. West. Indian Ocean J. Mar. Sci. 2011, 10, 73–82. [Google Scholar]
- Motoh, H. Studies on the Fisheries Biology of the Giant Tiger Prawn, Penaeus monodon in the Philippines: Technical Report No. 7; Aquaculture Department, Southeast Asian Fisheries Development Center: Iloilo, Philippines, 1981; pp. 1–128. [Google Scholar]
- Uddin, S.K.N.; Ghosh, S.; Maity, J. Reproductive biology, maturation size and sex ratio of Black Tiger Shrimp (Penaeus monodon Fabricius, 1798) from fishing grounds of Digha coast, West Bengal, India. Int. J. Aquat. Biol. 2015, 3, 372–378. [Google Scholar]
- Ruppert, E.E.; Fox, R.S.; Barnes, R.D. Invertebrate Zoology: A Functional Evolutionary Approach; Thomson-Brooks/Cole: Belmont, CA, USA, 2004; p. 990. [Google Scholar]
- Primavera, J.H. Maturation, reproduction, and broodstock technology. In Biology and Culture of Penaeus monodon; Southeast Asian Fisheries Development Center: Iloilo, Philippines, 1988; pp. 37–57. [Google Scholar]
- Niamaimandi, N.; Arshad, A.; Daud, S.; Saed, R.; Kiabi, B. Growth parameters and maximum age of Prawn, Penaeus semisulcatus (de Haan) in Bushehr waters, Persian Gulf. Iran. J. Fish. Sci. 2008, 7, 187–204. [Google Scholar] [CrossRef]
- Thomas, M.M. Reproduction, fecundity and sex ratio of the Green Tiger Prawn, Penaeus semisulcatus de Haan. Indian J. Fish. 1974, 21, 152–163. [Google Scholar]
- Niamaimandi, N.; Aziz, A.; Siti Khalijah, D.; Che Roos, S.; Kiabi, B. Reproductive biology of the Green Tiger Prawn (Penaeus semisulcatus) in coastal waters of Bushehr, Persian Gulf. ICES J. Mar. Sci. 2008, 65, 1593–1599. [Google Scholar] [CrossRef] [Green Version]
- Jayakody, D.S. Population dynamics of Indian Shrimp (Penaeus indicus, Milne Edwards) on the west coast of Sri Lanka. Asian Fish. Sci. 1988, 1, 135–146. [Google Scholar]
- Teikwa, E.D.; Mgaya, Y.D. Abundance and reproductive biology of the Penaeid Prawns of Bagamoyo coastal waters, Tanzania. West. Indian Ocean J. Mar. Sci. 2004, 2, 117–125. [Google Scholar]
- Pauly, D. A method to estimate the stock-recruitment relationship of Shrimps. Trans. Am. Fish. Soc. 1982, 111, 13–20. [Google Scholar] [CrossRef]
- Jayawardane, P.A.A.T.; Mclusky, D.S.; Tytler, P. Reproductive biology of Penaeus indicus (H. Milne Edwards, 1837) from the western coastal waters of Sri Lanka. Asian Fish. Sci. 2002, 15, 315–328. [Google Scholar] [CrossRef]
- Safaie, M. Population dynamics for Banana Prawns, Penaeus merguiensis de Man, 1888 in coastal waters off the northern part of the Persian Gulf, Iran. Trop. Zool. 2015, 28, 9–22. [Google Scholar] [CrossRef]
- Bhadra, S.; Biradar, R.S. Population dynamics of Penaeid Prawn Penaeus merguiensis off Mumbai coast. J. Indian Fish. Assoc. 2000, 27, 65–77. [Google Scholar]
- Crocos, P.J.; Kerr, J.D. Maturation and spawning of the Banana Prawn Penaeus merguiensis de Man (Crustacea: Penaeidae) in the Gulf of Carpentaria, Australia. J. Exp. Mar. Biol. Ecol. 1983, 69, 37–59. [Google Scholar] [CrossRef]
- Sukumaran, K.K.; Deshmukh, V.D.; Rao, G.S.; Alagaraja, K.; Sathianandan, T.V. Stock assessment of the Penaeid Prawn Metapenaeus monoceros Fabricius along the Indian coast. Indian J. Fish. 1993, 40, 20–34. [Google Scholar]
- Nandakumar, G. Reproductive biology of the Speckled Shrimp Metapenaeus monoceros (Fabricius). Indian J. Fish. 2001, 48, 1–8. [Google Scholar]
- Nalini, C. Observations on the maturity and spawning of Metapenaeus monoceros (Fabricius) at Cochin. Indian J. Fish. 1976, 23, 23–30. [Google Scholar]
- Rao, G.S. Studies on the Reproductive biology of the Brown Prawn Metapenaeus monoceros (Fabricius, 1798) along the Kakinada coast. Indian J. Fish. 1989, 36, 107–123. [Google Scholar]
- Manasirli, M. Some properties reproductive of the Speckled Shrimp (Metapenaeus monoceros Fabricius, 1798) in the north-eastern Mediterranean. Iran. J. Fish. Sci. 2015, 14, 485–493. [Google Scholar]
- Rajyalakshmi, T. Observations on the biology and fishery of Metapenaeus brevicornis (M. Edw.) in the Hooghly estuarine system. Indian J. Fish. 1961, 8, 383–402. [Google Scholar]
- Dichmont, C.M.; Loneragan, N.R.; Brewer, D.T.; Poiner, I.R. Partnerships towards sustainable use of Australia’s Northern Prawn Fishery. In Fisheries Management: Progress Towards Sustainability; McClanahan, T.R., Castilla, J.C., Eds.; Blackwell Publishing: Oxford, UK, 2007; pp. 205–230. [Google Scholar]
- George, M.J. Synopsis of biological data on the Penaeid Prawn Metapenaeus brevicornis (H. Milne Edwards, 1837). In Proceedings of the World Scientific Conference on the Biology and Culture of Shrimps and Prawns: FAO Fisheries Synopsis No.105; Food and Agriculture Organization (FAO) of the United Nations: Mexico City, Mexico, 1967; pp. 1559–1573. [Google Scholar]
- Subrahmanyam, C.B. Notes on the bionomics of the Penaeid Prawn Metapenaeus affinis (Milne Edwards) of the Malabar coast. Indian J. Fish. 1963, 10, 11–22. [Google Scholar]
- Dash, G.; Mohammed, K.K.; Sen, S.; Sreenath, K.R.; Vase, V.K.; Pradhan, R.K.; Sukhdhane, K.; Divu, D.; Solanki, V.; Maheswarudu, G. Fishery, population dynamics and stock status of Jinga Shrimp, Metapenaeus affinis (Milne-Edwards, 1837) from Gujarat waters of India. Indian J. Geo-Marine Sci. 2018, 47, 2267–2277. [Google Scholar]
- Rao, P.V. Maturation and Spawning of the Penaeid Prawns of the Southwest Coast of India; Food and Agriculture Organization (FAO) of the United Nations: Rome, Italy, 1968; pp. 285–302. [Google Scholar]
- George, M.J. Synopsis of biological data on the Penaeid Prawn Metapenaeus affinis (H. Milne Edwards, 1837). In Proceedings of the World Scientific Conference on the Biology and Culture of Shrimps and Prawns: FAO Fisheries Synopsis No. 98; Food and Agriculture Organization (FAO) of the United Nations: Mexico City, Mexico, 1967; pp. 1359–1375. [Google Scholar]
- Rajyalakshmi, T. On the age and growth of some estuarine Prawns. In Proc. Indo-Pacific Fish. Council 11; Food and Agriculture Organization (FAO) of the United Nations: Honolulu, HI, USA, 1966; pp. 52–83. [Google Scholar]
- Rao, P.V. Synopsis of biological data on the Penaeid Prawn Parapenaeopsis stylifera (H. Milne Edwards, 1837). In Proceedings of the World Scientific Conference on the Biology and Culture of Shrimps and Prawns: FAO Fisheries Synopsis No. 106; Food and Agriculture Organization (FAO) of the United Nations: Mexico City, Mexico, 1967; pp. 1575–1605. [Google Scholar]
- Sukumaran, K.K.; Rajan, K.N. On the biology of the Penaeid Parapenaeopsis sculptilis (Heller) in the Bombay area. Indian J. Fish. 1986, 33, 440–449. [Google Scholar]
- Geetha, S.; Nair, N.B. Reproductive biology of Parapenaeopsis stylifera. J. Indian Fish. Assoc. 1992, 22, 1–12. [Google Scholar]
- Tzeng, T.D.; Yeh, S.Y. Estimates of biological parameters of Sword Prawn (Parapenaeopsis hardwickii) in the adjacent waters off Taichung Harbor. J. Fish. Soc. Taiwan 2000, 27, 241–251. [Google Scholar]
- Sukumaran, K.K.; Rajan, K.N. Studies on the fishery and biology of Parapenaeopsis hardwickii (Miers) from Bombay area. Indian J. Fish. 1981, 28, 143–153. [Google Scholar]
- Smith, G.S.; Sumpton, W.D. Sand Crabs a valuable fishery in southeast Queensland. Qld. Fisherman 1987, 5, 13–15. [Google Scholar]
- Ng, P.K.L. Crabs. In FAO Species Identification Guide for Fishery Purposes: The Living Marine Resources of the Western Central Pacific; Carpenter, K.E., Niem, V.H., Eds.; Food and Agriculture Organization (FAO) of the United Nations: Rome, Italy, 1998; Volume 2, pp. 1045–1155. [Google Scholar]
- Dineshbabu, A.P.; Shridhara, B.; Muniyappa, Y. Biology and exploitation of the Blue Swimmer Crab, Portunus pelagicus (Linnaeus, 1758), from south Karnataka coast, India. Indian J. Fish. 2008, 55, 215–220. [Google Scholar]
- Josileen, J. Fecundity of the Blue Swimmer Crab, Portunus pelagicus (Linnaeus, 1758) (Decapoda, Brachyura, Portunidae) along the coast of Mandapam, Tamil Nadu, India. Crustaceana 2013, 86, 48–55. [Google Scholar] [CrossRef]
- Sukumaran, K.K.; Neelakantan, B. Spawning biology of two marine Portunid Crabs, Portunus (Portunus) sanguinolentus (Herbst) and Portunus (Portunus) pelagicus (Linnaeus) from the Karnataka coast. In Proceedings of the 4th Indian Fisheries Forum Proceedings, Kochi, India, 24–28 November 1996. [Google Scholar]
- Meynecke, J.O.; Richards, R.G. A full life cycle and spatially explicit individual-based model for the Giant Mud Crab (Scylla serrata): A case study from a marine protected area. ICES J. Mar. Sci. 2014, 71, 484–498. [Google Scholar] [CrossRef] [Green Version]
- Devi, L.S. The fishery and biology of Crabs of Kakinada region. Indian J. Fish. 1985, 32, 18–32. [Google Scholar]
- Suman, A.; Hasanah, A.; Amri, K.; Pane, A.R.P.; Lestari, P. Population characteristics of Mud Crab (Scylla serrata) in the waters of Kendari Bay and surrounding areas. Indones. Fish. Res. J. 2018, 24, 117–124. [Google Scholar] [CrossRef]
- Prasad, P.N.; Neelakantan, B. Maturity and breeding of the Mud Crab, Scylla serrata (Forskal) (Decapoda: Brachyura: Portunidae). Proc. Indian Acad. Sci. 1989, 98, 341–349. [Google Scholar] [CrossRef]
- Roper, C.F.E.; Sweeney, M.J.; Nauen, C.E. Cephalopods of the World: An Annotated and Illustrated Catalogue of Species of Interest to Fisheries; Food and Agriculture Organization (FAO) of the United Nations: Rome, Italy, 1984; Volume 3, p. 277. [Google Scholar]
- Chakraborty, S.K.; Biradar, R.S.; Jaiswar, A.K.; Palaniswamy, R.; Kumar, P. Growth, mortality and population parameters of three Cephalopod species, Loligo duvauceli (Orbigny), Sepia aculeata (Orbigny) and Sepiella inermis (Orbigny) from north-west coast of India. Indian J. Fish. 2013, 60, 1–7. [Google Scholar]
- Nalwa, M.K.; Kumar, R.; Jaiswar, A.K.; Swamy, R.P. Morphometry, length-weight relationship and biology of Sepia aculeata (d’ Orbigny, 1848) from Mumbai coast, India. J. Indian Fish. Assoc. 2005, 32, 19–27. [Google Scholar]
- Gabr, H.R. Fecundity of Cuttlefish (Sepia officinalis) determined from laboratory egg laying: Implications for fisheries management. Egypt. J. Aquat. Biol. Fish. 2001, 5, 99–116. [Google Scholar] [CrossRef] [Green Version]
- Supongpan, M.; Sinoda, M. Length frequency distribution and growth parameters of the Indian Squid Loligo duvauceli in the Gulf of Thailand. Warasan Kan Pram. 1995, 48, 461–466. [Google Scholar]
- Rao, G.S. Biology of inshore Squid Loligo duvaucelli Orbigny, with a note on its fishery off Mangalore. Indian J. Fish. 1988, 35, 121–130. [Google Scholar]
- Sarvesan, R. Cephalopods. In The Commercial Molluscs of India; Central Marine Fisheries Research Institute (CMFRI): Cochin, India, 1974; pp. 63–83. [Google Scholar]
- Naik, N.R.; Shivaprakash, S.M.; Anjaneyappa, H.N.; Somasekhara, S.R.; Naik, J.; Benakappa, S. Reproductive biology of the commercially important Indian Squid Uroteuthis (Photololigo) duvaucelii (d’ Orbigny [in Ferussac & d’ Orbigny], 1835) off Mangalore, south-west coast of India. Indian J. Fish. 2017, 64, 75–79. [Google Scholar] [CrossRef]
- Riede, K. Global Register of Migratory Species–From Global to Regional Scales: Final Report of the R&D–Projekt 808 05 081; Federal Agency for Nature Conservation: Bonn, Germany, 2004; p. 329. [Google Scholar]
- Islam, M.M.; Begum, P.; Begum, A.; Herbeck, J. When hazards become disasters: Coastal fishing communities in Bangladesh. Environ. Hazards 2021, 20, 533–549. [Google Scholar] [CrossRef]
- Purushottama, G.B.; Raje, S.G.; Thakurdas; Akhilesh, K.V.; Kizhakudan, S.J.; Zacharia, P.U. Biological observations on the Annandale’s Guitarfish Rhinobatos annandalei (Norman, 1926) from coastal waters off the northwest coast of India. In Proceedings of the 11th Indian Fisheries and Aquaculture Forum, Kochi, India, 21–24 November 2017. [Google Scholar]
- Hossain, M.A.R.; Wahab, M.A.; Belton, B. The Checklist of the Riverine Fishes of Bangladesh; WorldFish Center: Dhaka, Bangladesh, 2012; pp. 18–27. [Google Scholar]
- Myers, R.F. Micronesian Reef Fishes; Coral Graphics: Guam, CA, USA, 1991; p. 298. [Google Scholar]
- Frimodt, C. Multilingual Illustrated Guide to the World’s Commercial Warmwater Fish; Fishing News Books: Oxford, UK, 1995; p. 215. [Google Scholar]
- Lieske, E.; Myers, R. Coral reef fishes: Indo-Pacific & Caribbean; HaperCollins Publishers: London, UK, 1994; p. 400. [Google Scholar]
- Sommer, C.; Schneider, W.; Poutiers, J.M. FAO Species Identification Field Guide for Fishery Purposes: The Living Marine Resources of Somalia; Food and Agriculture Organization (FAO) of the United Nations: Rome, Italy, 1996; p. 376. [Google Scholar]
- Russell, B.C. Nemipteridae: Threadfin breams (also whiptail breams, monocle breams, dwarf monocle breams and coral breams). In FAO Identification Guide for Fishery Purposes: The Western Central Pacific; Carpenter, K.E., Niem, V.H., Eds.; Food and Agriculture Organization (FAO) of the United Nations: Rome, Italy, 2001; Volume 5, pp. 3051–3089. [Google Scholar]
- James, P.S.B.R. The Ribbon-Fishes of the Family Trichiuridae of India; Marine Biological Association of India: Mandapam Camp, India, 1967; p. 226. [Google Scholar]
- Akyol, O.; Kara, A. Record of the Atlantic Tripletail, Lobotes surinamensis (Bloch, 1790) in the Bay of Izmir, northern Aegean Sea. J. Appl. Ichthyol. 2012, 28, 645–646. [Google Scholar] [CrossRef]
- Ahmed, Z.F.; Fatema, M.K.; Zohora, U.H.A.; Joba, M.A.; Ahamed, F. Coefficient of algebraic relationship between linear dimensions as growth deduction for Rainbow Sardine Dussumieria acuta in the Bay of Bengal. Res. Agric. Livest. Fish. 2020, 7, 545–551. [Google Scholar] [CrossRef]
- May, J.L.; Maxwell, J.G.H. Trawl Fish from Temperate Waters of Australia; CSIRO Division of Fisheries Research: Tasmania, Australia, 1986; p. 492. [Google Scholar]
- Kuiter, R.H.; Tonozuka, T. Pictorial Guide to Indonesian Reef Fishes (Part 1); Zoonetics: Victoria, Australia, 2001; p. 302. [Google Scholar]
- Shafi, M.; Quddus, M.M.A. Fisheries Resources of Bangladesh (in Bengali); Bangla Academy: Dhaka, Bangladesh, 1982; p. 442. [Google Scholar]
- Muthu, M.S.; Alagarswami, K.; Kathirvel, M. Prawn Farming-Candidate Species; Central Institute of Brackishwater Aquaculture: Madras, India, 1992; pp. 1–32. [Google Scholar]


| Productivity Attributes | Low Risk (3) | Moderate Risk (2) | High Risk (1) |
| Maximum age (tmax, year) | <3 | 3–7 | >7 |
| Maximum size (Lmax, cm) | <26 | 26–42 | >42 |
| von Bertalanffy growth coefficient (K, year−1) | >0.90 | 0.38–0.90 | <0.38 |
| Estimated natural mortality (M, year−1) | >1.61 | 0.92–1.61 | <0.92 |
| Measured fecundity (MF) | >73,854 | 13,182–73,854 | <13,182 |
| Breeding strategy (BS) | Broadcast spawners | External brooders/demersal egg layer/guarders | Live bearers/mouth brooders |
| Age at first maturity (tmat, year) | <1 | 1–2 | >2 |
| Size at first maturity (Lmat, cm) | <13 | 13–25 | >25 |
| Mean trophic level (MTL) | <3.4 | 3.4–3.9 | >3.9 |
| Breeding cycle (BC) | Annual cycle with protracted breeding season | Annual cycle with a seasonal peak | Bi/Triennial |
| Age at first maturity/Maximum age (tmat/tmax) | <0.20 | 0.20–0.29 | >0.29 |
| Size at first maturity/Maximum size (Lmat/Lmax) | <0.51 | 0.51–0.59 | >0.59 |
| Susceptibility Attributes | High Risk (3) | Moderate Risk (2) | Low Risk (1) |
| Areal overlap (AO) | >50% of stock present in the area fished | Between 25% and 50% of the stock present in the area fished | <25% of stock present in the area fished |
| Vertical overlap (VO) | >50% of stock present in the depths fished | Between 25% and 50% of the stock present in the depths fished | <25% of stock present in the depths fished |
| Seasonal migrations (SM) | Seasonal migrations increase overlap with the fishery | Seasonal migrations do not substantially affect the overlap with the fishery | Seasonal migrations decrease overlap with the fishery |
| Schooling, aggregation, and other behavioral responses (SABR) | Behavioral responses of species increase the catchability of the gear | Behavioral responses of species do not substantially affect the catchability of the gear | Behavioral responses of species decrease the catchability of the gear |
| Morphological characteristics affecting capture (MCAC) | Species shows high selectivity to the fishing gear | Species shows moderate selectivity to the fishing gear | Species shows low selectivity to the fishing gear |
| Management strategy (MSt) | Stocks do not have catch limits or accountability measures, and are not closely monitored | Stocks have catch limits, reactive accountability measures, and are occasionally monitored | Stocks have catch limits, proactive accountability measures, and are closely monitored |
| Survival after capture and release (SCR) | Probability of survival <33% | 33% < probability of survival <67% | Probability of survival >67% |
| Species market value (SMV, USD/kg) | >4 | 2–4 | <2 |
| Species market demand (SMD) | High | Moderate | Low |
| Fishing rate relative to M (F/M) | >1 | 0.5–1 | <0.5 |
| DQ Scores | DQ | Description | Example |
|---|---|---|---|
| 1 | Best | Information is based on collected data for the stock and area of interest that is established and substantial | Data-rich stock assessment; published literature for which multiple methods are used, etc. |
| 2 | Adequate | Information is based on limited coverage and corroboration, or for some other reason is deemed not as reliable as tier-1 data | Limited temporal or spatial data, relatively old information, etc. |
| 3 | Limited | Estimates with high variation and limited confidence, and which may be based on studies of similar taxa or life history strategies | Similar genus or family, etc. |
| 4 | Very limited | Information based on expert opinion or general literature reviews from a wide range of species, or from outside of the region, or data derived by equations using the correlated life history parameter | General data not referenced |
| 5 | No data | No information |
| Scientific Name | Common Name | Family | FAO Code | P | PDQ | S | SDQ | V | Vast | ODQ | IUCN | CTC | E |
|---|---|---|---|---|---|---|---|---|---|---|---|---|---|
| (BD */G) | |||||||||||||
| Penaeus monodon | Giant Tiger Prawn | Penaeidae | GIT | 2.58 | 3.33 | 2.80 | 2.20 | 1.85 | 1.93 | 2.77 | LC * | D | 0.65 |
| Penaeus indicus | Indian White Prawn | Penaeidae | PNI | 2.42 | 3.33 | 2.80 | 2.50 | 1.89 | 1.98 | 2.92 | LC * | D | 0.74 |
| Penaeus merguiensis | Banana Prawn | Penaeidae | PBA | 2.42 | 3.33 | 2.60 | 2.20 | 1.70 | 1.77 | 2.77 | LC * | S | 0.68 |
| Penaeus semisulcatus | Green Tiger Prawn | Penaeidae | TIP | 2.42 | 3.33 | 2.70 | 2.30 | 1.80 | 1.87 | 2.82 | LC * | D | 0.60 |
| Metapenaeus monoceros | Speckled Shrimp | Penaeidae | MPN | 2.58 | 3.33 | 2.80 | 2.20 | 1.85 | 1.93 | 2.77 | LC * | D | 0.62 |
| Metapenaeus affinis | Jinga Shrimp | Penaeidae | MTJ | 2.67 | 3.42 | 2.67 | 2.44 | 1.70 | 1.78 | 2.93 | DD * | S | |
| Metapenaeus brevicornis | Yellow Shrimp | Penaeidae | MPB | 2.25 | 3.08 | 2.70 | 2.20 | 1.86 | 1.93 | 2.64 | LC * | D | 0.81 |
| Mierspenaeopsis sculptilis | Rainbow Shrimp | Penaeidae | NAP | 2.75 | 3.33 | 2.60 | 2.40 | 1.62 | 1.69 | 2.87 | LC * | S | 0.55 |
| Parapenaeopsis hardwickii | Spear Shrimp | Penaeidae | NAW | 2.67 | 3.67 | 2.22 | 2.56 | 1.27 | 1.29 | 3.11 | DD * | S | |
| Parapenaeopsis stylifera | Kiddi Shrimp | Penaeidae | NAY | 2.67 | 3.33 | 2.22 | 2.56 | 1.27 | 1.29 | 2.94 | LC * | S | |
| Portunus pelagicus | Blue Swimming Crab | Portunidae | SCD | 2.33 | 3.67 | 2.11 | 2.56 | 1.30 | 1.31 | 3.11 | LC * | S | |
| Scylla serrata | Indo-Pacific Swamp Crab | Portunidae | MUD | 2.08 | 3.17 | 2.10 | 2.40 | 1.43 | 1.44 | 2.78 | LC * | S | 0.39 |
| Sepia aculeata | Needle Cuttlefish | Sepiidae | EJA | 2.25 | 3.67 | 2.33 | 2.89 | 1.53 | 1.57 | 3.28 | DD | S | |
| Uroteuthis duvaucelii | Indian Squid | Loliginidae | OJD | 2.08 | 3.67 | 2.44 | 2.89 | 1.71 | 1.76 | 3.28 | DD | S | |
| Himantura uarnak | Honeycomb Stingray | Dasyatidae | DHV | 1.50 | 3.25 | 1.44 | 2.89 | 1.56 | 1.55 | 3.07 | VU | S | |
| Rhinobatos annandalei | Annandale’s Guitarfish | Rhinobatidae | RHD | 1.58 | 3.58 | 1.67 | 2.89 | 1.57 | 1.55 | 3.24 | DD | S | |
| Arius arius | Threadfin Sea Catfish | Ariidae | AUI | 1.33 | 3.50 | 2.33 | 2.56 | 2.13 | 2.16 | 3.03 | LC | D | |
| Arius maculatus | Spotted Catfish | Ariidae | CAO | 1.25 | 3.50 | 2.11 | 2.33 | 2.07 | 2.08 | 2.92 | NE | D | |
| Plicofollis layardi | Thinspine Sea Catfish | Ariidae | UKY | 1.25 | 3.58 | 2.33 | 2.67 | 2.20 | 2.23 | 3.13 | NE | D | |
| Ariomma indicum | Indian Driftfish | Ariommatidae | DRI | 2.50 | 3.17 | 2.80 | 2.50 | 1.87 | 1.95 | 2.83 | NE | D | 0.62 |
| Alepes djedaba | Shrimp Scad | Carangidae | LSJ | 2.33 | 3.42 | 2.56 | 2.56 | 1.69 | 1.76 | 2.99 | LC | S | |
| Atropus atropos | Cleftbelly Trevally | Carangidae | TUP | 2.58 | 3.67 | 2.56 | 2.44 | 1.61 | 1.68 | 3.06 | LC | S | |
| Parastromateus niger | Black Pomfret | Carangidae | POB | 2.08 | 2.58 | 2.90 | 2.40 | 2.11 | 2.20 | 2.49 | LC | D | 0.52 |
| Selar crumenophthalmus | Bigeye Scad | Carangidae | BIS | 2.58 | 3.50 | 2.78 | 2.56 | 1.83 | 1.92 | 3.03 | LC | D | |
| Conger cinereus | Conger Eel | Congridae | COI | 1.42 | 3.67 | 2.67 | 2.89 | 2.30 | 2.36 | 3.28 | LC | D | |
| Cynoglossus bilineatus | Fourlined Tongue Sole | Cynoglossidae | YOB | 1.67 | 3.50 | 2.22 | 2.78 | 1.81 | 1.83 | 3.14 | NE | D | |
| Cynoglossus lingua | Long Tongue Sole | Cynoglossidae | YOG | 1.67 | 3.50 | 2.33 | 2.44 | 1.89 | 1.92 | 2.97 | LC * | D | |
| Dussumieria acuta | Rainbow Sardine | Dussumieriidae | RAS | 2.00 | 3.67 | 1.89 | 2.89 | 1.34 | 1.33 | 3.28 | LC | S | |
| Coilia dussumieri | Goldspotted Grenadier Anchovy | Engraulidae | ECD | 2.42 | 2.92 | 2.30 | 2.40 | 1.42 | 1.46 | 2.66 | LC * | S | 0.48 |
| Stolephorus tri | Spined Anchovy | Engraulidae | ESJ | 2.25 | 3.17 | 2.10 | 2.30 | 1.33 | 1.34 | 2.73 | NE | S | 0.85 |
| Thryssa mystax | Moustached Thryssa | Engraulidae | EYY | 2.33 | 3.67 | 2.22 | 2.56 | 1.39 | 1.42 | 3.11 | LC | S | |
| Gerres filamentosus | Whipfin Silver-biddy | Gerreidae | GEF | 2.83 | 3.67 | 2.67 | 2.56 | 1.67 | 1.76 | 3.11 | LC | S | |
| Aurigequula fasciata | Striped Ponyfish | Leiognathidae | LGS | 2.08 | 3.67 | 2.33 | 2.56 | 1.62 | 1.65 | 3.11 | LC | S | |
| Eubleekeria splendens | Splendid Ponyfish | Leiognathidae | LGP | 2.42 | 3.42 | 2.33 | 2.56 | 1.46 | 1.49 | 2.99 | LC | I | |
| Lobotes surinamensis | Tripletail | Lobotidae | LOB | 2.08 | 3.67 | 2.00 | 2.67 | 1.36 | 1.36 | 3.17 | LC | S | |
| Lutjanus johnii | John’s Snapper | Lutjanidae | LJH | 1.67 | 3.00 | 2.60 | 2.50 | 2.08 | 2.13 | 2.75 | LC | D | 0.78 |
| Lutjanus lutjanus | Bigeye Snapper | Lutjanidae | LJL | 2.00 | 3.67 | 2.56 | 2.44 | 1.85 | 1.91 | 3.06 | LC | D | |
| Congresox talabonoides | Indian Pike Conger | Muraenesocidae | MCG | 1.42 | 3.33 | 2.44 | 2.67 | 2.14 | 2.18 | 3.00 | NE | D | |
| Nemipterus japonicus | Japanese Threadfin Bream | Nemipteridae | NNJ | 2.33 | 3.17 | 2.70 | 2.50 | 1.83 | 1.90 | 2.83 | LC | NS | 0.59 |
| Nemipterus randalli | Randall’s Threadfin Bream | Nemipteridae | NNZ | 2.00 | 3.67 | 2.56 | 2.89 | 1.85 | 1.91 | 3.28 | LC | NS | |
| Parascolopsis aspinosa | Smooth Dwarf Monocle Bream | Nemipteridae | NPS | 2.50 | 3.83 | 2.56 | 2.89 | 1.63 | 1.70 | 3.36 | LC | S | |
| Plotosus lineatus | Striped Eel Catfish | Plotosidae | PII | 2.08 | 3.42 | 2.00 | 2.44 | 1.36 | 1.36 | 2.93 | NE | S | |
| Eleutheronema tetradactylum | Fourfinger Threadfin | Polynemidae | FOT | 1.83 | 3.00 | 2.44 | 2.44 | 1.86 | 1.90 | 2.72 | NE | D | |
| Leptomelanosoma indicum | Indian Threadfin | Polynemidae | OYD | 1.75 | 3.67 | 2.33 | 2.67 | 1.83 | 1.86 | 3.17 | NE | D | |
| Polydactylus sextarius | Blackspot Threadfin | Polynemidae | OAX | 1.83 | 3.50 | 2.44 | 2.67 | 1.86 | 1.90 | 3.08 | NE | D | |
| Rachycentron canadum | Cobia | Rachycentridae | CBA | 1.92 | 3.42 | 2.22 | 2.56 | 1.63 | 1.65 | 2.99 | LC | S | |
| Johnius dussumieri | Sin Croaker | Sciaenidae | JOU | 2.42 | 3.67 | 2.00 | 2.56 | 1.16 | 1.16 | 3.11 | LC | S | |
| Otolithoides biauritus | Bronze Croaker | Sciaenidae | OTB | 1.83 | 3.83 | 1.78 | 2.56 | 1.40 | 1.39 | 3.19 | DD | S | |
| Epinephelus lanceolatus | Giant Grouper | Serranidae | EEN | 1.75 | 3.42 | 2.00 | 2.78 | 1.60 | 1.60 | 3.10 | DD | S | |
| Epinephelus malabaricus | Malabar Grouper | Serranidae | MAR | 2.00 | 3.50 | 2.22 | 2.67 | 1.58 | 1.60 | 3.08 | LC | S | |
| Siganus canaliculatus | White-spotted Spinefoot | Siganidae | SCN | 2.42 | 3.67 | 2.00 | 2.56 | 1.16 | 1.16 | 3.11 | LC | S | |
| Sillago sihama | Silver Sillago | Sillaginidae | ILS | 2.17 | 3.33 | 2.10 | 2.70 | 1.38 | 1.39 | 3.02 | LC | S | 0.75 |
| Argyrops spinifer | King Soldier Bream | Sparidae | KBR | 1.50 | 3.67 | 2.00 | 2.44 | 1.80 | 1.80 | 3.06 | LC | D | |
| Sphyraena obtusata | Obtuse Barracuda | Sphyraenidae | YRB | 1.92 | 3.25 | 2.44 | 2.67 | 1.81 | 1.85 | 2.96 | NE | NS | |
| Pampus argenteus | Silver Pomfret | Stromateidae | SIP | 2.17 | 2.83 | 2.40 | 2.30 | 1.63 | 1.67 | 2.57 | NE | S | 0.40 |
| Pampus chinensis | Chinese Silver Pomfret | Stromateidae | CPO | 1.92 | 3.00 | 2.30 | 2.30 | 1.69 | 1.72 | 2.65 | NE | S | 0.39 |
| Harpadon nehereus | Bombay-duck | Synodontidae | BUC | 2.25 | 3.17 | 2.00 | 2.30 | 1.25 | 1.25 | 2.73 | NT | S | 0.38 |
| Saurida tumbil | Greater Lizardfish | Synodontidae | LIG | 2.00 | 3.17 | 2.40 | 2.70 | 1.72 | 1.76 | 2.93 | LC | I | 0.35 |
| Terapon jarbua | Jarbua Terapon | Terapontidae | TJB | 1.83 | 3.33 | 2.22 | 2.33 | 1.69 | 1.71 | 2.83 | LC | S | |
| Lepturacanthus savala | Savalai Hairtail | Trichiuridae | SVH | 2.08 | 2.67 | 2.30 | 2.40 | 1.59 | 1.62 | 2.53 | NE | S | 0.43 |
Publisher’s Note: MDPI stays neutral with regard to jurisdictional claims in published maps and institutional affiliations. |
© 2022 by the authors. Licensee MDPI, Basel, Switzerland. This article is an open access article distributed under the terms and conditions of the Creative Commons Attribution (CC BY) license (https://creativecommons.org/licenses/by/4.0/).
Share and Cite
Fatema, U.K.; Faruque, H.; Salam, M.A.; Matsuda, H. Vulnerability Assessment of Target Shrimps and Bycatch Species from Industrial Shrimp Trawl Fishery in the Bay of Bengal, Bangladesh. Sustainability 2022, 14, 1691. https://doi.org/10.3390/su14031691
Fatema UK, Faruque H, Salam MA, Matsuda H. Vulnerability Assessment of Target Shrimps and Bycatch Species from Industrial Shrimp Trawl Fishery in the Bay of Bengal, Bangladesh. Sustainability. 2022; 14(3):1691. https://doi.org/10.3390/su14031691
Chicago/Turabian StyleFatema, Umme Kaniz, Hasan Faruque, Md. Abdus Salam, and Hiroyuki Matsuda. 2022. "Vulnerability Assessment of Target Shrimps and Bycatch Species from Industrial Shrimp Trawl Fishery in the Bay of Bengal, Bangladesh" Sustainability 14, no. 3: 1691. https://doi.org/10.3390/su14031691