1. Introduction
With the 4th Industrial Revolution, technology known as big data statistical analysis, artificial intelligence, robot engineering, the Internet of Things, 3D printing, unmanned transportation, nanotechnology, and cutting-edge convergence technology are being widely applied in a variety of fields [
1]. Accordingly, the construction industry is also striving to shift to a new paradigm that involves periodically photographing a construction site with drones to track the site process and worker status in real time, or to try to create a digital twin-based construction site. The adoption of new technologies in the construction industry is slower than it is in other industries such as healthcare, education, finance, etc. [
2]. As such, although state-of-the-art safety technology is being applied to construction sites more often, albeit partially, the accident mortality rate in the construction industry remains higher than that of other industries, and it is still generally classified as a dangerous industry [
1].
In addition, although the government’s continuous reduction of construction site accidents through various policies is raising the level of safety management, it has yet to achieve the desired results due to the lack of safety consciousness culture among companies and construction workers [
3]. So far, studies for predicting construction safety accidents have mostly been conducted by statistical analysis methods that assume linear models, such as regression and time series analysis.
For example, Ryu et al. [
4] analyzed the actual damage record of construction sites in the loss prediction model for building construction projects using insurance claim payments. This identified the risk factors for damage. Kim et al. [
5] conducted multiple regression analyses on bridge construction in a loss assessment for sustainable industrial infrastructure.
Kim et al. [
6] derived economic loss indicators from quantifying the third-party loss in building construction sites utilizing claims payouts collected from major domestic insurers. Ahn et al. [
7] analyzed the record of third-party damage and subsequent financial losses in bridge construction management in their paper to identify objective and loss-related risk indicators. These studies adopted statistical analysis methods. As a result, the adjusted R2 was found to be 0.315 to 0.471. In other words, parts whose patterns have not been identified can be explained by hidden indicators, which requires a more reliable analysis method.
These statistical analysis methods cannot reflect the non-linear characteristic of construction safety accidents determined by complex influence factors. In the past, many studies have focused on experience, intuition, and theoretical approaches due to difficulties in securing safety accident data and limitations in analysis methods. Recently, however, data accumulation and information disclosure such as safety accident data have been carried out. Therefore, the object of this study is deep learning model development to predict safety accidents for sustainable construction. This study seeks to use deep learning techniques to quantify construction safety accident risk and propose ways to reduce safety accident risk in the construction industry.
Furthermore, we review the framework of construction safety accident prediction using deep learning techniques. In addition, we examine the effectiveness of the introduction of deep learning technology in construction safety accident prediction by comparing it to the existing construction safety accident prediction method.
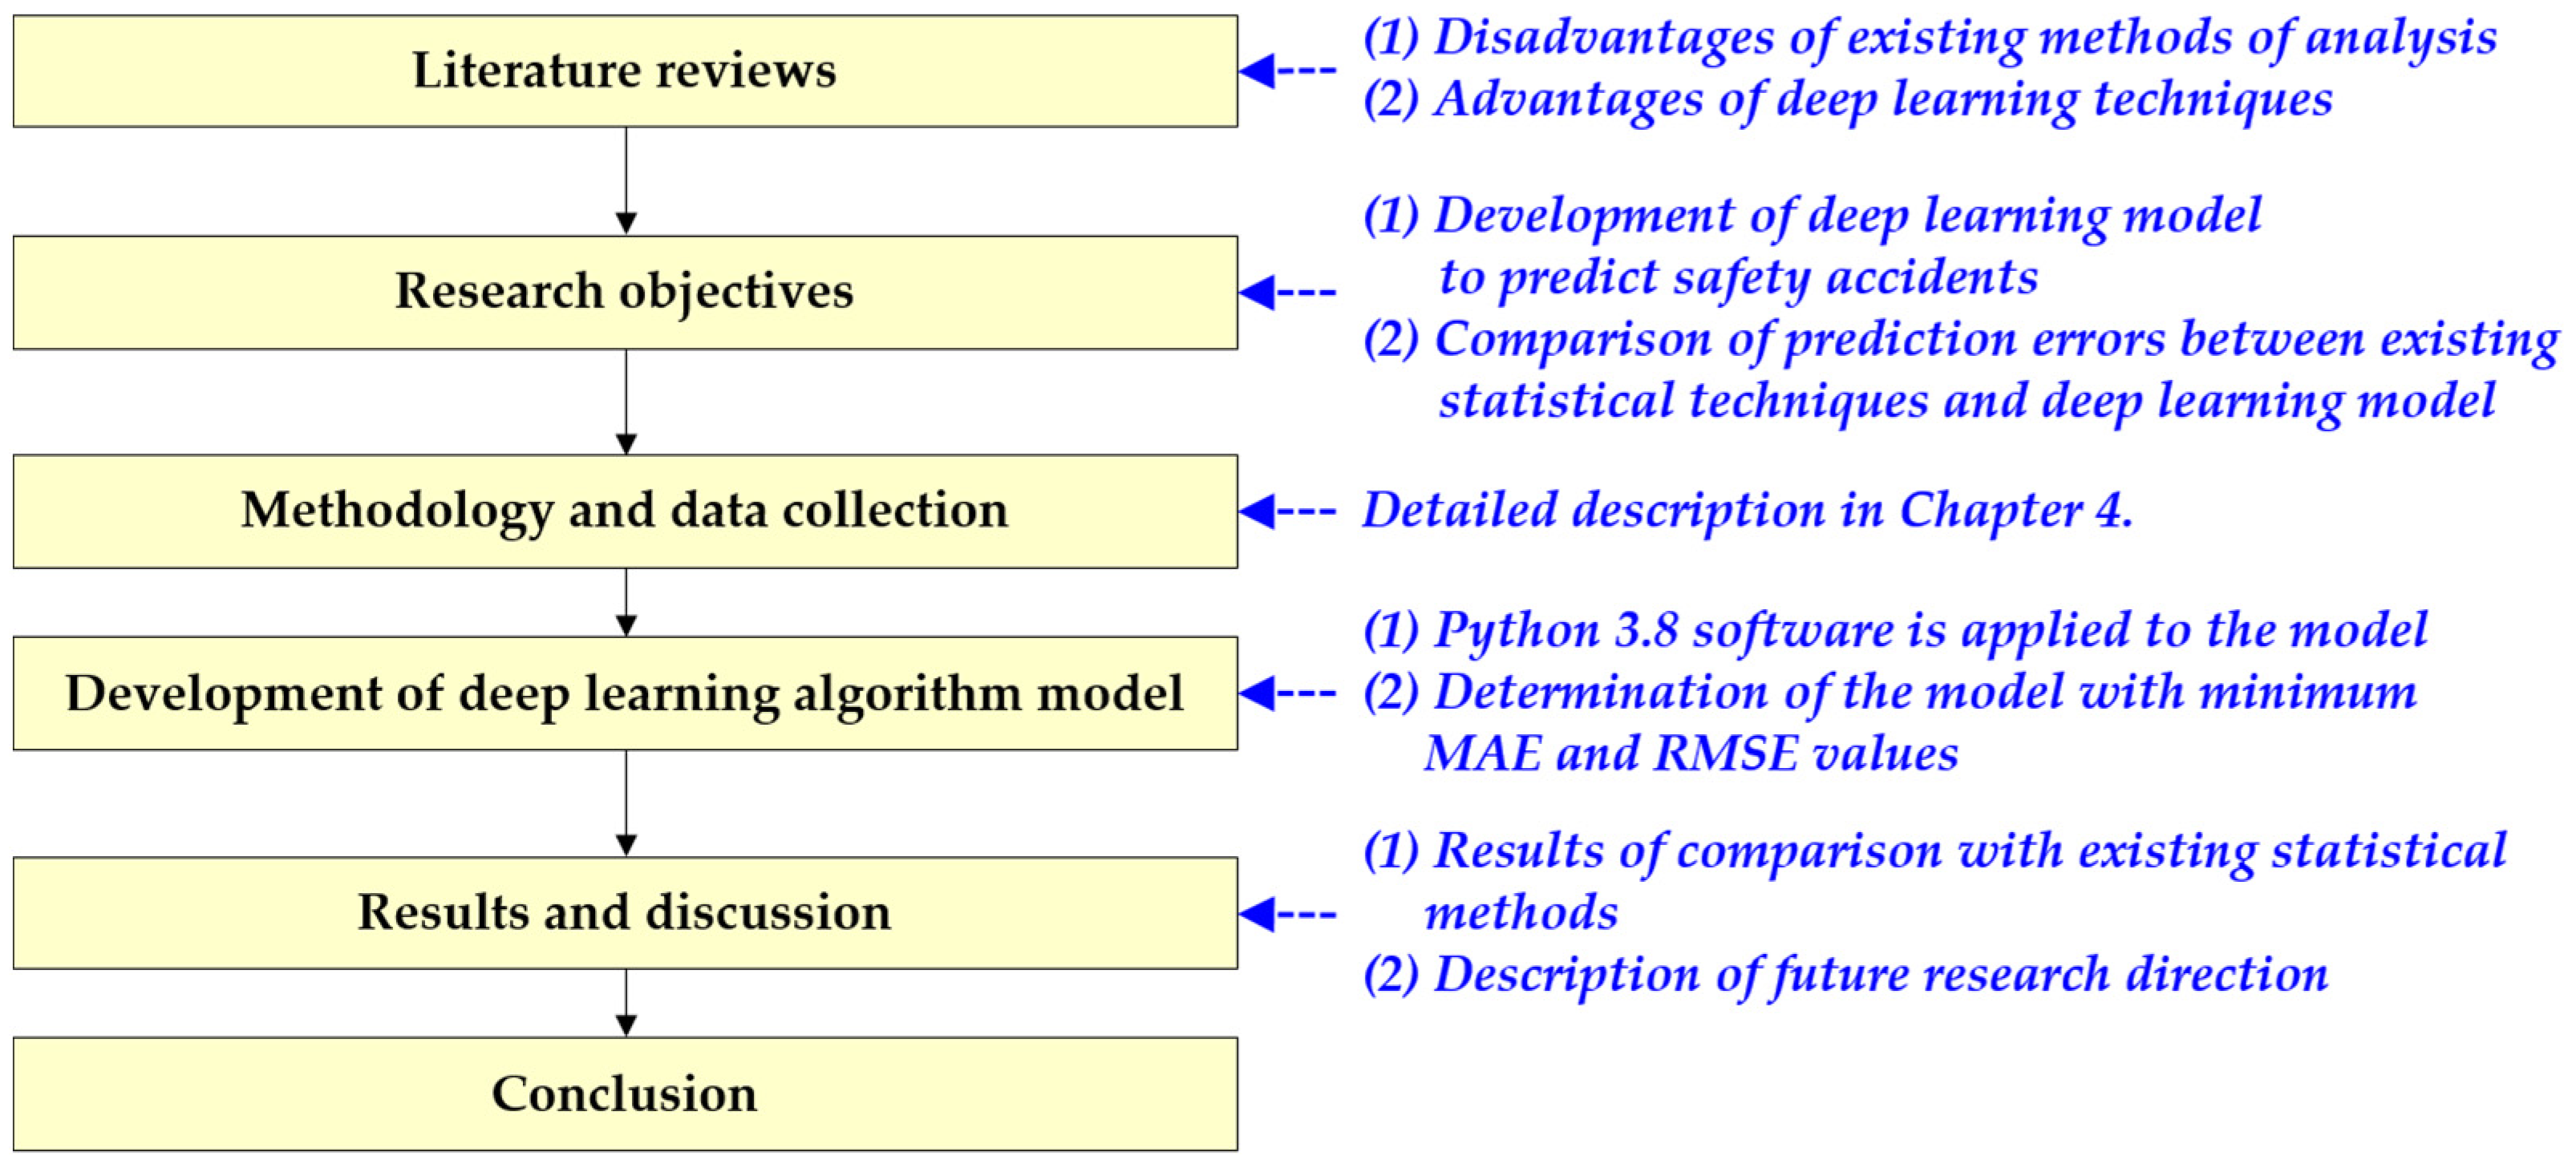
This study is conducted as shown in
Figure 1.
First, safety accident-related variables to be applied to this study are investigated through a literature review. In addition, the necessity of this study is presented by considering the problems of the existing method to predict the risk of safety accidents.
Second, the purpose of this study is clearly presented based on the previously investigated contents.
Third, the method of this study is clearly explained. Data collection and input variables to be applied to the model are described in detail.
Fourth, a deep learning algorithm model is established. In this case, the optimal combination is derived through changes in hyper-parameters.
Fifth, the results and discussions of this study are clearly described.
Finally, the implications of this study and further studies in the future are described in the conclusion.
2. Literature Review
The purpose of this study is to develop a safety accident prediction model at a construction site based on a deep learning algorithm. To this end, this section conducts a literature review. Details consist of (1) safety accumulations among South Korean construction workers, (2) reviews in the construction safety literature, (3) disadvantages of externalizing methods of analysis, and (4) advances in learning.
2.1. Safety Accidents among South Korean Construction Workers
According to the Korea Occupational Safety and Health Agency’s 2018 announcement, the total number of industrial accidents in the construction industry in 2018 was 6486 (29.16%), the second largest number among all industries, but it had the highest mortality rate, at 26.61% [
8]. The number of casualties in the construction industry increased by 7.2% compared to the previous year, and the main causes of accidents were pinching, collapsing, bumping, and trampling, cumulatively accounting for 32% of accidents. Furthermore, these statistical data are data that have not been properly reported, as many safety accidents in this industry are concealed [
3].
For example, the industrial accident rate in South Korea in 2017 was 0.84%, which was relatively low compared to the values of 3.46% in the UK and 3.88% in the US. However, comparing the number of deaths, Korea was highest among these three countries at 1.9‱, much higher than the corresponding values for the UK (0.16‱) and the US (0.95‱) [
8]. These numbers are conflicting statistics according to Heinrich’s Accident Triangle, which shows the relationship between the number of accidents that lead to serious, minor, and unconceived accidents, indicating that many minor and underived accident risks are not reported. Thus, accurate data collection and analysis of potential risks are essential aspects of preventing safety accidents at construction sites. In addition, the construction industry is classified as high risk compared to other domestic industries. Specifically, the construction industry has higher accident and death rates of 0.36% and 0.85‱, respectively, than other domestic industries. One of the reasons for this is that many high-rise buildings, which have high rates of death and permanent disability, have recently been built. Furthermore, construction work, which is dominated by outside work, naturally involves no protection from weather conditions such as heat, rain, and strong winds. In addition, the risk of accidents is large due to the high proportion of work occurring on roofs, ladders, and scaffolding, as well as lifting work, all of which have a high risk of safety accidents, such as fall and collapse [
9].
2.2. Reviews in the Construction Safety Literature
There have been a number of studies aiming to prevent construction safety accidents occurring at construction sites; key cases include research on safety accident prevention measures [
10,
11,
12], a major accident cause analysis [
13], an accident case study [
14], and safety accident occurrence structure analyses [
15,
16]. These past works have conducted post-analytical studies targeting specific types of accidents, then suggested prevention and countermeasures based on the results. These studies cannot be applied to ongoing activities to prevent safety accidents and minimize damage in advance while considering the conditions of construction sites, wherein dynamic and diverse companies work. Nevertheless, due to the nature of the construction industry, such as the limited budget for safety management at construction sites, the involvement of manpower, and the large number of external works, efforts to prevent and reduce risk in advance are essential.
Therefore, it is necessary to accurately calculate potential safety accidents in advance. Such accident estimation will help prevent and reduce damage by identifying the types of safety accidents that may occur and the risks that should be managed first at each construction site. This will ultimately contribute to increased profits for construction projects and further reductions of safety accidents in the construction industry as a whole. Consequently, this study intends to examine the feasibility of applying deep learning techniques to predict potential construction safety accidents at construction sites in advance.
2.3. Disadvantages of Existing Methods of Analysis
Most prior studies on safety accident analysis and safety accident risk prediction at construction sites have been based on traditional statistical methods such as regression analysis, fuzzy theory, literature reviews, expert opinions, and expert interviews. Specifically, safety accidents in construction projects have been examined through expert consultations, interviews, and expert surveys such as AHP (analytic hierarchy process), Delphi survey, etc. due to the difficulty of securing data [
17,
18,
19,
20,
21]. However, this research method requires substantial amounts of time and money, and accurate communication is impossible in some cases due to difficulties that some people may have with understanding or answering questions. It is also difficult to resolve any conflicting ideas among respondents. Regression analysis is mainly used for data-based research.
To solve the problem of these existing statistical analysis methods, machine learning techniques, which are methods by which machines learn by themselves from the data provided, must be utilized. In particular, among machine learning techniques, deep learning algorithms are a way of learning data by utilizing information input/output layers similar to neurons in the brain. These deep learning algorithms classify datasets and find correlations among themselves to make predictions more accurately. Furthermore, the deep learning algorithm can have a more complex structure than other artificial intelligence techniques, such as machine learning and fuzzy logic, so its availability can be increased when complex and large amounts of data are secured in the future [
22]. In addition, considering the irregularity of safety accident data, a deep learning algorithm that can have a more multifaceted structure can explain safety accident data better than other artificial intelligence techniques [
23]. Therefore, this study intends to present a safety accident analysis methodology using a deep learning algorithm.
2.4. Advantages of Deep Learning Techniques
These studies define the correlation between safety accidents and various factors, i.e., project information, natural hazards, geographical vulnerability, building environment, and socio-economic factors, and estimate the severity and frequency of safety accidents; the risk of safety accidents can be calculated through this process [
4,
5,
7,
24,
25,
26,
27]. However, due to the development of ICT technology, various materials that have not been used often in the past are being produced and accumulated in large quantities at construction sites. In addition, the recent geometric development of computer software and hardware has made it possible to analyze enormous amounts of information in a short time. Based on these advances in data acquisition and analysis technology, big data analysis technologies such as machine learning and deep learning have begun to attract attention as representative and new approaches [
6].
These machine learning and deep learning techniques are advantageous for analyzing factors related to safety accidents using large amounts of data, and are already being actively applied in other fields. Despite these advantages, the utilization of such techniques remains low in the field of construction safety [
28]. In this field, these techniques can make it possible to estimate the relationship with risk factors related to safety accidents that are not defined in the existing statistical models by using heterogeneous and large amounts of data. The risk indicators were identified through literature reviews and statistical analyses of many studies, but the predictive power of the model is still between 0.2 and 0.5 [
17,
18,
19,
20,
21]. In other words, this model can explain about 20–50% of the relationship with safety accidents through the prescribed indicators, whereas the remaining 50–80% of the relationship is explained by unidentified indicators. Thus, it is necessary to advance the estimation of safety accidents by identifying these hidden indicators.
It can also be said that machine learning and deep learning techniques in a big data environment are likely to develop further. In particular, when combined with big data such as safety sensor information, weather information, the Internet of Things, and unmanned aerial vehicles, which have recently come to be widely used in construction sites, not only can the accuracy of safety accident calculation be further improved, but it is also ultimately expected that the risk of safety accidents at construction sites can be reduced [
29,
30,
31].
3. Research Objectives
As previously explained, existing safety accident analysis methods use statistical methods. However, these statistical approaches do not reflect a variety of influence factors because they are assumed to be a linear model. In particular, multiple regression analyses can be easily analyzed with fewer data, but when the variability (or error) of the data is large, there is a problem of generating predictions that differ greatly from the actual value. Machine learning, which has recently attracted attention in the field of engineering, is an area of artificial intelligence technology, and active research is underway in several fields, showing significant results. Furthermore, the limitations of existing statistical analysis models can be supplemented in that machine learning is a nonlinear estimation technique.
The ultimate aim of this study is to provide a framework for developing a construction site safety accident prediction model using a deep learning algorithm. The aim of this study is to develop a construction site safety accident prediction model using deep learning algorithms based on the safety accident data occurring at the construction site. The detailed objectives are to (1) explore the safety accidents that occur at real construction sites in South Korea and create a construction site safety accident prediction model using deep learning algorithms as a case study, and (2) compare the models by comparing the prediction error of the deep learning algorithm model and the model using existing statistical techniques to verify the validity of the introduced model.
4. Methodology and Data Collection
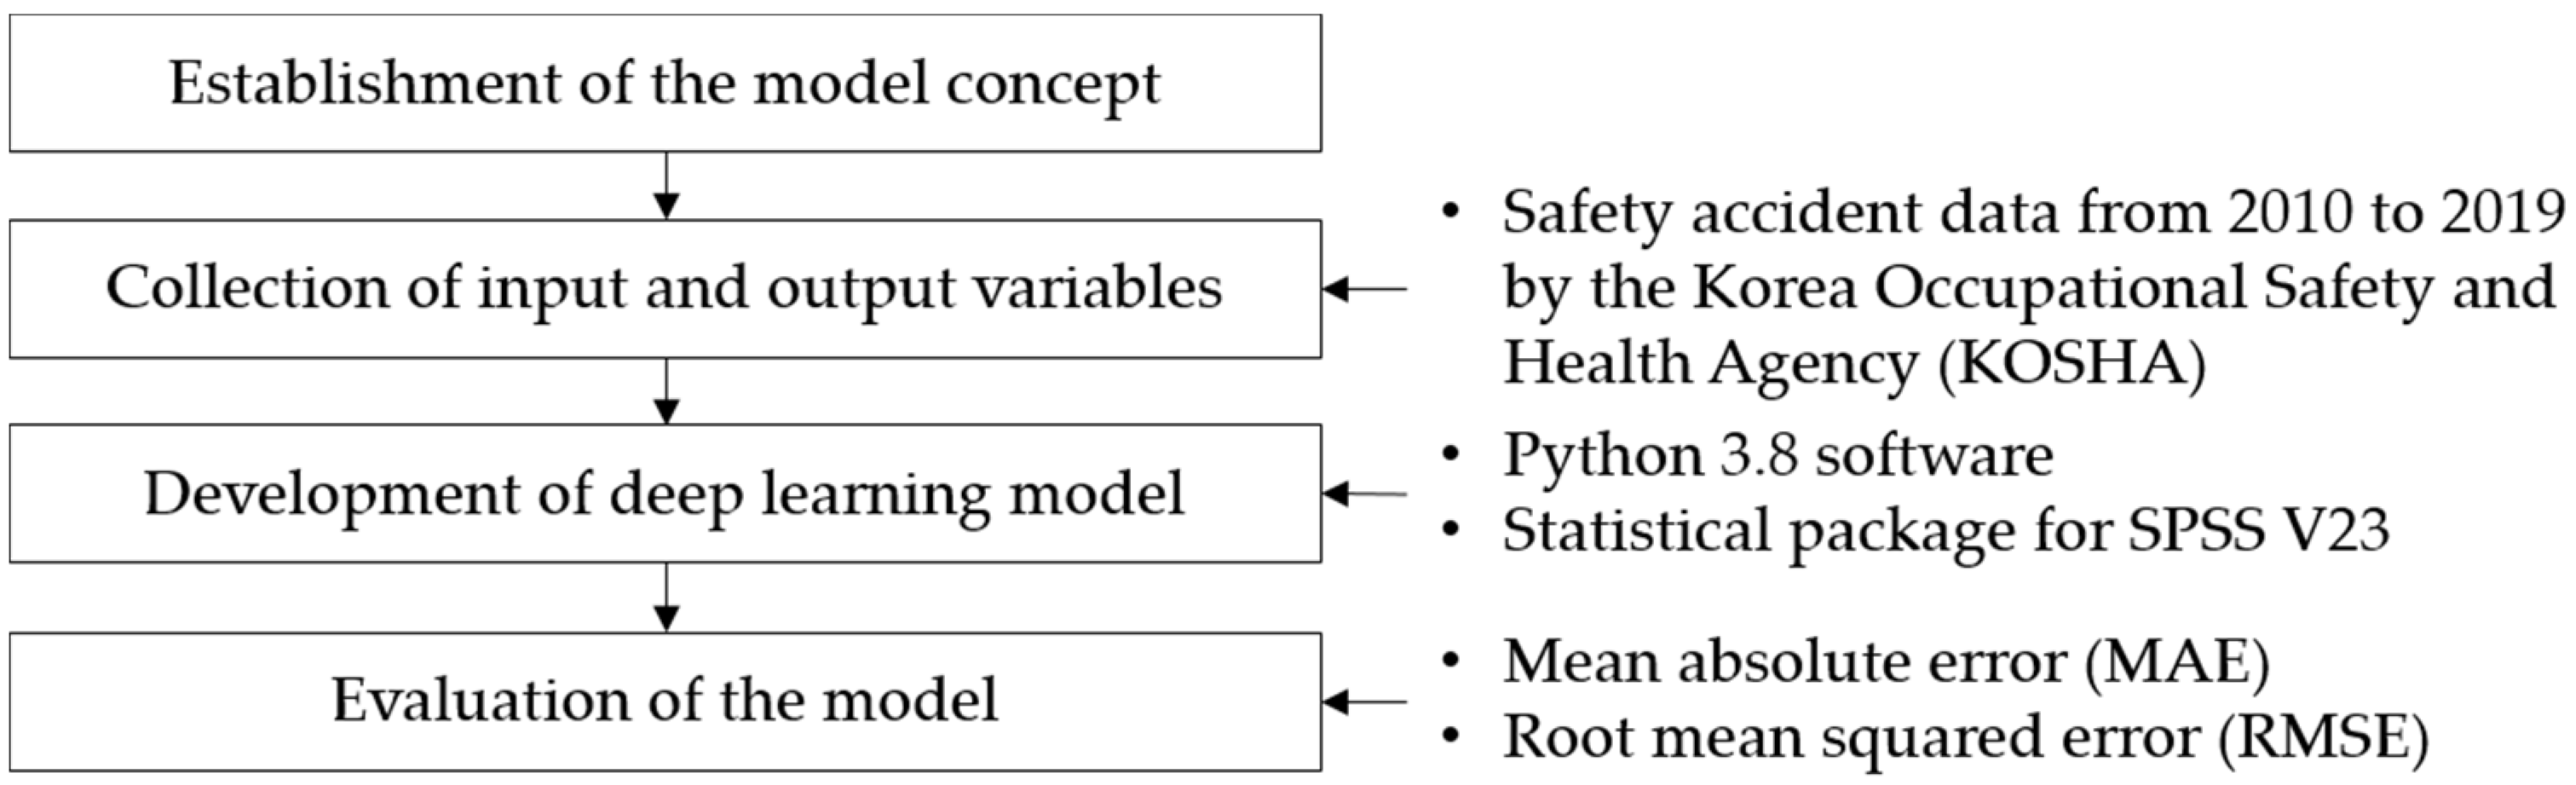
The detailed research steps are shown in
Figure 2. First, based on past studies, this study investigated indicators and models related to safety accidents. Second, safety accidents that occurred at construction sites were collected as input and output variables.
The deep learning model uses Python 3.8 and the statistical model analysis tool was made using IBM Statistical Package for the Social Sciences (SPSS) V23. Third, each model (the deep learning model and the statistical model) was developed. Finally, the MAE (mean absolute error) and the RMSE (root mean squared error) were calculated to compare the models.
This study used safety accident data from 2010 to 2019 from the Korea Occupational Safety and Health Agency (KOSHA) to secure data on safety accidents that occurred at construction sites in Korea. KOSHA is a government agency that was founded with the Korea Occupational Safety and Health Agency Act in 1987. This institution was established to help employers prevent accidents and ensure that workers work in a safe and healthy manner. Representative responsibilities include research and development related to safety, education on occupational safety and health, and the dissemination of industrial accident prevention technologies. To this end, safety accidents occurring in various industrial sites are counted and converted into data.
The collected data include the construction scale, number of employees, worker nationality, accident type, construction progress at the time of the accident, accident occurrence date, accident occurrence time, accident day, employment type, site address, accident summary, and medical treatment day. The dependent variable was the number of days of treatment for the accident. To unify the types of accidents and quantify the severity of each accident, among the data, death was excluded, and the type of accident was limited to accidents caused by falling. The collected data did not contain any personal information from the accident.
In this study, eight variables were selected in reference to the previous study, as shown in
Table 1. Kim et al. [
3] selected the days of treatment, progress rate, construction scale, and employment types as variables in their paper. Kim et al. [
26] selected the progress rate, construction scale, and worker’s carelessness as variables in their paper. In particular, Kim et al. [
3] selected days of treatment as a dependent variable to analyze the risk of accidents in migrant workers, and independent variables such as progress rate, construction scale, classification of occupations, day of the week, accident time, and employment type. As a result, the independent variable was statistically significant at level 0.01.
According to Kim et al. [
3], the risk increases as the progress rate and construction scale increase. In addition, they said that the risk of accidents may increase depending on the classification of occupations, day of the week, accident time, and status of employment. As such, their study found that factors such as progress rate, construction scale, number of employees, status of employment, nationality of workers, day of the week, accident time, and classification of occupations influence the risk of accidents at construction sites.
Therefore, the model in this study was applied with eight variables. In the future, it is intended to increase the reliability of the model by reflecting factors such as the difficulty of the construction, worker safety awareness, organizational culture, etc.
In total, eight indicators were used in the safety accident prediction model, and descriptions of these variables are listed in
Table 1.
As the process rate increases in construction, the risk of safety accidents increases due to the increased construction complexity caused by collisions between various processes [
25,
32]. Therefore, this rate has a close correlation with safety accidents in a construction project. This study asserts that the degree of risk is reflected using the construction site process rate at the time of the safety accident.
The scale of construction work and the number of employees have statistically significant relationships with safety accidents, and these are widely used as indicators of the risk of safety accidents [
24,
33,
34]. This study adopted the scale of construction work being divided into two units as a nominal variable, in accordance with the Korean Occupational Safety and Health Act. Specifically, each site was classified according to the total construction amount, i.e., (1) a small construction site with a total construction cost of less than KRW 2 billion, (2) a medium-sized construction site with a total construction cost of KRW 2 billion to 12 billion, and (3) a large construction site with a total construction cost of more than KRW 12 billion. The number of employees maintained by the company was also entered.
The employment type was divided into non-regular workers and regular workers. Research has suggested that non-regular construction workers are more susceptible to safety accidents than regular construction workers [
3]. Therefore, employment status is an important indicator for the risk of safety accidents. This study defines the indicator as a nominal variable, i.e., (0) regular worker and (1) non-regular worker.
Moreover, the nationality of the worker is an important indicator of the vulnerability of workers to safety accidents. This is because migrant workers have relatively shorter careers than non-migrant workers, and they are often more exposed to safety accidents as they work in small and medium-sized workplaces [
35,
36,
37]. This study adopted the indicator as a nominal variable, i.e., (0) non-migrant worker and (1) migrant worker.
Further, the day and time are important indicators that indicate the risk of a safety accident [
38,
39]. The work at a construction site is characterized by changes in the work content and intensity depending on the day and time of the week, because construction workers tend to move fluidly according to the working environment of the construction site [
3].
For example, safety accidents frequently occur in the middle of the morning and early afternoon, when work is intensive. This is also because the accident rate increases during times of heavy workload or times of high difficulty. Consequently, in this study, time was divided into nominal variables, i.e., (1) dawn (00:00~06:00), (2) evening and night (18:00~24:00), (3) afternoon (13:00~18:00), and (4) morning (06:00~12:00). The day of the week was also used as a nominal variable, classified as (1) Monday, (2) Tuesday, (3) Sunday, (4) Wednesday, (5) Friday, (6) Saturday, and (7) Thursday.
Occupational classification is used to evaluate the risk of work according to occupational classification [
3]. The Korean Standard Statistical Classification was used for occupational classification, which characterizes risk factors according to the job and provides comprehensive management guidelines for similar jobs [
40]. Therefore, it was used as a factor indicating the risk of safety accidents because it reflects the difficulty and intensity of work according to the work classification.
The occupational classification was divided into nominal variables, i.e., (1) equipment, machine operating, and assembly workers; (2) professionals and related workers; (3) craft and related trade workers; (4) managers; and (5) elementary workers. The descriptive statistics of the variables are listed in
Table 2.
This study used the data on safety accidents from 2010 to 2019 from the Korea Occupational Safety and Health Agency (KOSHA). We continue to strive to secure actual safety accident data at construction sites. In the future, additional data will be obtained continuously to increase the reliability of the model.
5. Construction of Deep Learning Algorithm Model
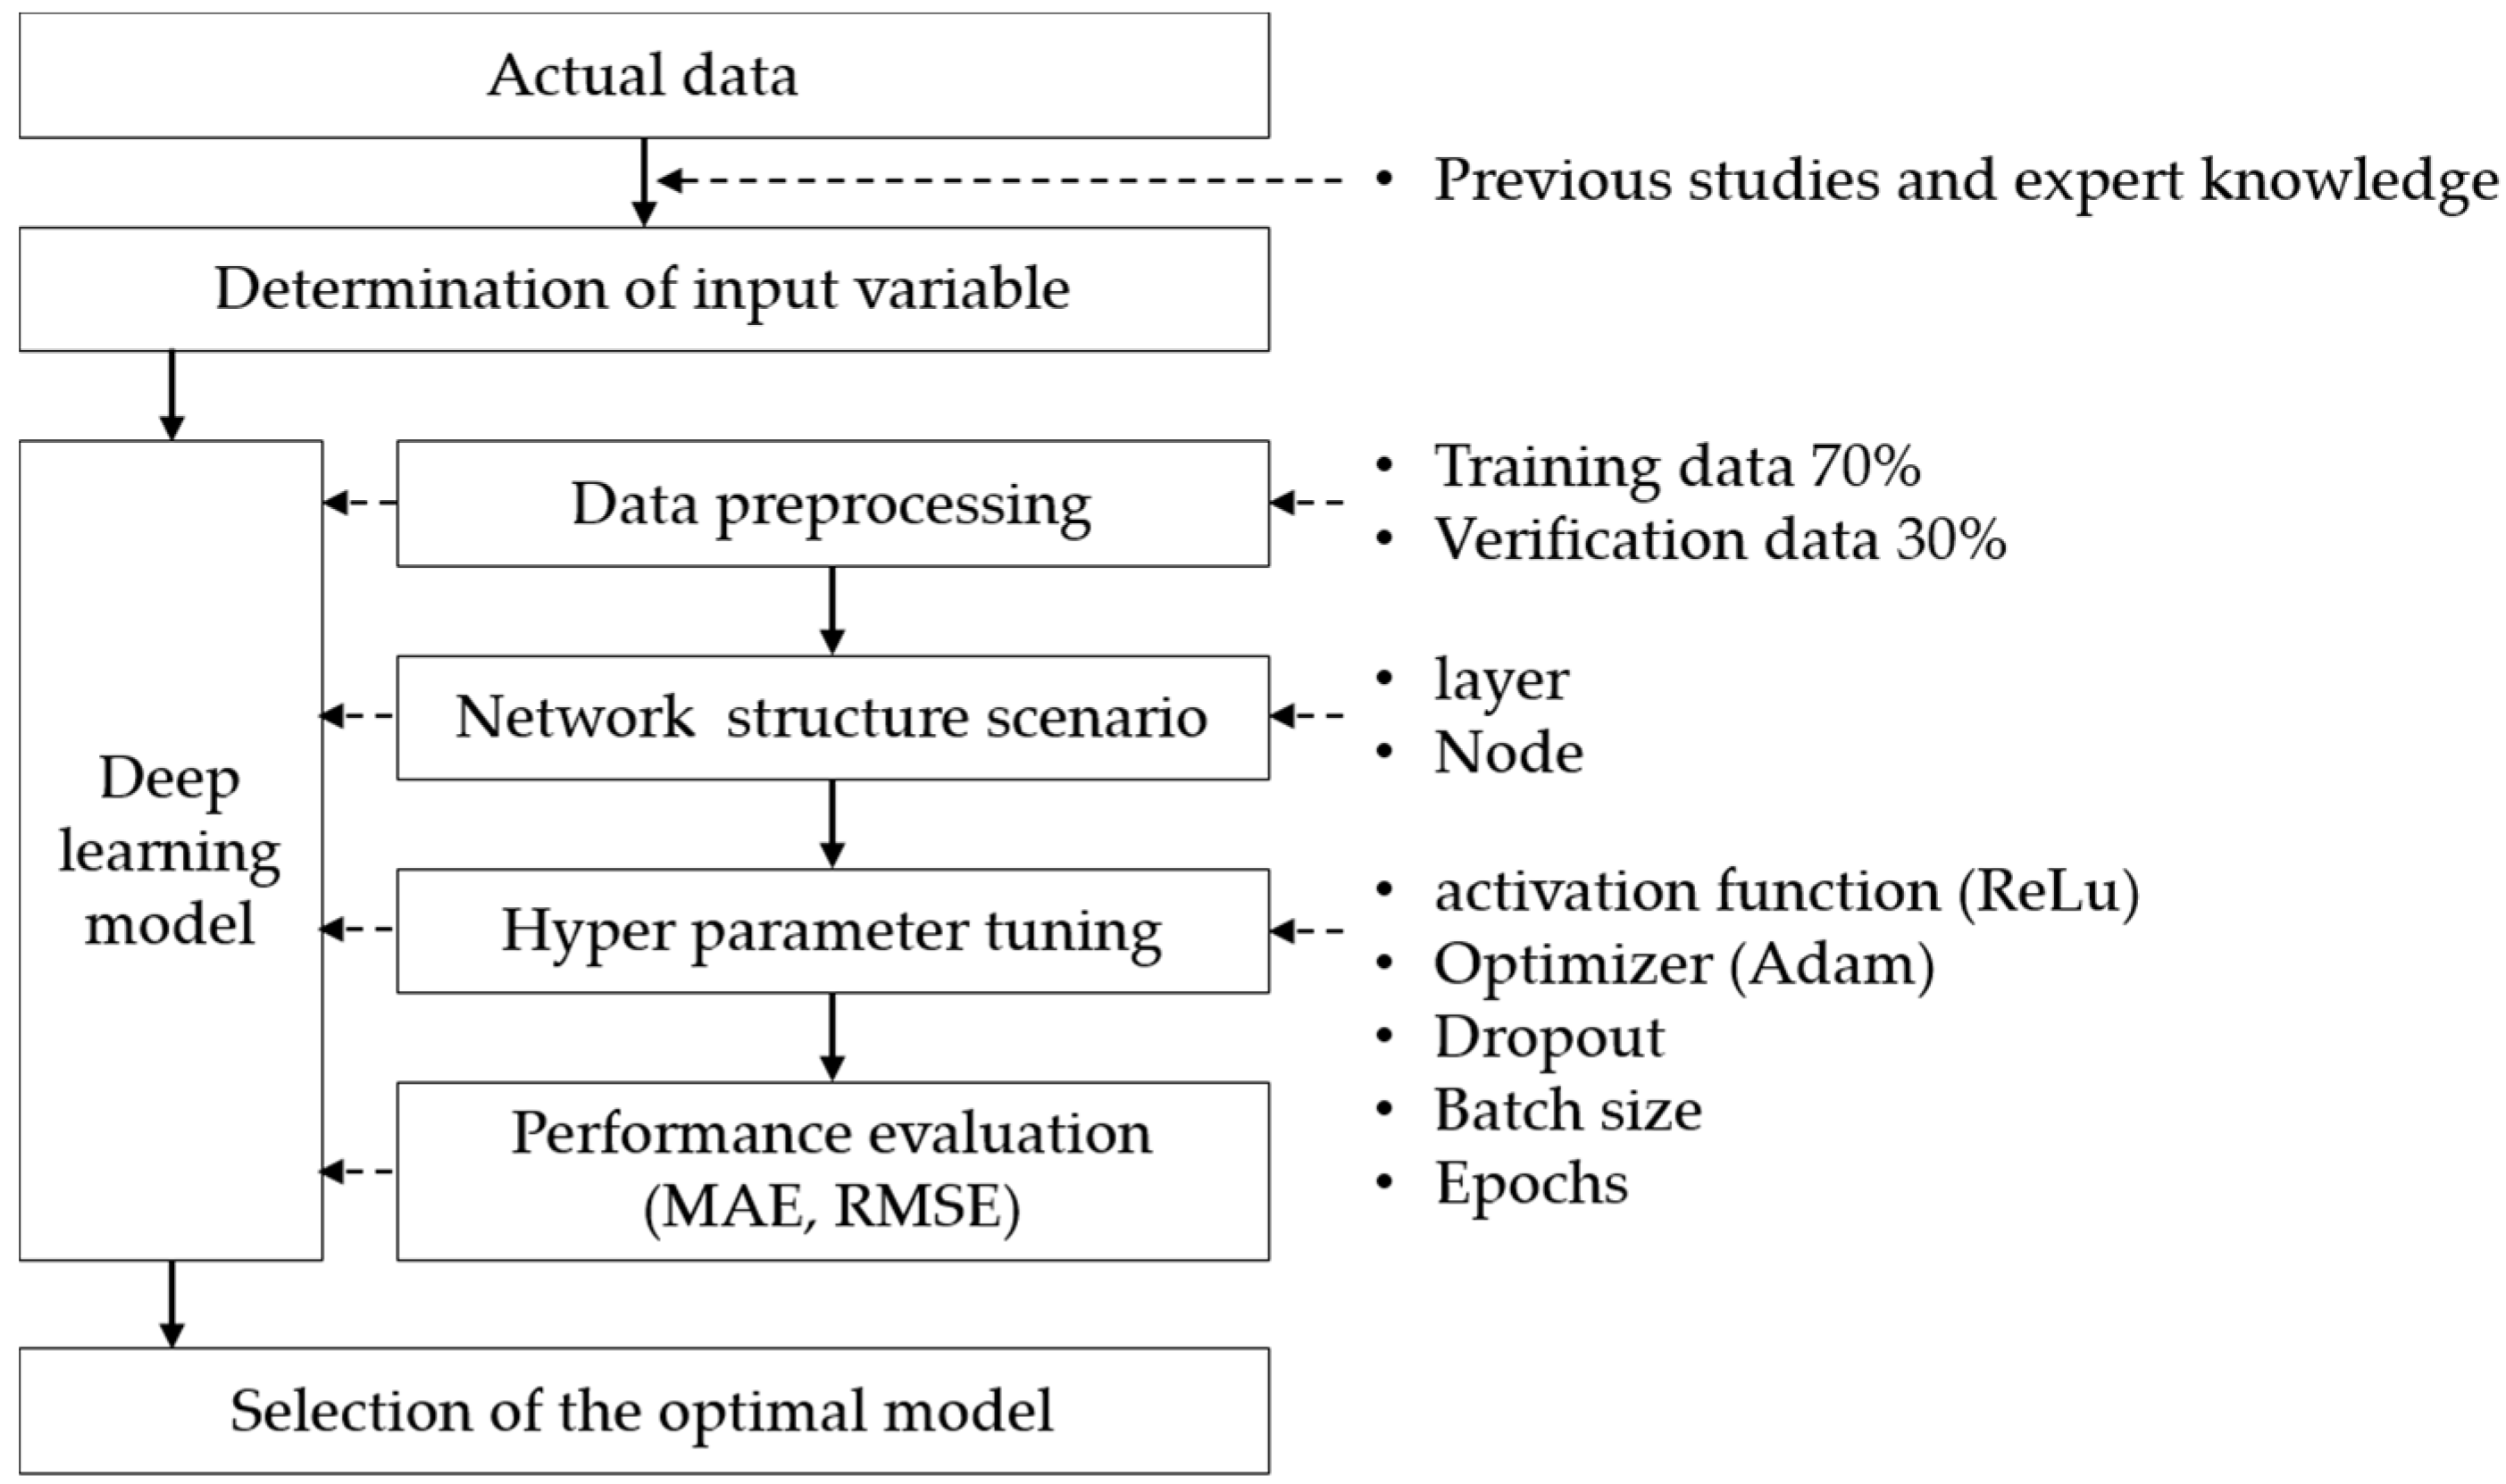
In this study, a design process for deriving optimal input variables and parameters was constructed to develop a deep learning-based accident risk prediction model. The predictive model design process is shown in
Figure 3.
As shown in
Figure 3, when the input variable derivation process is performed and the optimal parameter derivation process is completed, a deep learning model based on the deep neural network is developed. The final developed model is verified and evaluated for effectiveness. The first step in the process of deriving optimal input variables is to identify important variables from the actual data, and for this purpose, prior research and expert knowledge were used. In the process of deriving optimal parameters, deep learning algorithms using deep neural networks were used.
First, it is necessary to divide actual data into learning and verification data, and to set the range of parameters. In order to optimize the DNN model, the number of inputs, hidden layers, number of nodes in the hidden layer, dropout, activation function, optimizer, batch, epochs, etc. should be set directly to determine the optimal combination for the model. MAE and RMSE are used to evaluate the predictive performance of the developed model. Finally, when the optimal DNN model is determined, the predictive performance is evaluated compared to the existing method, MRA.
MAE and RMSE are two evaluation indicators that express errors through comparisons between predicted values and actual values using artificial neural networks [
41]. MAE is obtained by taking the difference between the predicted value and the actual value as an absolute value and averaging it, and the closer the MAE value is to 0, the smaller the error, so it can be said that the predictive power of the model is high. Meanwhile, RMSE is a measure commonly used to deal with the difference between the predicted value of the model and the value observed in the real environment. RMSE is used to synthesize residuals into one measure. The closer the RMSE value is to 0, the smaller the error, again indicating that the predictive power of the model is high.
In this study, we focused on the development of models using deep learning algorithms. No separate predictive power was produced in this study. MAE and RMSE are commonly used as model evaluation metrics in machine learning and deep learning. The lower the MAE and RMSE, indicators of the difference between predicted and real values, respectively, the higher the predictive power of the model. This study adopted Python 3.8 for model development, and it also used the Keras and Scikit-Learn libraries.
5.1. Deep Learning Algorithm
As AI continues to evolve, its value is continually increasing with the emergence of new algorithms. Neural networks are one of the deep learning algorithms. Neural networks were introduced as algorithms that mimic the neural system, and they solve problems using a layer of connected nodes. The multilayer perceptron (MLP) is mostly used for regression problems as well as classification and recognition [
42]. This study used a deep learning technique, which is widely used in the field of recognition and prediction. A deep learning model has basically the same structure as an artificial neural network, but it has the advantage of having two or more hidden layers, so it can be applied to various type of data [
43].
Deep learning is one of the techniques of machine learning, and it refers to a method of performing type classification or regression of input data. In general, deep learning has a neural network composed of several layers, and it has various structures [
44].
Deep learning involves various models, such as the deep neural network (DNN), convolutional neural network (CNN), recurrent neural network (RNN), autoencoder (AE), and generative adversarial network (GAN), depending on the processing method and structure. DNNs are usually standard neural networks with depth. There are hidden layers between the input and output layers, and the number of hidden layers determines the depth of the neural network. There is no specific number that a neural network classifies as deep, but in general, if the credit assignment path depth exceeds 2, it is regarded as deep [
45].
DNNs are trained to model complex nonlinear relationships, since each layer of the multiple layers is designed to identify a specific function [
46]. DNNs have the advantage of being capable of various types of modeling, like a general artificial neural network. However, they also have the disadvantage of being vulnerable to overfitting. Consequently, they are generally utilized for prediction and classification in various fields [
47]. This study developed a safety accident prediction model at a construction site using DNN in consideration of the input data format and output format as well as various modeling possibilities.
5.2. Data Preprocessing
The total number of data collected in this study was 1766, and eight input variables were used: progress rate, construction scale, number of employees, status of employment, worker nationality, day of week, accident time, and occupational classification. In this study, data were preprocessed by scaling the data using the z-score normalization method, which is a method that normalizes data using the mean and standard deviation. Before data pre-processing, data duplication, invalidity, and duplication were investigated, and it was confirmed that there were no abnormalities. Six nominal variables, including construction scale, status of employment, worker nationality, day of the week, incident time, and occupational classification, were entered as a single variable because they did not require normalization. Two numerical variables, the progress rate and the number of employees, were normalized. The z-score normalization method was adopted in this study. This was done to avoid the problem of data corresponding to outliers. In this work, z-score normalization was applied to reflect a wide variety of cases of construction safety accident data [
48].
Data preprocessing is the process of adjusting the range of data for easy comparison and applying units of quantities and resources that are difficult to compare. The input data preprocessed through the normalization process were divided into three types (i.e., learning, verification, and testing). Training data (learning and verification data) are data for a deep learning algorithm model to learn based on input data. In order to check whether the performance of the trained model is optimal, an optimal deep learning model is constructed and subjected to a verification process with verification data; the verification data are included in the training data. It is necessary to evaluate whether the verified optimal learning model is suitable for predicting the problem. At this time, the predicted result of the model and the result of the test data are compared to calculate and evaluate the error rate and fitness, and the data used for this step are the test data. The data used in this study were divided into training data (70%) and test data (30%); in addition, 30% of the training data were used as validation data. All data were chosen randomly.
In the model of this study, the data were scaled using the z-score normalization method to preprocess the data. If noise data are generated during the preprocessing process, the process may be performed by interval estimate or by binning through a smoothing method. In addition, if a new variable occurs in predicting safety accidents in the future, the DNN model of this study can be transferred learning and recalibrated to suit the problem to be newly solved.
5.3. Network Structure Scenario and Hyper-Parameter Tuning
The DNN model optimizes the model by updating the weights of each neural network node through a backpropagation algorithm. In order to optimize the DNN model, the number of inputs, hidden layers, number of nodes in the hidden layer, dropout, activation function, optimizer, batch, epochs, etc. should be set directly to determine the optimal combination for the model [
49]. Since the optimal combination value differs according to the input/output variables of each model, the optimal value of the model is derived through a trial-and-error method. The dropout is a normalization penalty to prevent overfitting.
In a deep learning algorithm, when a model has many input variables or when a learning model becomes complicated due to a large number of hidden layers and nodes, an overfitting phenomenon may occur. Overfitting refers to a phenomenon in which the performance of a deep learning model is degraded due to an increase in errors in the actual data or the test data caused by excessive learning of the training data. Dropouts can be used to prevent this [
50].
The activation function is a method of finding the weight that minimizes the cost function of each node. The optimizer is a way to make the learning both stable and fast. The batch is responsible for grouping the data into sets for efficient computation by large neural networks. The epoch defines the number of transcriptions [
47,
49]. In this study, considering the number of learning data and related past studies, three hidden layers as well as 0 or 0.2 for dropout were determined [
51,
52,
53]. The results of learning are shown in
Table 3.
The phenomenon of overfitting a model to the learning data is a major issue that reduces the model’s performance. Overfitting reduces the predictive power of the model due to the overlearning of learning data. To prevent this, dropout rates should be adjusted. It was determined that dropout rates do not make much difference by comparing the results of the training data, the results of the validation data, and the results of the test data, as shown in
Table 3.
The model with the minimum MAE and RMSE values for each dropout and node scenario was chosen as the final model. The learning results are presented in
Table 3. As the number of nodes in the hidden layer increased, the MAE and the RMSE tended to increase gradually, and when the number of nodes was 400-400-400, the MAE and the RMSE were both found to be minimal. Consequently, for the network structure, dropout was determined as 0 and the number of nodes was determined as 400-400-400. The batch was 5, the activation function was the ReLU (rectified linear unit) function, and the optimizer used the Adaptive Moment Estimation (Adam) method. The epoch was set to 1000 times, but the learning was stopped where there was no further improvement in the loss value. As the activation function, the ReLU function is a method designed to solve the vanishing gradient problem, which is a disadvantage of the existing sigmoid function. The ReLU function returns 0 if the input value is less than 0, and it sends the input value as it is if it is greater than 0 [
46,
51]. The Adam method was used as the optimization algorithm. This optimizer is a method that was proposed in 2015, and it is a commonly used algorithm due to its advantages, such as its ease of implementation, efficiency of calculation, and excellent performance. This algorithm is a first-order gradient algorithm based on a stochastic objective function by adding the concept of moment [
52].
In this study, the ReLU activation function was used in the hidden layer, and the activation function for the output layer used the softmax function. The activation function is used to normalize and transfer input values between 0 and 1 when they pass through one layer and transfer to the next layer. Particularly, the ReLU activation function does not cause gradient vanishing that occurrs in the sigmoid function, and the slope value is 1 as long as the input value is greater than 0, so learning in backpropagation is fast. For this reason, it is the most commonly used activation function in recent years. Since the data collected in this study did not have a value less than 0, the fast-learning ReLU activation function was used in the hidden layer.
In addition, the main reason for using the softmax function in the output layer in this study was to interpret the result value as a probability value. The biggest advantage of the softmax function is that the sum of probabilities is 1, so it is easy to recognize which classification has the highest probability. Due to these characteristics, the use of softmax can obtain the effect of normalization, so it is an activation function mainly used in the output layer.
Dropout was used on the input and hidden layers, not on the output layers. The learning rate was set at 0.1 for first 30 epochs, and 0.01 for next 70 epochs. It was set to 0.001 until the end. Epochs are the number of times the model is repeatedly learned. In this study, we trained it by changing the number of epochs, and learning became the most efficient when the number of epochs was specified as 1000.
5.4. Validation of the Model
The final model was decided based on the determined network structure and hyper-parameters. In this study, the Adam (Adaptive Moment Estimation) method was used as an optimizer. The Adam method can be implemented simply and has the advantage of having few memory requirements due to its efficient operation.
The final model is detailed in
Table 4. To verify the model, the predicted value and actual value (medical day) were calculated using the verification data and test data in the final DNN model, and the MAE and the RMSE were compared. In addition, using multiple regression analysis (MRA), which is an existing calculation method, the MAE and the RMSE were calculated and compared with the same data as the final DNN model. The MRA model was built using IBM SPSS Statistics 23 for Windows.
The results of the analysis of the evaluation indicators for each model are presented in
Table 5. The results of the validation data of the DNN model (MAE: 26.05, RMSE: 35.01) showed no significant difference compared to the training data results (MAE: 26.15, RMSE: 34.96); this indicates that the problem of overfitting is insignificant in this model. The results of the MRA and DNN models were MAE 29.98 and RMSE 39.79 for MRA, and MAE 27.42 and RMSE 35.99 for DNN. This indicates that the prediction error of the MRA model was larger than that of the DNN model, with MAE at 9.3% and RMSE at 10.6%; that is, the DNN model also had a lower prediction error rate than MRA in MAE by 9.3% and in RMSE by 10.6%.
6. Results and Discussion
As discussed earlier, meaningful results were obtained through the process of optimizing the network structure and hyper-parameters by borrowing the DNN algorithm, which is one of the deep learning algorithms. As a result of the model’s prediction, the DNN model showed that the MAE was 27.42 and the RMSE was 35.99. The MRA model showed a MAE of 29.98 and an RMSE of 39.79. The analyzed results show that the DNN model improved its predictive power by 9.3% in MAE and 10.6% in RMSE over the MRA model. The reason for these results is that the existing MRA model is a statistical analysis method that assumes a linear model, so the non-linear characteristics of the data due to complex influencing factors cannot be reflected. Contrary to this, the DNN model can reflect non-linear characteristics that are difficult for humans to check by learning a large amount of data by a machine. Therefore, it was judged that the DNN model was more suitable than the MRA model for adequately reflecting the nonlinear characteristics of the construction site safety accident data.
Deep learning techniques will allow us to predict safety accidents in construction projects more effectively than the MRA model. Using the methodology presented in this study, an optimal deep learning prediction model for a user’s desired problem can be constructed. Hence, the ultimate goal of this study, the framework proposal for the development of a deep learning model for the prediction of construction safety accidents, presented significant results. In addition, using this deep learning model, other users will be able to predict safety accidents at construction sites. For instance, in a construction site, the risk of an accident can be predicted through the DNN model, and management for the prevention of accidents can be advanced. In addition, the ordering party can predict accident risk in advance as part of the safety measure and use it to prepare a reserve fund, safety management budget, and annual budget for accident response. Furthermore, when insurance is actively considered as an accident risk transfer strategy, it can be used as a guideline for the selection of an appropriate premium. Moreover, since this model can be used to increase prediction reliability over that of the existing model, it will be possible to derive a more objective and accurate safety accident risk than the existing model. For instance, a project owner can set a level of probability that fits their assets and risk appetite. Through this, it is possible to prepare for risks in advance by transferring the risk through insurance for the expected risk amount and by signing a special contract for supplementary risks. In addition, it will be an opportunity to think about an appropriate rate by comparing it with the current insurance rate. Furthermore, it can contribute to improving the safety accident rate by enabling active safety management of construction sites through the accurate prediction of safety accidents. Using this model, the risk of safety accidents can be identified in advance, and damage can be minimized and avoided through appropriate investments for risk reduction. This will greatly reduce construction accidents by improving construction site safety, thereby contributing to the minimization of social costs resulting from human and material losses.
If the process of predicting accident risk proposed in this study is systematized, more effective safety management will be possible for accident prevention at construction sites. In the future, the safety management system to be developed will operate as shown in
Figure 4.
As shown in
Figure 4, first, the construction site is selected (Step 1) and then the construction site data are investigated (Step 2). Subsequently, the eight variables presented in this study are entered into the model (Step 3). Deep learning models operate using the entered variables (Step 4). The model measures the risk of accidents (Step 5). Subsequently, the risk of accidents at construction sites is reviewed (Step 6). If the risk of an accident is not identified correctly, the risk of an accident is reviewed again (feedback to Step 2). If the risk of an accident is identified correctly, its effectiveness is verified by application in the case (Step 7).
Nevertheless, this study lacks detailed data that can be used in the DNN model, even though, among the safety accident data at the construction site, the data from the Korea Occupational Safety and Health Agency were relatively accurate and large. In order to estimate safety accidents using deep learning algorithms, it is necessary to systematically build and manage safety accident data and geometry data as a database. In addition, further research is needed to advance the model by increasing the type of input variables and the amount of data. Furthermore, detailed personal information (age, gender, etc.) other than the variables used in this study could not be obtained from the KOSHA data. Further research is needed, including personal information that can be closely linked to safety accidents. Moreover, the data output of KOSHA collected for this study was the medical day of the accident, and the accident type (mild, severe, etc.) was not considered. Although the severity of an accident can be inferred through the medical day, there is a limit to the sophisticated prediction of safety accidents, so additional research is needed to develop a model for each accident type by securing additional data.
Furthermore, the existing studies using deep learning algorithms to predict safety accidents were relatively insufficient compared to those in other areas, so the selection of the optimal model and model structure depended on trial and error. Further research is needed through an in-depth analysis of more diverse model structures and parameter values, as well as the introduction of other algorithms in addition to the DNN algorithm used in this study.
Additionally, in this study, a model was developed using the variables employed in previous studies. The developed model has a low prediction error as a result of verification and is evaluated as a meaningful research result. However, it is not possible to know the weight and significance of each variable due to the characteristics of the DNN model.
In deep learning, details in which input data are processed in multiple layers are stored in the weight of the layer. Learning is to find weight values in all layers of the neural network to map input data to an accurate target. However, some deep neural networks have tens of millions of parameters. In this case, it is very difficult to find the exact values of all parameters. The reason is that changing one parameter value affects all other parameters. Therefore, it is difficult to express it in a general formula.
This may act as a lethal restriction in logically explaining the process and rationale for future result derivation by providing unilateral prediction results through the DNN algorithm.
To compensate for this, Europe has recently introduced eXplainable Artificial Intelligence (XAI) and made it mandatory. Therefore, in future studies, XAI will be introduced to improve the reliability of the DNN model.
eXplainable AI is an AI technology that explains the causal relationship, decision-making, prediction, and classification of the model to help users understand the model results [
51]. Through such AI technology, it will be possible to not only improve reliability by relieving anxiety about model results, but also develop understanding into data, models, and variables.
In addition, in this study, only the DNN algorithm was borrowed considering the complex nonlinearity of construction safety accidents. This can act as a limitation in model results and utilization. Therefore, cross-validation between models through modeling of other deep learning algorithms (e.g., CNN, RNN, etc.) is required in future research to increase the excellence and persuasiveness of model results. Such cross-validation will increase the reliability of the model results.
7. Conclusions
In this study, a deep learning model was developed to predict construction safety accidents. Deep learning technology can be a way to reduce safety incidents in construction sites. The model can improve the estimation technique of safety accidents at construction sites and improve the accuracy of prediction. The model proposed in this study is expected to develop into a more reliable model through continuous data accumulation and effectiveness verification.
The results of this study are as follows.
First, a deep learning-based safety accident prediction model was developed using the collected data. The model can predict the medical day by reflecting factors such as progress rate, construction scale, number of employees, status of employment, nationality of workers, day of week, accident time, and occupational classification. The developed model showed minimal MAE and RMSE when the number of nodes was 400-400-400. The MAE was 26.15 and RMSE was 34.96.
Second, the predictive power between the model in this work and the existing multi-regression model was compared. As a result, the MRA model showed that the MAE was 29.98 and the RMSE was 39.79. Furthermore, the DNN model showed the MAE as 27.42 and the RMSE as 35.99. The DNN model improved predictive power by 9.3% in MAE and 10.6% in RMSE compared to a conventional multi-regression model.
The model built through this study can improve the estimation technique of safety accidents at construction sites and improve the accuracy of prediction. Applying this model to construction sites can identify the risk of safety accidents in advance and minimize damage through appropriate investments to reduce risk. In the future, the model proposed in this study is expected to develop into a more reliable model through continuous data accumulation and effectiveness verification.
This study provides a framework for the introduction of DNN models in safety management and can be applied in other industries. Additionally, the development procedure and development model used for the deep learning algorithm model developed in this study can be applied to various types of construction sites and related research. This is expected to contribute to improving the safety accident rate in the overall construction industry. In the future, further research on the development of safety management system software will be conducted by developing the results of this study. If the proposed process of predicting the risk of accidents is systematized through this study, more effective safety management will be possible to prevent accidents at construction sites.


