
Study on Evacuation Behavior of Urban Underground Complex in Fire Emergency Based on System Dynamics


1
College of Transportation and Civil Engineering, Fujian Agriculture and Forestry University, Fuzhou 350108, China
2
College of Civil Engineering, Huaqiao University, Xiamen 361021, China
3
Department of Quantity Surveying, Faculty of Built Environment & Surveying, University of Technology Malaysia, Johor Bahru 81310, Malaysia
*
Authors to whom correspondence should be addressed.
Sustainability 2022, 14(3), 1343; https://doi.org/10.3390/su14031343
Submission received: 9 December 2021
/
Revised: 16 January 2022
/
Accepted: 20 January 2022
/
Published: 25 January 2022
(This article belongs to the Special Issue Fire Safety Technology and Human Behavioural Science for Building Sustainability)
Abstract
:During a fire evacuation, long lateral evacuation distances, large crowds waiting for evacuation at the same level, and easily panicked populations are common. This research aimed to look into the large-scale evacuation behavior of urban underground complexes with limited evacuation and egress during a fire. A simplified model for large-scale group evacuation of urban subsurface complexes was constructed using system dynamics theory. The Vensim software was used for quantitative simulation. The model could represent the typical phenomenon of group evacuation behaviors, such as quick or slow, under seven operating situations with total initial numbers of 350, 400, 450, 500, 1000, 2000, and 4000. The results of an analysis of critical affecting factors show “total initial number” and “panic state” during a large-scale group evacuation: a large beginning population will result in a rapid reduction in system evacuation capability, delaying the completion of the evacuation process significantly; meanwhile, if the level of panic is deficient, the system’s evacuation efficiency will remain low for an extended period, making it difficult to evacuate trapped persons promptly. According to the findings, the developed system dynamics model, which combines the advantages of a continuous model with the advantages of a discrete model, is very accurate. At the same time, we should emphasize the importance of the evacuation guide and reinforce the fire education and behavior drills for the building’s workers. This research presents a simplified model for the evacuation of large groups of people from metropolitan underground complexes. Furthermore, the findings may give theoretical support for the development of rules and safety management practices.
1. Introduction
In contrast to ground-level high-rise buildings, urban underground complexes can be evacuated via top-level platforms and windows on each floor. Underground complexes are surrounded by soil because they are relatively deep, and people trapped inside can only escape through narrow escape passages such as stairwells or refuge aisles. Congestion can quickly occur at these bottlenecks once the number of people in the building reaches an extremely high level, significantly reducing the overall evacuation capacity [1]. Furthermore, underground spaces have drawbacks, such as a lack of natural lighting. As a result, trapped people can quickly become panicked [2]. An irrational evacuation will cause widespread confusion and make evacuation more difficult [3]. As a result, large-scale crowd evacuation of urban underground complexes has always been a research focus in the field of pedestrian evacuation.
Evacuation is a necessary public safety measure to reduce the health risks associated with significant accidents [4]. Eviction is an essential part of emergency response and management because it allows people to move from dangerous areas to safer ones [5]. Scale and start time may limit evacuation [6]. Pre-warning of sudden-onset disasters may provide enough time for evacuation before a disastrous event, depending on the type of disaster [7]. Evacuees are assigned to fixed routes or destinations in emergency evacuation plans, and optimal evacuation policies for populations from areas of risk and uncertainty are defined [6]. The exposure dose calculated based on a vulnerability model and accident probability was introduced to predict the risk in [8], who focused on providing an assessment framework of evacuation risk for major accidents.
This research aims to provide information on large-scale group evacuation from the standpoint of fire safety management. First, a simplified model for large-scale group evacuation is proposed based on system dynamics, which can be combined with the continuous model to study the group evacuation behavior of underground space. The complex interaction relationship between performance systems is then examined, considering the effects of initial crowd size and group panic on evacuation efficiency and evacuation time. Finally, the simulation process is described, which considers the effect of population size on calculation time. The study’s findings are presented to understand better the complex interaction between the performance systems on a macro level. With the continuous development of computer technology, the evacuation model based on ABM can describe the complex interaction between individuals in large-scale populations, but the simulation results of different simulation systems are biased and need to be further optimized, and the system dynamics model depends on reliable data. The model established in this paper combines empirical research and a computer simulation system, through the analysis of several representative underground building facility fire accidents, and, combined with the simulation results of multiple simulation systems and with the advantages of the continuous model and the discrete model, overcomes the limitations and, finally, obtains the research results with strong reliability. This research can be used to analyze the evacuation behavior of large groups of people during similar types of safety evacuation procedures.
2. Literature Review
During a fire evacuation, the various human behaviors observed tend to fall into one of five categories: (1) preparation before a fire; (2) recognition of fire after the occurrence; (3) actions during a fire; (4) escape from fire; and (5) after-effects of the fire experience [9]. The five components most important to evacuees’ safety are how quickly occupants of a building recognize that a fire has occurred, escape from the danger zone, and react to toxic smoke encountered along the egress path [10]. In social sciences, behavioral engineering, and fire safety studies, evacuee response during these phases is a topic of interest. Acknowledging how evacuees recognize an emergency and react during a fire requires an understanding of the cognitive and social aspects of human behavior (such as risk perception, decision making, social influence, and group formation), according to [11,12,13,14,15]. While calculating evacuation paths, recent studies of individual actions during an emergency considered changes in crowd movement and suggested optimal routes based on adequate knowledge of human behavior [16,17]. When crowd emergency choices do not match the expected choice, these intelligent guidance systems can improve evacuation effectiveness, ensuring a safe and quick evacuation [18]. The central issues with the fourth component of escaping a fire concern procedural measures for designing effective egress paths or establishing emergency equipment (e.g., building signage systems) to aid actual evacuation processes. Despite their effectiveness in reducing wayfinding time, intuitive structural layouts cannot guarantee a building’s successful evacuation, as the scale and complexity of modern facilities are frequently different from such designs. The more elaborate the building enclosure, the more signage is needed to provide adequate wayfinding information to occupants during an evacuation [19]. For improving evacuation safety, many studies have confirmed the importance of understanding how people perceive, interpret, and use the information provided by signage systems [20,21,22]. Significant efforts have been made, for example, to improve the effectiveness of signage systems and increase their perceptibility to evacuees [16,23,24,25]. Modern signage systems are designed to indicate a path toward optimal exits using clearer and simpler presentation methods, based on recent technological advancements [24]. Such research highlights that understanding and improving how people observe and interpret signage during an evacuation can significantly improve evacuee safety during a fire [26,27].
Nonetheless, evacuees must observe the appropriate signs and determine the best route forward from their current positions due to a chaotic and crowded egress process. If the building in question has multiple egress paths and exits, any of which may be filled with smoke and must be avoided, the situation becomes even more complicated. As a result of the limitations of signage systems, the confusion surrounding time-limited building evacuations could be significantly reduced if safe evacuation states were provided quickly and accurately to reflect dynamic changes within the facility.
The evacuation group during a fire emergency was investigated at a macroscopic scale in this study. The large-scale group evacuation behavior of the underground complex was studied macroscopically to solve the problems mentioned above. During a fire, panicked individuals exhibit inadaptable and indomitable group behaviors, resulting in life-threatening crowding. The model was used to look at how the size of the initial population and the level of panic in the group affected evacuation efficiency and time. Physical experiments and more simulations in evacuation studies using evacuation models are complex due to personnel safety and the limitations of actual conditions. Continuous and discrete models are the two types of models currently used in evacuation simulation studies. The continuous model treats the human flow group’s evacuation behavior like a liquid or gas flow. The Euler or Navier–Stokes equation is used to describe pedestrian flow, and the amount calculated is independent of the size of the pedestrian [28].
However, rather than a simple linear superposition, complex nonlinear interactions between individuals and the environment occur during a group evacuation [29]. As a result, traditional continuous fluid mechanics models are unable to describe these complex relationships accurately. Discrete models have flaws in rule definition, calculation amount, and the number of simulated populations, making it impossible to effectively simulate large-scale group behaviors [30,31]. The evacuation group consists of several different evacuation individuals who interact with the others [32]. As a result, the evacuation group will contain various information, energy intersections, and conflicts within the complex system, resulting in the emergence of group trends or group confusion [33]. As a result, large-scale group evacuation behavior is a complex social system behavior that the traditional evacuation model cannot accurately model and quantify digitally [34].
To sum up, it is difficult for the current research model to represent the complex nonlinear relationship between individuals and the environment in the evacuation process. The efficiency of modeling and analysis of large-scale groups is very low, and it is difficult to describe the interaction between individuals in the group. The evacuation model established in this study can not only not be limited by the scale of the simulated crowd but can also show the interaction between individuals in the group so as to better study the large-scale crowd evacuation of underground buildings under fire. Table 1 shows the summary of the domestic and foreign research results.
3. Materials and Methods
The study aims to give knowledge on large-scale group evacuation from a fire safety management approach. First, a system-dynamics-based simplified model for large-scale group evacuation is provided, which may be integrated with the continuous model to analyze subterranean group evacuation. The impacts of initial crowd size and group terror on evacuation efficiency and time are then explored. Finally, the simulation procedure is outlined, taking population size into account. The study’s results help us better comprehend the macro-level interplay of performance systems. The method flow of this study is shown in Figure 1 below.
3.1. Analysis of Large-Scale Crowd Emergency Evacuation Accidents
Practical analysis of large-scale population emergency evacuation accidents can reveal the root causes of evacuation failures and prevent significant casualties. A fishbone diagram was established, and the root cause of heavy casualties was analyzed in “2004 Xinjiang Karamay Fire”, “2000 Luoyang Dongdu Commercial Building Fire”, “2004 Jilin Zhongbai Commercial Building Fire”, “2008 Shenzhen Dance King Club Fire”, and “2014 Henan Xinxiang KTV Fire”.
The causal analysis diagram, also known as the twig diagram or characteristic factor diagram, is a fishbone diagram. It was created in 1953 by Japanese expert Ishikawa and is thus known as the Ishikawa diagram. The fishbone diagram analysis method is primarily used in safety analysis and is helpful in accident investigation. In the latter, the various causes of an accident are examined from four perspectives: person, machine (environment), environment, and management, and a fishbone analysis chart is created with concise words and lines. When the fishbone diagram analysis method is used to investigate fire accidents in-depth, it can reveal systematic and organized causes that are otherwise complex, allowing people to discover the accident’s root cause more directly. As a result, a fishbone diagram is used in this study to perform a systematic analysis of the causes of mass crowd evacuation accidents, as shown in Figure 2.
To determine the root cause of the heavy casualties, the typical heavy casualties are analyzed from the perspectives of person, machine, ring, and tube using the established fishbone diagram. The main reasons for the evacuation’s failure are “extremely high initial number of people inside the building” and “panic in evacuated personnel,” as shown in the diagram.
An urban underground complex has a sizeable single-story area with a vast population capacity. The number of evacuation exits is extremely limited due to the location’s depth. Furthermore, natural light and air circulation are restricted because the underground environment differs significantly from the ground. When an accident occurs, the crowd can easily become panicked, and the panic can spread quickly. In an emergency evacuation, the urban underground complex exhibits the characteristics of “large capacity,” “fewer exits,” and “evacuation group.” According to studies of severe fire accidents, once a city underground complex is evacuated in an emergency, severe malignant casualties can quickly occur due to the effect of these characteristics. As a result, the focus should be on the macroscopic perspective of group evacuation behavior concerning “initial population size” and “panic state” through the model developed.
3.2. System Dynamics Modeling Process
System dynamics (SD) is a discipline that studies system feedback structure and behavior by combining system science theory with computer simulation. It is a branch of system science and management science that uses a mix of qualitative and quantitative methods and systematic, comprehensive reasoning to solve problems in large complex systems such as society, ecology, and biology. It can fully describe the complex interactions between internal feedback and structure and functional and dynamic behaviors [35,36].
In SD problems, it is common to identify the main subsystems in a complex system by studying the subsystems of internal function elements and the connections between the subsystems to promote the evolution of a complex system mechanism; the influence of the relationship between each subsystem and the entire system can be analyzed by combining with a computer test. The SD can be performed on a dynamic simulation model that is established based on the observed data. As a result, an analysis system with multiple internal feedback subsystems of dynamic change has been created. SD is also known as the computer simulation method for studying the dynamic behavior of social systems [37]. At present, system dynamics has been widely used in many research fields. Professor Forrester [38] used system science and computer simulation to systematically analyze complex social problems. Yan et al. [39] summarized the influencing factors of subway fire from four aspects—human factors, equipment, environment, and management—and constructed the system dynamics model of fire-influencing factors. Zhao et al. [40] constructed the operation feedback mechanism model of subway automatic driving based on system dynamics from the aspects of organization and management resource allocation, management experience, and avoidance of driver misoperation, evaluated the changes of system safety value and variables over time and the relationship between them with three key factors, and determined a detailed framework to identify the automatic control level.
Its primary modeling analysis method can be divided into five steps, as illustrated in Figure 3.
The fundamentals of cybernetics and information theory are combined in system dynamics theory, which integrates structure, function, material, information, science, and experience to provide the following significant benefits [41]: a diverse set of applications; an open research object; qualitative and quantitative data combined; and robust integration.
SD theory is a powerful tool for studying complex systems because of these advantages; it can successfully solve complex problems that many traditional methods cannot. As time passes, a mass evacuation crowd comprises several different evacuation individuals, alternating between various states such as movement, stillness, panic, and calmness. Individuals also engage in complex social behaviors such as attraction, collision, exclusion, crowding, and learning. Some of these states and behaviors can be expressed numerically, while others are impossible to quantify. As a result, the entire evacuation group exhibits nonlinear complex system characteristics. As a result, using the SD research method to model the evacuation behavior of large-scale populations is theoretically possible.
The evacuation model is built using the same technical methods used in system science. An SD model can describe individual interactions within populations. However, it can also simplify the modeling process and solve the problem in the traditional evacuation model, where the crowd size limit cannot describe the complicated nonlinear relationship between individuals and other issues. As a result, a large-scale crowd evacuation model can help researchers come up with new research ideas.
3.3. Model Setting
3.3.1. Scenario Setting
Buildings on the ground can be evacuated via high-rise platforms or windows, whereas underground space evacuation exits are limited. As shown in Figure 4, evacuation personnel must be evacuated to ground safety areas through narrow spaces such as stairwells or evacuation front rooms. In this paper, we set the following assumptions: (1) the evacuees are bounded rational people, that is, they are vulnerable to emotional influence and make irrational decisions; and (2) the influence of everyone’s height, pace, body shape, and other factors on evacuation behavior is not considered.
As a result of this unique structure, large-scale populations can be evacuated in an emergency. When people are evacuated to safety areas, they congregate in these small spaces, slowing down the entire evacuation process.
These “bottleneck” positions limit the speed with which trapped people can be evacuated. It is the most important factor affecting an urban underground complex’s evacuation efficiency, and it must be considered when building the model. Other factors, such as the exit distance and the distribution of exits, have little impact on the overall evacuation time.
A regular or irregular rectangle is used to divide a fire subdivision of an urban underground complex. For the sake of simplicity, each fire partition is assumed to be a regular rectangle. The “Chinese Code for Fire Protection of Building Design” stipulates that each fire department must have at least two evacuation exits; in reality, each partition has two evacuation exits. The size of the evacuation exit door in this experiment is 1800 mm × 2400 mm, the evacuation exit distance in different directions is 20 m, and the included angle is 90°. The following data are obtained by organizing several crowd evacuation experiments. According to the building regulations, the allowable evacuation time for civil buildings with grade I and II fire-resistant buildings is 5–7 min, and the evacuation time for civil buildings with grade III and IV fire-resistant buildings is 2–4 min. Therefore, the simulation time of SD evacuation model established in this study is controlled within the range required by regulations, which is relatively short. The above scenarios were simulated by FDS+Evac simulation software. As shown in Figure 5, two evacuation exits are set up based on rectangular area rules, with the distribution location divided into a synthetic distribution exit relative to three adjacent distributions. The time to evacuate when simulating different exit distributions is listed in Table 2 when the number of people is set to 1500; the exit divisions are different and will not significantly impact the total evacuation time.
The SD model developed in this study considers the narrow bottleneck locations as critical factors affecting the efficiency of group evacuation based on the analysis above. When personnel in the system must evacuate in an emergency, the model assumes that they must first move from their locations to the exit area (the evacuation front room) and then evacuate to the external security area through the exit, as shown in Figure 6. The model considers the effects of the number and size of the exit area on evacuation efficiency and the distribution of the exit area and the distance from the starting point to the exit distance.
Assuming that there is no congestion before entering the exit, the evacuation speed of the personnel is unaffected by density and is independent of the number of people. A more significant number of people allows more people to immediately move to the exit simultaneously, which results in faster exits but does not imply a faster individual evacuation speed.
When using SD to model a complex system such as a large-scale evacuation population, it is typically verified whether the input and output of the model are abnormal according to the actual situation [42]. Because many uncertain factors exist in the system, mutual influences occur between the factors, exhibiting evident nonlinearity and randomness [32]. Therefore, when the social complex system expresses the relationships among various factors, it is primarily based on the actual situation. The situation is fitted to obtain the representation function, and the regression is examined [41]. Furthermore, the model developed in this study contains a wide range of variables. Existing mathematical formulas can express the interaction of some factors (for example, the relationship between personnel density and evacuation speed); however, explicit mathematical expressions for other factors are challenging to obtain (e.g., the effect of crowd order on evacuation efficiency and the effect of emergency broadcast systems on the rate of panic increase). As a result, the mathematical expressions of these influence relations are obtained primarily by fitting empirical data, and the main parameters are corrected several times using relevant literature [43,44,45].
This study focuses on the impact of “total initial number” and “panic state” on evacuation efficiency. As a result, the model focuses solely on the relationship between these two system factors and establishes a corresponding feedback loop. Other influences, such as fire products and crowd composition, are not considered.
3.3.2. Staffing
Personnel in the model setting system include the following: total system personnel, personnel to be evacuated, personnel inside the exit, and evacuated personnel. The total number of personnel in the system is the sum of the number of evacuated people. In contrast, the number of people to be evacuated is the number of personnel within the exit when entering the exit area, such as the evacuation stairwell. In addition, the number of exits is recorded.
The evacuation movement and personnel setting change processes for the system’s personnel are as follows: After an emergency, the evacuated personnel evacuates the trapped personnel inside the system, and some of the evacuated personnel move to the exit area (the evacuation front room). Some people are classified as personnel in the exit (but remain evacuated personnel) and are then evacuated outside the system via the exit area to become evacuated personnel. The total number of people in the system minus the number of evacuated persons is the number of people to be evacuated in the system; they are gradually evacuated to the outside of the system according to the process outlined above. All evacuation is completed.
3.4. Causality and Stock–Flow Diagrams
3.4.1. Construction of Causality Diagram
The SD model and an accurate portrayal of the system’s internal relations are based on the causal relationship between various factors in the system [25]. As a result, constructing the causal relationship diagram is the fundamental step in system simulation to establish a correct model.
The causality diagram analyzes the causal relationship between various factors in complex systems and describes the interaction of different factors based on the causal feedback loop. As shown in Figure 7a, a positive sign in the feedback chain between two factors indicates that a change in A will cause a change in the trend of B in the same direction. For example, if A decreases, B decreases; if the feedback chain between the two factors takes on a negative sign, it indicates that A’s change causes B to change in the opposite direction. For example, if A decreases, B increases, as shown in Figure 7b,c. It is worth noting that the arrows in the feedback loop only indicate a positive or negative correlation between the two variables, not a proportional relationship.
Figure 8 depicts the causal relationship diagram of an urban underground complex’s large-scale crowd evacuation behavior based on the previous model analysis.
3.4.2. Construction of Stock–Flow Chart
The causal relationship graph can qualitatively analyze the relationship between the system’s various factors and the system’s dynamic changes. However, if the model is to be quantified, the system’s stock–flow graph must be created. The stock–flow graph is classified according to the variables’ nature to distinguish the differences between them effectively. The following are the most used variables:
- (1)
- State variable (level): The horizontal variable primarily indicates the system’s accumulation state during the dynamic change. It represents the accumulation of matter or energy (information) from the beginning to the end of a given period, and its magnitude is proportional to the rate variable.
- (2)
- Rate variable (rate): The state variable represents the accumulation over a given period, whereas the rate variable represents the state variable at a given point in time, i.e., the derivative.
- (3)
- Auxiliary variable (auxiliary): The primary function of the auxiliary variable is to complete the system structure. It is commonly used to supplement and enrich the logical relationship between the state and rate variables, i.e., the intermediate variable, to make the two more reasonable. A connection is also established.
- (4)
- In theory, invariant parameters do not exist in a dynamically balanced system; however, to make the model more concise and easier to construct, the SD typically exhibits a small variation range. Parameters are treated as constants and can be directly entered into the model.
This section examines the significant linkages and interactions among the system’s significant factors using a stock–flow graph of a large-scale evacuation population system, as shown in Figure 9.
As shown in the figure, there are 13 positive cycles and 5 negative cycles in the system. Through the analysis of “Karamay fire in Xinjiang in 1994”, “Dongdu commercial building fire in Luoyang in 2000”, “Zhongbai commercial building fire in Jilin in 2004”, “Shenzhen Dance King Club fire in 2008”, “2014 Henan Xinxiang KTV fire”, and other major fire accidents were studied, and the influencing factors of evacuation behavior of urban underground complex under fire emergency were obtained; the circulation system of system dynamics was constructed through the relationship between variables. The model comprises three state variables LEVEL (LEV), seven rate variables RATE (RAT), and six auxiliary variables AUXILIARY (AUX). The main variables are described as follows:
- ▪
- The evacuation capacity of the system (SEC) indicates the ability of the system to evacuate trapped personnel per unit time in terms of panic status, human order, exit area, and the number of exits. It is noteworthy that in this model, the SEC only qualitatively indicates the size of the system’s ability to evacuate personnel per unit time and does not represent the exact number of evacuated personnel per unit time. However, whether the number of evacuated persons can be accurately represented in the entire evacuation process does not affect the system’s variation law of evacuation ability. Although the SEC cannot specify the number of evacuated personnel per unit time, it can describe the system’s evacuation capability during an evacuation. The dynamic changes in the process will not affect the SD model’s accurate simulation of a large-scale crowd evacuation in urban underground complexes.
- ▪
- The number of people exiting (NPE) indicates that the number of people entering the stairwell of the exit is related to the rate of increase in the number of exits.
- ▪
- The increase in exit personnel (EPGR) indicates the increase in the number of people in the evacuation stairwell, which is related to the number of evacuations in the system and the speed at which the trapped persons flee the evacuation stairwell (panic state). A more significant number of people to be evacuated results in more people being evacuated in the unit time to the exit stairwell; additionally, a higher panic state causes the people to run faster.
- ▪
- The number of evacuations (NPE) indicates how many must be evacuated within the system. When an emergency occurs, the system’s personnel must be evacuated. The number of people who will be evacuated at this time is proportional to the total number of people who will be evacuated.
- ▪
- The number of evacuated people (NE) is the number of evacuated to a safe area outside the system during the evacuation process; it is proportional to the total initial number and the number of people to be evacuated.
- ▪
- The sum of all the numbers in the system at the time of evacuation is the total initial number (TIN). The total initial number is equal to the number of people to be evacuated before the evacuation begins. The total initial number equals the sum of evacuated persons and the number of evacuated persons once the evacuation begins.
- ▪
- During the evacuation, the degree of human order (DOP) indicates the degree of order among the trapped people. The lower the degree of order, the more chaotic the crowd, and thus the lower the efficiency of evacuation and the higher the state of panic.
- ▪
- The degree of panic among the trapped people in the system is indicated by the state of panic (SP). The trapped person is thought to be more eager to flee the scene as the level of panic rises after an emergency. The panic state has a positive relationship with the trapped person’s evacuation speed. A higher SP level in the population causes a faster evacuation.
- ▪
- The rate of increase in terror sentiment (TRFI), the rate of personnel reduction (RRP), emergency (EG), evacuation pilot (EL), emergency evacuation lighting system (EELS), fire emergency broadcast system (FEBS), exit quantity (EQ), and exit area are some of the other variables (EA). Table 3 shows the specific classification.
The stock–flow chart’s most significant advantage is that it can influence the feedback system’s dynamic accumulation effect via state and rate variables and represent the causal structure between various factors in the system via other variables such as auxiliary variables. The SD model can perform a quantitative analysis [41] and a qualitative analysis based on the mathematical description of the dynamic relationship between state and rate variables in equations. The mathematical equations’ derivation is detailed in the following section.
3.5. Construction of the Dynamo Equation
The process of “translating” a model structure into a mathematical expression or transforming the qualitative relationship between abstract factors into mathematical expressions of quantity, is known as equation derivation. Abstract logical relationships can be simulated in a computer using mathematical equations. The process of deriving mathematical equations is more than just establishing a simple link between ideas, concepts, and simulation results. Only the relationships between various factors can be expressed if only the causal graph representation model is built, and the simulation cannot be quantified. A standardized mathematical model must be established for a computer to calculate the dynamic changes of various factors within the system in a stepwise manner. Even if the system’s causal relationship has been established, mathematical equations are required to calculate the simulation of the system’s operation process more accurately, as they are critical in simulation modeling [25]. In the dynamic model of a large-scale crowd evacuation system in an underground space, the Dynamo language was used to derive mathematical equations, and Vensim was used to simulate the model.
For the study of SEC functional relationship, Chen [4] and Silvius [46] summarized and demonstrated the specific functional relationship and proved its accuracy. The SEC is expressed by the following Equation:
stands for density between outlets, and it indicates the effect of personnel evacuation speed on the system’s evacuation ability under the influence of density between outlets; and stand for panic state and degree of order evacuation ability, respectively; and stands for the adjustment parameter.
The following equation expresses the SP:
According to the findings in the primary reference [47], when an emergency occurs, the people in the group express their panic by using the crowded behavior strategy. When the panic level of the crowd is low, it is reasonable to assume that most of the evacuated personnel will still follow the evacuation procedure. When the commander’s SP is high, the majority of the people in the group will panic and compete for evacuation. The following equation expresses the :
Its effect on evacuation efficiency was investigated through small-scale experiments, as illustrated in Figure 10.
For 168 students in four classes, organized group evacuation drills were held. The evacuation time was shorter (approximately 1.5 min) when each class was queued for evacuation, and the evacuation time was longer (approximately 4 min) when the second free disorder was used, as shown in Figure 11a,b. As a result of small-scale evacuation experiments, it was determined that the order of the evacuation population is related to the group’s evacuation efficiency, i.e., the higher the degree of order, the higher the evacuation efficiency; however, the order degree is a difficult concept to quantify. The trend function can only be obtained by fitting empirical formulas, and the relationship of group evacuation efficiency is difficult to obtain using existing mathematical expressions.
Other kinds of literature, such as the effect of panic level on movement speed, can be used to determine the relationships between other variables. In their paper “Simulating Dynamical Features of Escape Panic”, [48] stated that when people are panicked, they will try to evacuate at a faster rate than usual. Furthermore, this phenomenon was described in detail: under normal conditions, an adult of approximately 80 kg would move at 0.6 m/s in a more relaxed state (when the degree of panic is low or when the degree of panic is average). In a high-panic state (when the degree of panic is high), the moving speed can reach 1 m/s, and in a high-panic state (when the degree of panic is high), the moving speed can reach 1.5 m/s. Furthermore, the desire to survive in a dangerous environment governs the relationship between panic emotion and speed of movement. This is the law of behavior change caused by an inner desire and the goal of the action; thus, it will not be caused by the type of disaster or the structure on the scene. Other findings can be obtained from the study, such as spatial parameters, number of evacuations, and individual attributes and rules, which can all make a significant difference.
Although the relationship between the remaining variables can be determined through relevant experiments or real-world cases—the emergency broadcast system, lighting guidance system, and guidance personnel, for example, can effectively control the evacuation process and improve overall evacuation efficiency—this has not been documented in the literature. It expresses the mathematical formula relating to the effects of these variables on other variables; however, it has a more substantial influence on evacuation behavior. Although no specific mathematical formula exists, increasing the emergency broadcast system can effectively improve evacuation efficiency, and optimally setting the lighting guidance system can improve personnel evacuation speed. However, there is a clear link between the two. After consulting relevant security field scholars or experts engaged in fire safety work, this relationship is expressed as a linear relationship. However, these factors are considered secondary factors affecting the evacuation efficiency of the group in the model constructed in this study to reduce the effect of the empirical judgment on the accuracy of the simulation results. The values of the evacuation guidance personnel are set to 0, as shown in Figure 12. At 10 and 30, the effect of system evacuation efficiency only indicates that this factor will improve the system’s overall evacuation efficiency and significantly impact group evacuation. The emergency broadcast system and the lighting guidance system both work in the same way.
The expert scoring method is used to determine variable parameters, which combines simulation results from classical models such as the social force model with the results of small-scale group evacuation experiments; finally, the parameters are determined by comparing and fitting.
The main equations in the model are listed in Table 4.
4. Verification and Validation
The large-scale crowd evacuation model that was built was tested to ensure that the model was accurate and that the simulation results were credible. The test was carried out in two stages, with the model function and model accuracy tests being the most important.
4.1. Functional Test
The established evacuation model was tested using the Vensim software. The software is an SD program developed by Ventana in the United States, and it is currently the most widely used SD modeling and analysis program.
The emergency broadcast system, emergency lighting guidance system, evacuation guidance personnel, and other facilities and personnel are assumed to function generally in the established large-scale crowd evacuation SD model. We started with a total of 300 people, two outlets, and a 10 m2 space. To simulate an emergency, we increased the EG to 100. Figure 13 depicts the results of the model simulation. People in the system began to evacuate as soon as the emergency occurred, as shown. Due to on-site tension and other factors, the crowd moved quickly to the exit after the evacuation. The system’s evacuation capability was significantly increased in a short period. However, as the number of exited evacuees increased, congestion affected evacuation behavior, and the system’s evacuation capacity declined. As the number of exited evacuees increased, the system’s evacuation capacity declined, eventually reaching its lowest point. At this point, the stairwell’s personnel density can be maximized. The crowding phenomenon severely harms the system’s ability to evacuate. Its effect may have gradually spread to the stairwell’s surrounding area, resulting in “exit congestion”. The trapped personnel in the system gradually dispersed as a result of this evacuation behavior. As the number of people on the street decreased, congestion in the exit stairwells decreased, and the exit’s evacuation capacity gradually increased. The tail of the curve began to rise, as shown by the curve in the figure. The evacuation behavior was thought to be coming to an end.
In a group evacuation, “fast is slow” is a common occurrence. It primarily states that as individual evacuation speeds increase, the evacuation efficiency at the evacuation exit will gradually decrease due to congestion [49] (Helbing et al., 2000). Furthermore, as shown in Figure 14, this model is capable of accurately reproducing complex behavior. The psychological state is characterized by increased anxiety and panic. The behavior is embodied in an increase in evacuation speed after emergency workers are eager to flee the scene to safe evacuation areas [50]. Because close contact was positively correlated, the curve in Figure 14 implies that the people trapped are in a panic state, and the personnel’s evacuation speed changes. As time passes, the evacuees’ evacuation speed increases in lockstep with the level of panic; however, the system’s evacuation capability decreases, and the “fast is slow” phenomenon emerges.
4.2. Accuracy Test
One of the most important and difficult tasks faced by model developers is model validation and the validation process [51]. This paper refers to the research methods of Ransikarbum et al. and, combined with the research on integration by Chanthakhot [52] and Wattanasaeng [53], verifies the evacuation model by comparing and fitting the simulation results of different evacuation simulation software in different evacuation numbers. Integration aspects related to simulation research are essential.
The model accuracy test’s primary goal is to see if the established model can accurately simulate actual crowd evacuation behavior and if the model’s calculation results are correct. Because large-scale group evacuation experiments are challenging to conduct due to the large number of participants involved, the accuracy test’s primary goal is to simulate the model simulation results using the widely used evacuation simulation software Pathfinder and FDS+Evac. To compare, the model’s accuracy is determined by calculating the difference between the two.
Thunderhead Engineering of the United States developed Pathfinder, an intelligent evacuation and evacuation assessment system based on the SFPE (Fire Engineering Manual), which is simple and intuitive [54]. The software has been successfully used in the evacuation simulations of many large and complex buildings worldwide [55,56]. The Pathfinder simulation environment is a three-dimensional triangular mesh design with a continuous constructed physical space. The software’s simulation results closely resemble those of reality. The National Technology Research Center (VTT in Finland) developed FDS+Evac, a pedestrian evacuation simulation software. The software was created using the Fire Dynamics Simulation Software from the National Institute of Standards and Technology (FDS). To simulate the behavior of the personnel, the motion equation and the motion model were used. Helbing’s proposed social force model can be used to model the effects of environmental and social forces on the evacuation process [57].
To verify the accuracy of the constructed SD model, the model simulation results are compared to the simulation results of the Pathfinder and FDS+Evac software. Figure 15 and Figure 16 show how the evacuation site model was created in the Pathfinder and FDS+Evac software, respectively. The simulated site area was 40 m × 50 m, and two outlets were designed, each with a 12 m2 area and an exit width of 0.90 m (GB 50016-2014) 5.5.18, according to the national standard “Code for Fire Protection of Building Design” (GB 50016–2014). The net width of the evacuation doors and safety exits in public buildings shall not be less than 0.90 m unless otherwise specified in this specification. This value was discovered during the evacuation of trapped personnel from the fire zone to a safe area.
Furthermore, the narrowest width was the most crucial factor affecting evacuation efficiency. SFPE mode meets the environmental requirements of this paper and is simple and intuitive. Therefore, the Pathfinder software selects the SFPE mode as the evacuation mode. Both types of software set the pedestrian response lag time to 0 s, the shoulder width to 0.4 m, and the height to 1.6 m to make the simulation easier. A normal distribution represents the moving speed (average speed is 1.2 m/s, the standard deviation is 0.3 m/s). The Evac and SD software’s parameters are identical to those of Pathfinder. The simulation was run in six sessions, with the initial number of people set to 350, 400, 450, 500, 1000, 2000, and 4000, respectively, to calculate the time required to evacuate various groups of people. As shown in Table 5 and Figure 17, the simulation results are compared to the model calculation results from this study.
The simulation results show less than 7% differences between the evacuation model and the Pathfinder simulation results. Except when the numbers of people are 350 and 2000, the deviation from the FDS+Evac simulation results is less than 9%. y = x; y = 0.9458x; and R2 = 0.9997 and 0.9961 are the fitting curves for the data. As a result, it can be concluded that the model simulation results are consistent with the Pathfinder and FDS+Evac software simulation results. However, as the number of simulations increased, the simulation operation time of the Pathfinder and FDS+Evac software increased significantly, particularly the FDS+Evac software, which is modeled for individuals thanks to Helbing’s social force model; additionally, its complexity is O = N2. In other words, as the number of simulations grows, so does the calculation time. As a result, large-scale population simulations are inefficient; however, the calculation time of the SD model developed in this study remains unchanged, and the simulation can be completed quickly.
Based on the results of the above tests, it can be concluded that the SD model developed here has a high level of simulation accuracy and can accurately describe the basic process of group evacuation. The SD model of large-scale crowd evacuation in an underground space was used to test the model function and accuracy. The model can simulate and reproduce group evacuation behavior and reproduce the typical behavior characteristics of the process. Furthermore, because the model’s simulation accuracy is high, the calculation amount will not change significantly with the size of the evacuated population. It also can simulate the evacuation behavior of large groups.
5. Case Analysis
5.1. Background Introduction
The SD model was built to analyze the effect of different “total initial number” and “panic state” on system evacuation efficiency during an emergency evacuation using the underground complex of a particular city in F city as the research background. A fire protection section of a complex’s underground layer is selected in the simulation area, as shown in Figure 18, measuring 1284 m2. The area has two evacuation exits, each with a 10 m2 evacuation front chamber and a 12 m2 evacuation back chamber.
A 0.9 m wide fire door connects the refuge aisle. Expert scoring methods are used to determine the variable parameters, combined with simulation results from classic models such as the social force model and small-scale group evacuation experiment results.
5.2. Analysis of the Effect of the Initial Total Number of People on Evacuation Efficiency
The range of the total number of people is determined first. According to the density requirements of personnel in various building types in the most current building design fire protection specification, the density coefficient is 0.6 (Ministry of Public Security of the Republic of China, 2014), and the simulation area’s construction area is 1284 m2 according to the following formula:
is the number of people to be evacuated; is the simulated area; and is the area reduction factor. The range is 0.5–0.7 and 0.5 in this study; is the personnel density coefficient, of which 0.6 is used herein. The number of people to be evacuated is 386; therefore, the total initial participants (TINs) are 300, 500, 700, and 900. The effect of different TINs on the SEC was analyzed through four simulations.
Figure 19 shows the results of the simulation. The evacuation capability of the system increased significantly, indicating that the density within the exit decreased; additionally, the number of people decreased, and the evacuation is nearing completion. It is possible to conclude that the evacuation behavior came to an end. In addition, the figure depicts some variations in exit evacuation capacity corresponding to various initial numbers, as follows:
- (1)
- Before the ECX reaches the extreme value (section “a” in Figure 19), the effect of different TIN values on ECX is not evident.
- (2)
- The ECX values corresponding to different TINs are different, and the time to reach the extreme value is also different. The larger the TIN, the earlier the ECX reaches the extreme value, and the smaller is the extreme value.
- (3)
- After the ECX reaches the extreme value (section “b” in Figure 19), the TIN begins to affect it. The larger the TIN value, the lower is the ECX.
The reasons for the phenomenon above are as follows:
Even though the simulation’s four TIN values are different, the effect of TIN on ECX is not visible at the start of evacuation (section “a” in Figure 19). This is due to the low exit density at this stage. Even though the four TIN values differ, the ECX is unaffected by factors such as exit density. The trapped personnel can flee at a faster rate, keeping the evacuation exit open. The ability to evacuate gradually improves over time.
The density of exit personnel gradually increases as the evacuation progresses, and once it reaches a certain level, it affects the ECX. The larger the TIN, the more people will rush into the evacuation room in the event of an emergency. The increase in evacuation personnel density is faster, and the effect on the ECX is more immediate. As a result, the larger the TIN, the longer the ECX takes to reach the extreme value. The rate of evacuation is proportional to the level of panic, which rises over time. The earlier the ECX reaches the extreme value, the lower the evacuation speed is, resulting in a lower corresponding ECX extreme value. However, due to the short duration of this process, the actual difference is not readily apparent.
The larger the TIN, the lower the ECX (segment “b” in Figure 19) when outlet density affects evacuation behavior. The main reason for this is that the higher the TIN, the lower the ECX extreme value and evacuation efficiency are, and the higher the personnel retention rate is. The density increase rate is correspondingly higher at this time, making it more difficult for the population to evacuate due to density. As a result, the rate of ECX reduction is higher. Because of the low extreme value and the fast reduction speed, the ECX decreases as the TIN increases. The TIN value is low, indicating that the number of people who must evacuate is low, and the ability to do so is high. The two effects are combined, and thus the lower the TIN, the shorter the evacuation behavior’s end time. On the other hand, the higher the TIN, the longer the evacuation time.
5.3. Analysis of the Effect of the Initial Total Number of People on Evacuation Time
As shown in Figure 20, the evacuation end time of various initial numbers is calculated. As can be seen, the end time corresponding to the TIN varies significantly depending on the value. The shorter the end time of the evacuation behavior, the smaller the TIN; the more significant the TIN, the longer the end time of the evacuation behavior.
In the “Code for Fire Protection of Building Design”, the urban underground complex is classified as a Class 1 fire-resistant building. The specification provisions clearly state that “the time for personnel to evacuate from the auditorium of the first- and second-class fire-rated buildings is not more than 2 min” (Ministry of Public Security of the Republic of China, 2014). As a result, using the simplified model developed in this study, it is possible to verify whether the evacuation end times of various initial numbers satisfy the specification requirements. The initial number of people significantly impacts the group’s evacuation time, as shown in Figure 20 and listed in Table 6. When the initial number is enormous, the evacuation time will exceed the requirements, posing a security risk.
In conclusion, the TIN has a significant impact on the SEC. When the TIN is low, the evacuation team can keep moving faster throughout the process. Furthermore, the TIN keeps a low value to significantly advance the evacuation end time, allowing the system to recover to a higher evacuation capacity sooner. Controlling the initial number of people evacuated is critical to improving overall evacuation efficiency. This is similar to the findings of [41,54]. As a result, to improve the efficiency of a group emergency evacuation, we should concentrate on the beginning of the evacuation and the TIN before the start of the evacuation and the ability to withstand the system ahead of time. Furthermore, scientific judgments must be made, and the size of the population entering the system must be well controlled.
5.4. Analysis of the Effect of Panic State on Evacuation Efficiency
Another essential factor influencing evacuation behavior is panic [43]. Extreme panic can confuse the evacuation process, which reduces the efficiency of the evacuation and increases the number of casualties due to stamping accidents [58]. In general, a lower level of anxiety is preferable; however, there is no clear answer to this. As a result, this study included a simulation of this problem. The simulation was performed twice. The first SP is TRFI × 2 + DELAY1(IF THEN ELSE (EG > 0, 10, 0), 2). The second set of the SP value is divided by 100 on the original basis, with (TRFI × 2 + DELAY1(IF THEN ELSE (EG > 0, 10, 0), 2))/100) indicating a lower panic state, as listed in Table 7.
The simulation results are illustrated in Figure 21.
As shown in the figure, when the crowd is in a normal state of panic (curve 1 in the figure), the SEC is affected by the panic state and increases at first but gradually decreases as the evacuation progresses due to the action of density and other factors. The SEC does not have the shape of a peak and a valley in the normal state when the crowd is in a state of low panic (curve 2 in the figure) for evacuation. The SEC, on the other hand, gradually decreases over time to maintain the original evacuation ability, and its overall level is low when the SP is low.
The above research shows that panic has a certain positive effect on crowd evacuation activities. Figure 22a considers the factors of panic and crowd evacuation. Figure 22b considers a reduction in the panic mood of the group, making .
It can be seen that the role of panic is inversely proportional to the size of the evacuated population, and beyond a certain critical value, panic will no longer play a role in improving evacuation efficiency. In order to control panic in the evacuation activities, the size of the evacuated population should be considered. In the case of a large crowd size, it is still necessary to maintain a low level of panic.
5.5. Analysis of the Impact of Emergencies on Evacuation Efficiency
The emergence of emergencies during evacuation will affect the crowd psychology, which may aggravate the panic psychology and further confuse the crowd. Therefore, in the process of evacuation, it is necessary to minimize the impact of emergencies. The effect of various emergency impacts on evacuation efficiency is systematically simulated in this study to investigate the necessity of emergency impacts in the evacuation process. The simulation is divided into three stages in the experiment: the first emergency impact is set to 1, indicating that the emergency impact is small; the second setting emergency impact is more significant than 100 on the original basis, indicating a normal panic state; and the third setting emergency impact is multiplied by 100, indicating that the emergency impact is significant. Figure 23 depicts the simulation results.
As shown in the graph above, the curve of “great impact of emergency” rises sharply at first then gradually decreases with evacuation behavior until it converges with the curve of “normal”. The “great impact” and “normal impact” curves are consistently above the curve throughout the process.
The reasons for this phenomenon are as follows: if the impact of emergencies is too significant, people have a strong sense of crisis, and with the cooperation of complete evacuation facilities and influential evacuation guide personnel, they can produce a higher evacuation ability, allowing them to evacuate a large number of people in the early stages of evacuation; if the impact of emergencies is too small, people in the building facilities lack the danger to the scene; the concept of degree slows down the evacuation process, reduces the efficiency of the evacuation, and slows down the evacuation speed.
It can be seen that during the crowd evacuation process, we should not only maintain the scene’s order but also ensure that the evacuation crowd understands the gravity of the incident, creates a sense of crisis in people’s hearts, and allows the crowd to cooperate with the evacuation consciously.
5.6. Impact of Site Environment Layout on Evacuation Efficiency
Given the influence of underground building environment on evacuation efficiency, the following centralized variables are analyzed:
- (1)
- Measures to protect the environment at the evacuation site in the event of an emergency. The simulation is repeated twice during the test. The evacuation guiding people, emergency lighting guidance system, and emergency broadcasting system are all set to 10 in the first instance, indicating that the site has emergency evacuation facilities and an evacuation guide; in the second instance, the evacuation guiding people, emergency lighting guidance system, and emergency broadcasting system are all set to 0, indicating that the site does not have emergency evacuation facilities or an evacuation guide. Figure 24 depicts the simulation findings.
- (2)
- The trend in both is similar, but the curve of “evacuation site equipped with emergency measures and evacuees” is always higher than the curve of “evacuation site without emergency measures and evacuees”, and the difference between the two is expanding with time. Arranging evacuation guide persons and emergency evacuation settings at the evacuation site can considerably improve evacuation efficiency.
- (3)
- The impact of emergency evacuation personnel and equipment on evacuation efficiency is modeled in this paper. The simulation is repeated twice more. The evacuation guide is set to 0, and the emergency lighting guidance system and emergency broadcasting system are set to 10, indicating that the site has emergency evacuation facilities but no evacuation guide; the evacuation guide is set to 10, and the emergency lighting guidance system and emergency broadcasting system are set to 0, indicating that there are no emergency evacuation facilities on site. The evacuation guide is set to 10, and the emergency lighting guidance system and emergency broadcasting system are set to 0, indicating no emergency evacuation facilities on site.
However, evacuation guidance personnel are arranged; the third time, the evacuation guidance personnel are set to 5, as are the emergency lighting guidance system and the emergency broadcast system, implying that, while the site has emergency evacuation facilities and evacuation guidance personnel, their respective strength is not as good as the previous two times. Figure 25 depicts the simulation findings.
The “evacuation guide” curve is always above the “facilities guide” and “evacuation facilities” curves, as shown in the diagram, and then the three curves eventually coincide. This is because the crowd fails to adapt to the site environment in the early stages of evacuation owing to panic and other factors. On the other hand, the evacuation guide can assist them in calming down their emotions depending on the situation. It means that the crowd can leave as quickly as possible. However, the emergency broadcast system and emergency lighting guidance system are not as adaptable, indicating that the evacuation guide staff can be set up earlier than the emergency evacuation. The application has the potential to take on a more significant role and improve evacuation efficiency.
5.7. Managerial Insight
The SEC is at a lower level when the panic state is low. Because the crowd is not eager to depart the event in a low-panic state [59], the populace in the system flows at a slower pace to the exit stairs for evacuation. Because the evacuation staff continually maintain a low evacuation speed during this procedure, the system’s evacuation capability remains low until the density reduces.
Although a decreased panic state can eliminate unneeded confusion and improve crowd order [60], reducing panic just for the sake of enhancing overall evacuation capabilities is not a good idea. On the other hand, a decreased panic state may result in a lower crowd evacuation speed for an extended period (such as maintaining regular strolling and stopping speeds) but an increase in overall evacuation duration and a drop in the evacuation effect. This is in line with the findings by [8,59,61,62]. As a result, in the actual emergency evacuation process, tactics such as “over-rendering” can be used to suitably boost the terror level of the crowd, allowing the system to evacuate at a faster rate and improving overall evacuation efficiency. Compared to other study scenarios, the analysis can suggest a complicated interaction relationship between large-scale crowd evacuation behaviors during a fire. The findings serve as a benchmark for a large-scale crowd evacuation behavior model in the same situation.
Simulations of evacuations sparked fresh ideas. The following are the paper’s primary findings:
- (1)
- The SD-based large-scale crowd evacuation model accurately reproduced group evacuation behaviors such as “exit congestion” and “fast or slow.” When compared to the simulation results of professional evacuation software Pathfinder and FDS+Evac, the deviation from Pathfinder’s simulation results was less than 7%. The deviation from FDS+Evac’s simulation results was 350 and 2000, i.e., less than 9%, under the initial conditions of 350/400/450/500/1000/2000/4000. The following were the data fitting curves: y = x; y = 0.9458x; R2 = 0.9997 and 0.9961. The SD model used in this work was faster, and the Pathfinder and FDS+Evac software did not use it. With the growth in the number of people, the computation time grew dramatically.
- (2)
- The influence of the “total initial number” on the evacuation ability was revealed through simulation analysis: the larger the total initial number, the lower the system’s evacuation ability, and the longer the evacuation period. This conclusion suggests that when investigating the evacuation of underground space groups, we should examine the total number of individuals entering the system before the evacuation behavior begins, rather than just optimizing the programs and procedures in the evacuation process. In order to maximize the system’s evacuation efficiency and ensure evacuation safety, we should also focus on controlling the size of the population entering the system, expanding the time dimension of evacuation firefighting work until the occurrence of evacuation behavior, and combining pre-existing prevention with in-process control.
- (3)
- The influence of the “panic state” on the system’s evacuation capabilities was revealed through simulation analysis. As a result, in an emergency evacuation, the trapped population’s level of terror should not be lessened arbitrarily. To boost overall evacuation efficiency, techniques such as radio propaganda, staff encouraging, and loud sirens could be used to generate certain panic atmospheres. However, at the same time, the use of panic to improve the group evacuation ability needs to be considered in combination with the crowd size. In the case of a large crowd size, it is still necessary to maintain a low level of panic.
- (4)
- Through the simulation analysis, we found the influence law of “emergency” on the evacuation ability of the system, that is, appropriately improving the influence degree of “emergency” will promote the evacuation efficiency and speed; if the impact of emergency is too small, it cannot cause enough attention of the evacuation crowd, and the lack of awareness of the danger degree of the scene makes the evacuation slow, which makes the evacuation effective. The evacuation rate was dramatically reduced, and the evacuation speed was dramatically extended. Therefore, in the evacuation process, we can use broadcast, personnel narrative, and other ways to report the current emergency situation to the on-site evacuation personnel to enhance the attention of the crowd and improve the overall evacuation efficiency.
- (5)
- We discovered that installing an emergency lighting guidance system, an emergency broadcast system, and arranging for evacuation guidance staff can significantly improve overall evacuation efficiency, with the effect becoming more substantial as the number of evacuees increases. In the early stages of evacuation, the effect of evacuation guiding staff is more significant than that of lighting guidance systems, emergency broadcast systems, and other facilities. As a result, during an emergency evacuation, we should pay special attention to the function of evacuation guide personnel and develop building staff fire education and behavior drills, which may considerably improve evacuation efficiency.
- (6)
- To study the evacuation behavior, we should quantify the panic degree of the crowd according to a different environment, crowd number, fire spread, and other factors and explore the most reasonable panic degree in the process of crowd evacuation so as to ensure that the panic state is maintained within a reasonable range in the process of crowd evacuation of an urban underground complex in the case of a fire emergency, and finally improve the efficiency of crowd evacuation.
6. Conclusions
Given the limited environmental characteristics of underground space evacuation and exit, a group evacuation model based on SD was developed, taking into account the simulation characteristics and simulation efficiency by taking into account the main group behavior characteristics of the evacuated people, which was a large-scale crowd of an urban underground complex. This model may give theoretical support and practical reference for the evacuation behavior of an urban underground complex in a fire emergency.
Although the study’s objectives were met, significant limitations remained. First, even though the created model simply modeled and assessed two critical parameters, “total initial number” and “panic state”, and individual aspects that were closely related to these two critical elements, it impacted group evacuation efficiency. Second, the model could only examine the average panic state of big groups, not the production and broad-scale dispersion of mass fear in a crowd. As a result, analyzing the interaction between different individuals in the crowd while under the influence of panic was impossible. Nonetheless, the findings of this study are noteworthy and contribute to the body of knowledge because they are the first to construct a group evacuation model based on SD principles by taking into account the primary group behavior features of evacuated persons.
Furthermore, the conclusions of this study can serve as a theoretical foundation for businesses looking to better the management of urban underground complex operations and increase the safety of evacuation technologies. Furthermore, the findings can be used by governments and businesses to develop evacuation safety laws and regulations for subway management, ultimately assisting them in achieving a better implementation of this strategy in the future. Other aspects, such as staff composition and fire products, were not accounted for in the SD model used in this study and will be considered in future research. In future investigations, the model should be improved regularly. Furthermore, in the future, an enhanced evolutionary game model should be developed so that an in-depth study of the panic state in a considerable population can be explored from a mesoscopic perspective.
Author Contributions
Conceptualization, X.L., W.C., C.W. and M.A.K.; methodology, X.L., W.C., C.W. and M.A.K.; validation, X.L., W.C., C.W. and M.A.K.; formal analysis, X.L., W.C., C.W. and M.A.K.; writing—original draft preparation, X.L., W.C., C.W. and M.A.K.; writing—review and editing X.L., C.W. and M.A.K.; visualization, X.L., W.C., C.W. and M.A.K.; supervision, C.W. and M.A.K.; project administration, C.W. and M.A.K. All authors have read and agreed to the published version of the manuscript.
Funding
MOE (Ministry of Education in China) Project of Humanities and Social Sciences (grant number 20YJC630068) and financial support from Fujian Provincial Department of Science and Technology through grant number 2021I0014, and Universiti Teknologi Malaysia (UTM) Research Grant Vot No: J130000.7113.05E79.
Institutional Review Board Statement
Not applicable.
Informed Consent Statement
Not applicable.
Data Availability Statement
The data sets of the current study and/or analyzed during the current study are available from the corresponding author on reasonable request.
Acknowledgments
The authors are grateful for the research grants awarded by the MOE (Ministry of Education in China) Project of Humanities and Social Sciences (grant number 20YJC630068) and financial support from Fujian Provincial Department of Science and Technology through grant number 2021I0014, and Universiti Teknologi Malaysia (UTM) Research Grant Vot No: J130000.7113.05E79.
Conflicts of Interest
The authors declare no conflict of interest.
References
- Lei, W.; Li, A.; Gao, R.; Hao, X.; Deng, B. Simulation of pedestrian crowds’ evacuation in a huge transit terminal subway station. Phys. A Stat. Mech. Its Appl. 2012, 391, 5355–5365. [Google Scholar] [CrossRef]
- Hosseini, O.; Maghrebi, M.; Maghrebi, M.F. Determining optimum staged-evacuation schedule considering total evacuation time, congestion severity and fire threats. Saf. Sci. 2021, 139, 105211. [Google Scholar] [CrossRef]
- Wagner, N.; Agrawal, V. An agent-based simulation system for concert venue crowd evacuation modeling in the presence of a fire disaster. Expert Syst. Appl. 2014, 41, 2807–2815. [Google Scholar] [CrossRef]
- Chen, X.; Kwan, M.P.; Li, Q.; Chen, J. A model for evacuation risk assessment with consideration of pre- and post-disaster factors. Comput. Environ. Urban Syst. 2012, 36, 207–217. [Google Scholar] [CrossRef]
- Perry, R.W.; Lindell, M.K. Preparedness for Emergency Response: Guidelines for the Emergency Planning Process. Disasters 2003, 27, 336–350. [Google Scholar] [CrossRef] [PubMed]
- Stepanov, A.; Smith, J.M.G. Multi-objective evacuation routing in transportation networks. Eur. J. Oper. Res. 2009, 198, 435–446. [Google Scholar] [CrossRef]
- Kovács, G.; Spens, K.M. Logistics Theory Building. Icfai J. Supply Chain. Manag. 2007, 4, 7–27. [Google Scholar]
- Gai, W.; Du, Y.; Deng, Y. Evacuation risk assessment of regional evacuation for major accidents and its application in emergency planning: A case study. Saf. Sci. 2018, 106, 203–218. [Google Scholar] [CrossRef]
- Canter, D. Fires and human behaviour: Emerging issues. Fire Saf. J. 1980, 3, 41–46. [Google Scholar] [CrossRef]
- Arce, S.G.; Jeanneret, C.; Gales, J.; Antonellis, D.; Vaiciulyte, S. Human behaviour in informal settlement fires in Costa Rica. Saf. Sci. 2021, 142, 105384. [Google Scholar] [CrossRef]
- Wang, C.M.; Xu, B.B.; Zhang, S.J.; Chen, Y.Q. Influence of personality and risk propensity on risk perception of Chinese construction project managers. Int. J. Proj. Manag. 2016, 34, 1294–1304. [Google Scholar] [CrossRef]
- Day, R.C.; Hulse, L.M.; Galea, E.R. Response Phase Behaviours and Response Time Predictors of the 9/11 World Trade Center Evacuation. Fire Technol. 2013, 49, 657–678. [Google Scholar] [CrossRef]
- Gershon, R.R.M.; Qureshi, K.A.; Rubin, M.S.; Raveis, V.H. Factors Associated with High-Rise Evacuation: Qualitative Results from the World Trade Center Evacuation Study. Prehosp. Disaster Med. 2007, 22, 165–173. [Google Scholar] [CrossRef] [PubMed]
- Kinateder, M.T.; Kuligowski, E.D.; Reneke, P.A.; Peacock, R.D. Risk perception in fire evacuation behavior revisited: Definitions, related concepts, and empirical evidence. Fire Sci. Rev. 2015, 4, 1. [Google Scholar] [CrossRef]
- Nilsson, D.; Johansson, A. Social influence during the initial phase of a fire evacuation—Analysis of evacuation experiments in a cinema theatre. Fire Saf. J. 2009, 44, 71–79. [Google Scholar] [CrossRef]
- Occhialini, M.; Bernardini, G.; Ferracuti, F.; Iarlori, S.; D’Orazio, M.; Longhi, S. Fire exit signs: The use of neurological activity analysis for quantitative evaluations on their perceptiveness in a virtual environment. Fire Saf. J. 2016, 82, 63–75. [Google Scholar] [CrossRef]
- Ran, H.; Sun, L.; Gao, X. Influences of intelligent evacuation guidance system on crowd evacuation in building fire. Autom. Constr. 2014, 41, 78–82. [Google Scholar] [CrossRef]
- Iftikhar, H.; Shah, P.; Luximon, Y. Human wayfinding behaviour and metrics in complex environments: A systematic literature review. Archit. Sci. Rev. 2020, 64, 452–463. [Google Scholar] [CrossRef]
- Fu, L.; Cao, S.; Song, W.; Fang, J. The influence of emergency signage on building evacuation behavior: An experimental study. Fire Mater. 2019, 43, 22–33. [Google Scholar] [CrossRef]
- Akizuki: Setting Conditions of Signs in Escape Routes. Available online: https://scholar.google.com/scholar?cluster=6497336819932525909&hl=en&as_sdt=2005&sciodt=2007 (accessed on 18 November 2021).
- Arthur, P.; Passini, R. Wayfinding: People, Signs, and Architecture; National Academy of Sciences: Washington, DC, USA, 1992; p. 238. [Google Scholar]
- O’neill, M.J. Effects of Signage and Floor Plan Configuration on Wayfinding Accuracy. Environ. Behav. 1991, 23, 553–574. [Google Scholar] [CrossRef]
- Cisek, M.; Kapalka, M. Evacuation Route Assessment Model for Optimization of Evacuation in Buildings with Active Dynamic Signage System. Transp. Res. Procedia. 2014, 2, 541–549. [Google Scholar] [CrossRef]
- Galea, E.R.; Xie, H.; Deere, S.; Cooney, D.; Filippidis, L. An international survey and full-scale evacuation trial demonstrating the effectiveness of the active dynamic signage system concept. Fire Mater. 2017, 41, 493–513. [Google Scholar] [CrossRef]
- Xie, H.; Filippidis, L.; Galea, E.R.; Blackshields, D.; Lawrence, P.J. Experimental analysis of the effectiveness of emergency signage and its implementation in evacuation simulation. Fire Mater. 2012, 36, 367–382. [Google Scholar] [CrossRef]
- Gao, J.P.; Xu, Z.S.; Liu, D.L.; Cao, H.H. Application of the model based on fuzzy consistent matrix and AHP in the assessment of fire risk of subway tunnel. Procedia Eng. 2014, 71, 591–596. [Google Scholar] [CrossRef]
- Alvarez, P.; Alonso, V. Using microsimulation software to model large-scale evacuation scenarios. The case of Sangüesa and the Yesa dam collapse. Saf. Sci. 2018, 106, 10–27. [Google Scholar] [CrossRef]
- Shende, A.; Singh, M.P.; Kachroo, P. Optimization-based feedback control for pedestrian evacuation from an exit corridor. IEEE Trans. Intell. Transp. Syst. 2011, 12, 1167–1176. [Google Scholar] [CrossRef]
- Wang, J.H.; Lo, S.M.; Sun, J.H.; Wang, Q.S.; Mu, H.L. Qualitative simulation of the panic spread in large-scale evacuation. Simulation 2012, 88, 1465–1474. [Google Scholar] [CrossRef]
- Xie, J.J.; Xue, Y. Study on the dynamics of indoor pedestrian evacuation based on the game. In Proceedings of the 2011 Seventh International Conference on Natural Computation, Shanghai, China, 26–28 July 2011; Volume 4, pp. 2283–2287. [Google Scholar] [CrossRef]
- Lo, S.M.; Huang, H.C.; Wang, P.; Yuen, K.K. A game theory based exit selection model for evacuation. Fire Saf. J. 2006, 41, 364–369. [Google Scholar] [CrossRef]
- Henein, C.M.; White, T. Macroscopic effects of microscopic forces between agents in crowd models. Phys. A Stat. Mech. Its Appl. 2007, 373, 694–712. [Google Scholar] [CrossRef]
- Jehn, K.A.; Mannix, E.A. The Dynamic Nature of Conflict: A Longitudinal Study of Intragroup Conflict and Group Performance. Acad. Manag. J. 2001, 44, 238–251. [Google Scholar] [CrossRef]
- Wang, J. Research on the Uncertainties of Large-scale Crowd Evacuation under Unconventional Emergencies. Ph.D. Thesis, City University of Hong Kong, Hong Kong, China, 2013. [Google Scholar]
- Chen, Y.; Wang, C.; Yap, J.B.H.; Li, H.; Zhang, S. Emergency evacuation simulation at starting connection of cross-sea bridge: Case study on Haicang Avenue Subway Station in Xiamen Rail Transit Line. J. Build. Eng. 2020, 29, 101163. [Google Scholar] [CrossRef]
- Yin, X.; Martineau, C.; Demers, I.; Basiliko, N.; Fenton, N.J. The potential environmental risks associated with the development of rare earth element production in Canada. Environ. Rev. 2021, 29, 354–377. [Google Scholar] [CrossRef]
- Myrovali, G.; Tsaples, G.; Morfoulaki, M.; Aifadopoulou, G.; Papathanasiou, J. An Interactive Learning Environment Based on System Dynamics Methodology for Sustainable Mobility Challenges Communication & Citizens’ Engagement. In Lecture Notes in Business Information Processing; Springer: Berlin, Germany, 2018; Volume 313, pp. 88–99. [Google Scholar] [CrossRef]
- Forrester, J.W. Industrial Dynamics. A major breakthrough for decision makers. Harv. Bus. Rev. 1985, 36, 37–66. [Google Scholar]
- Yan, W.; Wang, J.; Xu, H. System dynamic analysis of the traffic system in Nanjing subway system based on measured data. J. Saf. Environ. 2017, 17, 630–635. [Google Scholar]
- Yan, W.; Wang, J.; Jiang, J. Subway fire cause analysis model based on system dynamics: A preliminary model framework. Procedia Eng. 2016, 135, 431–438. [Google Scholar] [CrossRef]
- Limin, W.Y.C.; Daming, S. Discussion on Vertical Greening of Buildings. Urban Ecol. 2009, 22, 16–23. Available online: https://xueshu.baidu.com/usercenter/paper/show?paperid=563c02e339ffbcb8e12419bd177b102a&site=xueshu_se (accessed on 14 June 2021).
- Voyer, J.; Dean, M.D.; Pickles, C.B. Hospital evacuation in disasters: Uncovering the systemic leverage using system dynamics. Int. J. Emerg. Manag. 2016, 12, 152–167. [Google Scholar] [CrossRef]
- Cimellaro, G.P.; Ozzello, F.; Vallero, A.; Mahin, S.; Shao, B. Simulating earthquake evacuation using human behavior models. Earthq. Eng. Struct. Dyn. 2017, 46, 985–1002. [Google Scholar] [CrossRef]
- Yang, L.Z.; Zhao, D.L.; Li, J.; Fang, T.Y. Simulation of the kin behavior in building occupant evacuation based on Cellular Automaton. Build. Environ. 2005, 40, 411–415. [Google Scholar] [CrossRef]
- Yi, M.; Yuen, R.K.K.; Lee, E.W.M. Transition from positive to negative on the leadership effect of the biological particles group. EPL Europhys. Lett. 2016, 114, 18003. [Google Scholar] [CrossRef]
- Silvius, A.J.G.; Schipper, R.; Durdyev, S.; Hosseini, M.R.; Chileshe, M.S.-G.N.; Solomon, N.; Babatunde, O.; Perera, S.; Zhou, L.; Udeaja, C.; et al. Engineering, Construction and Architectural Management Barriers to public private partnership projects in developing countries: A case of Nigeria. Eng. Constr. Archit. Manag. 2015, 22, 669–691. [Google Scholar] [CrossRef]
- Liu, H. The Impact of Owner Practices and Procedures on Construction Project Safety Performance. Ph.D. Thesis, University of Kentucky, Lexington, KY, USA, 2017. [Google Scholar]
- Helbing, D.; Buzna, L.; Johansson, A.; Werner, T. Self-organized pedestrian crowd dynamics: Experiments, simulations, and design solutions. Transp. Sci. 2005, 39, 1–146. [Google Scholar] [CrossRef]
- Helbing, D.; Farkas, I.; Vicsek, T. Simulating dynamical features of escape panic. Nature 2000, 407, 487–490. [Google Scholar] [CrossRef] [PubMed]
- Haghani, M.; Sarvi, M. Human exit choice in crowded built environments: Investigating underlying behavioural differences between normal egress and emergency evacuations. Fire Saf. J. 2016, 85, 1–9. [Google Scholar] [CrossRef]
- Ransikarbum, K.; Kim, N.; Ha, S.; Wysk, A.R.; Rothrock, L. A highway driving system design viewpoint using an agent-based modeling of an affordancebased finite state automata. IEEE Access 2017, 6, 2193–2205. [Google Scholar] [CrossRef]
- Chanthakhot, W.; Ransikarbum, K. Integrated IEW-TOPSIS and Fire Dynamics Simulation for Agent-Based Evacuation Modeling in Industrial Safety. Safety 2021, 7, 47. [Google Scholar] [CrossRef]
- Wattanasaeng, N.; Ransikarbum, K. Model and Analysis of Economic-and Risk- Based Objective Optimization Problem for Plant Location within Industrial Estates Using Epsilon-Constraint Algorithms. Computation 2021, 9, 46. [Google Scholar] [CrossRef]
- Zhang, B.; Xu, Z.S.; Zhao, Q.W.; Liu, Y.Y. A Study on Theoretical Calculation Method of Subway Safety Evacuation. Procedia Eng. 2014, 71, 597–604. [Google Scholar] [CrossRef]
- Ronchi, E.; Uriz, F.N.; Criel, X.; Reilly, P. Modelling large-scale evacuation of music festivals. Case Stud. Fire Saf. 2016, 5, 11–19. [Google Scholar] [CrossRef]
- Li, N.; Fang, D.; Sun, Y. Cognitive Psychological Approach for Risk Assessment in Construction Projects. J. Manag. Eng. 2016, 32, 1–12. [Google Scholar] [CrossRef]
- Mcgrattan, K.; Klein, B.; Hostikka, S.; Floyd, J. Fire Dynamics Simulator (Version 5): User’s Guide; National Institute of Standards and Technology: Gaithersburg, MD, USA, 2007. [Google Scholar] [CrossRef]
- Wei, P.; Liangfa, S. Managing Transportation Megaproject Schedule Risks Using Structural Equation Modelling: A Case Study of Shanghai Hongqiao Integrated Transport Hub in China. MATEC Web Conf. 2016, 81, 03005. [Google Scholar] [CrossRef]
- Koo, J.; Kim, B.I.; Kim, Y.S. Estimating the effects of mental disorientation and physical fatigue in a semi-panic evacuation. Expert Syst. Appl. 2014, 41, 2379–2390. [Google Scholar] [CrossRef]
- Lin, J.; Lucas, T.A. A particle swarm optimization model of emergency airplane evacuations with emotion. Netw. Heterog. Media 2015, 10, 631. [Google Scholar] [CrossRef]
- Shi, D.M.; Wang, B.H. Evacuation of pedestrians from a single room by using snowdrift game theories. Phys. Rev. E 2013, 87, 022802. [Google Scholar] [CrossRef]
- Fu, Y.W.; Liang, J.H.; Liu, Q.P.; Hu, X.Q. Crowd Simulation for Evacuation Behaviors Based on Multi-agent System and Cellular Automaton. In Proceedings of the 2014 International Conference on Virtual Reality and Visualization, Shenyang, China, 30–31 August 2014; pp. 103–109. [Google Scholar] [CrossRef]
Figure 1.
Method flow chart.

Figure 2.
Fishbone diagram of large-scale crowd evacuation accident.

Figure 3.
Main modeling and analysis steps of system dynamics.

Figure 4.
Emergency exit and evacuation stairwell in an urban underground complex. (Photo source: taken at the experimental site).
Figure 4.
Emergency exit and evacuation stairwell in an urban underground complex. (Photo source: taken at the experimental site).


Figure 5.
Simulation of different exit distributions. (a) Exit in the same direction. (b) Adjacent distribution of exit. (c) Exit distribution.
Figure 5.
Simulation of different exit distributions. (a) Exit in the same direction. (b) Adjacent distribution of exit. (c) Exit distribution.

Figure 6.
Model evacuation behavior setting.

Figure 7.
Example of causality. (a) Cause and effect relationship of air-conditioner principle. (b) Positive feedback. (c) Negative feedback.
Figure 7.
Example of causality. (a) Cause and effect relationship of air-conditioner principle. (b) Positive feedback. (c) Negative feedback.

Figure 8.
Causality diagram of mass crowd evacuation behavior in an urban underground complex.

Figure 9.
Mass crowd evacuation behavior stock–flow diagram of an urban underground complex.

Figure 10.
Classmates waiting for the evacuation experiment at the venue. (Photo source: taken at the experimental site).
Figure 10.
Classmates waiting for the evacuation experiment at the venue. (Photo source: taken at the experimental site).

Figure 11.
Comparison of two evacuation experiments. (a) Classmates lined up in an orderly manner. (b) Disorderly free evacuation. (Photo source: taken at the experimental site).
Figure 11.
Comparison of two evacuation experiments. (a) Classmates lined up in an orderly manner. (b) Disorderly free evacuation. (Photo source: taken at the experimental site).

Figure 12.
Simulation results based on different numbers of evacuation guides.

Figure 13.
Simulation results of the system dynamics model.

Figure 14.
Phenomenon of “fast is slow”.

Figure 15.
Pathfinder simulation software.

Figure 16.
FDS+Evac simulation software.

Figure 17.
Simulation result fitting.

Figure 18.
Illustration of the simulated area.

Figure 19.
Comparison of evacuation capability of systems with different initial numbers in the initial evacuation stage. (a) Before the ECX reaches the extreme value; (b) After the ECX reaches the extreme value.
Figure 19.
Comparison of evacuation capability of systems with different initial numbers in the initial evacuation stage. (a) Before the ECX reaches the extreme value; (b) After the ECX reaches the extreme value.

Figure 20.
Comparison of evacuation end times of different initial numbers.

Figure 21.
Comparison of system evacuation capability under different panic states.

Figure 22.
Comparison of system evacuation capacity at different population sizes. It can be seen from figure (a) that when the number of people is small, the relationship between the number of evacuees and the evacuation time is essentially linear relationship, but if the total number of evacuees reaches a certain limit, the panic loses its role in promoting the evacuation ability. The reason for this phenomenon is that when the people to be evacuated exceed a certain limit, the management difficulty increases. Panic not only makes the people increase their walking speed but also makes the people more likely to lose order and, finally, makes the positive effect of panic disappear and the negative effect increase. Properly reducing the panic of the group, as shown in (b), will improve the evacuation capacity of the group and shorten the evacuation time.

Figure 23.
Comparison of system evacuation ability under different emergencies.

Figure 24.
Comparison of system evacuation capability in different field environments.

Figure 25.
Comparison of evacuation facilities and evacuation guide personnel.


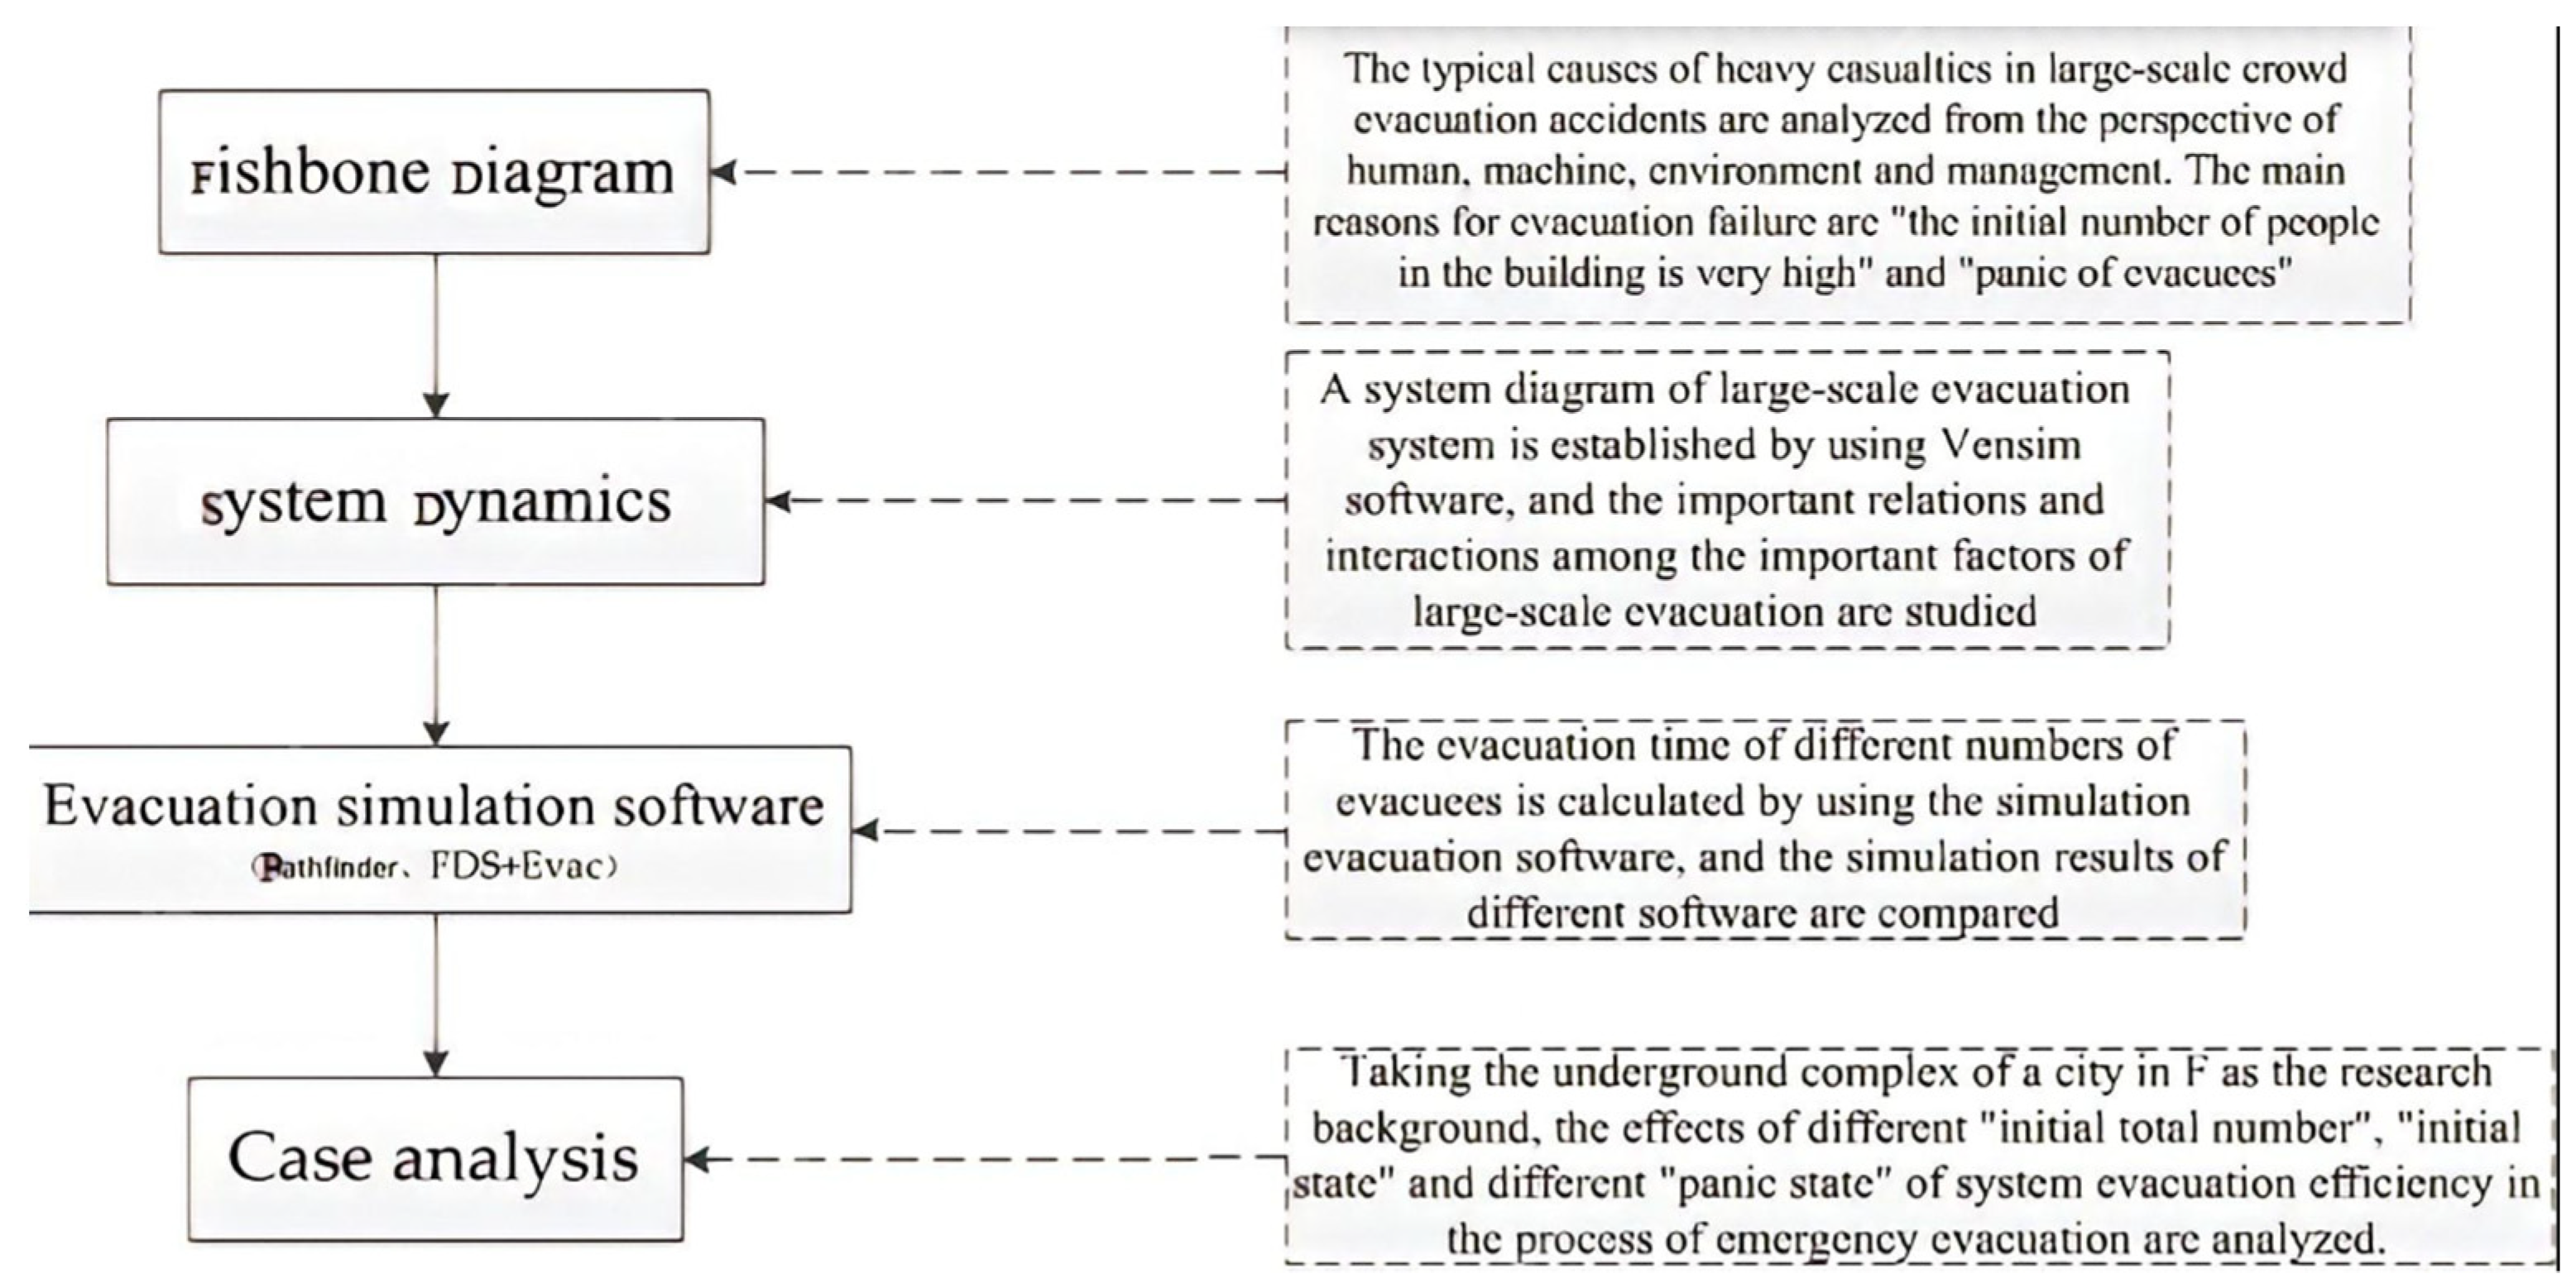
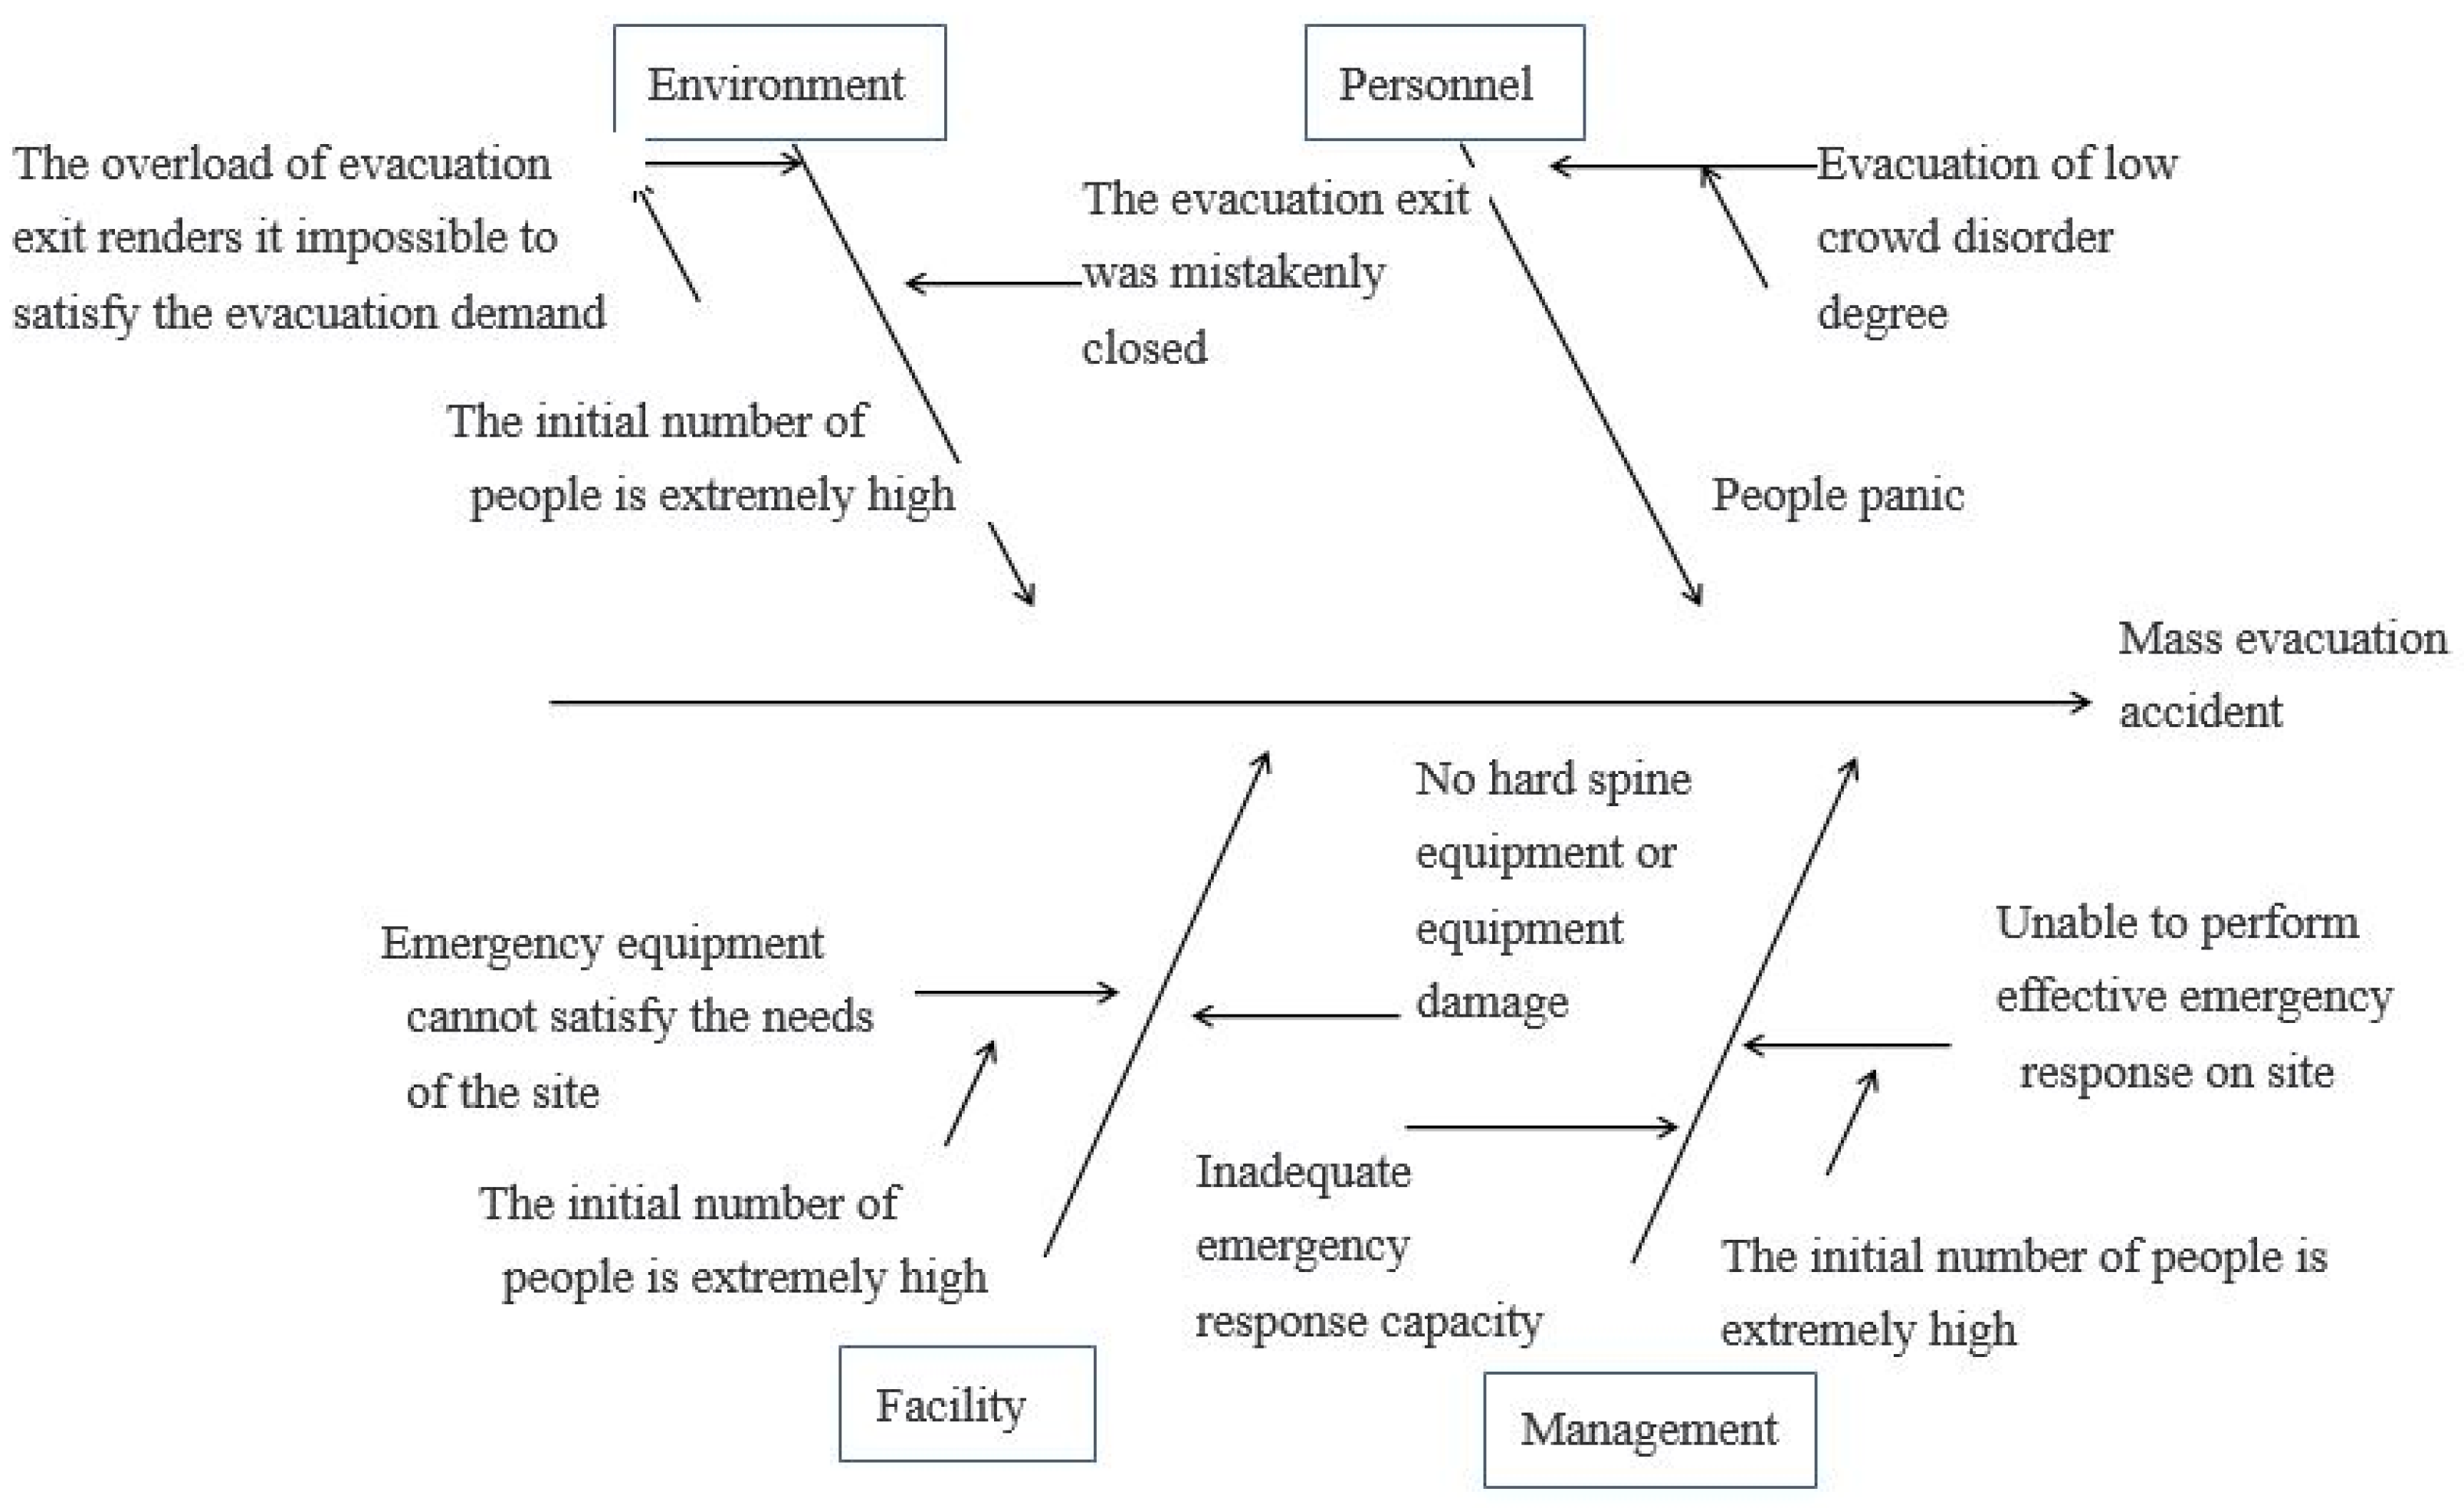
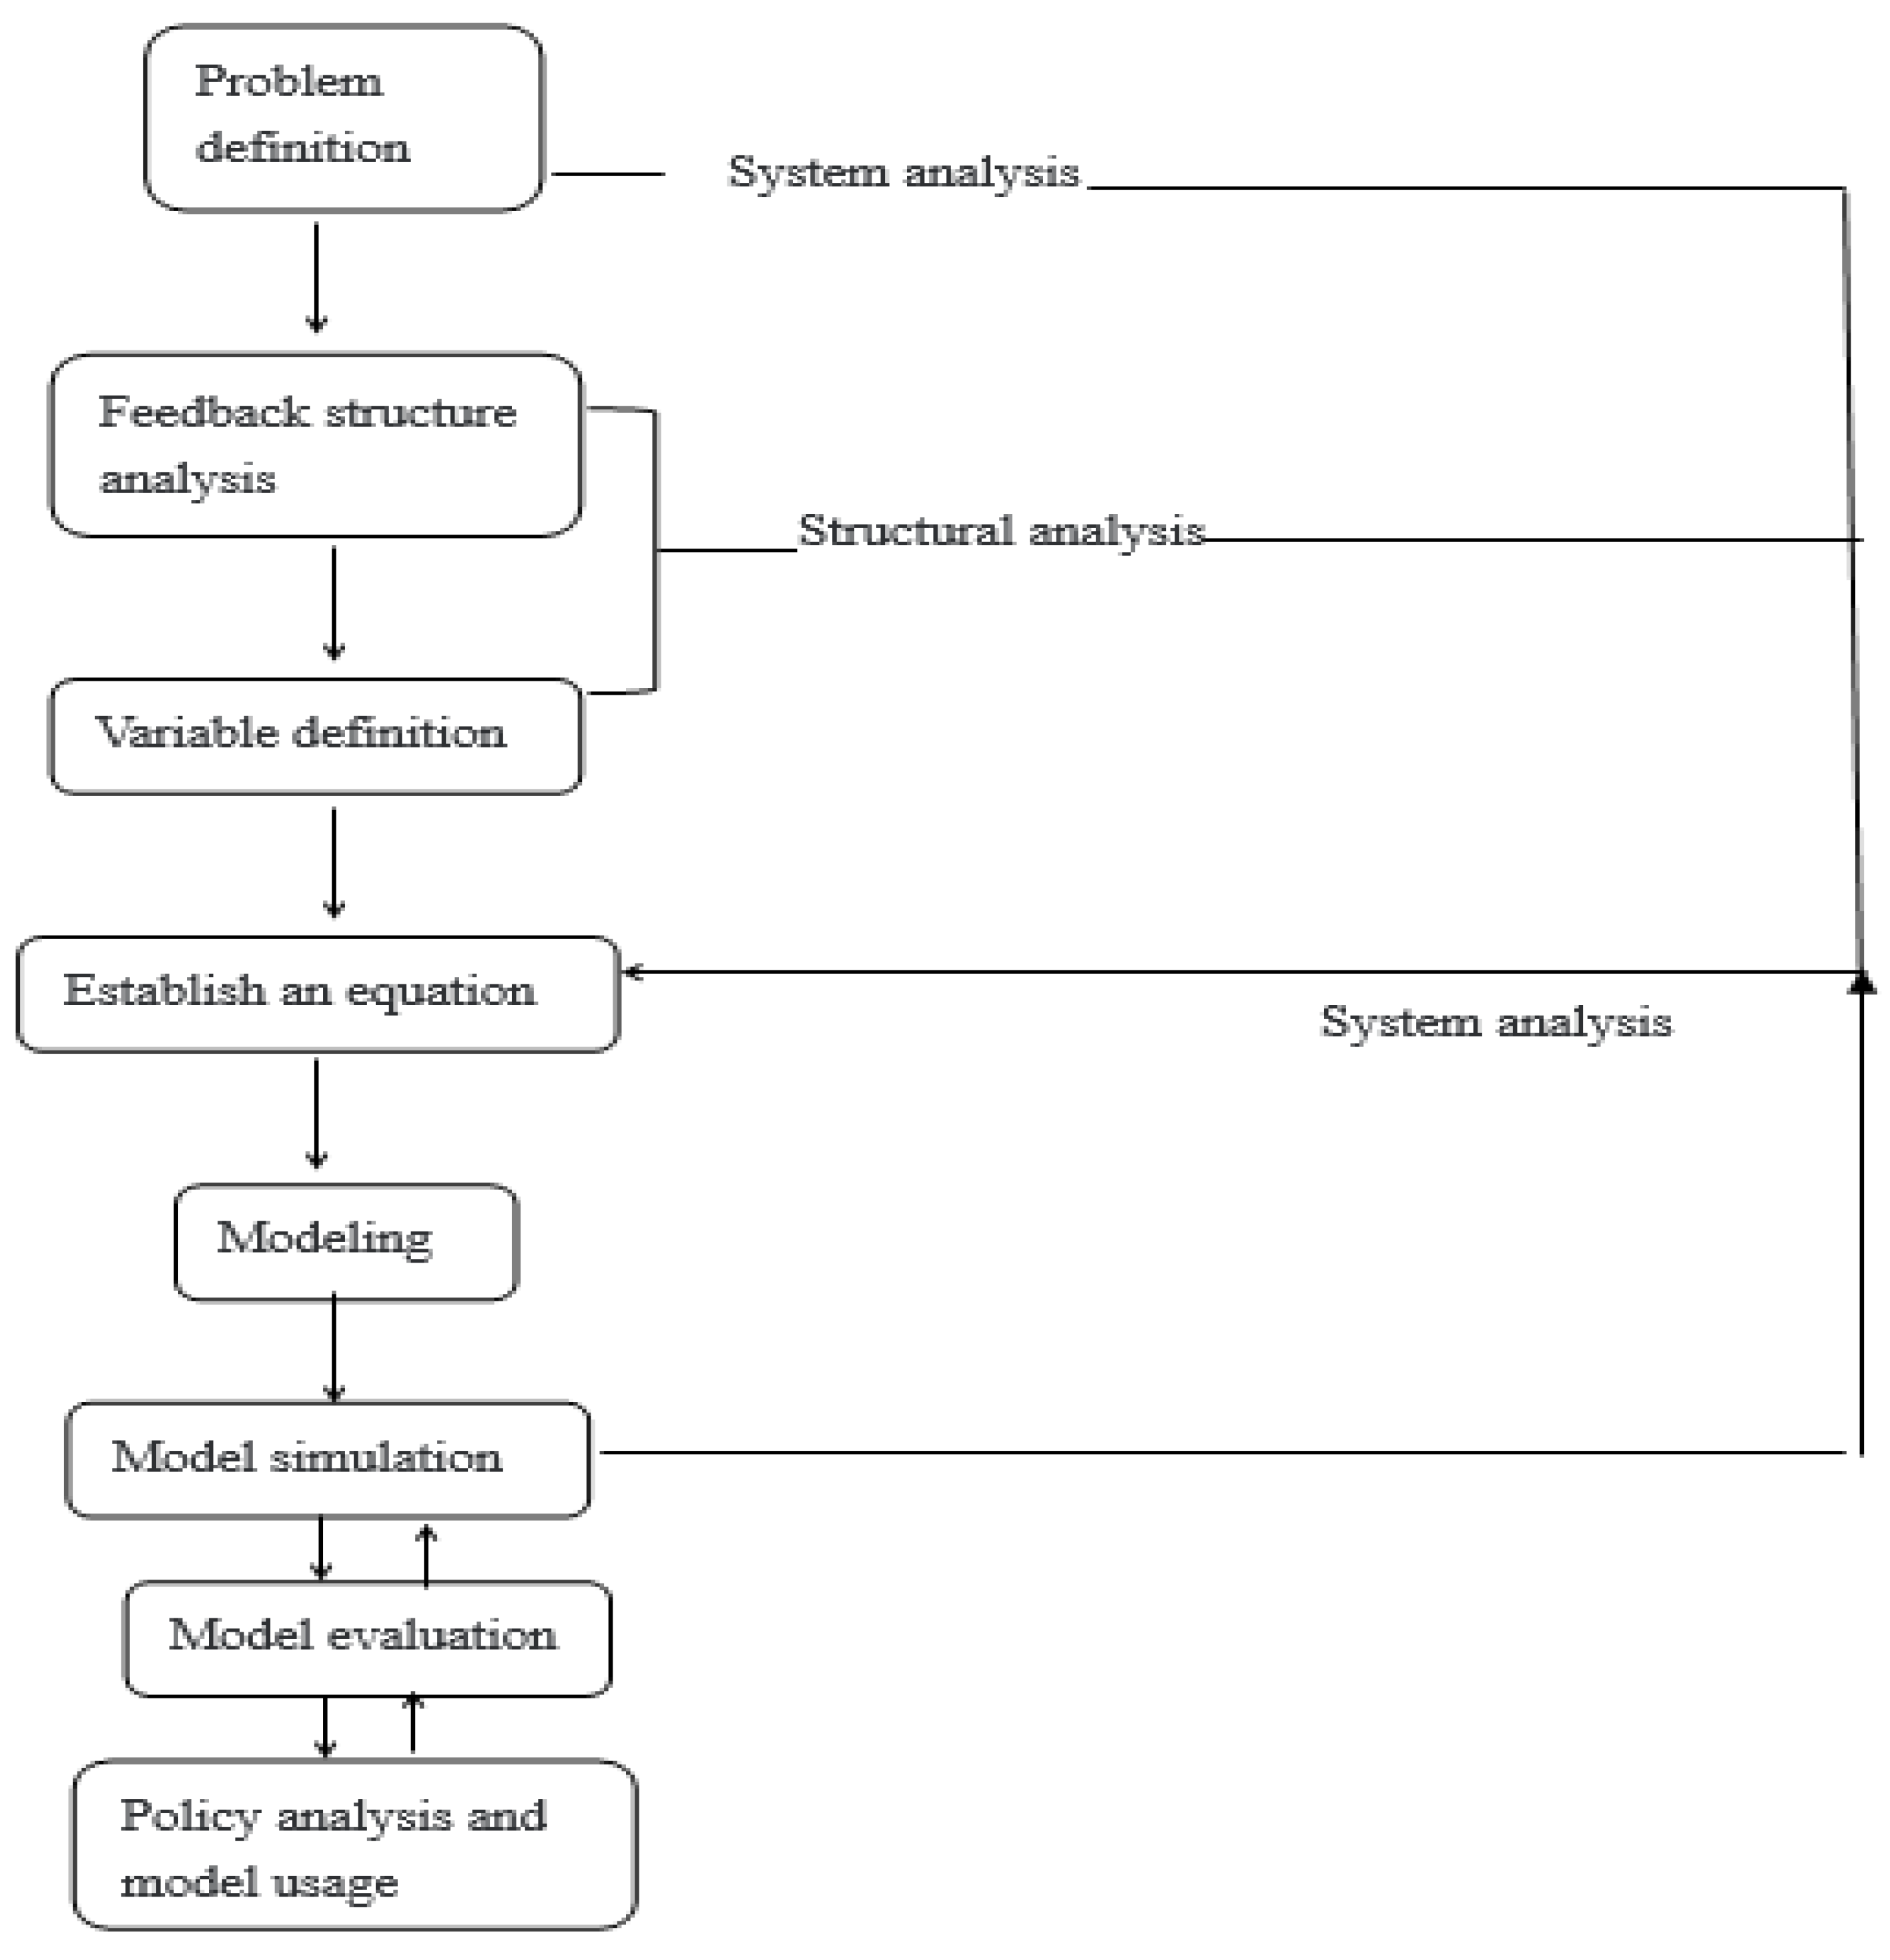
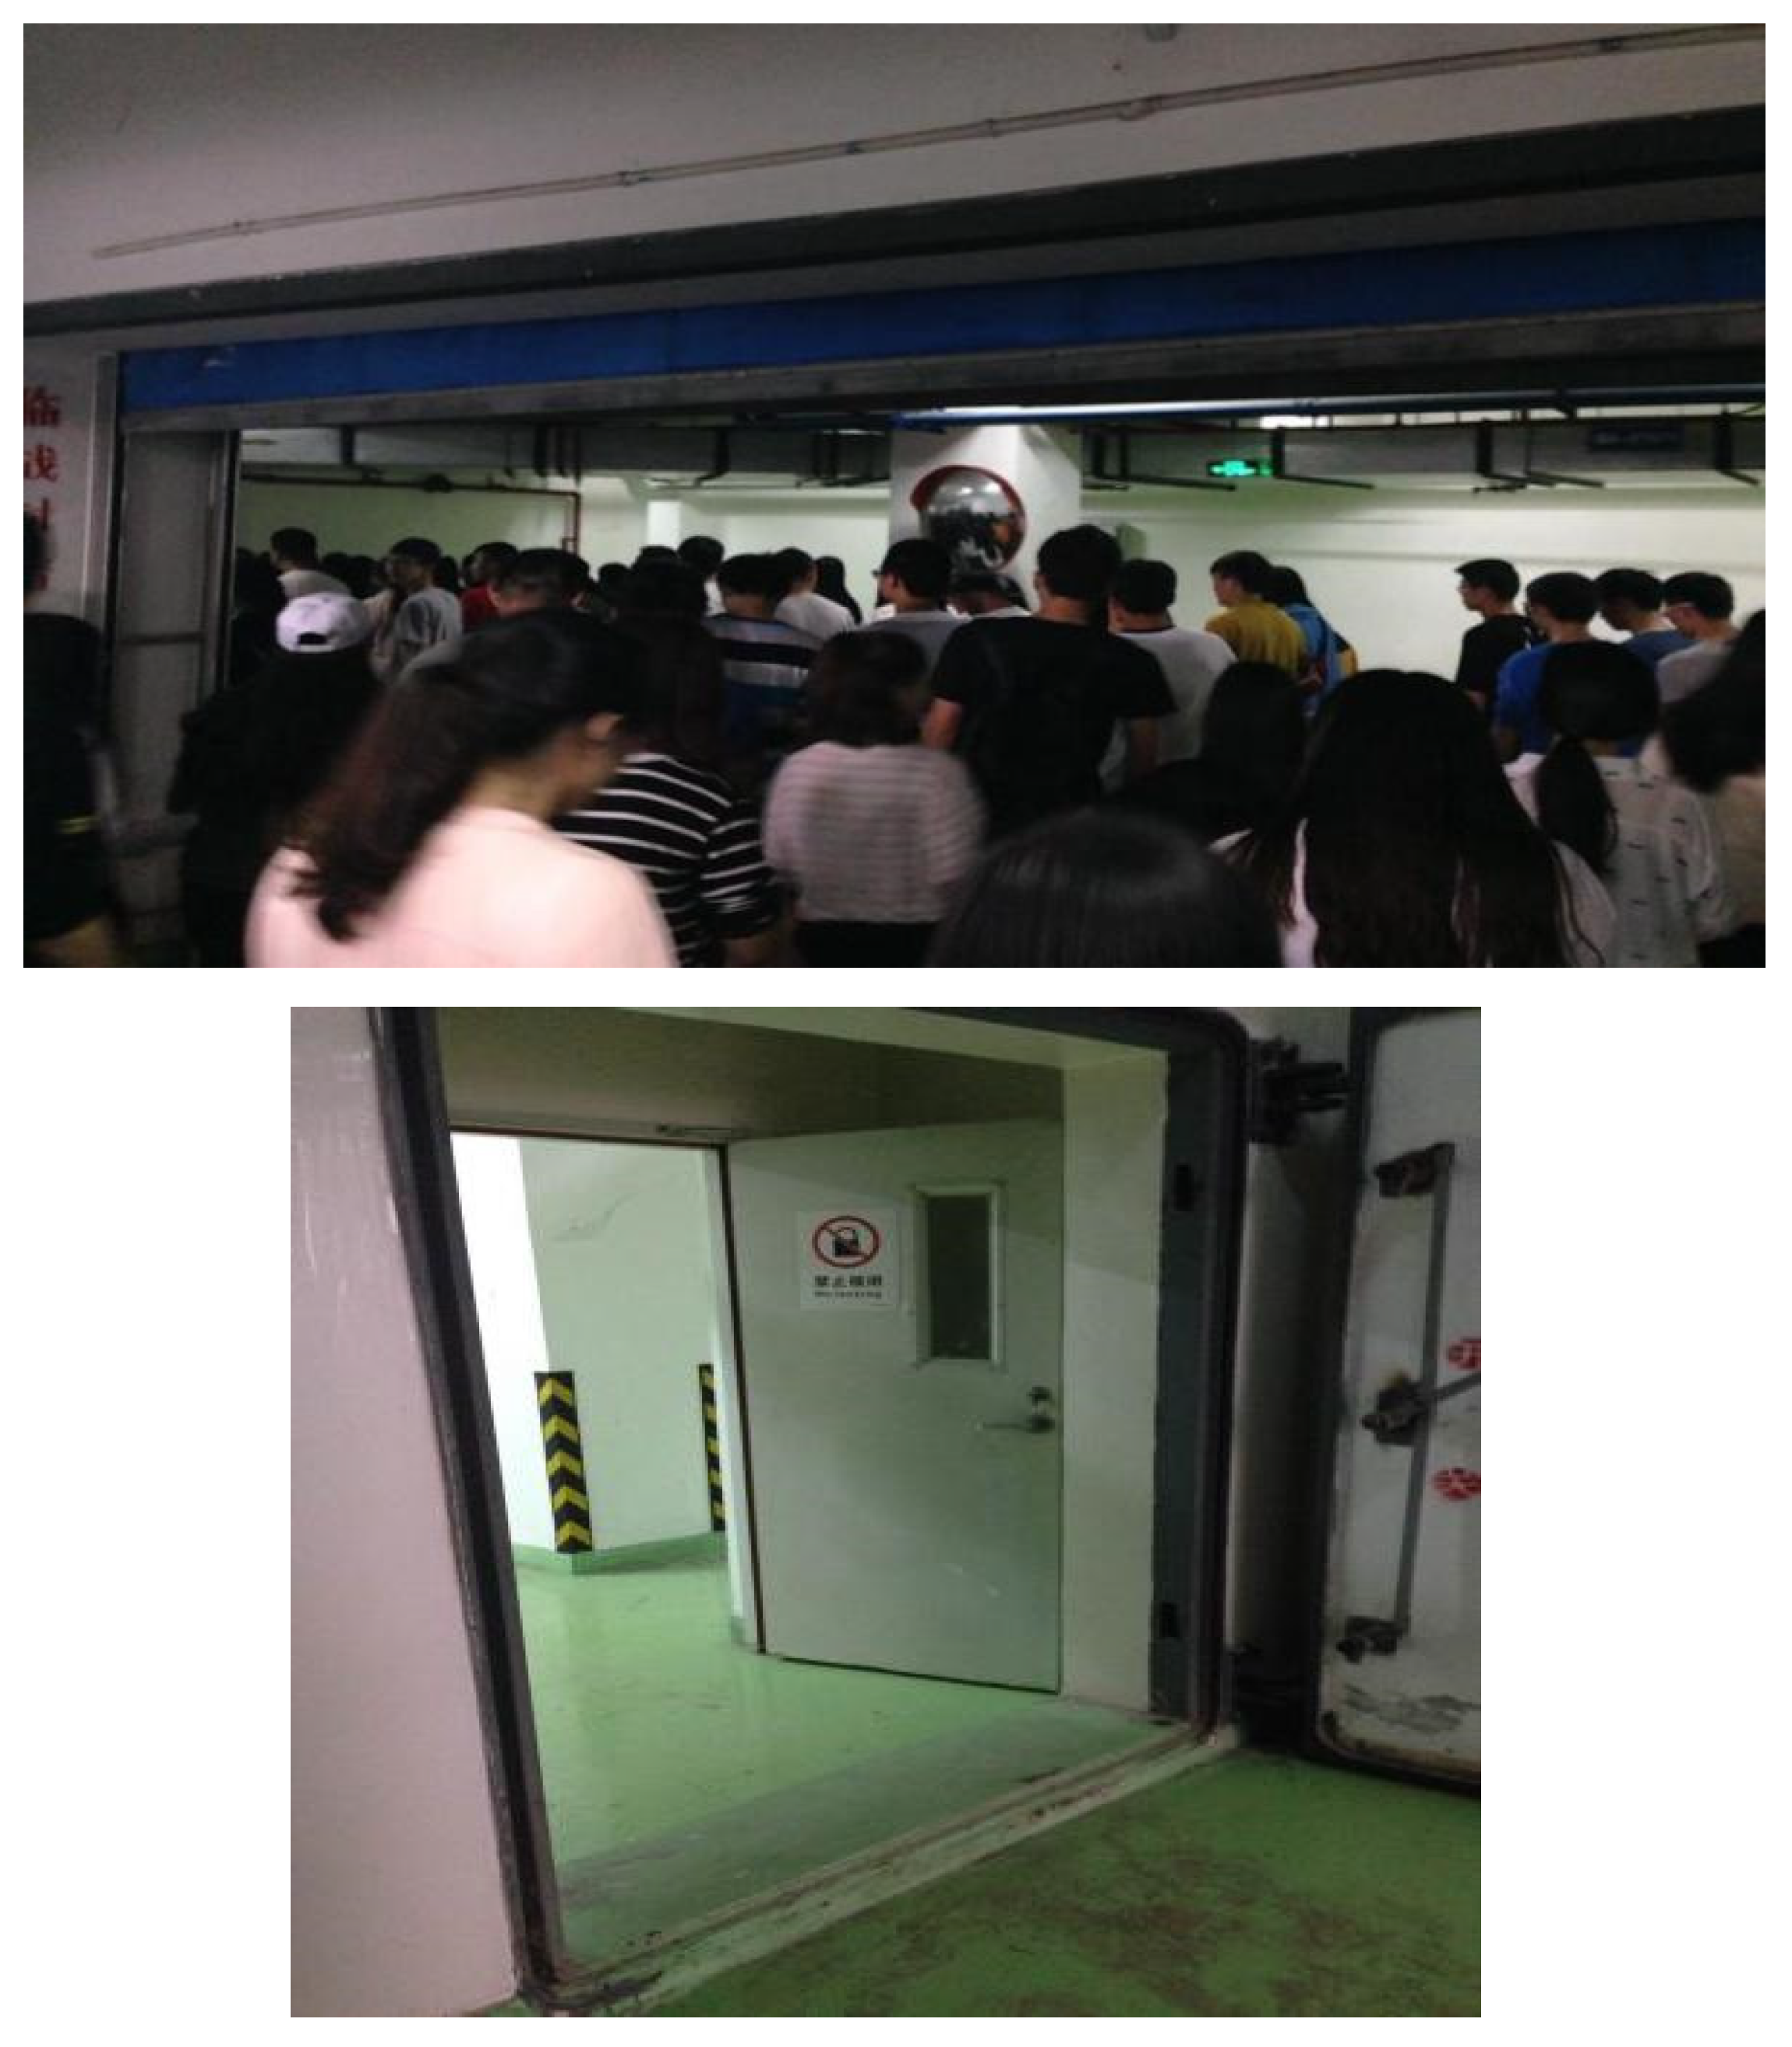
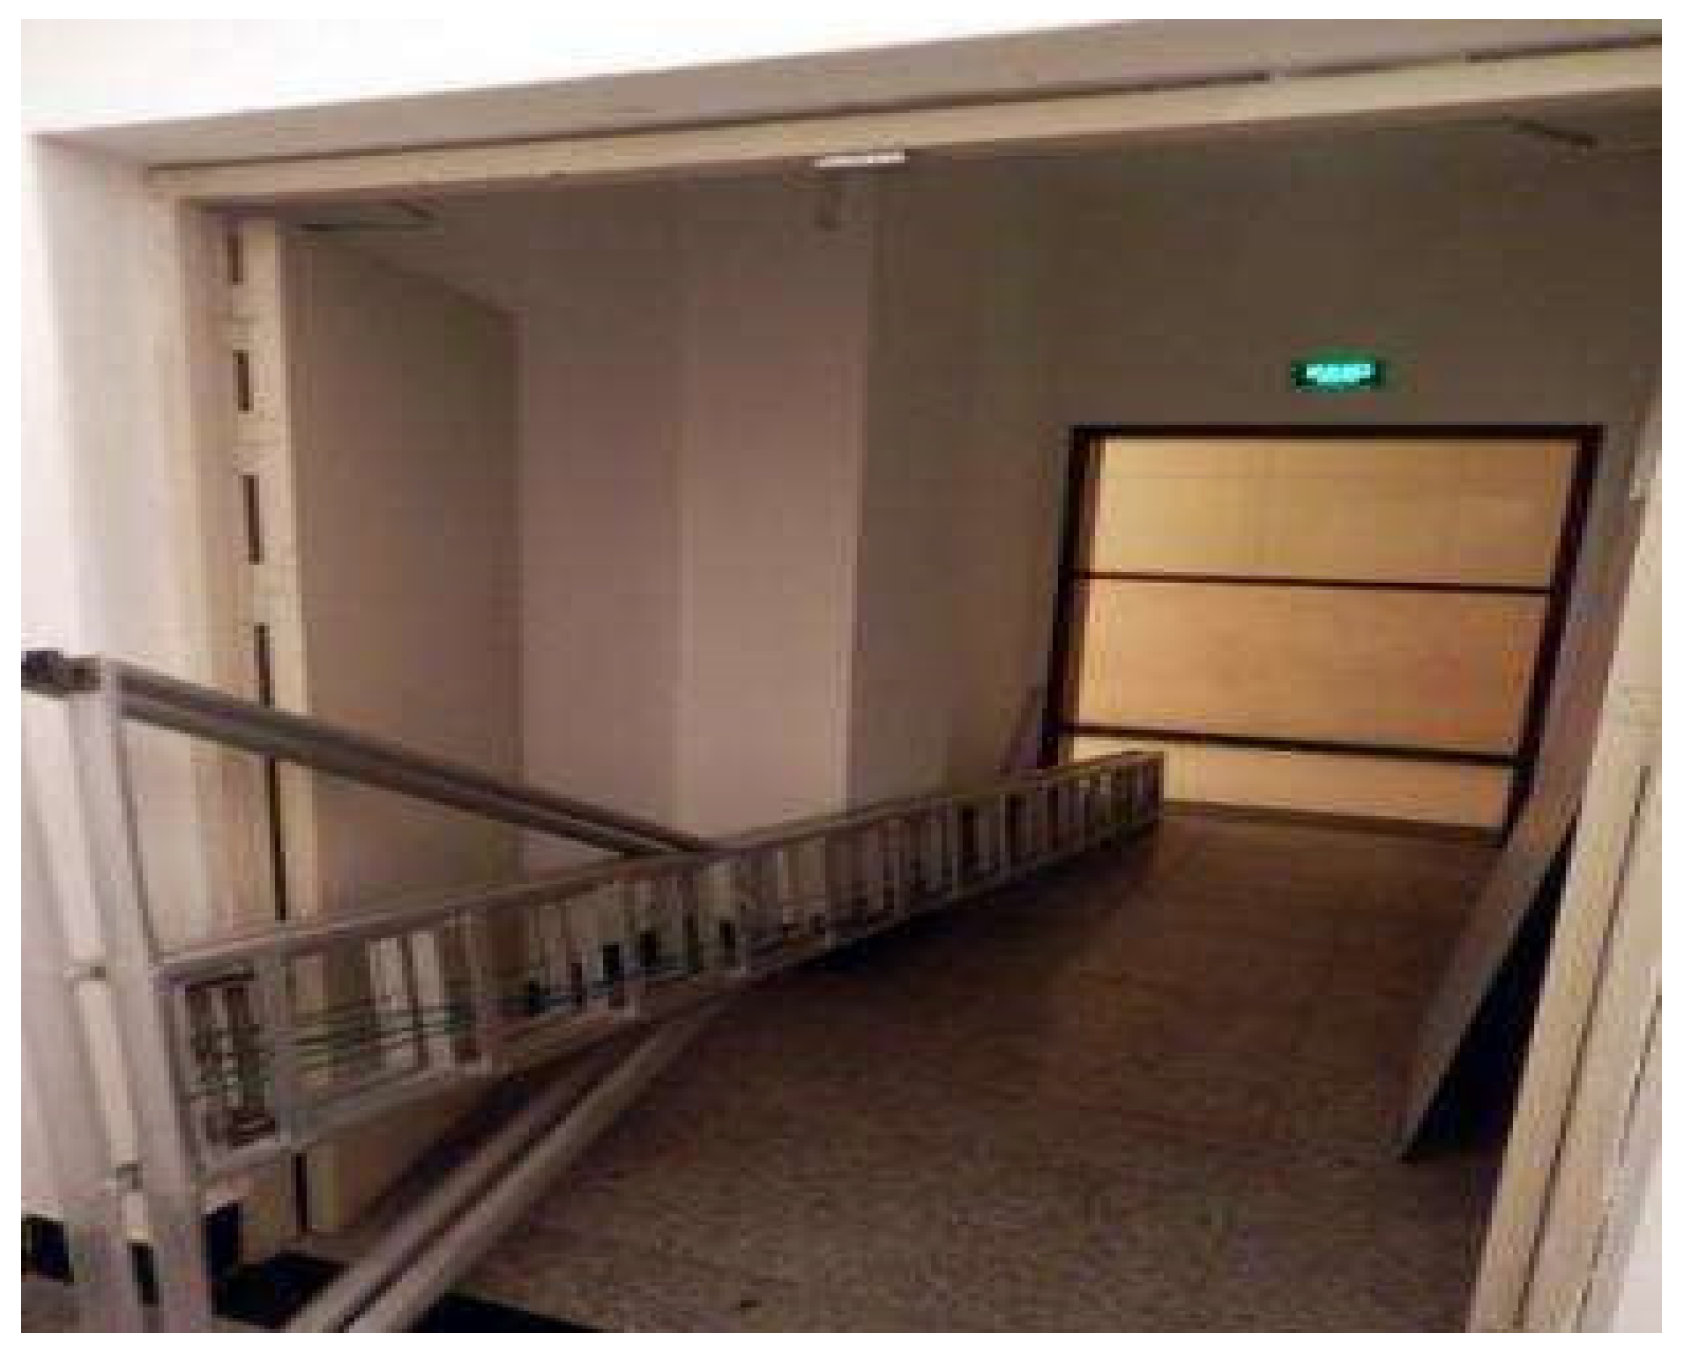
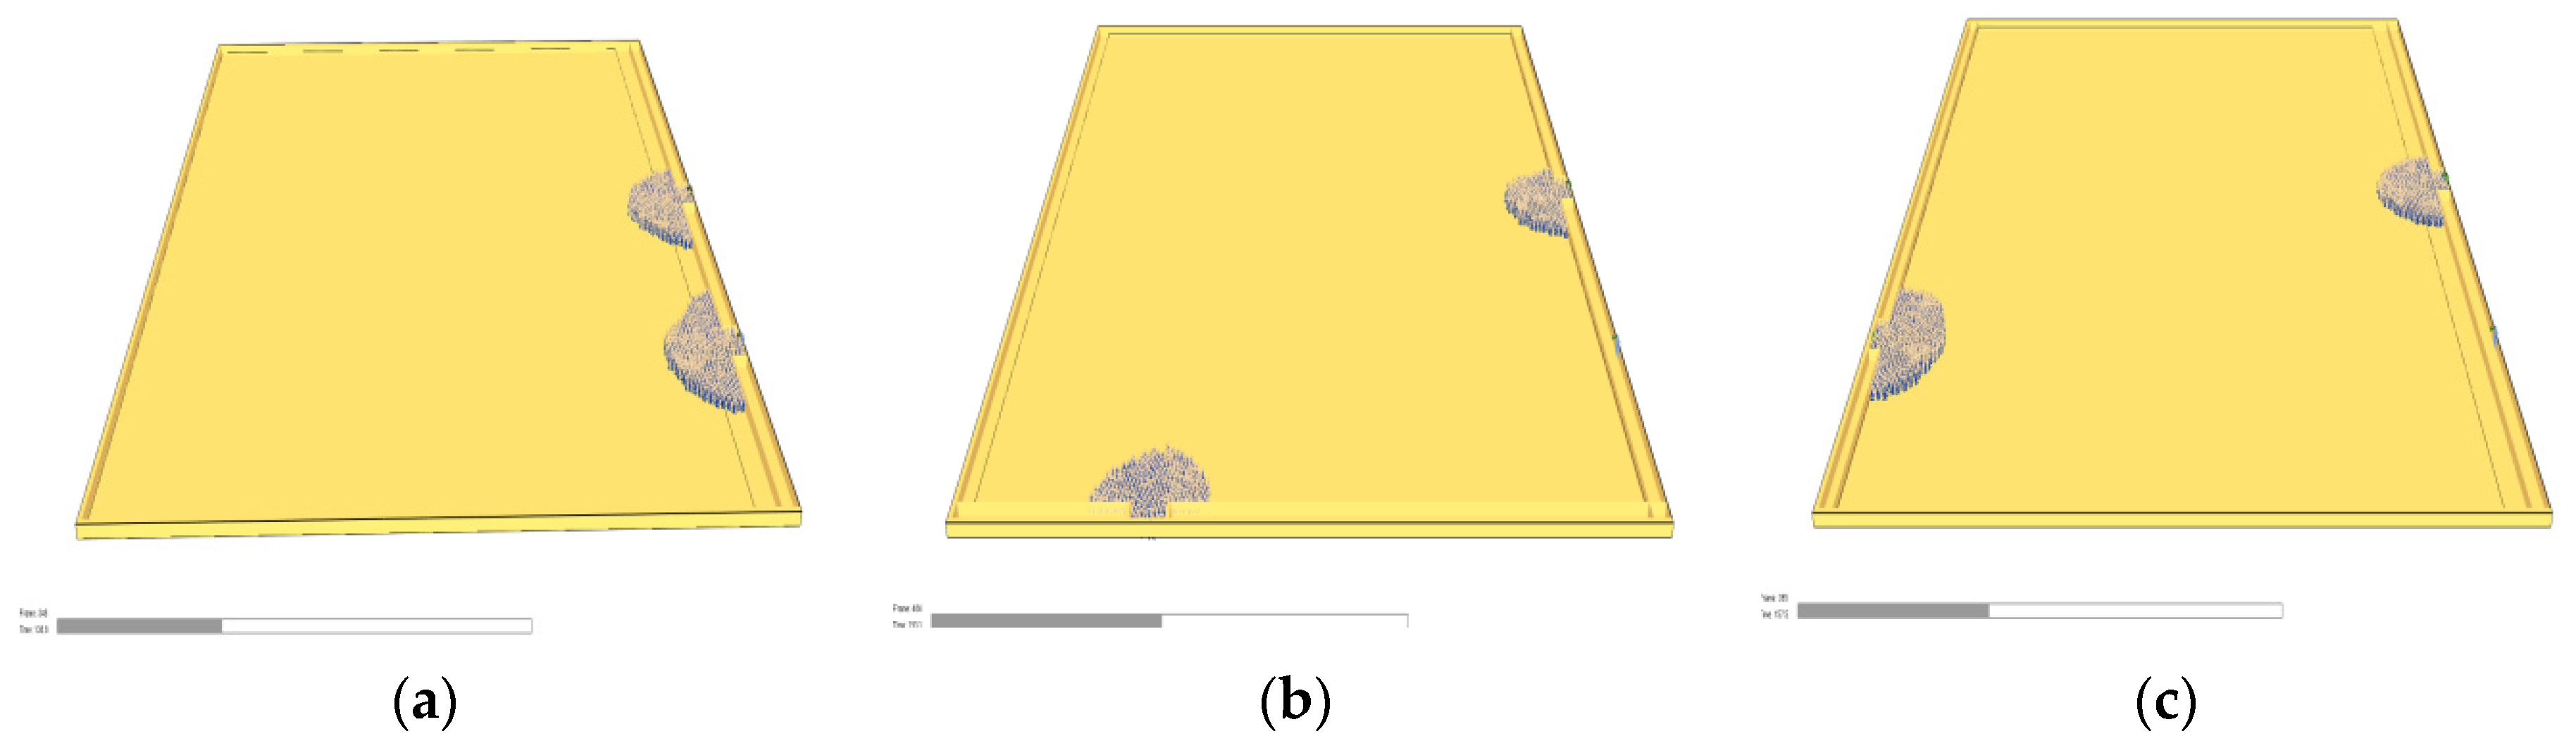
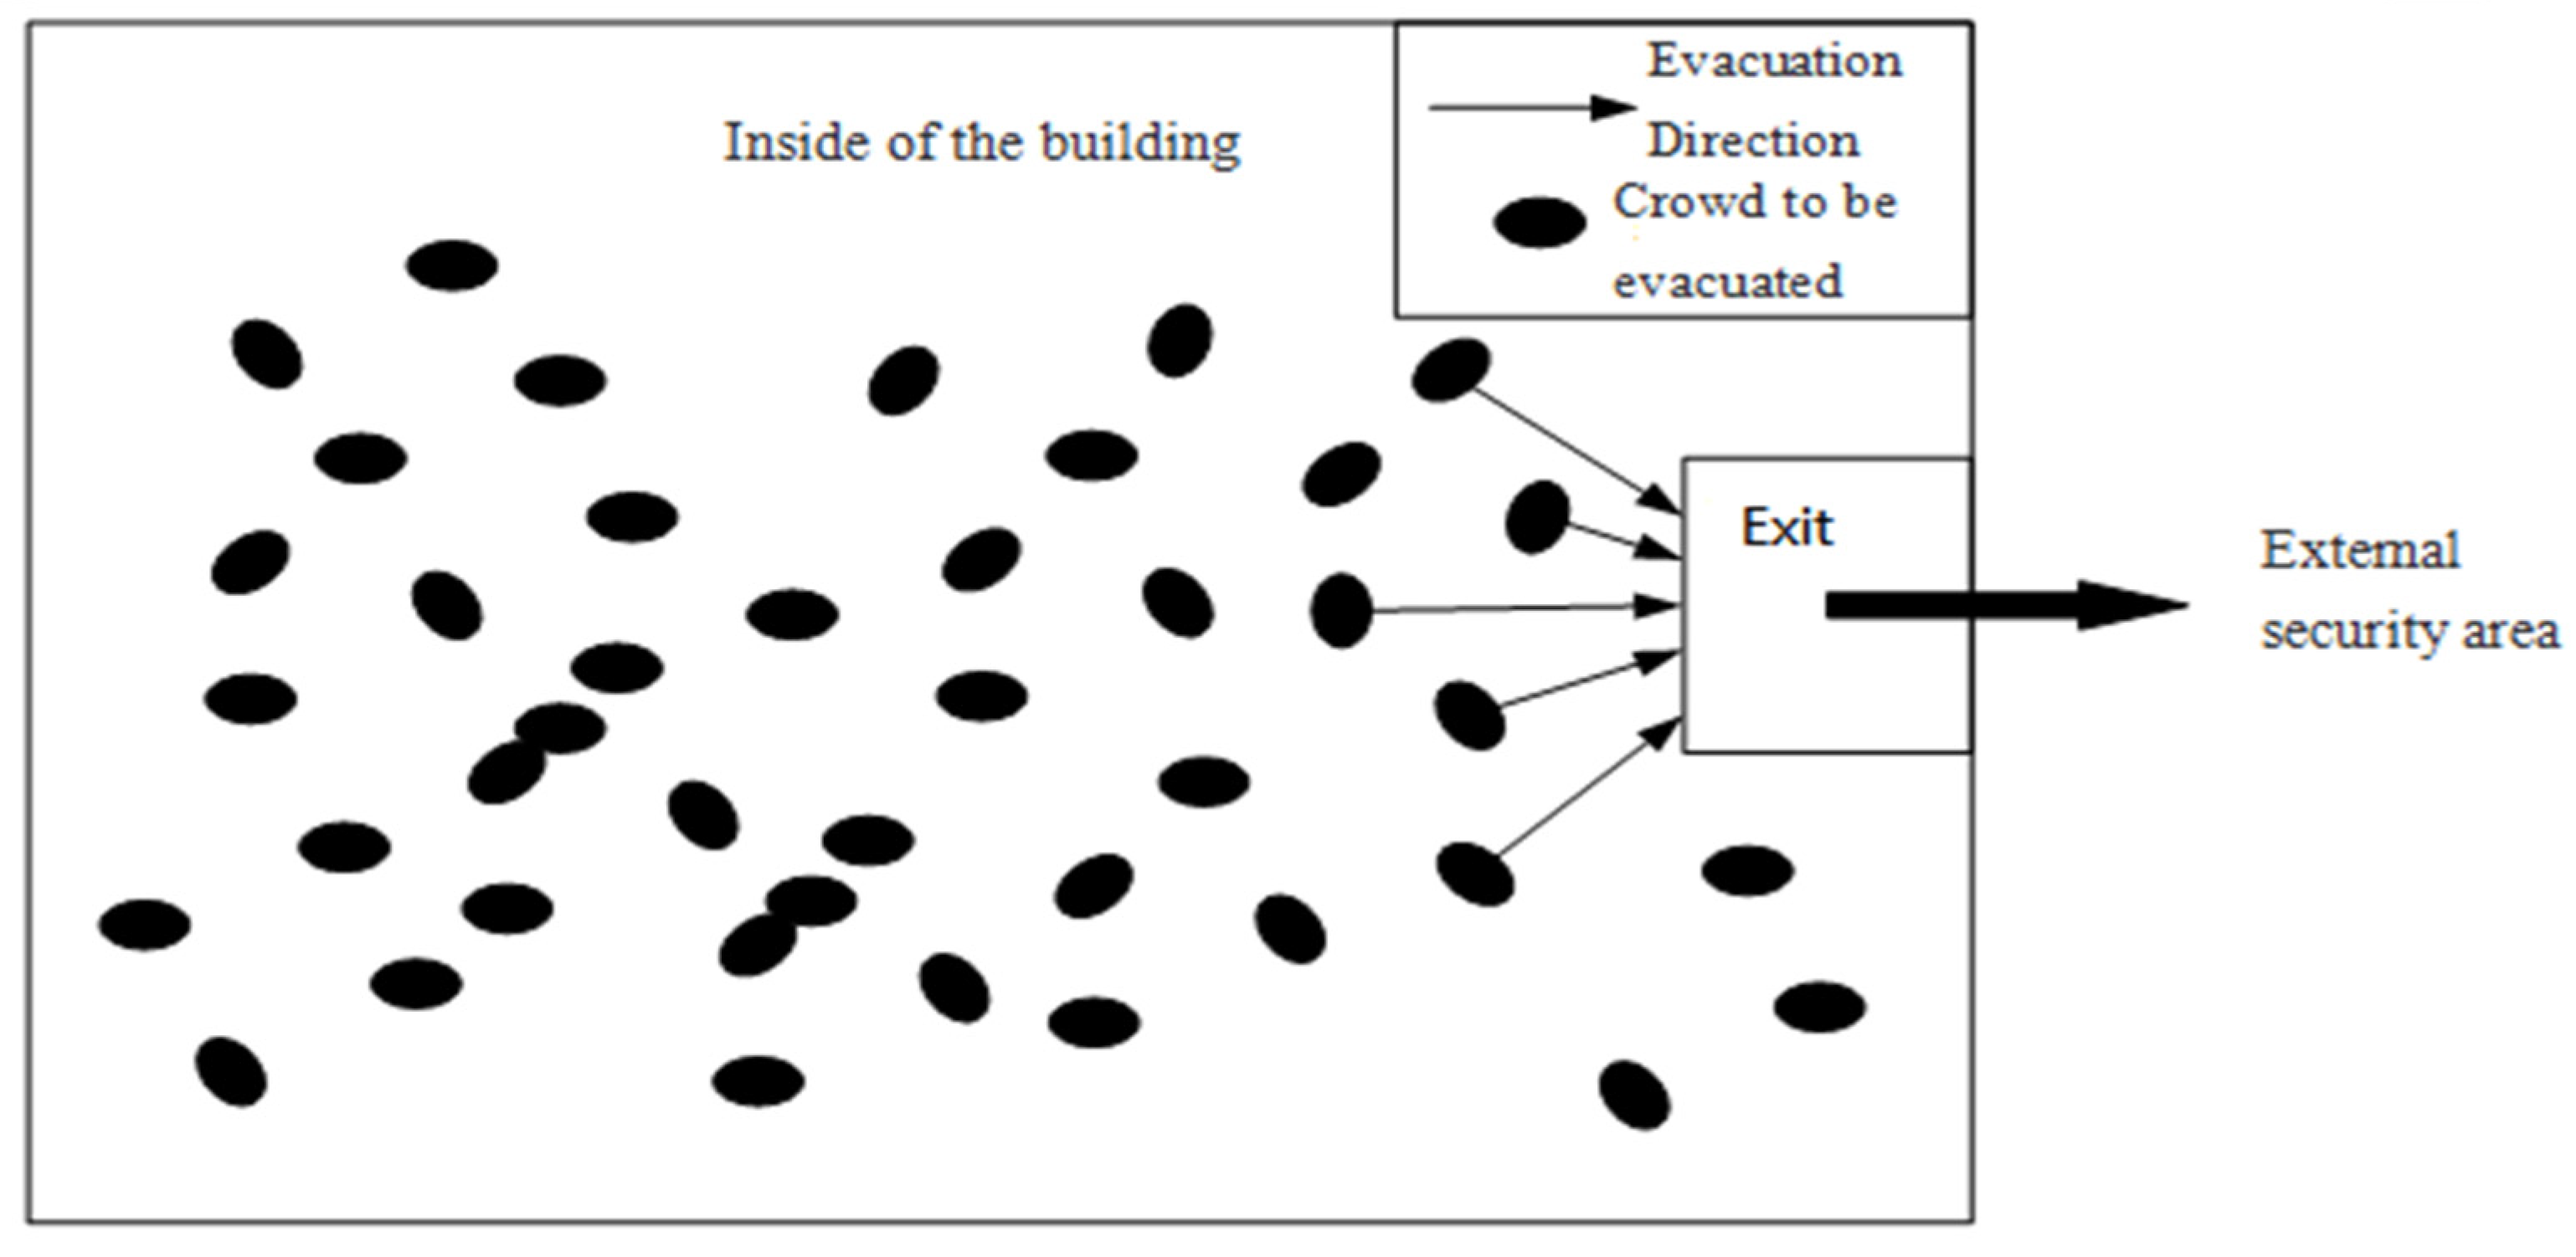
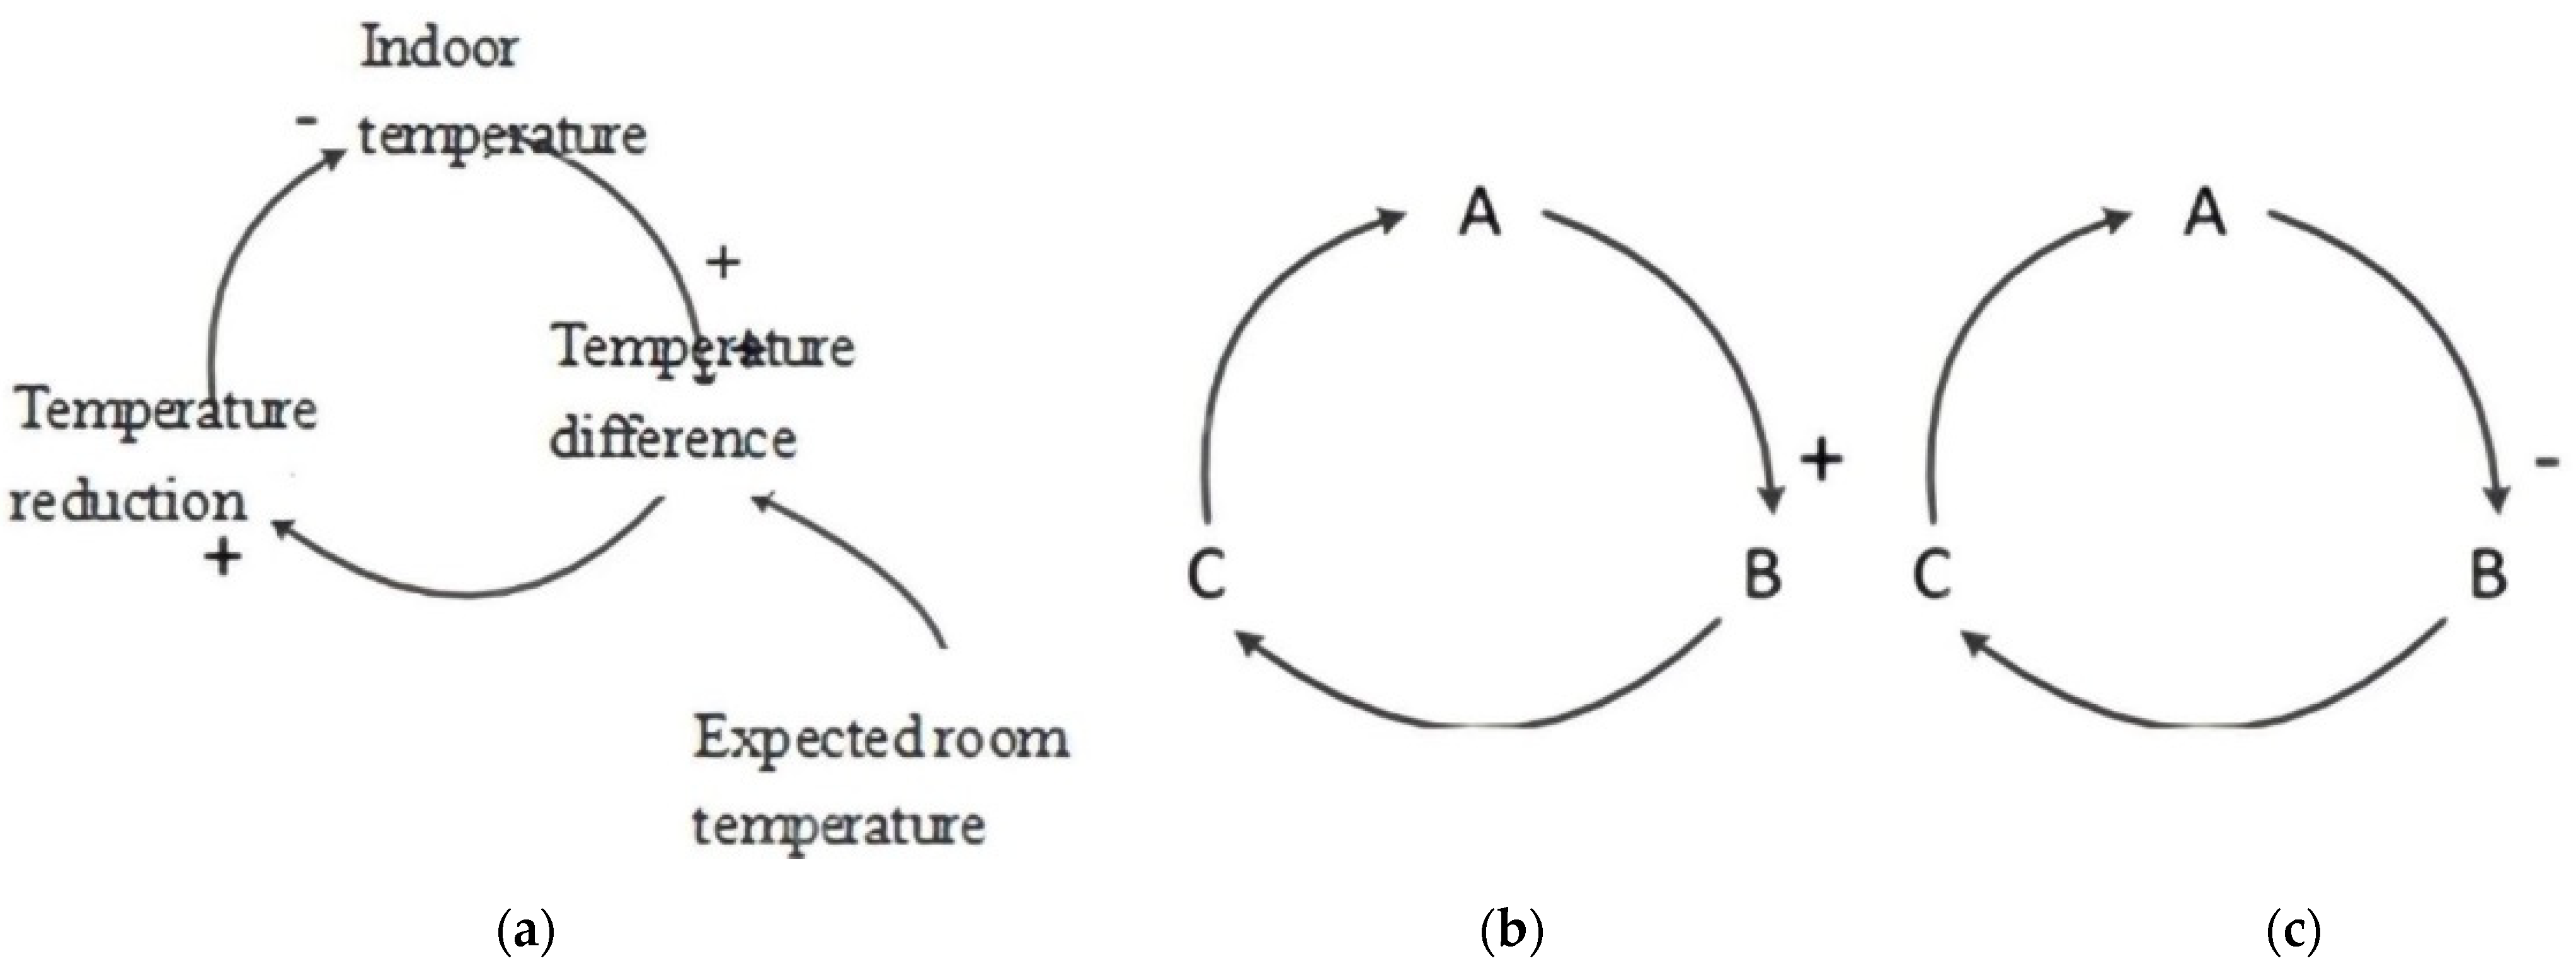
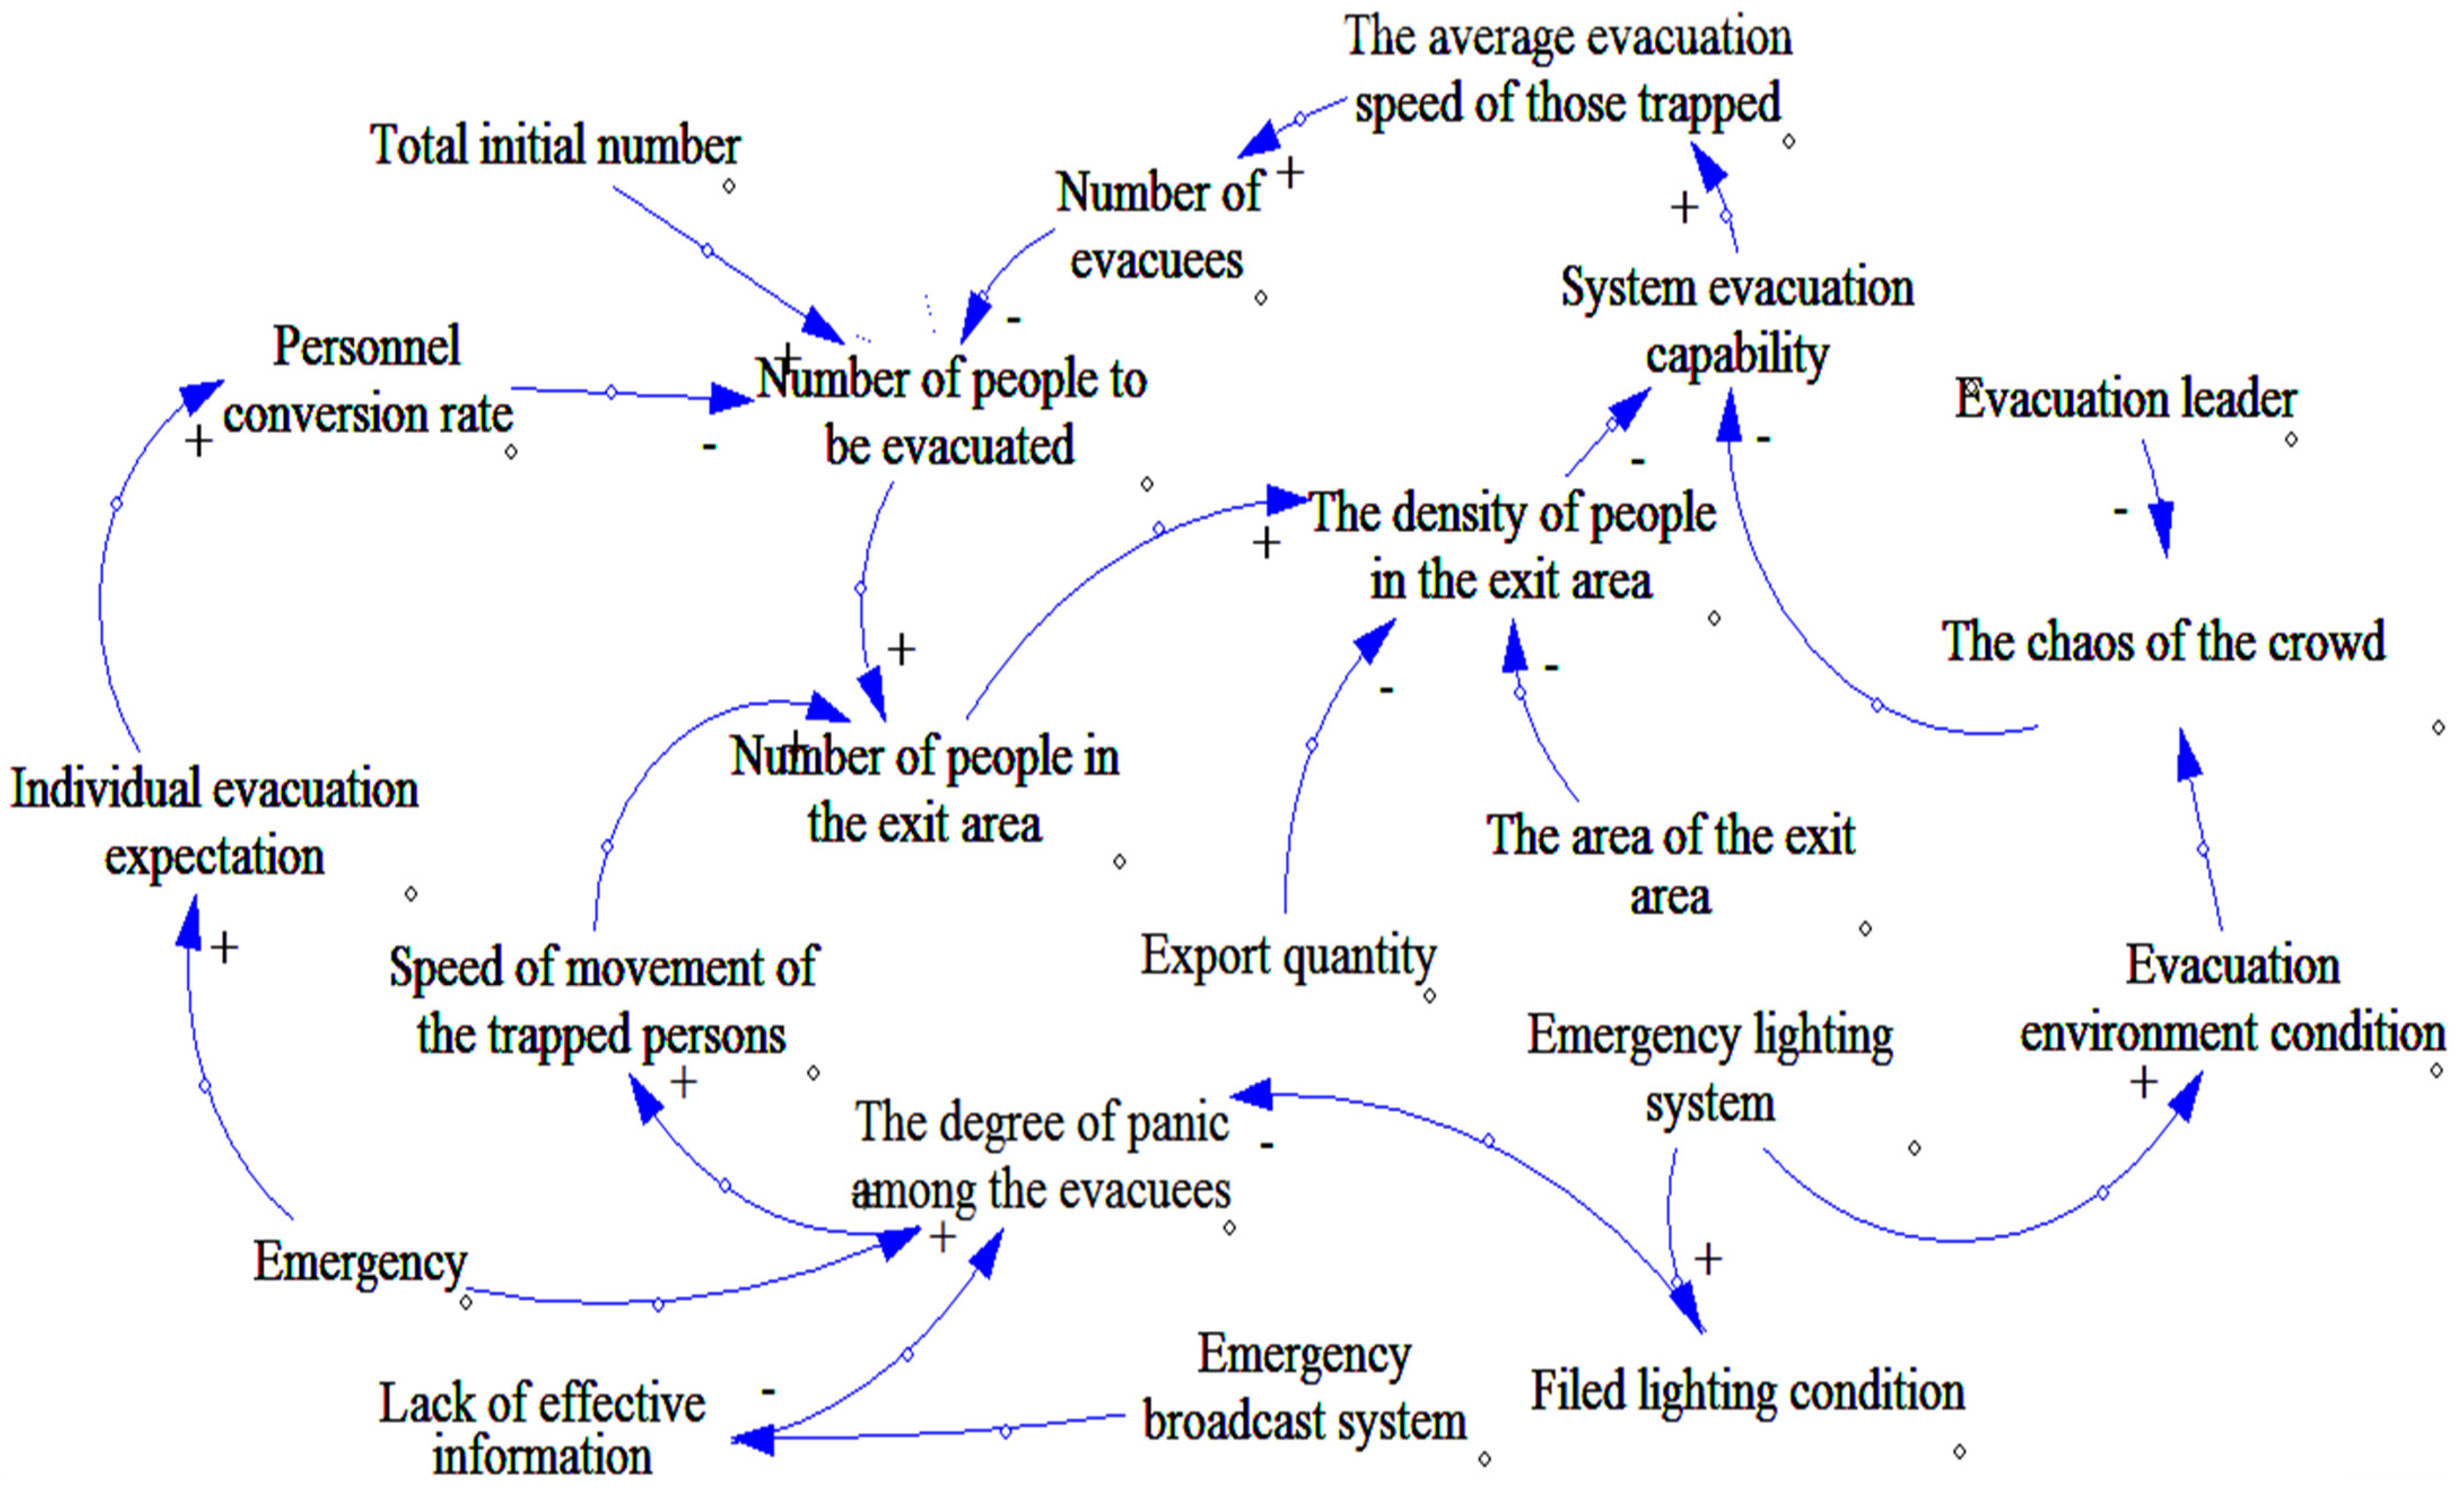
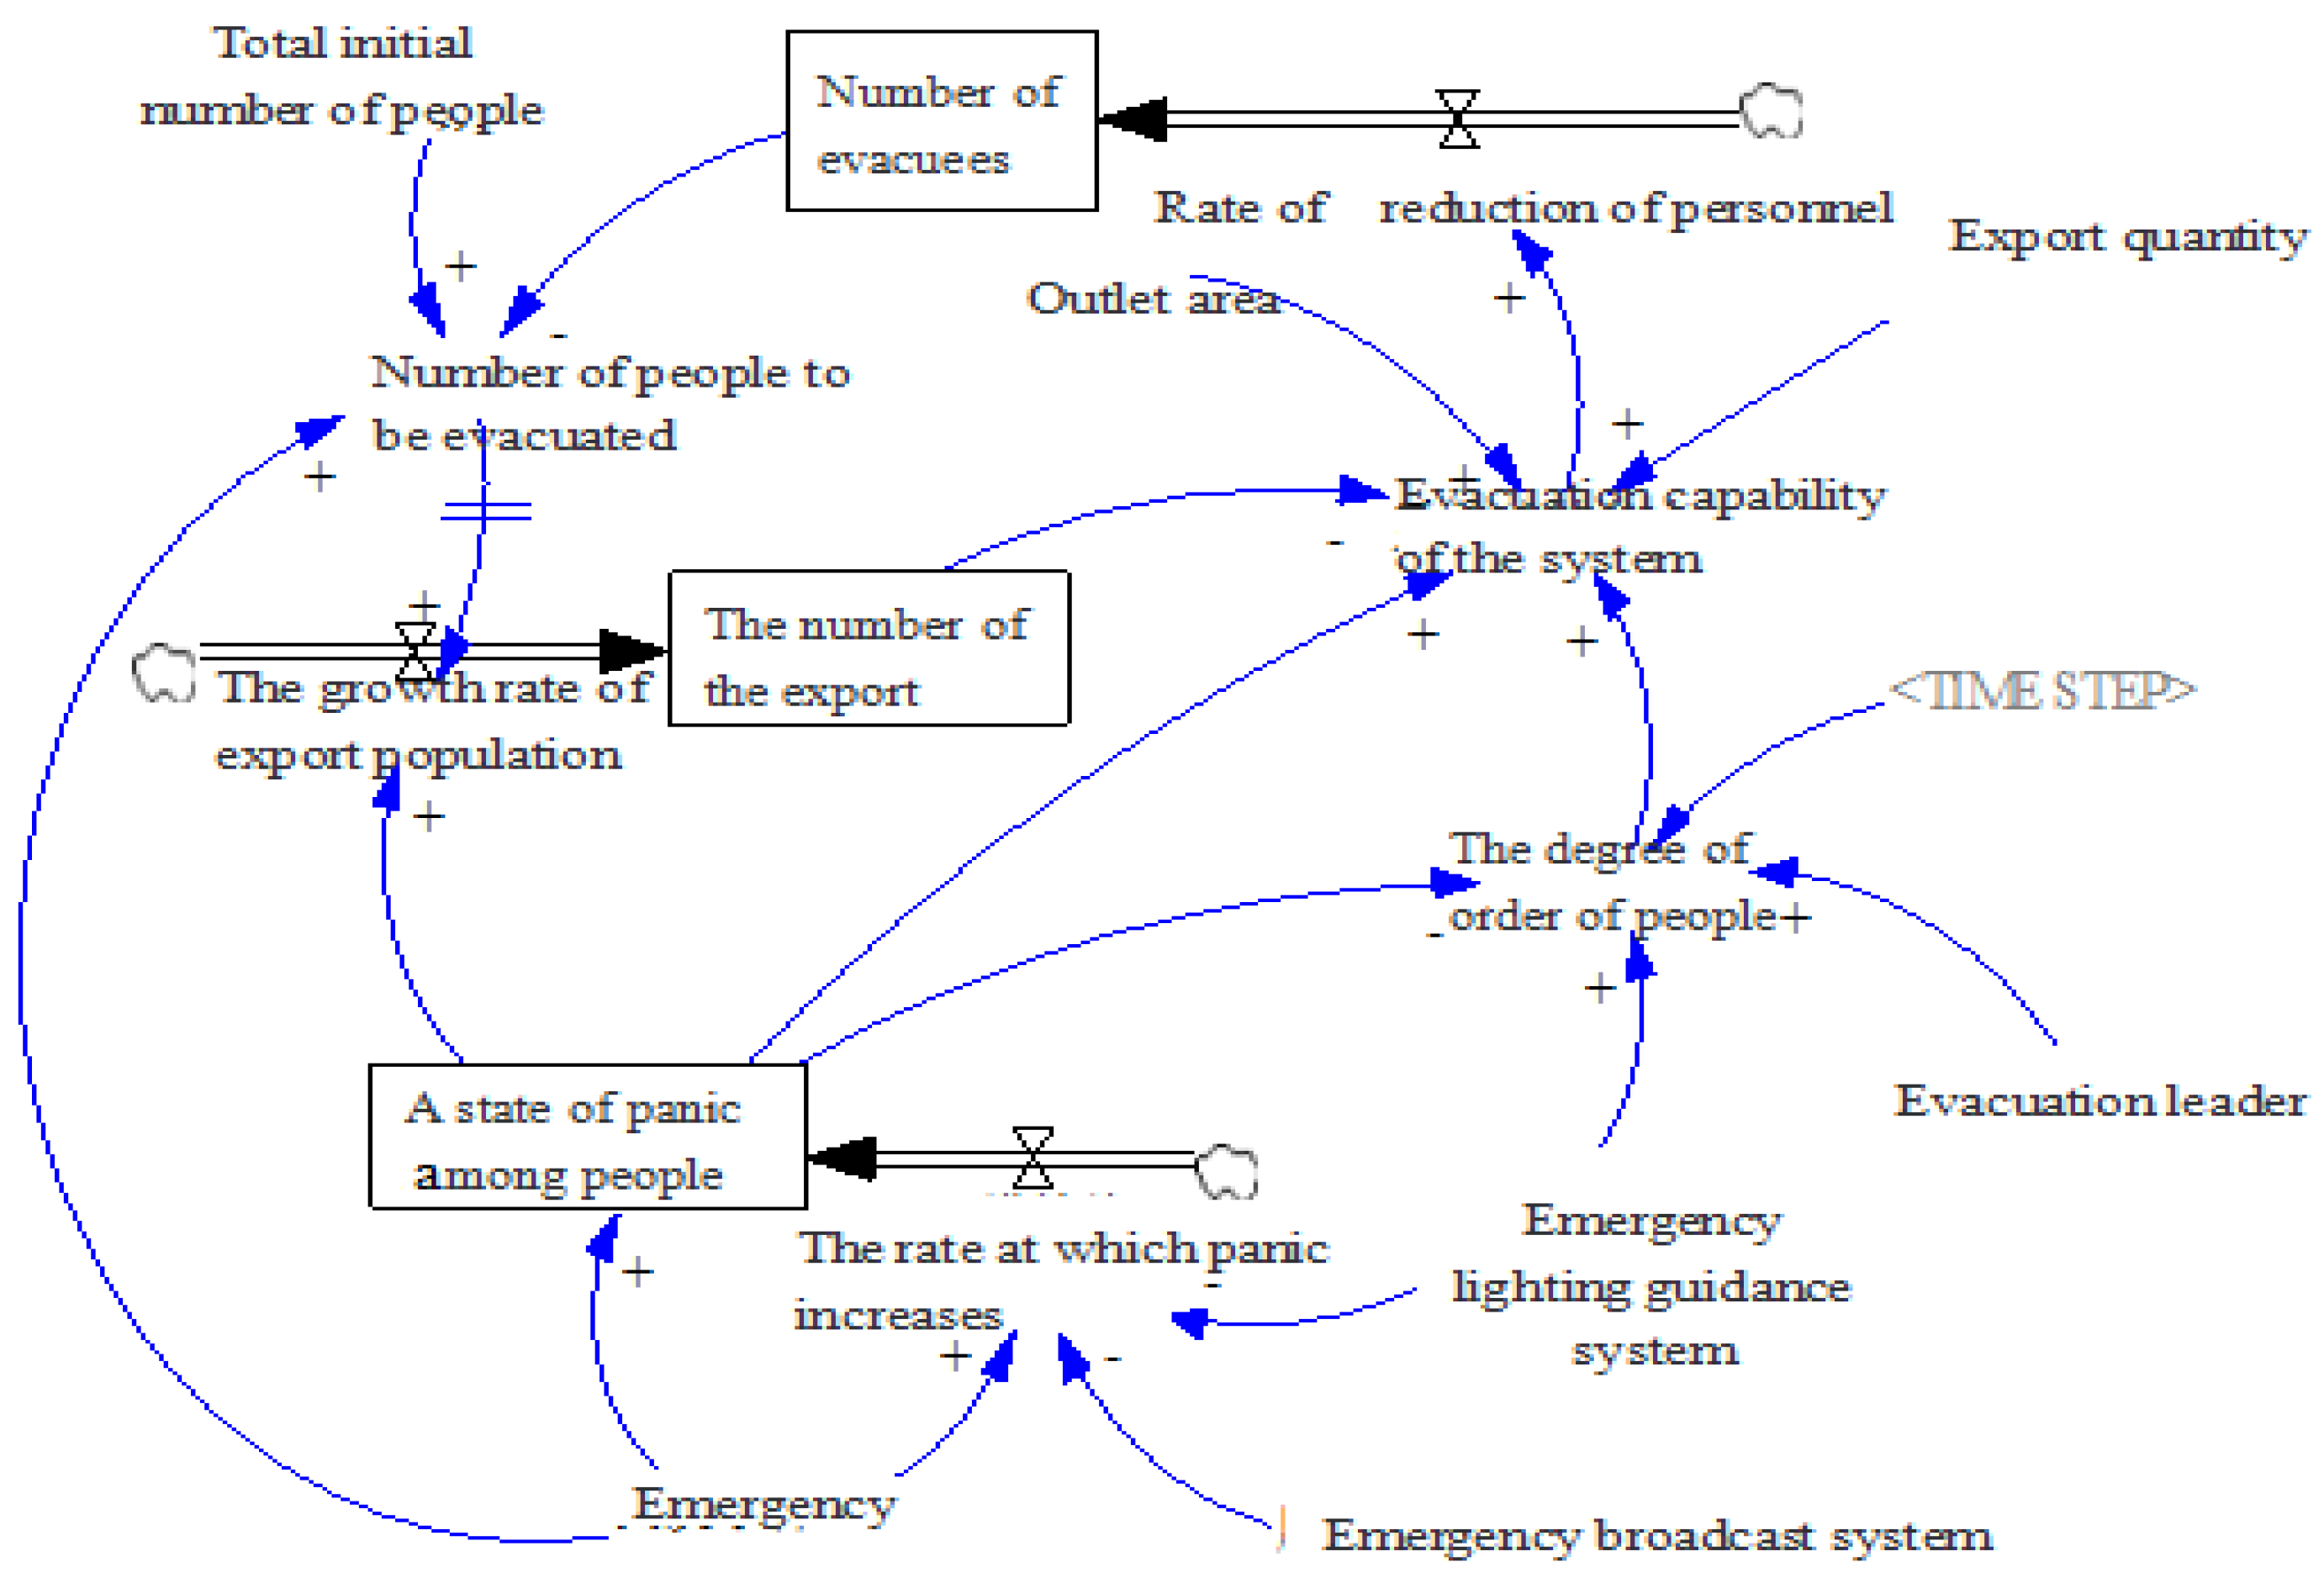
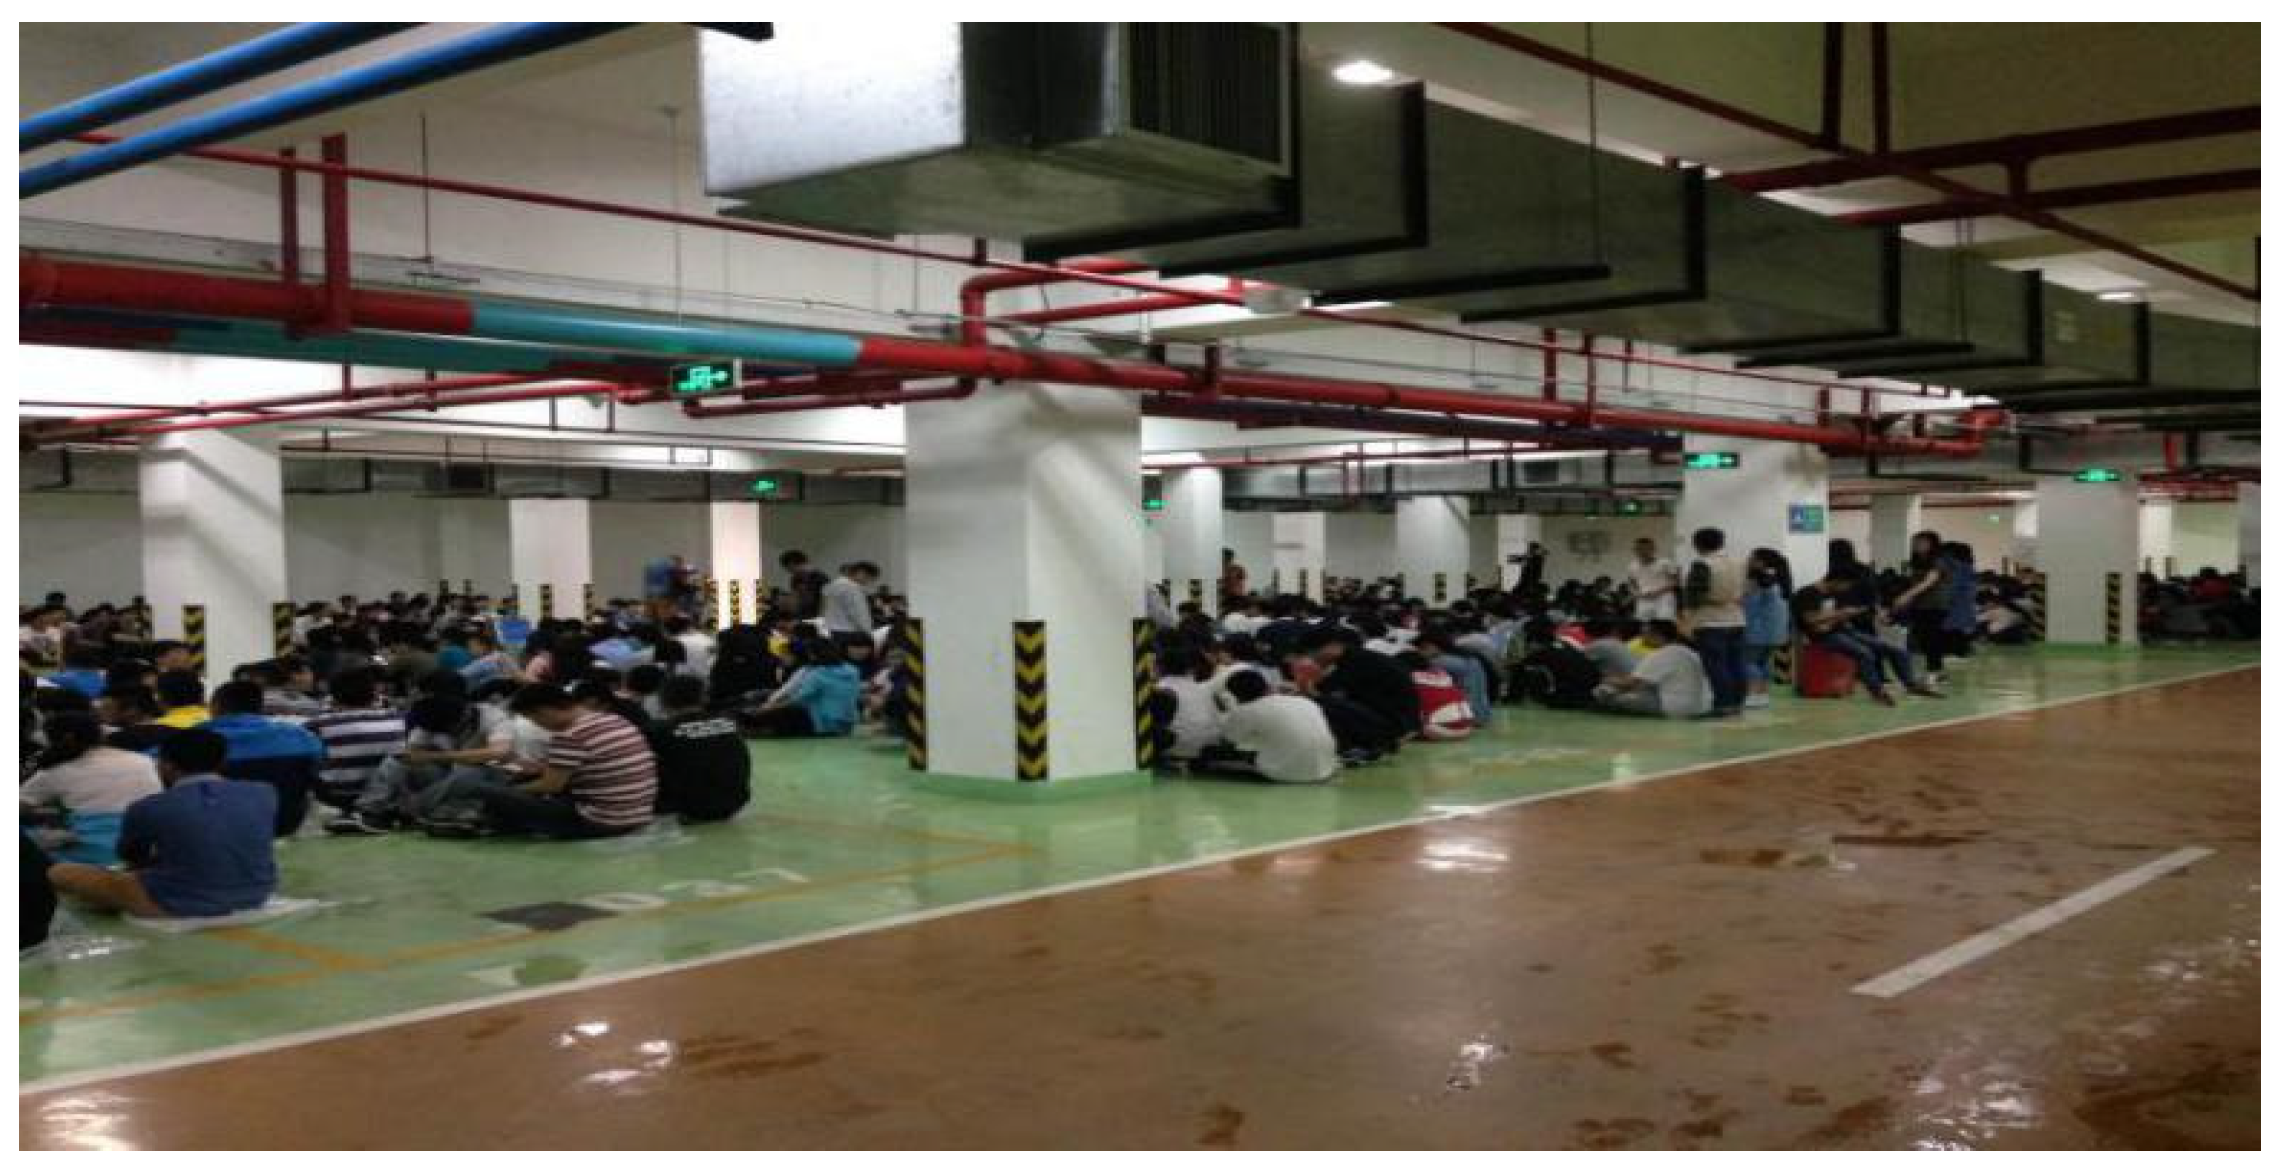
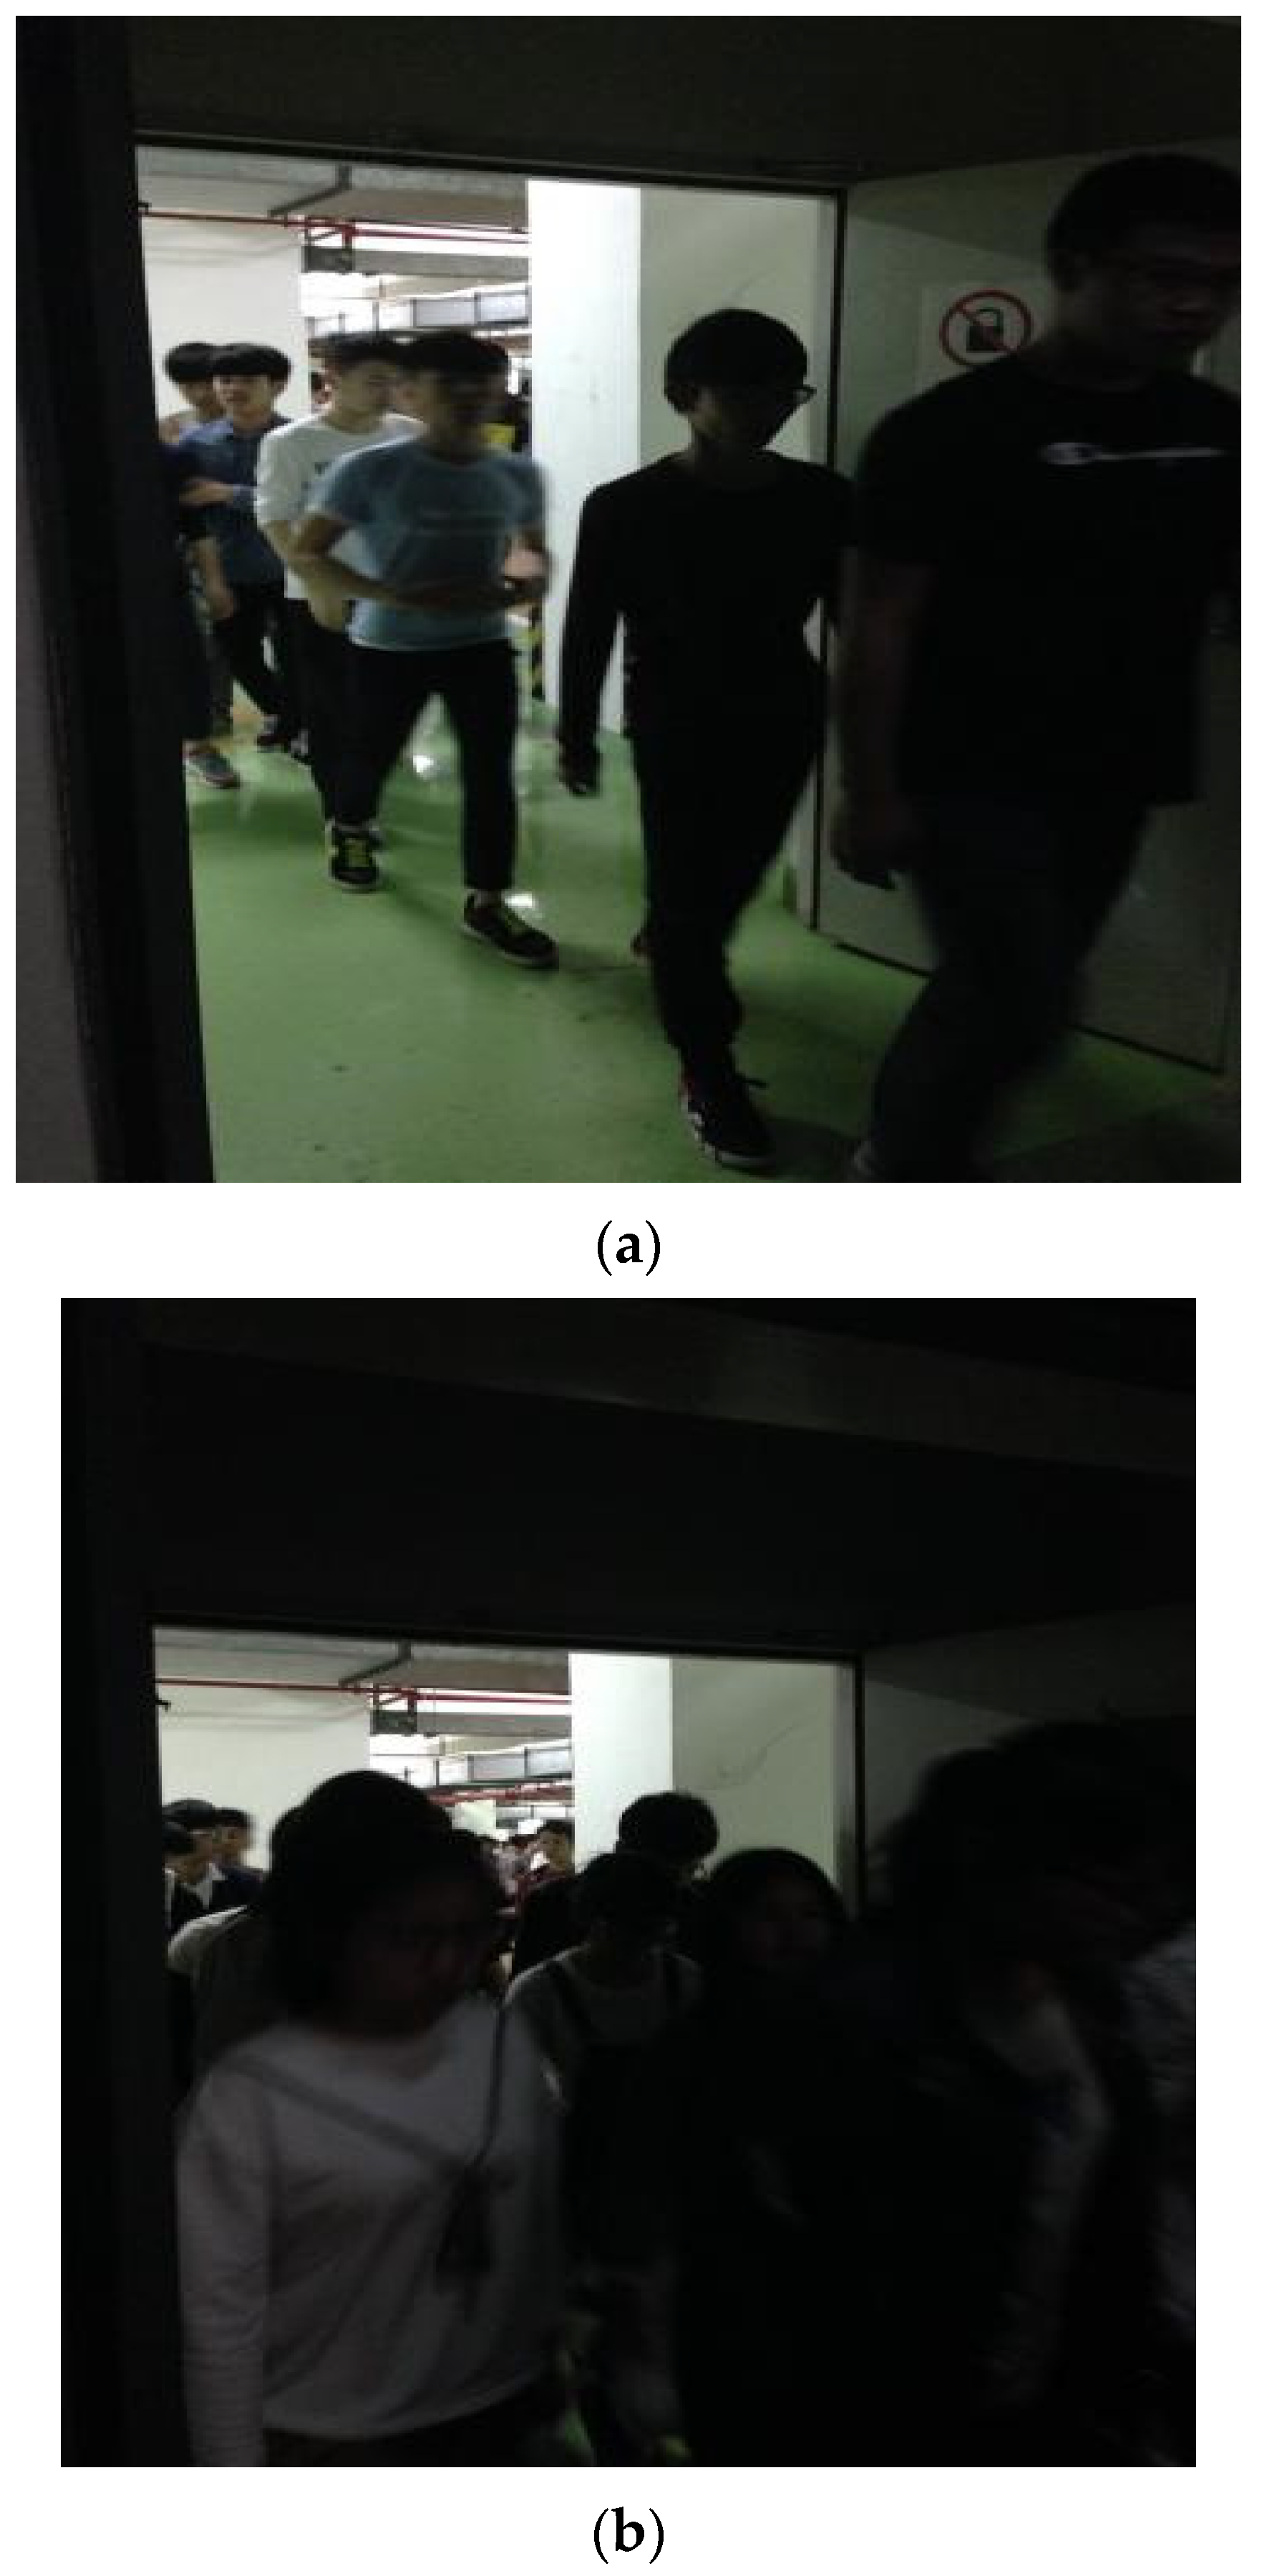
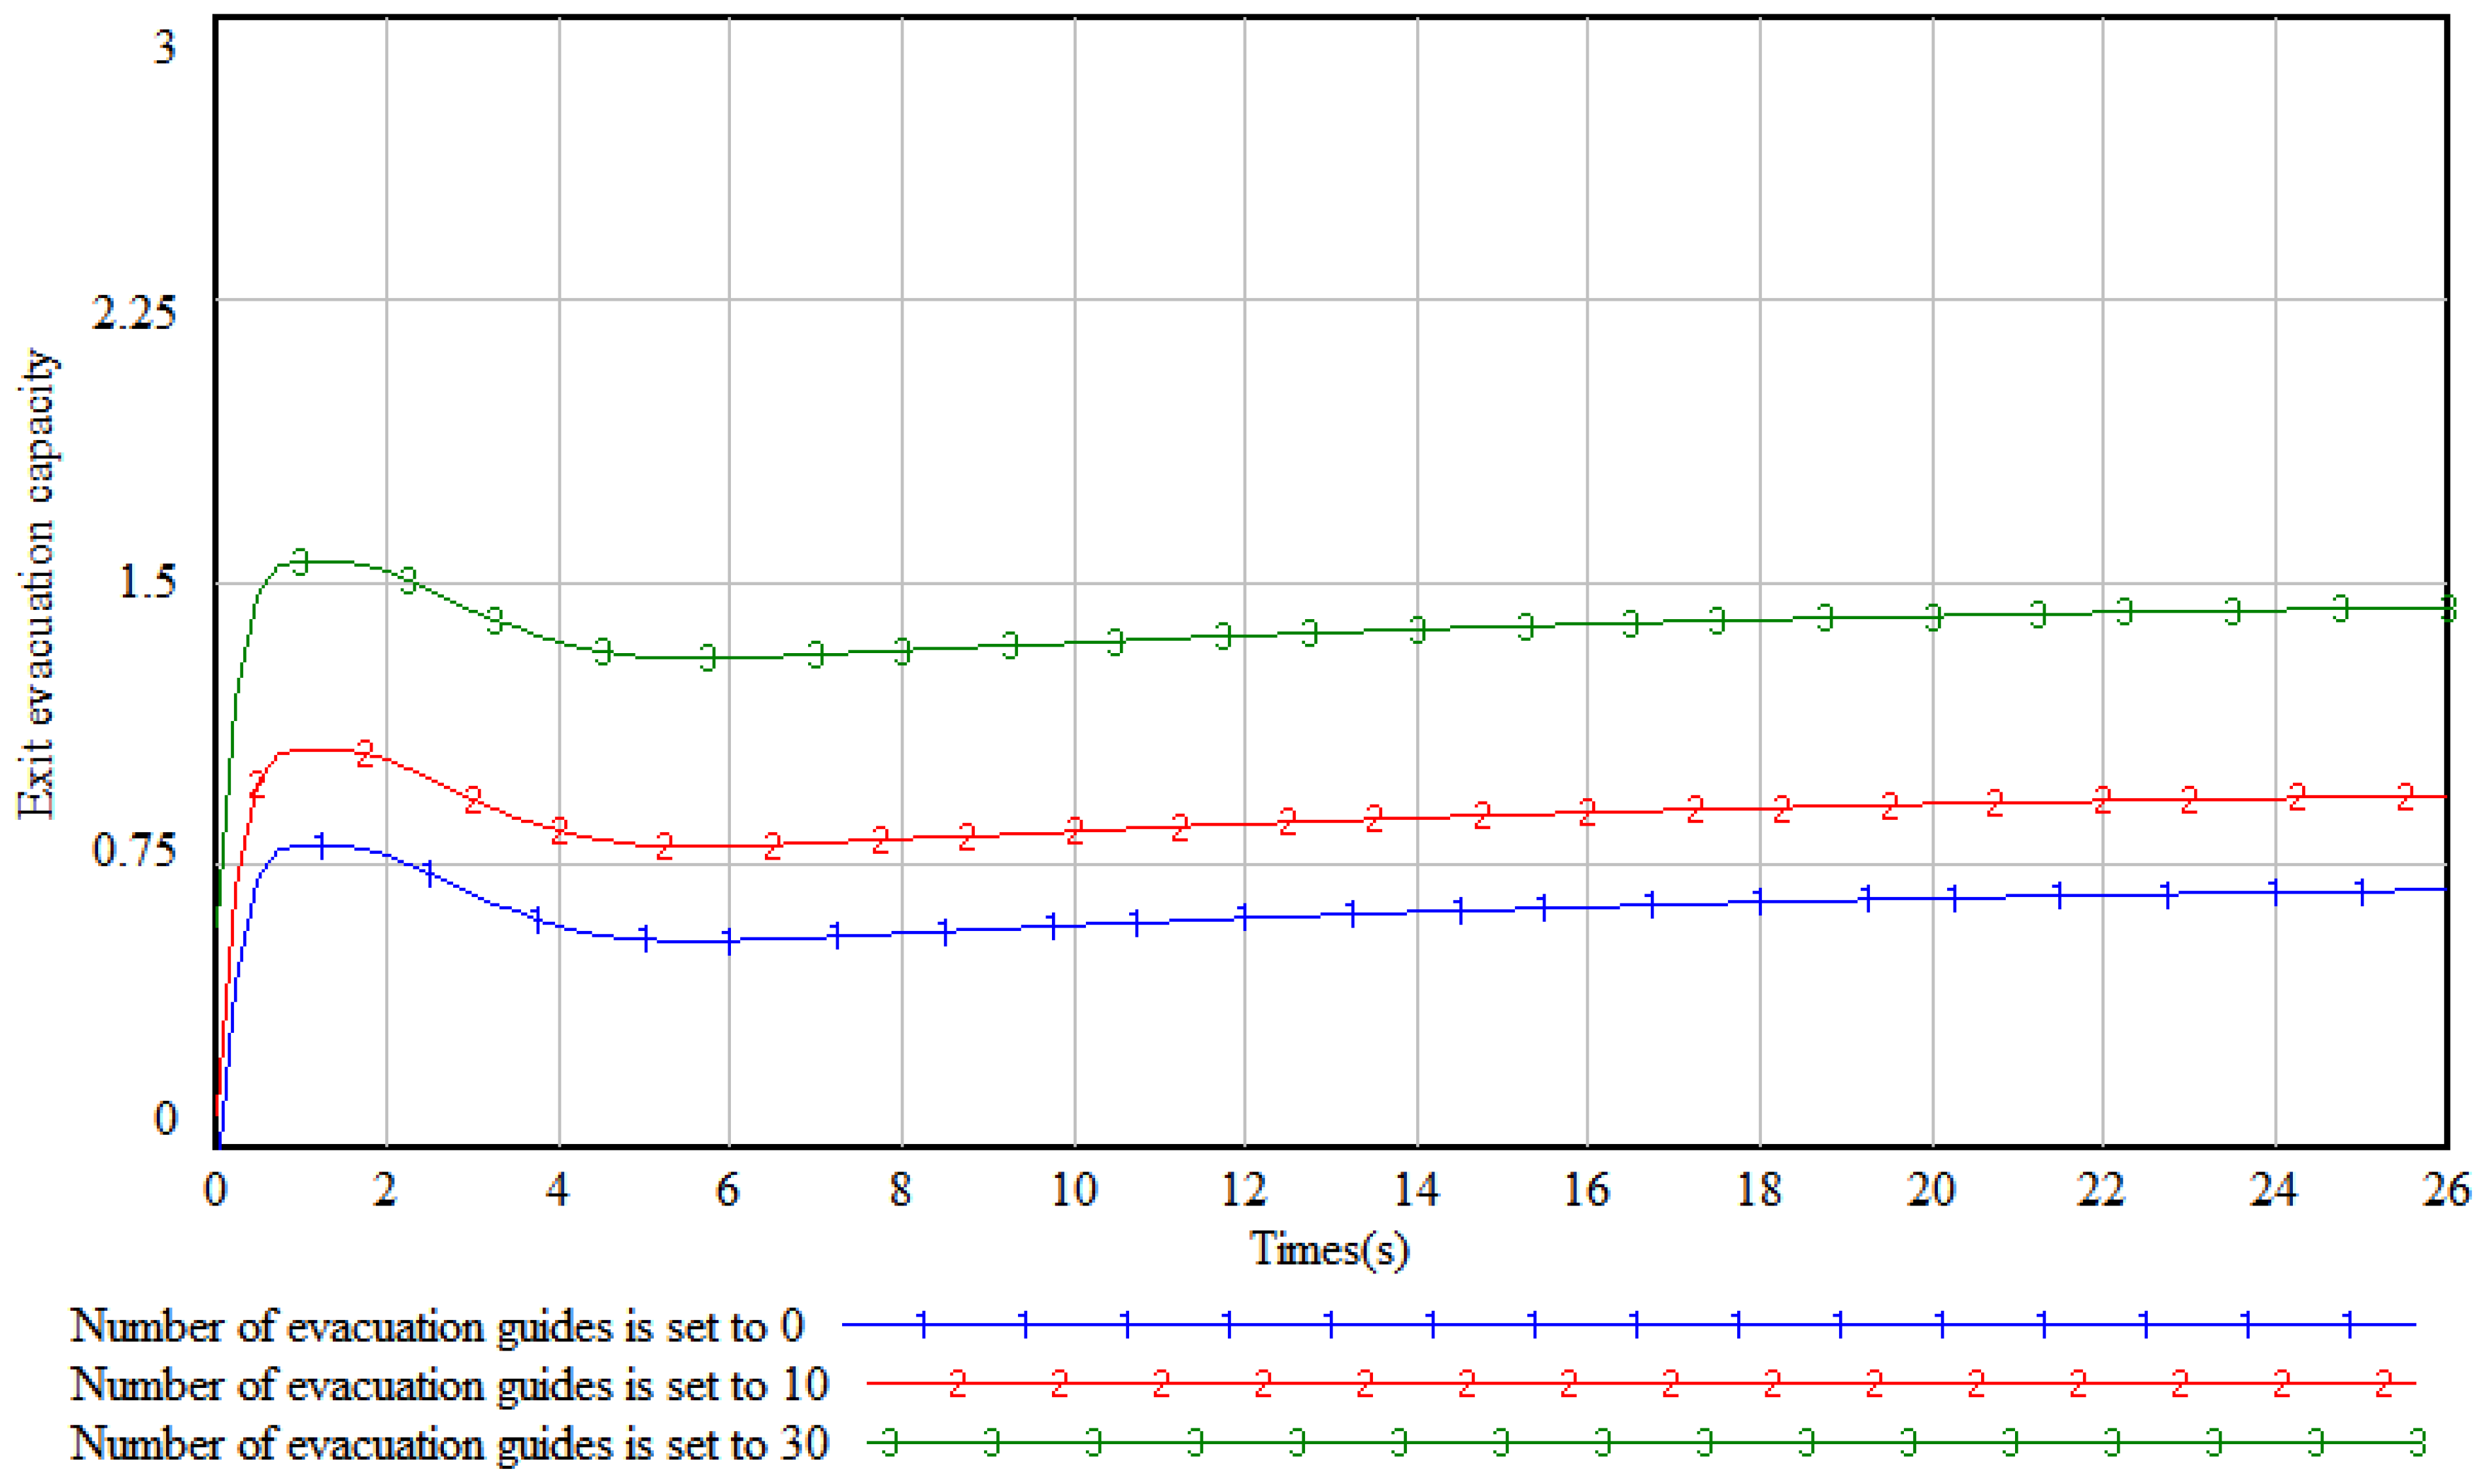
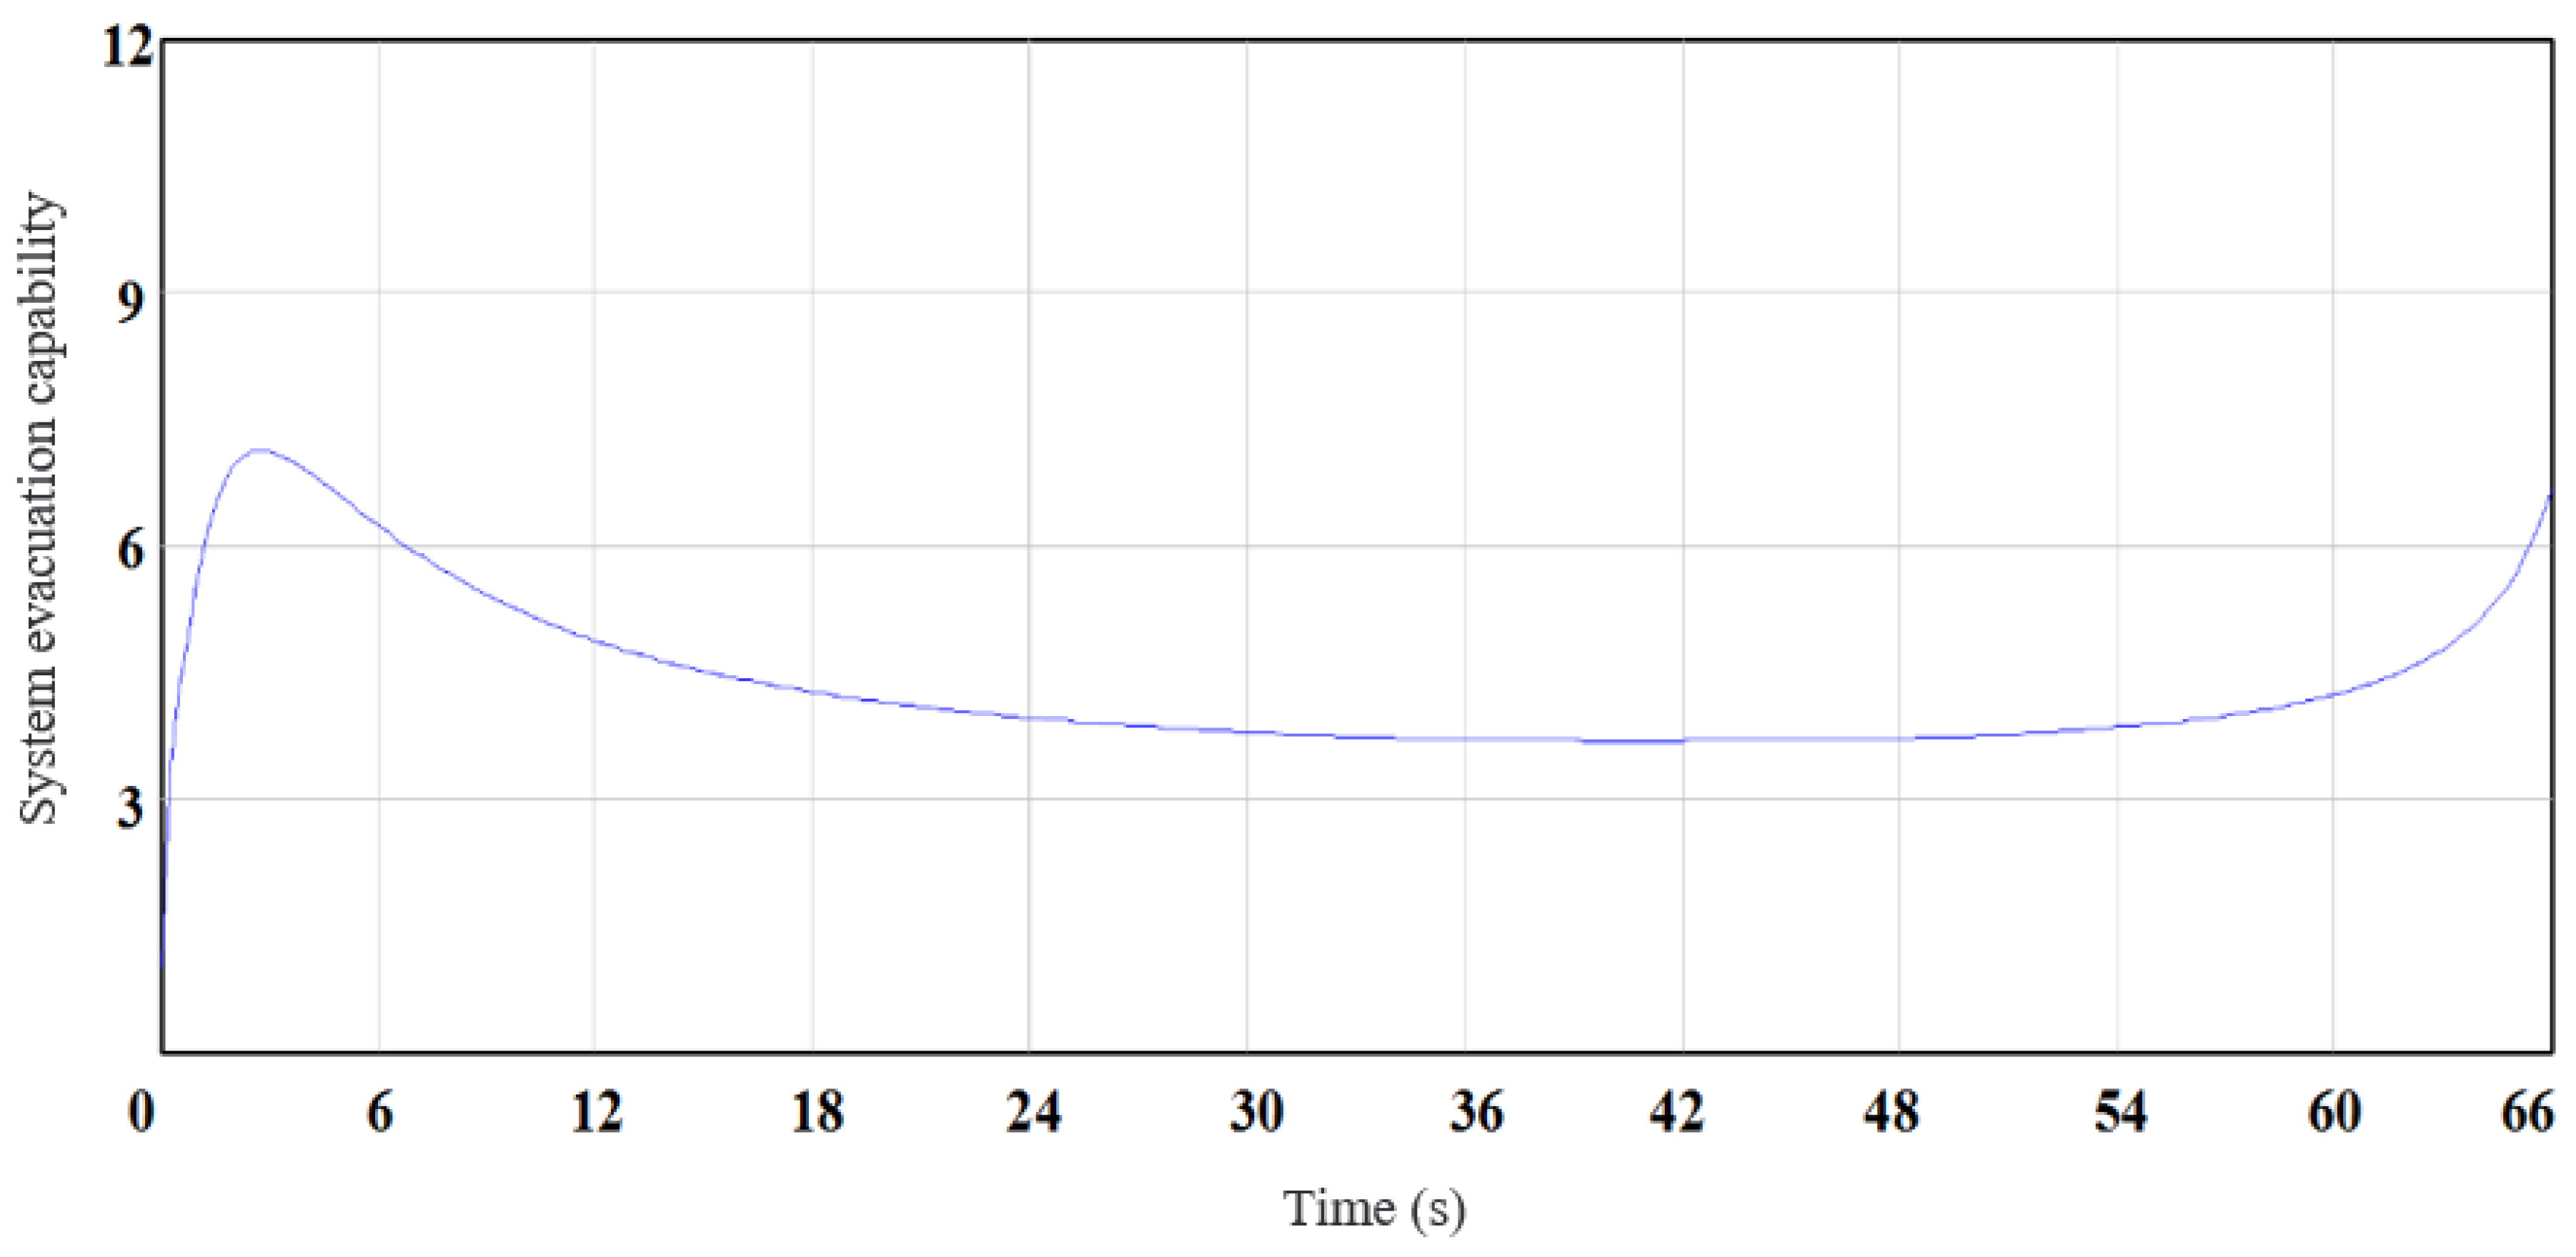
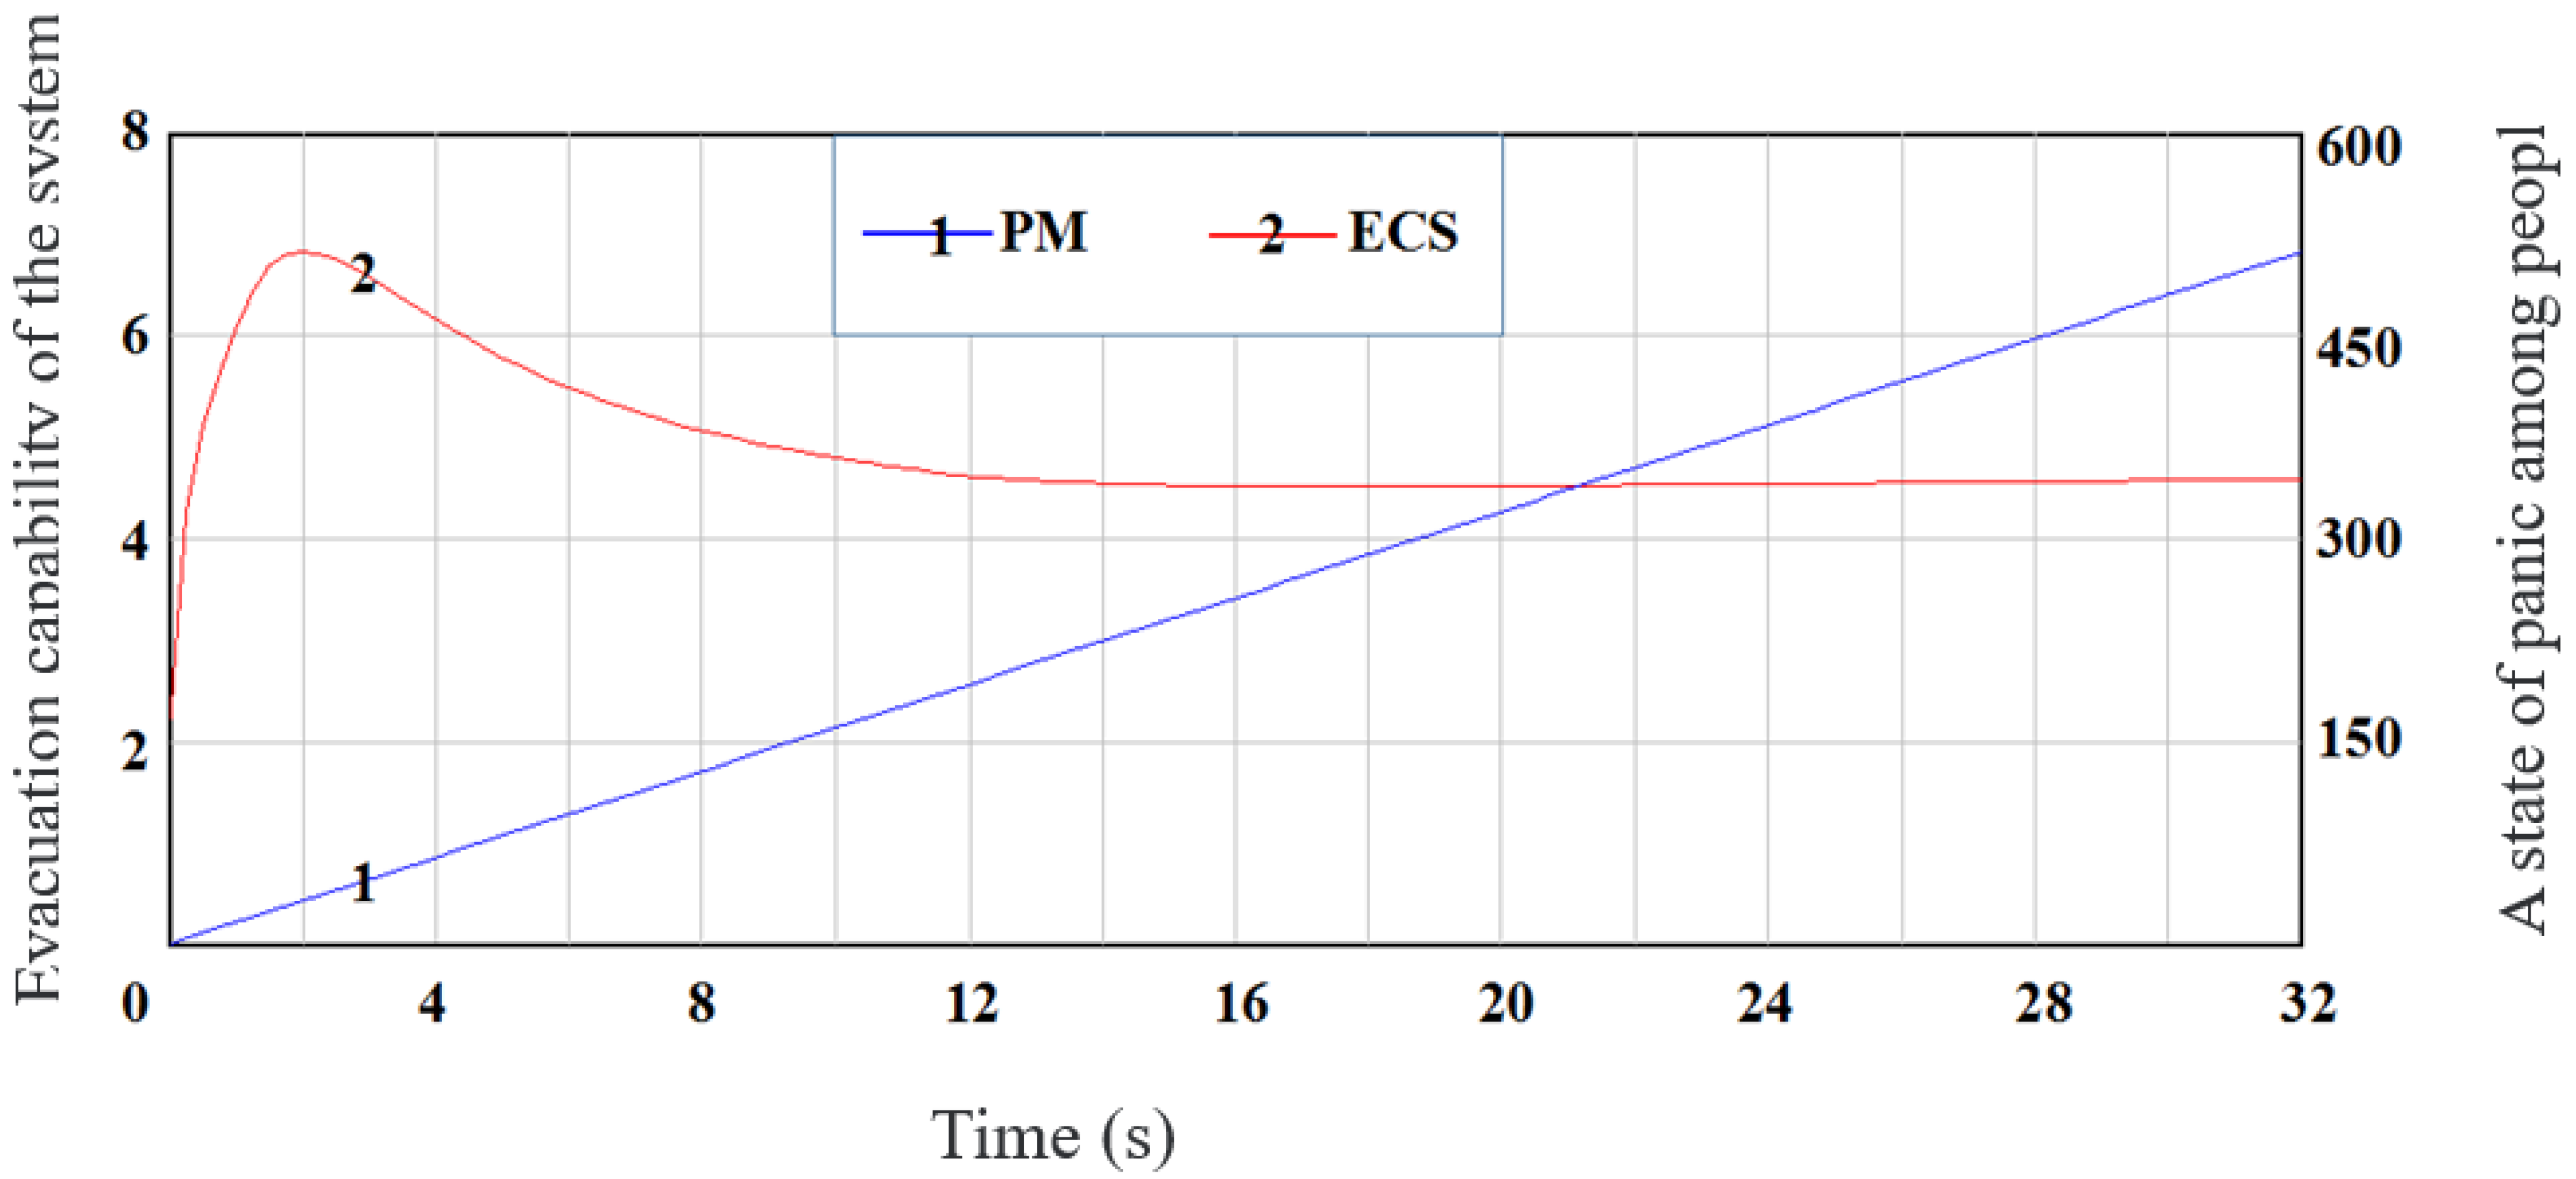
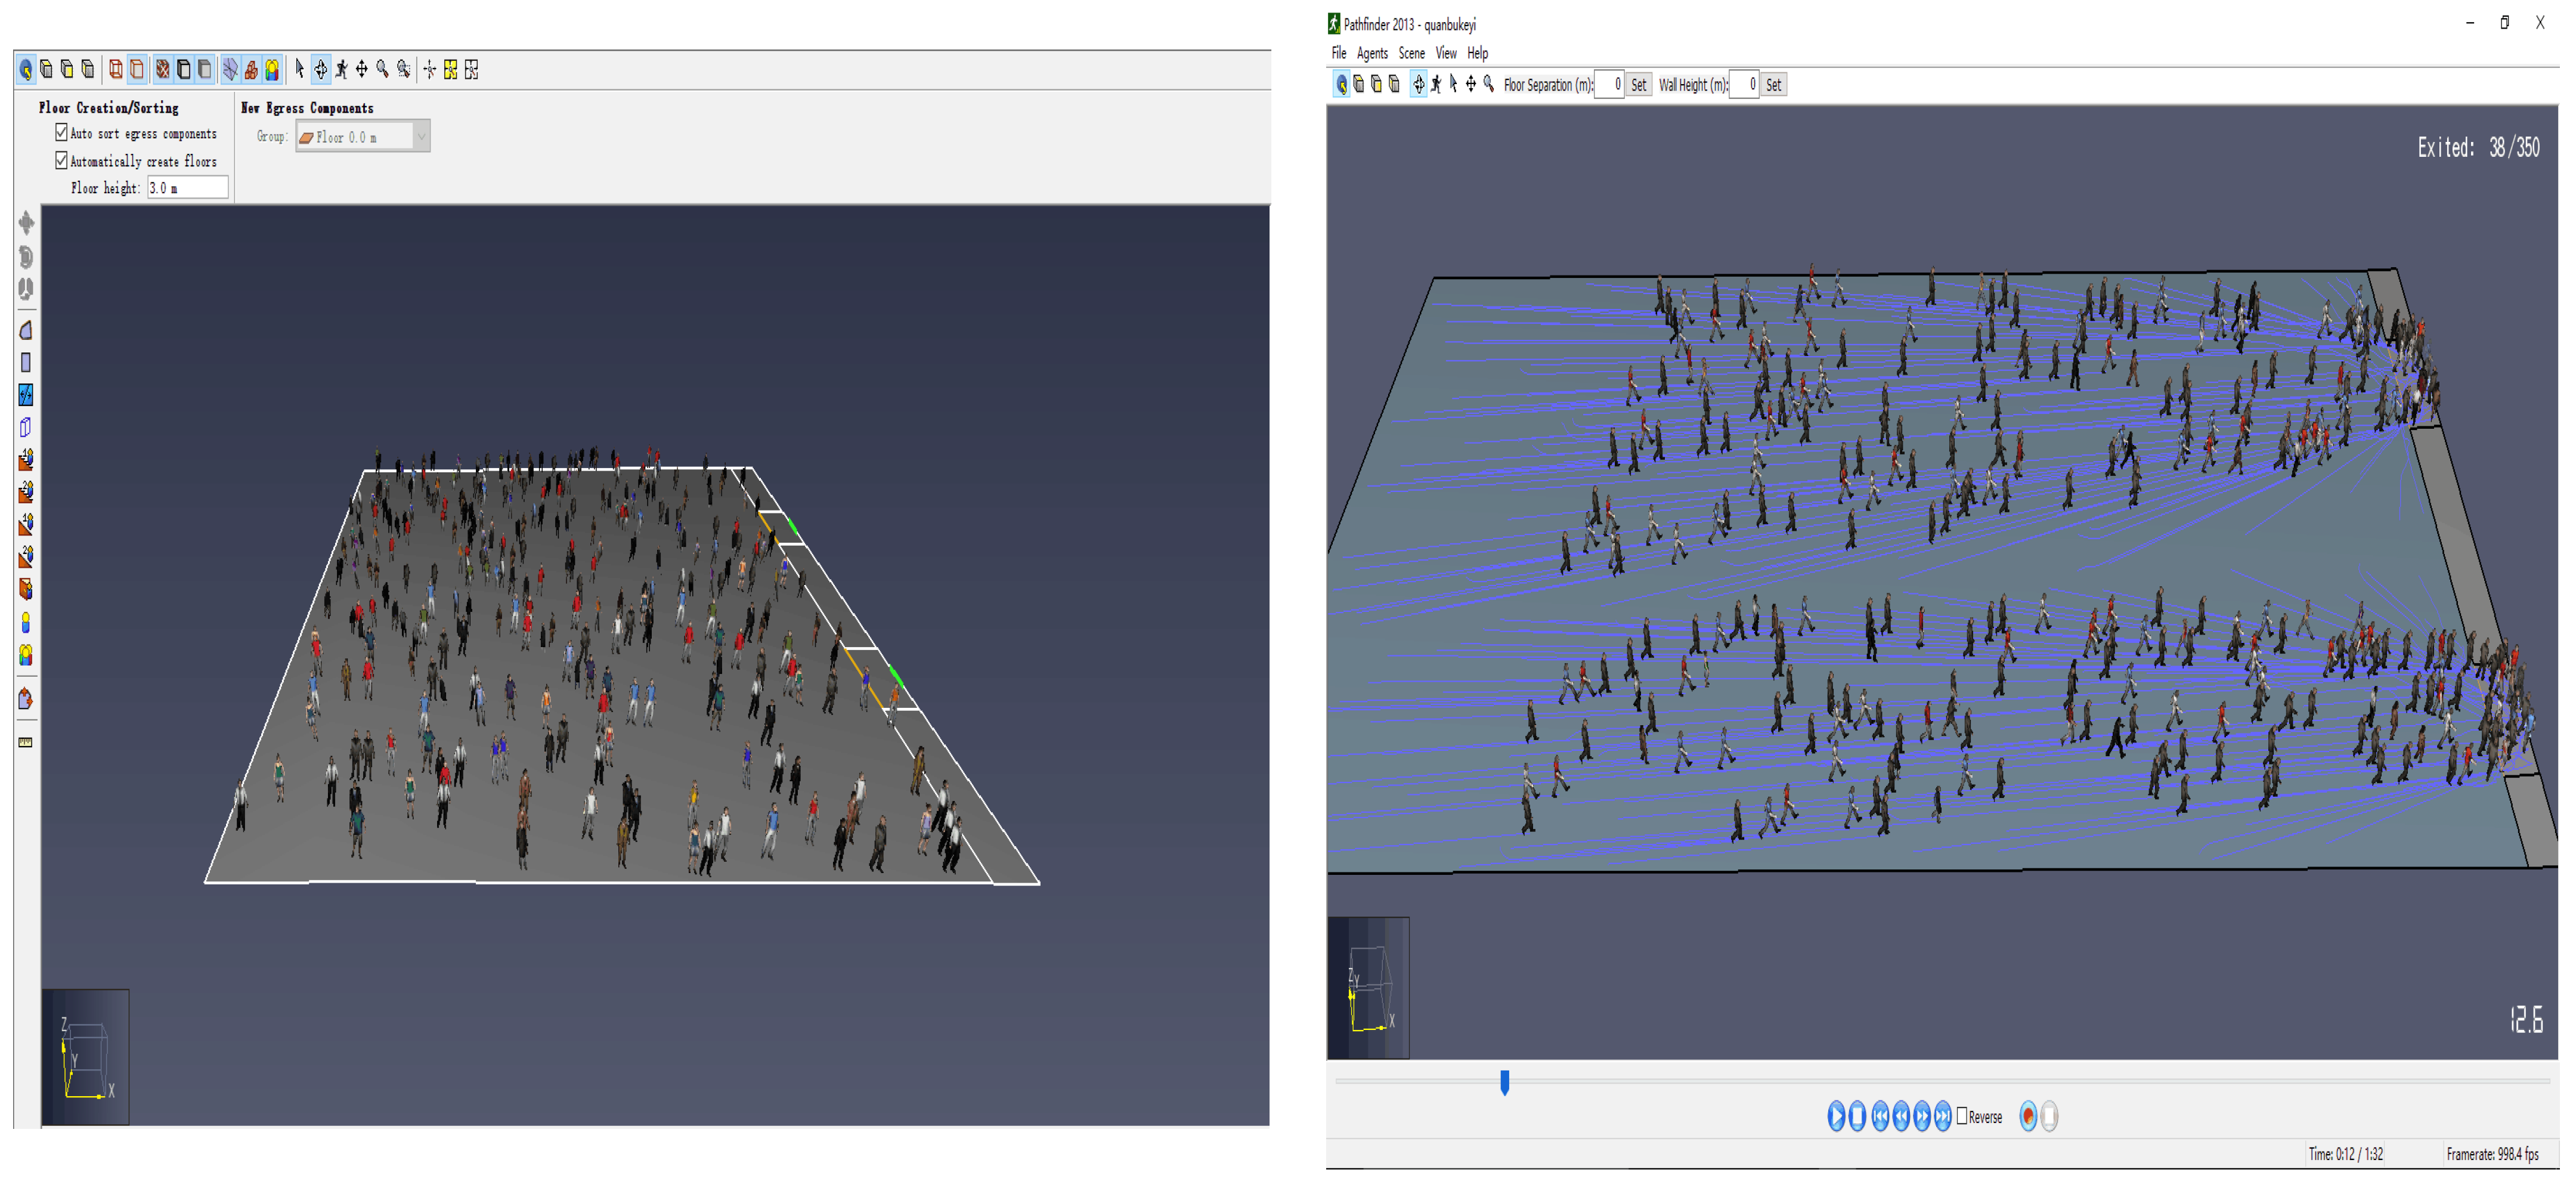
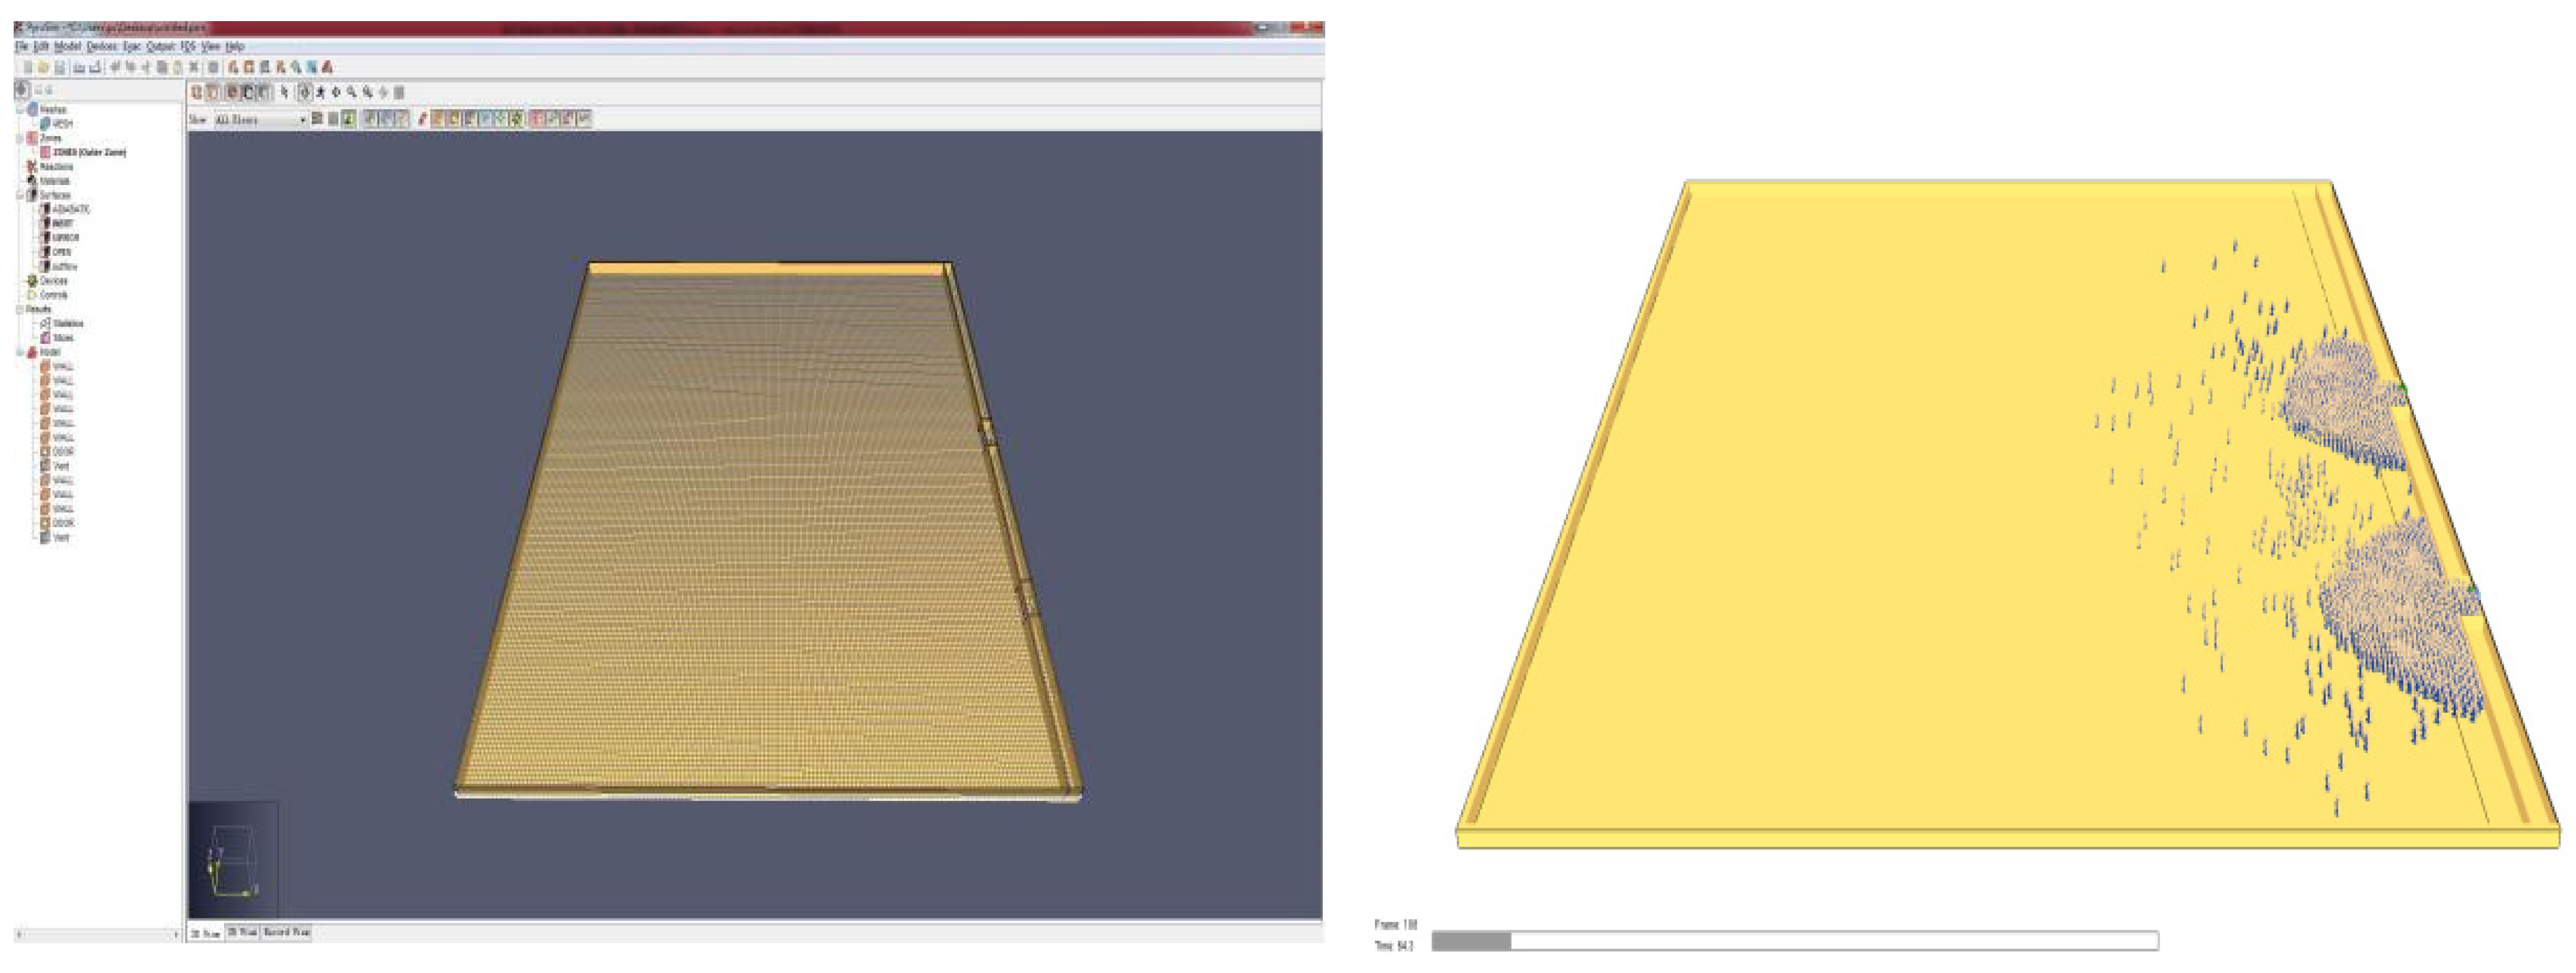
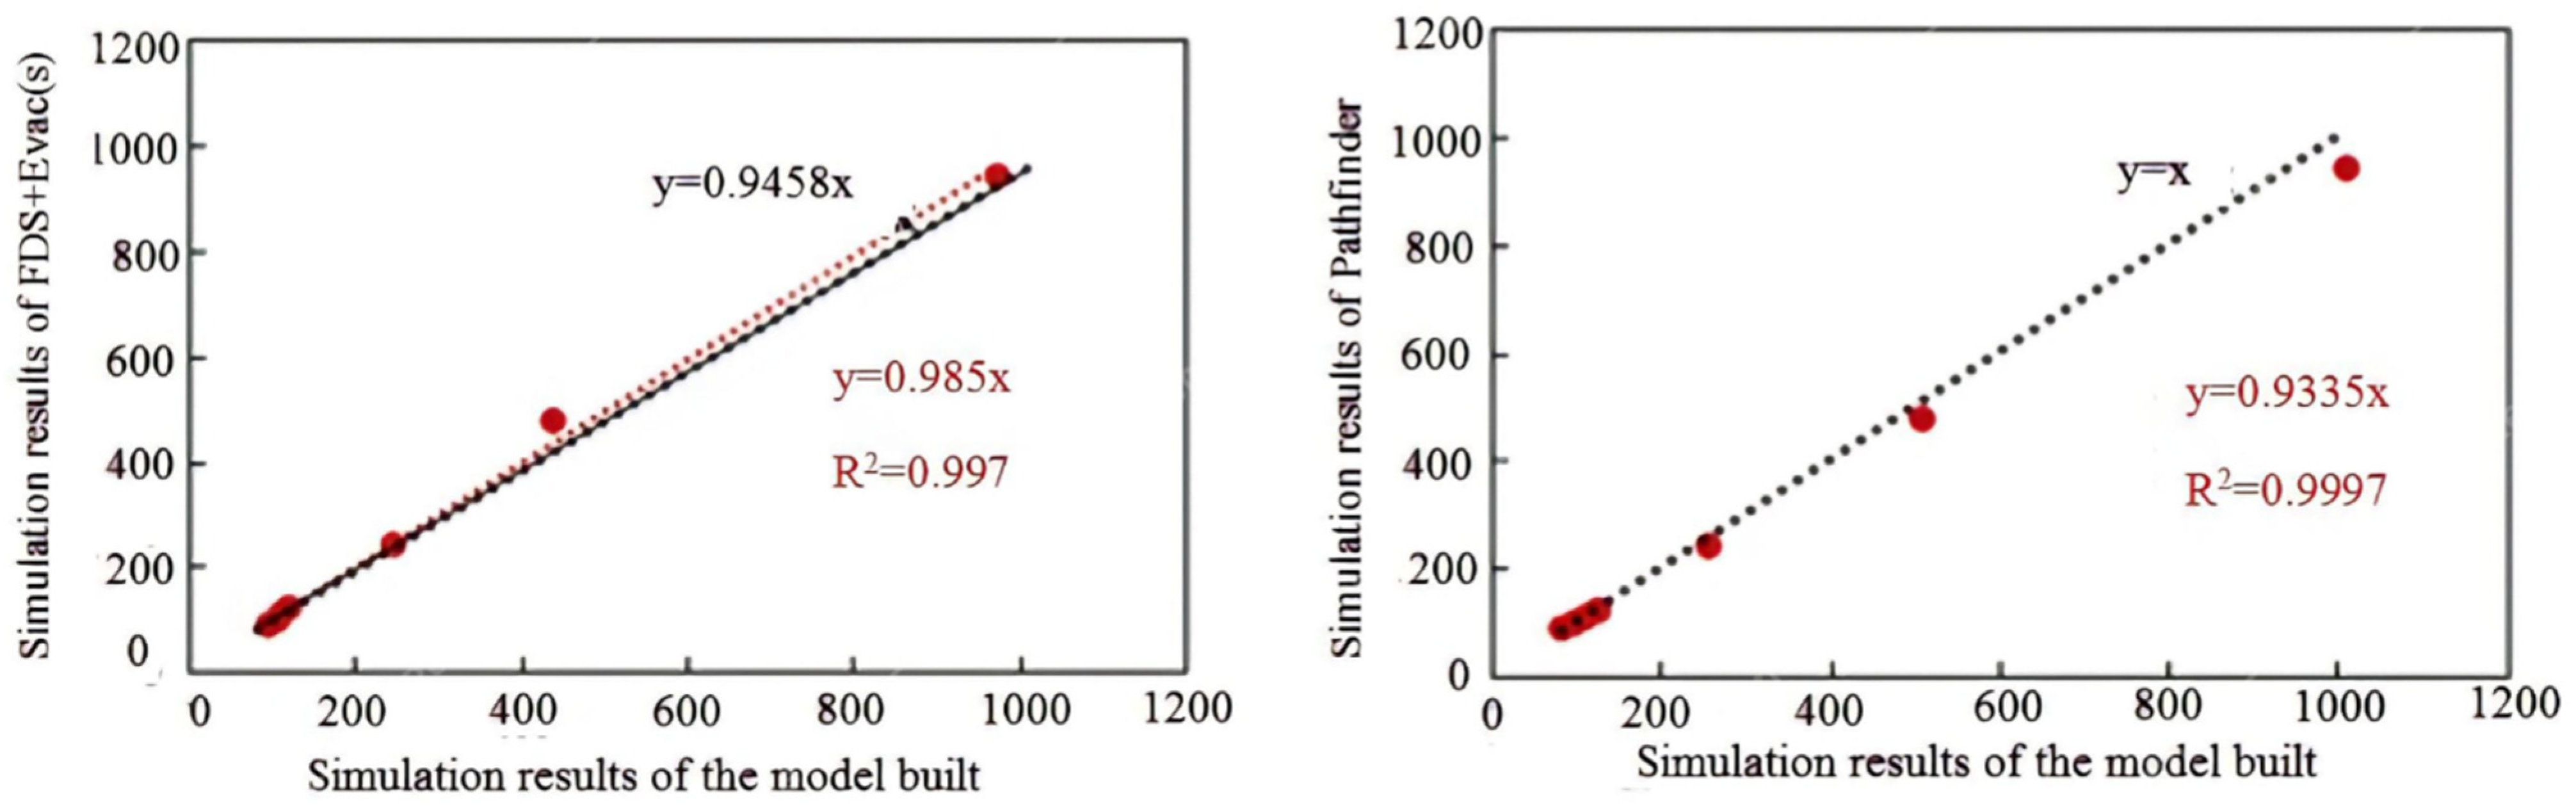
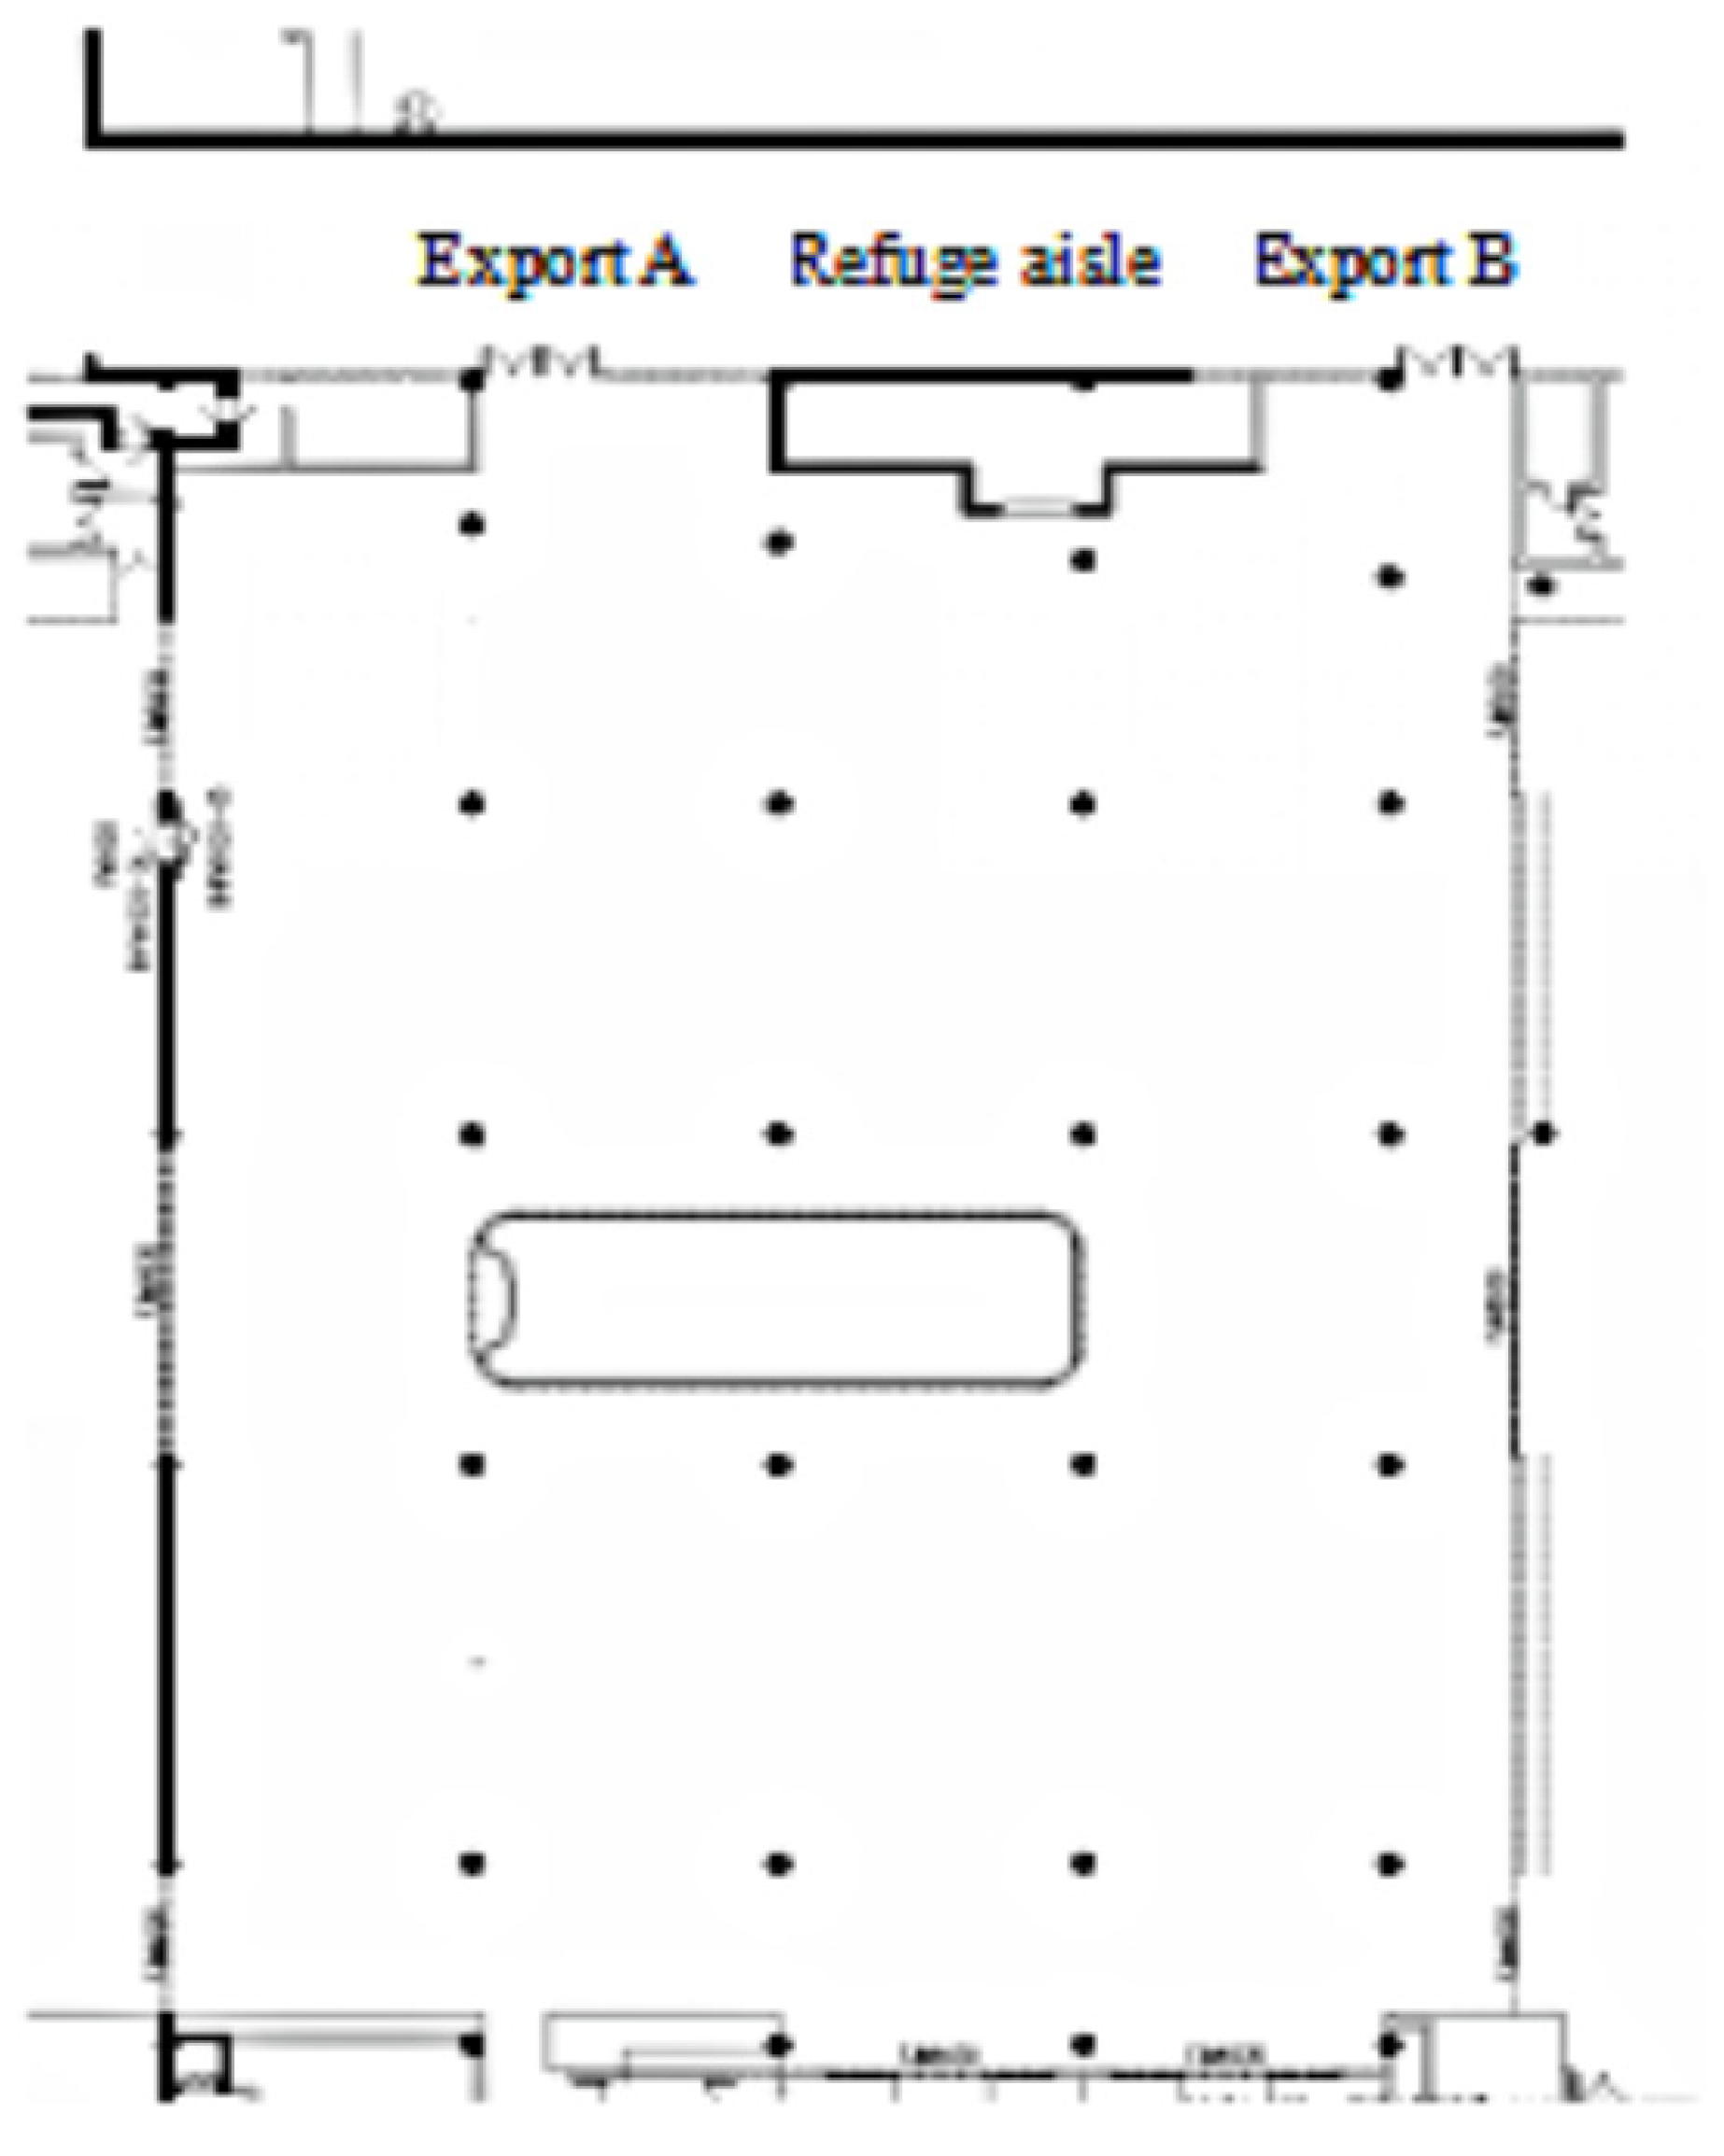
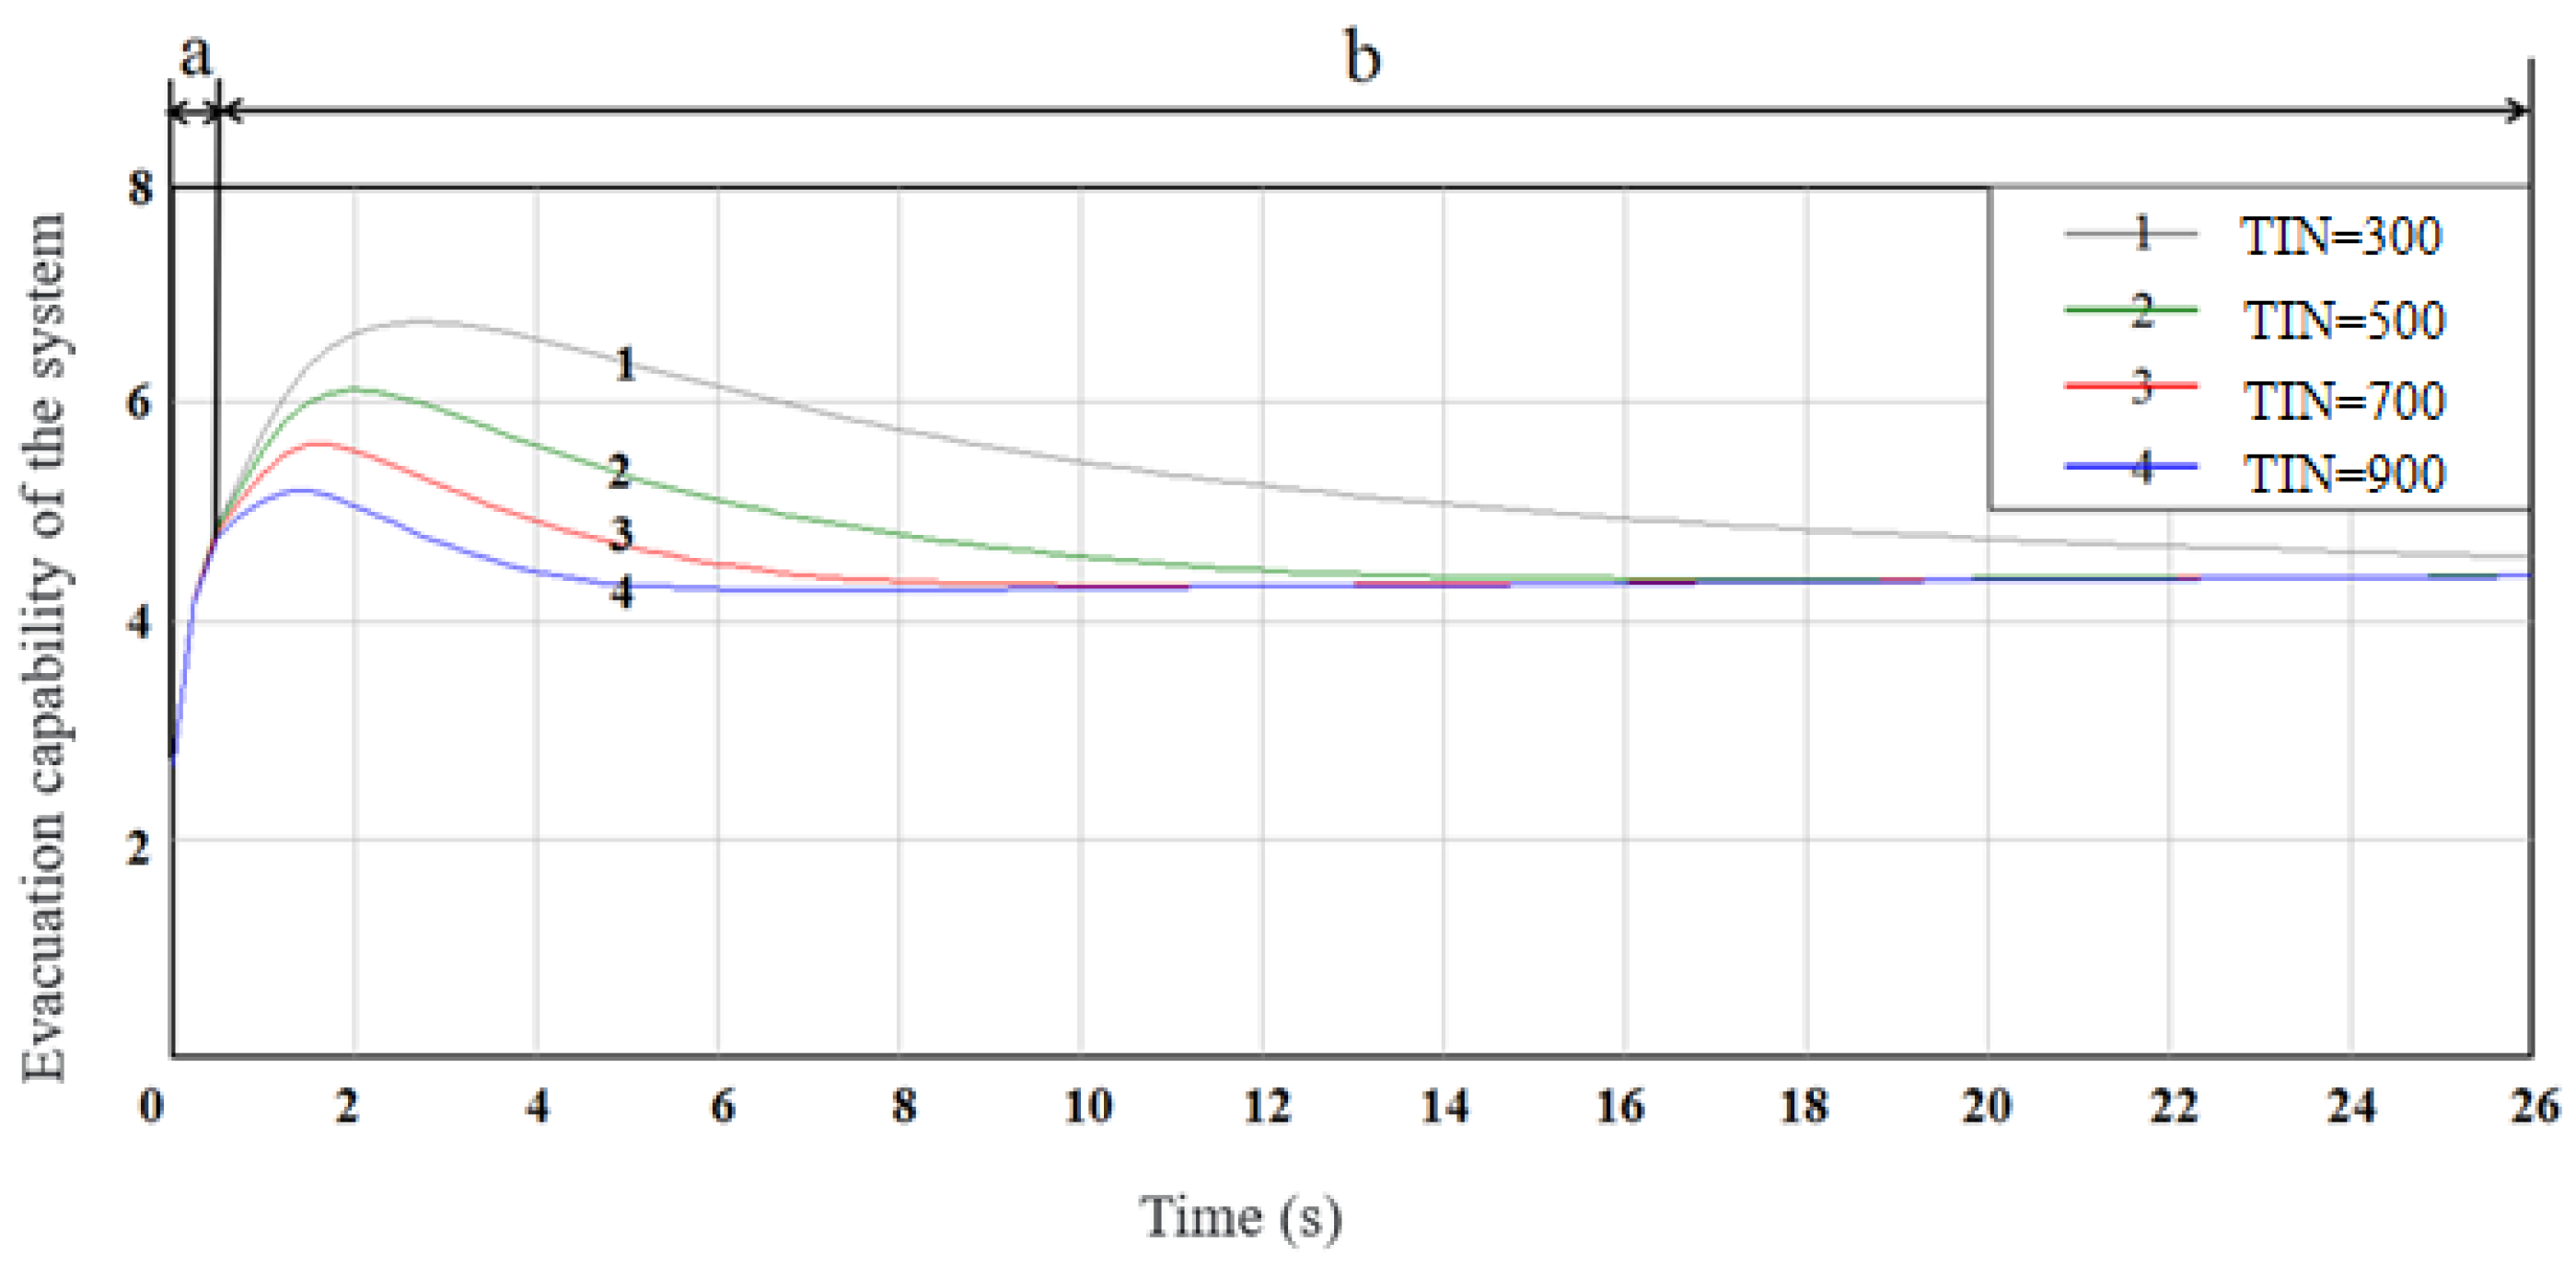
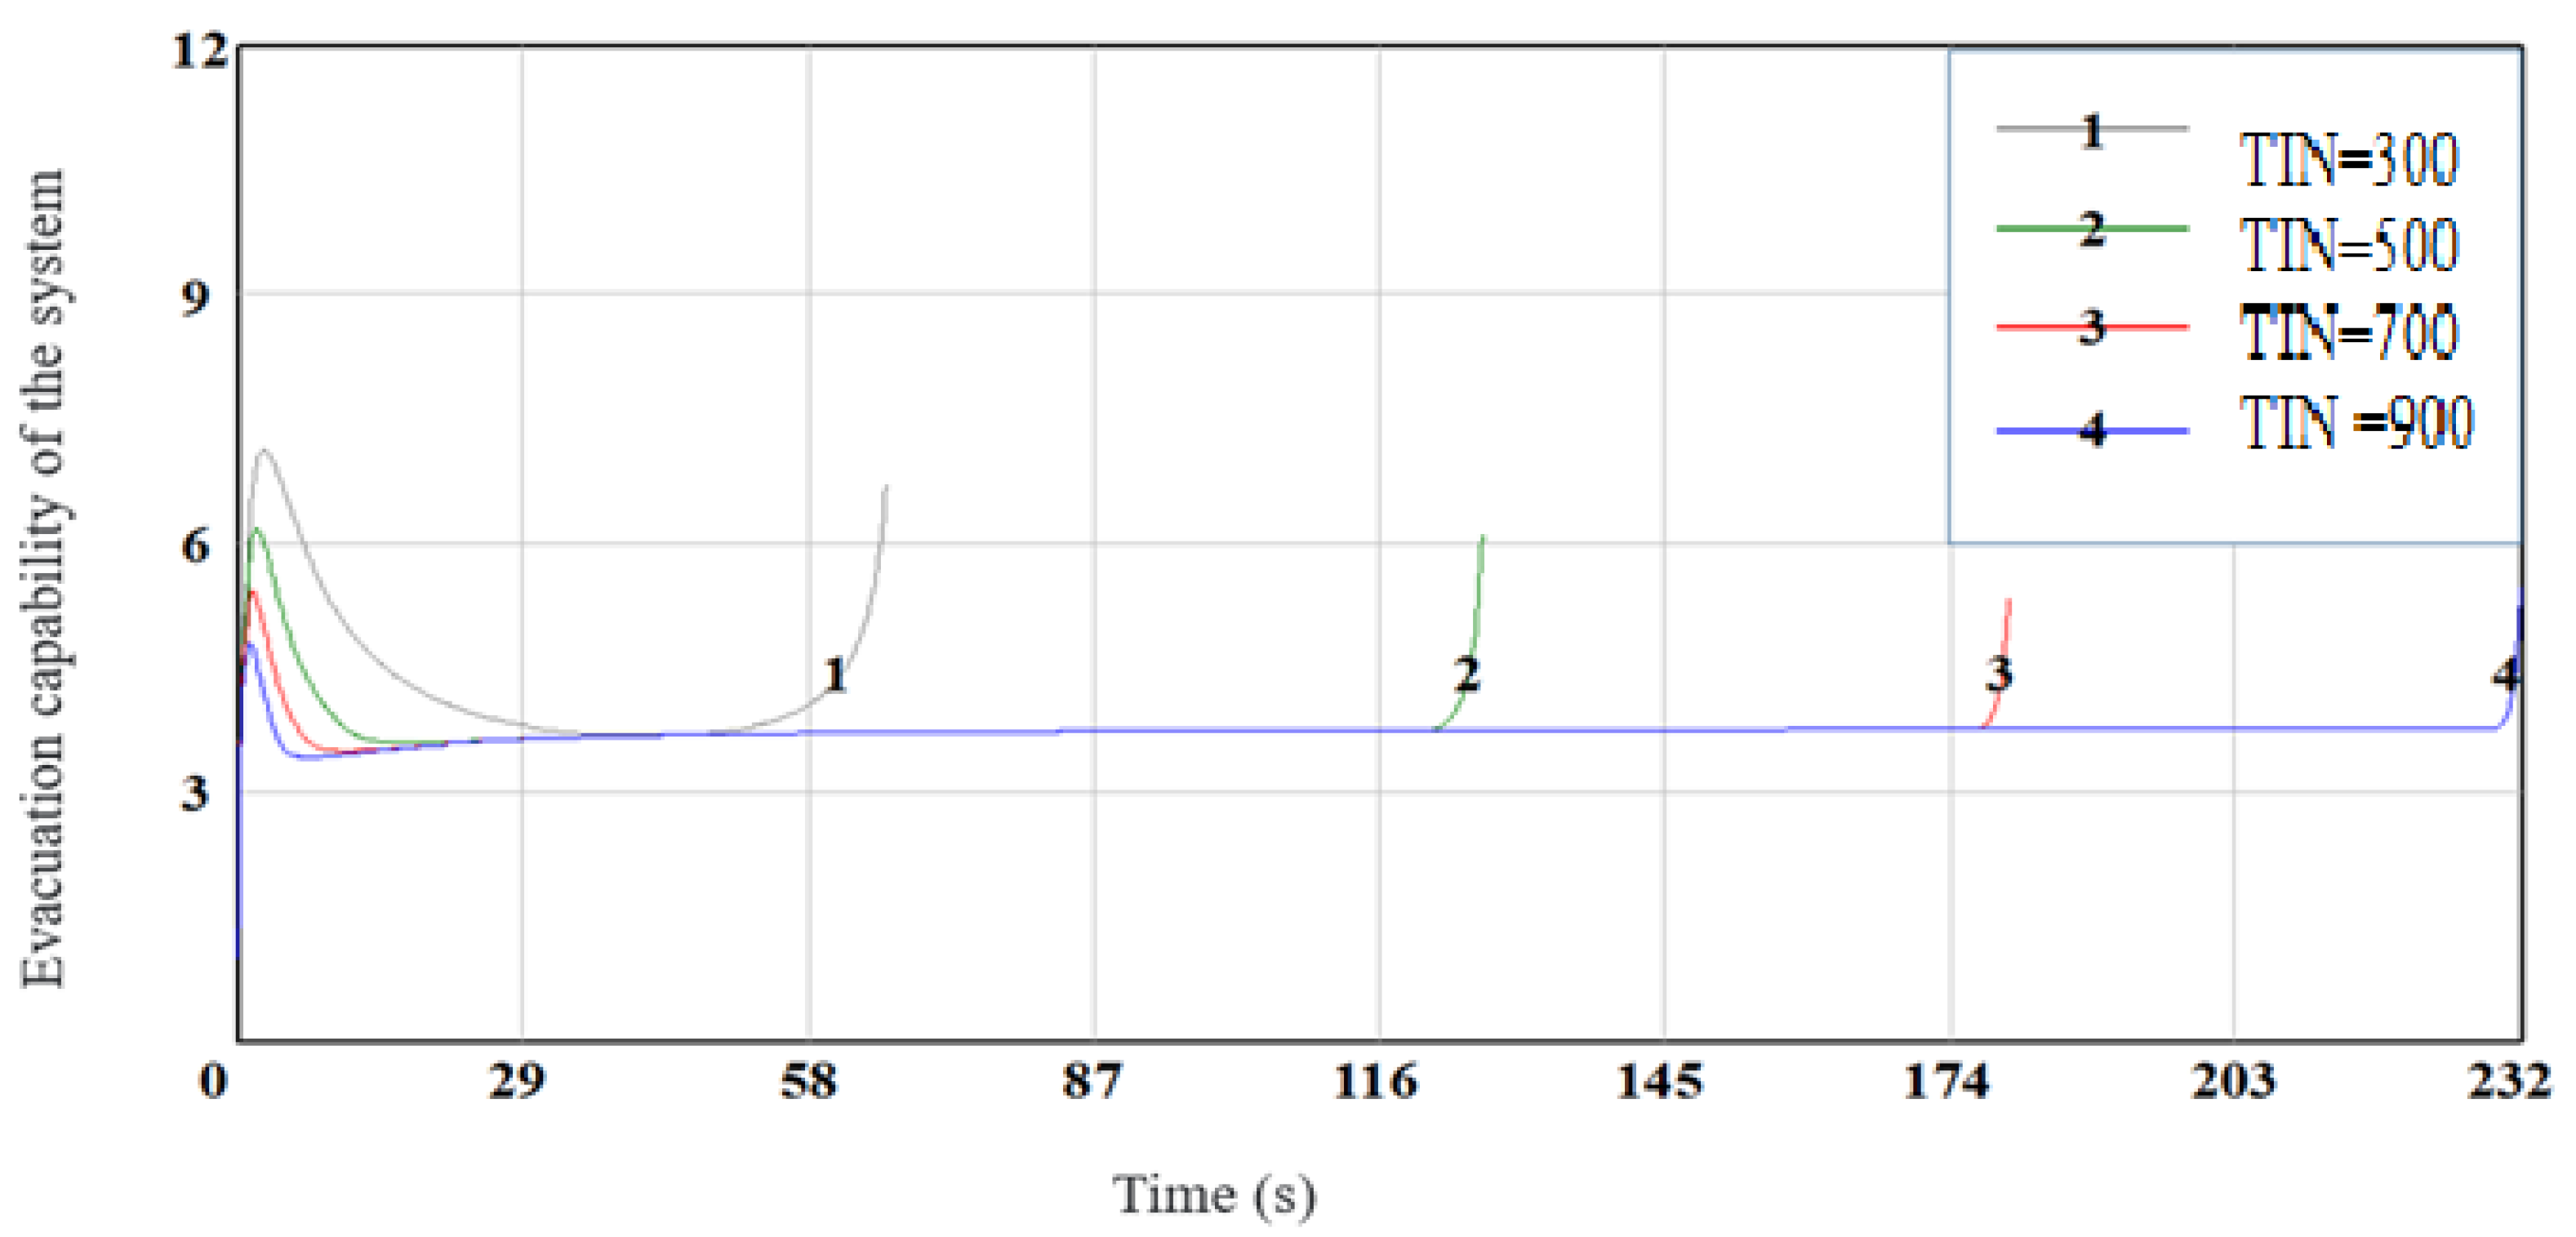
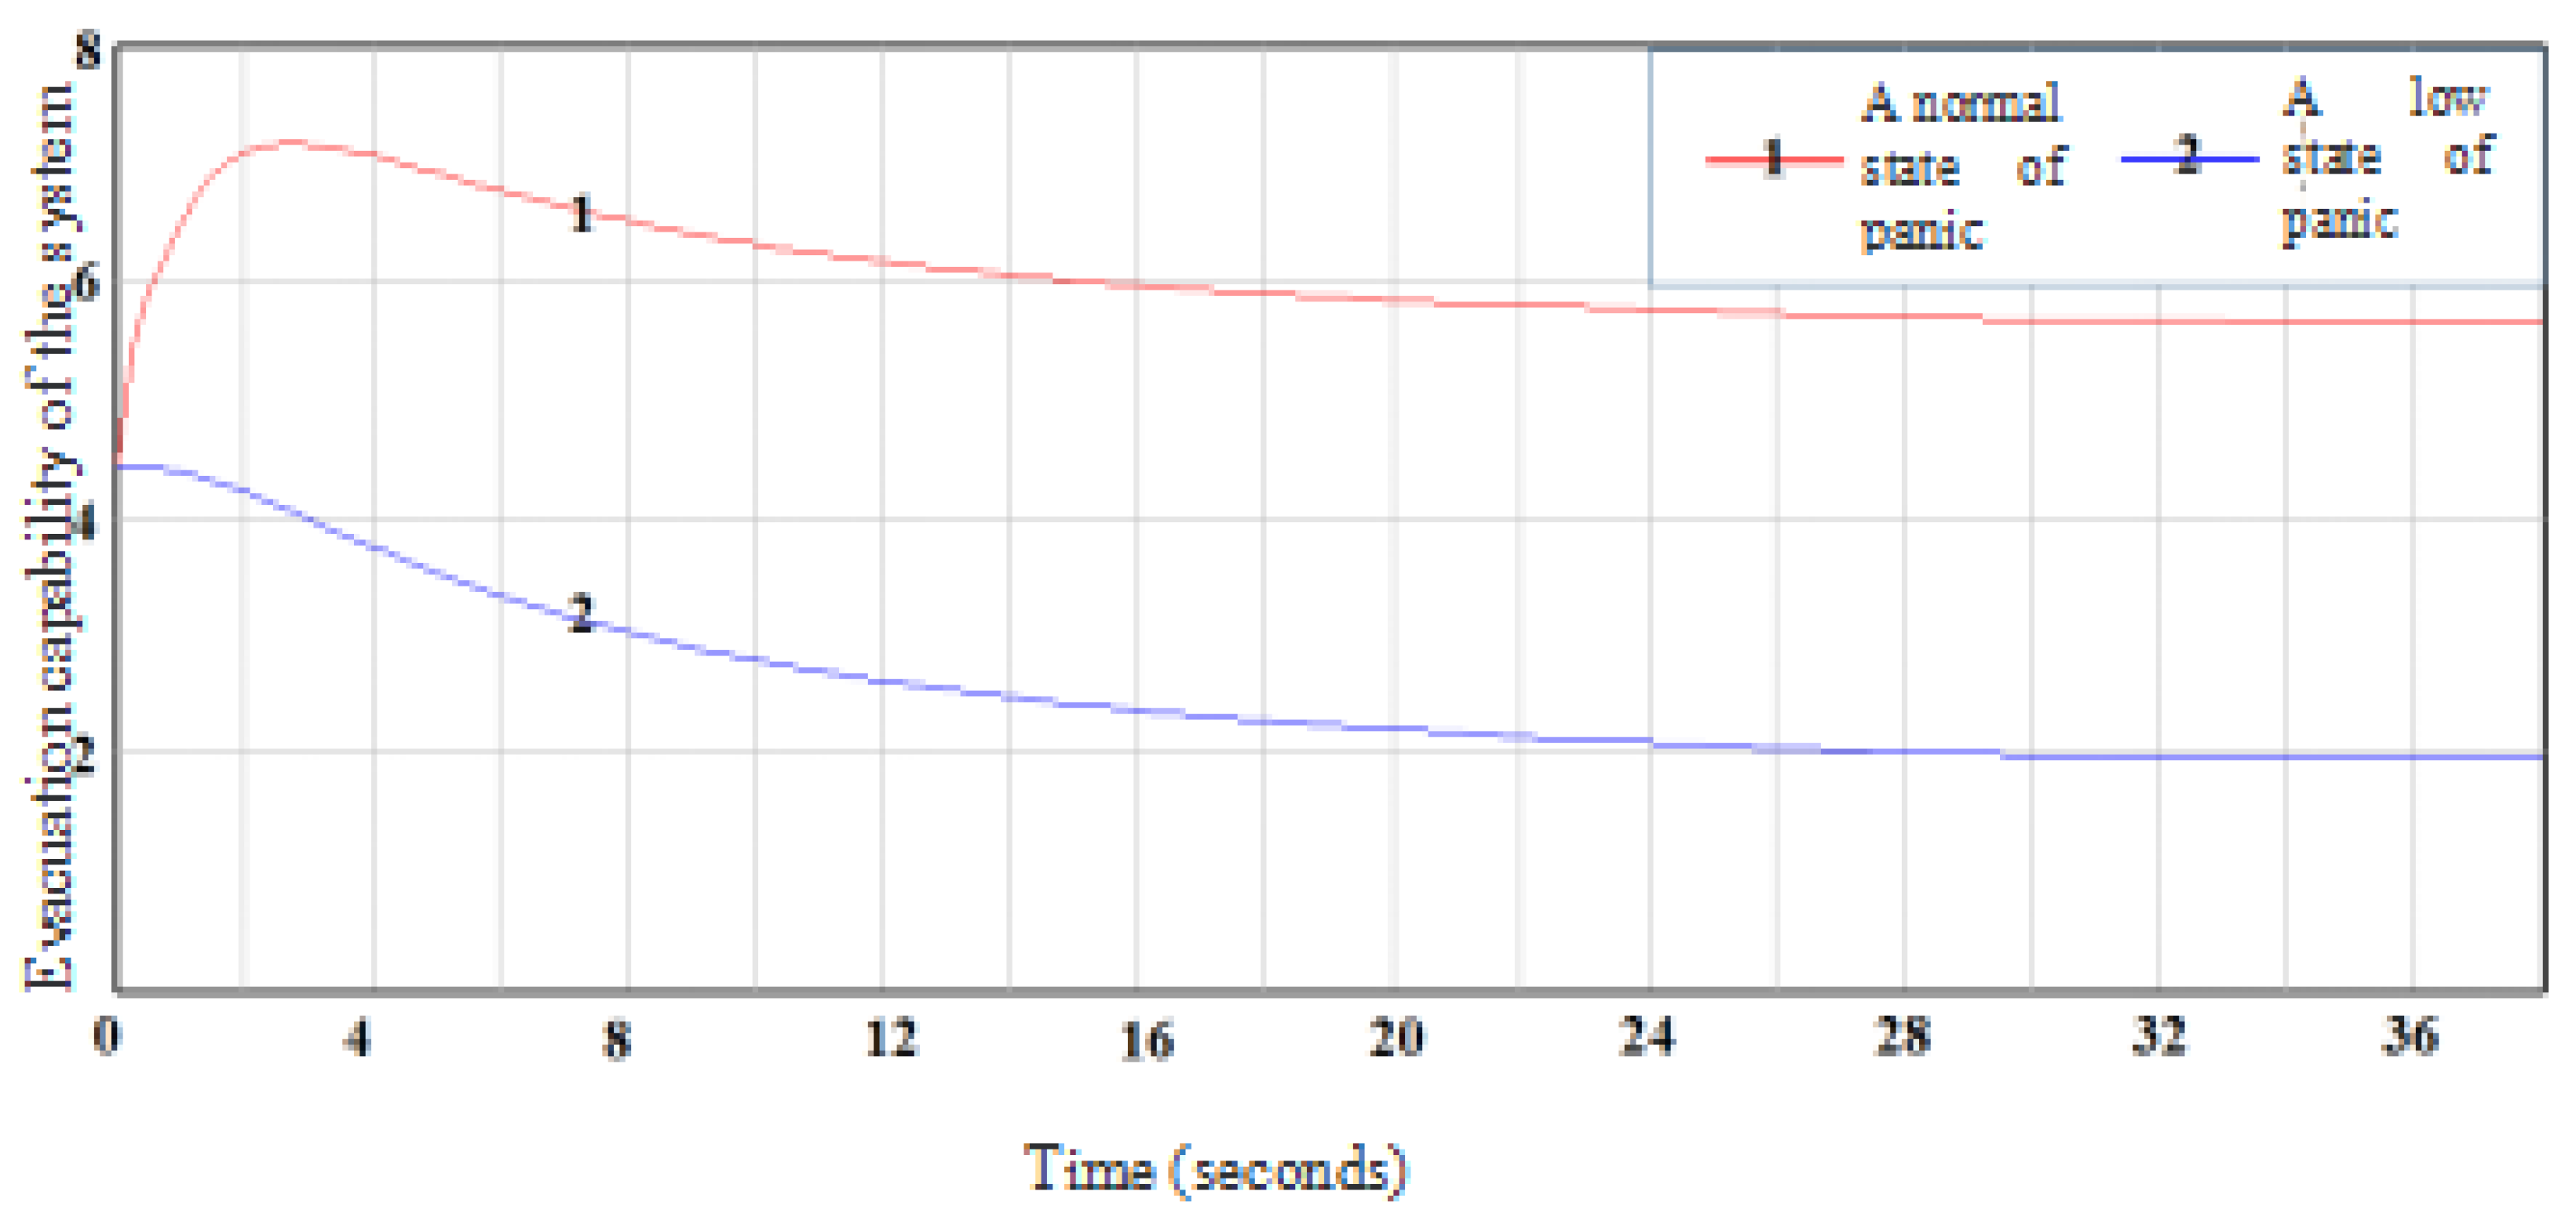
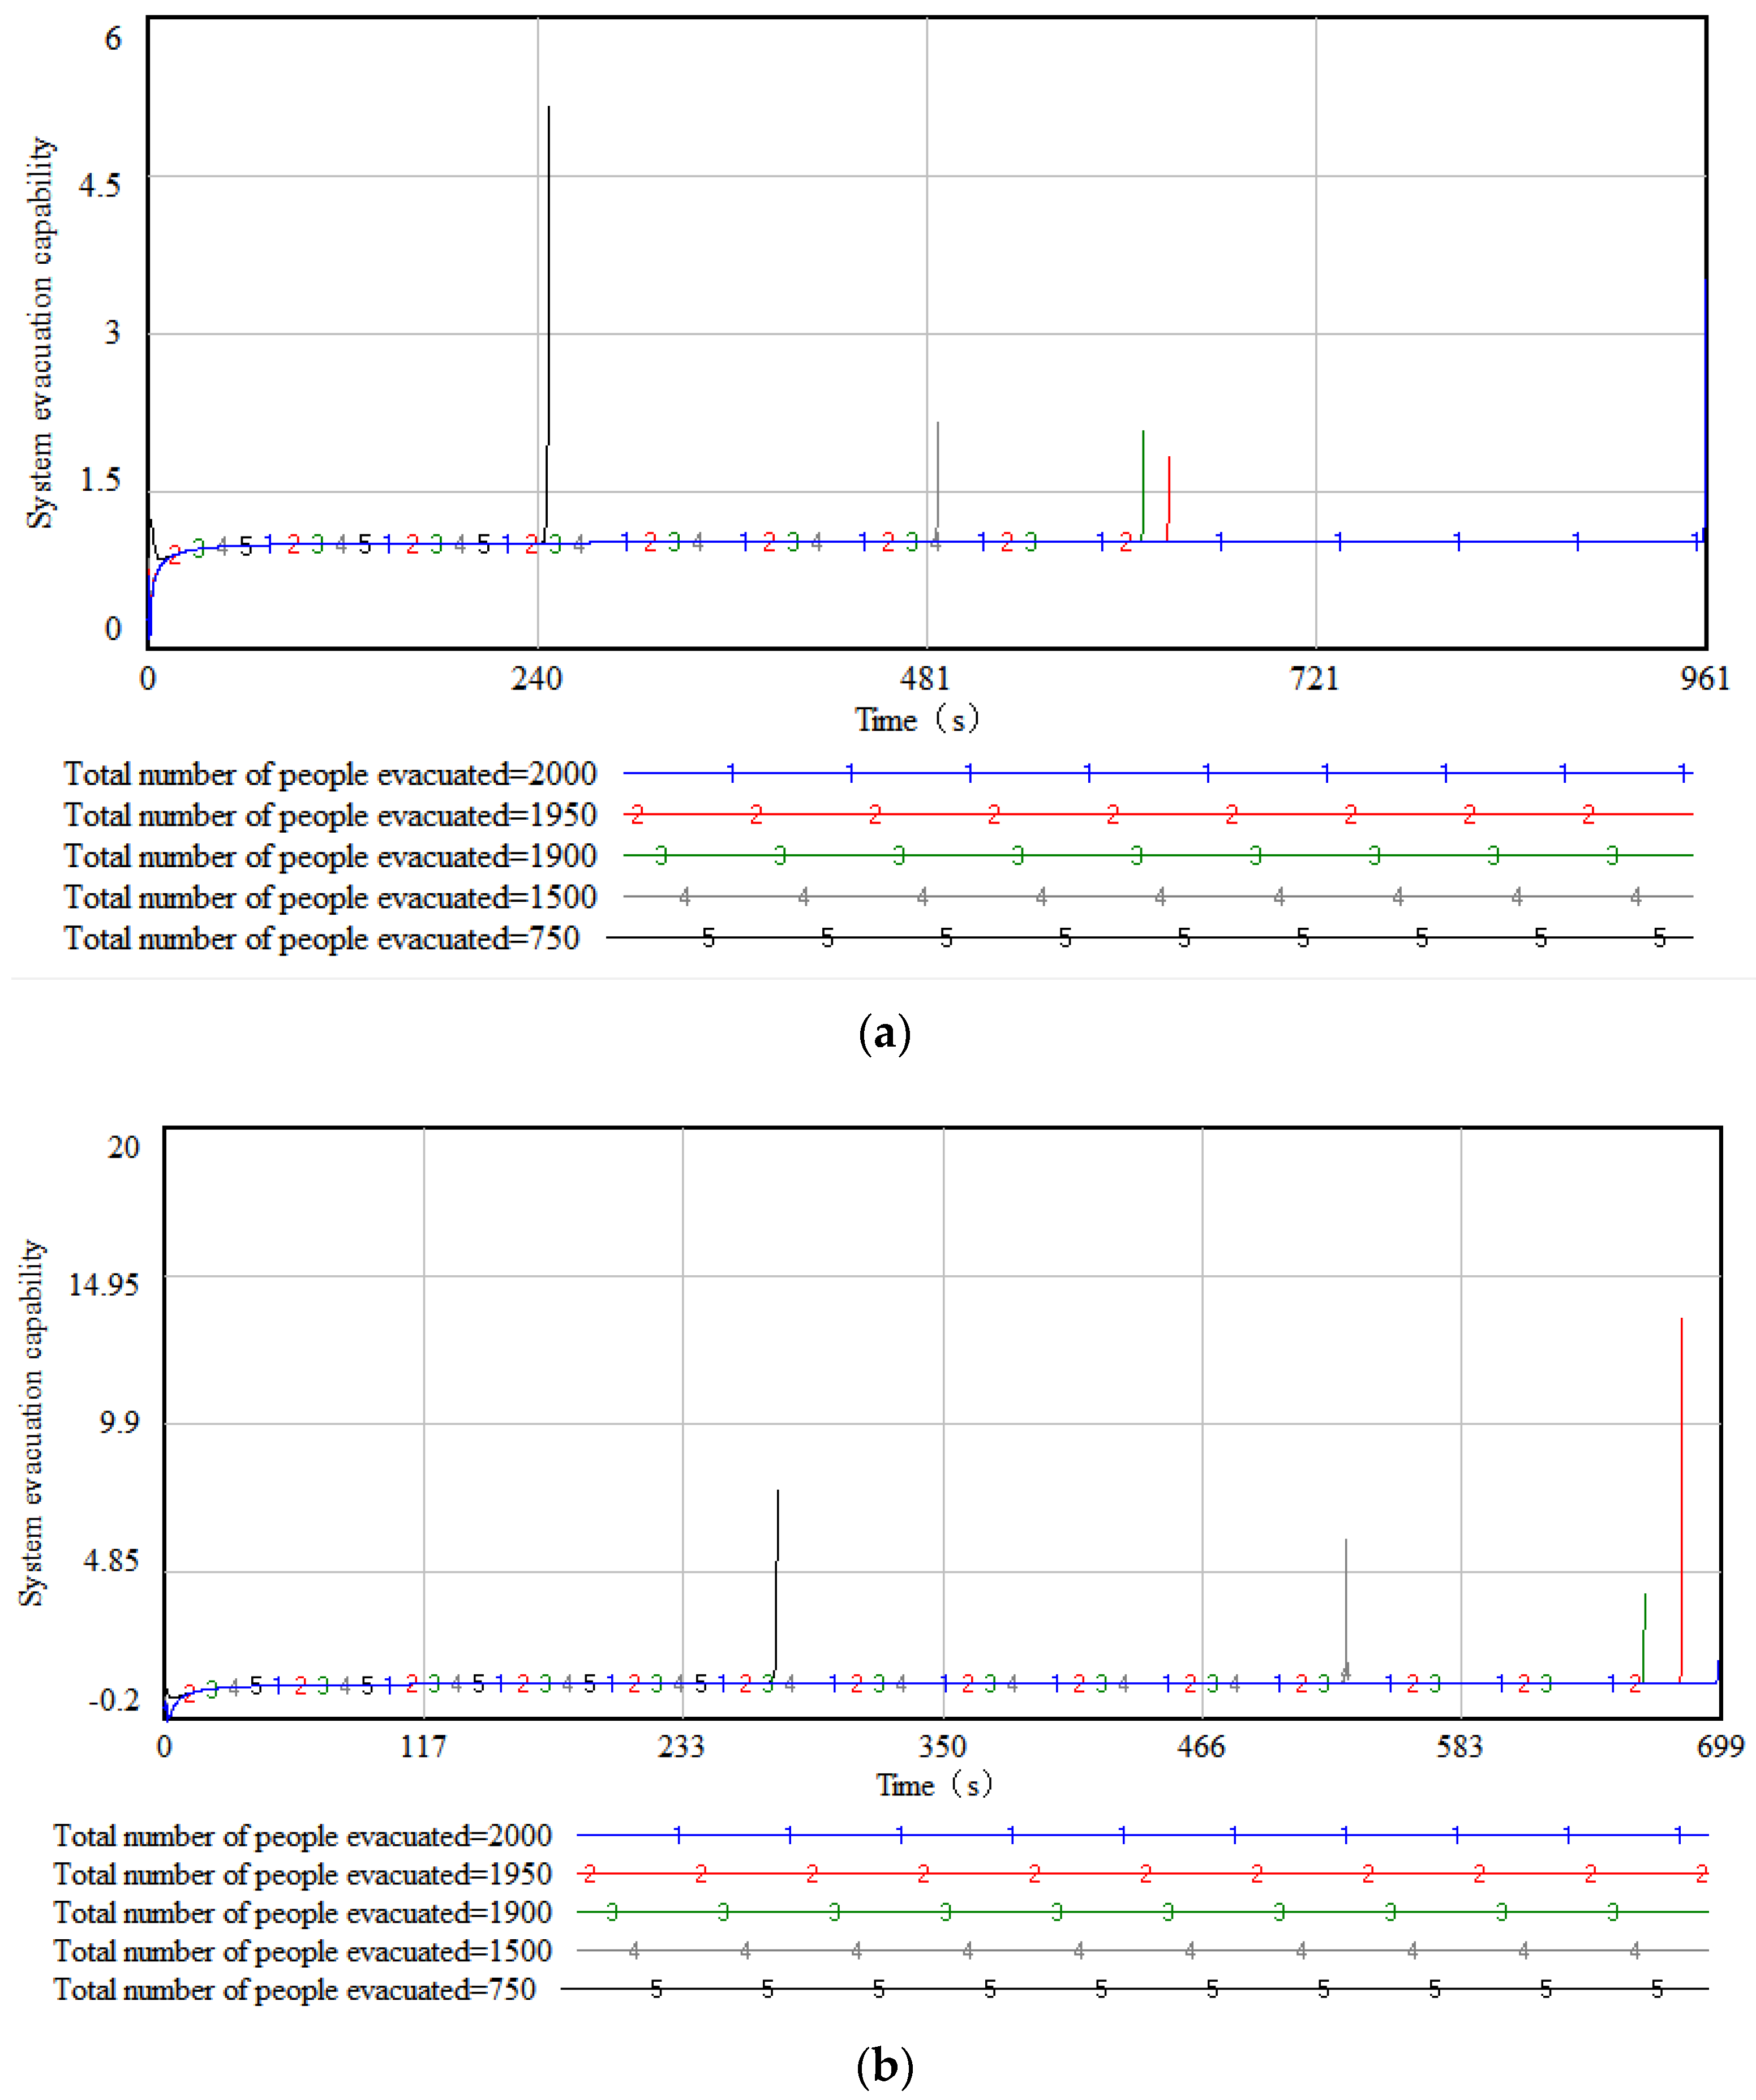
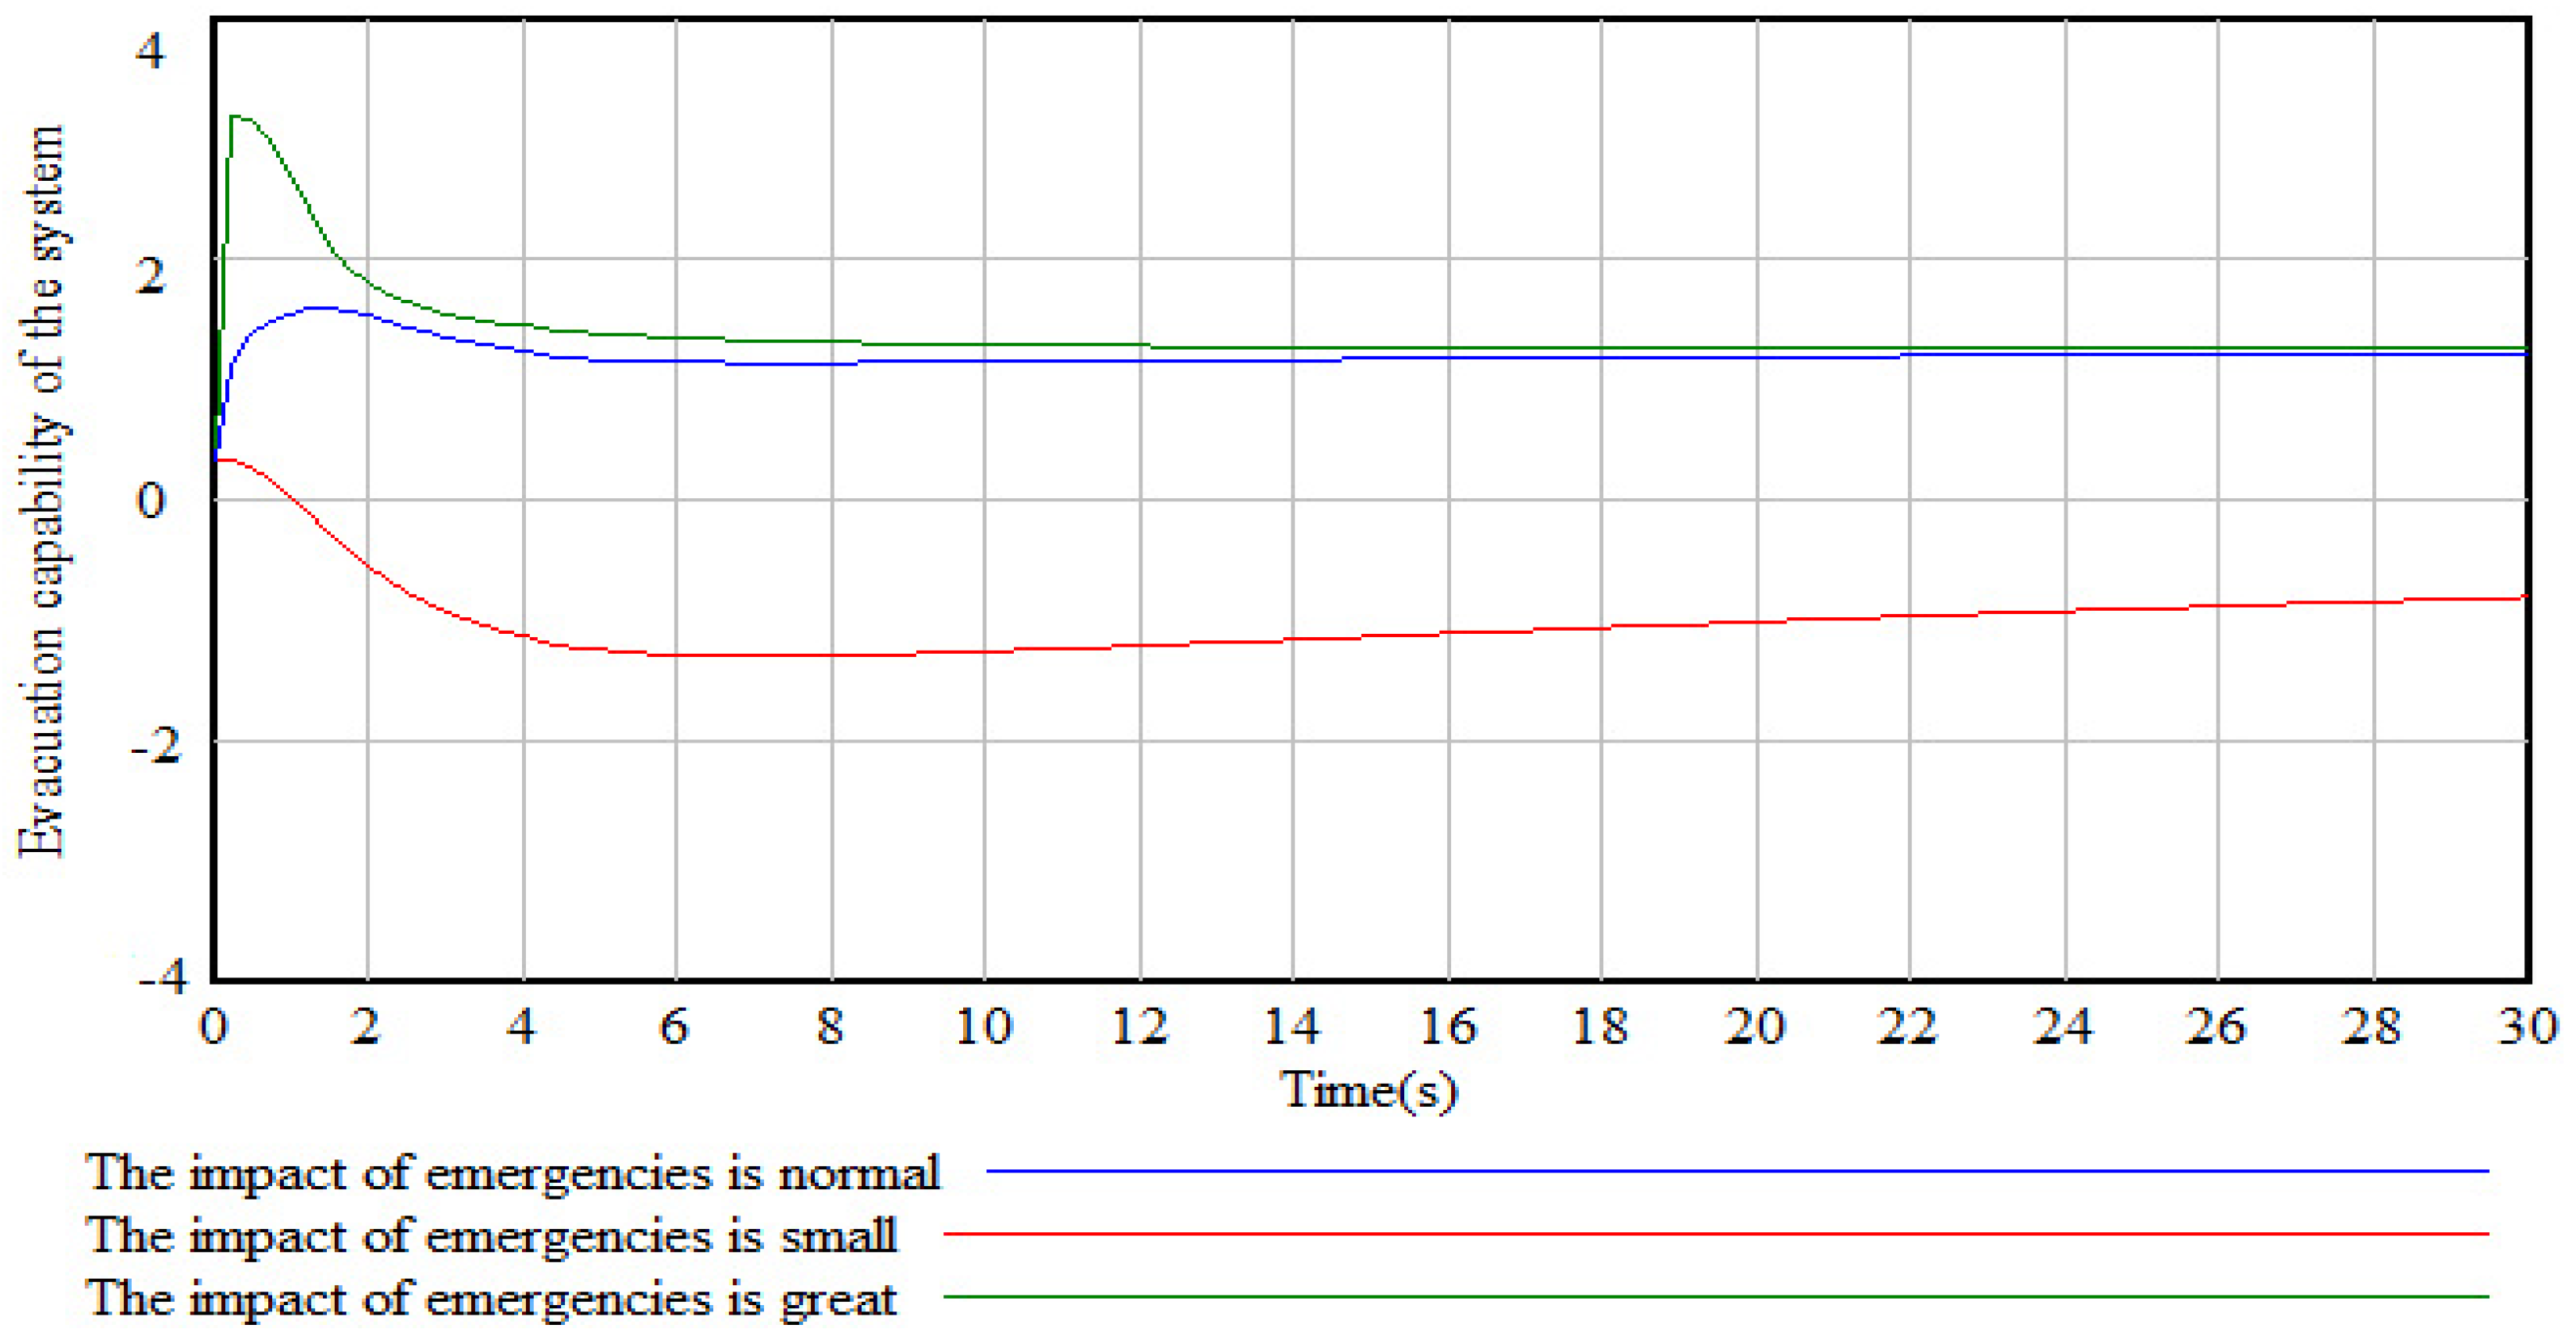
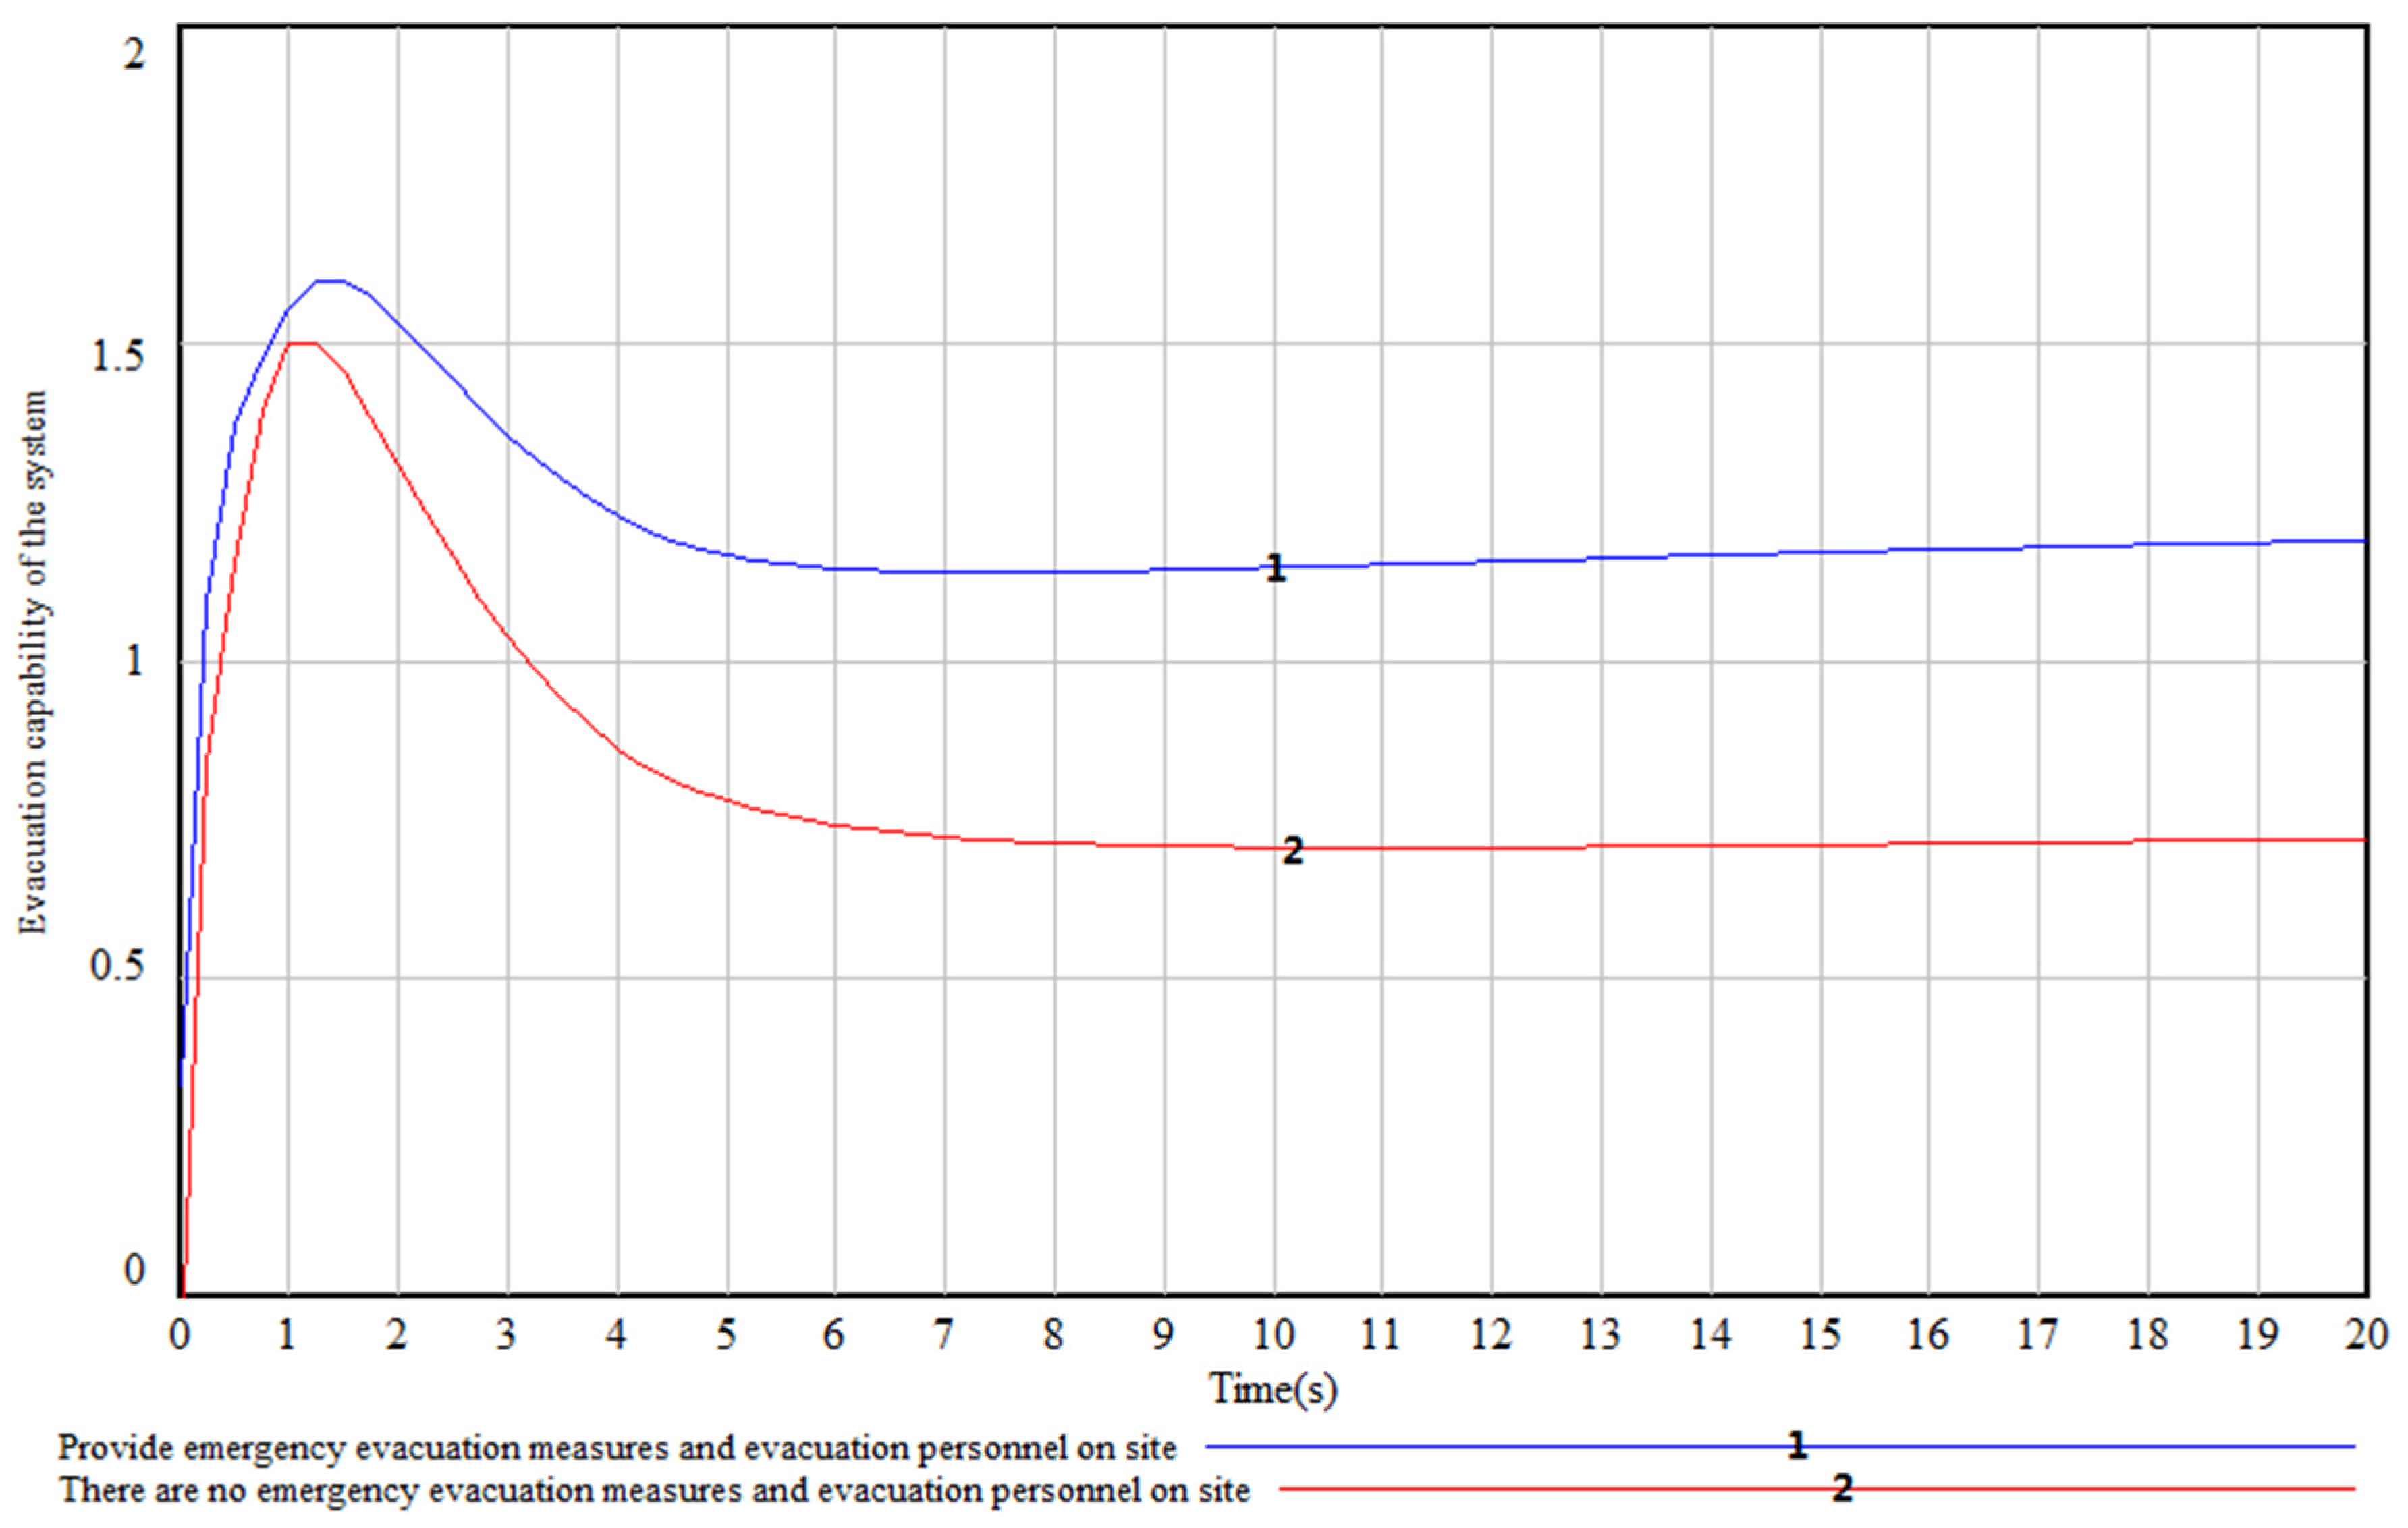
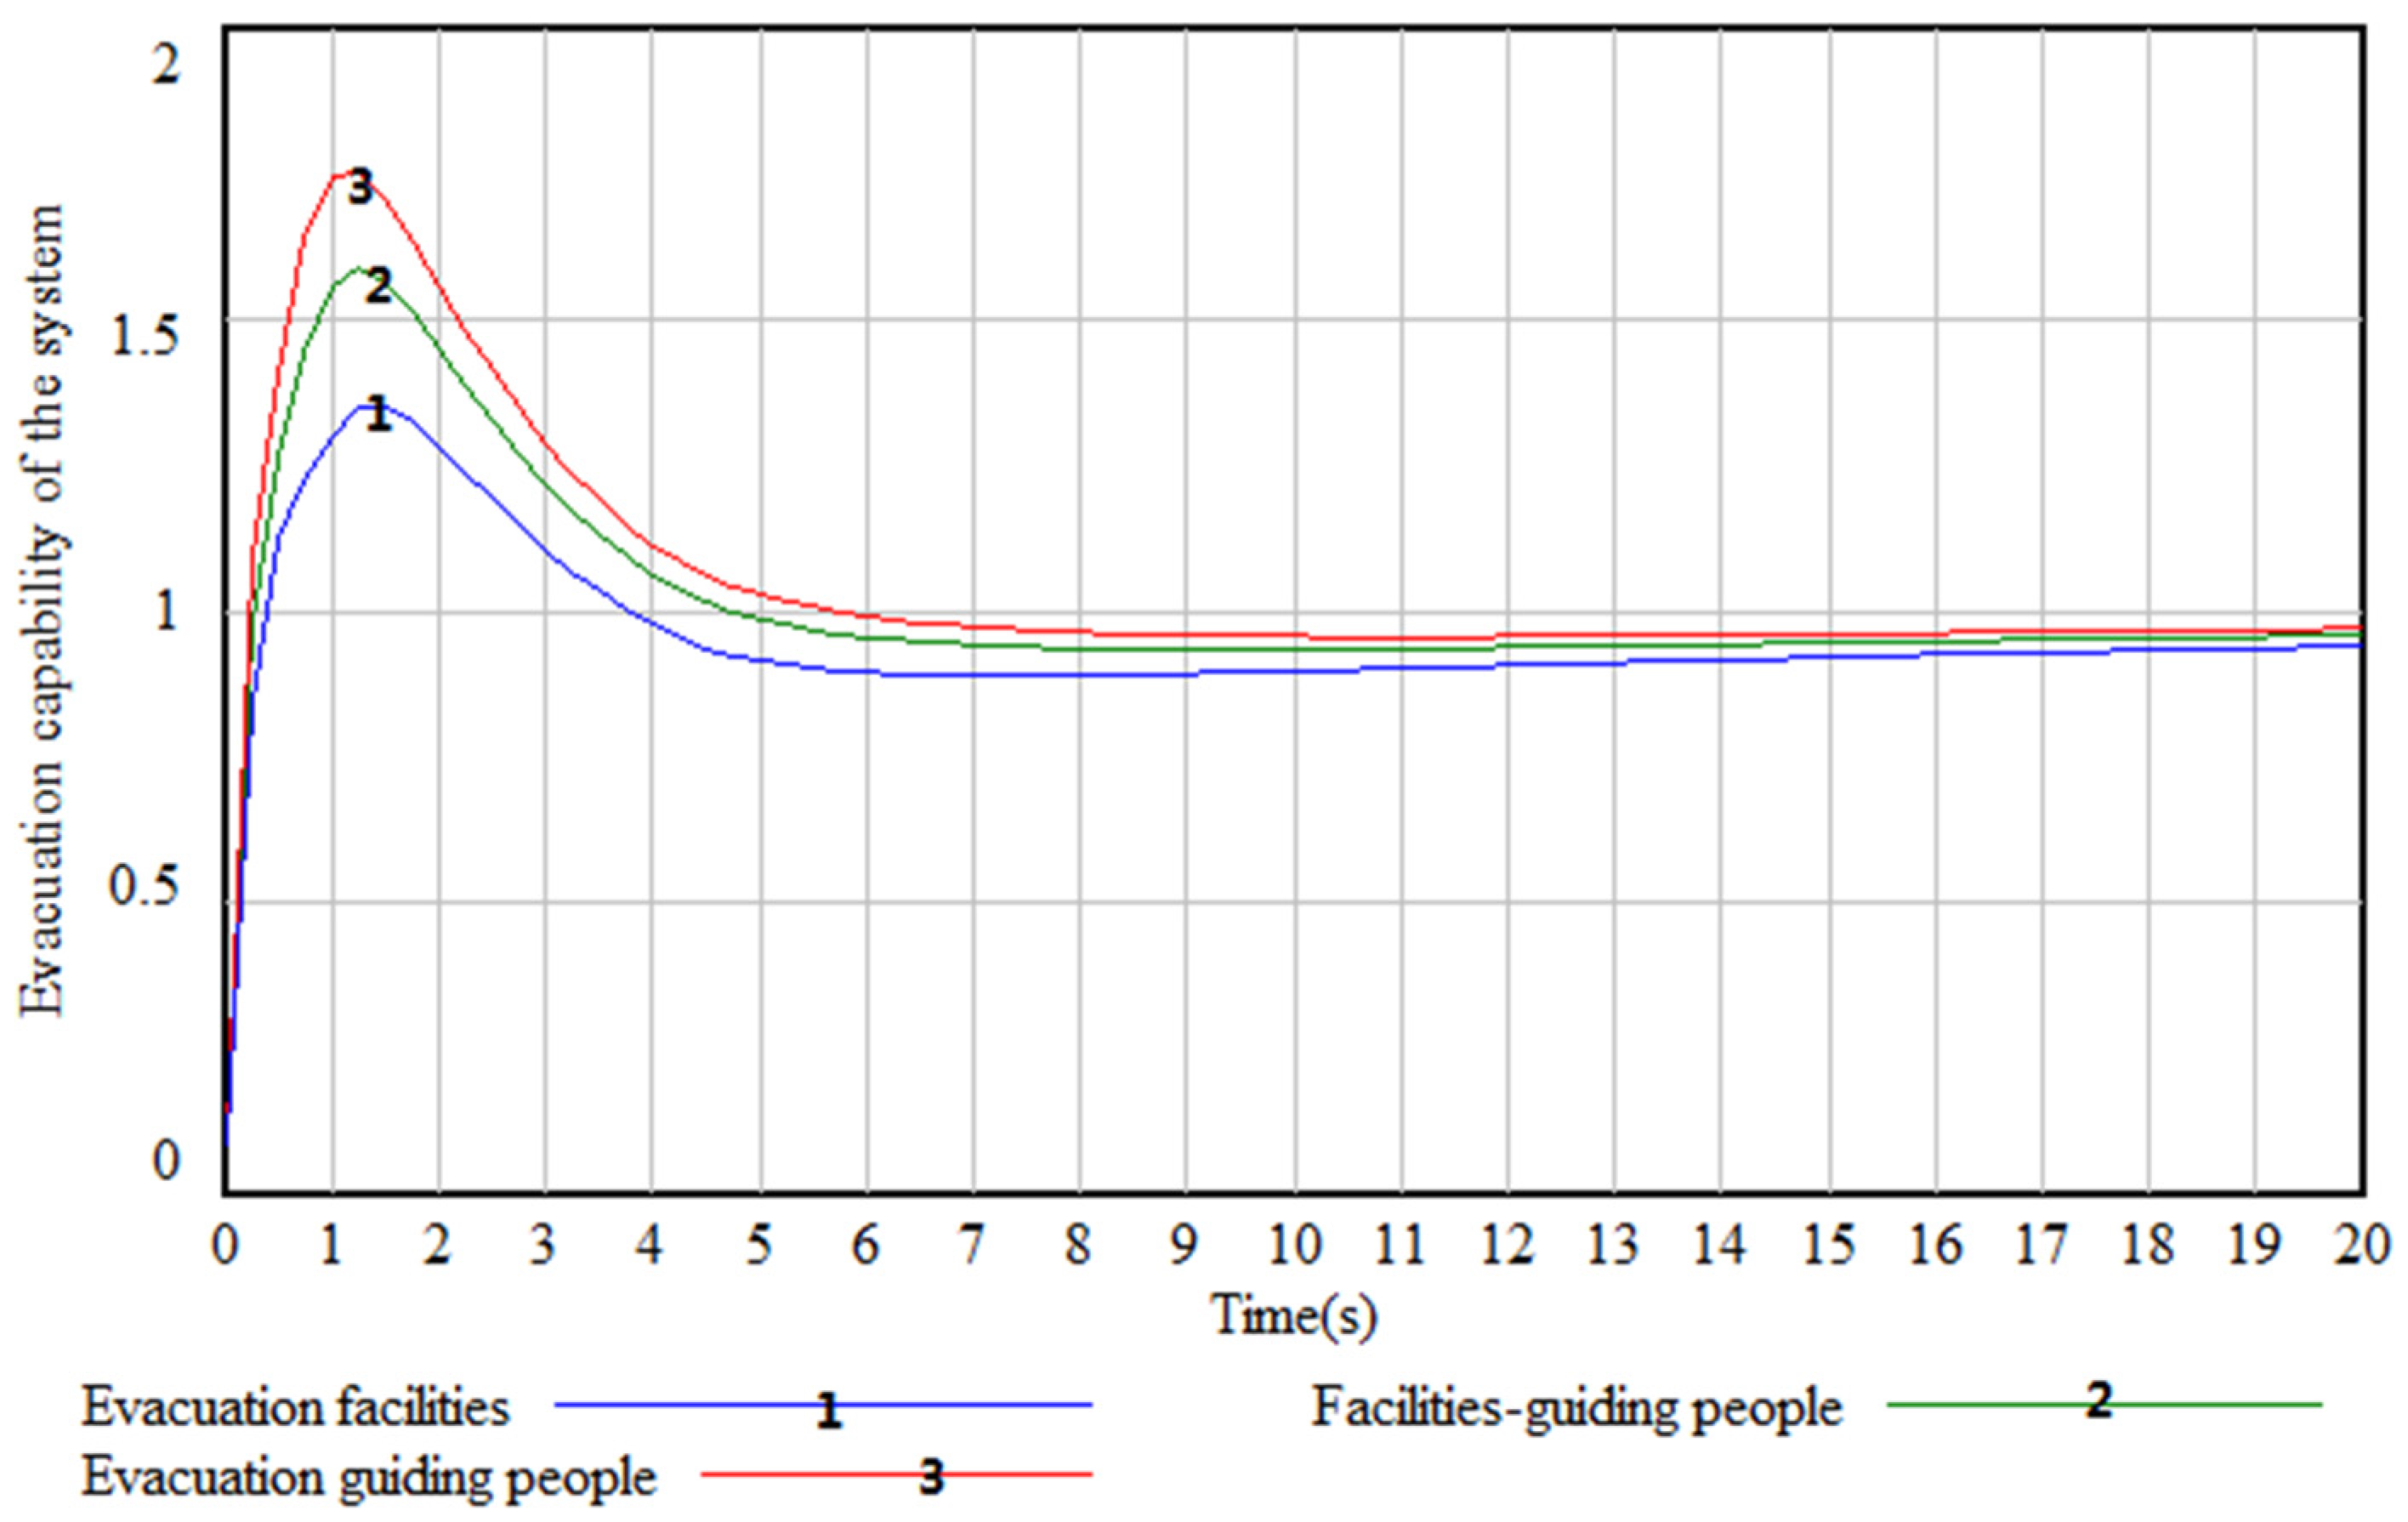
Table 1.
Summary of the domestic and foreign research results.
| Document Serial Number | Research Findings | Types of Models | Research Tools |
|---|---|---|---|
| [9] | Summarized the five types of the population during fire evacuation | Continuous fluid models | Database |
| [10] | Summarized the five most important components for the safety of the evacuees | Continuous fluid models | Scenario analysis and human behavioral responses were recorded by a fire video |
| [11,12,13,14,15] | Studied how evacuees can identify emergencies and respond in a fire | Continuous fluid models | Questionnaires, field visits, databases, structural equations models, empirical studies |
| [16,17] | When calculating the evacuation path, the factors of population movement changes during the evacuation were considered, and the optimal evacuation route was proposed | Continuous fluid models | Empirical studies, intelligent algorithm |
| [18] | Then, the intelligent guidance system can improve the evacuation effect | Continuous fluid models | Research databases |
| [19] | During evacuation, identification provides adequate path finding information and is critical to evacuation efficiency | Continuous fluid models | Empirical studies |
| [20,21,22] | Studied the importance that people perceive, interpret, and use the information provided by the identification system | Continuous fluid models | Empirical studies |
| [23,24,25] | Improving the effectiveness of the identification system and awareness of evacuees is critical to fire evacuation; based on technological advances, the use of modern identification systems indicates the path to the optimal exit in a clearer and simpler representation | Continuous fluid models | Intelligent algorithm, empirical studies, questionnaires |
| [26,27] | Understanding and improving people observing and interpreting signs during an evacuation can significantly improve the safety of evacuees during a fire | Continuous fluid models | Fuzzy consistent matrix, analytic hierarchy process, case analysis, micro-simulation tools |
| [29] | Complex nonlinear interactions between individuals and the environment occur, rather than a simple linear superposition, during group evacuation | Continuous fluid models | Qualitative simulation model |
| [30,31] | Complex nonlinear interactions between individuals and the environment occur, rather than a simple linear superposition, during group evacuation | Discrete models | Traditional game theory |
| [32] | Explored the interaction process between participants in the discrete evacuation model | Discrete models | Simulation of evacuation processes using a bionics-inspired cellular automaton model for pedestrian dynamics |
| [33] | Evacuation models will contain a variety of information, energy intersections, and conflicts in complex systems, leading to group trends or group confusion | Discrete models | Questionnaires |
| [34] | Large-scale group evacuation behavior is a complex social system behavior, and traditional evacuation models fail to accurately model and quantify numbers | Discrete models | Mathematical modeling, system dynamics, qualitative simulation model, case analysis, intelligent algorithm, a dynamic network flow approach considering the general laws of evacuation priority and disaster diffusion |
Table 2.
Comparison of evacuation results for different exit distributions.
| Exit Distribution | Evacuation Time | Result Bias |
|---|---|---|
| Exit in the same direction | 335.1 s | / |
| Adjacent distribution of exit | 343.5 s | 2.5% |
| Exit distribution | 328.3 s | 2.0% |
Table 3.
Variable classifications of the model.
| Categories | Variable Name |
|---|---|
| State variable | Number of evacuees (NE) |
| Number of people exiting (NPE) | |
| State of panic (SP) | |
| Rate variable | System evacuation capability (SEC) |
| Exit personnel growth rate (EPGR) | |
| Number of people to be evacuated (NPE) | |
| Degree of order of people (DOP) | |
| The rate at which fear increases (TRFI) | |
| Rate of reduction of personnel (RRP) | |
| Instrumental variable | Total initial number (TIN) |
| Emergency (EG) | |
| Evacuation leader (EL) | |
| Emergency evacuation lighting system (EELS) | |
| Exit quantity (EQ) | |
| Exit area (EA) |
Table 4.
Dynamo equation of the dynamics model of large-scale crowd evacuation system.
| Variable | Types of Variables | DYNAMO Equation |
|---|---|---|
| PM | LEV | |
| EP | LEV | |
| PIS | LEV | |
| ONP | AUX | Constant; set according to different initial populations |
| EI | AUX | Constant; set to 0 (100) to indicate that no (occurrence) incident has occurred |
| EGP | AUX | Constant |
| FEI | AUX | Constant |
| PFAA | AUX | Constant |
| NOE | AUX | Constant; set according to the actual situation |
| AOE | AUX | Constant; set according to the actual situation |
| WFE | RAT | |
| IRPIS | RAT | |
| DOO | RAT | |
| ECS | RAT | |
| IRPM | RAT | |
| DOE | RAT |
Table 5.
Comparison of simulation results.
| Number of Occupants | Simulated Results | Simulation Time | ||||||
|---|---|---|---|---|---|---|---|---|
| Model of This Study | Pathfinder | FDS+Evac | Model of This Study | Pathfinder | FDS+Evac | |||
| Evacuation Time | Evacuation Time | Deviation | Evacuation Time | Deviation | ||||
| 350 | 83.5 s | 88.5 s | 5.99% | 96.2 | 15.21% | 1 s | 5.1 s | 18 s |
| 400 | 98.5 s | 98.3 s | 0.20% | 106.9 | 8.53% | 1 s | 6.1 s | 20 s |
| 450 | 112.75 s | 109.8 s | 2.62% | 111.8 | 0.84% | 1 s | 7.7 s | 23 s |
| 500 | 126.75 s | 121.8 s | 3.91% | 121.3 | 4.30% | 1 s | 11.3 s | 30 s |
| 1000 | 257.5 s | 241.3 s | 6.29% | 247 | 4.08% | 1 s | 29.6 s | 181 s |
| 2000 | 510 s | 476.5 s | 6.57% | 439.3 | 13.86% | 1 s | 103.6 s | 657 s |
| 4000 | 1011.5 s | 941.3 s | 6.94% | 974 | 3.71% | 1 s | 426.2 s | 3678 s |
Table 6.
End of evacuation time for different initial numbers.
| Initial Number | Evacuation Time | Compliance with Regulatory Requirements |
|---|---|---|
| 300 | 67.25 s | Yes |
| 386 | 94.5 s | Yes |
| 500 | 126.75 s | No |
| 700 | 180 s | No |
| 900 | 232 s | No |
Table 7.
Comparison of panic level settings.
| Panic State | Value | Representation Function |
|---|---|---|
| Normal | SP | TRFI × 2 + DELAY1(IF THEN ELSE (EG > 0, 10, 0), 2) |
| Lower | SP/100 | TRFI × 2 + DELAY1(IF THEN ELSE (EG > 0, 10, 0), 2))/100 |
Publisher’s Note: MDPI stays neutral with regard to jurisdictional claims in published maps and institutional affiliations. |
© 2022 by the authors. Licensee MDPI, Basel, Switzerland. This article is an open access article distributed under the terms and conditions of the Creative Commons Attribution (CC BY) license (https://creativecommons.org/licenses/by/4.0/).
Share and Cite
MDPI and ACS Style
Li, X.; Chen, W.; Wang, C.; Kassem, M.A. Study on Evacuation Behavior of Urban Underground Complex in Fire Emergency Based on System Dynamics. Sustainability 2022, 14, 1343. https://doi.org/10.3390/su14031343
AMA Style
Li X, Chen W, Wang C, Kassem MA. Study on Evacuation Behavior of Urban Underground Complex in Fire Emergency Based on System Dynamics. Sustainability. 2022; 14(3):1343. https://doi.org/10.3390/su14031343
Chicago/Turabian StyleLi, Xiaojuan, Weibin Chen, Chen Wang, and Mukhtar A. Kassem. 2022. "Study on Evacuation Behavior of Urban Underground Complex in Fire Emergency Based on System Dynamics" Sustainability 14, no. 3: 1343. https://doi.org/10.3390/su14031343
Note that from the first issue of 2016, this journal uses article numbers instead of page numbers. See further details here.