
Impact of Environmental Factors and System Structure on Bioretention Evaporation Efficiency
by
 , and
, and
Jingming Qian
1,2,3 ,
,
Dafang Fu
1,2,
Tong Zhou
4,
Rajendra Prasad Singh
1,2,* and
Shujiang Miao
2,* 1
Joint Research Centre for Future Cities, Southeast University-Monash University Joint Graduate School, Suzhou 215123, China
2
School of Civil Engineering, Southeast University, Nanjing 210096, China
3
School of Earth, Atmosphere and Environment, Monash University, Clayton 3800, Australia
4
Design Department, Jiangsu Provincial Planning and Design Group Co., Nanjing 210036, China
*
Authors to whom correspondence should be addressed.
Sustainability 2022, 14(3), 1286; https://doi.org/10.3390/su14031286
Submission received: 1 December 2021
/
Revised: 17 January 2022
/
Accepted: 18 January 2022
/
Published: 24 January 2022
(This article belongs to the Special Issue Waste Treatment and Environmental Sustainability: Current Trends, Challenges and Management Strategies)
Abstract
:Bioretention is an important low impact technology that has prominent stormwater detention and purification capacity. Current study focused on analyzing the impact of environmental factors and system structure on bioretention evaporation efficiency. In operational phase, the moisture content in bioretention packing changes constantly, directly affecting the stagnation efficiency of the bioretention. Therefore, it is very important to study the evaporation efficiency of the bioretention for objective evaluation of hydrologic effects. In this study, an artificial climate chamber was used to investigate the effect of environmental factors and bioretention structure on the evaporation efficiency of bioretention. The evaporation capacity of bioretention was analyzed under different temperature and relative humidity conditions in a laboratory-scale artificial climate chamber. The result showed that evaporation rate at the initial stage was close to the maximum evaporation capacity under an environmentally controlled rapid decrease. Results revealed that after 15 h, the evaporation rate decreased more than 60%, and the evaporation rate decreased rapidly at the higher temperature, whereas the evaporation rate in the third stage was low and stable. It was about 1 mm/d (0.82~1.1 mm/d) and formed a dry soil layer. The results revealed that cumulative evaporation of the bioretention with a submerged zone was notably higher than that without the submerged zone, and the cumulative evaporation after 50 h was 16.48% higher. In the second stage of evaporation, the decreasing amplitude of the evaporation capacity of bioretention with the submerged zone was also relatively slow. Moisture content in upper layers in bioretention packing was recharged from the bottom submerged zone by capillary action and water vapor diffusion. These research findings can be used to evaluate the hydrologic effect of bioretention and can also be used to guide its design.
1. Introduction
Bioretention is an effective low impact development (LID) technology for stormwater management of first-flush rainwater treatment in small scale catchments, which is a potential method for processing water quality and managing water quantity [1,2]. Bioretention is a soil–vegetation system, also known as rain garden, controlling water quantity by filtration and evaporation, and removing pollutants through filtration, adsorption, microbe exchange, and other functions in the soil [3,4,5,6]. The LID technology is widely used for urban stormwater management and flood protection [7,8].
Substrate packing structure is one of the most important parts of any bioretention system [9,10]. The evaporation from the packing layer shows strong connection between bioretention operation and ambient conditions [11,12,13,14]. The moisture content and changes in its distribution in the soil is due to evaporation processes, which in turn lead to changes in soil engineering properties. Therefore, many engineering and environmental problems are directly or indirectly related to the evaporation. In arid and semiarid regions, evaporation is one of the key driving forces in soil salinization and desertification, which not only bringing serious harm to agricultural production and the ecological environment, but also weakening the engineering properties of the soils [15,16,17]. Research on bioretention in the past focused primarily on water quality purification and hydrological flow effect and not much attention has been given to evapotranspiration, which is an important aspect in bioretention performance. The moisture content in the packing layers directly affects the detention and storage efficiency of bioretention [18]. Previous studies noted that the evapotranspiration process is affected by external climatic factors such as temperature, relative humidity, and wind speed, together with internal factors such as surface water content, permeability coefficient, and packing structure [14,19,20,21].
Soil water evaporation involves many disciplines, such as geology, geotechnical, water conservancy, roads, environment, atmosphere, etc. Especially in recent years, under the influence of global climate change, extreme arid climate occurs frequently, related disasters are becoming increasingly prominent, and economic losses are becoming much larger. Therefore, a large number of soil moisture evaporation studies on soil and water conservation in arid and semiarid areas have been carried out worldwide [22,23]. In the process of operation, the moisture content in the bioretention packing layer is constantly changing, and the water content of the packing layer directly affects the stagnation-stage evaporation rate [24,25]. Therefore, it is very important to study the water evaporation mechanism in bioretention for the objective evaluation of its hydrologic effect. Current work focused on the study of the common packing profile in Kunshan city, a model sponge city in China. An artificial climate chamber was used to investigate the effect of environmental factors and bioretention structure on the evaporation efficiency of bioretention. A water evaporation resistance model in bioretention was established in this current study. The evaporation model of bioretention was used to consider the hydrological effect of the bioretention calculated after the effect of water evaporation, which was more consistent with the actual measured runoff reduction. Current research findings can be used to evaluate the hydrological effect of the bioretention and to prepare guidelines for the design and implementation in local environments. Therefore, based on abovementioned information, key objectives of the current work follow: (i) design and establish a water evaporation test system for bioretention; (ii) prepare an experimental system consisting of an artificial climate chamber, a bioretention cell unit, a weighing unit, a water supply unit, and a signal acquisition unit; (iii) simulate evaporation rate from the bioretention under different temperature and humidity conditions, with or without a submergence zone; and (iv) measure, collect, process, and analyze the evaporation data through real-time monitoring.
2. Materials and Methods
2.1. Experimental Equipment
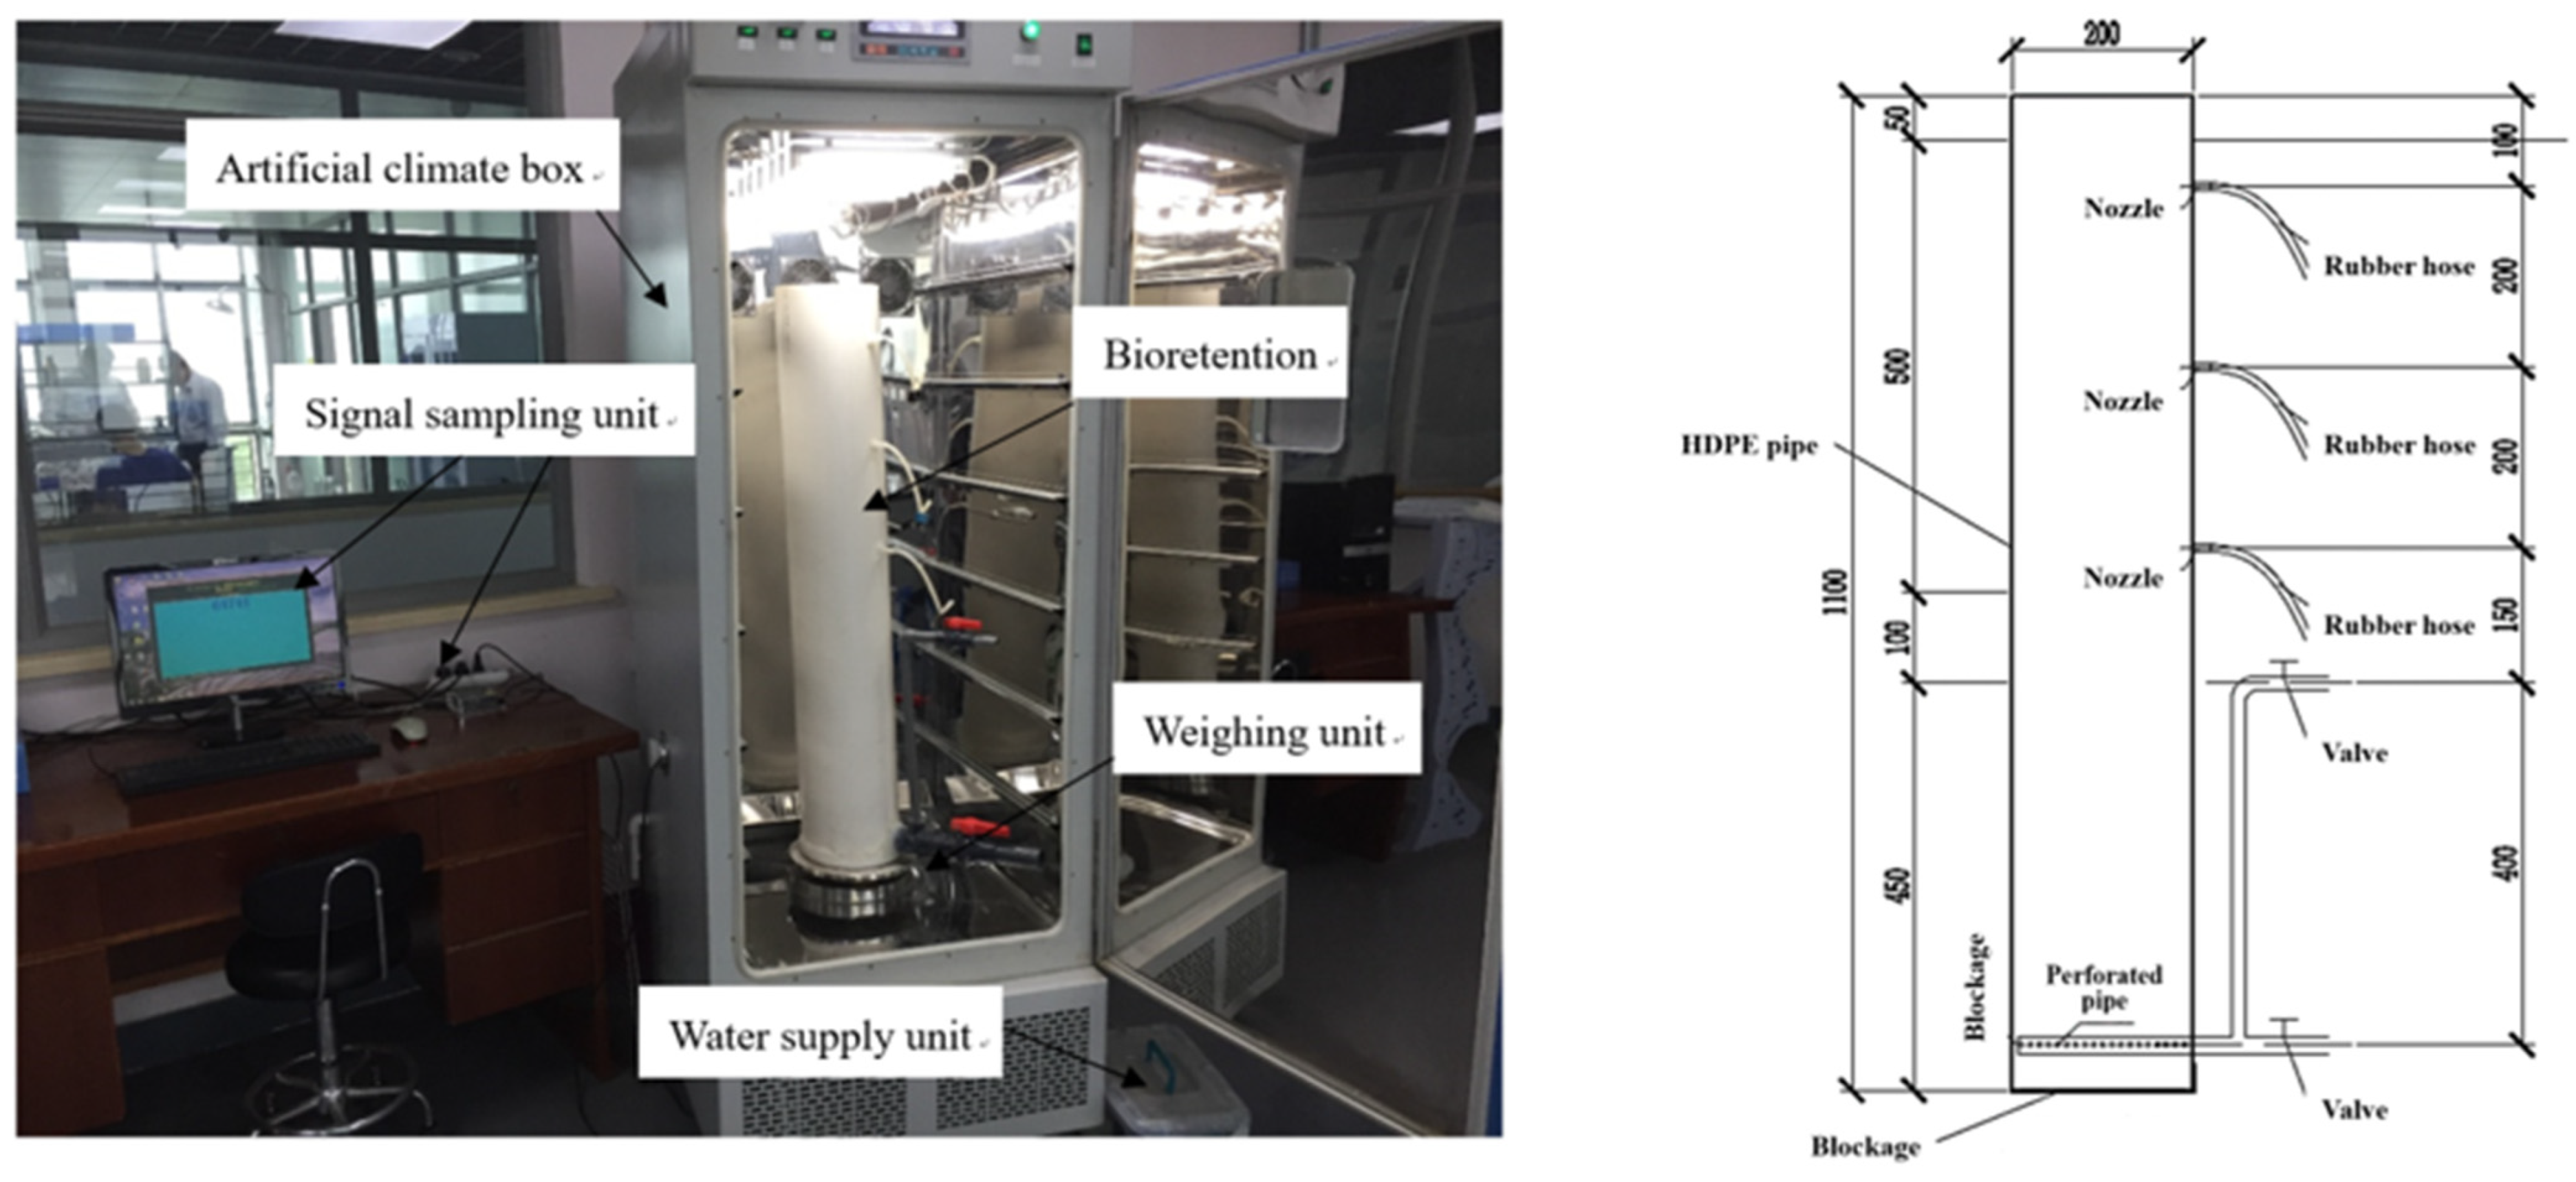
The system consists of the following parts: artificial climate chamber, bioretention unit, weighing unit, water supply unit, and signal sampling unit, as shown in Figure 1. The weighing unit is made up of a loading cell and weight base. The water supply unit consists of a plastic water tank and a pump. The signal sampling unit consists of a data acquisition device and computer.
2.1.1. Artificial Climate Chamber
The trial was undertaken in a PQX-500 artificial climate chamber. It was controlled by the computer, which has system functions, e.g., light, constant temperature, and automatic wetness control. It can be used for seed germination, plant cultivation, cultivation of microorganisms and insects, and small animal husbandry.
Device specifications were as follows:
- Temperature: 0–50 °C;
- Temperature fluctuation: °C
- Relative humidity: 30–98%
- Relative humidity fluctuation:
2.1.2. Bioretention Simulation Test
The bioretention model can simulate the operating conditions with or without a submerged zone, as shown in Figure 1. While the upper valve remained open at running time and if the inferolateral valve was closed, the bioretention had a 450 mm submerged zone. If the inferolateral valve was open, there was no submerged zone.
The bioretention experimental unit was made of white high-density polyethylene (HDPE) pipes. The bioretention unit was constructed as follows: total height 1100 mm, diameter 200 mm, intermediate layer 100 mm, and height of the submerged zone 450 mm. The permeability coefficient of packing could be measured by three piezometer tubes with different heights, located at the sidewall of the bioretention unit. The internal surface of the equipment was sanded with a fine grit wheel, which increased the roughness of the inner wall to prevent rain runoff from flowing along the inner wall.
2.2. Sustrate Packing Structure
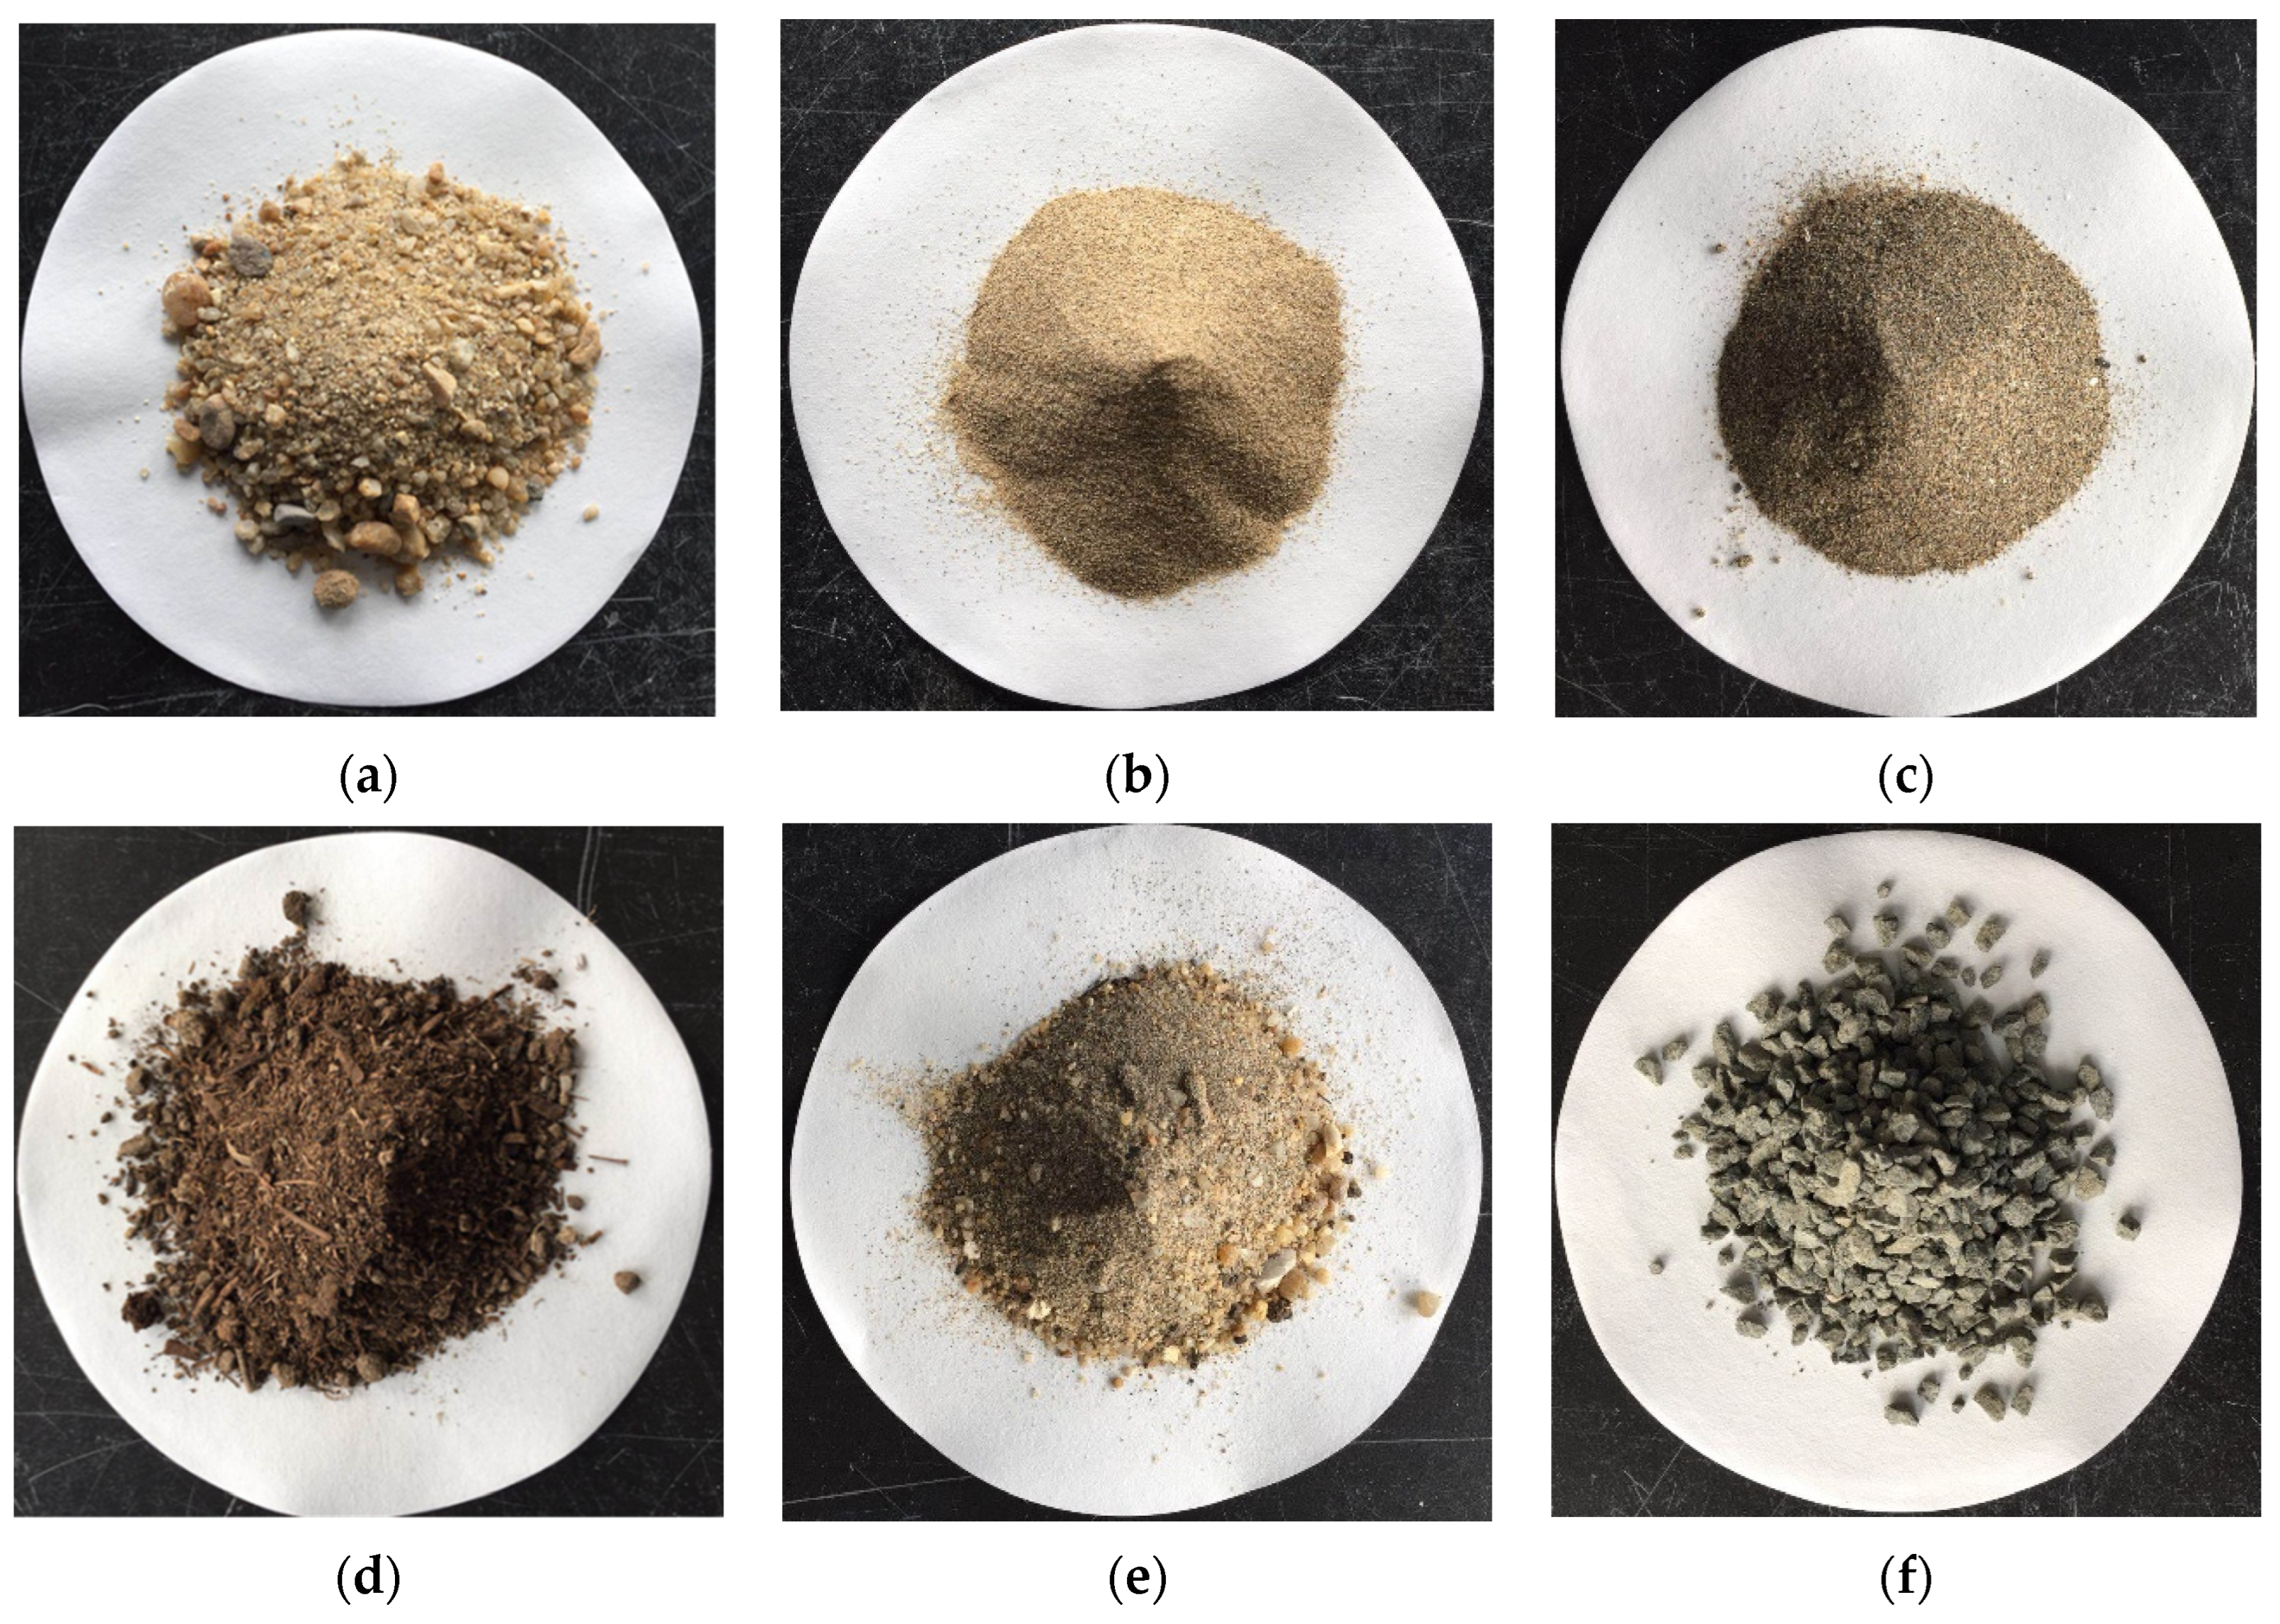
The packing structure of the bioretention unit has a filter layer, intermediate layer, and submerged zone, which was designed according to the local catchment, climatic conditions, and soil characteristics of the experimental area in Kunshan city, China. The permeability coefficient of the filter layer was 140 mm/h. The compounding ratio of different materials forming the filter layer follows: coarse sand—48%, medium size sand—20%, fine sand—30%, and soil—2%. The intermediate layer was packed with coarse sand, and its height was 100 mm. The submerged zone was 450 mm high and made of gravel. All the materials are shown in Figure 2.
2.3. Methods
The bioretention simulated runoff in the trial experiment was computed by the storm strength formula for Kunshan. Designed storm strength (i) could be calculated by Equation (1), which was given in a report published by the Kunshan city government:
where; —storm recurrence period (yr), t—rainfall duration (min), and i—designed storm strength.
According to five years of recent data from the Kunshan government, the following parameters were used: bioretention area was 10% of total catchment area, synthetic runoff coefficient was 0.8, storm recurrence period () was 2 yr, and rainfall duration (t) was 60 min. According to the Kunshan city storm strength analysis formula, the total runoff was calculated to be 0.012 m3. The three main parts of the trial experiments are discussed in following sections.
2.3.1. Evaluation of Bioretention Evaporation Capacity
The evaporation capacity in bioretention was the possible maximum evaporation in certain weather conditions when water is supplied without limitation. Petri dishes with pure water were first placed in the artificial climate box with set temperature and relative humidity, and then their weight was measured after a period of time. The evaporation capacity was calculated based on the evaporation, evaporation time, and the surface area of the Petri dish, as given in Equation (2):
where E—evaporation capacity, mm/d; M—initial mass of Petri dish with water, g; m—subsequent mass of the Petri dish after evaporation, g;—water density, approximately 1 g/cm3; D—diameter of the Petri dish, mm; and t—period of evaporation, d.
To improve the accuracy of the determination, Petri dishes should be set in the artificial climate box for more than 10 h and then weighed several times to obtain an average. The temperature was set at 20, 25, 30, 35, and 40 °C, and the relative humidity was set at 30%, 40%, 50%, 60%, and 70%, as shown in Table 1.
2.3.2. Determination of Evaporation Efficiency in Bioretention
Evaporation efficiency of bioretention can be affected by external weather factors such as temperature, relative humidity, and wind speed, and internal factors such as permeability coefficient, with or without a submerged zone and packing structure [20,23]. This trial attempted to change the external and internal factors of bioretention to compare the evaporation efficiency, which includes temperature, relative humidity, and with or without a submerged zone. Temperature was set at 20, 30, and 40 °C, and relative humidity was set at 30%, 50%, and 70%, as shown in Table 2.
Each set of evaporation test stayed in the artificial climate box for 50 h. After each test, the bottom valve was opened to empty the water in the submerged zone. The bioretention unit was left unused for some time, after which simulated runoff was added for further analysis.
2.3.3. Determination of the Surface Water Content in Bioretention
In the process of evaporation in bioretention, it would gradually form a layer of dry soil in the surface of the packing layer that prevents evaporation, where the water content would apparently change [26,27]. Therefore, surface water content was an important parameter of evaporation capacity in the bioretention unit. In the process of evaporation, the water content from the 0~1 cm surface sand samples was measured during the bioretention. The samples were collected every 2 h in the first 6 h of evaporation, and then collected every 4~6 h. The water content can be calculated by comparing the weights of samples before and after heating in an oven at 105 °C for more than 24 h. The final water content was the average of two samples taken at each time point.
3. Results and Discussion
3.1. Effect of Temperature on Bioretention Evaporation
3.1.1. Effect of Temperature on Evaporation Accumulation
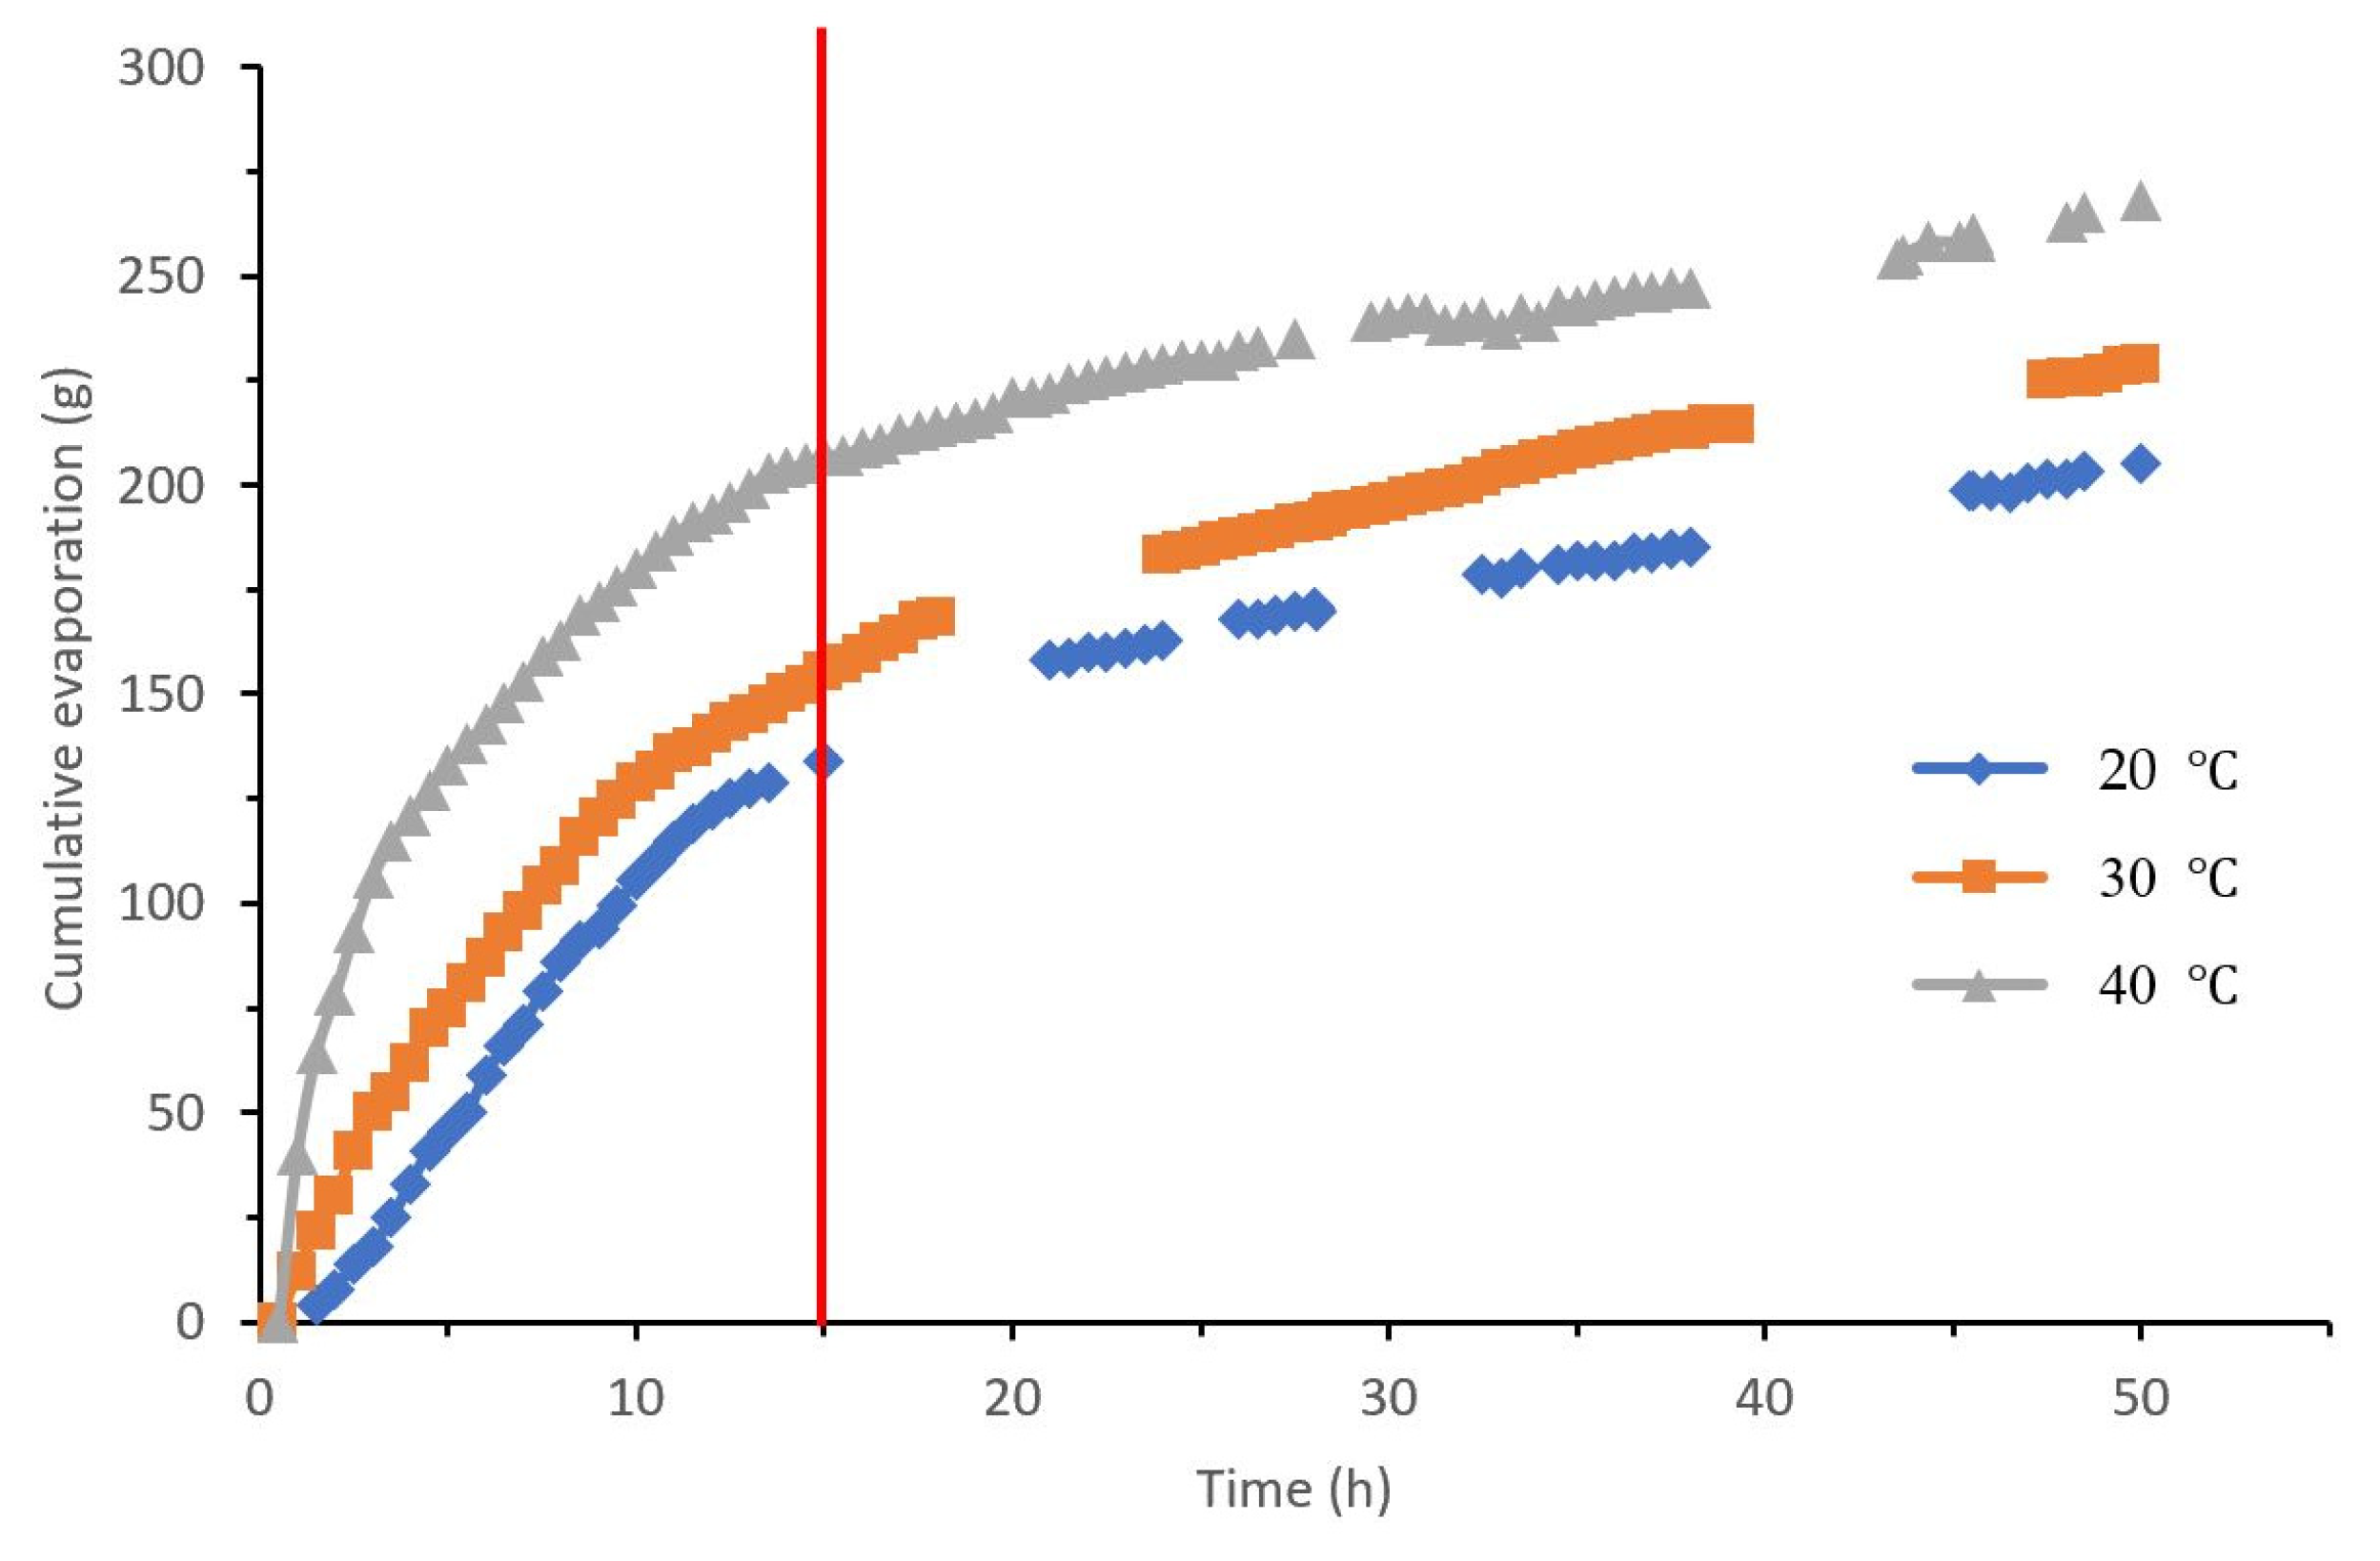
At the same relative humidity, the cumulative evaporation under different temperatures was analyzed and compared, as presented in Figure 3.
Results reveal that at 30% relative humidity, cumulative evaporation rates from bioretention with a submerged zone were 205, 229, and 268 g at ambient temperatures of 20, 30, and 40 °C, respectively, after evaporating for 50 h. Compared to the cumulative evaporation in 20 °C, cumulative evaporation increased 11.71% and 30.73%, respectively, for 30 and 40 °C. The gap in cumulative evaporation among different temperatures was apparent in the first 15 h evaporation period, and cumulative evaporation of bioretention was 134, 156, and 207 g in 20, 30, and 40 °C. Compared to the cumulative evaporation at 20 °C, the cumulative evaporation increased 16.42% and 54.48%, respectively, for 30, 20, 30, and 40 °C. It can be noted from the findings that temperature had substantial influence on the accumulation of evaporation during the initial stage of evaporation [28], but the difference of cumulative evaporation was relatively constant for different temperatures.
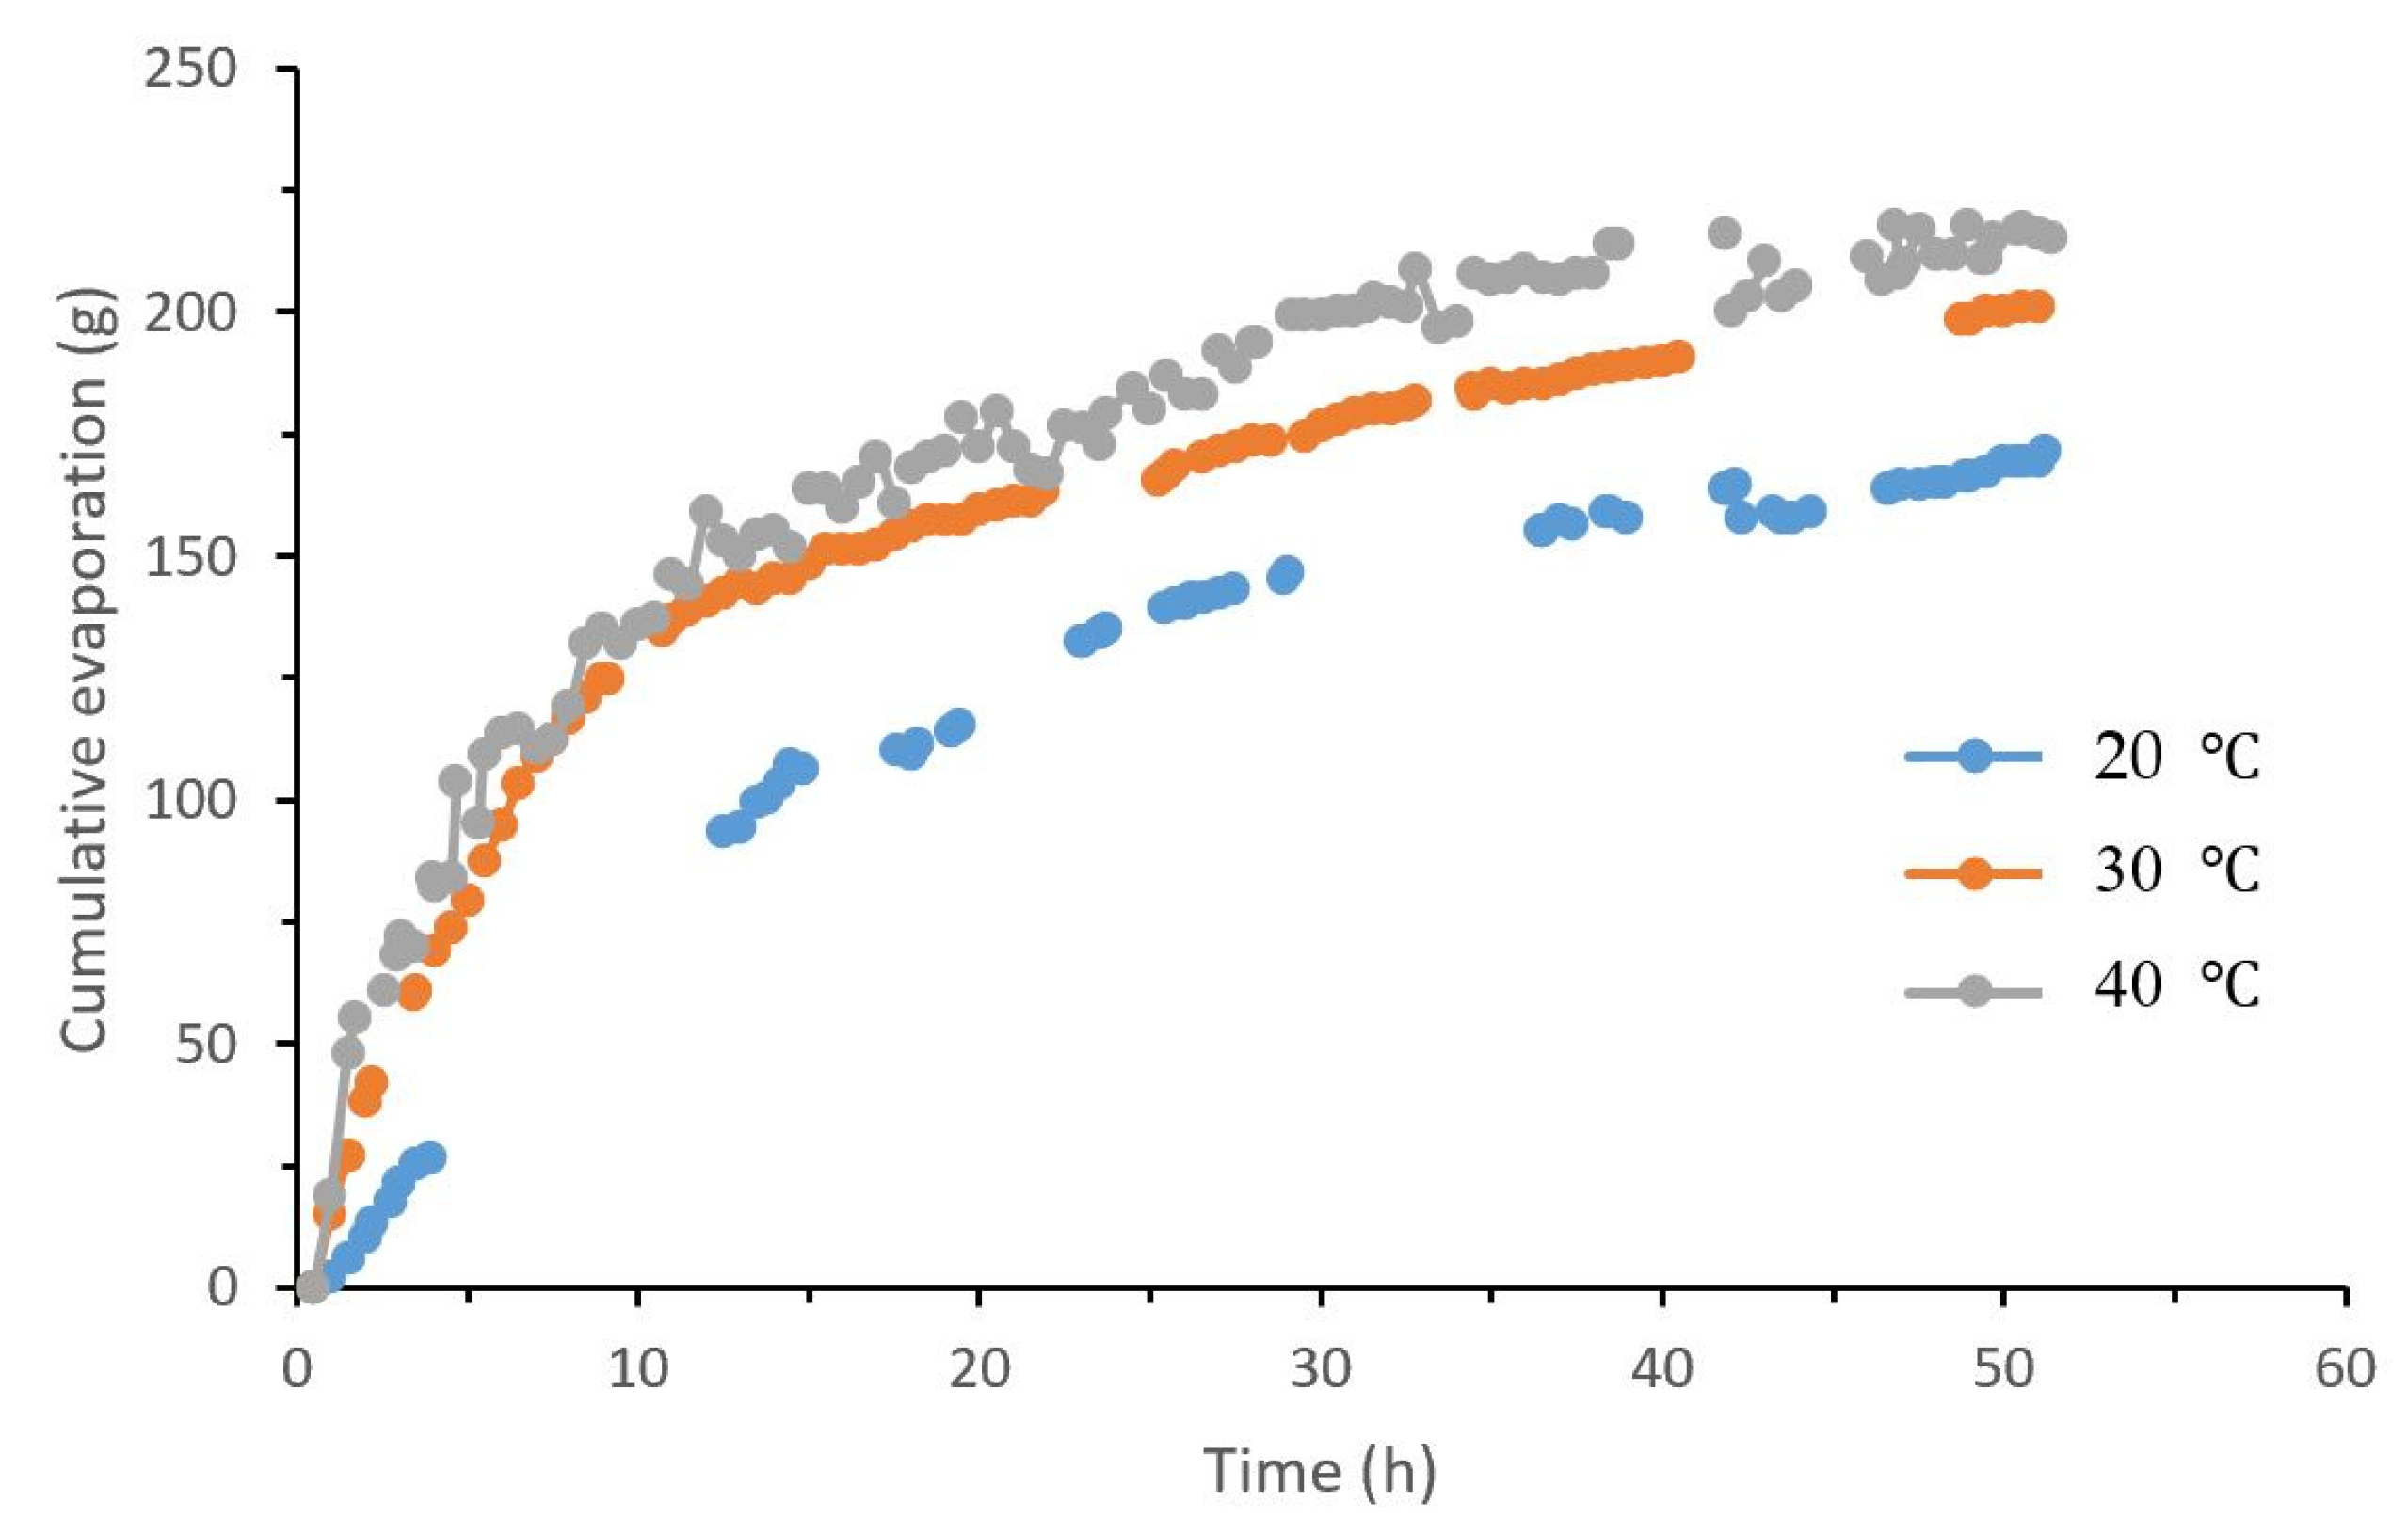
Findings presented in Figure 4 reveal the cumulative trend in evaporation from bioretention without a submerged zone for 30% relative humidity. The cumulative evaporation from bioretention without a submerged zone was 169, 200, and 216 g for ambient temperatures of 20, 30, and 40 °C, respectively, after 50 h evaporation. Compared to the cumulative evaporation at 20 °C, cumulative evaporation increased 18.34% and 27.8%, respectively, at 30 and 40 °C. The cumulative evaporation of bioretention was 106, 148, and 164 g for 20, 30, and 40 °C, respectively, after 15 h evaporation. Compared to the cumulative evaporation at 20 °C, cumulative evaporation increased 28.38% and 54.73%, respectively, for 30 and 40 °C.
Therefore, the cumulative evaporation from bioretention increased significantly with the temperature increment for the same relative humidity. Most of the increase in cumulative evaporation occurred in the first and second stages, which means cumulative evaporation was mainly influenced by temperature, one of the external environmental factors. However, in the third stage, the difference in cumulative evaporation among different temperatures was steady, which reflects the fact that temperature had a minor impact on the cumulative evaporation. Because evaporation was weak in the third stage, which was mainly determined by vapor supply from the lower layer to the upper layer, the water content was therefore low in the surface packing of the bioretention unit [16].
3.1.2. Effect of Temperature on Evaporation Rate
According to the cumulative evaporation data collected by the sensor, the evaporation rate at different time scale was calculated to compare the relationship between temperature and evaporation rate at the same relative humidity, as presented in Figure S1. Results show the relationship between evaporation rate and temperature in bioretention could be concluded as follows: (a) the evaporation capacity at 20, 30, and 40 °C were 10.52, 15.21, and 19.91 mm/d, respectively, as the red line shown. The evaporation rates at 20, 30, and 40 °C after 2 h were 9.75, 14.52, and 19 mm/d, respectively; (b) the evaporation capacity in 20, 30, and 40 °C were 7.84, 11.19, and 14.54 mm/d, respectively. The evaporation rate at 20, 30, and 40 °C after 1.5 h were 5.92, 8.41, and 10.1 mm/d respectively; (c) the evaporation capacity at 20, 30, and 40 °C were 10.52, 15.21, and 19.91 mm/d, respectively. The evaporation rate at 20, 30, and 40 °C after 1.5 h were 7.54, 14.1, and 17.62 mm/d, respectively. The evaporation rate was close to the evaporation capacity, as the water content was almost at saturation in the early evaporation [16,27]. At this stage, the evaporation rate was determined mainly by external weather conditions, which have less to do with packing structure and permeability coefficient of bioretention.
As the evaporation proceeded, the evaporation rate decreased rapidly while the surface water content decreased constantly. Results were as follows: (a) the evaporation rate at 20, 30, and 40 °C after 15 h were 3.3, 3.4, and 2.5 mm/d, respectively, decreased 66.15%, 76.58%, and 86.84% compared to the initial evaporation rate; (b) the evaporation rate at 20, 30, and 40 °C after 15 h were 3.7, 2.8, and 2.68 mm/d, respectively, decreased 37.5%, 66.71%, and 73.47% compared to the initial evaporation rate; (c) the evaporation rate at 20, 30, and 40 °C after 15 h were 2.3, 1.9, and 2.4 mm/d, respectively, decreased 76.41%, 86.91%, and 87.37% compared to the initial evaporation rate. The reduction of evaporation rate at higher temperature was larger than lower temperature, which means the higher the temperature, the faster the descending speed of the evaporation rate, as the water cannot be supplied in time from the lower layer to the upper layer.
At later stage of evaporation, the curves of evaporation rate stay steady that were low values. The evaporation could be reduced due to the formation of a dry layer on the bioretention surface, in which the water content was very low [26,27]. Results reveal that the evaporation rates at 20, 30, and 40 °C in 50 hour’s duration were 1.06, 0.99, and 1.1 mm/d, respectively, whereas the evaporation rate at 20, 30, and 40 °C after 50 h were 0.83, 0.92, and 0.82 mm/d, respectively, equaling 14.02%, 10.94%, and 8.12% of the initial evaporation rate. In this stage, the evaporation rate was mainly determined by water content of packing, packing structure, and permeability coefficient of bioretention, which had minimal influence by external weather conditions.
Variation in the evaporation rate at different temperatures and trend in the same relative humidity are presented in Figure S1. In the early evaporation stage, the evaporation rate was higher and close to the evaporation capacity. This trend occurred due to the saturation in the water content of packing in the early evaporation. This trend reflects that there was no limitation in water supply for evaporation. At this stage, the evaporation rate was mainly determined by external weather conditions, such as temperature, relative humidity, and wind speed. As the evaporation proceeded, the evaporation rate fell quickly. After 15 h, the evaporation rate decreased by more than 60% of the initial evaporation rate. In addition, the higher the temperature, the faster the descending speed of evaporation rate. This results from high temperature accelerating the descending speed of surface water content. In later evaporation, the variation of evaporation rate stayed low and steady. After 50 h, the evaporation rate of bioretention remained at approximately 1 mm/d (0.82~1.1 mm/d) at different relative humidity. In this stage, the evaporation becomes difficult as a dry layer formed in the surface of the bioretention unit. The evaporation rate was mainly determined by water content of packing, packing structure, and permeability coefficient of bioretention, which has less to do with external weather conditions.
3.2. Effect of Relative Humidity on the Evaporation
The relative humidity can affect the diffusion and exchange of water vapor in the packing surface because of the difference in relative humidity between the inside and outside of the packing. When the relative humidity was low, the evaporation rate was high as the fast speed of diffusion and exchange of vapor; when the relative humidity was high, the evaporation rate was low as the slow speed of diffusion and exchange of vapor [28,29]. While the relative humidity rises to a certain extent, the surface evaporation nearly stops.
3.2.1. Analysis of Relative Humidity Effect on the Accumulation of Evaporation
At the same temperature, this section compares cumulative evaporation under different relative humidity. Results revealed that when the temperature was 20 °C, cumulative evaporation of bioretention with a submerged zone were 205, 159, and 146 g at relative humidity 30%, 50%, and 70%, respectively, after evaporating for 50 h. Compared to the cumulative evaporation at relative humidity 30%, cumulative evaporation decreased 22.44% and 28.78%, respectively, at relative humidity 50% and 70%. The gap of cumulative evaporation among different temperatures was obvious in the first 15 h. The cumulative evaporation of bioretention was 136, 90, and 54 g at relative humidity 30%, 50%, and 70%, respectively, after evaporating for 15 h. Compared to the cumulative evaporation at relative humidity 30%, cumulative evaporation decreased 33.82% and 60.29%, respectively, at relative humidity 50% and 70%. It can be seen that relative humidity has substantial influence on the accumulation of evaporation at the initial stage of evaporation, but the difference of cumulative evaporation was relatively constant for different relative humidity.
When the temperature was 30 °C, cumulative evaporation of bioretention with a submerged zone was 228 and 137 g for relative humidity 30% and 50%, respectively, after evaporating for 50 h. Compared to the cumulative evaporation for relative humidity 30%, cumulative evaporation decreased 39.91% for relative humidity 50%. The gap of cumulative evaporation among different temperatures was obvious in the first 15 h. The cumulative evaporation of bioretention was 155 and 80 g for relative humidity 30% and 50%, respectively, after evaporating for 15 h. Compared to the cumulative evaporation for relative humidity 30%, cumulative evaporation decreased 48.39% for relative humidity 50%. It can be seen that relative humidity has substantial influence on the accumulation of evaporation at the initial stage of evaporation, but the difference of cumulative evaporation was relatively constant for different relative humidity. In case where the temperature was 40 °C, cumulative evaporation of bioretention with a submerged zone was 271 and 249 g for relative humidity 30% and 50%, respectively, after evaporating for 50 h. Compared to the cumulative evaporation for relative humidity 30%, cumulative evaporation decreased 8.12% for relative humidity 50%. The gap of cumulative evaporation among different temperatures was obvious in the first 15 h. The cumulative evaporation of bioretention was 207 and 167 g for relative humidity 30% and 50%, respectively, after evaporating for 15 h. Compared to the cumulative evaporation for relative humidity 30%, cumulative evaporation decreased 19.32% for relative humidity 50%. It can be seen that relative humidity has substantial influence on the accumulation of evaporation at the initial stage of evaporation, but the difference of cumulative evaporation was relatively constant for different relative humidity.
The cumulative evaporation of bioretention decreases significantly with the relative humidity increment at the same temperature. Because the gap of vapor between the bioretention packing and air decrease, it leads to the decline of evaporation rate, while the relative humidity increases [28,29]. Most of the increase in cumulative evaporation occurs in the early evaporation, which means cumulative evaporation was mainly influenced by relative humidity. However, in the later evaporation, the cumulative evaporation becomes steady, which means relative humidity had minor impact on it. Earlier study also pointed out that the occurrence and maintenance of soil evaporation must meet three conditions: (1) continuous heat supply to meet the consumption of evaporation latent heat; (2) vapor pressure in the atmosphere must be lower than the vapor pressure on the soil surface, and there is a relative humidity difference; and (3) continuous water supply to the evaporating surface in the soil [30].
3.2.2. Effect of Relative Humidity on Evaporation Rate
According to the cumulative evaporation data collected by the sensor, the evaporation rate of different timings was calculated to compare the relationship between relative humidity and evaporation rate at 20 °C, as presented in Figure S2. When the temperature was 20 °C, the evaporation capacity for relative humidity 30%, 50%, and 70% were 10.52, 7.84, and 5.16 mm/d, respectively, as shown by the red line. The evaporation rate for relative humidity 30%, 50%, and 70% after 1.5 h was 7.13, 5.64, and 4.31 mm/d, respectively. In the early evaporation, the evaporation rate was close to the potential evaporation rate.
As the evaporation proceeded, the evaporation rate was falling fast while the surface water content decreased constantly. The evaporation rate for relative humidity 30%, 50%, and 70% after 15 h was 4.41, 4.12, and 2.65 mm/d, respectively, and decreasing 38.15%, 26.95%, and 38.52%, respectively, compared to the initial evaporation rate. Evaporation rate decreased quickly in a short time. In later evaporation, the evaporation rate remained steady with low values. The evaporation rate for relative humidity 30%, 50%, and 70% after 50 h were 1.13, 0.86, and 0.82 mm/d, respectively, equaling 15.85%, 15.25%, and 19.03% of the initial evaporation rate. In this stage, the evaporation rate was mainly determined by the water content of packing, packing structure, and permeability coefficient of bioretention, which had less to do with external weather conditions.
3.3. Effect of Submerged Condition on the Evaporation
3.3.1. Analysis of Submerged Zone Effect on the Accumulation of Evaporation
Findings for comparison of the cumulative evaporation trend in bioretention with or without a submerged zone at similar temperature and relative humidity (20 °C and 30%) are presented in Figure S3a. The cumulative evaporation in bioretention with a submerged zone was higher than without a submerged zone. After 50 h, the cumulative evaporation rate in bioretention with a submerged zone was 251 g, which was 15.67% more than the cumulative evaporation in bioretention without a submerged zone, which was 217 g. In addition, the cumulative evaporation in bioretention with a submerged zone became higher than without a submerged zone between the 10th to 20th hours, as revealed by the red line shown in the graph. At the 10th hour, the cumulative evaporation in bioretention with and without a submerged zone was 107 and 75 g, which was 32 g in difference. At the 20th hour, the cumulative evaporation in bioretention with and without a submerged zone was 161 and 116 g, which shows a difference of 45 g. In the later evaporation stage, the difference between cumulative evaporation under the two conditions was relatively stable.
In the case of similar temperature and relative humidity (30 °C and 30%), results comparing cumulative evaporation in bioretention with and without a submerged zone are presented in Figure S3b. The cumulative evaporation in bioretention with a submerged zone was higher than without the submerged condition. After 50 h, the cumulative evaporation in bioretention with a submerged zone was 237 g, which was 18.5% more than the cumulative evaporation in bioretention without a submerged zone, which was 200 g. In addition, the cumulative evaporation in bioretention with a submerged zone became larger than without a submerged zone between the 10th and 20th hours, as presented by the red line in the figure. At the 10th hour, the cumulative evaporation in bioretention with and without a submerged zone was 137 and 133 g, which was 4 g in difference; at the 20th hour, the cumulative evaporation in bioretention with and without a submerged zone was 181 and 159 g, which shows a difference of 22 g. In the later evaporation stage, the difference between cumulative evaporation under abovementioned two conditions was relatively stable.
In the case of similar temperature and relative humidity (40 °C and 30%), comparison results of cumulative evaporation in bioretention with or without a submerged zone are presented in Figure S3c. The cumulative evaporation in bioretention with a submerged zone was higher than without a submerged zone. After 50 h, cumulative evaporation in bioretention with a submerged zone was 249 g, which was 15.28% more than bioretention without a submerged zone (216 g). In addition, the cumulative evaporation in bioretention with a submerged zone became higher than without a submerged zone between the 5th and 15th hour, as presented by the red line in the figure. At the 5th hour, the cumulative evaporation in bioretention with and without a submerged zone was 115 and 106 g, which was 9 g in difference; at the 15th hour, the cumulative evaporation in bioretention with and without a submerged zone were 187 and 160 g, a difference of 27 g. In the later evaporation stage, the difference between cumulative evaporation trends under two different conditions was relatively stable.
The cumulative evaporation in bioretention with a submerged zone was higher than without a submerged zone in the similar temperature and relative humidity conditions. In the early evaporation stage, it had minor impact on the cumulative evaporation in the case of presence of a submerged zone in the bioretention unit. As the evaporation advanced, the cumulative evaporation in bioretention with a submerged zone became larger than without a submerged zone. This trend occurred due the sharp decline in surface water content. The surface water content and the water supply ability of packing were the main contributory factors that determined the cumulative evaporation, while the influence of temperature and relative humidity was the secondary factor [16]. The water from the submerged zone in bioretention can be supplied to the upper layer through diffusion and capillary, reflecting that the water supply ability of bioretention with a submerged zone was better than bioretention without a submerged zone [30,31,32].
3.3.2. Effect of Submerged Zone on Evaporation Rate
Results presented in Figure S4a reveal that under the 20 °C and 30% temperature and relative humidity condition, the evaporation capacity in bioretention was 10.52 mm/d. The evaporation rates in bioretention with and without a submerged zone after 1 h were 10.2 and 9.1 mm/d. In the early evaporation stage, the evaporation rate was close to its potential. As the evaporation proceeded, the evaporation rate revealed a sharp decline while the surface water content showed constant decrease. The downward trend in evaporation rate with a submerged zone was slower than without a submerged zone. The evaporation rates in bioretention with and without a submerged zone after 10 h were 6.5 and 4.5 mm/d, decreasing 36.27% and 50.52% compared to the initial evaporation rate. Evaporation rate decreases quickly in a short interval. In the later evaporation stage, the evaporation rates stay steady and were close between bioretention with and without a submerged zone. The evaporation rates in bioretention with and without a submerged zone after 50 h were 1.08 and 1.06 mm/d, which were 10.59% and 11.65% of the initial evaporation rate. In this stage, presence or absence of a submerged zone in bioretention had negligible impact.
The evaporation capacity in bioretention was 15.21 mm/d when the temperature and relative humidity were 30 °C and 30%, as presented Figure S4b. The evaporation rate in bioretention with and without a submerged zone after 1 h was 15.28 and 15 mm/d, respectively. In the early evaporation stage, the evaporation rate was close to potential evaporation. As the evaporation proceeded, the evaporation rate showed a sharp decrease while there was a constant decrease in the surface water content. The downward trend in evaporation rate with a submerged zone was slower than without a submerged zone. The evaporation rates in bioretention with and without a submerged zone after 15 h were 3.44 and 1.53 mm/d, decreasing 77.49% and 89.8%, respectively, compared to the initial evaporation rates. It reveals a sharp decrease in evaporation rates in a shorter duration, which is consistent with the trend revealed in other studies [29,32,33,34].
Results showed that in the later evaporation stage, the evaporation rate revealed a steady trend, which is a very similar trend between bioretention with and without a submerged zone. Evaporation rate in bioretention with and without a submerged zone after 50 h was 0.91 and 0.87 mm/d, which was 5.96% and 5.8% of the initial evaporation rate. In this stage, it was not important whether there was a submerged zone in bioretention. Findings show that when the temperature and relative humidity were 40 °C and 30%, respectively, the evaporation capacity was 19.91 mm/d, as presented in Figure S4c. The evaporation rate in bioretention with and without a submerged zone after 1 h was 19.82 and 20.06 mm/d, respectively. In the early evaporation stage, the evaporation rate was close to the potential evaporation rate. As the evaporation process started in bioretention, the evaporation rate showed a sharp decline while the surface water content decreased constantly. The downward trend in evaporation rate with a submerged zone was slower than without a submerged zone. The evaporation rates in bioretention with and without a submerged zone after 10 h were 5.61 and 3.5 mm/d, decreasing 71.73% and 82.55% compared to the initial evaporation rates and reflects a sharp decrease in a short time.
The evaporation rates reflected a steady trend in later evaporation, which was close between bioretention with and without a submerged zone [32,33,34]. The evaporation rate in bioretention with and without a submerged zone after 50 h was 1.11 and 1.02 mm/d, which were 5.6% and 5.1% of the initial evaporation rate. In this stage, it was not important whether there was a submerged zone in the bioretention. The evaporation rate was close to the potential evaporation rate in the early evaporation, whether in presence or absence of a submerged zone in bioretention. As the evaporation proceeded, the evaporation rate fell fast, but the downward trend of the evaporation rate with a submerged zone was slower than without a submerged zone [35]. The water supply in bioretention with a submerged zone was better than bioretention without a submerged zone, as the water from the submerged zone in bioretention can supply the upper layer through diffusion and capillary process.
4. Conclusions
Results revealed that the bioretention evaporation rate was in accordance with the soil evaporation, which can be divided into three stages, namely, the constant rate stage, the falling rate stage, and the residual stage. In the first two stages, the environmental factors were the main factors affecting water evaporation of the bioretention. The evaporation rate at the initial stage of evaporation was close to the maximum evaporation capacity under the environment, and then the evaporation rate decreased rapidly. After 15 h, the evaporation rate decreased more than 60%, and the higher the temperature, the faster the evaporation rate decreased. The evaporation rate of the third stage was low and stable. The evaporation rate was about 1 mm/d (0.82~1.1 mm/d), and the surface layer formed a dry soil layer. The cumulative evaporation of the bioretention with the submerged zone was higher than that without a submerged zone, and the cumulative evaporation after 50 h was 16.48% higher. In the second stage of evaporation, the decreasing amplitude of the evaporation capacity of the bioretention with a submerged zone was also relatively slow, whereas, the water in the bottom of the submerged zone recharged the upper layer by capillary action and water vapor diffusion.
Supplementary Materials
The following are available online at https://www.mdpi.com/article/10.3390/su14031286/s1, Figure S1: The relationship between temperature and evaporation rate, Figure S2: The relationship between relative humidity and evaporation rate (20 °C, with submerged zone), Figure S3: The influence of submerged zone on accumulation of evaporation, Figure S4: The influence of submerged zone on evaporation rate.
Author Contributions
Conceptualization, D.F. and T.Z.; methodology, J.Q. and S.M.; formal analysis, J.Q.; investigation, J.Q. and T.Z.; resources, S.M. and R.P.S.; data curation, J.Q. and T.Z.; writing—original draft preparation, J.Q. and T.Z.; writing—review and editing, J.Q. and R.P.S.; visualization, J.Q. and R.P.S.; supervision, D.F. and R.P.S.; project administration, J.Q. and D.F.; funding acquisition, S.M. All authors have read and agreed to the published version of the manuscript.
Funding
This research was funded by National Natural Science Foundation of China, grant number 41807514; Natural Science Foundation of Jiangsu Province, grant number BK20170682; and Priority Academic Program Development of the Jiangsu Higher Education Institution, Jiangsu Province, China.
Institutional Review Board Statement
Not applicable.
Informed Consent Statement
Not applicable.
Data Availability Statement
Not applicable.
Conflicts of Interest
The authors declare no conflict of interest.
References
- Ali, W.; Takaijudin, H.; Yusof, K.W.; Osman, M.; Abdurrasheed, A.S.I. The common approaches of nitrogen removal in bioretention system. Sustainability 2021, 13, 2575. [Google Scholar] [CrossRef]
- Osman, M.; Yusof, K.W.; Takaijudin, H.; Goh, H.W.; Malek, M.A.; Azizan, N.A.; Ghani, A.A.; Abdurrasheed, A.S. A review of nitrogen removal for urban stormwater runoff in bioretention system. Sustainability 2019, 11, 5415. [Google Scholar] [CrossRef] [Green Version]
- Gülbaz, S.; Kazezyılmaz-Alhan, C.M. Hydrological model of LID with rainfall-watershed-bioretention system. Water Resour. Manag. 2017, 31, 1931–1946. [Google Scholar] [CrossRef]
- Gulbaz, S.; Kazezyılmaz-Alhan, C.M.; Temür, R. Development of an empirical formula for estimation of bioretention outflow rate. Water SA 2019, 45, 209–215. [Google Scholar] [CrossRef] [Green Version]
- Goor, J.; Cantelon, J.; Smart, C.C.; Robinson, C.E. Seasonal performance of field bioretention systems in retaining phosphorus in a cold climate: Influence of prolonged road salt application. Sci. Total Environ. 2021, 778, 146069. [Google Scholar] [CrossRef]
- Qian, J.; Miao, S.; Tapper, N.; Xie, J.; Ingleton, G. Investigation on airport landscape cooling associated with irrigation: A case study of Adelaide airport, Australia. Sustainability 2020, 12, 8123. [Google Scholar] [CrossRef]
- Maliva, R.G. Low impact development and rainwater harvesting. In Anthropogenic Aquifer Recharge; Springer: Cham, Switzerland, 2020; pp. 765–825. [Google Scholar] [CrossRef]
- Qin, Y. Urban flooding mitigation techniques: A systematic review and future studies. Water 2020, 12, 3579. [Google Scholar] [CrossRef]
- Spraakman, S.; Rodgers, T.; Monri-Fung, H.; Nowicki, A.; Diamond, M.; Passeport, E.; Thuna, M.; Drake, J. A need for standardized reporting: A scoping review of bioretention research 2000–2019. Water 2020, 12, 3122. [Google Scholar] [CrossRef]
- Yang, F.; Fu, D.; Liu, S.; Zevenbergen, C.; Singh, R.P. Hydrologic and pollutant removal performance of media layers in bioretention. Water 2020, 12, 921. [Google Scholar] [CrossRef] [Green Version]
- Shrestha, P.; Salzl, M.T.; Jimenez, I.J.; Pradhan, N.; Hay, M.; Wallace, H.R.; Abrahamson, J.N.; Small, G.E. Efficacy of spent lime as a soil amendment for nutrient retention in bioretention green stormwater infrastructure. Water 2019, 11, 1575. [Google Scholar] [CrossRef] [Green Version]
- Shahrokh Hamedani, A.; Bazilio, A.; Soleimanifar, H.; Shipley, H.; Giacomoni, M. Improving the treatment performance of low impact development practices—Comparison of sand and bioretention soil mixtures using column experiments. Water 2021, 13, 1210. [Google Scholar] [CrossRef]
- Sang, M.; Huang, M.; Zhang, W.; Che, W.; Sun, H. A pilot bioretention system with commercial activated carbon and river sediment-derived biochar for enhanced nutrient removal from stormwater. Water Sci. Technol. 2019, 80, 707–716. [Google Scholar] [CrossRef] [PubMed]
- Jiang, C.; Li, J.; Li, H.; Li, Y. Experiment and simulation of layered bioretention system for hydrological performance. J. Water Reuse Desalin. 2019, 9, 319–329. [Google Scholar] [CrossRef] [Green Version]
- Yuan, C.; Feng, S.; Wang, J.; Huo, Z.; Ji, Q. Effects of irrigation water salinity on soil salt content distribution, soil physical properties and water use efficiency of maize for seed production in arid Northwest China. Int. J. Agric. Biolog. Eng. 2018, 11, 137–145. [Google Scholar] [CrossRef] [Green Version]
- Liu, Q.; Zhao, R.; Miao, J.; Wang, J.; Jia, D. Effect of diatomite on soil evaporation characteristics. Environ. Earth Sci. 2021, 80, 219. [Google Scholar] [CrossRef]
- Hou, L.; Zhou, X.; Wang, S. Numerical analysis of heat and mass transfer in kiwifruit slices during combined radio frequency and vacuum drying. Int. J. Heat Mass Transf. 2020, 154, 119704. [Google Scholar] [CrossRef]
- Sandhu, J.S.; Takhar, P.S. Verification of hybrid mixture theory based two-scale unsaturated transport processes using controlled frying experiments. Food Bioprod. Process. 2018, 110, 26–39. [Google Scholar] [CrossRef]
- Kaya, Y.Z.; Zelenakova, M.; Üneş, F.; Demirci, M.; Hlavata, H.; Mesaros, P. Estimation of daily evapotranspiration in Košice City (Slovakia) using several soft computing techniques. Theor. Appl. Climatol. 2021, 144, 287–298. [Google Scholar] [CrossRef]
- Valipour, M. Importance of solar radiation, temperature, relative humidity, and wind speed for calculation of reference evapotranspiration. Arch. Agron. Soil Sci. 2015, 61, 239–255. [Google Scholar] [CrossRef]
- Shokri, N.; Lehmann, P.; Or, D. Characteristics of evaporation from partially wettable porous media. Water Resour. Res. 2009, 45, W02415. [Google Scholar] [CrossRef] [Green Version]
- Fox, M.J. A technique to determine evaporation from dry stream beds. J. Appl. Meteorol. 2010, 7, 697–701. [Google Scholar] [CrossRef]
- Denisov, Y.M.; Sergeev, A.; Bezborodov, G.; Bezborodov, Y.G. Moisture evaporation from bare soils. Irrig. Drain. Syst. 2002, 16, 175–182. [Google Scholar] [CrossRef]
- Idso, S.B.; Reginato, R.J.; Jackson, R.D.; Kimball, B.A.; Nakayama, F.S. The three stages of drying of a field soil. Soil Sci. Soc. Am. J. 1974, 38, 831–837. [Google Scholar] [CrossRef]
- Chapman, C.; Horner, R.R. Performance assessment of a street-drainage bioretention system. Water Environ. Res. 2010, 82, 109–119. [Google Scholar] [CrossRef]
- An, N.; Tang, C.-S.; Xu, S.-K.; Gong, X.-P.; Shi, B.; Inyang, H.I. Effects of soil characteristics on moisture evaporation. Eng. Geol. 2018, 239, 126–135. [Google Scholar] [CrossRef]
- Verdú González, A.M.C.; Mas Serra, M.; Josa March, R.; Ginovart Gisbert, M. The effect of a prototype hydromulch on soil water evaporation under controlled laboratory conditions. J. Hydrol. Hydromech. 2020, 68, 404–410. [Google Scholar] [CrossRef]
- Sterlyagov, A.N.; I Nizovtsev, M.; Borodulin, V.Y.; Letushko, V.N. The effect of air relative humidity on the evaporation temperature of water-ethanol droplets. In Journal of Physics: Conference Series, Proceedings of the 5th All-Russian Scientific Conference Thermophysics and Physical Hydrodynamics with the School for Young Scientists (TPH-2020), 13–20 September 2020, Yalta, Crimea; IOP Publishing Ltd.: Bristol, UK, 2020; Volume 1675, p. 012058. [Google Scholar] [CrossRef]
- Roger, K.; Sparr, E.; Wennerström, H. Evaporation, diffusion and self-assembly at drying interfaces. Phys. Chem. Chem. Phys. 2018, 20, 10430–10438. [Google Scholar] [CrossRef] [Green Version]
- Hillel, D. Introduction to Environmental Soil Physics, 1st ed.; Elsevier: Amsterdam, The Netherlands, 2003. [Google Scholar] [CrossRef]
- Tamm, T.; Nõges, T.; Järvet, A.; Bouraoui, F. Contributions of DOC from surface and ground flow into Lake Võrtsjärv (Estonia). Hydrobiologia 2008, 599, 213–220. [Google Scholar] [CrossRef]
- He, K.; Qin, H.; Wang, F.; Ding, W.; Yin, Y. Importance of the submerged zone during dry periods to nitrogen removal in a bioretention system. Water 2020, 12, 876. [Google Scholar] [CrossRef] [Green Version]
- Zhang, J.; Singh, R.P.; Liu, Y.; Fu, D. Design and operation of submerged layer in bioretention for enhanced nitrate removal. J. Water Supply Res. Technol.—AQUA 2019, 68, 744–756. [Google Scholar] [CrossRef]
- Wei, D.; Singh, R.P.; Liu, J.; Fu, D. Effect of alternate dry-wet patterns on the performance of bioretention units for nitrogen removal. Desalination Water Treat. 2017, 59, 295–303. [Google Scholar] [CrossRef]
- Singh, R.P.; Zhao, F.; Ji, Q.; Saravanan, J.; Fu, D. Design and performance characterization of roadside bioretention systems. Sustainability 2019, 11, 2040. [Google Scholar] [CrossRef] [Green Version]
Figure 1.
The experimental bioretention unit (laboratory and schematic diagram).

Figure 2.
Different packing materials used in the bioretention unit: (a) coarse sand; (b) medium size sand; (c) fine sand; (d) soil; (e) intermediate layer packing; and (f) gravel.
Figure 2.
Different packing materials used in the bioretention unit: (a) coarse sand; (b) medium size sand; (c) fine sand; (d) soil; (e) intermediate layer packing; and (f) gravel.

Figure 3.
Cumulative evaporation at different temperatures (30% relative humidity, with submerged zone).
Figure 3.
Cumulative evaporation at different temperatures (30% relative humidity, with submerged zone).

Figure 4.
Cumulative evaporation for different temperatures (30% relative humidity, without submerged zone).
Figure 4.
Cumulative evaporation for different temperatures (30% relative humidity, without submerged zone).


Table 1.
Parameters used to determine the water surface evaporation rate.
| No. | Temperature (°C) | Relative Humidity (%) |
|---|---|---|
| 1 | 20 | 30 |
| 2 | 20 | 40 |
| 3 | 20 | 50 |
| 4 | 20 | 60 |
| 5 | 20 | 70 |
| 6 | 25 | 30 |
| 7 | 25 | 50 |
| 8 | 25 | 70 |
| 9 | 30 | 30 |
| 10 | 30 | 40 |
| 11 | 30 | 50 |
| 12 | 30 | 60 |
| 13 | 30 | 70 |
| 14 | 35 | 30 |
| 15 | 35 | 50 |
| 16 | 35 | 70 |
| 17 | 40 | 30 |
| 18 | 40 | 40 |
| 19 | 40 | 50 |
| 20 | 40 | 60 |
| 21 | 40 | 70 |
Table 2.
Parameter settings used for the evaporation trial.
| No. | Submerged Zone | Temperature (°C) | Relative Humidity (%) |
|---|---|---|---|
| 1 | With a 450 mm-high submerged zone | 20 | 30 |
| 2 | 20 | 50 | |
| 3 | 20 | 70 | |
| 4 | 30 | 30 | |
| 5 | 30 | 50 | |
| 6 | 30 | 70 | |
| 7 | 40 | 30 | |
| 8 | 40 | 50 | |
| 9 | 40 | 70 | |
| 10 | Without submerged zone | 20 | 30 |
| 11 | 30 | 30 | |
| 12 | 40 | 30 |
Publisher’s Note: MDPI stays neutral with regard to jurisdictional claims in published maps and institutional affiliations. |
© 2022 by the authors. Licensee MDPI, Basel, Switzerland. This article is an open access article distributed under the terms and conditions of the Creative Commons Attribution (CC BY) license (https://creativecommons.org/licenses/by/4.0/).
Share and Cite
MDPI and ACS Style
Qian, J.; Fu, D.; Zhou, T.; Singh, R.P.; Miao, S. Impact of Environmental Factors and System Structure on Bioretention Evaporation Efficiency. Sustainability 2022, 14, 1286. https://doi.org/10.3390/su14031286
AMA Style
Qian J, Fu D, Zhou T, Singh RP, Miao S. Impact of Environmental Factors and System Structure on Bioretention Evaporation Efficiency. Sustainability. 2022; 14(3):1286. https://doi.org/10.3390/su14031286
Chicago/Turabian StyleQian, Jingming, Dafang Fu, Tong Zhou, Rajendra Prasad Singh, and Shujiang Miao. 2022. "Impact of Environmental Factors and System Structure on Bioretention Evaporation Efficiency" Sustainability 14, no. 3: 1286. https://doi.org/10.3390/su14031286
Note that from the first issue of 2016, this journal uses article numbers instead of page numbers. See further details here.