
Born or Grown: Enablers and Barriers to Circular Business in Europe
by
 , , , and
Marie Briguglio
1,* ,
,
Leandro J. Llorente-González
2,3,
Christopher Meilak
1,
Ángeles Pereira
3,*,
Jonathan Spiteri
4 and
and
Xavier Vence
3 1
Department of Economics, Faculty of Economics, Management and Accountancy, University of Malta, MSD 2080 Msida, Malta
2
International Institute of Social Studies, Erasmus University, 2518 AX The Hague, The Netherlands
3
ICEDE Research Group, Department of Applied Economics, University of Santiago de Compostela, 15782 Santiago de Compostela, Spain
4
Department of Insurance, University of Malta, MSD 2080 Msida, Malta
*
Authors to whom correspondence should be addressed.
Sustainability 2021, 13(24), 13670; https://doi.org/10.3390/su132413670
Submission received: 10 November 2021
/
Revised: 27 November 2021
/
Accepted: 29 November 2021
/
Published: 10 December 2021
(This article belongs to the Section Economic and Business Aspects of Sustainability)
Abstract
:Circular economy goals have made their way towards the very heart of EU policy, promising the delivery of both economic and environmental goals, but key to their achievement is the active involvement and participation of businesses. Scholarly literature has made considerable headway in describing the diverse CE business model archetypes and the enablers and barriers that can nurture the transition toward them. However, little work has been done to assess a more profound distinction—that between enterprises that are born circular in contrast with incumbent businesses that grow into circularity. We review 18 case studies of businesses in Europe, which shed light on this distinction. A systematic analysis of their internal, contextual, and policy issues results in the identification of ten key enablers (including business targets, cost reduction potential, loyal customers, demographic aspects, growing waste flows, environmentalism, EU policy, circular policy, and dis/incentives as well as sectoral considerations) and ten key barriers (including bottom line concerns, problematic consumer preferences, lack of infrastructure, technological barriers, poor access to finance, competition, lack of EU harmonisation, uncertainty and lack of internalisation of externalities, and the presence of obstructive policy). We observe that businesses which are born circular seem to face fewer barriers than those seeking to grow into circularity, a finding which offers hope for the transition to a circular economy. Our analysis also suggests that while some enablers and barriers cut across different types of businesses, others tend to be more prevalent among enterprises of a certain size or sector.
1. Introduction
The circular economy (CE) has emerged as a new paradigm by which to discuss economic activity, making its way towards the very heart of European Union (EU) policy [1,2]. Transitioning to such an economy has the potential to increase EU GDP by 0.5% and create an additional 700,000 new jobs within the EU by 2030 [3], while also contributing significantly towards the EU’s goal of climate neutrality by 2050. Key to this successful transition is the active involvement and participation of business enterprises. After all, in 2018, around 91.8% of all waste generated in the EU was attributable to various business operations, notably construction (36%), mining and quarrying (26.2%), and manufacturing (10.6%) [4]. As a reflection of increased activity in the field, scholarly work on the adoption of circular economy business models (CEBM) has flourished, documenting activities from servitisation in manufacturing (e.g., [5]) to remanufacturing in the automotive sector (e.g., [6]) and repurposing end-of-life computers (e.g., [7]). Scholarly work has also identified archetypical models which broadly characterise these CEBMs. These include remake, reconditioning, circular sourcing, co-product recovery/industrial symbiosis, access, performance, and resource recovery (circular supplies) (see for example [8,9,10,11]). In turn, the transition towards the CE is likely to result as a combination of both disruptive innovation and a slow transformation, progressively incorporating new elements in line with the new paradigm [12,13,14]. Given the pivotal role that business models play in circular-oriented innovation, various tools and guidelines have been proposed that can help business strategists develop such models at enterprise level [9,15,16]. In turn, the literature on the ecology of business models and business ecosystem [17,18,19,20] sheds light on the potential to achieve circular-oriented innovation and transformation through collaboration among agents at system level.
While several papers have now been written about the enablers and barriers that impact the transition of established enterprises towards CEBMs, a literature gap remains on how these relate to those enterprises whose very business model aligns with the precepts of the CE and on the differences between such enterprises and those transitioning to circularity. We assess the enablers and barriers of 18 enterprises across Europe and contrast the insights drawn from those that transitioned or grew into circularity (GC) with those taken from enterprises that were ‘born’ circular (BC). Our study provides further nuance in that the cases reflect diverse CEBM archetypes, pertaining to enterprises of different sizes and describing businesses operating in different contexts, across priority EU areas [2].
In what follows, we outline the salient findings from the literature as to what constitute the main barriers and enablers to circular economy business models, supplementing the review by a summary of what is known about the challenges and opportunities faced by SMEs in their quest for circularity and by insights from the field of innovation and entrepreneurship for sustainability. We then proceed to outline the materials and methods applied in the paper (accompanied by Appendix A, Appendix B and Appendix C), starting with the selection of case studies and proceeding to data collection, coding, and analysis. In the third section of the paper, we present the results. We start with the analysis of the enablers and barriers, reviewing the business-level, the contextual, and the policy-level issue that emerge from our case studies. We then assess how these differ between enterprises that are born circular and those that are growing into circularity. We conclude the analysis by revisiting the enablers and barriers by enterprise size and sector. The fourth section presents a discussion, including recommendations and caveats, while the fifth section concludes.
1.1. Barriers and Enablers to Circular Economy Business Models
In recent years, there has been a surge in scholarly interest in the barriers, drivers, and enablers for the implementation of innovation oriented towards the CE. Among the most recent studies, a framework consisting of seven main categories of drivers and barriers (supply chain, institutional, economic, environmental, social, technological, or informational) has been proposed [21]. In their analysis, the authors highlight the relevance of context as an important factor affecting the possibility of applying a circular model. Another study tackling similar questions [22] classifies barriers to circular models based on a meta-analysis of cases, including organisational, market, technological, behavioural, and institutional factors. The barriers tend to be influenced by business model changes, disruptive qualities, and innovation types.
Diverse studies approach the question of barriers and enablers from different perspectives. For instance, internal barriers and external barriers may be distinguished [23]. These different obstacles were identified to different degrees in four different types of CEBMs implemented by 31 Dutch companies. A total of 13 motivational drivers and 39 barriers were clustered into those pertaining to internal/external environments, and in turn related to one or more stakeholders, namely organisation, supplier, government, consumer, and society [24]. In a study focusing on the meso-perspective (eco-industrial parks, environmental, sustainable and green supply chains, and closed-loop supply chains), eight key drivers were identified, namely resource efficiency gains (that increase competitiveness), new value streams through utilisation of by-products and waste, avoiding regulative costs of environmental pollution and waste, brand reputation and the right to operate in global markets, improved brand reputation with consumers, increased business resilience, and reduced risk [25]. The authors further classify barriers as financial, technological, societal, informational, and institutional. Studies on specific industries and products include those on textile and apparel activities [26], plastic [27], mining [28], end-of-life management of PV panels and BESS [29], among others.
1.2. SMEs and Pioneers
Within this field of enquiry, an emergent sub-field which is particularly pertinent to this study is that which focuses on the barriers and enablers that apply to small and medium enterprises (SMEs) [30]. Although SMEs are not necessarily start-ups, in practice most start-ups begin as SMEs [31]. The literature here offers some useful insights for our inquiry characterised as it is by two types of studies, namely those based on case studies and small surveys (typically limited to a specific country, sector, or region), and those which rely on statistical analyses with data drawn from large-scale surveys. An example of the former is the pioneering work on European SMEs, which finds that the main barriers to implementing CE strategies are the absence of funding and the lack of support from clients and suppliers [32]. Major enablers include having a ‘circular mindset’, the availability of regional networks, and the benefits of having a ‘green’ image. In the same vein, improving brand image and reducing costs were mentioned as drivers while the lack of public support was identified as one important obstacle to SMEs [30]. In another recent study [33], the lack of knowledge, the uncertainty of new business models, the lack of strategic view, and the legal framework were found as common barriers addressed by consultancy firms in circular projects aimed at SMEs. An example of a large-scale survey is the Flash Eurobarometer 441, conducted in 2016 on more than 10,000 SMEs across the EU-28. Studies employing this data (e.g., [34,35,36]) emphasize the importance of both contextual factors (such as the institutional framework in which the firms operate) and of firm characteristics (such as size, turnover, and sector). A distinction has also been made between insurmountable barriers and those which can be overcome with time [37].
Studies on innovation and entrepreneurship for sustainability also shed light on the question of differences between incumbents versus pioneers. Pioneering business models operating in niche areas are often characterised by having a well-differentiated value proposition, with sustainability as a key element. They tend to target specific segments through specialised channels. Their financial model is often conditioned by high costs due to small scale. The challenges they face relate to the need to find loyal customers who appreciate their value proposition, the need to focus efforts on developing the relationship with customers and distribution, and the quest to make enough profit for the initiative to consolidate in the market [38]. On the other hand, incumbents wishing to innovate their business models for sustainability tend to face the challenges of effectively combining sustainability aspects in their key product features, of increasing efficiency in their value creation and distribution activities, as well as of reducing the costs of sustainable products [38]. Incumbents may also be more reluctant to innovate due to the novelty and uncertainty of the CE paradigm. This emerges from a study using multiple cases in the servitisation of mobility. While start-ups tend to work with, and adapt to, the most radical technologies available to create and implement an innovative business model, conventional companies tend to be initially reluctant and only adopt new technologies once they become routinised [39]. There also seems to be a difference in the way these two types of businesses deal with the institutional framework and innovation [40]. A case study on circular innovation in the fashion industry shows that incumbents are characterised by rigidity when it comes to resources and legacy within established paradigms. They tend to proceed cautiously, experimenting with small-scale green initiatives [41]. Interestingly, incumbent companies tend to copy the success of niche entrepreneurs [12].
1.3. Synthesis and Gaps
In synthesis, there is growing evidence (including case studies, comprehensive regional surveys, and reviews of the literature itself) on the factors that can hinder and enable the development of circular business models and innovation. Different criteria have been used to investigate and classify the factors by type of business model, by internal/external factors, by level (product, value chain, territory), by agents involved, and by size/type/sector of enterprise. While relevant insights may be drawn from the literature on SMEs and that on sustainability, to our best knowledge, none of the studies on enablers and barriers to the CE have specifically focused on the distinctions between BC and GC enterprises. The current paper aims to enrich this literature by analysing the factors that affect the adoption of circular economy patterns, considering the different market position of the innovators. Our contribution to the literature lies not only in identifying key enablers and barriers of 18 new case studies, but also in assessing their relationship with this specific consideration (BC vs. GC), among other attributes.
2. Materials and Methods
2.1. Case Study Selection
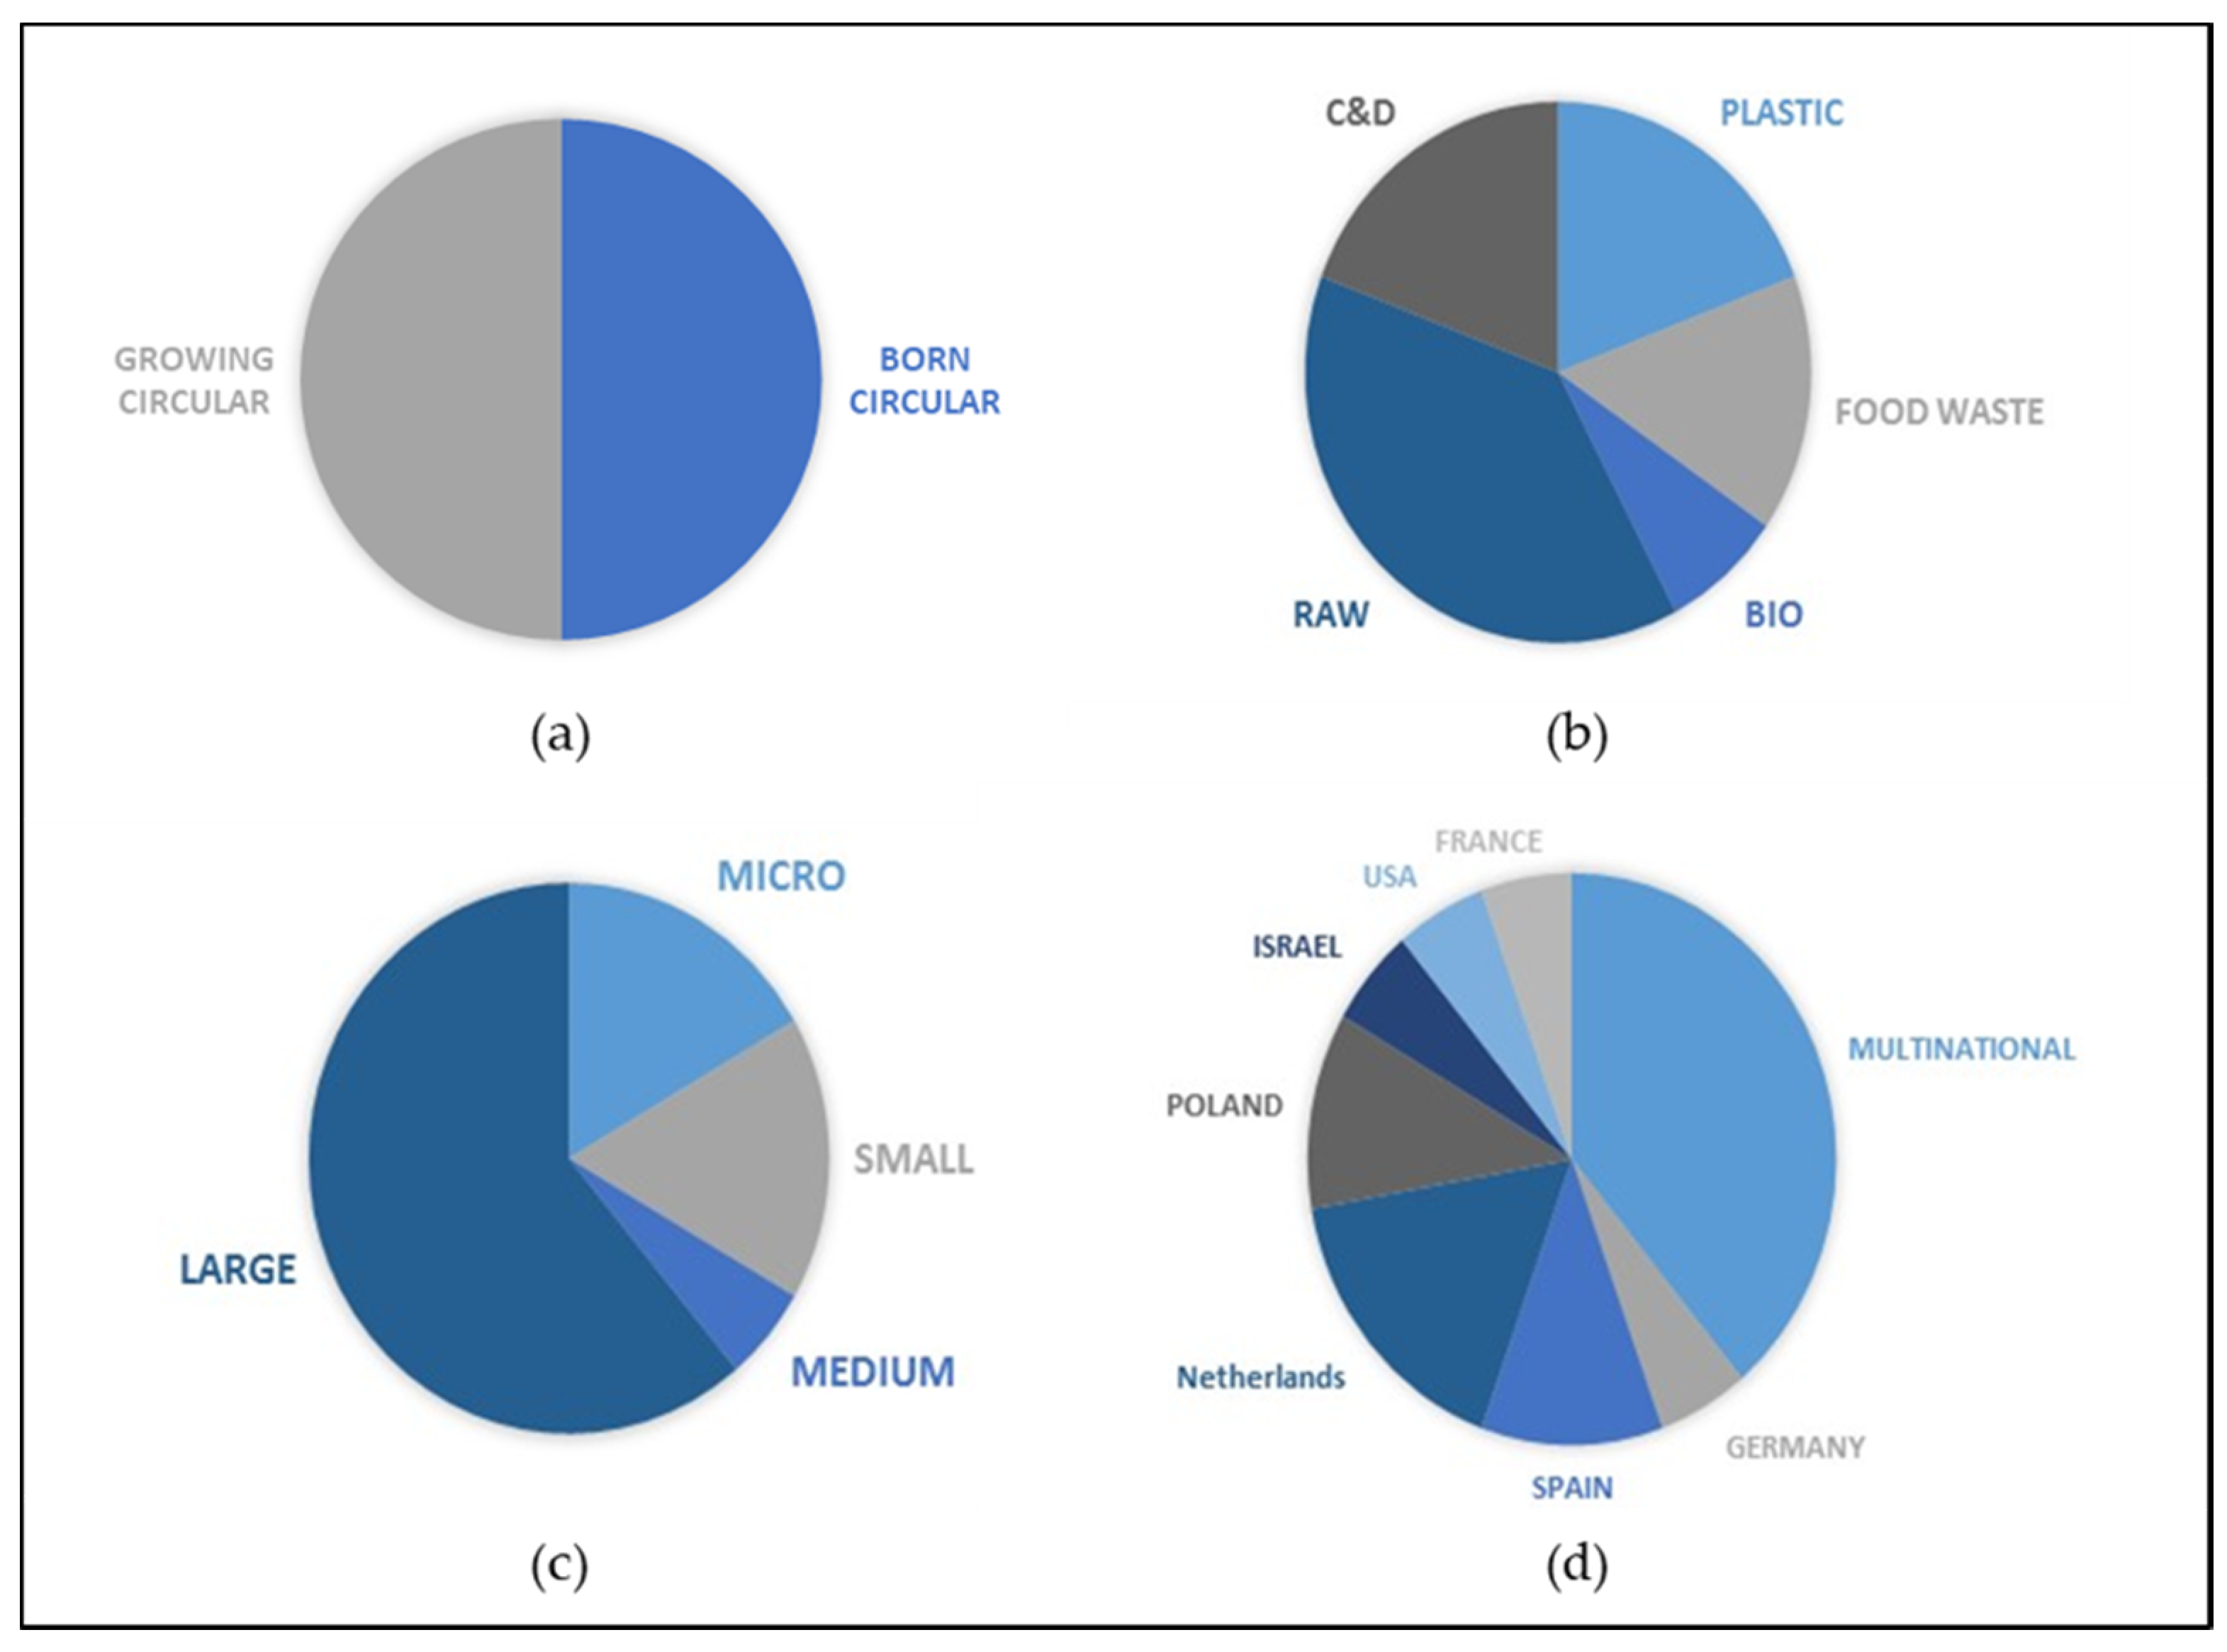
The data employed in this paper were gathered as part of a Horizon 2020 project which focused on business transitions towards circularity [42]. Sixteen partners formed the project consortium, including experts from the business sector, public bodies, think tanks, and research institutes hailing from the UK, Germany, The Netherlands, France, Spain, Malta, Poland, Belgium, and Israel. The process of identification of case studies started with a long list of over 300 potential organisations based on initial suggestions made by the consortium partners. Of these, a shortlist of fifty candidates were considered to meet three criteria, namely: a. relevance to EU circular priority areas (biomass/bio-based, construction and demolition, critical raw materials, food waste, and plastics) (These priorities have recently been revised by the EU), b. relevance and experience of circular business model, and c. with a relevant geographical market in Europe (including Israel). Selecting 18 cases out of the initial list involved the consideration of a further list of criteria, namely their ability to create maximum impact, the willingness of organisations to being part of a case study, and their having circular patterns. As Figure 1 illustrates, the selected cases offered a good range of size, geographical scope, and relevance to the EU priorities [42]. They are equally split between nine BC and nine GC entities.
The case studies that pertain to established enterprises that have grown into circularity include long-standing household names/brands, namely Philips (which operates a leasing and remake model for its MRI machines), Rolls Royce (which operates a TotalCare model for its aircraft engines), Canon (which takes used printing devices and re-conditions them), Groupe SEB (manufacturer of brands such as Moulinex, Rowenta, and Krups, which uses recycled plastics and other recycled materials in some of its products), and Inditex (the global organisation behind the Zara brand), which operates a renewable/circular collection. They also include Rehau (which produces and sells energy efficient high-end insulating window profiles) and Rockwool (which offers a take-back for building insulation materials in five countries). Vivenge (offering signage from reclaimed materials) and Park 20-20 (which installed Mitsubishi elevators based on the leasing concept) are two other case studies which demonstrate how non-circular business models can be (at least partially) transformed into circular ones.
The other nine companies include ECF Farm Systems Gmb (a German aquaponic food/bio-oriented production company), Lentura (an agro-ecological company), Revertia (which operates in the management of WEEE), Venlo (which demonstrates a publicly-owned city hall built on CE principles), the Israeli Water System (looking into the entire water cycle), Bioelektra (a Polish municpal waste recycling company), and TerraCycle (a US-based enterprise focused on the collection and recycling of traditionally non-recyclable waste streams). They also include MUD Jeans (set up in the Netherlands to allow customers to lease or buy jeans) and Phenix (which operates in the French food waste sector). A summary of these case study characteristics is provided as Appendix A Case Study Summary Description).
2.2. Data Collection
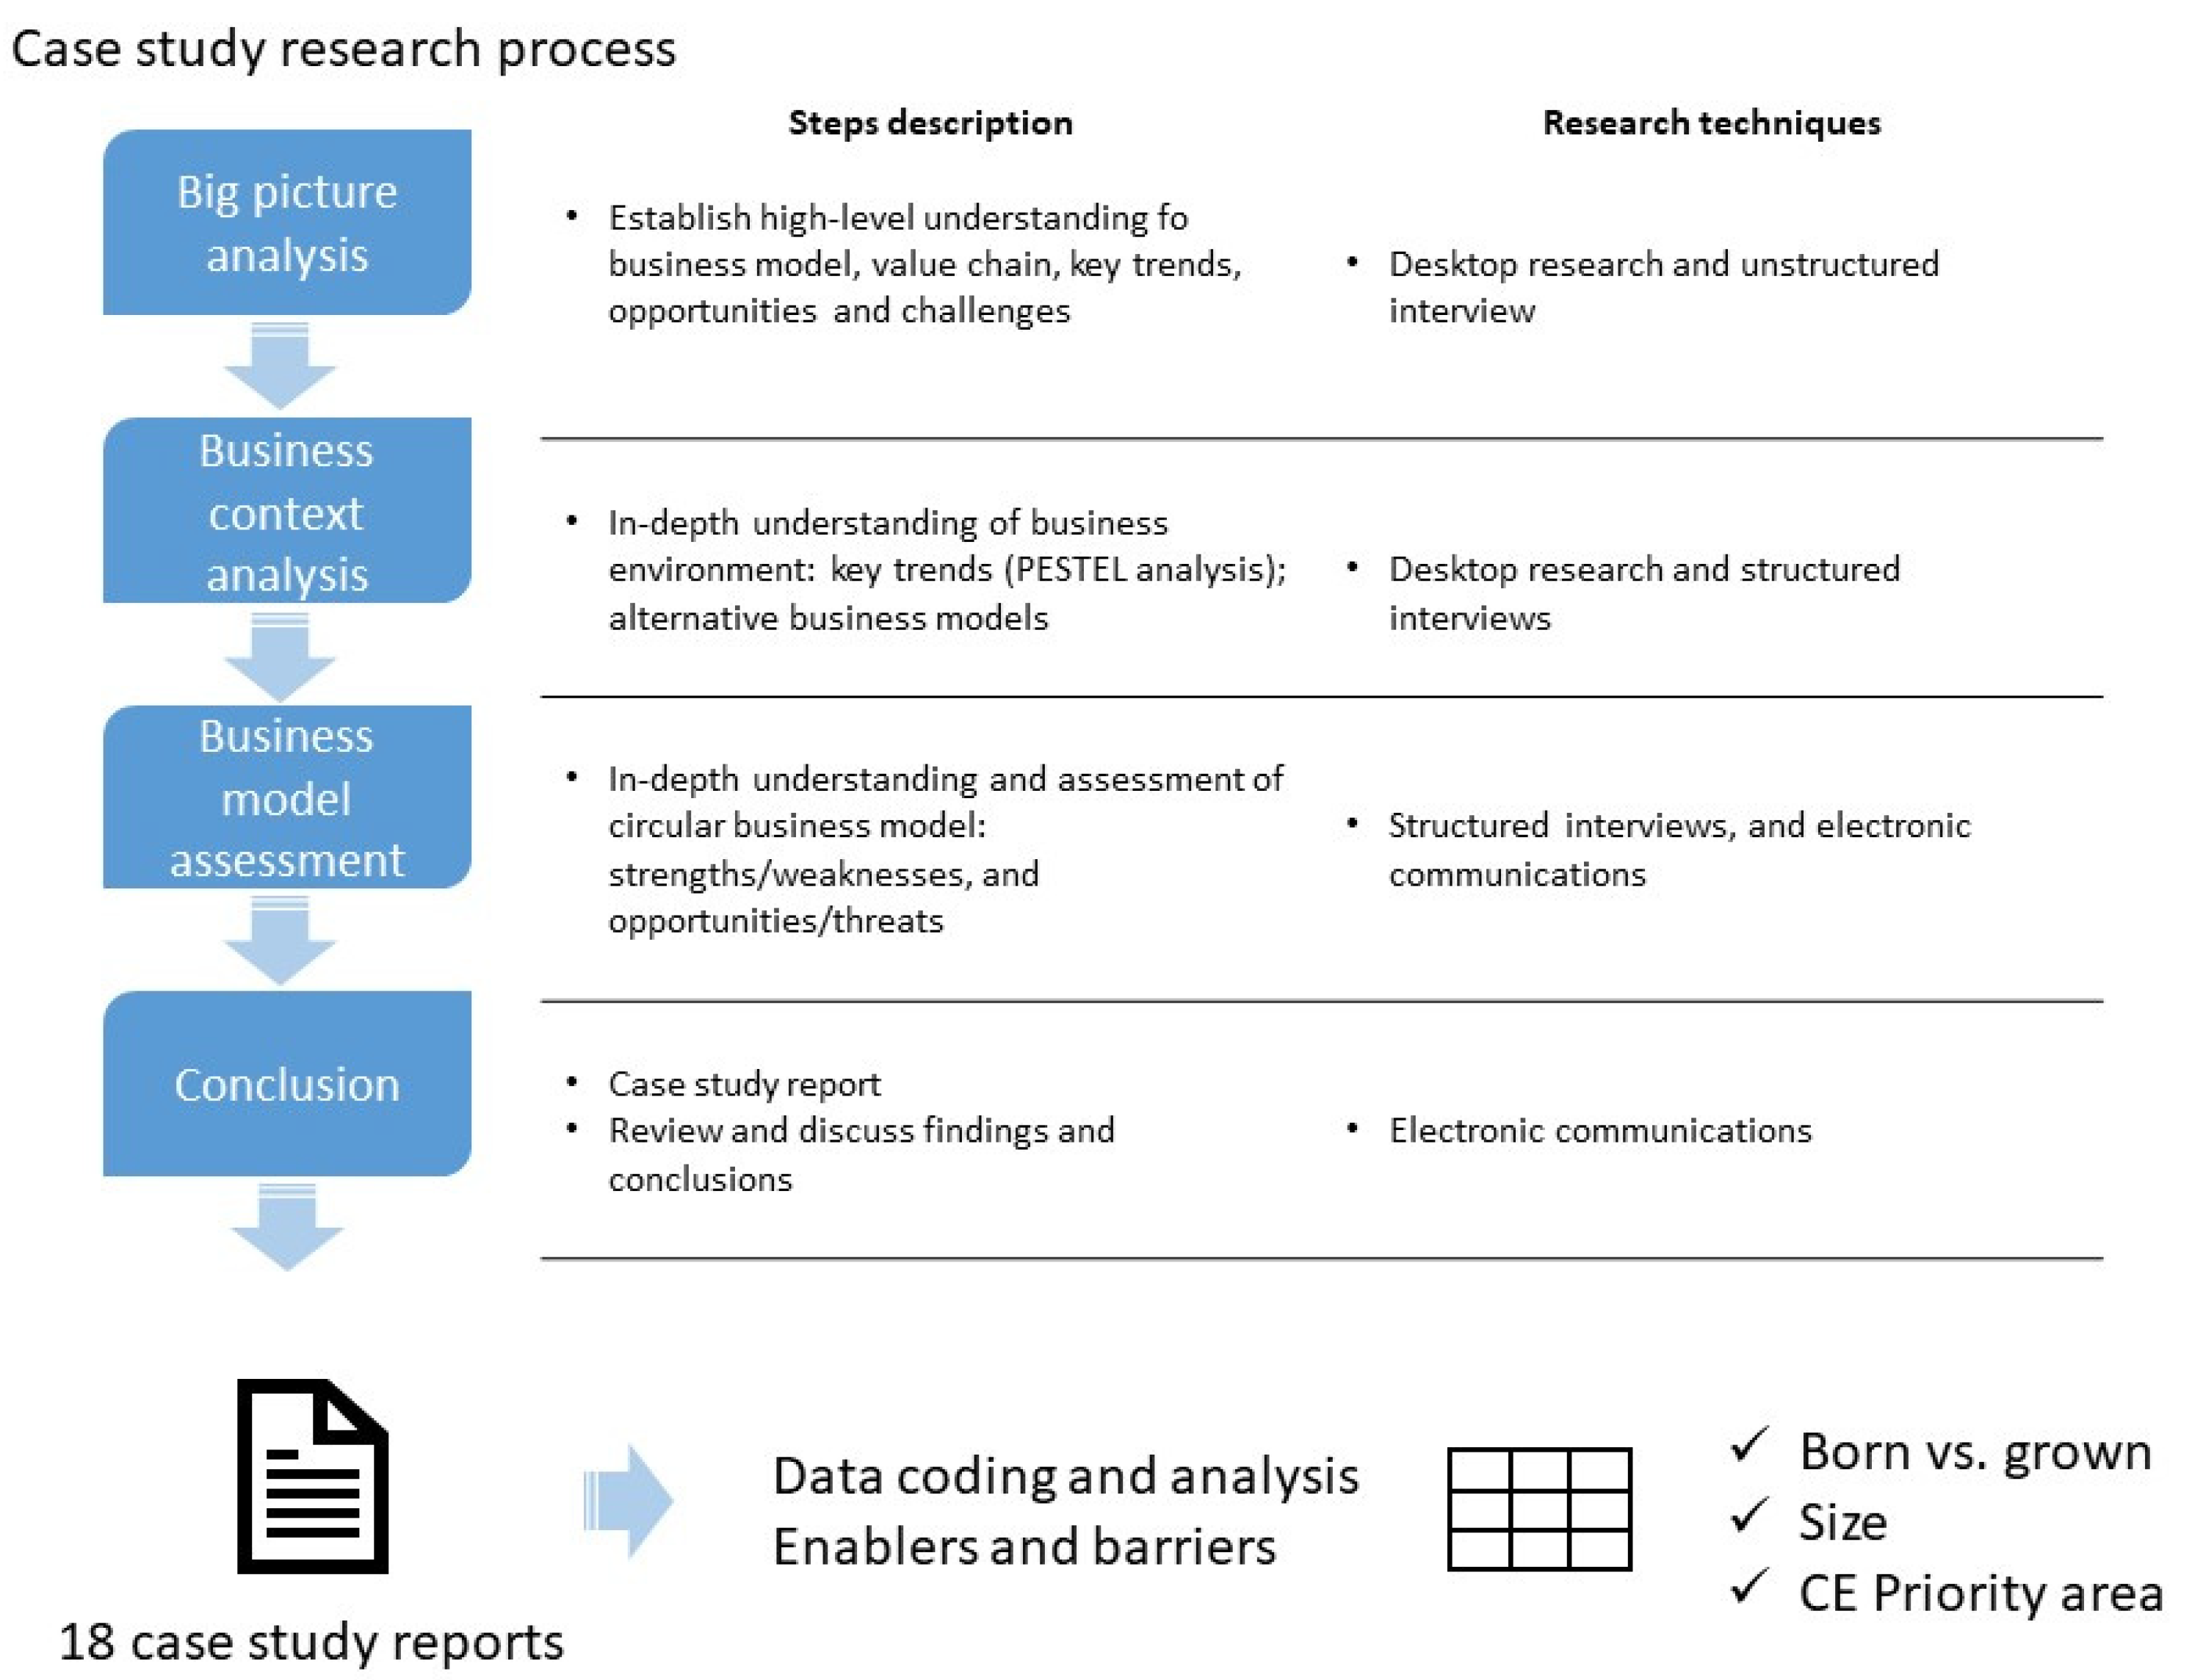
The collection of information from these case studies spanned over several months (approval from the University of Malta’s Research Ethics Committee was obtained in October 2017 (EMA002/2017) and the data gathering process was concluded by December 2018.). The first step consisted of desk research, which sought to develop a broad perspective of the case study organisation’s business model, value chain, and context, based on information that is publicly and readily available. The second step involved interviews with high-level executives within each organisation to understand regulations, policies and industry standards, socio-cultural, economic, and market dynamics, infrastructure, technology, knowledge, and innovation. The third step involved further interviews to complete a SWOT analysis and a modified version of the Business Model Canvas, similar in scope to [43], as well as the Value Proposition Canvas [44]. This enabled us to assess how CE principles currently fit into the value creation process, and to tease out the enablers and barriers that may have facilitated or inhibited the adoption of such practices. The findings derived from each step were compiled into detailed case study reports for each individual organisation, which in turn were discussed and presented to senior executives at each firm for finalisation. Figure 2 summarises the research flow.
2.3. Data Coding and Analysis
The qualitative data gathered from the case studies were then analysed using thematic analysis, as promulgated in [45] (Appendix B Thematic Analysis). The first step consisted of reading through and reviewing each of the 18 case study reports. Information was inputted into pre-determined classifications in a spreadsheet, capturing the main barriers and enablers identified in the literature. The issues were discussed with data collectors with a view to identifying any gaps. The SWOT analysis, enablers, and barriers were then examined and coded, and illustrative examples were extracted. This step allowed the re-classification of issues into ten key barriers and ten key enablers, in turn sub-clustered as business-level determinants, contextual factors, and policy issues. Inter-coder reliability was handled through ongoing discussion. Armed with these categories, the coding process proceeded whereby each of the factors mentioned received a one, while no mention received a zero. Furthermore, each case study was classified according to whether it was a BC or GC, as well as by size and CE priority (Appendix C, Case study data). Pertinent highlights were extracted from the qualitative data to illustrate what was captured by the numeric data. Information on the enablers and barriers was juxtaposed against the key characteristics of each case study. The key limitations, namely the small number of cases studied, the absence of temporal data, and the lack of controls, meant that causal inferences could not to be made. However, the sample of cases, reflecting a diversity of sizes, sectors, and incumbency, made it possible to observe certain patterns. We now proceed to examine these insights.
3. Results
3.1. Enablers and Barriers
Our first set of findings pertains to enablers at the business level, which were identified by all case studies. Within this category, the key facilitator towards circularity (mentioned in 15 case studies) is having clear business targets (including environmental performance targets, a specific circular business vision, or the clear objective of shifting to new business models). Such tangible, measurable targets act as an explicit top-down commitment, placing CE at the heart of strategic decision-making within the business. For example, Rehau had the explicit objective that by 2020, half of its production of window profiles would contain recycled materials. Groupe SEB are committed to guarantee repairability and the availability of spare parts for their brands over a 10-year period. The City of Venlo aims to be a frontrunner in the construction industry. Philips, ECF, and Mud Jeans set revenue targets from circular activities. A second key enabler is that of having a loyal customer base—indicated by 11 of the cases analysed. Businesses like Mud Jeans demonstrate how, despite the novelty of the proposition and its price, customer numbers and revenue growth were steady. Customer collaboration is highlighted in the case of Delta Development in Park 2020, the world’s first Cradle-to-Cradle certified office park. Thirdly, eight of the analysed cases recognise cost advantages as an enabler at the business level. For instance, Rolls Royce’s move towards a more service-based business model for its jet engine business reduced repair and maintenance costs. Inditex explain how making use of reused and recycled materials can reduce business exposure to fluctuating prices of raw materials. Vivenge mention that circular solutions helped make costs more predictable.
Our second set of findings focus on contextual enablers, including social attitudes and environmental awareness. Representatives from Terracycle, Vivenge, and Groupe SEB were among those who pointed at the positive shift in consumer and employee attitudes over time, causing an increased demand for environmentally friendly products. Mud Jeans noted responsiveness to media coverage and awareness campaigns and Canon and Inditex noted a stronger acceptance of refurbished, reused, and recycled products. Changing demographics and urbanisation issues are seen as a further enabler by six of the cases analysed in a context where population growth and increasing urbanisation place pressures on limited resources. ECF acknowledges aquaponics’ potential in a scenario of biodiversity loss, widespread competition for arable land, overfishing, and agrochemical impacts. Increasing urbanisation, which translates into a greater need for building reconstruction, is in line with Rehau’s value proposition. An additional contextual enabler is the large and growing waste flow, emerging from growing populations, consumerist lifestyles, and rapid product obsolescence. Bioelektra’s innovative technology for recycling and processing municipal waste is one example where this contextual phenomenon served as an enabler. Several other factors can be grouped together as sector-specific enablers. Technology and innovation dynamics in the sector are factors that facilitated Israel’s water industry and Park 2020; cross-industry collaboration and symbiosis features prominently as part of the Rockwool case; the principle of extended producer responsibility favours enterprises like Revertia, creating a market for waste electrical and electronic equipment (WEEE) management.
Our third set of insights pertain to policy enablers. The existence of a regulatory framework for circularity was one of the key enabling factors mentioned in 10 case studies. Park 2020 and City of Venlo were among those cases that referred to the positive effects of policy roadmaps for a CE. Some companies, such as Inditex, report that business decisions regarding the future are based directly on objectives set at EU, country, or city level. Regulatory frameworks also drive circularity by enhancing acceptability (e.g., the legislative mandate of Israel for water measurement and reuse) and by driving demand (e.g., Terracycle, Rehau; Phenix and French food waste regulations). Related global goals such as policies for climate protection (as mentioned by Bioelektra) and for fair trade in the textile sector (as mentioned by Mud Jeans) are also deemed to be policy enablers for circularity. Five case studies made specific mention of EU policy, particularly those in waste management and recovery (e.g., Revertia, Bioelektra, Groupe SEB). EU policy is also regarded as an important enabler by companies with strong environmental impacts. This is the case of Rolls Royce, for which EU carbon emissions trading schemes, emission targets, and other limitations constituted a significant pressure for change. In addition, five case studies make specific reference to financial incentives. These include both pricing systems that allow internalising externalities (e.g., Israel water industry) and subsidies for R&D projects (e.g., support for key suppliers referred by Inditex).
Fourthly, in terms of barriers, the most predominant business level issues mentioned were those related to costs and consumer behaviour. In 9 of the 18 cases, high costs were identified among the most relevant business level barrier. This is the case of the cost of sustainably sourced input materials (e.g., ECF’s sustainable fish feed, Inditex’s circular textile materials, and Groupe SEB’s recycled plastics). Higher costs of operations associated with innovative solutions were also mentioned, (e.g., by Canon for reverse logistics). Competition from cheaper linear business models (mentioned by Mud Jeans), insufficient economies of scale (mentioned by Lentura and Terracycle), asset-cost heavy structure (mentioned by Vivenge), and lack of income predictability (mentioned by Lentura) were further business level cost-related barriers. In eight cases, barriers at the business level were linked to customer behaviour. For Groupe SEB, misconceptions regarding the quality and/or performance of products that contain recycled materials sometimes make consumers reluctant to pay a higher price. Negative attitudes were also mentioned in regard to water re-use (Israel Water System) and food aesthetics (Lentura).
Our fifth set of findings is that when it comes to contextual barriers, a wide range of sectoral issues come into play across nine of the case studies, including growing competition in the market (e.g., the recycling sector for Revertia and the organic food industry for Lentura); switching behaviour in cost-oriented markets (e.g., visual identification for Vivenge, in Poland); bottlenecks in the supply of certain recyclables (e.g., textile industry in Inditex); and resistance to servitisation when retailers work by commission (e.g., in Canon). In five cases, contextual shortcomings were related to the inadequacy or inexistence of an adequate supporting infrastructure. Rockwool mentioned that, in the building sector, recovery, reuse, and recycling activities were hampered in Germany, Denmark, Belgium, Netherlands, and Luxembourg. The same was reported by Inditex to have happened in the clothing industry with product tracking. Other issues related to infrastructure are the over-dependence on specific logistical contractors (mentioned by Terracycle), which leads to higher costs. A total of eight case studies reported that technology acted as a barrier to the implementation of their business models. Paradoxically, the very development of the CE can become a barrier for certain CEBMs over time, especially those which feed on waste, as the supply of waste becomes more limited. In 4 of the 18 cases access to funding was a contextual barrier that hindered the possibility to shift to circularity (e.g., Lentura and Israel Water System). The difficulties of gauging risk using conventional models appears to have been a related barrier (e.g., for Mud Jeans).
Finally, while policy is often assumed to be an enabler, ten case studies pointed to standards, regulations, legislation, or policies supporting linear BMs, or penalising circular initiatives, as a key barrier for CEBMs. Some circular solutions struggle with issues related to the definition of ownership of the products or services (e.g., Park 2020). The law on waste creates barriers to commercialisation of recovered waste in Poland (as flagged by Bioelektra); policies disincentivise extending the lifetime of MRI machines in France (as mentioned by Philips). Public procurement favours lower price over sustainability (as mentioned by Rockwool). International trade agreements may have a negative impact on secondary raw material sourcing (as indicated by Rolls Royce). Bureaucracy in general was also often mentioned (e.g., Israel Water System, Revertia, and Philips). Four of the case studies mentioned the lack of fiscal tools for internalising environmental costs. Certain taxes were also reported to have disincentivised the implementation of CEBMs, including VAT on upcycled products and double taxing (mentioned by Mud Jeans), the absence of eco-taxes in construction and building sectors in the Netherlands (mentioned by Venlo), and fuel subsidies for marine fishing (mentioned by ECF). Five cases pointed to lack of regulation as another kind of policy barrier. A further challenge for refurbishment in the equipment industry (mentioned by Canon) is the lack of consistently applied protocols and standards. A similar point was made regarding the need for waste codes, to make sorting possible (e.g., Rockwool). Some of the current environmental standards, namely the Restriction of Hazardous Substances Directive and the Registration, Evaluation, Authorisation, and Restriction of Chemicals regulation, were reported to have hindered the capture of economic value after the initial use of products (Philips). Eight case studies mentioned EU policy barriers, mainly with regard to the heterogeneous application of EU directives—the interpretation of waste management regulation may vary across EU countries (as mentioned by Bioelektra and Rehau). Phenix also flagged the lack of clear incentivising regulatory regimes across countries, making it difficult to replicate CEBMs aimed at reducing food waste. The uncertain future of EU legislation was also mentioned (e.g., Groupe SEB).
3.2. Born vs. Growing Circular
The enablers and barriers discussed above can be synthesised as follows. Business level enablers include the presence of business targets, cost-reduction potential, and loyal customers, while barriers include bottom line cost/benefit concerns and problematic consumer preferences. Contextual enablers include demographic aspects, waste flows, growing environmentalism, and various sectoral considerations, while contextual barriers include lack of infrastructure, technological barriers, poor access to finance and competition. Policy enablers include EU policy, circular policy, and dis/incentives for circularity while barriers include lack of EU harmonisation and uncertainty, of policy targeting the internalisation of externalities and of suitable regulation and the presence of obstructive policy.
Building further on these findings, it is now possible to examine whether the incidence of such enablers and barriers differs depending on whether the enterprise is a BC one, where circularity was a consideration from the start, and or a GC enterprise for which circularity was an acquired goal. From our detailed case study interviews, we classified nine BC and nine GC enterprises. The classification of case studies as either BC or GC hinged on whether the enterprises were established with a clearly delineated circular economy business model from inception, based on the CEBM archetypes [9,10,11], or whether such practices or models were introduced later on during the enterprise’s existence (or are in the process of being implemented).
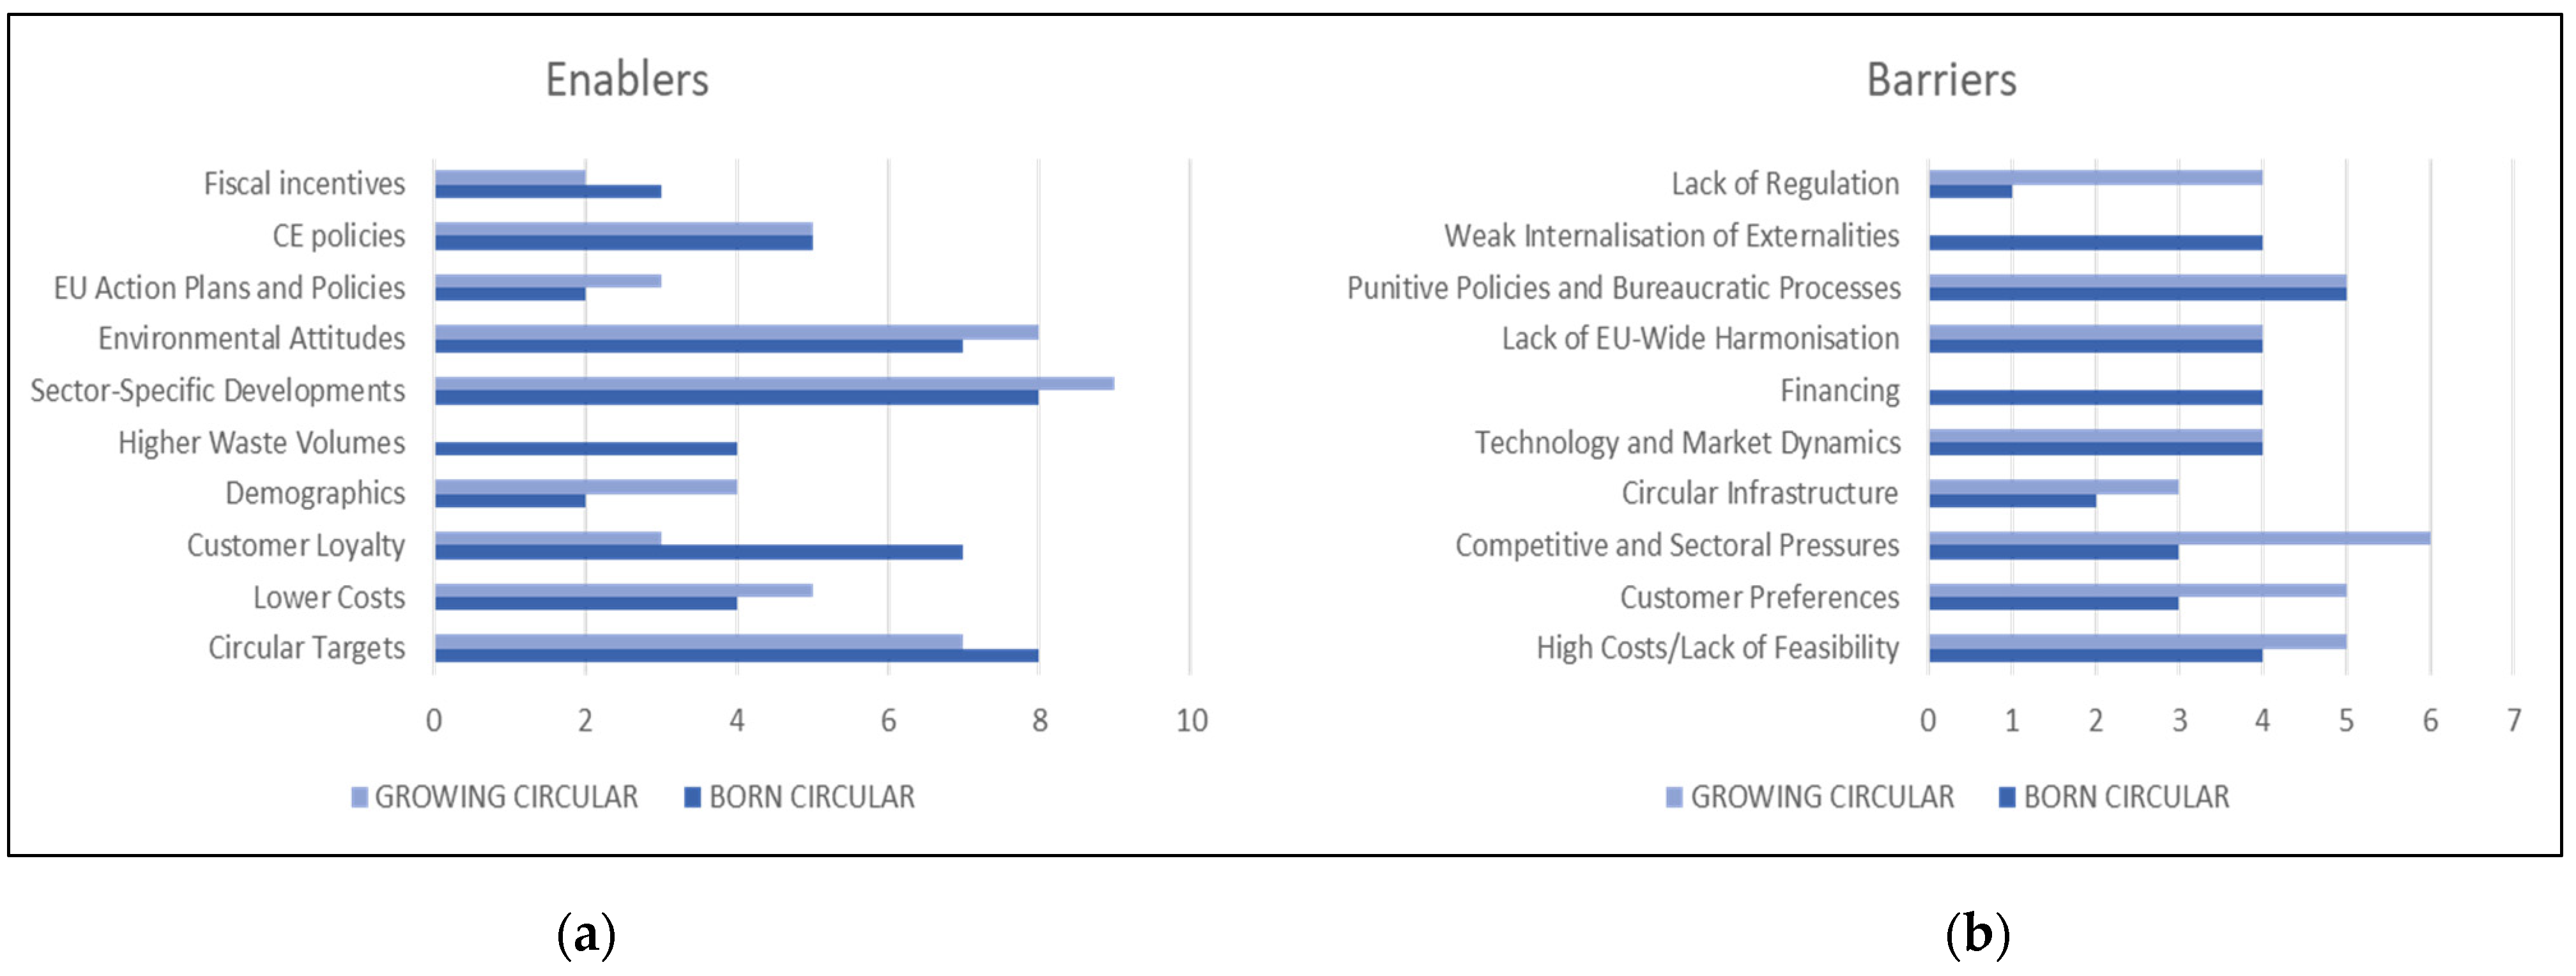
Figure 3 presents the enablers and barriers once they are assessed according to frequency of mention among BC and GC enterprises.
We start with the enablers. When it comes to the BC enterprises, the top enablers mentioned were the presence of business targets, sectoral conditions, growing environmentalism, and loyal customers. For our GC firms, on the other hand, the first three enablers received similarly high mentions, but customer demand and loyalty were mentioned with far less frequency. This seems to be more pertinent for circular start-ups, particularly in the early years as the business takes shape due to the innovative nature of the circular business model. For example, Lentura specifically cited a number of studies which show that awareness and concern among European consumers when it comes to food origin, environmental impact, and health is increasingly on the rise, which has therefore led to growing interest in their organic food offerings. BC firms also tended to mention waste volumes far more frequently than GC firms, many of which did not really refer to this at all as an enabling factor. This may speak to the broader business case for setting up such circular firms in the first place, given that rising waste volumes create an opportunity for entrepreneurs to enter the fray and capture value. For example, as mentioned earlier, Bioelektra’s business model for resource recovery has been significantly enabled by the growing volume of municipal waste generated globally every year, resulting in greater demand for their specific type of waste treatment.
A further interesting observation emerges when looking at policy enablers. In both BC and GC enterprises, there is emphasis on the importance of circular policies at the national level. Such policies seem to help both to create an environment within which circular innovation and entrepreneurship can flourish as well as encouraging established firms to begin their circular journey. From a BC perspective, Phenix mentioned the crucial role played by France’s stringent food waste management regulations in enabling a company like theirs to operate and flourish (in particular the so-called “Coluche Law” which enables food retailers and manufacturers to benefit from a 60% corporate tax deduction on any food that is donated rather than disposed, coupled with new food waste regulations introduced in 2016 (“Loi Garot”) that, among other things, effectively banned the disposal of unsold food items before their sell-by date). From the GC side, Rockwool specifically mentioned the favourable waste management regulations in countries like Netherlands and Denmark as key enablers to the recovery and reuse of materials. Heavy restrictions on landfilling coupled with punitive taxes on landfilling and incineration helped to promote a more circular approach to waste management. Interestingly, BC firms paid more attention to dis/incentives from policy while GC firms paid more attention to EU policy as enabling agents.
We now turn to the barriers. It is amply clear that established GC firms experience greater barriers relative to their BC counterparts which were set up for circularity. As seen below, the leading barrier for firms that are BC is obstructive policy and bureaucracy. For example, Revertia mentions that while extended producer responsibility schemes for WEEE across Europe support the functioning of their business, in practice, this is hindered by various issues such as lack of transparency in the products managed and significant bureaucratic burdens when it comes to the transfer of waste. Other important barriers are the lack of policy to internalise negative externalities, lack of EU harmonisation and uncertainty, lack of financial support, technology, and the relative cost-to-benefit ratio of circular offerings relative to traditional linear ones. The lack of financial support for those entities which are BC emerges clearly, indicating that circular entrepreneurs face challenges when seeking out financing from banking and other traditional financial institutions in order to implement their business plans, potentially also reflecting their status as innovative yet risky start-ups. MUD Jeans specifically mentions the lack of available investment as a key hindrance to scaling up its business model and achieve profitability. Interestingly, firms which are BC also emphasise the lack of internalisation of negative externalities (by other entities) as a key barrier, while GC firms tended to omit this factor altogether. Circular start-ups may be better placed to notice such realities given their attempts at penetrating different linear markets. For example, ECF mentions this lack of internalisation as a limiting factor in its drive towards improved competitiveness within the marketplace. For ECF, the carbon footprint of traditional farming, the lack of transparency of ‘food miles’ travelled, as well as a lack of internalisation when it comes to biodiversity loss is an issue. On the other hand, firms which are growing into circularity placed far more importance on a lack of regulation pertaining to the CE.
In turn, among the established GC firms, competitive pressures and sectoral conditions emerged as a chief barrier. Competition is likely to keep on increasing as more firms adopt circular business practices and new start-ups emerge, which in turn may lead to greater upward pressure on the price of secondary raw materials due to higher demand (e.g., recycled plastics). For example, Rehau mentions that the lower cost of recycled relative to virgin raw materials used to produce its window insulation has resulted in growing demand for this input, coupled with increased pressures from existing competitors. GC firms also mentioned obstructive policy and bureaucracy, consumer preferences, and relative costs-to-benefits as the key barriers to circularity in their case. The mention of consumer preferences underscores the potential challenges of trying to change business practices and product offerings for consumers who are used to existing linear value propositions and may thus be resistant to change. For example, Canon specifically mentions that customer preferences for ‘new’ products act as a prominent barrier to the uptake of its remanufactured and refurbished printing equipment, despite quality assurances, particularly as competition and declining demand for printing has driven the price of new machines downwards.
It should be noted that some issues are prevalent across both BC and GC enterprises. The importance of relative costs as barriers to circularity is evident across both types of businesses, pointing towards the enduring prevalence of these barriers. Thus, the need to address externalities prevails as a matter to address for both types of business. For example, Groupe SEB explicitly mentions that the volatility and upward pressure on recycled plastic is swiftly eroding any cost benefits relative to virgin raw materials, which in turn reduces both the business case as well as customer demand for circular products. Obstructive policy and bureaucracy also score highly across both BC and GC firms, reflecting the fact that existing public policies may penalise circular entrepreneurs and businesses seeking to embark on their circular journey, either by continuing to implicitly favour longstanding linear business models or by creating prohibitive levels of red tape.
3.3. Size and Sector
We now assess mentions of each of the issues emerging from the 18 case studies and contrast the findings in two groups: SMEs versus larger enterprises. It is worth noting that of the nine BC enterprises, six are also SMEs, while only one GC business is an SME. Indeed, several of the findings overlap, underscoring a certain overlap that exists between circular SMEs and BC categories. However, we do note some distinctions, notably, the lack of focus on internalisation of externalities and on the need for EU policy harmonisation suggests that while SMEs are largely focused on limited domestic market conditions, our BC firms also have a more European perspective to their operations and are more acutely aware of the continued lack of unaccounted for negative externalities emanating from the linear model. Similarly, while a lack of financial support was not an important barrier for SMEs, it was a key consideration for BC firms, indicating that the financial challenges faced by these enterprises are not simply related to their size or start-up nature, but rather due to the innovative nature of their business, which may be deemed to be risky by investors and financial institutions alike. This also ties in with the importance of technological limitations as barriers to the CE for BC enterprises, as opposed to SMEs, since the former would require the latest cutting-edge technology in order to scale up their circular business ideas and continue to expand.
Finally, we assess the mentions of enablers and barriers across the specific CE priority areas. Our headline finding here is that those enterprises involved in critical raw materials were the most likely to mention a wide range of barriers and the least likely to identify enablers. On the other hand, the construction and development sector identified more enablers than any other sector. In all instances, contextual issues were the most likely enabler to be mentioned, with the exception of the food sector. The relative importance of barriers varies considerably across our case studies when assessed by sector, with particularly notable differences in the biomass sector. Environmentalism was particularly important for the plastics sector, while those in the construction sector tended to mention cost reduction with higher frequency. Policy issues were the least likely issue to be mentioned as an enabler in any sector. With regard to the main barriers, relative costs and benefits were deemed among the most important across the board, but the state of existing infrastructure was cited as a key barrier in the food priority area. Those case studies involved in biomass were more likely to highlight EU harmonisation and obstructive policies as main hindrances. Enterprises in the field of critical raw materials and construction and development were particularly concerned with competition and with policy as a barrier. The diversity in prevalence of enablers and barriers related to the EU areas may suggest a need for more specific policy review.
4. Discussion
Our main findings regarding both enabling and deterring factors find resonance with those identified in the literature [21,22,23,24,30]. Like others, we note the importance of business level issues (business targets, costs, consumer preferences, and loyalty), contextual issues (demographics, waste volumes, environmentalism, infrastructure, technology, finance, and sector-specific issues), and policy (including EU policy and its harmonisation, circular policy, dis/incentives, and obstructive policy). Worthy of singling out from our analysis of enablers and barriers is the importance of the need to internalize environmental externalities, and for enhanced harmonisation at the EU level (and beyond). Aside from CE policy, it also seems important to address the unintended consequences of other policies (for example, competition and health and safety laws) on the CE. Larger firms, those involved in the use of critical raw materials, and those engaged in reconditioning seem to face stronger barriers. An interesting emerging issue is the need to adjust policy responses as the CE becomes more dominant: waste patterns have created enabling circumstances for some CEBMs but, as less waste is generated, businesses may need to readapt.
Our findings on the distinctions between BC and GC firms also chime with those found in the sustainable innovation literature [12,26,38]. Firstly, we find that, although BC firms paid more attention to dis/incentives and internalisation of externalities and GC firms paid more attention to EU policy as enablers, both BC and GC firms reported to have been affected by national policy and institutional elements. In this regard, our results suggest that the emergence of new circular firms (BC) in the market would benefit from changes in existing policies including through the introduction of disincentives to linear practices, which would allow them to compete on better terms. Similarly, setting clear circularity objectives (by sector of activity) can be an important move to nudge incumbents towards new, more circular models. These results reinforce the need for policies that set strict circularity targets by sector, for instance by encouraging extended producer responsibility for the life cycle of their products.
Secondly, we note that among BC firms, customer demand and loyalty was mentioned with far greater frequency than among GC firms. That BC firms enjoy the prospect of a strong customer base and its consolidation with an innovative sustainable value proposition was also previously found in sustainable entrepreneurship literature [38]. Meanwhile, such factors are comparatively less important for GC firms given their larger scale and well-established presence in the market. Nevertheless, among the established GC firms, competitive pressures and sectoral conditions emerged as a chief barrier. These findings suggest a need to promote circular consumer practices and disincentivize linear consumption. An example would be the mandatory provision of information on the environmental impact of products and services, complemented by the development of standardised measures of their degree of circularity [46].
As expected, BC firms tend to mention lack of financial support, which has also been found in recent literature [26]. Logically, the transition to more circular models will come at a cost. Experimenting with and implementing these new models requires the expansion of public and private funding mechanisms for research, development, innovation, and widespread diffusion of new circular business models.
We also observe, in line with previous literature, that the degree of innovation for circularity differs in scope between incumbents and born circular firms [39]. The analysed cases show, in general, that BC companies implement more disruptive circular models, such as garments leasing or aquaponics. They also take advantage of gaps left by the linear model, such as minimising waste food and preparing computers for reuse. Incumbent companies, on the other hand, grow into circularity by combining new patterns with their linear business models or as subsidiary models. One way to support disruptive circular models is to establish the principles of circularity as a relevant criterion in public R&D calls. This could be accompanied by the development of specific financial products, adapted to the risk and innovative nature of circular economy projects.
Further analysis of enablers and barriers across the CEBMs by their particular attributes (size and priority area) also yielded relevant insights and represent a novel contribution of this paper. While national policy is a key issue for SMEs, larger firms are more concerned by policy at the EU level, particularly on the matter of harmonization and uncertainty. The assessment of the main issues that were pertinent across the five EC priority areas reinforced the call for targeted sector-focused policy intervention. Businesses involved in critical raw materials, for instance, appeared to face greater challenges than others, for instance [28]. This result emphasises the need for sector-focused policies.
It is important to caveat these findings by stating that working with case studies comes with methodological limitations. Firstly, the case studies feature companies of different sizes, in different industries/sectors, employing diverse business models, and operating in different territories. While this enriches the analysis, it also makes comparison harder. Secondly, as many of the case studies were in their initial phase at the time of data collection, with only a few months or years of trajectory, there is insufficient information on their degree of success in terms of the level of circularity achieved. This issue is further aggravated by the general lack of established metrics and targets [47] to gauge the impact of each CEBM on the different stakeholders. Thirdly, the sample of cases under study does not include any counterfactual case, i.e., a firm that did not adopt a CEBM, which could give further valuable insights on the barriers to circularity. Such analysis certainly merits investigation. Finally, it is worth noting that developments in the field are taking place at a rapid rate. Blockchain technology, for instance, is emerging as a possible solution to overcome some of the current barriers of implementing the concept of the CE [48], and there appears to be considerable scope for research in this nascent area [49].
5. Conclusions
The aim of this paper was to study the enablers and barriers that concern established firms that are ‘growing’ into circularity and contrast these with those that are ‘born’ circular. In order to do so, we profiled 18 case studies and conducted a systematic analysis of their enablers and barriers. We then assessed these by nature (BC vs. GC), by size, and by sectoral priority area.
Despite the methodological limitations inherent in working with case studies, both the breadth of this study (cross-country, multi-sector, diverse sizes and business models) and its scope offer a contribution to the current literature regarding enablers and barriers for the CEBMs. Furthermore, it provides new insights on the relevance of making a distinction between the factors affecting new firms whose business models were conceived for circularity and those that apply to more mature companies which started out in a linear economy. This resonates with literature in the field of sustainable innovation which suggests that there are likely to be differences in the behaviour and evolving path depending on the firm’s market position.
To conclude, we find that a new generation of business is emerging, established for circular goals, and facing somewhat different challenges and opportunities from those transitioning to circularity from linear operations. Our main results point to the fact that those enterprises which we dub ‘born circular’ face considerably fewer barriers than incumbents, offering hope for a new generation of business which will face fewer obstacles and advancing more smoothly towards the goal of a CE. This said, the transition towards the CE is unlikely to be driven solely by this kind of enterprise, but rather through adaptive evolution, where the effects of BC firms, combined with the slow transformation of the GC business models will progressively incorporate new elements in line with the new CE paradigm. Researchers in the field would do well to explore this with a larger sample of such enterprises over a longer period of time, contrasting the effects of BC, GC, and, indeed, firms which continue to adopt linear business models. Scholarly work on metrics would not only allow the assessment of the impact of such firms in research but also in practice.
Author Contributions
Conceptualisation, all co-authors; methodology, all co-authors; validation, C.M.; formal analysis, M.B., L.J.L.-G., C.M., Á.P. and J.S.; investigation, L.J.L.-G., C.M., Á.P. and J.S.; data curation, L.J.L.-G., C.M., Á.P. and J.S.; writing—original draft preparation, M.B., L.J.L.-G., C.M., Á.P. and J.S.; writing—review and editing, M.B., L.J.L.-G., C.M., Á.P. and J.S.; visualisation, M.B.; supervision, M.B. and X.V.; funding acquisition, M.B. and X.V. The authors build upon the work they conducted as part of a Horizon 2020 project documented in Deliverable 6.2: summary of key factors of CEBM. The R2π Project Consortium; 2019. All authors have read and agreed to the published version of the manuscript.
Funding
Transition from Linear 2 Circular: Policy and Innovation Project funded by the European Union’s Horizon 2020 research and innovation programme under grant agreement No. 730378.
Institutional Review Board Statement
The data collection process reported in the study was approved by the Research Ethics and Data Protection Committee of the University of Malta (EMA002/2017) on the 2 October 2017.
Informed Consent Statement
Informed consent was obtained from all subjects involved in the study.
Data Availability Statement
The R2π case study reports and Deliverable 6.2: summary of key factors of CEBM, used as sources for this article are available on the R2π project website http://www.r2piproject.eu/ (accessed on 2 November 2021).
Conflicts of Interest
The authors declare no conflict of interest.
Appendix A

Table A1.
Case study summary descriptions.
| Case Study 1: ECF Farm Systems GmbH (ECF) | Born Circular—Founded in 2012, ECF is an aquaponic food/bio-oriented production organisation based in Germany, which engages in the sale of potted herbs to supermarkets and sale of fish to supermarkets and restaurants. In production, material flows are exchanged between the aquaculture and the hydroponic operations, enabling co-product recovery. ECF also engages in Build–Own–Operate (B-O-O) aquaponic farms (co-management of plants). |
| Case Study 2: Inditex (brand name Zara) | Grown Circular—An international organisation founded in 1985 that operates in the textile manufacturing industry, with head offices in Spain, which is increasing the number of products that use renewable and circular raw materials. Textile waste from its factories is recycled and added to virgin materials to develop new fibres that can re-enter garment manufacturing processes. It enables disposal of unwanted clothes to be donated, recycled, and transformed into new fabrics and supports third sector organisations for collection systems. |
| Case Study 3: Lentura | Born Circular—An agro-ecological production organisation founded in 2009 and based in Spain, operating a direct sales model whereby produce is sold to school canteens and farmers’ market, as well as managing a subscription model for box schemes to households. It offers products with a renewable main material base that is easily reintegrated into biological cycles. Both livestock excreta and packaging used in products/activities are recovered and reused as inputs for new production cycles. |
| Case Study 5: Rockwool | Grown Circular—Operating within the construction and building materials sector since 1976, it offers take-back and recycle programme for building insulation materials in 5 countries. At end-of-use, the material taken back from customers is recovered, and during production, this is combined also with secondary materials originating from other products or industries to make new insulation material. |
| Case Study 6: Vivenge | Grown Circular—A one-stop shop for durable visual identification (signage) involved in rebranding operations and related services (e.g., installation, logistics, design, warehousing, disassembly, waste sorting, utilisation, maintenance) and selling of material reclaimed during the disassembly of the end-of-life products. It returns parts into a new overall product and in every disassembly and utilisation, resources from products are recovered and sent to companies as feedstock for production. It was founded in 1997. |
| Case Study 7: Venlo | Born Circular—A publicly owned city hall built on a number of circular economic principles: the building generates its own energy, purifies water, and creates a healthy indoor and outdoor air quality. It uses mainly recycled, recyclable, or renewable content and offers buy-back options. Cradle to Cradle Certified products are used. Material passports are employed and agreements are made for take-back and residual value. Resources are re-used (through biological or technical cycles). It opened its doors in October 2016. |
| Case Study 8: Park2020—M-Use® elevator | Grown Circular—This case study is related to an elevator located in a full-service Cradle to Cradle office park. This elevator is not owned by the user, but by the manufacturer (Mitsubishi) who leases the product, retains ownership, and sells vertical integration. Using intelligent software and close monitoring, the developer can schedule more efficient maintenance, extending the lifespan of the elevator and performance. Once the lift reaches its end of life, the developer has a take-back programme in place, permitting the disassembly of the elevator and the reuse of its components. The idea started taking shape in 2015. |
| Case Study 9: Israel water system | Born Circular—The entire water system of Israel copies the natural water cycle. Water passes through a number of cycles, including sourcing, collection and storage, conveyance and distribution, uses, and recovery and cleaning. It is reused at the technical and biological level in a closed system. Sludge and other water waste material are used as a fertiliser and energy stock. All water sources are publicly owned and use is subject to a fee per quantity. Water is used and re-used at the technical (such as industrial processes) and biological (such as agricultural) level in a closed system. |
| Case Study 10: Bioelektra | Born Circular—This case study operates in the waste management industry in Poland, specifically recycling mixed municipal waste using an innovative mechanical-heat waste treatment (MHT), where up to 96% of the municipal solid waste stream is recycled with no need of separate collection. It was founded in 2013. |
| Case Study 11: TerraCycle | Born Circular—This US-based waste management company (operating in 21 countries) was founded in 2001 and is involved in the collection and recycling of waste streams that are traditionally considered not recyclable. The company designs and manufactures products from recycled materials for closed loop solutions. |
| Case Study 12: MUD Jeans | Born Circular—This Dutch retail/fashion company was set up in 2012 and allows customers to lease or buy jeans. Customers are called after one year and asked whether they would like to keep, switch, or send back their jeans. Jeans that are returned by customers are upcycled when possible to turn them into vintage jeans that are re-sold. If jeans are torn through wear, they are repaired for free. |
| Case Study 13: Philips | Grown Circular—An international technology company with head offices in Amsterdam, it also operates in the magnetic resonance imaging (MRI) sector. They operate a service of optimising the machines by allowing for software and hardware updates; enhance MRI machines in time to improve their capacity and functionality; re-make the machine entirely (leaving only the main magnet); harvest and reuse components; offer a service of trade-in, whereby the customer can trade in their old MRI machine; and use extra components in other processes. Leasing agreements are possible too. |
| Case Study 14: Rolls Royce | Grown Circular—This enterprise’s aircraft engines division has implemented a servitisation/product-service system. The company remains responsible for the Maintenance, Repair, and Overhaul (MRO) provision (referred to as the “TotalCare” business model). This scheme has been in operation for around 20 years, with ongoing maintenance of engines and component parts over the asset lifetime, and efforts to restore life into the asset at intervals and as required. The Revert programme for materials recovery permits the option to buy-back and reclaim end-of-life engines so that materials can be recycled back into its manufacturing supply chain. |
| Case Study 16: Groupe SEB | Grown Circular—A leading global manufacturer of small domestic appliances, headquartered in France and operating worldwide, the focus of the case study is a steam generator for linen. The case includes the use of recycled polypropylene (plastics) and other recycled materials, the offer of a 10-year guarantee, allowing for reparability, cooperation with the national Producers Responsibility Organisation (PRO), and a system of WEEE collection/processing, producing recycled plastic. |
| Case Study 17: Phenix | Born Circular—Founded in 2014, this French company operates in the food waste sector which has set up a digital platform that works as an intermediary, connecting waste suppliers (mainly retailers) and waste receivers (mostly charities). The enterprise thus prevents food close to expiration date from being wasted, and turns it into food donations, sourcing food from retailers’ unsold goods. Food unsuitable for human consumption is turned into energy or animal food stock. |
| Case Study 18: Rehau | Grown Circular—A large enterprise of German origin (founded 1948), head quartered in Switzerland and operating in another 50 nations, it produces and sells energy efficient high-end insulating window profiles (frames), which increase the energy efficiency of buildings. Their glass-fibre PVC uses less steel than other similar profiles. In tandem with another German high-tech SME, it has developed a tracer system which allows the company to identify and sort the PVC glass fibre-waste. It recuperates PVC cuttings, melts them, granulates them, and reuses them as part of new profiles. |
Note: Detailed descriptions of each case study are accessible on the R2π project website http://www.r2piproject.eu/ (Accessed on 1 December 2021).
Appendix B
Table A2.
Case study thematic analysis.
| Level | B/E | Heading | Select Keywords | Examples |
|---|---|---|---|---|
| Business Level | Enablers | Business Targets | “internal goals”, “requirement”, “seeking to” | “Rehau has an explicit objective that 50% of its window profile production by 2020 ought to contain recyclate” |
| Cost Reduction and Stability | “optimize costs”, “desire to cut costs”, “price of raw materials has been increasing and very volatile” | “The raw product price after TerraCycle’s processing is currently lower than market price” | ||
| Customers | “loyal and active customers”, “customer loyalty is high” | “They [MUD Jeans] are on a growth trajectory. Their loyal and active customers and strong partnerships work as an enabler in this.” | ||
| Barriers | Relative Cost/Benefit of Circularity | “cost of sustainable”, “high costs of circular materials”, “financial risk” | “Canon will need to explore opportunities to reduce the cost of remanufacturing” | |
| Customer Preferences | “lack of perception”, “little knowledge and experience”, “resistance to adoption”, “public and market resistance” | “For Groupe SEB, some customers are not willing to pay more for products that contain recycled materials due to misconceptions around these being of lower quality or performance” | ||
| Contextual | Enablers | Demography | “population growth, “urban sprawl”, “ageing population” | “For ECF, socio-demographic factors such as growing population, growing urbanisation, …are the contextual drivers for aquaponics as a successful CEBM” |
| Waste Volumes | “generation of waste”, “raw materials”, “increased levels of waste” | “Revertia—Growing demand for EEE also translates into greater e-waste generation” | ||
| Sectoral Conditions | “digitisation”, “servitisation”, “opportunities” | “With respect to Philips, hospitals need to become more efficient at generating clinical outcomes within a defined budget. Now, customers look favourably on refurbished MRI systems” | ||
| Environmentalism | “rising environmental concern”, “increased awareness”, “environmental attitudes” | “Inditex—customers’ increasing awareness and sensitivity to sustainability” | ||
| Barriers | Competition and Sectoral Aspects | “extremely high competition”, “switching to competition is easy”, “changing expectations”, “declining market” | “Vivenge—key activities are easy to copy by competitors” | |
| Infrastructure | “lack of supporting infrastructure”, “logistics” | “Rockwool—lack of infrastructure for the building industry” | ||
| Technological Change and Dynamics | “laggard technology”, “slow progress”, “innovation” | “it is important for Revertia’s business model to collaborate with other agents in R&D projects” | ||
| Financing | “no possibilities for funding and investment”, “financing needs”, “financial evaluation” | “For MUD Jeans another barrier is the financial evaluation of leased jeans, without much recognition of the value of materials that is retained in business for the long term.” | ||
| Policy | Enablers | EU Policy | “EU legislation further supporting”, “EU is encouraging” | “Bioelektra—EU policies introducing restrictive requirements in waste management” |
| Circular Policy | “legislation is further supporting”, “reduction targets”, “a change in political mindset” | “The French legal framework offered a favourable context for the development of a profitable business model for Phenix” | ||
| Fiscal Dis/Incentives | “green taxes”, “product levy and recovery rewards”, “differentiated VAT rates” | “Venlo—Green Public Procurement as an important enabler for CE” | ||
| Barriers | Lack of Regulation | “absence of standards”, “no requirements”, “no consistency” | “No consistently applied standards and protocols exist for refurbishing equipment. This creates a number of challenges for Canon.” | |
| No Internalisation | “subsidies support linear economy”, “unlevel playing field”, “paying taxes twice”, “no eco-taxes” | “ECF faces barriers in its competitiveness due to lack of internalisation of externalities such as: CO2 emissions, ensuing non-transparency on ‘food miles’, loss of biodiversity” | ||
| Obstructive Policy and Bureaucracy | “little support through policy/regulation”, “heterogeneous policy landscape”, “lack of transparency”, “regulatory hurdles” | “The current law regarding ownership in The Netherlands poses a risk to Mitsubishi [Park-2020] since the elevator is permanently attached to a building, which is owned by a third party” | ||
| Lack of EU Harmonisation and Policy Uncertainty | “inconsistency of regulations”, “different interpretation”, “dissimilar regulation” | “For Phenix, without a more homogeneous European regulation, the business model will remain hard to expand internationally” |
Appendix C
Table A3.
Case study data.
| All | 1 | 2 | 3 | 4 | 5 | 6 | 7 | 8 | 9 | 10 | 11 | 12 | 13 | 14 | 15 | 16 | 17 | 18 | |
|---|---|---|---|---|---|---|---|---|---|---|---|---|---|---|---|---|---|---|---|
| Enablers | |||||||||||||||||||
| Targets + | 15 | 1 | 1 | 1 | 1 | 1 | 1 | 1 | 1 | 1 | 1 | 1 | 1 | 1 | 1 | 1 | |||
| Cost Reduce + | 9 | 1 | 1 | 1 | 1 | 1 | 1 | 1 | 1 | 1 | |||||||||
| Customers + | 10 | 1 | 1 | 1 | 1 | 1 | 1 | 1 | 1 | 1 | 1 | ||||||||
| Demography + | 6 | 1 | 1 | 1 | 1 | 1 | 1 | ||||||||||||
| Waste + | 4 | 1 | 1 | 1 | 1 | ||||||||||||||
| Sectoral + | 17 | 1 | 1 | 1 | 1 | 1 | 1 | 1 | 1 | 1 | 1 | 1 | 1 | 1 | 1 | 1 | 1 | 1 | |
| Environmentalism + | 15 | 1 | 1 | 1 | 1 | 1 | 1 | 1 | 1 | 1 | 1 | 1 | 1 | 1 | 1 | 1 | |||
| EU Policy + | 5 | 1 | 1 | 1 | 1 | 1 | |||||||||||||
| Circular Policy + | 10 | 1 | 1 | 1 | 1 | 1 | 1 | 1 | 1 | 1 | 1 | ||||||||
| Dis/Incentives + | 5 | 1 | 1 | 1 | 1 | 1 | |||||||||||||
| Barriers | |||||||||||||||||||
| Relative Cost/Benefit − | 9 | 1 | 1 | 1 | 1 | 1 | 1 | 1 | 1 | 1 | |||||||||
| Consumer Preferences − | 5 | 1 | 1 | 1 | 1 | 1 | 1 | 1 | 1 | ||||||||||
| Competition, Sector − | 8 | 1 | 1 | 1 | 1 | 1 | 1 | 1 | 1 | 1 | |||||||||
| Infrastructure − | 4 | 1 | 1 | 1 | 1 | 1 | |||||||||||||
| Technology/Dynamic − | 6 | 1 | 1 | 1 | 1 | 1 | 1 | 1 | 1 | ||||||||||
| Financial Support − | 3 | 1 | 1 | 1 | 1 | ||||||||||||||
| EU Harmonise/Uncertain − | 6 | 1 | 1 | 1 | 1 | 1 | 1 | 1 | 1 | ||||||||||
| Obs. Policy/Bureaucracy − | 7 | 1 | 1 | 1 | 1 | 1 | 1 | 1 | 1 | 1 | 1 | ||||||||
| No Internalisation − | 2 | 1 | 1 | 1 | 1 | ||||||||||||||
| Lack of Regulation − | 3 | 1 | 1 | 1 | 1 | 1 | |||||||||||||
| Born vs. Growing Circular | |||||||||||||||||||
| Born | 9 | 1 | 1 | 1 | 1 | 1 | 1 | 1 | 1 | 1 | |||||||||
| Growing | 9 | 1 | 1 | 1 | 1 | 1 | 1 | 1 | 1 | 1 | |||||||||
| Country | |||||||||||||||||||
| Multinational | 7 | 1 | 1 | 1 | 1 | 1 | 1 | 1 | |||||||||||
| Germany | 1 | 1 | |||||||||||||||||
| Spain | 2 | 1 | 1 | ||||||||||||||||
| Netherlands | 3 | 1 | 1 | 1 | |||||||||||||||
| Poland | 2 | 1 | 1 | ||||||||||||||||
| Israel | 1 | 1 | |||||||||||||||||
| USA | 1 | 1 | |||||||||||||||||
| France | 1 | 1 | |||||||||||||||||
| Size | |||||||||||||||||||
| Micro | 3 | 1 | 1 | 1 | |||||||||||||||
| Small | 3 | 1 | 1 | 1 | |||||||||||||||
| Medium | 1 | 1 | |||||||||||||||||
| Large | 11 | 1 | 1 | 1 | 1 | 1 | 1 | 1 | 1 | 1 | 1 | 1 | |||||||
| Benefits | |||||||||||||||||||
| Environment | 18 | 1 | 1 | 1 | 1 | 1 | 1 | 1 | 1 | 1 | 1 | 1 | 1 | 1 | 1 | 1 | 1 | 1 | 1 |
| Social | 9 | 1 | 1 | 1 | 1 | 1 | 1 | 1 | 1 | 1 | |||||||||
| Macro Economy | 3 | 1 | 1 | 1 | |||||||||||||||
| Micro Economy | 16 | 1 | 1 | 1 | 1 | 1 | 1 | 1 | 1 | 1 | 1 | 1 | 1 | 1 | 1 | 1 | 1 | ||
| CE Priority | |||||||||||||||||||
| Plastic | 5 | 1 | 1 | 1 | 1 | 1 | |||||||||||||
| Food Waste | 4 | 1 | 1 | 1 | 1 | ||||||||||||||
| Bio | 2 | 1 | 1 | ||||||||||||||||
| Raw | 10 | 1 | 1 | 1 | 1 | 1 | 1 | 1 | 1 | 1 | 1 | ||||||||
| C&D | 5 | 1 | 1 | 1 | 1 | 1 |
Note: This data is reported in Deliverable 6.2: summary of key factors of CEBM. The R2π Project Consortium (2019).
References
- European Commission. Communication from the Commission to the European Parliament, the Council, the European Economic and Social Committee and the Committee of the Regions. A New Circular Economy Action Plan for a Cleaner and More Competitive Europe, COM (2020) 98 Final. 11 March 2020. Available online: https://eur-lex.europa.eu/resource.html?uri=cellar:9903b325-6388-11ea-b735-01aa75ed71a1.0017.02/DOC_1&format=PDF (accessed on 15 May 2021).
- European Commission. Communication from the Commission to the European Parliament, the Council, the European Economic and Social Committee and the Committee of the Regions. Closing the Loop-An EU Action Plan for the Circular Economy, COM (2015) 614 Final. 2 December 2015. Available online: https://eur-lex.europa.eu/legal-content/en/TXT/?uri=CELEX%3A52015DC0614 (accessed on 15 November 2018).
- Cambridge Econometrics; Trinomics; ICF. Impacts of Circular Economy Policies on the Labour Market. 2018. Available online: https://op.europa.eu/en/publication-detail/-/publication/fc373862-704d-11e8-9483-01aa75ed71a1/language-en (accessed on 15 June 2021).
- Eurostat Generation of Waste by Waste Category, Hazardousness and NACE Rev. 2 Activity, EU. Available online: https://ec.europa.eu/eurostat/databrowser/view/env_wasgen/default/table?lang=en (accessed on 9 December 2020).
- Doni, F.; Corvino, A.; Bianchi Martini, S. Servitization and sustainability actions. Evidence from European manufacturing companies. J. Environ. Manag. 2019, 234, 367–378. [Google Scholar] [CrossRef] [PubMed]
- Kalverkamp, M.; Raabe, T. Automotive Remanufacturing in the Circular Economy in Europe. J. Macromark. 2018, 38, 112–130. [Google Scholar] [CrossRef] [Green Version]
- Coughlan, D.; Fitzpatrick, C.; McMahon, M. Repurposing end of life notebook computers from consumer WEEE as thin client computers—A hybrid end of life strategy for the Circular Economy in electronics. J. Clean. Prod. 2018, 192, 809–820. [Google Scholar] [CrossRef]
- Lacy, P.; Keeble, J.; McNamara, R.; Rutqvist, J.; Haglund, T.; Cui, M.; Cooper, A.; Pettersson, C.; Eckerle, K.; Buddemeier, P.; et al. Circular Advantage: Innovative Business Models and Technologies to Create Value in a World without Limits to Growth; Accenture: Chicago, IL, USA, 2014; Volume 24. [Google Scholar]
- Bocken, N.; de Pauw, I.; Bakker, C.; van der Grinten, B. Product design and business model strategies for a circular economy. J. Ind. Prod. Eng. 2016, 33, 308–320. [Google Scholar] [CrossRef] [Green Version]
- Bocken, N.; Short, S.W.; Rana, P.; Evans, S. A literature and practice review to develop sustainable business model archetypes. J. Clean. Prod. 2014, 65, 42–56. [Google Scholar] [CrossRef] [Green Version]
- Pieroni, M.P.P.; McAloone, T.C.; Pigosso, D.C.A. Business model innovation for circular economy and sustainability: A review of approaches. J. Clean. Prod. 2019, 215, 198–216. [Google Scholar] [CrossRef]
- Hansen, E.G.; Schaltegger, S. 100 per cent organic? A sustainable entrepreneurship perspective on the diffusion of organic clothing. Corp. Gov. 2013, 13, 583–598. [Google Scholar] [CrossRef]
- Berkhout, F. Technological regimes, environmental performance and innovation systems: Tracing the links. In Towards Environmental Innovation Systems; Weber, M., Hemmelskamp, J., Eds.; Springer: Berlin/Heidelberg, Germany, 2005; pp. 57–80. [Google Scholar]
- Smith, A. Green niches in sustainable development: The case of organic food in the United Kingdom. Environ. Plan. 2006, 24, 439–459. [Google Scholar] [CrossRef] [Green Version]
- Bocken, N.M.P.; Schuit, C.S.C.; Kraaijenhagen, C. Experimenting with a circular business model: Lessons from eight cases. Environ. Innov. Soc. Transit. 2018, 28, 79–95. [Google Scholar] [CrossRef] [Green Version]
- Bocken, N.M.P.; Antikainen, M. Circular Business Model Experimentation: Concept and Approaches. In Proceedings of the International Conference on Sustainable Design and Manufacturing, Gold Coast, Australia, 24–26 June 2018; Springer: Cham, Switzerland, 2018; pp. 239–250. [Google Scholar]
- Konietzko, J.; Bocken, N.; Hultink, E.J. Circular ecosystem innovation: An initial set of principles. J. Clean. Prod. 2020, 253, 119942. [Google Scholar] [CrossRef]
- Brown, P.; Bocken, N.; Balkenende, R. How do companies collaborate for circular oriented innovation? Sustainability 2020, 12, 1648. [Google Scholar] [CrossRef] [Green Version]
- Konietzko, J.; Bocken, N.; Hultink, E.J. A tool to analyze, ideate and develop circular innovation ecosystems. Sustainability 2020, 12, 417. [Google Scholar] [CrossRef] [Green Version]
- Brown, P.; Bocken, N.; Balkenende, R. Why Do Companies Pursue Collaborative Circular Oriented Innovation? Sustainability 2019, 11, 635. [Google Scholar] [CrossRef] [Green Version]
- Tura, N.; Hanski, J.; Ahola, T.; Ståhle, M.; Piiparinen, S.; Valkokari, P. Unlocking circular business: A framework of barriers and drivers. J. Clean. Prod. 2019, 212, 90–98. [Google Scholar] [CrossRef]
- Diaz, F.J.; Bastein, T.; Tukker, A. Business model innovation for resource-efficiency, circularity and cleaner production: What 143 cases tell us. Ecol. Econ. 2019, 155, 20–35. [Google Scholar] [CrossRef]
- Vermunt, D.A.; Negro, S.O.; Verweij, P.A.; Kuppens, D.V.; Hekkert, M.P. Exploring barriers to implementing different circular business models. J. Clean. Prod. 2019, 222, 891–902. [Google Scholar] [CrossRef] [Green Version]
- Govindan, K.; Hasanagic, M. A systematic review on drivers, barriers, and practices towards circular economy: A supply chain perspective. Int. J. Prod. Res. 2018, 56. [Google Scholar] [CrossRef]
- Masi, D.; Day, S.; Godsell, J. Supply Chain Configurations in the Circular Economy: A Systematic Literature Review. Sustainability 2017, 9, 1602. [Google Scholar] [CrossRef] [Green Version]
- Jia, F.; Yin, S.; Chen, L.; Chen, X. The circular economy in the textile and apparel industry: A systematic literature review. J. Clean. Prod. 2020, 259, 120728. [Google Scholar] [CrossRef]
- Dijkstra, H.; van Beukering, P.; Brouwer, R. Business models and sustainable plastic management: A systematic review of the literature. J. Clean. Prod. 2020, 258, 120967. [Google Scholar] [CrossRef]
- Kinnunen, P.H.-M.; Kaksonen, A.H. Towards circular economy in mining: Opportunities and bottlenecks for tailings valorization. J. Clean. Prod. 2019, 228, 153–160. [Google Scholar] [CrossRef]
- Salim, H.K.; Stewart, R.A.; Sahin, O.; Dudley, M. Drivers, barriers and enablers to end-of-life management of solar photovoltaic and battery energy storage systems: A systematic literature review. J. Clean. Prod. 2019, 211, 537–554. [Google Scholar] [CrossRef]
- Ormazabal, M.; Prieto-Sandoval, V.; Puga-Leal, R.; Jaca, C. Circular Economy in Spanish SMEs: Challenges and opportunities. J. Clean. Prod. 2018, 185, 157–167. [Google Scholar] [CrossRef]
- Acs, Z.J.; Audretsch, D.B. Births and Firm Size. South. Econ. J. 1989, 56, 467–475. [Google Scholar] [CrossRef]
- Rizos, V.; Behrens, A.; van der Gaast, W.; Hofman, E.; Ioannou, A.; Kafyeke, T.; Flamos, A.; Rinaldi, R.; Papadelis, S.; Hirschnitz-Garbers, M.; et al. Implementation of circular economy business models by small and medium-sized enterprises (SMEs): Barriers and enablers. Sustainability 2016, 8, 1212. [Google Scholar] [CrossRef] [Green Version]
- Pereira, Á.; Vence, X. The role of KIBS and consultancy in the emergence of Circular Oriented Innovation. J. Clean. Prod. 2021, 302. [Google Scholar] [CrossRef]
- Bassi, F.; Dias, J.G. The use of circular economy practices in SMEs across the EU. Resour. Conserv. Recycl. 2019, 146, 523–533. [Google Scholar] [CrossRef]
- Demirel, P.; Danisman, G.O. Eco-innovation and firm growth in the circular economy: Evidence from European small- and medium-sized enterprises. Bus. Strateg. Environ. 2019, 28, 1608–1618. [Google Scholar] [CrossRef]
- Zamfir, A.M.; Mocanu, C.; Grigorescu, A. Circular economy and decision models among European SMEs. Sustainability 2017, 9, 1507. [Google Scholar] [CrossRef] [Green Version]
- García-Quevedo, J.; Jové-Llopis, E.; Martínez-Ros, E. Barriers to the circular economy in European small and medium-sized firms. Bus. Strateg. Environ. 2020, 29, 2450–2464. [Google Scholar] [CrossRef]
- Schaltegger, S.; Lüdeke-Freund, F.; Hansen, E.G. Business Models for Sustainability: A Co-Evolutionary Analysis of Sustainable Entrepreneurship, Innovation, and Transformation. Organ. Environ. 2016, 29, 264–289. [Google Scholar] [CrossRef]
- Hein, A.; Schreieck, M.; Wiesche, M.; Böhm, M.; Krcmar, H. The emergence of native multi-sided platforms and their influence on incumbents. Electron. Mark. 2019, 29, 631–647. [Google Scholar] [CrossRef] [Green Version]
- Fischer, A.; Pascucci, S. Institutional incentives in circular economy transition: The case of material use in the Dutch textile industry. J. Clean. Prod. 2017, 155, 17–32. [Google Scholar] [CrossRef] [Green Version]
- Todeschini, B.V.; Cortimiglia, M.N.; Callegaro-de-Menezes, D.; Ghezzi, A. Innovative and sustainable business models in the fashion industry: Entrepreneurial drivers, opportunities, and challenges. Bus. Horiz. 2017, 60, 759–770. [Google Scholar] [CrossRef]
- Briguglio, M.; Llorente, L.; Meilak, C.; Pereira, A.; Spiteri, J. Deliverable 6.2: Summary of key factors of CEBM. The R2π Project Consortium. 2019. Available online: https://www.um.edu.mt/library/oar/handle/123456789/48189 (accessed on 15 January 2021).
- Lewandowski, M. Designing the business models for circular economy-towards the conceptual framework. Sustainability 2016, 8, 43. [Google Scholar] [CrossRef] [Green Version]
- Osterwalder, A.; Pigneur, Y.; Bernarda, G.; Smith, A.; Papadakos, T. Value Proposition Design: How to Create Products and Services Customers Want; John Wiley & Sons: Hoboken, NJ, USA, 2014; ISBN 978-1-118-96805-5. [Google Scholar]
- Braun, V.; Clarke, V. Using thematic analysis in psychology. Qual. Res. Psychol. 2006, 3, 77–101. [Google Scholar] [CrossRef] [Green Version]
- Saidani, M.; Yannou, B.; Leroy, Y.; Cluzel, F.; Kendall, A. A taxonomy of circular economy indicators. J. Clean. Prod. 2019, 207, 542–559. [Google Scholar] [CrossRef] [Green Version]
- Llorente-González, L.J.; Vence, X. Decoupling or ‘Decaffing’? The Underlying Conceptualization of Circular Economy in the European Union Monitoring Framework. Sustainability 2019, 11, 4898. [Google Scholar] [CrossRef] [Green Version]
- Khadke, S.; Gupta, P.; Rachakunta, S.; Mahata, C.; Dawn, S.; Sharma, M.; Verma, D.; Pradhan, A.; Krishna, A.M.S.; Ramakrishna, S.; et al. Efficient Plastic Recycling and Remolding Circular Economy Using the Technology of Trust–Blockchain. Sustainability 2021, 13, 9142. [Google Scholar] [CrossRef]
- Böckel, A.; Nuzum, A.-K.; Weissbrod, I. Blockchain for the Circular Economy: Analysis of the Research-Practice Gap. Sustain. Prod. Consum. 2021, 25, 525–539. [Google Scholar] [CrossRef]
Figure 1.
Case study dashboard. Note: In all charts, N = 18. Chart (a) distinguishes case studies by born or growing circular; chart (b) shows the sectors where the case studies operate (C&D refers to construction and demolition; raw refers to critical raw materials; bio refers to biomass and bio-based products); chart (c) shows the size distribution by number of employees (>250 employees are large, 50–250 are medium, 10–49 are classified as small, and those <10 employees are micro); and chart (d) indicates where these businesses operate.

Figure 2.
Summary of the case study research process.

Figure 3.
Enablers and barriers by born vs. growing circular. Notes: Chart (a) depicts the enablers to business circularity, while chart (b) shows the relative barriers. In both instances, responses are broken down by whether the business is growing or born circular.
Figure 3.
Enablers and barriers by born vs. growing circular. Notes: Chart (a) depicts the enablers to business circularity, while chart (b) shows the relative barriers. In both instances, responses are broken down by whether the business is growing or born circular.

Publisher’s Note: MDPI stays neutral with regard to jurisdictional claims in published maps and institutional affiliations. |
© 2021 by the authors. Licensee MDPI, Basel, Switzerland. This article is an open access article distributed under the terms and conditions of the Creative Commons Attribution (CC BY) license (https://creativecommons.org/licenses/by/4.0/).
Share and Cite
MDPI and ACS Style
Briguglio, M.; Llorente-González, L.J.; Meilak, C.; Pereira, Á.; Spiteri, J.; Vence, X. Born or Grown: Enablers and Barriers to Circular Business in Europe. Sustainability 2021, 13, 13670. https://doi.org/10.3390/su132413670
AMA Style
Briguglio M, Llorente-González LJ, Meilak C, Pereira Á, Spiteri J, Vence X. Born or Grown: Enablers and Barriers to Circular Business in Europe. Sustainability. 2021; 13(24):13670. https://doi.org/10.3390/su132413670
Chicago/Turabian StyleBriguglio, Marie, Leandro J. Llorente-González, Christopher Meilak, Ángeles Pereira, Jonathan Spiteri, and Xavier Vence. 2021. "Born or Grown: Enablers and Barriers to Circular Business in Europe" Sustainability 13, no. 24: 13670. https://doi.org/10.3390/su132413670
Note that from the first issue of 2016, this journal uses article numbers instead of page numbers. See further details here.