1. Introduction
European directives and domestic legislation on energy production and efficiency are increasingly demanding, with requirements geared to achieving nearly zero energy buildings (NZEB) and to advancing toward carbon neutrality by target year 2050 [
1,
2]. Renewable energy and more specifically photovoltaic energy has been instituted by many users in any number of buildings. Photovoltaic systems designed for small-scale on-site use are becoming increasingly affordable. Costs have declined substantially in recent years and begun to be economically viable for both the residential and tertiary sectors. Southern Europe, with a fair number of annual sun hours, holds enormous potential for producing such power.
The primary drawback is the significant imbalance between photovoltaic production and users’ actual needs (peak consumption vs. peak generation), difficult to reconcile without resorting to energy storage or net metering.
City roofs, particularly those over apartment buildings, can double as suitable support for the local generation of solar power, with the advantages inherent in producing and consuming electricity in the same building. That would enhance efficiency substantially, lessening power distribution-related losses and grid costs. Rooftop solar photovoltaic energy is a strategic practice in many regions. The US Energy Information Administration (EIA) reports that installed capacity in small-scale (distributed) solar photovoltaic energy facilities doubled from 2014 to 2017, with even greater growth potential in the offing. Over half of those facilities are found on the roofs of residential buildings. Similar trends can be identified the world over [
3]. With the second-highest percentage of urban dwellers in Europe (66%, a figure that continues to rise in the wake of ongoing migration to cities), Spain is well-positioned to group power consumers geographically.
The present study introduces a methodology for analysing residential archetypes to determine the values of the parameters essential to optimising photovoltaic energy production and use. The aim is to determine where excess generation can be shared with other users in the vicinity and optimally pool rooftop facilities to meet community-scale energy demand, ultimately enhancing such disadvantaged neighbourhoods’ self-sufficiency. The primary effort is geared to improving indoor operation in deprived or low-income neighbourhoods in southern European cities. Despite its moderate temperate climate, that region generally exhibits lower energy facility performance than expected. Particularly where social housing is concerned [
4,
5,
6], that situation may be partly attributable to faulty or obsolete envelope design and construction, as well as the typology of the dwellings or the use of the surface [
5,
6,
7]. Widespread fuel poverty or small household budgets in the most disadvantaged neighbourhoods often curtail residents’ ability to exercise thermal control over indoor environments [
8].
A study of fuel poverty distribution in Madrid estimated demand to be lower than the mean measured by Spain’s Institute for Energy Diversification and Savings (Spanish initials, IDEA). The inference of such findings is that energy demand in many apartments inhabited by middle to low-income households is lower than required to ensure comfort. Such deprivation is voluntary, with users preferring to prioritise other spending over the costs associated with a comfortable indoor environment [
9].
With a view to mitigating such situations, research teams, universities and the industry are striving to provide occupants with useful information on neighbourhood potential for photovoltaic energy, seeking direct user involvement.
A project implemented in Lavapiés, a district in Madrid, explored the possibility of installing photovoltaic energy in 1300 buildings, one outcome of which was a public map with data on the solar potential of building roofs [
10].
In a different site but with similar aims, the municipal government of Alpedrete, a village in the province of Madrid, determined to renovate its energy mix by furthering the use of renewables. The project involved a study of the village’s solar potential conducted by Spain’s Centre for Energy, Environmental and Technological Research (Spanish initials, CIEMAT). With the support of the Technical University of Madrid (UPM), CIEMAT developed an online application enabling users to determine the capacity of their roofs to house photovoltaic panels or solar thermal collectors [
11]. This second example identifies the latent need for government involvement in small-scale, high potential energy initiatives. Yet a third case constitutes another promising example. The municipal government of Miraflores de la Sierra, a village on the outskirts of Madrid, is partnering with the UPM and CIEMAT to formulate a solar power geoweb for the village as part of the gSolarRoof project, a GPS technology-based study of its photovoltaic potential. The idea is to produce a report that will enable villagers to determine their homes’ photovoltaic potential [
12]. Although a number of city-scale estimates of potential such as described above [
10,
11,
12] can be found in the literature, most earlier studies, drawing from standards on engineering requirements, entail fairly lax approximations, to the detriment of the accuracy of optimisation calculations. The present study develops predictors that can be applied to establish optimal installed photovoltaic capacity (based on building typology and construction) in other residential or mixed urban neighbourhoods.
The present study explores the social housing typologies frequently found in southern Europe to extrapolate the respective findings to the same types of buildings in continental climates. The methodology and general conclusions are likewise liable to extrapolation to other climates. The study forms part of a larger project, Habita.Res [
13], whose overarching aim is to determine the potential for and impact of urban residential renewal involving improvements in energy self-sufficiency. The analysis is discussed in the context of a case study of a peripheral district and more specifically its social housing built between the post-Spanish Civil War years and 1979 [
14], which is highly representative of the conditions prevailing in residential areas of contemporary Mediterranean cities.
2. Methodology
2.1. Demographic and Use Profiles
A detailed study of the area’s population was conducted in this stage to determine user parameters, envisaging practice, lifestyle and consequently needs. In Spain those data are available in the cadastral information published by the National Statistics Institute (Spanish initials, INE) [
15]. Non-residential uses detected in the area were also analysed. Future power pooling will require information on the opportunities afforded by the existing characteristics and typical user dynamics in different situations and stages.
2.2. Characterisation of Area Studied
The case study was initiated by compiling morphological and geometric information on buildings with the land registry’s geographic information system (SIG) and comparing it to the data gleaned from Google’s Goolzoom 3D viewer.
The urban information compiled included zoning, residential type, maximum allowable height and geometries for detailed characterisation of roofs. That information was used to create a more thorough database with which to identify each model: building typology, ID code, location, year of construction, footprint (m2), roof area (m2), number of identical buildings/homes, number of units (= homes), number of street level premises or offices, number of storeys, roof type, orientation and shade cast on roof (by bulkheads, parapets and similar).
The data were subsequently applied to develop a three-dimensional model of the neighbourhood, including city topography and volumetry, as well as the buildings themselves. The archetypes to be analysed were defined as constructional models with varying characteristics to ensure the study can be readily extrapolated.
2.3. Detailed Analysis: Energy Demand
Data on hourly consumption profiles for domestic applications are not available in Spain. Building-scale energy demand for each archetype identified was consequently simulated with computer models. The findings for each building type were obtained by simulating hour-by-hour data for a full year with Design Builder software. That same methodology had been used in earlier studies to determine building stock consumption in Spain and other European countries. The results for each archetype were extrapolated and applied, with minor adjustments to account for orientation, to all the buildings of a given type in the city. Mean consumption was found for lighting, household appliances, heating and air conditioning. Not all housing had the same consumption pattern. In addition to constructional characteristics and climate zone, a household’s power consumption is determined by the number of occupants as well as their age and socioeconomic status. In the present case study, the operating conditions for HVAC were defined assuming compliance with the provisions of Spanish energy efficiency legislation [
16] and a mean infiltration rate as per a model developed in [
17,
18]. In contrast, the actual building geometry and envelope construction data were entered into the model. Heat pump-based heating and air conditioning were assumed and entered in the program for conversion to power consumption. In the detailed study conducted, daytime was distinguished from night time consumption and summer from winter and both from spring (doubling as autumn) demand loads.
2.4. Detailed Analysis: Photovoltaic Output
A month-by-month insolation study for the neighbourhood as a whole was performed in this stage to provide valid information on locations affected by shading that could alter system performance if not identified.
The analysis was conducted with Shadow Analysis modelling software, which delivers values on shading across a range of 0 h to +10 h. A study was performed for one day of each month, analysing sunlight between 7:00 and 21:00 (14 h). The analysis yielded information relevant to photovoltaic panel installation, particularly as concerns shadows cast on the roof by other buildings and rooftop elements such as bulkheads, ventilation chimneys, parapets and similar.
Deploying that methodology, photovoltaic output was calculated in terms of the hourly energy balance. Energy balance sizes a photovoltaic system further to consumption and local meteorological data. The aim is to adapt photovoltaic generation to load demand in a given period of time in pursuit of the optimal design for a given photovoltaic facility. Here photovoltaic output was estimated with PVGIS software on the grounds of facility characteristics (module, tilt angle, orientation…) and the irradiation and temperature data published by the National Meteorological Agency for Madrid. PVGIS (Photovoltaic Geographical Information System) software developed by the European Commission’s Science and Knowledge Service estimates the percentage of monthly losses; mean daily, monthly and yearly electricity output; mean daily, monthly and yearly solar irradiance; and overall facility losses.
As the photovoltaic facilities were simulated for installation on building roofs, space was at a premium and its use had to be optimised. Based on roof geometries and varying panel arrangements, high efficiency modules were found to be the option that generated the maximum amount of power per available area. More specifically, standard market monocrystalline silicon modules with an aspect ratio of 2:3 were assumed for the simulations. The inverter (for continuous/alternating conversion of the electric power generated by the modules) defined for each facility was adapted to the electrical characteristics of the photovoltaic generator, subject to the availability of suitable market hardware. The study distinguished summer from winter and daytime from night time conditions, as above, to optimise photovoltaic panel performance.
2.5. Case Study
A case study for a continental climate and more specifically for Madrid’s Canillas district was run to test the methodology. Canillas is presently listed by the Spanish Ministry of Public Works as a deprived neighbourhood. It was selected for the study because it exceeds relative vulnerability indices and at 10% its population of over 75′s is slightly higher than the standard mean. It had a foreign population around half the size of the mean municipal rate, while unemployment was higher than the mean for the city. The rate for the unschooled segment of the population, the most severely affected, was at 26.38% substantially higher than the averages used.
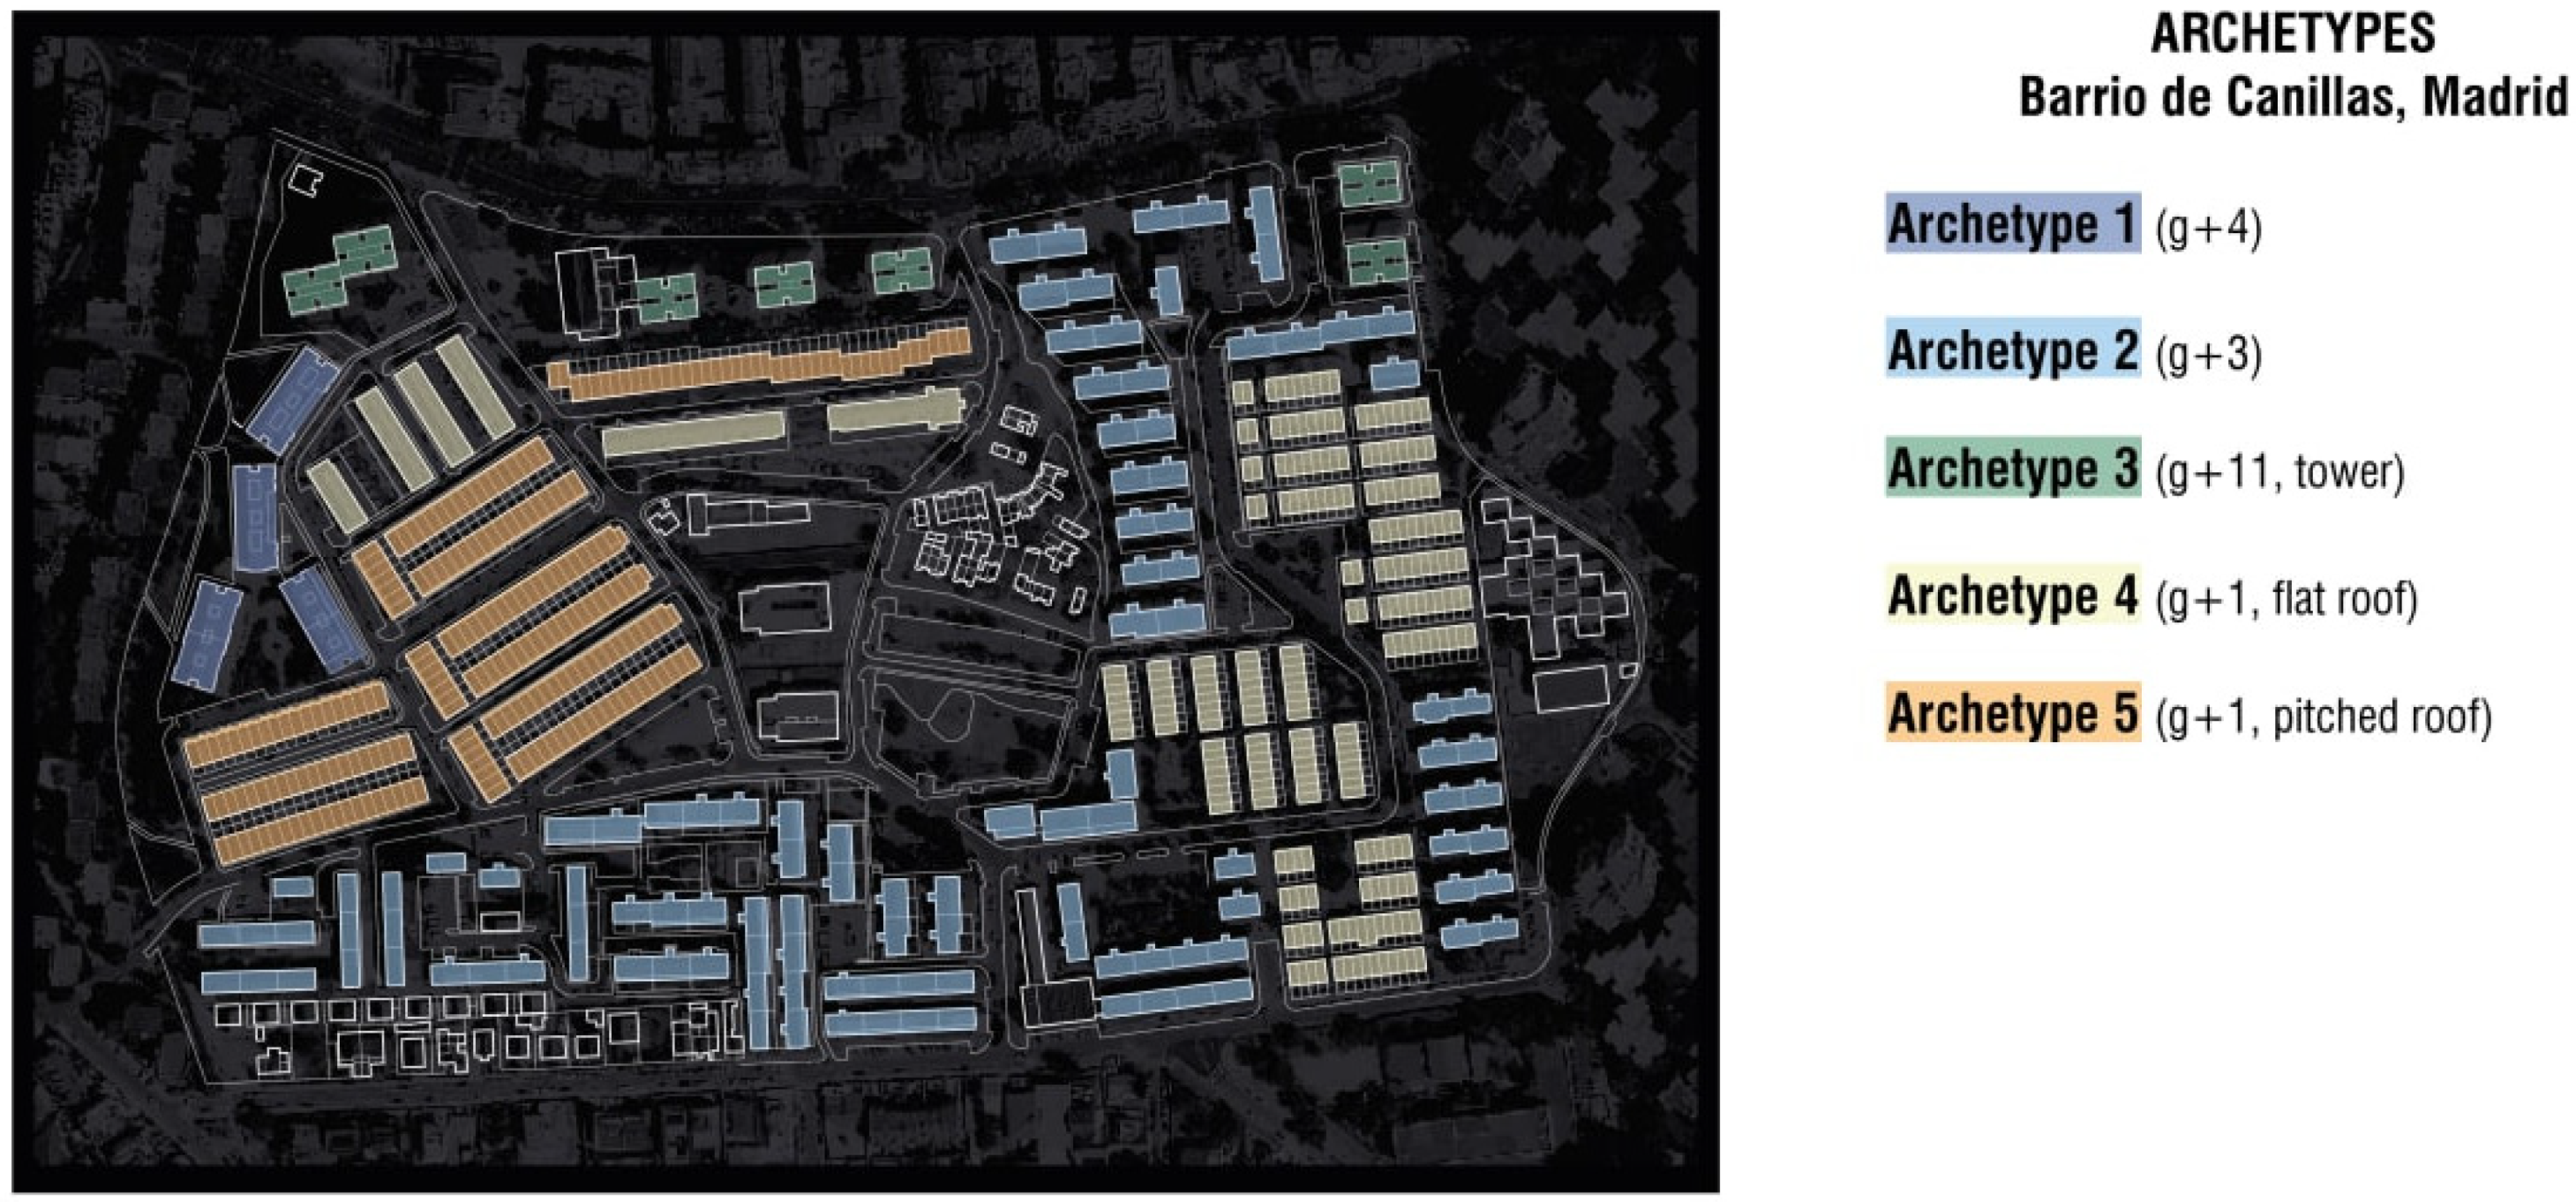
When first developed the neighbourhood comprised three housing typologies, set in rows running from east to west with progressively greater heights: two-storey single family homes in the south, four-storey apartment buildings in the middle and 12-storey towers in the north, bordering Canillas Road. That tiered arrangement afforded all buildings a view and ensured optimal insolation. At present, 60 years later, the district has a wider variety of building typologies, altering the initial ideal. In addition to the original three (ground +3, single family ground +1 and tower) there are now a further five which while similar differ in terms of roof geometries and number of units (
Figure 1). The tertiary buildings standing at this time include a church, a public secondary school, a sports centre and a government building, while retail establishments occupy ground storey premises.
As a rule in Madrid, household heating consists in individual or community gas-fired boilers that heat water for circulation in radiators. Nonetheless, this study envisaged the additional load inherent in a heat pump system to determine whether photovoltaic facilities would suffice to meet the resulting demand or if they would need to be reinforced with other types of energy.
The load profiles used for this study were defined on an hourly basis for full years to represent actual consumption and therefore the demand curve as accurately as possible for comparison with the output curve.
The main characteristics of the Canillas neighbourhood building archetypes are set out in
Table 1.
3. Results
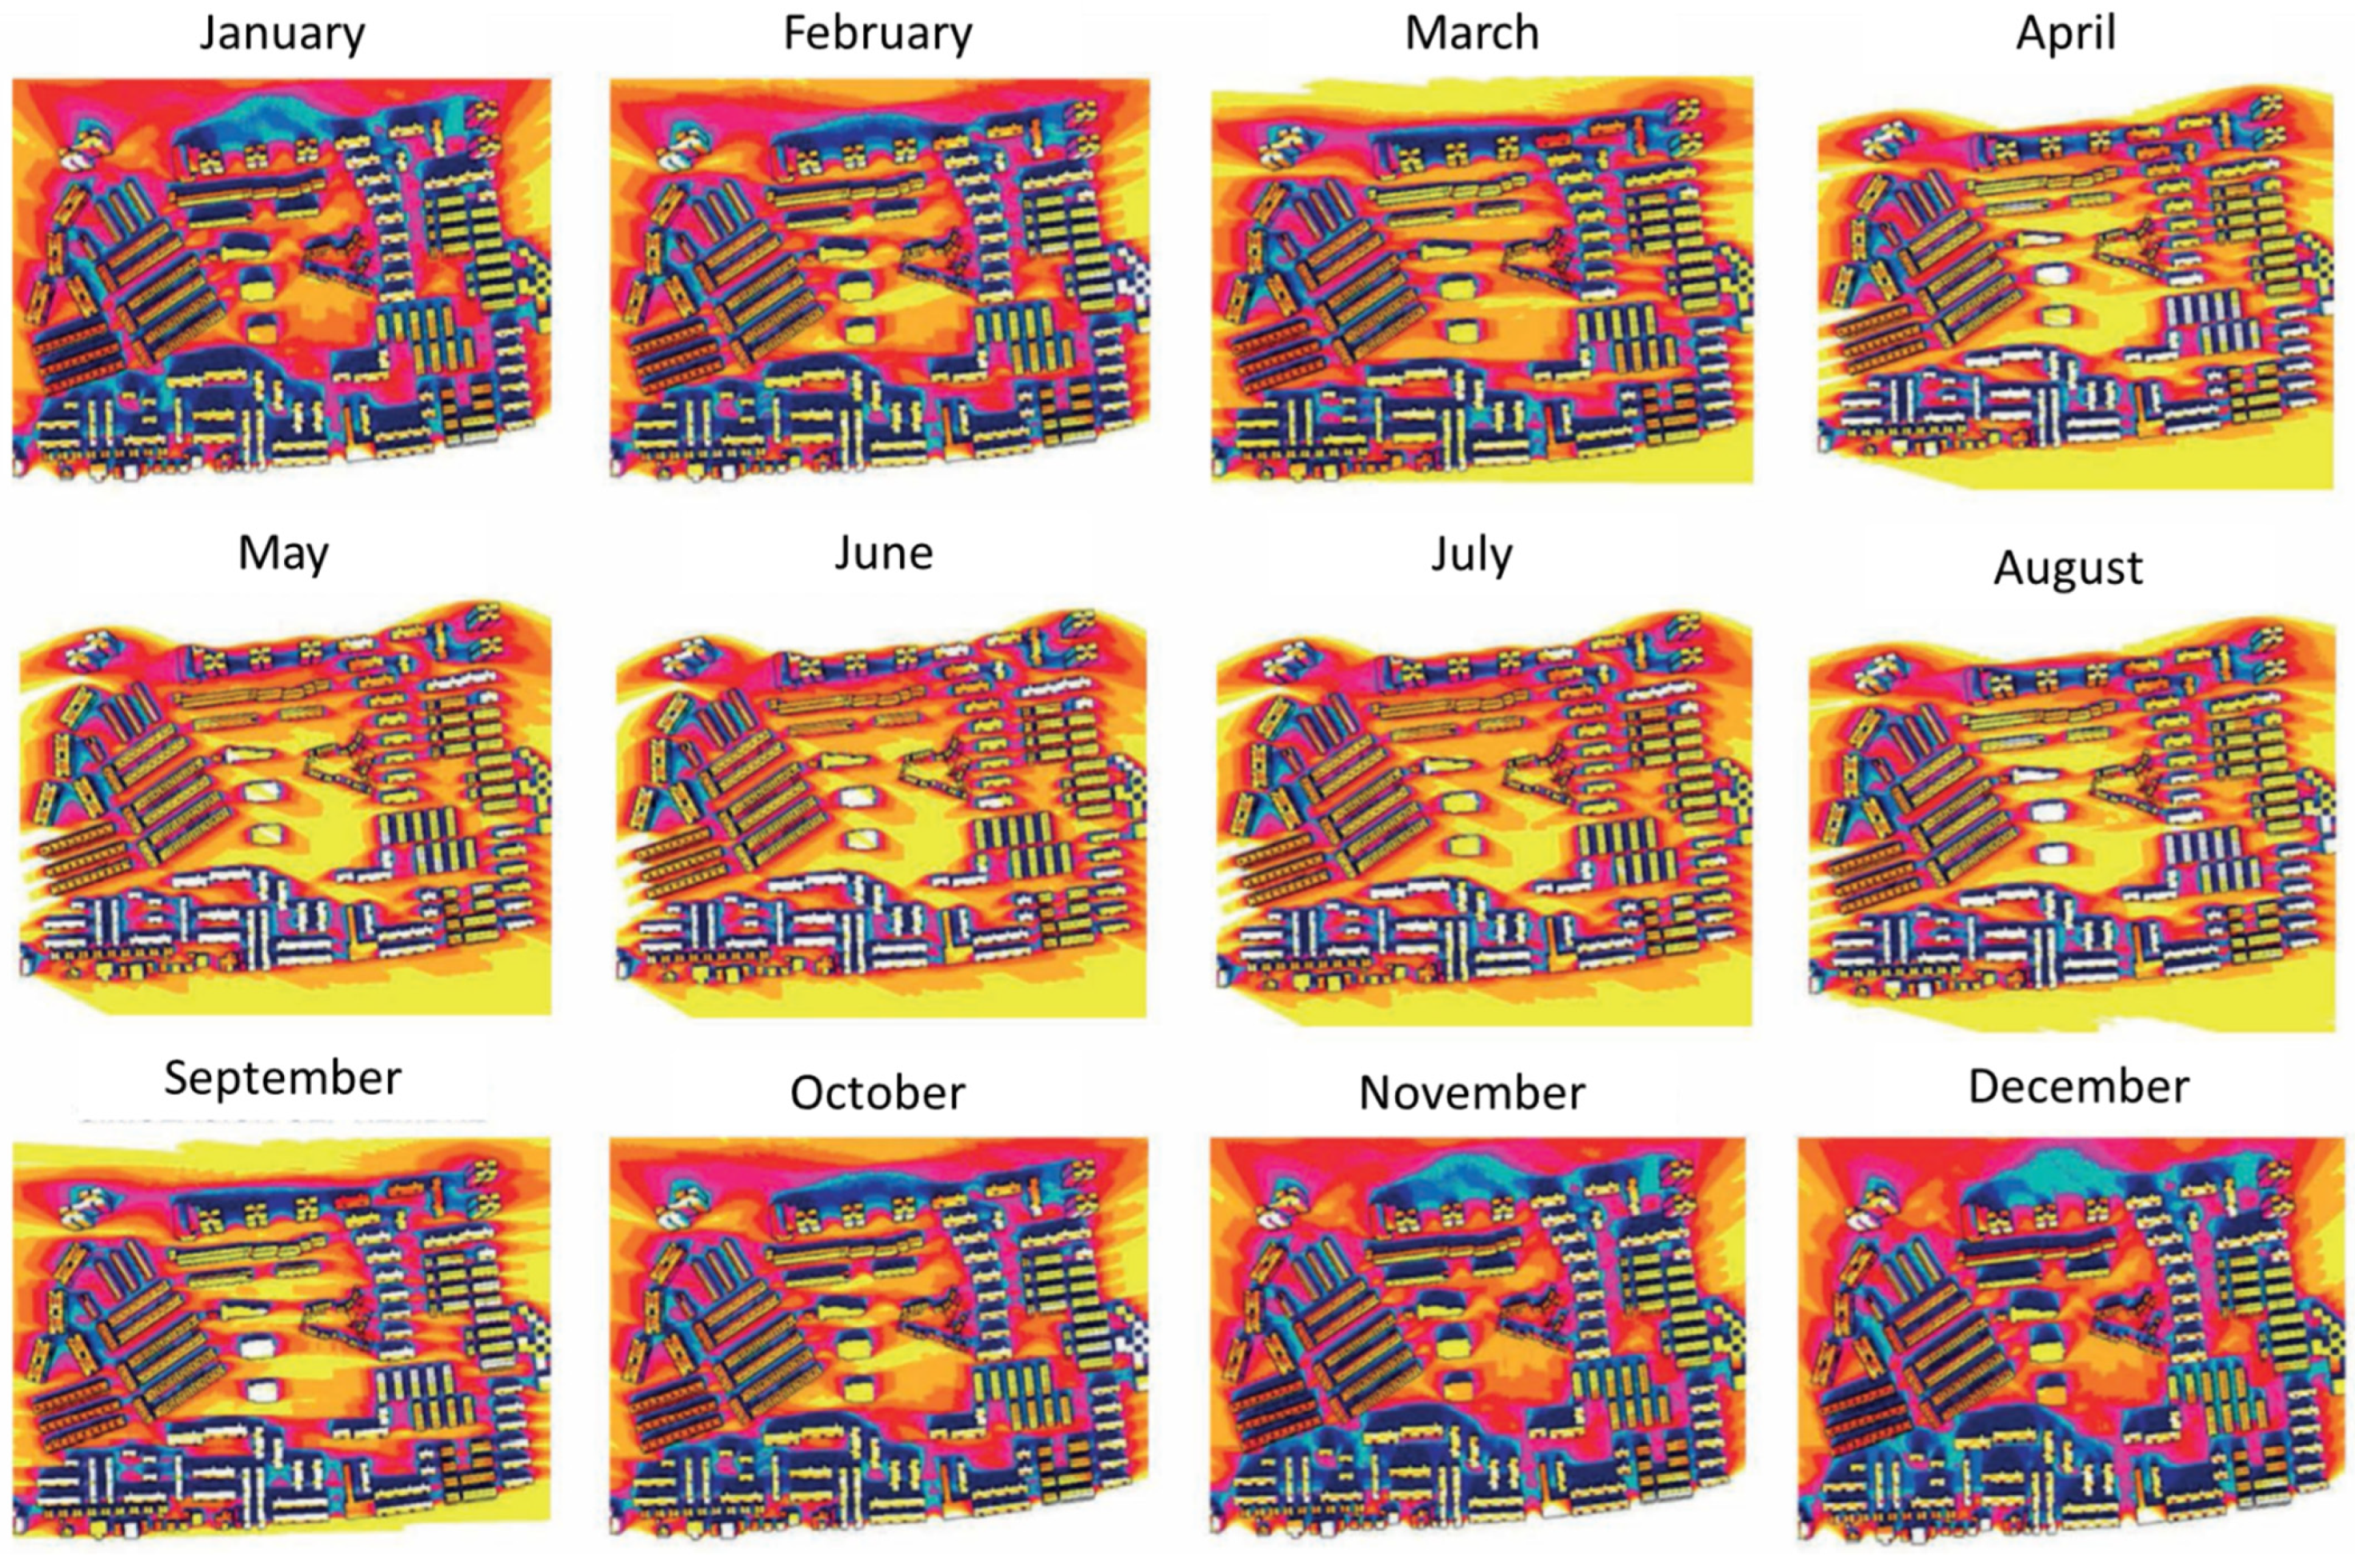
The sun’s path, irradiance and shading were analysed to identify the rooftop areas best suited to housing PV panels. PV operation was found to be viable across a range of 700 to 3800 h per year. The models defined the most favourable photovoltaic panel arrays Only the shaded areas attributable to rooftop elements had to be avoided, for as
Figure 2 shows, given neighbourhood topography inter-building shading was not an issue.
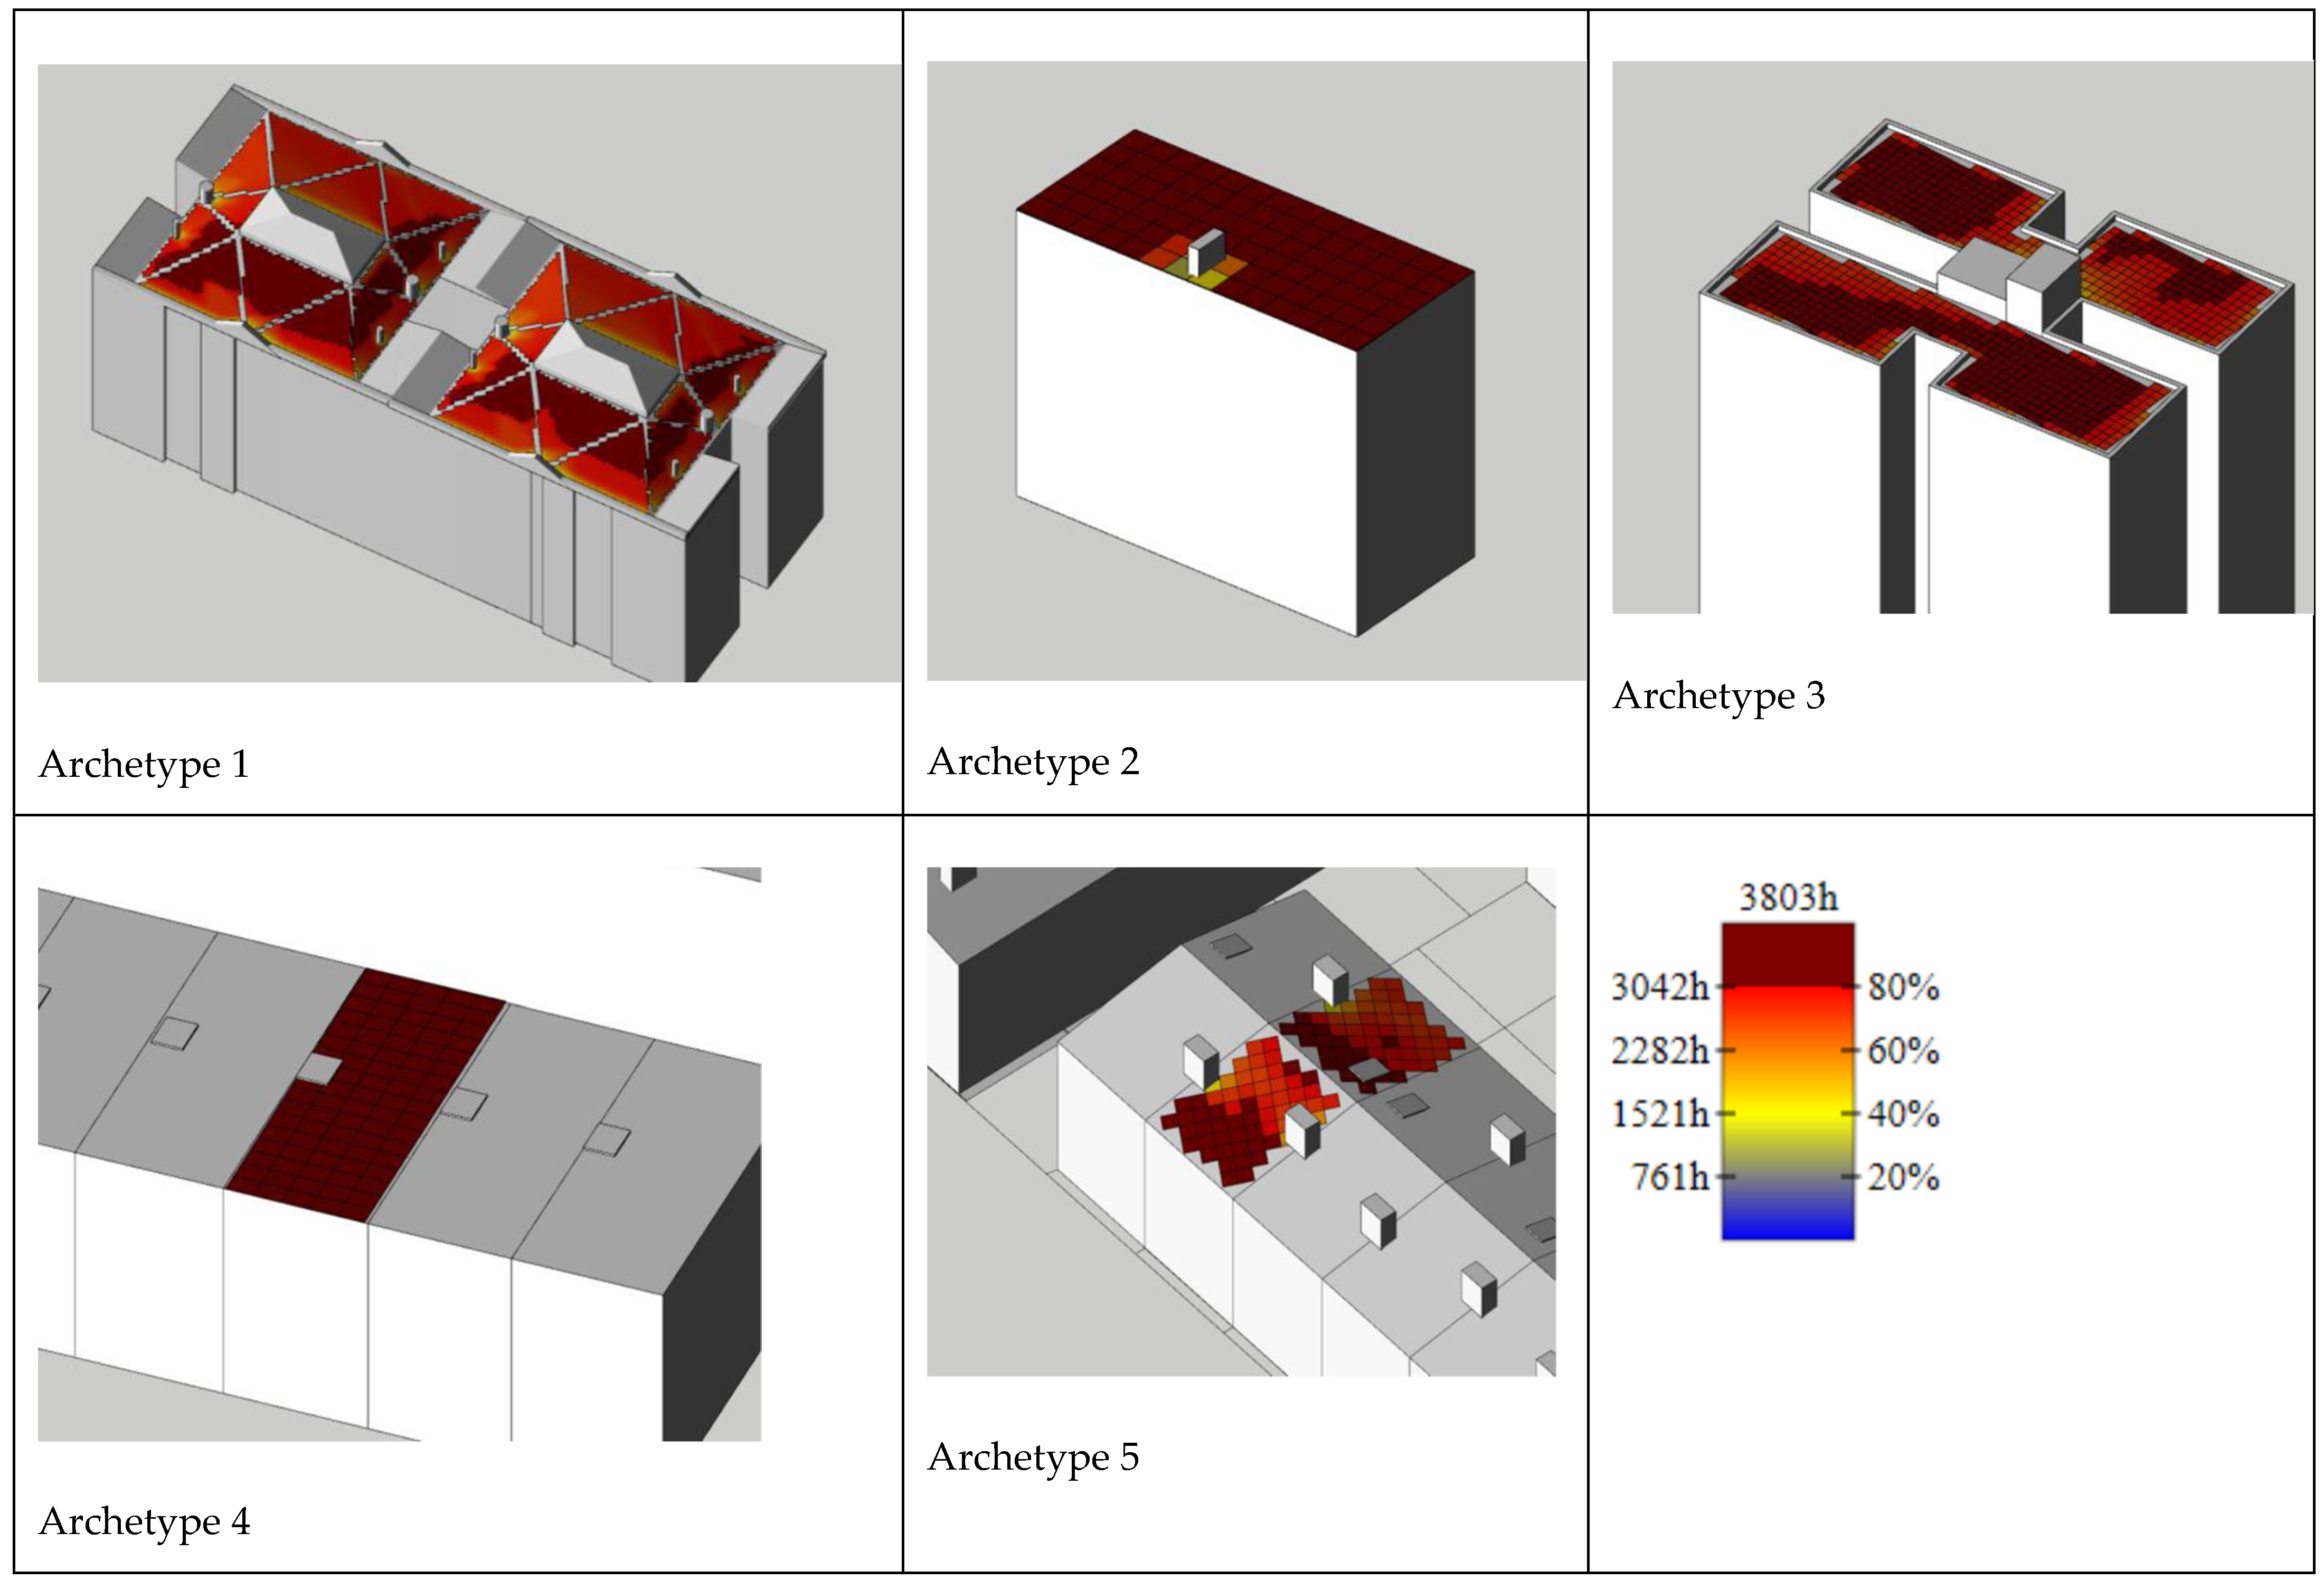
The total hours of sunlight for each archetype are graphed in
Figure 3. Archetype 1, a ground + four-storey apartment building, has a hipped roof characterised by solar optimisation difficulties, intensified by the presence of a hip skylight. Thanks to its large surface area (687 m
2), however, the sloping sides facing south and east fortunately receive less shade. In the absence of excessive shadowing, output was analysed for both two and four usable sides. In the simulation the panels were assumed to need no ancillary substructure but rather to capitalise on the slope angle to maximise solar capture. The geometric analysis was conducted bearing in mind protruding elements such as chimneys and small-scale machinery. A second consideration was the necessary separation from tall, shade-casting parapets and façade ornaments. In light of the complexity of its roof, this archetype was used to study the viability of small panels in intricate geometries.
The flat roof over the ground + three-storey apartment building denominated archetype 2 was found ideal for installing solar collectors. No overly shaded areas were identified, for the sole upward-protruding rooftop element detected was a service chimney that casts shadows at close range only. Advantage was drawn from the greater space afforded by the absence of a prominent parapet to install a larger number of panels. The sole protruding element was taken into consideration in the geometric analysis by testing different arrangements to elude the shadows it casts. As a flat roof 80% flooded by sunlight, the test was run assuming both the presence (latitude −10) and absence (latitude ±0) of substructure. This archetype was deemed to be of particular significance for the study, as it is the most prevalent in Canillas.
In archetype 3, a ground + 11-storey tower, the flat albeit somewhat complex roof geometry was found optimisable for installing solar collectors. The north-oriented bays were identified as trouble spots, especially in the area behind the bulkhead. The resulting shadows reduce yearly sunlight time in this area to approximately 1520 h, compared to the 3000 h in the rest of the roof. The greater space afforded by the absence of a prominent parapet was used to house a larger number of panels, although they still had to be positioned at a distance from the parapets. The geometric analysis was conducted bearing in mind the shadows cast by bulkhead and parapets.
As 75% of this flat roof receives sunlight all day, the test was run both in the presence (latitude −10) and the absence (latitude ±0) of substructure. This archetype was deemed significant for output and demand calculations both, for it is the neighbourhood building archetype with the highest demand load.
Archetype 4 is single family, semi-detached, ground + one-storey homes. Their flat roofs are optimal for solar collector installation. As no shaded areas were identified, these were the two archetypes with the largest number of sun hours, 3803 h on all areas of the roof. The sole rooftop element in archetype 4 is a small skylight at one end. No parapets or chimneys were identified. The presence of the skylight was taken into consideration in the geometric analysis to ensure the sloped panels would cast no shadows over that opening. As 100% of this flat roof receives sunlight all day, the test was run both in the presence (latitude −10) and the absence (latitude ±0) of substructure. These archetypes are the second-most prevalent (by No. of homes) in Canillas.
Archetype 5 comprised single family, pitched-roof, semi-detached ground + one-storey homes. Given the presence of a pitched roof, the geometric analysis involved some complexity. The need or otherwise for substructure was verified by analysing whether the pitch angle of the roof itself sufficed for optimal solar capture. The protruding elements housed on the roof, including skylights, chimneys and small-scale machinery, were also taken into consideration for due to the shadows cast over the roof by those elements less than 50% of its area receives the maximum yearly irradiance (3803 h).
The detailed analysis of archetype 1 described in the paragraphs below bring into focus the problems that arise when installing photovoltaic solar systems with no storage facility, as is generally the case due to the high costs of battery storage.
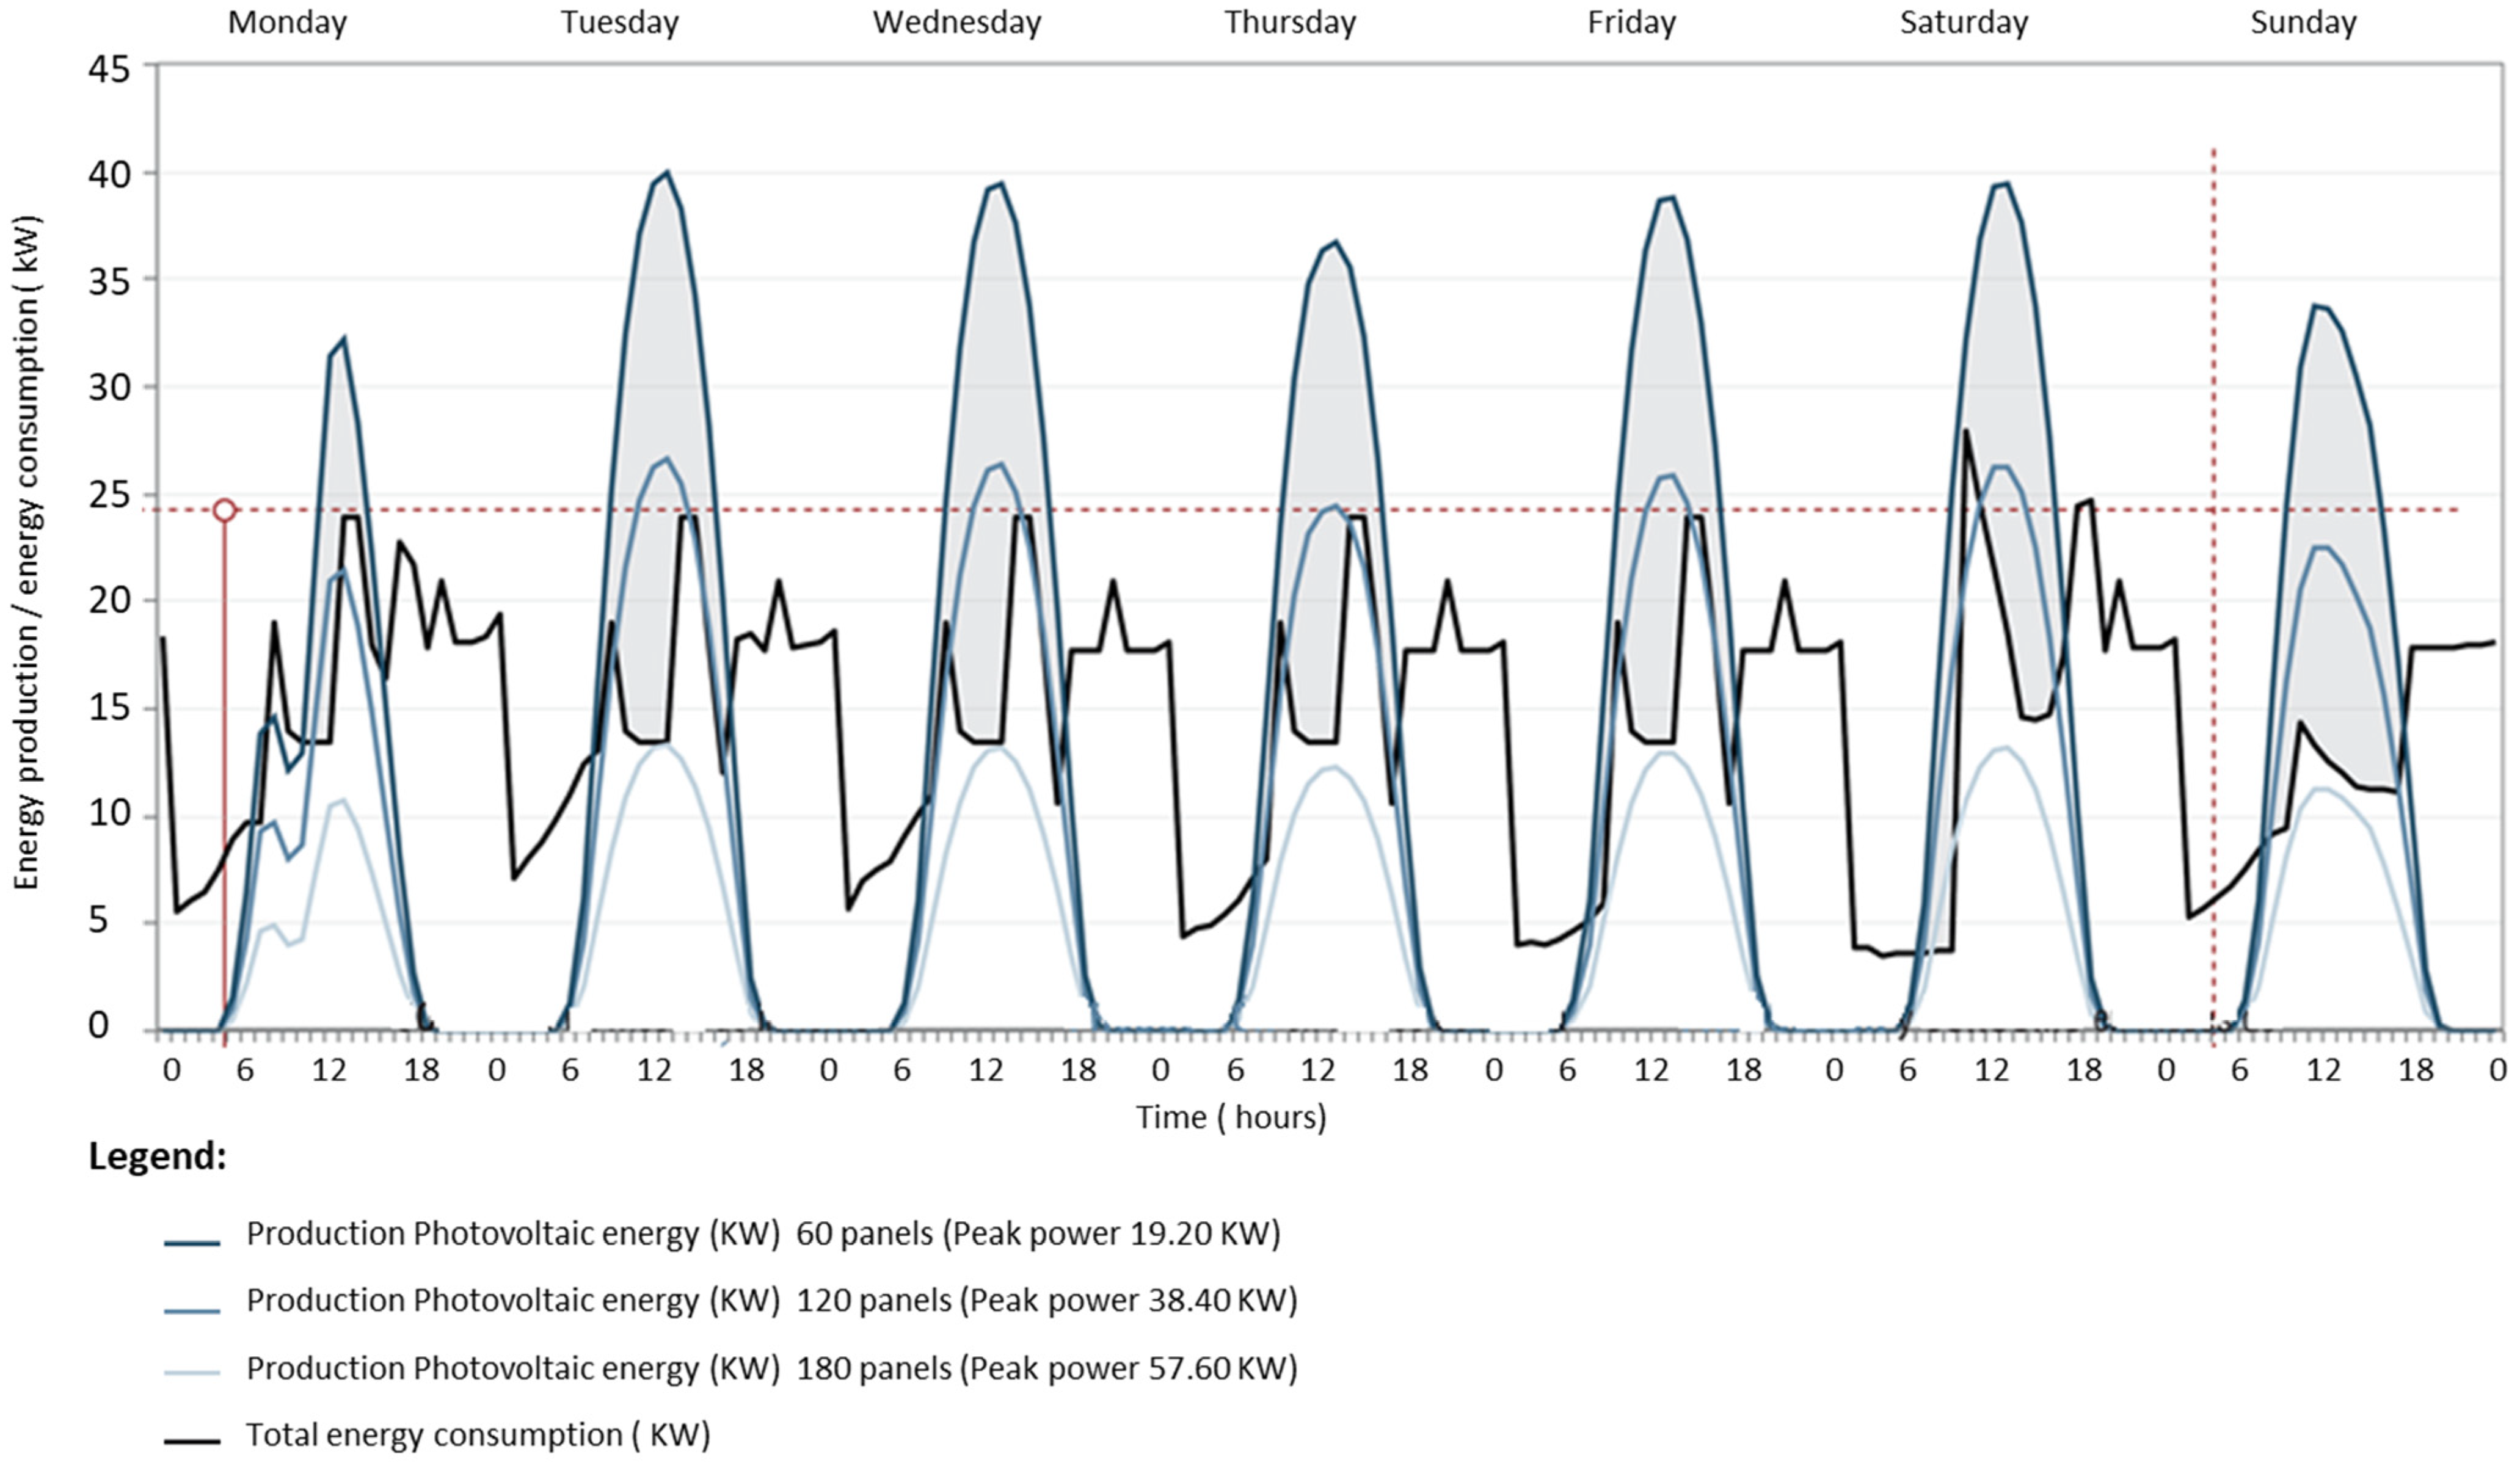
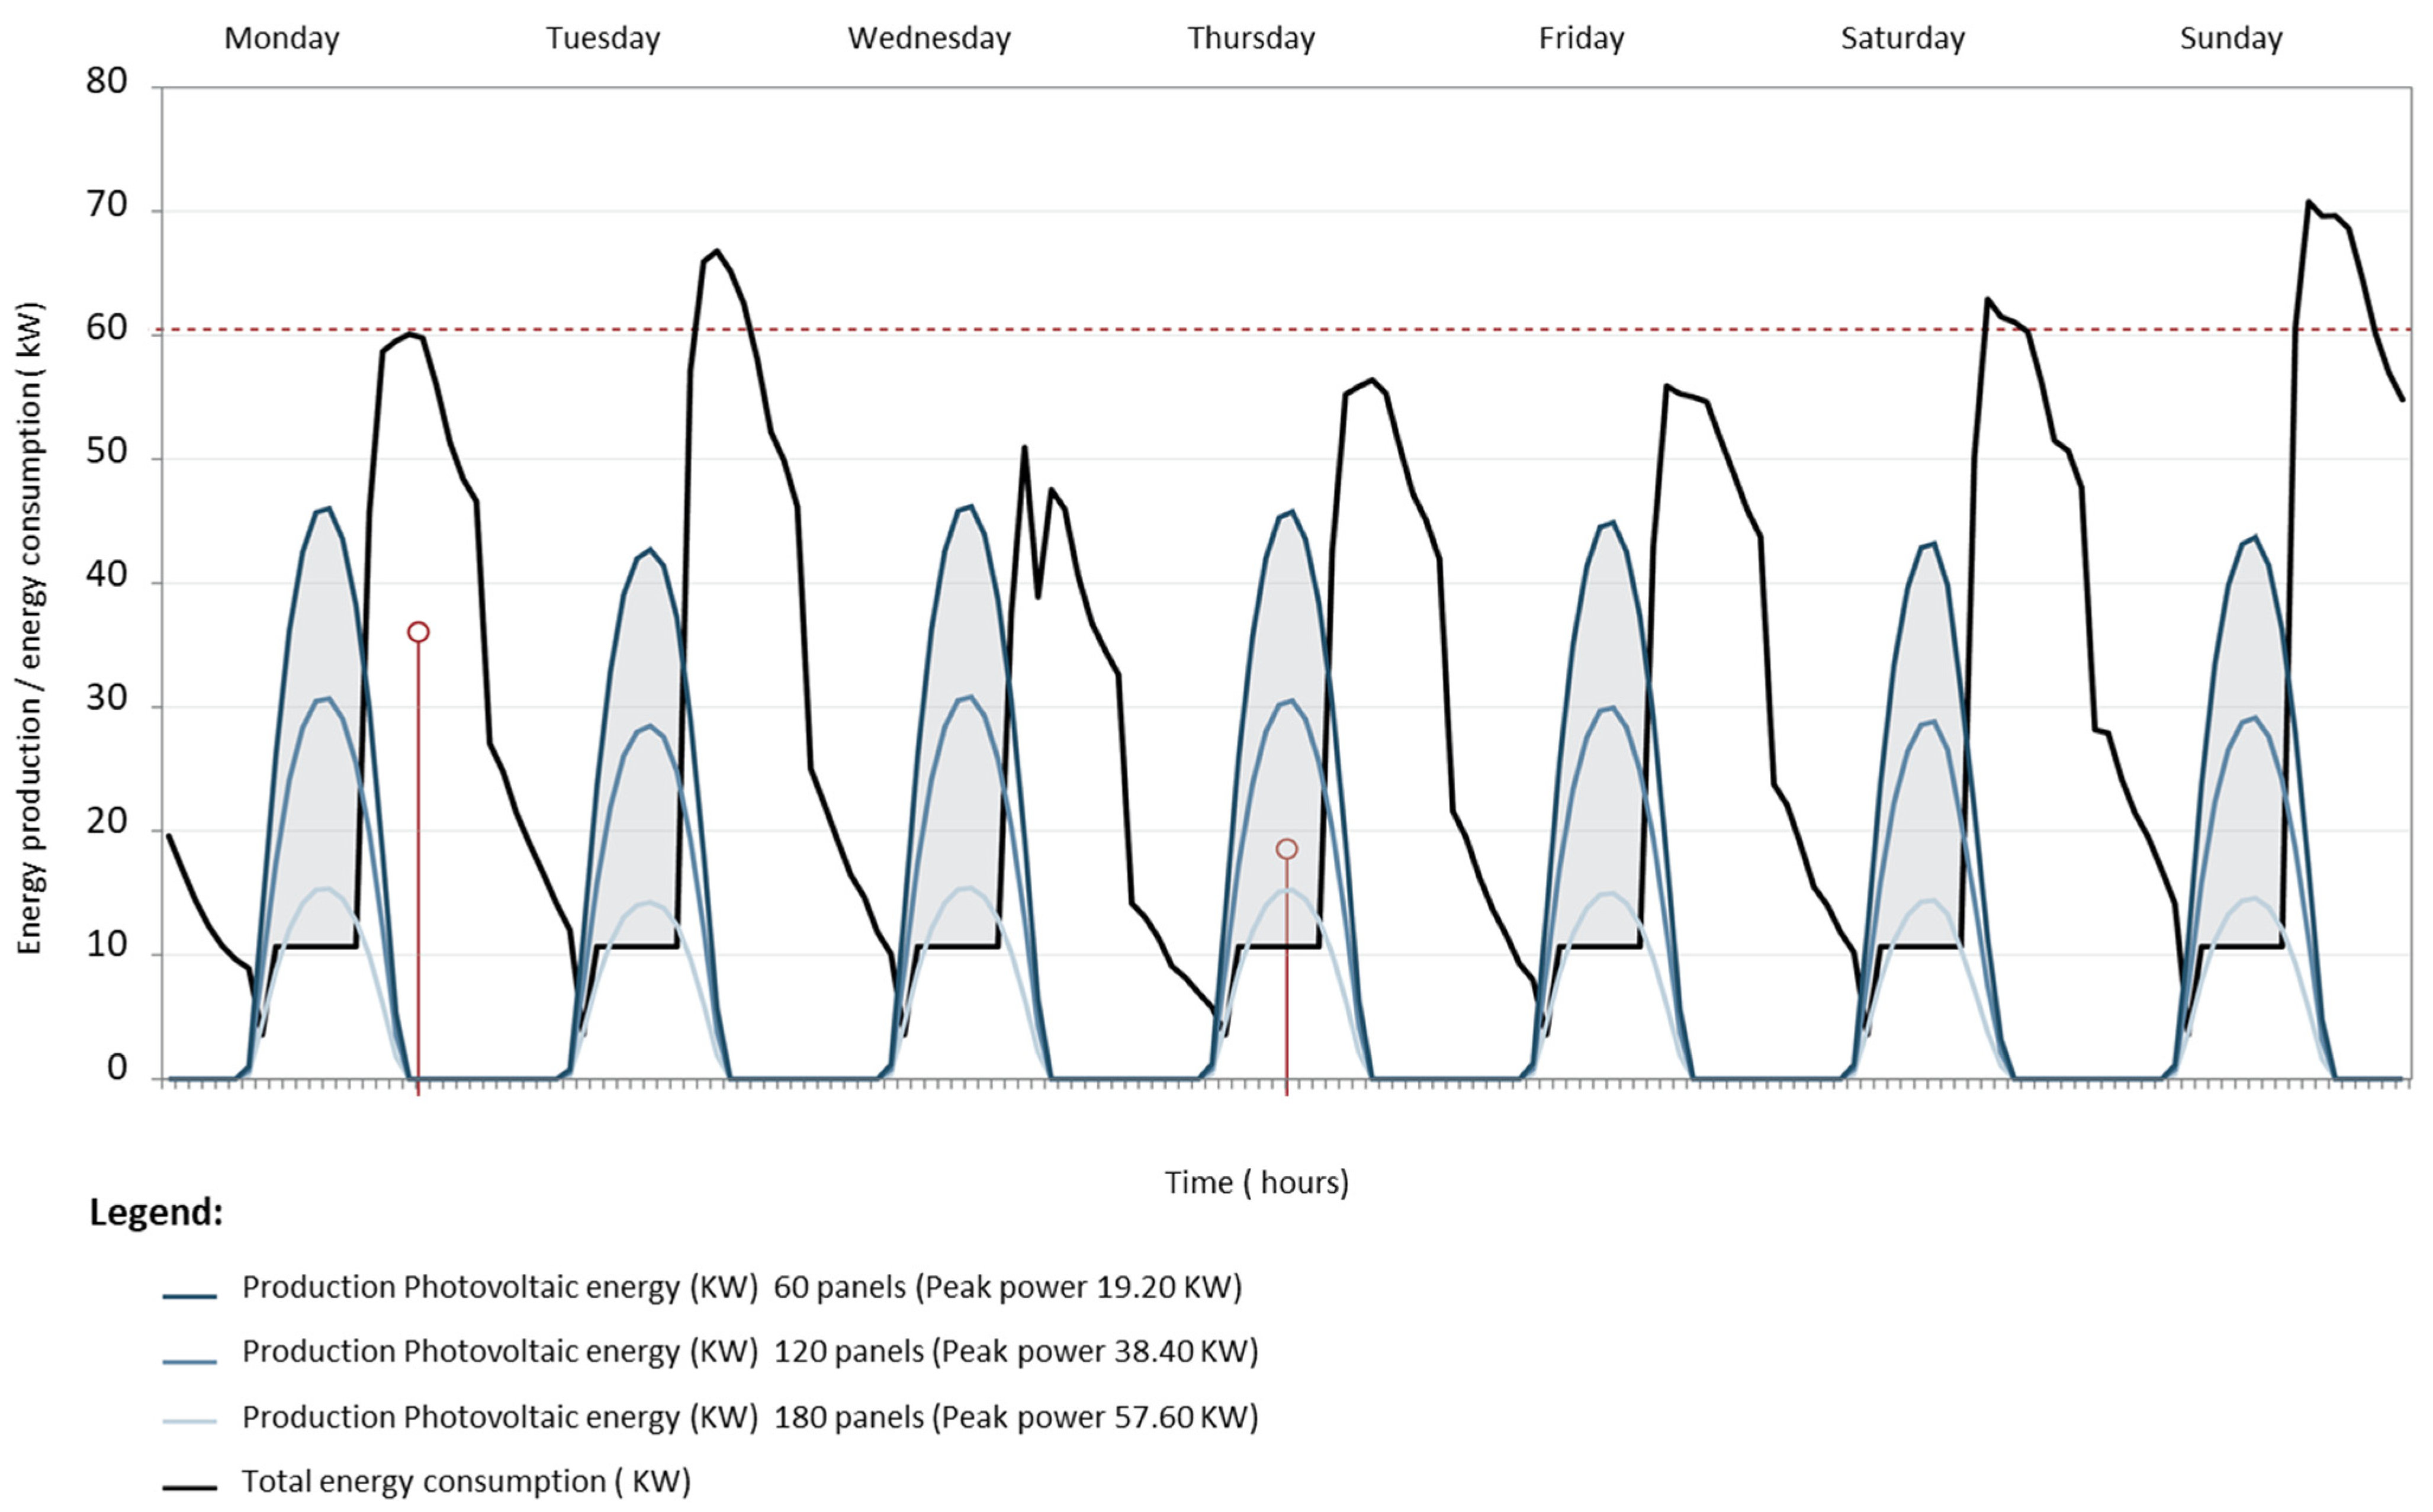
The consumption–output analysis was performed with data for a full week (Monday through Sunday) in March. Total consumption (black line in
Figure 4, with an upper limit of approximately 25 kW at peak hours) showed that consumption declined on the weekend, when in-home use and activity differed from the rest of the week. Output was likewise graphed (blue lines in
Figure 4) for three peak power/number of panel scenarios.
An hourly analysis revealed that the consumption peak was most intense at midday. Close to full advantage could be taken of output, which was similar to consumption in this archetype in the 120 panel/38.40 kW peak power scenario. Assuming peak power of 57.50 kW and 180 panels yielded surplus power from 11:00 to 18:00, which could be applied to energy exchanges for other uses.
In this week, typical of an intermediate (spring or autumn) season, under scenario 1 photovoltaic output could supply 29.67% of the energy consumed, whilst 70.33% would have to be sourced from the electricity grid. In scenario 2, PV output would cover 47.63% of demand and yield 282.63 kW of excess power or 19.63% of total production. In scenario 3 photovoltaic output would cover 54.21% of demand and yield 837.18 kW of excess power or 39.17% of total production (
Table 2).
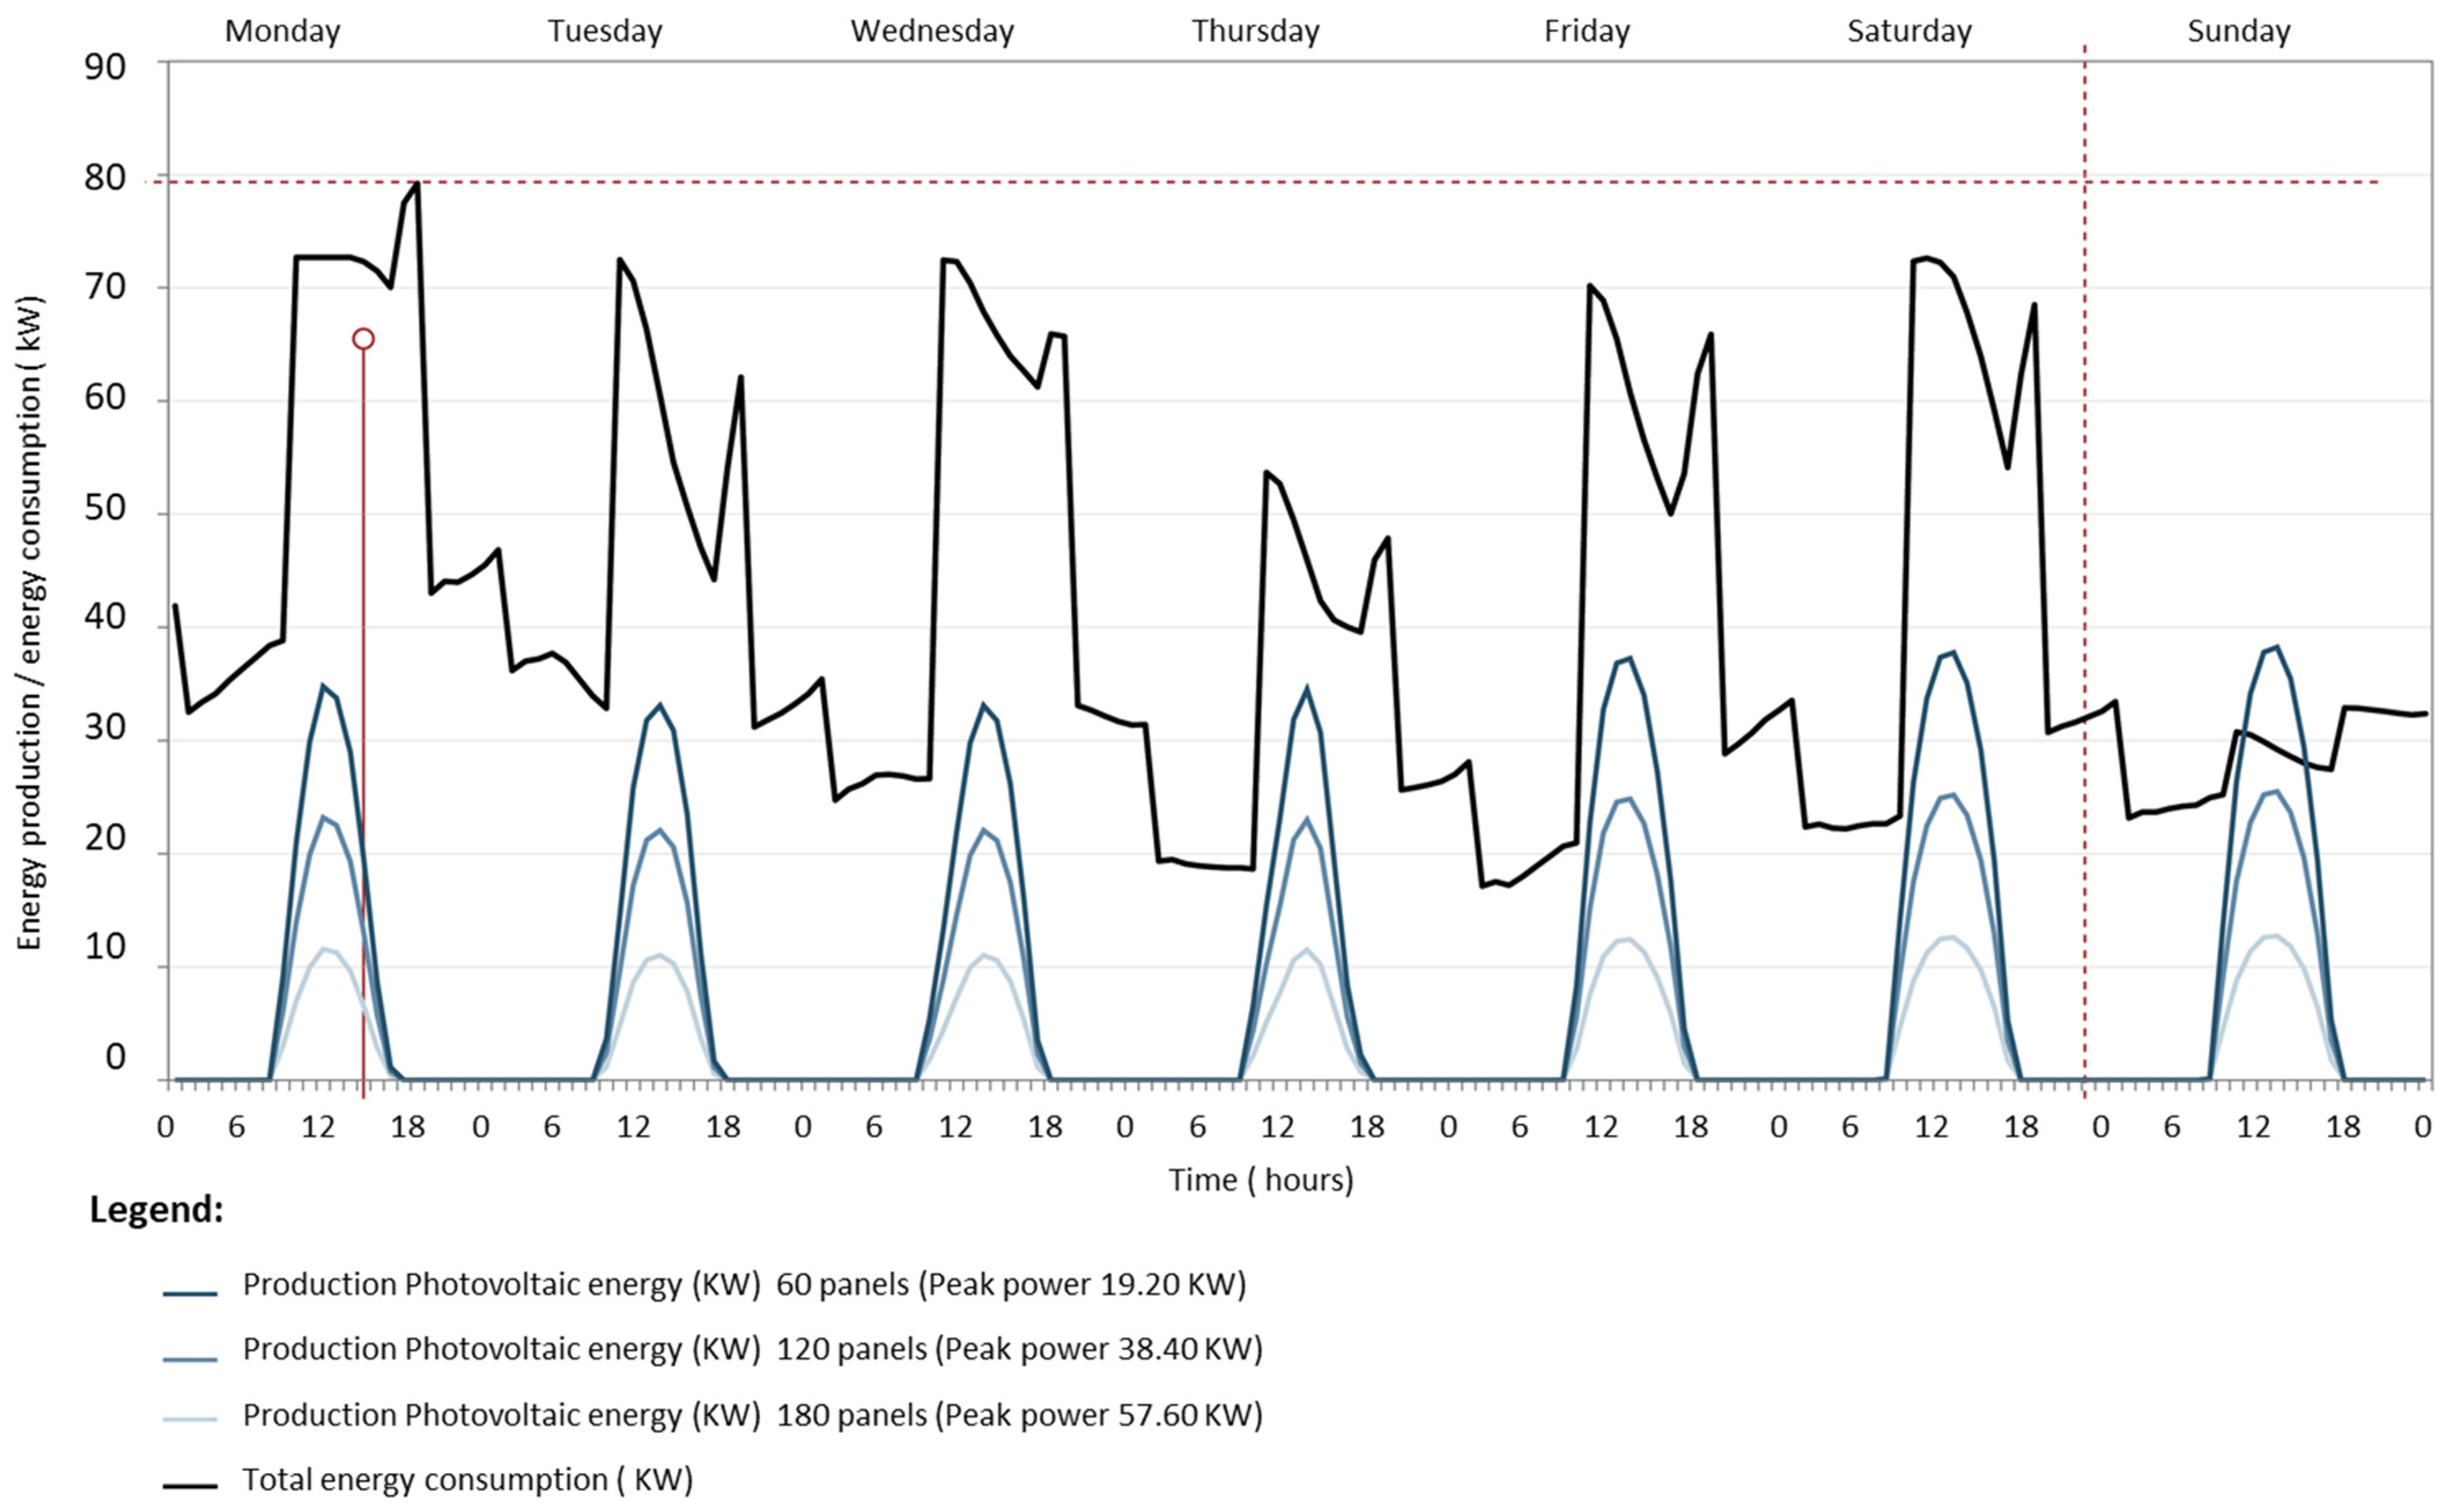
The same calculation for a summertime week showed mean peak hour consumption to amount to 80 kW. Not all the power produced was used, however, for peak production did not coincide with peak consumption, heavily impacted by the loads involved in air conditioning homes to the comfort targets laid down in Spanish legislation. The daily profile showed domestic consumption to be highest beginning at midday, when the widest consumption–output discrepancies were observed (
Figure 5).
In scenario 1 in this typical summer week, photovoltaic output would supply only 14.75% of the energy consumed. In scenario 2, PV output would cover 22.24% of demand and yield 510.90 kW of excess energy or 32.88% of total production. In scenario 3 photovoltaic output would cover 28.96% of demand and yield 972.77 kW of excess energy or 41.74% of total production (
Table 3).
As in summer, winter time peak consumption amounted to approximately 80 kW to meet heating-related demand. The energy yield was again observed to cover the demand load rather sparingly (
Figure 6).
The hour-by-hour profile showed power supply to be closely matched to demand at intermediate times only, assuming heating systems to be electrically-powered, despite the prevalence of gas-fired arrangements in Madrid.
In the typical winter week described photovoltaic output met from 6.87% (scenario 1) to 20.18% (scenario 3) of demand, with only negligible excess power production (
Table 4).
Further to the findings for the same analysis applied to the yearly data for archetype 1, in the third and most favourable scenario, photovoltaic output would cover 27% of total energy demand.
4. Discussion
Self-consumption or on-site use is defined as the ratio between self-consumed PV electricity and total electricity generation from PV. Self-sufficiency is the ratio between self-consumed PV electricity and total electricity demand [
19]. The difference between the two conceits is that whilst the numerator in both cases is the PV-generated electric power consumed on site, the denominator varies: in self-consumption it is total local photovoltaic generation and in self-sufficiency a household’s total consumption.
According to the data in
Table 5, all the facilities met a sizeable percentage of energy consumption and produced substantial excess power. In apartment buildings, self-sufficiency rates ranged from 15% to 25% and self-consumption rates from 61% to 80%. As the last home type listed in the table, single-family homes, produced considerable excess power in terms of self-consumption, a single facility could serve a broader community of beneficiaries. That circumstance holds particular promise, for in some developments not all the homes have an energetically optimal orientation or roof apt for a photovoltaic facility. Positioning the panels in the most favourable site would optimise the facility and its usability by several households.
The successful implementation of these actions depends on the current legislative framework in each country, which includes, among others, the regulation on the use of excess power produced and its possible storage. In this way, Spanish legislation (Royal Decree 244/2019) [
20] specifies a number of options for using excess power: increasing the number of consumers; feeding it into the grid with adjustments to the simplified remuneration scheme; selling it on the market; or storing it. Storage of the excess power produced by a facility is a procedure now in place in countries such as Germany and the United Kingdom where it constitutes a distributed electricity system. When the grid requires more energy, that demand can be met almost immediately by batteries, obviating the cost and lag times associated with cold start-up of whole power plants. If the excess is fed into the grid, self-consumers subscribing to the simplified remuneration scheme are credited with the difference between the price of the energy purchased and of the price of the power sold in each billing period. The latter may be the subject of a prior agreement with the retailer or the small-scale consumer’s voluntary price (Spanish initials, PVPC) defined in the simplified remuneration scheme for excess power.
This research has shown with a methodological example the expected impact of the implementation of photovoltaic energy production systems in a deprived urban neighbourhood, which were optimised for sharing the excess generation with other users (power exchange). Nevertheless, further studies should be developed to correlate these results with the expected payback period of the solar power addition, as well as to evaluate the the financial structure to share the solar generation. Thus, these studies could provide a technical framework both for private operators and public decision-makers.
5. Conclusions
Versatility, efficiency and ever greater affordability have made solar power a major player in today’s energy models. Citizens and industry professionals have assumed an essential role in changing those models, along with the authorities, energy consumers and small towns determined to further the switchover to renewable energy sources. Any number of municipal governments are taking decisive action in that regard, implementing energy savings and efficiency policies and helping citizens by providing support for renewable energies and sustainable mobility. Those initiatives require tools that help users recognise the potential of their own homes.
This case study explores and provides a detailed account of the solar potential of a number of residential building archetypes found in peripheral and outlying neighbourhoods in large southern European cities.
The methodology proposed was tested in Canillas, a neighbourhood in Madrid, Spain. The findings quantified the potential for generating photovoltaic energy, establishing self-consumption and self-sufficiency rates for the five archetypes studied. The output is a valuable information base for addressing the energy revitalisation of such neighbourhoods. Each archetype, which differs substantially from all the others, exhibits characteristics that can be readily applied in other urban environments:
- -
Stand-alone ground + four-storey apartment building with complex hipped roof
- -
Linearly aligned ground + three-storey apartment building with flat roof
- -
Ground+11-storey apartment tower
- -
Semi-detached ground + one-storey single family home with flat roof
- -
Semi-detached ground + one-storey single family home with pitched roof
The data generated in this study provide citizens and municipal authorities with a useful tool to contribute significantly to improving the environment and quality of life for residents in disadvantaged neighbourhoods.


 ,
, 


