Article

The Misunderstanding of China’s Investment, and a Clarification: “Faustian Bargain” or “Good Bargain”? On the OFDI Data of Central and Eastern Europe

1
School of Government, Shenzhen University, Shenzhen 215123, China
2
Institute on the Development of Southern Jiangsu, Collaborative Innovation Center for New-Type Urbanization and Social Governance of Jiangsu Province, Soochow University, Suzhou 215123, China
3
Metropolitan College, Boston University, Boston, MA 02215, USA
4
Department of Government, University of Texas at Austin, Austin, TX 78703, USA
5
Zhejiang Business College, Hangzhou 310000, China
6
Institute of Economic Sciences, Hungarian University of Agriculture and Life Sciences, 2100 Gödöllő, Hungary
7
Faculty of Economics and Business, University of Debrecen, 4032 Debrecen, Hungary
8
College of Business and Economics, University of Johannesburg, Johannesburg 2006, South Africa
*
Authors to whom correspondence should be addressed.
Sustainability 2021, 13(18), 10281; https://doi.org/10.3390/su131810281
Submission received: 3 August 2021 / Revised: 8 September 2021 / Accepted: 10 September 2021 / Published: 14 September 2021

Abstract

:
The close development of the economic relations between China and Central and Eastern Europe (CEE) since 2012 has triggered the European Union’s criticism of China’s foreign policy towards Eastern European countries. The European Union believes that China’s investment growth has led to a governance crisis in CEE countries. Based on the global governance indicators of the World Bank and the outward foreign direct investment (OFDI) data of the Ministry of Commerce of China, this paper conducts a test using the panel data model and the regression discontinuity method. An imbalanced panel dataset is adopted, covering 16 CEE countries from 2000 to 2018. The empirical research results indicate that, representing a small proportion of the investment inflows to CEE countries, China is not yet able to exert a domination effect on the region, and China’s economic power is far less than the European Union’s regulatory influence. Furthermore, China’s share of the OFDI in CEE has a U-shaped effect on the regulatory quality of host countries, and the two have a mutually causal relationship. Specifically, the impact on the host country’s regulatory quality is first manifested in the Shanghai effect, and when China’s share reaches a certain level, it is manifested in the California effect. The U-shaped effect is associated with the strategic factors of CEE countries and China’s positive contribution to good global governance.

1. Introduction: Good Bargain or Faustian Bargain?

China’s foreign direct investment is most notable in terms of rapid growth, geographic diversification, and the acquisition of well-known Western brands [1]. However, still, there are a number of issues that create a misunderstanding of Chinese OFDI in different countries. Based on this concept, this study specifies the objectives of this study to clarify the misunderstanding of the concepts of Chinese foreign direct investment in European countries. The objectives of this study are extended to investigate the impact of China’s investment on CEE countries’ policies and government supervision.
There was a severe lack of investment in Europe in the last few decades [2]. In order to obtain investment from China, some countries in Central and Eastern Europe (CEE) began to implement the “Economic East” foreign policy. The concept of “Economic East” was first developed by Edward [3]. In 2012, China and CEE countries signed the 16 + 1 cooperation framework agreement, and since then, China’s investment in such countries has grown both in volume and share as an influential trading partner [4]. However, this triggered wide-ranging debate in European political and academic circles about the effects of China’s outward foreign direct investment (OFDI) in the region [5]. On the one hand, some people considered it a good bargain, assuming that Chinese foreign direct investment (FDI) would deliver the same economic benefits as other direct investment flows [6]. Hanemann and Huotari [7] noted that China’s growing OFDI footprint “presents a once in a lifetime opportunity for attracting capital to Europe and helping restart investment and economic growth”. A variety of studies empirically proved that FDI produces positive effects on the economic growth and governance quality of the host country [8,9,10,11]. Some CEE countries also take an optimistic attitude towards Chinese investment [12]. Basically, China’s OFDI (in terms of motivation) is inspired by the features of different industry levels in both home and host countries [13]. For example, in recent times, the motivations of Chinese investors are to expand investment in Europe. Thus, when they find that any European company has been sold, they are interested in buying the shares of those European companies that have decided to sell shares to new owners [14]. In some cases, some European businessmen believe that Chinese investments may form a threat to national security and public order [15].
On the other hand, in recent years, more and more Western scholars have suggested, with certain political prejudices, that Chinese investment may be a Faustian bargain and a zero-sum game [16,17,18,19]. In the short term, CEE countries face intensified competition to attract Chinese capital. Chinese capital is accompanied by implicit conditionality affecting European norms and policies, including the relaxation of regulations on human rights, environmental standards, and labor laws [20]. This will impose negative effects on the economic growth, national security and governance in CEE [21]. Some Western scholars believed that China’s growing investment activities and economic strength may undermine the European Union’s (EU) political and economic strength [22,23,24,25]. In a period of European political uncertainty and rising nationalism, these CEE countries still have a long way ahead before joining the European Union [26]. They suspected that Chinese investment is a Trojan horse for the European Union: it may cause the reverse Marco Polo effect in developed European countries (https://www.voanews.com/europe/italian-entrepreneurs-turn-chinese-help, accessed on 10 January 2021), or may produce the so-called Shanghai effect, and thus fuel corruption in transition economies such as those in CEE countries [27]. Brussels even portrayed China as a “potential threat” and “challenge”, arguing that the enhanced economic cooperation with China under the 16 + 1 cooperation framework will impact the political choices of CEE countries [28]. Some scholars attributed the slow process of democratization and the declined quality of governance in CEE to China’s direct investment and infrastructure financing [29].
The research objects include 11 countries that joined the European Union in the 2004, 2007 and 2013 enlargement rounds, namely Bulgaria, Croatia, Czech Republic, Estonia, Hungary, Latvia, Lithuania, Poland, Romania, Slovenia, Slovak Republic, and other five non-EU countries, namely Serbia, Montenegro, Macedonia, Bosnia and Herzegovina, and Albania. However, some scholars confined their research on China’s economic impact on CEE to case studies [30,31,32], while some scholars quantitatively analyzed the factors influencing China’s OFDI [33]. In any case, the research on the clarification of the misunderstanding of concepts of Chinese foreign direct investment to European countries has not yet been explored. Furthermore, the impact of China’s investment on CEE countries’ policies and government supervision has not yet been investigated with a large sample of data. Therefore, this study finds the research gap and specifies the objective to find this out. In view of this, we selected a large-scale dataset for the experiment in this study. Based on the 2000–2018 economic and trade data of China and CEE, this paper combines a panel-data model and regression discontinuity model with descriptive data and cases to perform a strict cause-and-effect inference regarding the impact of China’s OFDI on CEE’s governance quality, in response to the case-based analysis and judgment of Western scholars.
This research made a unique contribution to clarify China’s foreign direct investment in European countries. The concept of this misunderstanding is also discussed very clearly here. In addition, this empirical study on the relationship between China’s OFDI and the governance quality in CEE countries is a new contribution to the existing literature. This study found that China’s share of OFDI in CEE has a U-shaped effect on the governance quality of host countries. Furthermore, according to the findings, there is a causal relationship between the share of Chinese foreign direct investment in a country’s economy and the regulatory quality of the host countries. The relationship is first manifested in the Shanghai effect, and then as the California effect after China’s share reaches a certain level. However, according to the data, there is no such causal association between China’s share of foreign direct investment and the host country’s ability to regulate corruption. These relationships may explain the strategic behavior of CEE countries.
The contents of this paper are presented in a structured way. In Section 1, the introduction, we presented the background, significance, objectives, and contribution of the study. Section 2 clearly explains the concept of economic power from the perspective of realist theory, the source of China’s OFDI power in CEE, and the logic of the Faustian bargain. The materials and methods, and empirical analysis are presented in Section 3 and Section 4, respectively. Finally, the discussion and conclusion are discussed in the Section 5.

2. Literature Review and Research Hypothesis

According to various geopolitical, geographical, cultural and socioeconomic factors, the European continent can be divided into several regions. Western Europe and Eastern Europe are two such regions. There is no clear boundary between these two areas. The main difference between Western Europe and Eastern Europe is that the name “Eastern Europe” refers to all of the European countries previously ruled by communist regimes, while the name “Western Europe” refers to Western countries with more stable and developed economies (https://pediaa.com/difference-between-western-and-eastern-europe/#:~:text=The%20key%20difference%20between%20Western,stable%20and%20developed%20Western%20countries, accessed on 27 August 2021). Based on the realist concept of power, Western scholars believe that China’s OFDI transforms into economic power in CEE (The CEE countries are Albania, Bulgaria, Croatia, Czech Republic, Hungary, Poland, Romania, Slovak Republic, Estonia, Latvia, and Lithuania), exerting political and social influence that may impair the quality of governance in EU member states [34]. The theoretical sources and specific impact mechanisms are as follows.

2.1. Economic Power from the Perspective of Realist Theory: The Source of China’s OFDI Power in CEE

The concept and influence of power is one of the major long-lasting issues in the theories of international relations [35,36]. The realist concept of power emphasizes the country’s initiative in pursuing power and the importance of material resources to exercise power. It pays attention to the influence brought by (economic) interdependence between states [37]. Barnett and Duvall [38] defined power as “the production, in and through social relations, of effects that shape the capacities of actors to determine their circumstances and fate”. This concept highlights the changes in the behavior of actors, and characterizes power as “the relations between actors, which enables the expectations, desires, preferences or intentions of actor(s) to exert control over the behavior of other actor(s) or the tendency to take action.” Power in international relations is divided into four categories: compulsory, institutional, structural, and productive. Among them, compulsory power is the use of material resources by one actor to control or influence the behavior of another actor [38]. Knorr [39] noticed that the application of economic power to weak countries in order to exert influence has historically been a foreign policy method adopted by powerful countries. Specifically, economic measures such as commercial relations, FDI, financial assistance, and technical support are used to demonstrate political goals.
Physical materials in international relations are mainly embodied in economic activities in modern times, including trade activities and investment activities. In the 1950s, some scholars proposed the concept of economic power, i.e., that physical materials have a domination effect. They held the idea that a dominant country could influence another economy through the channel of a market economy [40]. This kind of economic power is manifested in economic interdependence in modern international relations. Keohane and Nye [37] referred to interdependence as situations “characterized by reciprocal effects among countries or among actors in different countries”, and pointed out that asymmetrical interdependence can be manipulated as a source of power. Academic debates about asymmetric interdependence mainly focus on economic relations (especially trade relations) among countries, and the ways in which they affect the actions or policies of other countries [41]. In fact, the economic relations and mutual dependence between countries involve not only bilateral trade status and scale but also encompass financial activities such as OFDI. In particular, OFDI is considered to be the key to exerting economic and political influence on other countries [42]. From the perspective of economic sociology, OFDI can be understood as “social relations embedded in social structure, power and culture” [43]. According to this definition, OFDI can be regarded as a means of obtaining informal access to another country and infiltrating government politics from the inside. Thus, OFDI as a physical material has become a source of compulsory power proposed by realist scholars. It represents a typical economic power with a domination effect. There are successful cases of the manipulation of this power in the practice of international relations (South Korea-Soviet Union and South Korea-China) [44].
China has made it into the top three (second or third) countries in the global OFDI flows since 2012. Scholars believed, based on the realist concept of power, that China has a certain economic power. Bartosz Kowalski [45] suggested that China’s OFDI and infrastructure diplomacy, which Willy Wo-lap Lam calls the Tanzania railway model or Renminbi diplomacy, affects the political preferences of host countries. Two well-known European think tanks, namely the Global Public Policy Institute (GPPi) and the European Council on Foreign Relations (ECFR), respectively released reports analyzing the challenges brought by China’s values and interests to European countries. Godement and Vasselier [34] referred to China’s economic activities in Europe as “China’s long arm”, and regarded OFDI as a “bilateral diplomatic weaponry” that is used to create asymmetrical interdependence. Based on such interdependence, China increasingly places its own laws and regulations above international laws, norms and even values [34], and extends its own norms to CEE through relations of corporate investment, resulting in a decline in the governance quality and democracy standards of CEE countries during the transition period (https://merics.org/en/report/authoritarian-advance-responding-chinas-growing-political-influence-europe, accessed on 5 February 2021).
There are some changing characteristics of OFDI in the fourth industrial revolution and now global capitalism, such as sustainable capitalisms, smart city characteristics, innovation strategy, emphasis on open innovation, and so on. A number of studies believe that the changing characteristics of Industry 4.0 will also have an impact on OFDI [46,47,48,49,50,51].

2.2. The Logic of the Faustian Bargain: The Specific Mechanisms for China to Exert the Domination Effect of Economic Power

The foregoing explanation provides a theoretical deduction of the possible negative effects of China’s OFDI. It shows that China has the potential to exert the domination effect of economic power. If so, does China actually take advantage of the economic power brought by OFDI? For a long time, European countries have been accustomed to investing in emerging economies, rather than receiving investment from emerging economies. Concerns about China have also been affected by the financial crisis since 2008. In the post-crisis period, some European people worry that the so-called rise of the rest heralds a sharp decline in their (European) power, as Chinese companies seem to be buying up the world (https://www.economist.com/leaders/2010/11/11/china-buys-up-the-world, accessed on 5 February 2021), taking over Europe (https://www.lepoint.fr/economie/la-chine-rachete-l-europe-22-09-2011-1380187_28.php, accessed on 5 February 2021), and invading Europe (https://www.lexpress.fr/actualite/monde/europe/comment-la-chine-s-installe-en-europe-via-les-pays-les-plus-fragiles_1983048.html, accessed on 5 February 2021). It can be expected that such public concerns will force policymakers and observers of contemporary European politics to face these basic questions: Is Chinese investment the same as other inflows of investment? Could accepting Chinese investment be a Faustian bargain? In the minds of some Europeans, the answer seems to be that the special features of Chinese investment make Chinese investment a Faustian bargain. This view rests on two impact mechanisms: a detrimental race to the bottom and the diffusion of bad governance.

2.2.1. A Detrimental Race to the Bottom Produces the Shanghai Effect

A detrimental race to the bottom refers to the competition among CEE countries under economic pressure in the face of underinvestment since the 2008 financial crisis, where regulation is reduced to its lowest point in order to attract Chinese investment. On the one hand, facing pressure from the financial crisis, CEE countries hope to obtain diversified investments with growth potential as a gateway to the EU market for Chinese investors (https://issuu.com/collegeofeurope/docs/eu-china_observer115, accessed on 5 February 2021). On the other hand, CEE countries need to improve their national infrastructure and governance capabilities before joining the European Union. While EU member states have a wide range of options for large-scale financing, the options are limited for CEE countries in the 16 + 1 framework. Many Eastern European countries (except Bulgaria and Romania) did not gain EU membership around the establishment of the 16 + 1 mechanism. Financing gaps still exist in these non-EU countries, despite financing possibilities (e.g., Western Balkans Investment Framework) offered by the European Union and international financial institutions. In the European political uncertainty period and during rising nationalism, these CEE countries still have a long way ahead before joining the European Union. They need to find faster and easier financing options, for which Chinese investment is welcome. Exactly in this context, China launched the 16 + 1 mechanism, the “New Silk Road” or the “Belt and Road Initiative”. Therefore, Western scholars suppose that China’s Belt and Road Initiative has increased the competition in CEE because all of the countries in the region hope to become a bridge between China and Europe through this commercial project. Such fierce competition, coupled with the problem of collective action, produces the so-called Shanghai effect [52]: The practices of foreign companies in a weakened regulatory environment will spread to local companies through competitive pressure, resulting in a decline in the overall governance quality of these countries. The impact is mainly reflected in the following three aspects.
First, the host country’s autonomy in the implementation of economic, social and cultural policies may be impaired by OFDI (Forte and Moura, 2013). Studies have shown that a negative consequence of FDI in the host country is a decline in the local authorities’ autonomy [53]. More specifically, large multinational companies gain control of employment assets, enabling them to influence the political and economic decisions of host-country authorities. Due to their size and impact on the local economy, the strategic decisions of multinational companies are independent of the strategies of local authorities. In the case of unstable FDI inflows and outflows, policies in the host country may undergo major changes, or even go against ideals to benefit foreign investors [54]. This impact mechanism even rises to the national level. FDI can be employed as a means to exert control over developing countries [55]. China’s investment in CEE has also been interpreted in this way [34].
Second, the CEE competition to attract Chinese investment may undermine regulatory standards in the areas of bidding, financial subsidies, and environmental and labor policies. With the infusion of substantial financial support and experience from China, roads, railways and ports in Southeast Europe are rapidly being constructed or modernized without bureaucratic and legal obstacles. Certain competition, bidding and procurement procedures, as well as national security and labor laws, seem to be partially bypassed. Some European scholars call for an in-depth study of the extent to which EU trade laws, bidding procedures and national regulations have so far been neglected for Chinese investment in this region [56]. CEE generally applies EU standards, which are higher than Chinese standards in terms of regulation. However, with the inflow of Chinese investment, Europe is upset that those Chinese standards may cause the overall relaxation of these standards in CEE countries. Despite its small share of the OFDI in the CEE region, Chinese investment may also affect the domestic policies of these countries’ aid competition for investment, leading to the minimization of regulatory requirements, such as environmental and labor standards [20]. Chinese companies investing overseas, especially construction companies, tend to bring their own labor force and violate local labor laws. An example is the China Overseas Engineering Group, which built the A2 highway between Warsaw and Lodz in Poland. The biggest implication for labor policy is most likely the softening of labor standards in the host country, which may turn a blind eye to labor violations in order to court and keep Chinese investment [20]. Western scholars concluded, based on incomplete empirical research, that African countries in close economic and trade relations with China have adopted relatively low Chinese labor protection standards [57].
Third, Western scholars are concerned that China’s strong influence on Chinese companies may strengthen China’s economic power [44]. In the early 20th century, China’s OFDI structure was dominated by state-owned enterprises (SOEs). As shown in the Figure 1, below, the contribution of SOEs was as high as 81% in 2006, and despite a long-term downward trend, it has stayed above 50% at present (which is very different from that of European and American countries). CEE has a similar OFDI structure. Western scholars held that compared with private enterprises, SOEs are more inclined to link economic goals with political goals [58]. Because the Chinese government gets more involved in the FDI decisions of SOEs, some Europeans suspected that a link is more likely between the specific investment decisions of Chinese SOEs and specific policies of the Chinese government. Whether it is abroad or at home, the engagement of SOEs in various projects is considered to reflect China’s strategic motives, and can impose threat and influence [20,59]. From the perspective of economic power, FDI economies have many hard and soft economic tools available to influence the behavior of the host authorities [60]. This explanation has been applied to Chinese investment growth in the CEE region. Some scholars suggested that China will exert economic influence to make their opinions on issues of concern heard in host countries [61]. Thus, economic power becomes an economic governance tool employed by China to achieve foreign policy goals. Based on this, two hypotheses under Hypothesis 1 are proposed:
Hypothesis 1a (H1a).
The more China invests in CEE, the more supportive of Chinese policies CEE tends to be.
Hypothesis 1b (H1b).
The more China invests in CEE, the worse the quality of government supervision CEE has.
Figure 1. Share of SOEs in China’s OFDI, 2006–2017.
Sustainability 13 10281 g001

2.2.2. Diffusion of Bad Governance—Diffusion of Corruption

The “diffusion of bad governance” argument holds that China has poor performance in governance (based on Western standards), such as the control of corruption and government quality [62]. China’s governance is a type of bad governance that is different from good governance. China’s OFDI influence leads to the retrogression of governance norms and standards in CEE countries, which may result in CEE’s deviation from EU political leadership and European values and norms [61]. This mechanism was first applied by Western politicians and scholars to China’s investment in Africa. In 2018, John R. Bolton, then Assistant to the President for National Security Affairs of the United States, gave a strong speech on African issues, criticizing China and Russia for their corrupt business practices in Africa (https://www.sohu.com/a/281853086_116897, accessed on 10 February 2021). Some scholars examined the correlation between the corruption level and Chinese investment preferences based on the data of Chinese companies investing in Asian and African areas with extremely high corruption levels, in order to prove that Chinese investors may actually welcome a highly corrupt business environment [63,64]. Isaksson and Kotsadam [57] adopted measurement methods to verify that China’s aid to Africa fuels local corruption. They geologically matched China’s foreign aid projects with respondents from the famous Afrobarometer survey, and compared the corruption experiences of individuals living near sites where Chinese projects are underway to those of individuals living close to sites where Chinese projects will be initiated, but are not yet implemented.
In recent years, Western scholars have directly applied the effects of China’s investment in Africa to CEE. They have often severely criticized China’s investment projects, on the grounds that China’s approval procedures for OFDI projects are not transparent and the technical standards for delivery are low, or even that the mode of behavior of Chinese companies will harm the interests of enterprises and the overall economy in CEE countries. Such views are often seen in CEE mainstream media discussions. For example, the analysis of Serbian mainstream media has been widely disseminated and discussed. “The Chinese way of doing business” also “allows Balkan decision-makers...to contribute to sponsor networks”, and “is putting pressure on target countries that owe huge debts to China”. China’s infrastructure projects are also considered to “exacerbate the serious corruption and government problems in the region” [61]. The specific impact mechanism is that aid projects may affect local corruption through the transmission of norms [65]. In a way similar to the Shanghai effect, by condemning corruption, aid projects in Western developed countries may be able to influence the behavioral norms of the aided countries, that is, norms about how people should behave. The authorities will raise the awareness of corruption issues, and establish standards of behavior to illegalize and stigmatize corrupt behaviors. Thus, this will affect local social norms and even trigger institutional changes that lead aided countries towards good governance (https://css.ethz.ch/en/services/digital-library/publications/publication.html/189192, accessed on 13 February 2021). The transmission of norms may also work in another direction, one that legitimizes and stimulates corruption. In the eyes of Western scholars, China’s OFDI has this effect, making norms more likely to deteriorate rather than improve [66]. They assume that China underperforms in the control of corruption (as shown in the Figure 2 below), and tends to maintain control of development projects throughout the implementation phase. Such control is typically achieved through Chinese contractors in recipient countries, because Chinese companies operating overseas are accused of corrupt practices to win contracts from more honest companies [67]. According to the Bribe Payers Index (BPI) data of Transparency International, China ranked far behind European countries over the years. The index examines the extent to which companies from the world’s leading economies engage in bribery when doing business abroad. There is a view in Western academic circles that the behavior of Chinese companies brings corruption, suggesting that Chinese investment may have a worse impact on local regulation and the control of corruption. Furthermore, we studied some other literature on international capital flows, the transformation of economic digitalization, and technological and innovation influence [68,69,70,71]. Based on this, Hypothesis 2 is proposed:
Hypothesis 2 (H2). 
The more China invests in CEE, the lower the level of corruption control CEE has.
Figure 2. China’s corruption perceptions index scores and relative positions, 1995–2018. Note: As the number of countries or regions covered by the rankings is different among the years, this study designed a parameter: the relative position is the position in the ranking/number of countries or regions. The closer the value is to 1, the higher the ranking. The closer the value is to 0, the lower the ranking.
Sustainability 13 10281 g002

3. Materials and Methods

3.1. Measurement of the Variables and Data Sources

The sample consists of 16 countries (Bulgaria, Croatia, Czech Republic, Estonia, Hungary, Latvia, Lithuania, Poland, Romania, Slovenia, Slovak Republic, and other five non-EU countries, namely Serbia, Montenegro, Macedonia, Bosnia and Herzegovina, and Albania). The time frame spans from 2000 to 2018. First, we take 2000 as the starting point due to the increase of China’s trade and investment activities in Europe after its accession to the WTO in 2000. The measurement of the variables and data sources are as follows.
First, the dependent variables are measures of national governance quality: regulatory quality and control of corruption. Drawing lessons from Liu and Zhang’s [72] research on China’s FDI destination preferences, two of the six dimensions of governance in the World Bank’s Worldwide Governance Indicators (WGI) were adopted: regulatory quality and the control of corruption. Mainly, those concepts were taken from [73,74,75]. The two indicators are continuous variables, ranging from −2.5 to 2.5. The higher the score, the better the national governance.
Second, the independent variables are divided into two categories. The first category includes two measures of the domination effect of economic power in the benchmark panel model: China’s OFDI stocks and the proportion of China’s OFDI stocks. The data of China’s OFDI stocks are used in the regression model. OFDI stock data are made more stable by avoiding short-term fluctuations, so they are more suitable for the analysis of the OFDI destination distribution [76]. The data come from the 2003–2018 China Foreign Direct Investment Statistics Bulletins, expressed by 10,000 U.S. dollars. The proportion of China’s OFDI stocks (%) refers to the ratio of China’s FDI stocks to the host country’s FDI stocks. The data of the host country’s FDI stocks are sourced from the World Development Indicator (WDI) data of the World Bank. The second category includes policy shock variables subject to a robustness test and regression discontinuity analysis. These variables examine whether, as questioned by some European scholars, the 16 + 1 cooperation framework signed by China and CEE in 2012 strengthens China’s economic power to exert the domination effect on CEE [28].
Third, the control variables are all derived from the World Bank WDI database. Specifically, they are: (i) the GDP per capita (GDPper) in the current period, expressed as U.S. dollars per person. The positive relationship between the governance quality and economic growth has been confirmed in empirical research [77]. (ii) The total population (persons) and land area (m2). The population and land area are important factors that affect the macro indicators of countries, such as economic growth and national governance [78]; (iii) The urbanization rate (%), which is the percentage of the urban population in the total population. (iv) Trade openness, which is the ratio of import and export trade to the GDP. Countries with a higher degree of trade openness rely more on foreign investment and trade [79,80], such that their government behavior is more susceptible to OFDI influence. (v) Education level (%), which is the percentage of people with a higher learning background in the total population. The brief of the variable measurement is mentioned in Appendix A.

3.2. Research Methods

3.2.1. Benchmark Model: Panel Model

Because panel data are used in this study, the fixed-effects panel model is adopted to remove the heterogeneity associated with individual characteristics and time shocks. The formal equation is written as follows:
Y i t = a 0 + β X i t + a i + γ t + ε i t
wherein Yit is the dependent variable, a0 is a constant term, i is the serial number of independent variables, and t is the year. Xit is the explanatory variable, and β is its coefficient. ai represents the country’s fixed effects, and yt represents the year’s fixed effects. εit is the random error. Although there are in some variables of the sample, the proportion of missing values in the sample is small, so we adopt list-wise deletion in all of the models, which is the most common and simplest method to deal with missing values.

3.2.2. Robustness Test: Regression Discontinuity Analysis of the Policy Shocks

There may be endogenous mutual causality between WGI and China’s OFDI. China’s OFDI in the CEE region prefers stable and reliable countries rather than poorly governed countries. Economically successful countries tend to have higher levels of governance [81]. In order to solve the endogenous problem, a segmented regression model is designed in this study, which treats policy factors as an influencing variable subject to sudden change (the 16 + 1 framework agreement established by China and CEE in 2012 conforms to this condition) in order to identify breakpoints. According to the Local Average Treatment Effect (LATE) of the regression discontinuity model proposed by Gelman [82], the formal equation is written as follows:
y g o v e r n a n c e = α + ρ × t r e a t m e n t + k = 1 k β k × ( y e a r 2012 ) k + k = 1 k γ k × t r e a t m e n t × ( y e a r 2012 ) k + δ x c 1 + ε 1
wherein ygovernance is the dependent variable, i.e., governance quality (regulatory quality and control of corruption); treatment is a processing variable created to examine China’s impact on Europe through the 16 + 1 framework. When x ≥ 2012, treatment = 1, or otherwise treatment = 0. c is a breakpoint; year is a configuration variable. k = 1 k γ k × t r e a t m e n t × ( y e a r 1996 ) k is an interactive item which allows different slopes around the breakpoint. xc1 is the control variable. α, β, ρ, and γ are the parameters to be estimated, and ε1 is the random disturbance term. ρ is the LATE estimator at year = c. ρ being significantly non-0 means that the 16 + 1 cooperation framework with China has an impact on the governance quality of CEE countries. ρ being significantly greater than 0 means a positive influence, and a ρ significantly less than 0 means a negative influence.

4. Empirical Analysis: Results, Discussions and Limitations

4.1. Descriptive Statistical Results: China’s Exagerrated Economic Power

As shown in Figure 3, Figure 4 and Figure 5, China is an important contributor to global OFDI flows, but China’s OFDI in the world and Europe is exaggerated. China is not able to, and in fact, will not, in the future, use its economic power to exert a domination effect on Europe or CEE. This is mainly reflected in four aspects: first, China’s global OFDI is overestimated, as China is still far behind the United States and the European Union in its global OFDI share. China’s OFDI has grown rapidly since its accession to the World Trade Organization (WTO) in 2001, and China became a net capital exporter in 2014. China’s OFDI flows reached 130 billion U.S. dollars in 2018, third only to the United States (367 billion U.S. dollars) and Japan (143 billion U.S. dollars) for two years in a row. However, despite this high ranking, China still lags far behind the major economies in terms of the amount and proportion of its OFDI stocks and flows. The long-term trend is as shown in the following Figure 3. From the perspective of the OFDI flows, the European Union ranked first (only lower than the United States in 2014), with a minimum share of 16.49% (2014) and a maximum share of 68.91% (2005). The share of the United States was low only in 2005, and remained stable at around 20% for a long time. China’s share maintained a long-term growth trend, up from 0.08% in 2000 and 12.8% in 2018. From the perspective of OFDI stocks, the European Union has occupied the top position since 2000; its share stayed at around 40%, and was once close to 50% (48.09% in 2008). The United States accounted for a share of 20% to 40%. China’s share rose steadily, up from 0.37% in 2000 to 6.25% in 2018, but remained below 10%, far lower than those of the United States and the European Union.
Second, China’s OFDI in Europe is exaggerated, with no specific preference to CEE. Although Europe has been the fastest growing destination for Chinese investment since 2008, China’s OFDI mainly flows to Asia. For example, according to the 2017 China’s Outward Foreign Direct Investment, Asia accounted for the largest proportion of China’s OFDI flows in 2017 (69.5%), followed by Europe (11.7%) and Latin America (8.9%). In terms of China’s OFDI stocks, the ranking was Asia (62.98%), Latin America (21.39%), Europe (6.13%), North America (4.8%), and Africa (2.39%).
As far as Europe is concerned, the regional distribution of China’s OFDI is as shown in Figure 4, below. The European Union represented 60–90%, Western Europe represented 20–50%, and CEE represented 1.91–10% from 2003 onwards. In other words, China’s OFDI in Europe shows a significant spatial concentration, with preference to developed economies in Western Europe. In 2017, for example, China’s OFDI flows in the European Union surged to surpass 10 billion U.S. dollars (10.267 billion U.S. dollars), a year-on-year increase of 2.7%, accounting for 6.5% of its total. Among the destinations, Germany ranked first, with a flow of 2.716 billion U.S. dollars and an increase of 14.1% year-on-year, representing 26.5% of the flows in the European Union. It was followed by the United Kingdom, at 2.066 U.S. dollars (20.1%), and Luxembourg, at 1.353 billion U.S. dollars (13.2%). China’s OFDI in Sweden also crossed the line of one billion U.S. dollars, reaching 1.29 billion U.S. dollars. At the end of 2017, China’s OFDI stocks in the European Union stood at 86.015 billion U.S. dollars, equivalent to 4.7% of its total. They exceeded 10 billion U.S. dollars in four countries: Britain, the Netherlands, Luxembourg, and Germany. In short, China’s OFDI does not prefer transition economies, because the share of CEE countries is relatively low.
Third, on the importance of Chinese investment for CEE, China takes up a low share of CEE OFDI stocks. In the 1990s and the early 21st century, Chinese investment tended to focus on Western Europe and the United States [83]. In recent years, Chinese investors have shown a special interest in CEE, giving rise to a sharp increase in investment following the 2008 economic and financial crisis. In April 2012, China announced the establishment of a new investment cooperation fund with an initial contribution of 500 million U.S. dollars to support investment in CEE. The growth of China’s investment in CEE can be attributed to the CEE integration as a manufacturing base in Western Europe, and a more favorable political climate than Western Europe [83]. Since then, the relations between China and CEE have been on the rise in all aspects. Chinese investment trends in CEE have the following characteristics, as shown in Figure 5. First, China’s share in European OFDI was relatively low, basically below 1%, so the actual influence was far weaker than the concerns of Western scholars. Second, China’s share in European OFDI exhibited a sudden change over time. After 2008, China’s share of the OFDI in various European economies increased substantially, making the curve turn abruptly upward, but it remained low. Third, China’s contribution to European OFDI shows regional differences. Prior to 2008, China’s share in CEE by OFDI was basically higher than the average of Europe, and that of Western Europe. In contrast, after 2008, it became lower than those of Europe, the European Union and Western Europe, and the gap is even widening.
Specific to Serbia, which has attracted much attention, the European Union contributes to more than 80% of Serbia’s FDI inflows. China’s OFDI in CEE (including Serbia) is dwarfed (representing no more than 1%). In addition, the European Union accounts for 63.8% of Serbia’s total trade, while China’s share is only 4.4% [61]. Generally speaking, although China’s engagement in infrastructure projects, trade and investment is welcomed by the CEE region, it is not as important as it is deemed by the media and academia, with far less influence than its EU counterpart.
Fourth, there is no evidence that China can change the policy autonomy and regulatory standards of Hungary, where China’s investment quota is relatively high. It is generally believed that the use of investment relations to penetrate the government from the inside depends on the interests of investors, and may better represent modern business behaviors. Chinese investment cannot yet be manipulated as a political tool for China to exercise influence [39]. Although it receives a considerable proportion of Chinese investment in CEE, Hungary has not shown a preference for China in its domestic and foreign policies. Matura counted the 191 anti-dumping documents and specific voting results of the European Union from 2005 to 2014. As is known to all, the EU anti-dumping issue is very important to Beijing, and such disputes can easily be politicized. If China ever tried to use the so-called dominance effect of economic power to exert political influence on CEE countries, the significant impact would be reflected in the voting habits during the study period. The empirical research could verify the hypothesis that major CEE countries may provide political preferences to China in exchange for higher levels of FDI. In other words, the pro-China attitude of CEE countries means more opposition votes and less protectionist positions. However, the empirical research produced contradictory results: CEE countries rarely vote for China (especially Hungary, which has more negative votes), while countries not in friendly political relations with Beijing (mainly Western European developed countries) tend to vote for China. Therefore, Matura concluded that there is a lack of evidence that Beijing uses its so-called economic influence to exert political influence on anti-dumping votes [84].
To sum up, CEE was not the main destination of China’s OFDI from 2008 onwards. China takes up a smaller proportion of the total OFDI flows to CEE than Western Europe, as China’s OFDI in Europe prefers developed economies. China’s existing domination effect in investment is still not enough to change the economic rules in Europe or CEE. China may not yet have the capability to influence CEE autonomy in governance. Hypothesis 1a is not supported by the evidence.

4.2. Regression Model

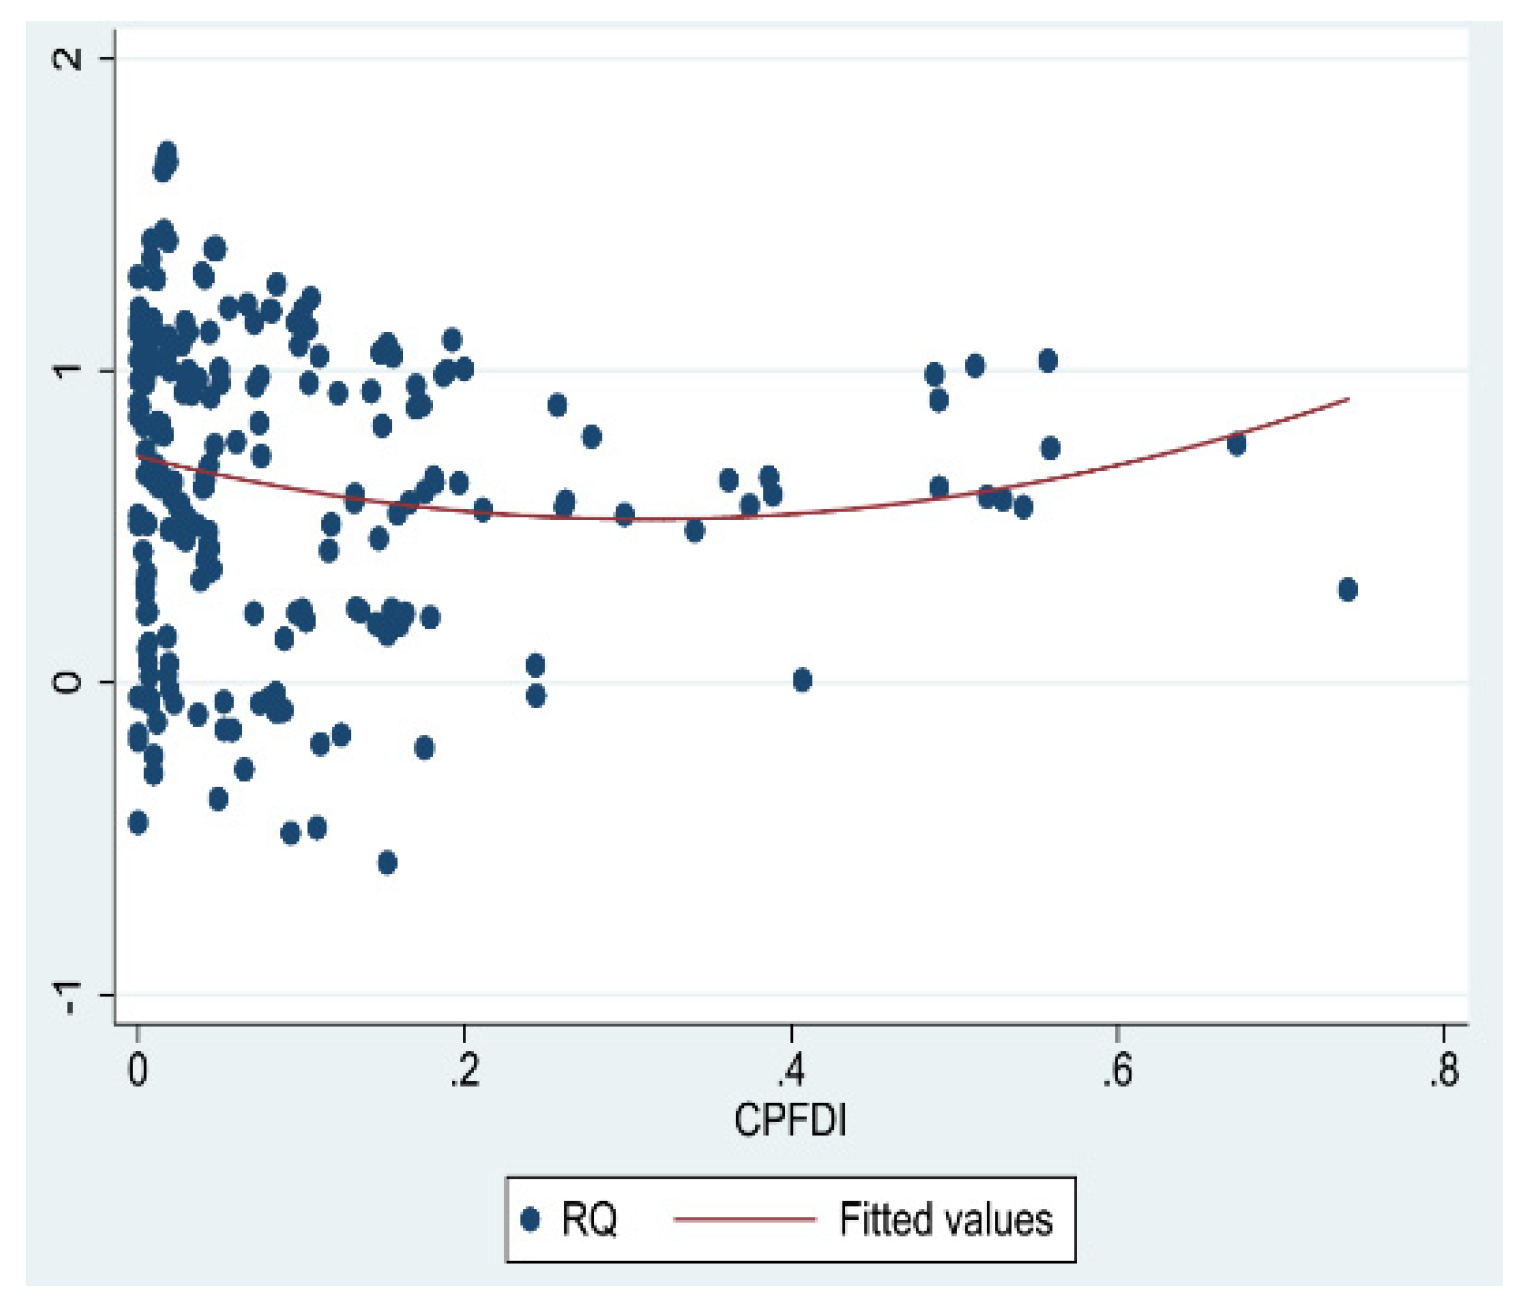
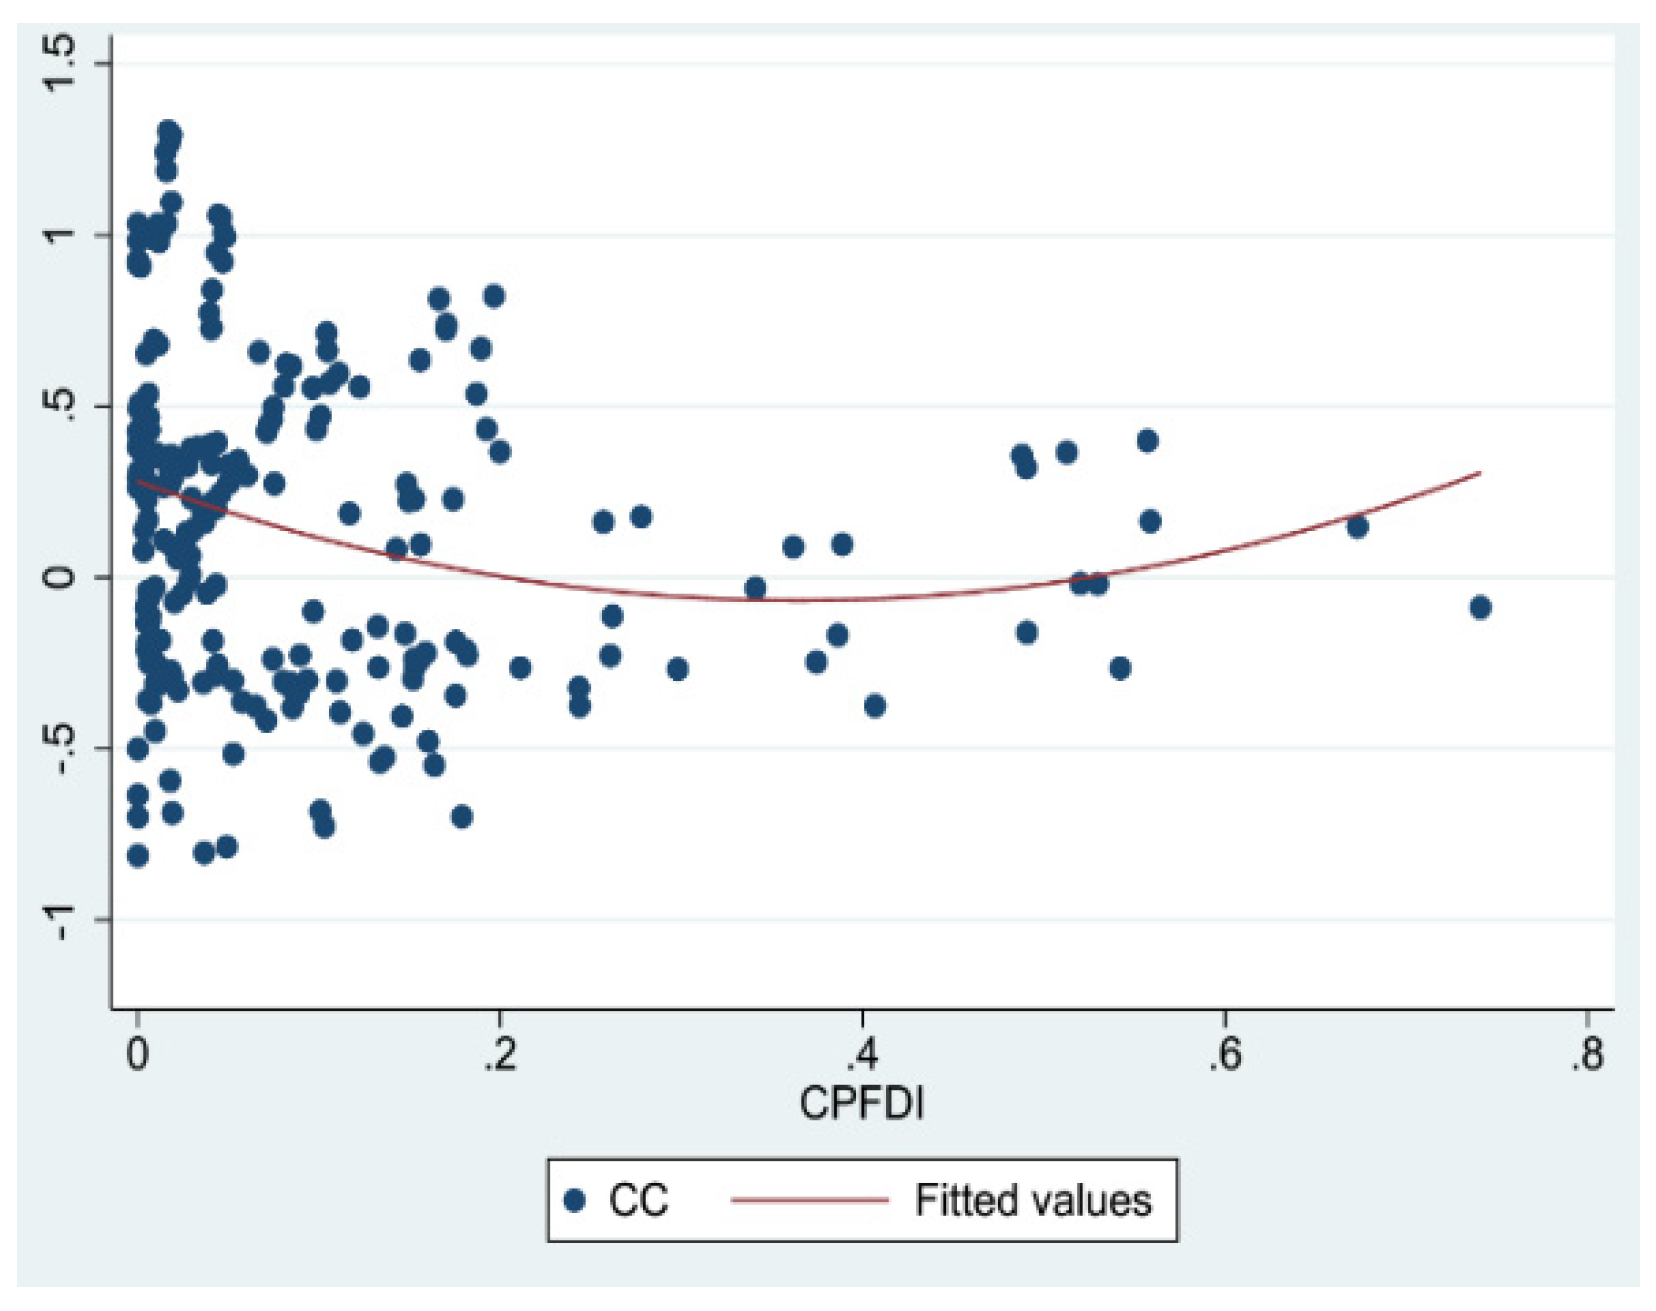
4.2.1. Benchmark Model: U-Shaped Effect

Table 1 and Table 2 list the results of the regression estimation of the two dependent variables (regulatory quality and the control of corruption) using six models based on panel data. All of the sample data were used in the 12 models, covering 16 CEE countries for the period from 2000 to 2018. The F-values indicate the overall significance, meaning that all of the parameters are unlikely to be zero at the same time. Therefore, these models have explanatory power overall and can verify Hypotheses 1b and 2.
Table 1’s results do not support Hypothesis 1b. First, China’s OFDI stocks in CEE have no impact on the regulatory quality of these countries. Models (1)–(3) represent the mixed-effects model, random-effects model, and fixed-effects model, respectively. They consistently indicate that China’s OFDI stocks have no effect on regulatory quality. Second, China’s share in the OFDI stocks of host countries has a significant impact on the regulatory quality of the host countries. The effect is manifested in the U-shaped relationship, rather than the linear relationship described in Hypothesis 1b. Models (5)–(7) produce consistent evidence that China’s share squared has a significant positive impact on the regulatory quality of host countries, while China’s share exerts a significantly negative impact. There is typical U-shaped relationship between the two, as shown in Figure 6. Under the impact of China’s share of the OFDI in CEE, the regulatory quality of the host countries first declines, seemingly forming the so-called Shanghai effect. The higher China’s share, the worse the regulatory quality of the host countries. However, after China’s share reaches a certain level, the higher China’s share, the better the regulatory quality of the host countries.
Table 2’s results do not support Hypothesis 2. First, China’s OFDI stocks in CEE have no impact on the control of corruption in these countries. Models (7)–(9) represent the mixed-effects model, random-effects model, and fixed-effects model, respectively. They consistently indicate that China’s OFDI stocks have no effect on the control of corruption. Second, Models (10)–(12) found an inconsistent relationship between China’s share in the OFDI stocks of host countries and the control of corruption of the host countries. In order to choose the best model, the three models were further tested. The xttest0 test indicates that the chi-square value = 267.49 (p value < 0.000), and so random effects need to be considered. The Hausman test indicates that the chi-square value = 5.08 (p value = 0.612 > 0.1), suggesting that the random variables of the panel data model have nothing to do with every independent variable; the random-effects model should be selected [85]. The random-effects Model (11) reveals that China’s share squared has a significant positive impact on the control of corruption of host countries, while China’s share imposes a significantly negative impact. The relationship can also be illustrated by a typical U-shaped curve, as shown in Figure 7.
In general, China’s share of the OFDI in CEE imposes a U-shaped effect on both the regulatory quality and corruption control of the host countries. At the beginning, the higher the share of Chinese investment, the worse the regulatory quality and corruption control of the host countries. After the Chinese investment reaches a certain proportion, the higher the share of Chinese investment, the better the regulatory quality and corruption control of host countries. There may be two explanations for the U-shaped effect. First, CEE countries adopt active strategies to attract diversified OFDI inflows. CEE countries have been under pressure for economic development since the financial crisis. In order to lure foreign investment, they relax and reduce regulations for labor and the environment. However, as OFDI inflows are scaled up, the economy has recovered, and the quality of governance has gradually improved. As is shown in the figure, China’s share in the investment in CEE also exhibits an upward trend over time.
Second, China’s OFDI will impose a positive effect on Europe in the long term, as corporate governance becomes more and more standardized. There are two historical precedents for such an effect: the coca-colonization of American multinational companies since the 1960s [86,87,88,89,90,91], and the OFDI transfer from Japan to the United States in the late 1980s. China’s potential investment today faces a strikingly similar background: trade frictions, exchange rate disputes, debates about state subsidies, and perceptions of economic threat and relative decline. The two precedents indicate that OFDI produces positive effects overall, although important distributional consequences indeed occurred in the host economies, and in some cases political and economic dependence risks arose. Looking back at the historical precedents, we believe that China’s OFDI will gradually gain mainstream recognition, and its positive effects will also become evident over time [92]. In fact, according to the latest empirical research, European labor leaders generally report that China’s OFDI does not show systematic differences from inflows from other countries in respect of local regulations [93], despite the huge national differences in the labor market regulation between China and the European Union.
The years between 2004 and 2007 were extremely relevant for this region, as 10 countries joined the EU, adopting the common commercial policy of the EU. In order to address this concern, we conducted regression models to estimate the relationships between the regulatory quality and China’s share of OFDI, the control of corruption and China’s share of OFDI using different time spans (2004–2018 and 2007–2018). The results of all of the models are consistent with the findings in Models (1)–(12). The regression results of 2004–2018 and 2007–2018 are presented in Appendix B, Appendix C, Appendix D and Appendix E.

4.2.2. Robustness Test: Regression Discontinuity Model

In order to verify whether China’s OFDI will bring about significant negative effects in the short term, this study adopts the regression discontinuity method. Western scholars suspected that the 16 + 1 cooperation framework agreement signed between China and CEE in 2012 has exerted China’s economic influence on CEE countries, and has generated negative effects on political issues such as regulatory quality and EU unity. As shown in Table 3, the eight models consistently indicate that the 16 + 1 framework has no impact on the regulatory quality and corruption control of the host countries, as well as China’s OFDI volume and share. It implies that China’s OFDI in CEE is driven more by economic motives than by political motives. The cooperative relationship with China cannot be linked to the weakened quality of governance in CEE. China has not used or cannot use this economic channel to exert political influence. Supporting Wagner’s criticism of economic power and changing the behavior of other countries based on economic interdependence is not feasible in reality [94], or is at least not applicable to the cooperation between China and CEE.

5. Discussions and Conclusions

5.1. Discussion

In the past five years, the cooperation between China and CEE under the 16 + 1 cooperation framework has yielded remarkable results through the Belt and Road Initiative. While recognizing that the Belt and Road Initiative has broadened the economic, trade and investment cooperation between China and CEE, the negative impact of various doubts about, and even blames for, heightened cooperation should not be underestimated. Western scholars and media have used a large number of limited case studies to demonstrate the Shanghai effect of Chinese investment in the CEE region. They discredited Chinese investment as a Faustian bargain, arguing that Chinese investment exerts a negative effect on the governance of host countries. While CEE takes a positive attitude towards the 16 + 1 cooperation framework, some Western European countries have a subversive stance on this issue. This difference in attitude may be due to the geopolitical considerations of some European elites and their attitude towards China.
This study uses a large sample of data and rigorous causal inference methods (a panel regression model and a breakpoint regression model) to clarify the basic facts, proving that China’s OFDI and CEE governance quality have a more complicated relationship, rather than the so-called Shanghai effect. In the short term, the downward trend of governance in Central and Eastern Europe is more likely to be a proactive strategy adopted by the transition economies to attract international investment. The economic development of CEE countries has long lagged behind Western European countries. Especially after the financial crisis, CEE countries have faced economic development pressure. In order to attract foreign investment, they may relax the supervision of labor, the environment and other fields, so as to use labor cost advantages to attract enterprises from various countries, including Chinese enterprises; in fact, Chinese capital does not show systematic respect for Central and Eastern European laws and regulations with capital from other countries. With the increase of investment in CEE, the economic recovery of the Central and Eastern European countries has been promoted. The improvement of the economic level has given the CEE countries more resources to improve the level of supervision in areas such as labor standards and corruption control. Therefore, in the long run, the increase in the proportion of China’s investment in CEE countries is a good deal, not the “Faustian deal” recognized by Western scholars. Chinese capital is a positive force for the promotion of economic development and good governance in CEE countries.

5.2. Conclusions

In general, after the previous analysis and discussion, this study has two basic conclusions, as follows.
First, descriptive data reveal that, representing a small share in CEE, China’s OFDI is not yet capable of substantially impacting the governance and policy autonomy of host countries. From the perspective of China, Europe is not the most important destination for Chinese investment. Within the scope of Europe, Chinese investment prefers developed capitalist countries such as Western Europe, without special focus on CEE countries. From the perspective of the host countries, China accounts for a small proportion, i.e., less than 1%, of OFDI stocks in CEE, which is much lower than the share of EU member states in CEE, and also lower than the share of China in Western Europe. Therefore, China’s domination effect of economic power in CEE is seriously overestimated. China lags far behind the United States and the European Union in its global OFDI share, and China is in no way as influential as the European Union in the regulation of CEE countries.
Second, China’s share of the OFDI in CEE has a U-shaped effect on the governance quality of host countries. There is mutual causality between the share of China’s OFDI and the regulatory quality of host countries. The relationship is first manifested in the Shanghai effect, and then as the California effect after China’s share reaches a certain level. The share of China’s OFDI and the corruption control of host countries do not have such a causal relationship. The relationship between the two in the panel model is affected by the mediation effect of other variables. Western scholars are concerned that Chinese investment in Europe is actually a long-term zero-sum game, and may serve as a Trojan horse that brings Chinese politics, governance norms and values into the heart of Europe [20]. They thus concluded that CEE’s acceptance of Chinese investment may actually be a Faustian bargain, and expressed the concerns that CEE countries may abandon their moral principles and social democratic policies in exchange for immediate economic assistance [80]. However, the empirical results of this study show that the share of China’s OFDI and the governance quality of host countries are mutually causal, rendering a U-shaped effect. This relationship may explain the strategic behavior of CEE countries. As the economy begins to recover, CEE countries have successively joined or will join the European Union, and they will strictly implement regulatory standards.

5.3. Implication

According to these empirical findings, we can derive two implications. First, Chinese investment in CEE countries is not special. In the long run, China also expects that CEE countries will enforce stringent regulatory standards to improve national governance in order to protect China’s investment interests in CEE. Given that a lot of funds have been invested in CEE infrastructure projects, the stability of these areas should also be China’s priority concern. In fact, China and the European Union have the same goal of bringing stability and prosperity to CEE, while not giving up the norms and practices that Europe has cultivated for a long time. This will not only help establish a positive image of China, but also help reduce the cost of the Belt and Road projects in CEE countries [81].
Second, the Chinese government should actively assist Chinese enterprises to understand and abide by the regulations of overseas host countries. Chinese companies have not been investing overseas in recent years, and some companies are not familiar with the laws, regulations and traditions where they invest. The business behaviors of some Chinese companies, based on economic considerations, may cause misunderstandings among the people of the host countries. The Chinese government needs to train overseas companies on these business practices, laws and regulations, and customs, etc., and guide Chinese companies to actively respect the customs of the host country, and to abide by the laws and regulations of the host country, i.e., to actively assume the social responsibilities of local communities, and distort the negative image of Chinese companies.

5.4. Limits and Future Research

Research on the relationship between FDI and governance quality can be further improved in the following ways. First, this research focuses only on evidence from CEE, which might limit the generalizability of the findings. In particular, CEE countries with a communist historical legacy might weaken the influence of China’s FDI compared to other European countries. Other characteristics of the countries, for instance, ethnicity and culture, might moderate China’s impact on their regulatory quality. Future studies should extend the scope and conduct a global comparison to advance the external validity and investigate potential heterogeneous effects caused by country characteristics. In addition, while WGI offers useful a measurement for governance quality, alternative objective measures are needed to support the discovered causal effects further. More specific evidence could help to provide a nuanced understanding of the impact in reality, for instance, the adoption or abolishment of labor laws. Furthermore, we know relatively little about how these effects really work in reality, which calls for qualitative evidence based on in-depth investigation. Future research can help to address this by leveraging alternative measurements for quantitative estimation, or by employing case studies to display the causal mechanisms.

Author Contributions

Conceptualization, C.D. and Y.Z.; methodology, D.S.; software, S.L.; validation, J.O., C.D. and S.L.; formal analysis, S.L.; investigation, J.P.; resources, S.L.; data curation, S.L. and C.D.; writing—original draft preparation, C.D. and W.G.; writing—review and editing, W.G., J.O. and J.P.; visualization, S.L.; supervision, Y.Z. and D.S.; project administration, J.O. All authors have read and agreed to the published version of the manuscript.

Funding

Funding was given by the general project of the 2020 National Social Science Foundation Major Project “Study on the Incentive Mechanism for Improving the Role of Cadres in the New Era” (Project Number: 20ZDA024); 2021 National Social Science Foundation Project “Study on the Phenomenon of A Few Cadres Being Busy and the Correction Mechanism” and the Project of Excellent Innovation Team of Soochow University “Local Government and Social Governance” (Project Number: NH33710921).

Institutional Review Board Statement

Not applicable.

Informed Consent Statement

Not applicable.

Data Availability Statement

The data is available on request.

Acknowledgments

We acknowledge the anonymous reviewer of this manuscript.

Conflicts of Interest

The authors declare no conflict of interest.

Appendix A

Table A1. Variable measurement.
VariableSourceReference
Regulatory QualityThe Worldwide Governance Indicators (WGI) of the World Bank[72]
Control of Corruption
China OFDI StockChina Foreign Direct Investment Statistics Bulletins, World Bank[28]
Proportion of China OFDI Stock
Political RiskPolitical Risk Services (PRS) Group[95]
GDP per capitaThe data bank of the World bank[77]
Total Population[78]
Land Area
Urbanization[26]
Trade openness[79,80]
Education Levels[96]
Source: Authors’ explanation.

Appendix B

Table A2. Regression results (2004–2018).
(1)(2)(3)(4)(5)(6)
Pool-RQRe-RQFe-RQPool-RQRe-RQFe-RQ
Ln (China’s OFDI stocks) squared0.0030.000−0.000
(0.003)(0.002)(0.002)
Ln (China’s OFDI stocks)−0.035−0.026−0.023
(0.042)(0.030)(0.030)
Share of China’s OFDI squared 1.773 ***0.804 **0.817 **
(0.593)(0.427)(0.417)
Share of Chinese investment −0.910 ***−0.778 ***−0.638 ***
(0.328)(0.238)(0.232)
Ln (GDP per capita)0.271 ***0.292 ***0.193 ***0.282 ***0.251 ***0.146 ***
(0.041)(0.047)(0.055)(0.036)(0.040)(0.049)
Ln (population)−0.310 ***−0.263 **−1.535 ***−0.313 ***−0.265 **−1.536 ***
(0.043)(0.125)(0.436)(0.036)(0.107)(0.414)
Ln (land area)0.369 ***0.373 **4.7630.374 ***0.326 **2.624
(0.048)(0.160)(3.606)(0.045)(0.139)(3.462)
Urbanization rate0.011 ***0.011 *−0.0040.012 ***0.015 ***0.005
(0.002)(0.006)(0.008)(0.002)(0.005)(0.007)
Trade openness−0.052 **−0.0050.003−0.044 **−0.0010.008
(0.022)(0.016)(0.016)(0.020)(0.014)(0.014)
Education level−0.1270.341 ***0.518 ***−0.217 *0.1440.311 **
(0.133)(0.132)(0.141)(0.125)(0.125)(0.137)
Political risk0.039 ***0.019 ***0.019 ***0.040 ***0.021 ***0.019 ***
(0.004)(0.004)(0.004)(0.004)(0.004)(0.004)
Constant term−4.305 ***−4.114 ***−31.863−4.674 ***−3.594 ***−7.958
(0.515)(1.188)(39.465)(0.350)(0.990)(37.593)
Obs.164164164168168168
R-squared0.844 ***0.768 ***0.393 ***0.852 ***0.796 ***0.406 ***
*** p < 0.01, ** p < 0.05, * p < 0.1. Standard errors are in parenthesis. Source: Authors’ explanation.

Appendix C

Table A3. Regression results (2007–2018).
(7)(8)(9)(10)(11)(12)
Pool-RQRe-RQFe-RQPool-RQRe-RQFe-RQ
Ln (China’s OFDI stocks) squared−0.004−0.011 ***−0.012 ***
(0.004)(0.003)(0.004)
Ln (China’s OFDI stocks)0.100 *0.180 ***0.187 ***
(0.060)(0.055)(0.057)
Share of China’s OFDI squared 2.537 ***0.736 *0.309 **
(0.601)(0.424)(0.153)
Share of Chinese investment −1.441 ***−0.431 **−0.435 **
(0.344)(0.242)(0.221)
Ln (GDP per capita)0.214 ***0.393 ***0.328 ***0.283 ***0.377 ***0.302 ***
(0.049)(0.082)(0.098)(0.046)(0.065)(0.097)
Ln(population)−0.435 ***−0.441 ***−1.299 ***−0.368 ***−0.286 ***−1.680 ***
(0.050)(0.136)(0.473)(0.039)(0.076)(0.451)
Ln (land area)0.443 ***0.564 ***3.1270.420 ***0.371 ***4.714
(0.051)(0.176)(3.242)(0.048)(0.099)(3.129)
Urbanization rate0.008 ***−0.007−0.030 ***0.010 ***0.009 **−0.021 **
(0.003)(0.006)(0.009)(0.002)(0.004)(0.009)
Trade openness−0.032−0.011−0.006−0.036−0.013−0.004
(0.024)(0.015)(0.015)(0.023)(0.016)(0.015)
Education level−0.0890.1820.357 **−0.2210.1340.418 ***
(0.142)(0.131)(0.137)(0.140)(0.127)(0.132)
Political risk0.044 ***0.020 ***0.018 ***0.041 ***0.022 ***0.019 ***
(0.004)(0.004)(0.004)(0.004)(0.004)(0.004)
Constant term−3.476 ***−4.164 ***−17.495−4.356 ***−4.679 ***−29.030
(0.606)(1.416)(35.566)(0.398)(0.856)(34.594)
Obs.133133133132132132
R-squared0.865 ***0.696 ***0.418 ***0.867 ***0.824 ***0.402 ***
*** p < 0.01, ** p < 0.05, * p < 0.1. Standard errors are in parenthesis. Source: Authors’ explanation.

Appendix D

Table A4. Regression results (2004–2018).
(13)(14)(15)(16)(17)(18)
Pool-CCRe-CCFe-CCPool-CCRe-CCFe-CC
Ln (China’s OFDI stocks) squared0.0020.001−0.000
(0.004)(0.002)(0.002)
Ln (China’s OFDI stocks)−0.041−0.034−0.015
(0.057)(0.035)(0.034)
Share of China’s OFDI squared 0.830 **0.516 **0.638
(0.348)(0.207)(0.478)
Share of Chinese investment −0.568 ***−0.316 **0.036
(0.219)(0.159)(0.166)
Ln (GDP per capita)0.441 ***0.162 ***−0.0120.408 ***0.108 **−0.048
(0.055)(0.058)(0.063)(0.051)(0.051)(0.056)
Ln(population)−0.221 ***−0.460 **−2.544 ***−0.234 ***−0.579 ***−2.580 ***
(0.058)(0.187)(0.498)(0.052)(0.201)(0.474)
Ln (land area)0.245 ***0.453 *2.2980.240 ***0.535 **0.737
(0.065)(0.243)(4.122)(0.064)(0.264)(3.968)
Urbanization rate−0.0020.001−0.011−0.0020.004−0.003
(0.003)(0.007)(0.009)(0.003)(0.007)(0.008)
Trade openness−0.0140.0130.023−0.0070.0120.023
(0.030)(0.019)(0.018)(0.029)(0.017)(0.016)
Education level0.553 ***0.2470.366 **0.536 ***0.0230.147
(0.181)(0.160)(0.161)(0.178)(0.156)(0.157)
Political risk0.031 ***0.019 ***0.019 ***0.034 ***0.020 ***0.019 ***
(0.005)(0.005)(0.005)(0.005)(0.004)(0.005)
Constant term−5.479 ***−0.58913.341−5.193 ***0.54031.246
(0.702)(1.745)(45.106)(0.500)(1.828)(43.083)
Obs.164164164168168168
R-squared0.771 ***0.496 ***0.276 ***0.771 ***0.398 ***0.298 ***
*** p < 0.01, ** p < 0.05, * p < 0.1. Standard errors are in parenthesis. Source: Authors’ explanation.

Appendix E

Table A5. Regression results (2007–2018).
(19)(20)(21)(22)(23)(24)
Pool-CCRe-CCFe-CCPool-CCRe-CCFe-CC
Ln (China’s OFDI stocks) squared−0.000−0.004−0.003
(0.005)(0.004)(0.004)
Ln (China’s OFDI stocks)0.0440.0750.029
(0.080)(0.066)(0.065)
Share of China’s OFDI squared 0.254 ***0.523 **0.259
(0.095)(0.261)(0.289)
Share of Chinese investment −0.250 ***−0.209 **−0.023
(0.085)(0.104)(0.105)
Ln (GDP per capita)0.537 ***0.435 ***0.1860.578 ***0.397 ***0.167
(0.065)(0.101)(0.112)(0.064)(0.105)(0.111)
Ln(population)−0.330 ***−0.487 ***−2.970 ***−0.246 ***−0.577 ***−3.051 ***
(0.066)(0.170)(0.541)(0.055)(0.201)(0.519)
Ln (land area)0.277 ***0.476 **−2.3990.238 ***0.573 **−2.467
(0.068)(0.221)(3.709)(0.067)(0.265)(3.601)
Urbanization rate−0.005−0.004−0.010−0.003−0.000−0.005
(0.003)(0.008)(0.010)(0.003)(0.009)(0.010)
Trade openness0.0250.0080.0160.0250.0080.014
(0.032)(0.018)(0.017)(0.033)(0.018)(0.017)
Education level0.728 ***0.1670.2220.729 ***0.1710.158
(0.190)(0.158)(0.157)(0.197)(0.155)(0.152)
Political risk0.022 ***0.013 ***0.008 *0.020 ***0.012 **0.009 **
(0.006)(0.005)(0.005)(0.006)(0.005)(0.005)
Constant term−4.881 ***−2.71271.263 *−5.840 ***−1.92173.163 *
(0.806)(1.762)(40.697)(0.559)(2.020)(39.818)
Obs.133133133132132132
R-squared0.811 ***0.698 ***0.327 ***0.803 ***0.598 ***0.346 ***
*** p < 0.01, ** p < 0.05, * p < 0.1. Standard errors are in parenthesis. Source: Authors’ explanation.

References

  1. McCaleb, A.; Szunomár, Á. Chinese Foreign Direct Investment in Central and Eastern Europe: An Institutional Perspective. In Chinese Investment in Europe: Corporate Strategies and Labour Relations; Jan Drahokoupil, Ed.; European Trade Union Institute: Brussels, Belgium, 2017; pp. 121–140. [Google Scholar]
  2. Timsit, A. Chinese Investment in Europe Hit a 10-Year Low in 2020; Quartz: Minas Gerais, Brazil, 2021. [Google Scholar]
  3. Ames, E. Economic Policy in Eastern Europe from 1950 through 1956. Ann. Am. Acad. Pol. Soc. Sci. 1958, 317, 22–35. [Google Scholar] [CrossRef]
  4. Stanzel, A.; Kratz, A.; Szczudlik, J.; Pavlićević, D.; Doyon, J. China’s Investment in Influence: The Future of 16 + 1 Cooperation; European Council on Foreign Relations: London, UK, 2016. [Google Scholar]
  5. Pepe, J.M. China’s Inroads into Central, Estern, and South Eastern Europe: Regional and Global Implications for Germany and the EU; Social Science Open Access Repository: Berlin, Germany, 2017. [Google Scholar]
  6. Hanemann, T.; Rosen, D. China Invests in Europe; Rhodium Group: New York, NY, USA, 2012; pp. 1–96. [Google Scholar]
  7. Hanemann, T.; Huotari, M. Chinese FDI in Europe and Germany Preparing for a New Era of Chinese Capital Thilo Hanemann and Mikko Huotari; Mercator Institute for China Studies: Berlin, Germany, 2015. [Google Scholar]
  8. Malikane, C.; Chitambara, P. Foreign Direct Investment, Democracy and Economic Growth in Southern Africa. Afr. Dev. Rev. 2017, 29, 92–102. [Google Scholar] [CrossRef]
  9. Durham, J.B. Absorptive capacity and the effects of foreign direct investment and equity foreign portfolio investment on economic growth. Eur. Econ. Rev. 2004, 48, 285–306. [Google Scholar] [CrossRef]
  10. Zhang, K.H. How does foreign direct investment affect economic growth in China? Econ. Transit. 2001, 9, 679–693. [Google Scholar] [CrossRef]
  11. Forte, R.; Moura, R. The effects of foreign direct investment on the host country’s economic growth: Theory and empirical evidence. Singap. Econ. Rev. 2013, 58, 1350017. [Google Scholar] [CrossRef] [Green Version]
  12. Spisak, A. EU uneasy over China’s efforts to woo central and eastern European states. Financial Times, 8 May 2017. [Google Scholar]
  13. Lv, P.; Curran, L.; Spigarelli, F.; Barbieri, E. One country, many industries: Heterogeneity of Chinese OFDI motivations at meso level. China Econ. Rev. 2021, 69, 101672. [Google Scholar] [CrossRef]
  14. Hung, N.P. Development and Impact of Chinese Investment in EU. Creat. Knowl. Soc. 2016, 6, 1–14. [Google Scholar] [CrossRef] [Green Version]
  15. Tombeur, J. Chinese Outward Foreign Direct Investments in Europe: A Shift towards the European Periphery? Master’s Thesis, Ghent University, Ghent, Belgium, 2020. [Google Scholar]
  16. Meunier, S. A Tale of Two Ports: The Epic Story of Chinese Direct Investment in the Greek Port of Piraeus; Council for European Studies: New York, NY, USA, 2015; pp. 1–8. [Google Scholar]
  17. Götz, M. Pursuing FDI policy in the EU—Member States and their policy space. J. Econ. Polit. Econ. 2015, 2, 290–308. [Google Scholar]
  18. Xu, X. Chinese Investment in Central and Eastern European Countries—A Study of Motivations. Köz-Gazdaság 2019, 14, 68–76. [Google Scholar] [CrossRef]
  19. Garlick, J. China’s Economic Diplomacy in Central and Eastern Europe: A Case of Offensive Mercantilism? Eur. Asia Stud. 2019, 71, 1390–1414. [Google Scholar] [CrossRef]
  20. Meunier, S. A Faustian bargain or just a good bargain? Chinese foreign direct investment and politics in Europe. Asia Eur. J. 2014, 12, 143–158. [Google Scholar] [CrossRef]
  21. Turcsanyi, R.Q. Central European attitudes towards Chinese energy investments: The cases of Poland, Slovakia, and the Czech Republic. Energy Policy 2017, 101, 711–722. [Google Scholar] [CrossRef]
  22. Garcia-herrero, A.; Wolff, G.; Poitiers, N.; Felbermayr, G.; Langhammer, R.; Liu, W.-H.; Sandkamp, A. EU-China Trade and Investment Relations in Challenging Times, Study Requested by the INTA Committee; Social Science Research Network: Rochester, NY, USA, 2020. [Google Scholar]
  23. Dams, T.; Martin, X.; Kranenburg, V. China’s Soft Power in Europe Falling on Hard Times; Clingendael: Hague, The Netherland, 2021. [Google Scholar]
  24. European Commission. European Commission and HR/VP Contribution to the European Council: EU-China—A Strategic Outlook; European Commission: Brussels, Belgium, 2019. [Google Scholar]
  25. Kratz, A.; Oertel, J. Home Advantage: How China’s Protected Market Threatens Europe’s Economic Power; European Council on Foreign Relations: London, UK, 2021. [Google Scholar]
  26. VanHeuvelen, T. Recovering the missing middle: A mesocomparative analysis of within-group inequality, 1970–2011. Am. J. Sociol. 2018, 123, 1064–1116. [Google Scholar] [CrossRef]
  27. Isaksson, A.S.; Kotsadam, A. Racing to the bottom? Chinese development projects and trade union involvement in Africa. World Dev. 2018, 106, 284–298. [Google Scholar] [CrossRef]
  28. Kaczmarski, M.; Jakóbowski, J. Beijing’s Mistaken Offer: The ‘16 + 1’ and China’s Policy towards the European Union; Centre for Eastern Studies (OSW): Warszawa, Poland, 2017. [Google Scholar]
  29. Shambaugh, D. China’s Future, 1st ed.; Cambridge University Press: Cambridge, UK, 2016. [Google Scholar]
  30. Szunomar, A. Chinese Investment and Financial Engagement in Visegrad Countries Myth or Reality; Institute for World Economics-Centre for Economic and Regional Studies-Hungarian Academy of Sciences: Budapest, Hungary, 2014; ISBN 9789633016152. [Google Scholar]
  31. Jacoby, W. Different cases, different faces: Chinese investment in Central and Eastern Europe. Asia Eur. J. 2014, 12, 199–214. [Google Scholar] [CrossRef]
  32. Ramasamy, B.; Yeung, M. China’s outward foreign direct investment (OFDI) to developing countries: The case of Central and Eastern Europe (CEE). J. Asia Pac. Econ. 2020, 1–23. [Google Scholar] [CrossRef]
  33. Curran, L.; Lv, P.; Spigarelli, F. Chinese investment in the EU renewable energy sector: Motives, synergies and policy implications. Energy Policy 2017, 101, 670–682. [Google Scholar] [CrossRef]
  34. Godement, F.; Vasselier, A. China at the Gates: A New Power Audit of EU-China Relations; European Council on Foreign Relations: London, UK, 2017; ISBN 9781911544395. [Google Scholar]
  35. Barnett, M.N.; Finnemore, M. The politics, power, and pathologies of international organizations. Int. Organ. 1999, 53, 699–732. [Google Scholar] [CrossRef] [Green Version]
  36. Hasenclever, A.; Mayer, P.; Rittberger, V. Interests, power, knowledge: The study of international regimes. Mershon Int. Stud. Rev. 1996, 40, 177–228. [Google Scholar] [CrossRef]
  37. Keohane, R.O.; Nye, J.S. Reading 3.5 power and interdependence. In Conflict after the Cold War; Routledge: London, UK, 2017; pp. 167–174. [Google Scholar]
  38. Barnett, M.; Duvall, R. Power in International Politics; Cambridge University Press: Cambridge, UK, 2005; Volume 59, ISBN 0020818305050. [Google Scholar]
  39. Knorr, K. The Power of Nations: The Political Economy of International Relations. Polit. Sci. Q. 1975, 91, 569–571. [Google Scholar]
  40. Perroux, F. The domination effect and modern economic theory. Soc. Res. 1950, 17, 188–206. [Google Scholar]
  41. Richardson, N.R.; Kegley, C.W. Trade Dependence and Foreign Policy Compliance: A Longitudinal Analysis. Int. Stud. Q. 1980, 24, 191. [Google Scholar] [CrossRef]
  42. Papayoanou, P.A. Economic Interdependence and the Balance of Power. Int. Stud. Q. 1997, 41, 113–140. [Google Scholar] [CrossRef]
  43. Bandelj, N. Supraterritoriality, embeddedness, or both? Foreign direct investment in central and Eastern Europe. In Contemporary Studies in Economic and Financial Analysis; Emerald Group Publishing Limited: Bingley, UK, 2007. [Google Scholar]
  44. Kahler, M.; Kastner, S.L. Strategic uses of economic interdependence: Engagement policies on the Korean Peninsula and across the Taiwan strait. J. Peace Res. 2006, 43, 523–541. [Google Scholar] [CrossRef]
  45. Kowalski, B.; Nolan, P.; Gerrits, A. China’s foreign policy towards Central and Eastern Europe: The “16 + 1” format in the South–South cooperation perspective. Cases of the Czech Republic and Hungary. Camb. J. Eurasian Stud. 2017, 1, 1–16. [Google Scholar] [CrossRef]
  46. Yun, J.H.J.; Won, D.K.; Park, K.B. Entrepreneurial cyclical dynamics of open innovation. J. Evol. Econ. 2018, 28, 1151–1174. [Google Scholar] [CrossRef]
  47. Cooke, P. A ground-up “Quaternary” innovation strategy for South Korea using entrepreneurial ecosystem platforms. J. Open Innov. Technol. Mark. Complex. 2017, 3, 10. [Google Scholar] [CrossRef] [Green Version]
  48. Cooke, P. Three disruptive models of new spatial planning: “Attention”, “surveillance” or “sustainable” capitalisms? J. Open Innov. Technol. Mark. Complex. 2021, 7, 46. [Google Scholar] [CrossRef]
  49. Cooke, P. Silicon valley imperialists create new model villages as smart cities in their own image. J. Open Innov. Technol. Mark. Complex. 2020, 6, 24. [Google Scholar] [CrossRef] [Green Version]
  50. Cooke, P. World turned upside down: Entrepreneurial decline, its reluctant myths and troubling realities. J. Open Innov. Technol. Mark. Complex. 2019, 5, 22. [Google Scholar] [CrossRef] [Green Version]
  51. Yun, J.H.J. How do we conquer the growth limits of capitalism? Schumpeterian Dynamics of Open Innovation. J. Open Innov. Technol. Mark. Complex. 2015, 1, 1–20. [Google Scholar] [CrossRef] [Green Version]
  52. Adolph, C.; Quince, V.; Prakash, A. The Shanghai Effect: Do Exports to China Affect Labor Practices in Africa? World Dev. 2017, 89, 1–18. [Google Scholar] [CrossRef]
  53. Duttaray, M.; Dutt, A.K.; Mukhopadhyay, K. Foreign direct investment and economic growth in less developed countries: An empirical study of causality and mechanisms. Appl. Econ. 2008, 40, 1927–1939. [Google Scholar] [CrossRef]
  54. Vissak, T.; Roolaht, T. The Negative Impact of Foreign Direct Investment on the Estonian Economy. Probl. Econ. Transit. 2005, 48, 43–66. [Google Scholar]
  55. Hong, L. Does and How does FDI Promote the Economic Growth? Evidence from Dynamic Panel Data of Prefecture City in China. IERI Procedia 2014, 6, 57–62. [Google Scholar] [CrossRef] [Green Version]
  56. Barisitz, S.; Radzyner, A. The New Silk Road, part II: Implications for Europe. Focus Eur. Econ. Integr. Oesterreichische Natl. (Austrian Cent. Bank) 2017, 4, 70–81. [Google Scholar]
  57. Isaksson, A.S.; Kotsadam, A. Chinese aid and local corruption. J. Public Econ. 2018, 159, 146–159. [Google Scholar] [CrossRef]
  58. Davis, C.L.; Fuchs, A.; Johnson, K. State Control and the Effects of Foreign Relations on Bilateral Trade. J. Confl. Resolut. 2019, 63, 405–438. [Google Scholar] [CrossRef]
  59. Khan, M.A.; Khan, M.A.; Ali, K.; Popp, J.; Oláh, J. Natural resource rent and finance: The moderation role of institutions. Sustainability 2020, 12, 3897. [Google Scholar] [CrossRef]
  60. Bräutigam, D.; Xiaoyang, T. Economic statecraft in China’s new overseas special economic zones: Soft power, business or resource security? Int. Aff. 2012, 88, 799–816. [Google Scholar] [CrossRef] [Green Version]
  61. Pavlićević, D. ‘China threat’ and ‘China opportunity’: Politics of dreams and fears in China-Central and Eastern European relations. J. Contemp. China 2018, 27, 688–702. [Google Scholar] [CrossRef]
  62. Sen, A. Quality of life: India vs. China. In The New York Review of Books; Pratichi Trust: Kolkata, India, 2011; pp. 5–13. [Google Scholar]
  63. Nyíri, P. Chinese entrepreneurs in poor countries: A transnational “middleman minority” and its futures. Inter-Asia Cult. Stud. 2011, 12, 145–153. [Google Scholar] [CrossRef]
  64. Hao, J.; Li, C.; Yuan, R.; Ahmed, M.; Khan, M.A.; Oláh, J. The influence of the knowledge-based network structure hole on enterprise innovation performance: The threshold effect of R&D investment intensity. Sustainability 2020, 12, 6155. [Google Scholar] [CrossRef]
  65. Hauk, E.; Saez-Marti, M. On the cultural transmission of corruption. J. Econ. Theory 2002, 107, 311–335. [Google Scholar] [CrossRef] [Green Version]
  66. Zhou, X.; Liu, Y.; Ho, B. The cultural transmission of cooperative norms. Front. Psychol. 2015, 6, 1–10. [Google Scholar] [CrossRef] [PubMed] [Green Version]
  67. Bräutigam, D.A.; Knack, S. Foreign aid, institutions, and governance in sub-Saharan Africa. Econ. Dev. Cult. Chang. 2004, 52, 255–285. [Google Scholar] [CrossRef] [Green Version]
  68. Qamruzzaman, M.; Tayachi, T.; Mehta, A.M.; Ali, M. Do international capital flows, institutional quality matter for innovation output: The mediating role of economic policy uncertainty. J. Open Innov. Technol. Mark. Complex. 2021, 7, 141. [Google Scholar] [CrossRef]
  69. Parfenov, A.; Shamina, L.; Niu, J.; Yadykin, V. Transformation of distribution logistics management in the digitalization of the economy. J. Open Innov. Technol. Mark. Complex. 2021, 7, 58. [Google Scholar] [CrossRef]
  70. Chen, J.; Han, L.; Qu, G. Citizen innovation: Exploring the responsibility governance and cooperative mode of a “post-schumpeter” paradigm. J. Open Innov. Technol. Mark. Complex. 2020, 6, 172. [Google Scholar] [CrossRef]
  71. Ngo, Q.T.; Doan, N.P.; Thi Tran, T.H.; Nguyen, T.D. Technology adoption strategies in the supply chain: The case of vietnamese young small and medium-sized enterprises. J. Open Innov. Technol. Mark. Complex. 2020, 6, 37. [Google Scholar] [CrossRef]
  72. Liu, K.; Zhang, W. Is there an institutional preference for China’s OFDI?––A perspective of heterogeneous investment motivation. Macroecon. Res. 2018, 7. [Google Scholar] [CrossRef]
  73. Alfaro, L. Foreign Direct Investment and Growth: Does the Sector Matter? Harvard Business School: Harvard, MA, USA, 2017; Volume 53. [Google Scholar]
  74. Borensztein, E.; De Gregorio, J.; Lee, J.-W. How does foreign direct investment affect economic growth? J. Int. Econ. 1998, 45, 115–135. [Google Scholar] [CrossRef] [Green Version]
  75. Alfaro, L.; Johnson, M.S. Foreign Direct Investment and Growth. Evid. Impact Financ. Glob. 2013, 106, 299–309. [Google Scholar] [CrossRef]
  76. Jiang, G.H.; Jiang, D.C. Is the host country system important for China’s investment in developing countries? Manag. World 2012, 11, 45–46. [Google Scholar] [CrossRef]
  77. La Porta, R.; Lopez-de-Silanes, F.; Shleifer, A.; Vishny, R. The quality of government. J. Law Econ. Organ. 1999, 15, 222–279. [Google Scholar] [CrossRef]
  78. Gemmell, N. Economic Development and Structural Change: The Role of the Service Sector. J. Dev. Stud. 1982, 19, 37–66. [Google Scholar] [CrossRef]
  79. Mudiyanselage, M.M.R.; Epuran, G.; Tescasiu, B. Causal Links between Trade Openness and Foreign Direct Investment in Romania. J. Risk Financ. Manag. 2021, 14, 1–18. [Google Scholar]
  80. Liargovas, P.G.; Skandalis, K.S. Foreign Direct Investment and Trade Openness: The Case of Developing Economies. Soc. Indic. Res. 2012, 106, 323–331. [Google Scholar] [CrossRef]
  81. Al-Marhubi, F. The determinants of governance: A cross-country analysis. Contemp. Econ. Policy 2004, 22, 394–406. [Google Scholar] [CrossRef]
  82. Gelman, A. A statistician’s perspective on “mostly harmless econometrics: An empiricist’s companion”, by Joshua D. Angrist and Jorn-Steffen Pischke. Stata J. 2009, 9, 315–320. [Google Scholar] [CrossRef]
  83. Turcsányi, R. Central and Eastern Europe’s Courtship with China: Trojan horse within the EU? EU-Asia Glance 2014, 32, 21–22. [Google Scholar]
  84. Matura, T. China–CEE Trade, Investment and Politics. Eur. Asia Stud. 2019, 71, 388–407. [Google Scholar] [CrossRef]
  85. Clark, T.S.; Linzer, D.A. Should I Use Fixed or Random Effects? Polit. Sci. Res. Methods 2015, 3, 399–408. [Google Scholar] [CrossRef] [Green Version]
  86. Shen, L.; Koveos, P.; Zhu, X.; Wen, F.; Liao, J. Outward FDI and Entrepreneurship: The Case of China. Sustainability 2020, 12, 5234. [Google Scholar] [CrossRef]
  87. Te Velde, D.W.; United Nations Conference on Trade and Development. Foreign Direct Investment and Development an Historical Perspective; Overseas Development Institute: London, UK, 2006. [Google Scholar]
  88. Hasan, M.M.; Yajuan, L.; Khan, S. Promoting China’s Inclusive Finance Through Digital Financial Services. Glob. Bus. Rev. 2020, 1–23. [Google Scholar] [CrossRef]
  89. Hasan, M.M.; Popp, J.; Oláh, J. Current landscape and influence of big data on finance. J. Big Data 2020, 7, 21. [Google Scholar] [CrossRef]
  90. Gao, J.; Wang, H.; Shen, H. Task failure prediction in cloud data centers using deep learning. IEEE Trans. Serv. Comput. 2020. [Google Scholar] [CrossRef]
  91. Gao, J.; Wang, H.; Shen, H. Machine learning based workload prediction in cloud computing. In Proceedings of the 2020 29th International Conference on Computer Communications and Networks (ICCCN), Honolulu, HI, USA, 3–6 August 2020; pp. 1–9. [Google Scholar]
  92. Moran, T.H.; Oldenski, L. Foreign Direct Investment in the United States: Benefits, Suspicions, and Risks with Special Attention to FDI from China; Peterson Institute for International Economics: Washington, DC, USA, 2013. [Google Scholar]
  93. Burgoon, B.; Raess, D. Chinese investment and European labor: Should and do workers fear Chinese FDI? Asia Eur. J. 2014, 12, 179–197. [Google Scholar] [CrossRef]
  94. Wagner, R.H. Economic interdependence, bargaining power, and political influence. Int. Organ. 1988, 42, 461–483. [Google Scholar] [CrossRef]
  95. Lacroix, J.; Méon, P.G.; Sekkat, K. Democratic transitions can attract foreign direct investment: Effect, trajectories, and the role of political risk. J. Comp. Econ. 2021, 49, 340–357. [Google Scholar] [CrossRef]
  96. Hakhverdian, A.; Mayne, Q. Institutional trust, education, and corruption: A micro-macro interactive approach. J. Polit. 2012, 74, 739–750. [Google Scholar] [CrossRef] [Green Version]
Figure 3. Percentage of major economies (EU, US, China) in global OFDI stocks and flows, 2000–2018.
Sustainability 13 10281 g003
Figure 4. Percentage of China’s OFDI stocks in various regions of Europe, 2003–2017.
Sustainability 13 10281 g004
Figure 5. Percentage of Chinese investment in terms of host country OFDI, 2003–2017.
Sustainability 13 10281 g005
Figure 6. Relationship between China’s share of the OFDI and the regulatory quality of the host countries.
Sustainability 13 10281 g006
Figure 7. Relationship between China’s share of OFDI and the control of corruption in host countries.
Sustainability 13 10281 g007
Table 1. Panel model evaluation of the relationship between Chinese investment and the CEE regulatory quality.
Variables(1)(2)(3)(4)(5)(6)
Pool-RQRe-RQFe-RQPool-RQRe-RQFe-RQ
Ln (China’s OFDI stocks) squared0.0020.0010.001
(0.003)(0.002)(0.002)
Ln (China’s OFDI stocks)−0.061−0.0400.008
(0.042)(0.029)(0.029)
Share of China’s OFDI squared 0.497 **0.846 **0.841 **
(0.193)(0.407)(0.412)
Share of Chinese investment −0.722 **−0.732 ***−0.710 ***
(0.320)(0.251)(0.245)
Ln (GDP per capita)0.503 ***0.291 ***0.196 ***0.290 ***0.252 ***0.159 ***
(0.038)(0.042)(0.050)(0.032)(0.036)(0.044)
Ln(population)−0.286 ***−0.251 **−1.529 ***−0.143 ***−0.147−0.478
(0.041)(0.121)(0.434)(0.045)(0.122)(0.466)
Ln (land area)0.343 ***0.358 **−5.5080.350 ***0.292 **1.863
(0.047)(0.156)(3.671)(0.044)(0.139)(3.592)
Urbanization rate0.012 ***0.011 **−0.0050.014 ***0.019 ***0.012 *
(0.002)(0.005)(0.008)(0.002)(0.005)(0.007)
Trade openness−0.046 **−0.022−0.017−0.030−0.010−0.005
(0.021)(0.015)(0.015)(0.019)(0.013)(0.012)
Education level−0.1350.347 **0.520 ***−0.2150.1160.275
(0.131)(0.134)(0.143)(0.152)(0.127)(0.141)
Political risk0.038 ***0.022 ***0.020 ***0.039 ***0.022 ***0.020 ***
(0.004)(0.004)(0.004)(0.003)(0.004)(0.004)
Constant term−4.42 ***−4.193 ***−38.005−4.808 ***−3.805 ***−4.949 **
(0.498)(1.148)(40.285)(0.335)(0.972)(2.139)
N185185185196196196
R−squared0.835 ***0.77 ***0.413 ***0.845 ***0.803 ***0.332 ***
Standard errors are in parenthesis. *** p < 0.01, ** p < 0.05, * p < 0.1.
Table 2. Panel model evaluation of the relationship between Chinese investment and the CEE control of corruption.
Variables(7)(8)(9)(10)(11)(12)
Pool-CCRe-CCFe-CCPool-CCRe-CCFe-CC
Ln (China’s OFDI stocks) squared0.002−0.002−0.003
(0.004)(0.002)(0.002)
Ln (China’s OFDI stocks)−0.103 **−0.0340.021
(0.052)(0.033)(0.032)
Share of China’s OFDI squared 0.612 ***0.502 **0.603
(0.836)(0.205)(0.465)
Share of Chinese investment −0.945 ***−0.650 **−0.418
(0.358)(0.272)(0.363)
Ln (GDP per capita)0.510 ***0.142 ***−0.0150.362 ***0.109 **0.027
(0.052)(0.050)(0.055)(0.046)(0.043)(0.047)
Ln(population)−0.196 ***−0.49 **−1.895 ***−0.235 ***−0.536 ***−2.403 ***
(0.056)(0.189)(0.478)(0.051)(0.186)(0.443)
Ln (land area)0.236 ***0.489 **2.9190.2410.486 **1.279
(0.064)(0.246)(4.042)(0.063)(0.244)(3.907)
Urbanization rate−0.0060.000−0.0140.0020.006−0.005
(0.003)(0.007)(0.008)(0.003)(0.007)(0.008)
Trade openness−0.0120.0130.022−0.0030.0020.004
(0.029)(0.017)(0.016)(0.027)(0.015)(0.015)
Education level0.525 ***0.2430.387 **0.491 **0.0780.137
(0.180)(0.157)(0.158)(0.172)(0.151)(0.154)
Political risk0.034 ***0.019 ***0.020 ***0.038 ***0.020 ***0.019 ***
(0.005)(0.004)(0.005)(0.005)(0.004)(0.004)
Constant term−5.672 ***−1.4116.770−5.078 ***−0.26722.179
(0.687)(1.265)(7.666)(0.479)(1.672)(42.345)
N185185185194194194
R−squared0.748 ***0.449 ***0.296 ***0.753 ***0.418 ***0.302 ***
Standard errors are in parenthesis (*** p < 0.01, ** p < 0.05).
Table 3. Regression discontinuity model (2012).
LATE CoefficientRD-RQ
(13)
RD-RQ
(14)
RD-CC
(15)
RD-CC
(16)
RD-CS
(17)
RD-CS
(18)
RD-CP
(19)
RD-CP
(20)
Algorithm 1: conventional0.0090.090−0.0300.0020.014−0.143−0.001−0.005
(0.975)(0.491)(0.869)(0.986)(0.99)(0.785)(0.926)(0.689)
Algorithm 2: bias−corrected0.0350.1450.0050.1380.154−0.0470.010.002
(0.898)(0.271)(0.976)(0.143)(0.885)(0.929)(0.510)(0.896)
Algorithm 3: Robust0.0350.1450.0050.1380.154−0.0470.0100.002
(0.917)(0.375)(0.987)(0.437)(0.917)(0.971)(0.695)(0.937)
Control variablesNOYESNOYESNOYESNOYES
Polynomial order (K)44444444
N268234272237220187228195
Note: Coefficient p-value in the ().
Publisher’s Note: MDPI stays neutral with regard to jurisdictional claims in published maps and institutional affiliations.

