
Safety Evaluation of Turbo-Roundabouts with and without Internal Traffic Separations Considering Autonomous Vehicles Operation


1
Faculty of Engineering and Architecture, University of Enna Kore, Viale delle Olimpiadi, 94100 Enna, Italy
2
Department of Engineering, University of Palermo, Viale delle Scienze, Ed 8, 90128 Palermo, Italy
*
Author to whom correspondence should be addressed.
Sustainability 2021, 13(16), 8810; https://doi.org/10.3390/su13168810
Submission received: 3 June 2021
/
Revised: 30 July 2021
/
Accepted: 2 August 2021
/
Published: 6 August 2021
(This article belongs to the Special Issue Roundabouts Performance in Road Transport Networks—Future Challenges, Problems and Issues)
Abstract
:The paper presents a microsimulation approach for assessing the safety performance of turbo-roundabouts where Cooperative Autonomous Vehicles “CAVs” have been introduced into the traffic mix alongside conventional vehicles “CVs”. Based on the analysis of vehicle trajectories from VISSIM and subsequent analysis of traffic conflicts through the Surrogate Safety Assessment Model (SSAM), the research aims to evaluate the safety benefits of turbo-roundabouts where the lanes are physically separated by raised curbs, compared to roundabouts without such curbs. The paper will then describe the methodological path followed to build VISSIM models of turbo-roundabouts with and without raised curbs in order to calibrate the simulation models and estimate the potential conflicts when a higher percentage of CAVs are introduced into the traffic mix. A criterion has been also proposed for setting properly the principal SSAM filters. The results confirmed both higher safety levels for turbo-roundabouts equipped with raised lane dividers compared to turbo-roundabout solutions without curbs, and better safety conditions under the traffic mix of CVs and CAVs. Therefore, it follows that, in absence of crash data including CAVs, the surrogate measures of safety are the only approach in which the safety performance of any roundabout or road entity can be evaluated.
1. Introduction
The turbo-roundabout concept has been introduced as an alternative roundabout which provides a spiraling traffic flow and requires drivers to preselect the right lane before entering the intersection. It also limits lane-changing and speeds; raised lane dividers between the lanes channelize drivers upstream from entry points, into the circulatory roadway and up to the desired exits [1]. In view of these safety benefits, turbo-roundabouts are used worldwide and their construction has induced a great variety of experiences. Despite the presence of raised lane dividers as an important feature of safe performance, turbo-roundabout configurations which only have road markings are also operating in different countries such as Canada, Czech Republic, Denmark, Germany, Lithuania and the USA. This configurational difference and absence of raised lane dividers is due to the possible problems with snow-plowing in winter in presence of curbs [2]. Kieć et al. [3] assessed the impact of curbs on road safety in Polish turbo-roundabouts by using floating car data and video observation of lane changing behavior. Based on surveys of turbo-roundabouts with and without raised curbs, they developed a surrogate measure of safety, just reaching a relative validation of the method. The surrogate measure of safety was introduced into existing safety performance functions in order to quantify the safety impact of different turbo-roundabout solutions. However, only a few studies have been based on field data or have calibrated models for safety performance evaluation at turbo-roundabouts. In turn, microscopic simulation has been used to estimate the impact of roundabouts and turbo-roundabouts on traffic safety and operational performances [4,5,6,7]. However, some aspects of driving are being studied: how to implement computational strategies to increase safety and efficiency in intelligent infrastructure management; how to evaluate traffic performances of Cooperative Autonomous Vehicles (CAVs) when they use dedicated lanes or when they are mixed with Conventional Vehicles (CVs) in the same road entity at the same time. According to [8], the introduction of CAVs into the traffic mix will likely reduce or eliminate the impact of the human factor in the decision-making processes implemented by the driver. Traffic micro-simulation can provide tools to analyze how the safety characteristics of road traffic will change when CAVs come to coexist with CVs, and to develop new methods for managing road safety. Some recent studies have used a surrogate measure of safety to evaluate the performance of any road entity under various traffic situations and major results have highlighted the fruitful use of these measures [9,10,11,12]. Guerrieri et al. [13] have studied the “conventional” driver behavior at turbo-roundabouts in-depth. However, few studies have been carried out with specific reference to roundabouts and turbo-roundabouts with the presence of CAVs. [14], Giuffrè et al. [15] presented a microsimulation-based approach for evaluating the safety performances of roundabouts where different percentages of CAVs were mixed with CVs. Based on vehicle trajectories exported from VISSIM, traffic conflicts were estimated by the SSAM for single-lane, double-lane and turbo-roundabouts. Tollazzi et al. [16] showed the benefits of the application of microsimulation to the roundabout evaluation, and the present study confirms that the simulated conflicts could be used to evaluate safety performance of roundabouts in the absence of crash data, including CAVs. Krivda et al. [17] highlighted the traffic conflict method based on the sustainable approach. Petru et al. [18] linked the turbo-roundabouts operation to the sustainable road transport operations.
In this paper, a microsimulation approach for assessing the safety performance of turbo-roundabouts, where CAVs are mixed with CVs, is presented. The research aims to evaluate the safety benefits of turbo-roundabouts with curbs compared to turbo-roundabouts without curbs. Based on a previous study [7], we also propose a criterion to set the principal SSAM filters when the presence of CAVs in traffic should be included. The paper shall also describe the methodological path followed to build the VISSIM models of turbo-roundabouts with and without internal traffic separations to calibrate the models and to estimate any potential conflicts that might occur with the change in the percentage of CVs and CAVs in the traffic mix. A criterion has been also proposed for modeling turbo-roundabouts without curbs in VISSIM and then estimating the potential conflicts which might occur.
The results confirmed that there was higher safety levels in turbo-roundabouts where raised lane dividers were installed, compared to solutions without curbs. Furthermore, there was better safety performance in the traffic mix of CVs and CAVs.
2. Method
The geometric characteristics of the turbo-roundabout case study are shown in Table 1 and Figure 1. Note that the design characteristics were chosen to be consistent with the basic turbo design proposed by [1,19].
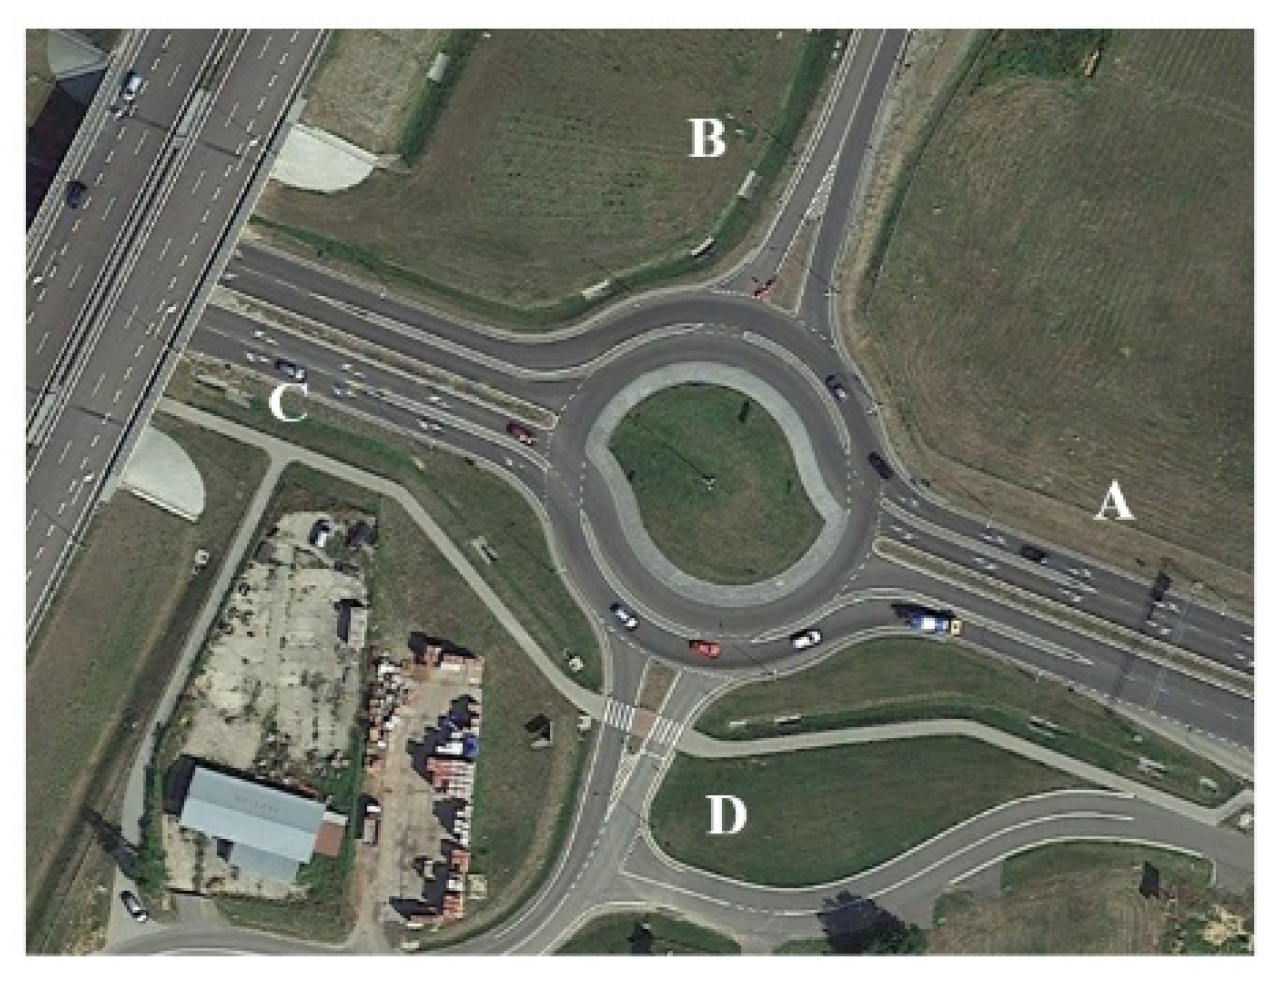
Based on data of entry and conflicting traffic flows videotaped at turbo-roundabouts showed in Figure 2 under rush-hour traffic and light traffic on regular weekdays, one situation of traffic corresponding to the matrix of traffic flow percentages in Table 2 was analyzed. The percentage of the heavy vehicles did not go beyond 5 percent during the observational period, while pedestrian flows resulted insignificant. Traffic flow measurement and vehicle counting were conducted in the morning (7:30–8:30 a.m.) and the afternoon’s peak hours (5:30–7:30 p.m.) at the 14 intersections under examination, on weekdays (Wednesday to Friday) in 2019. However, morning peaks were almost always reached in a short time period that dropped to their own lowest points, whereas the afternoon peaks were reached over a longer time than the morning peaks. Thus, the morning peak-hour data were excluded. Traffic flow data were videotaped on each entry (exit) lane approach within the viewable area of the intersections; they were classified by travel direction and maneuver so that they can be easily identified in the network model of the roundabouts built in simulation environment. Note that traffic data were manually gathered and simultaneously counted by two operators sited at the entry approaches of the major roads. A maximum value of total entry flow of 3340 vehicles per hour was registered on-field during the surveys.
First, VISSIM microsimulation was conducted for CVs only. The entering flow from each approach was simulated in VISSIM by assuming a value of 1.2 m for the average standstill distance (whereas the default value is 2.0 m). The VISSIM software was used to simulate the traffic flows in the same temporal intervals as they were surveyed in the field. Consistent with the observations in the field, the average standstill distance of 1.0 m was set (whereas the default value is 2.0 m); it represented the average desired distance between non-moving cars in which the roundabout is travelled under conditions ranging from free flow traffic to a saturation degree of 0.88 [20]. Based on field observations, the calibrated parameter is the mean value of the distribution of values of the distance between two subsequent vehicles when they are queuing (with standard deviation of 0.423).
A sensitivity analysis, followed by the calibration in VISSIM, identified further model parameters with the best possible performance on outputs:
- the “look ahead distance max”: the default value is 250.0 m; the calibrated value is 105.0 m;
- the “look back distance min”: the default value is 250.0 m; the calibrated value is 30.0 m;
- the “temporary lack of attention”: the default value is 0.0 s, while the calibrated value is 2.40 s, that is consistent with [21];
- the “additive part of desired safety distance” for both entry lanes: the default value is 2.00 m; the calibrated value is 1.80 m;
- the “multiple part of safety distance” for both entry lanes: the default value is 3.00 m; the calibrated value is 3.60 m.
Once the microsimulation ran, the vehicle data were extracted in order to generate and analyze the simulated vehicle paths. Calibration was conducted so that VISSIM could return driving patterns as close to those obtained in the field and the model was able to best replicate them, as suggested in [24]. The combinations of the VISSIM parameters under calibration best fitted the field data and resulted in more realistic driving behavior. Under these combinations, the model was also effective in improving the simulation estimates. In order to determine the similarity between observed and simulated values, the GEH index was used as a measure of goodness-of-fit for the simulated data compared to those ones observed in the field [25]. This index is a global indicator which is widely used for the validation of traffic simulation models, especially when only aggregate values, such as traffic flow counts in time-based detection stations and input capacity, are available [26]. Since the deviation of the simulated values, with respect to the observed values, resulted in lower than 5 in more than the 85% of the cases, the model was accepted; the root mean squared normalized errors less than 12 percent were also thought as acceptable.
For the O/D matrix in Table 2, the entering flow from each entry was simulated by increasing it with a step of 50 veh/h until the Level-of-Service C was reached; indeed, potential conflicts at LoS A or LoS B, where weak vehicle interactions occur, cannot be considered precursors of real conflicts. Simulations lasted 7 h in total. The analysis of output data provided a value of 500 veh/h for the entering vehicular flow from each entry.
Simulations in VISSIM were used to generate the trajectory files and then to estimate the surrogate measures of safety by using the SSAM. The overall duration of the simulation was 70 min: 5 min of warm-up to load traffic into the network model and to reach a steady state condition; 60 min of simulation for generating trajectory data; 5 min for emptying the road network without affecting the traffic during the simulation.
Setting VISSIM Microsimulation with CAVs
In order to model as accurately as possible, the behavior of CAVs interacting with CVs in the turbo-roundabout at the same time, the preloaded car-following model W99 in VISSIM was applied to consider the driving characteristics of CAVs. The traffic configuration included two scenarios: (1) 90% of CVs and 10% of CAVs; (2) 75% of CVs and 25% of CAVs. The car-following parameters were set as delineated by [27], instead of the default values (see Table 3).
Particular attention should be paid to the following parameters when CAVs are considered within traffic operations:
- minimum look-ahead distance: if its value is 0.00 (case of CVs), only the number of observed vehicles applies; if several vehicles can overtake within a lane, this value needs to be greater than 0.00 m. A minimum distance of 20 m has been imposed to model the CAVs and to allow a correct and safe alignment of vehicles during the queue formation;
- maximum look-ahead distance: this has been varied account for the fact that CAVs will be interconnected with each other by Wi-Fi or similar connections; this distance is set 200 m for CAVs; if this option is not selected, the following vehicle uses the normal following behavior until the speed of the preceding vehicle drops to <1 m/s and it almost comes to a halt. Only then, the following vehicle determines the final approach behavior;
- the number of observed vehicles or certain network objects that affects how well vehicles can predict other vehicles’ movements and react accordingly; the value has been set to 10 vehicles to make CAVs interacting with all vehicles in a 200 m radius;
- temporary lack of attention: this parameter is divided into duration (how long this lack of attention lasts) and probability (how often this lack of attention occurs); these two parts must be set equal to 0 for CAVs because, without failures, their devices will always be active and attentive to vehicle motion;
- standstill distance: the attribute of smooth close-up behavior should be selected for CAVs because without such selection, the vehicles will use a normally-distributed random value between 0.5 m and 0.15 m. For CAVs, this distance defines ultrasonic sensors that stop the vehicles at a default distance value of 0.5 m;
- CC0: it can be set to 1.00 m for CAVs when the magnetic or ultrasonic sensors on the market guarantee high efficiency and risk of minimal contact for distances from 1.00 m to 1.5 m;
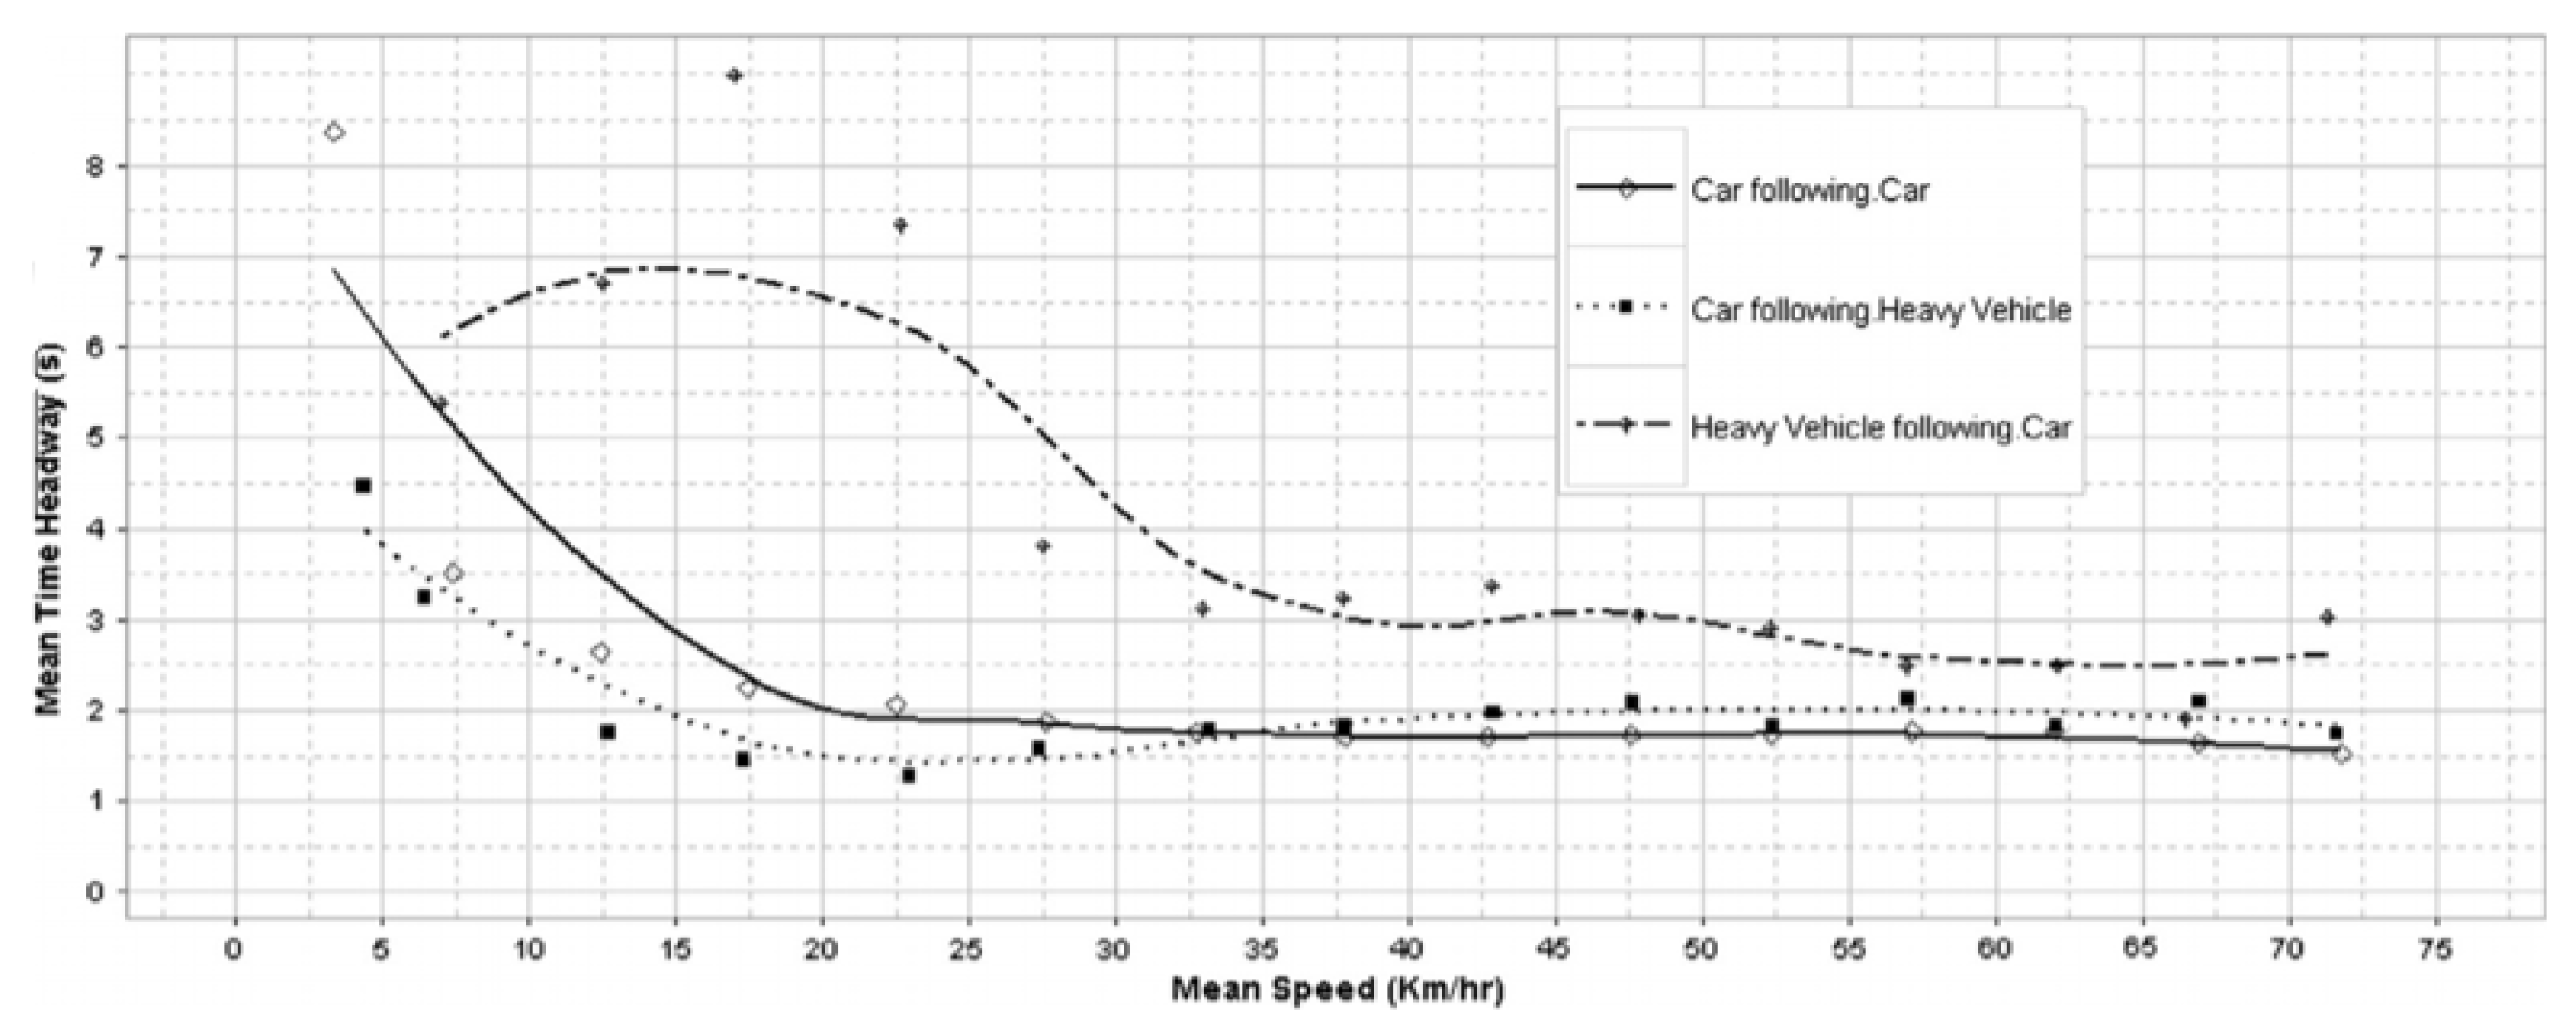
- CC1: Figure 3 shows the differences in the front-to-rear time headways of cars and heavy vehicles [27]. The headway was longer at very low speeds and decreased as the speed of the following vehicle increased. For CAVs, the LIDAR sensors allow this distance to be kept at a constant regardless of the type of vehicle that follows and its speed; for CAVs this parameter was set to 0.5 s;
- CC2: this additional safety distance for CVs was estimated based on the spacing between two vehicles during the unconscious following process [28]. Spacing, in addition to safety distance, is smaller for CAVs than it is for CVs, since CAVs equipped with sensors are 100% attentive and conscious when they follow vehicles; they are also able to maintain constant speed and distance, avoiding the typical oscillations of CVs. Thus, a value of 1.00 m was set for CAVs;
- CC3: for each vehicle pair, it was estimated based on the duration of the closing process that starts when the deceleration is less than or equal to −0.31 m/s2. In the case of CAVs equipped with Lidar sensors, CACC, breaking emergency systems, are able to recognize the vehicles that precede them regardless of their size and speed; therefore, the CAVs allow a quick recognition of all users present in their trajectory, starting the deceleration process at a greater distance. In the case of CAVs, this parameter has been set to −6 s;
- CC4 and CC5: CAV estimates the speed of the vehicle that follows, determines the distance and in the case of queuing, constantly maintains these two variables over time. Thus, the parameters CC4 and CC5 for the CAVs have been set equal to 0.1;
- CC6: for CAVs, this parameter can be 1 m/s thanks to the automatic control of the driving system;
- CC7: both car and heavy vehicle drivers apply low acceleration/deceleration during the unconscious following process because they try to maintain the ideal gap at zero relative speed. For CAVs, the vehicle can maintain this variation equal to 0.1 m/s2;
- CC8: for CAVs, it has been defined according to the technical characteristics of the CACC, which determines an average acceleration of 3.00 m/s2;
- CC9: for the CAVs, this has been set at 0.5 m/s2 but it did not influence simulations, since the speed limit is 50 km/h.
3. Calculation of Total Conflicts
In order to extract the trajectory files from VISSIM, 15 replications of simulation, each one hour in duration, were created; according to [4,7], the best five simulations were selected. The SSAM software was applied to combine microsimulation with automated conflict analysis, and calculate the surrogate measures of safety for the turbo-roundabout under examination. First, we only analyzed a fleet of CVs. A comparison was made between the turbo-roundabouts with curbs and without curbs; a criterion was also proposed to model the turbo-roundabout without curbs in VISSIM. Subsequently, the traffic composition was modified to introduce a percentage of CAVs.
3.1. SSAM Application with Conventional Vehicles (CVs)
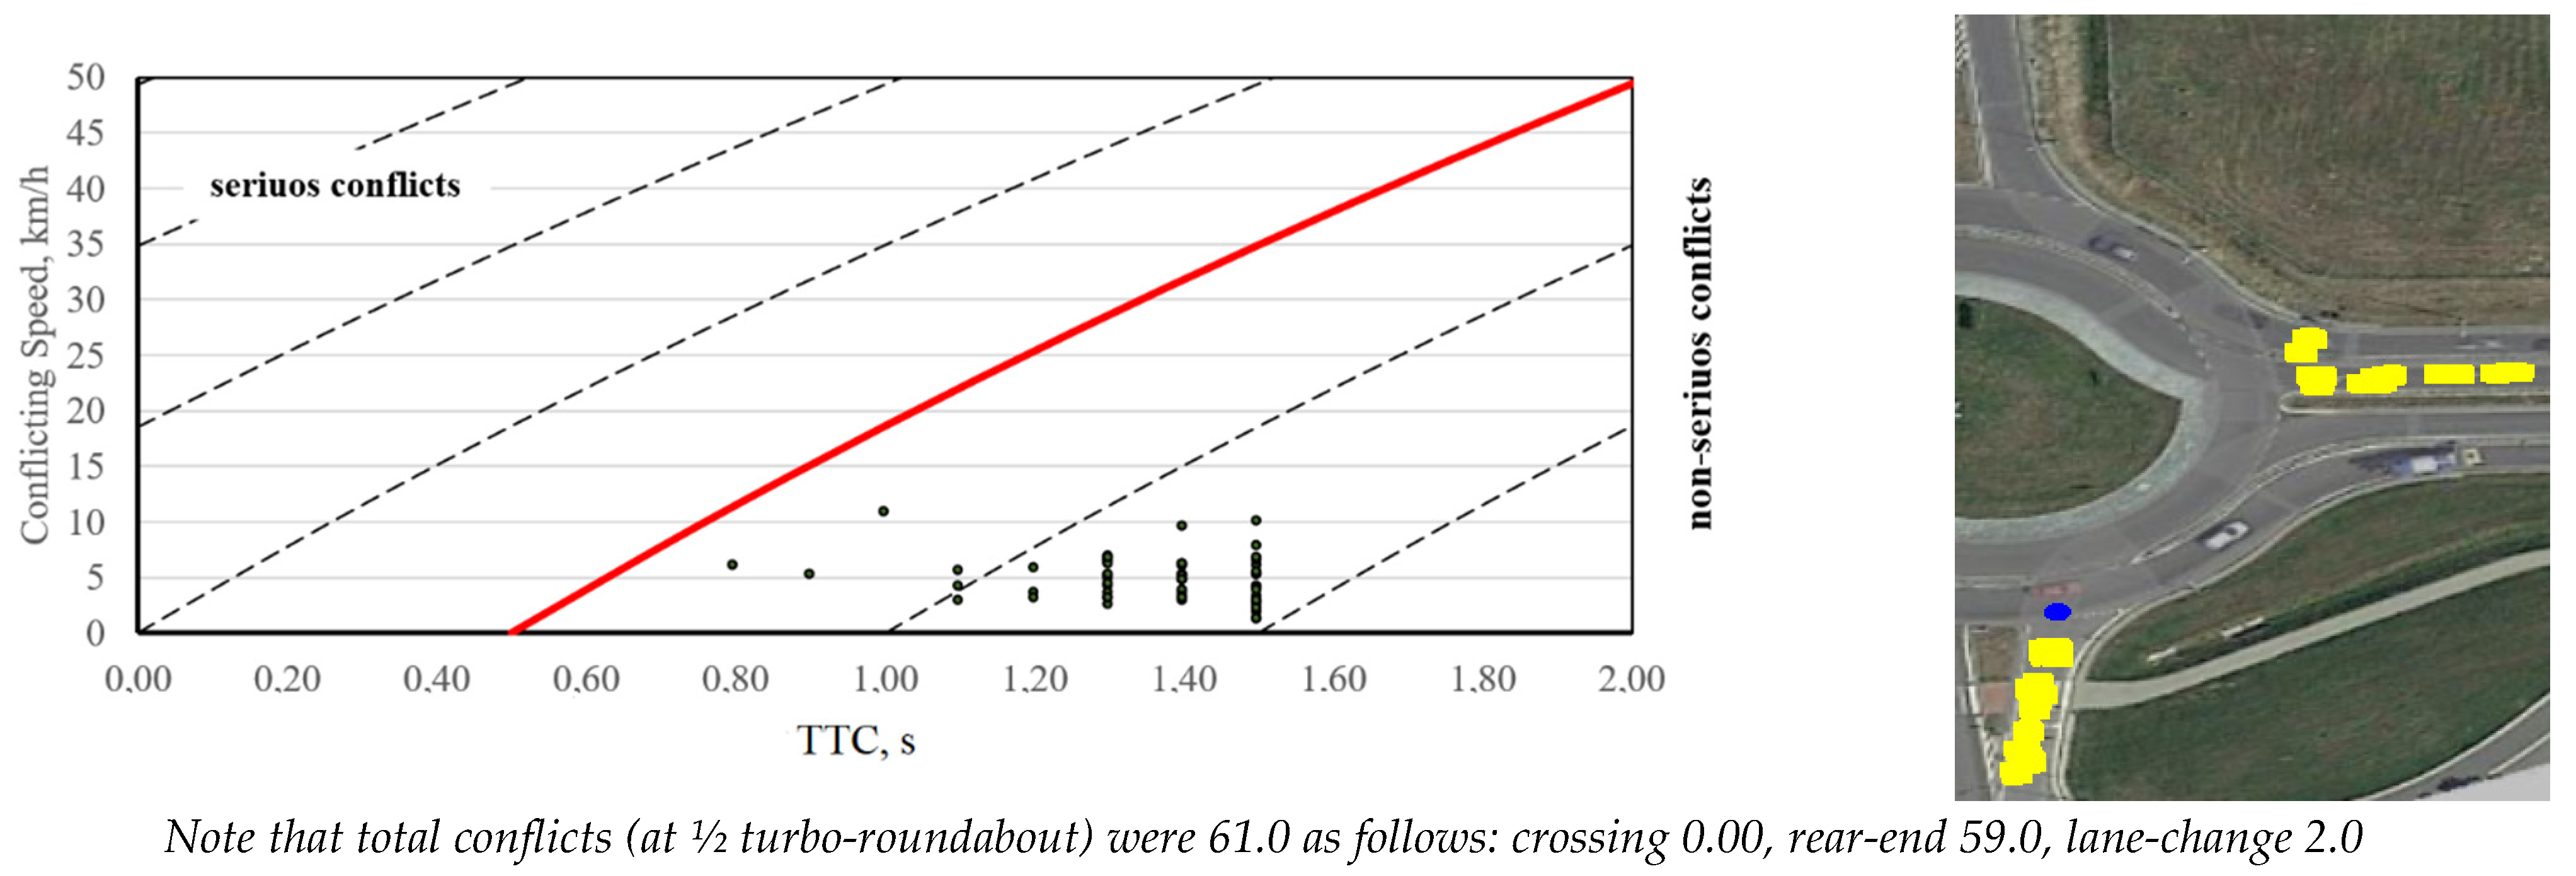
The SSAM software allowed for the analysis of surrogate indicators including the time-to-collision (TTC), which is the minimum time between two vehicles that will collide with each other if they do not change their respective trajectories, and the maximum speed (MaxS), which is the maximum speed of either vehicle throughout the conflict. Conflicts with a TTC value less than 1.50 s were considered since they denote a high probability of collision; therefore, the above value is used as the maximum threshold [29]. An estimation of potential conflicts was conducted and is shown in Figure 4, with reference to the case study of the turbo-roundabout with curbs (see Table 1); 61 total conflicts were observed: 97 percent at the rear-end and the remaining due to lane changing. The result has been referred to ½ turbo-roundabout with curbs (see Figure 4), according to the criterion that will be discussed shortly.
To evaluate the effects of curbs on road safety, two turbo-roundabouts with curbs and without curbs are compared. In VISSIM, behavioral model vehicles consider the continuous markings between two lanes as a forbidden limit; thus, the differences in terms of conflicts between turbo-roundabouts with or without curbs could not be understood. A criterion has been proposed for modeling a turbo-roundabout without curbs and estimating the potential conflicts. The approaching operation to the turbo-roundabout without curbs is broken down into two parts: an entry maneuver (left turn plus crossing, right turn) into a double-lane roundabout and an exit maneuver as for a single-lane roundabout (see Figure 5); the potential conflicts of each single maneuver have been summed. Figure 4 shows that ½ turbo roundabout (on the left) could be modeled by ¼ double lane roundabout plus ¼ single lane roundabout (on the right).
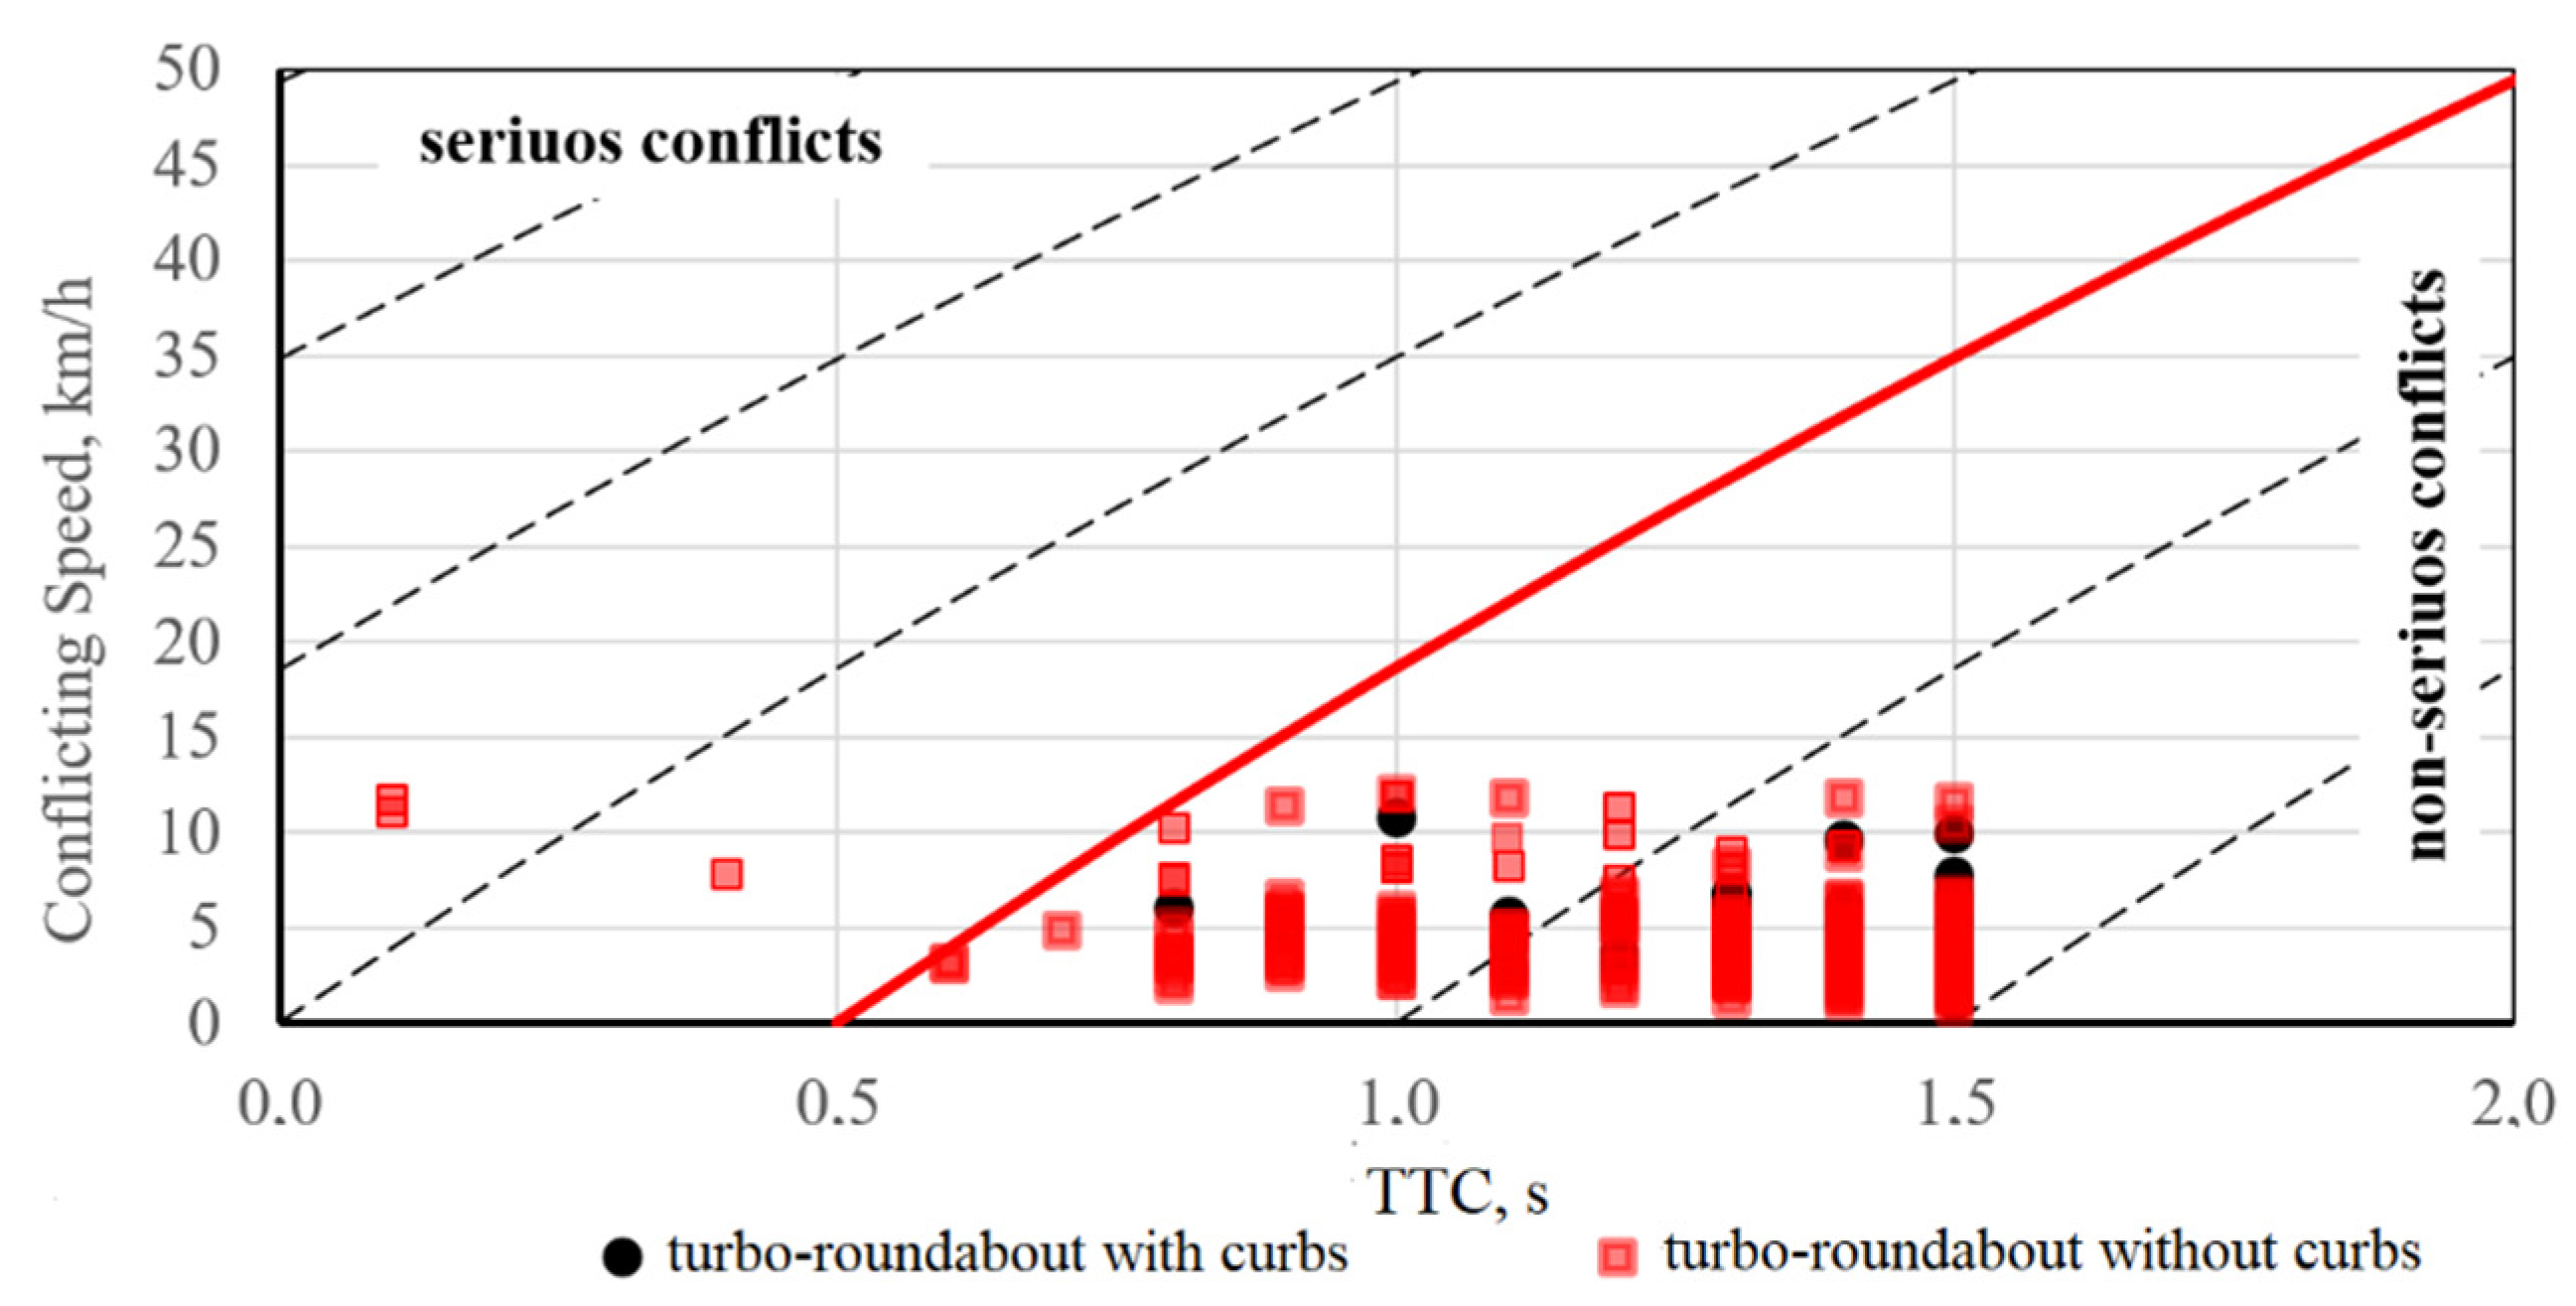
Based on the proposed criterion, simulations were carried out on a double-lane roundabout and a single-lane roundabout, geometrically consistent with what is shown in Figure 1, the same entry angles (in any case aligned with the North-South direction), and the same traffic conditions of Table 2. Simulations in VISSIM and followed by the analysis of potential conflicts by the SSAM software presented conflicts in Table 4, with reference to the pattern: ¼ double-lane roundabout plus ¼ single-lane roundabout shown in Figure 4. Figure 6 depicts potential conflicts for the turbo-roundabout models with and without curbs.
From the above considerations and the analysis just described, a total reduction in potential conflicts reach almost 70 percent when curbs are installed; thus, curbs help drivers to set their paths correctly, reduce the areas in which the trajectories could intersect and, consequently, decrease potential risks.
3.2. SSAM Application with Cooperative Autonomous Vehicles (CAVs)
Estimation of potential conflicts in traffic where percentages of CVs and CAVs are interacting was conducted using the SSAM; in each examined traffic mix, CVs included 5% of heavy vehicles. A filter was applied to the TTC to account for the autonomy of CAVs. TTC defines a conflict point as the difference between the end of encroachment of a turning vehicle and the time when a through-vehicle (with priority) arrives at the conflict point; however, it must have traveled its trajectory with the speed at the time it started deceleration to avoid a collision [9].
Thus, the vehicle with priority did not perceive the risk and, in turn, did not reduce the speed. The time for CVs ranges from 0.00 s to 1.50 s. CAVs are equipped with an Automatic emergency brake system [30] that is associated with the Anti-lock Braking System (ABS) [31]. Although these systems allow the vehicle to reach a very high level of deceleration (1.2 g as a maximum), usual pavement and tyre conditions, as far as adverse environmental conditions, can severely reduce the maximum value, which can be used in simulation.
When CAVs are interacting with the other vehicles in the traffic mix, the emergency braking system does not work and the vehicle cannot slow down to avoid the impact, the formula can be assumed for uniform motion: s = 6 m = v∙t = v∙TTC, where 6 m is assumed as the system activation distance in the case studied. In the most serious situation, it follows that TTC = 6·m/8.33 m/s = 0.72 s.
When traffic includes only CAVs, one can obtain 0 < TTCCAVs < 0.72 s. Considering a linear increase in TTC as the percentage of CVs increases, it is possible to write:
Considering that TTC increases linearly as the percentage of CVs increases, for %XCVs of 75% one can obtain , while for %XCVs of 90% it results in .
In order to verify this hypothesis, the risk of a crash (R) at a single-lane roundabout has been assessed based on the assumption that risk is the combination of the probability (or frequency), the occurrence of a risk, and the magnitude of the consequence.
Thus, R is defined as the product of the frequency of occurrence (F) for the severity of the consequences or magnitude (M): R = F × M. From this definition, it follows that the risk is proportional to the frequency of occurrence and therefore to the number of potential conflicts that occur at an intersection for a given geometry and entry capacity; the magnitude varies proportionally as the average travel speed changes.
From these two considerations, with reference to similar intersections with equal conflicts and average driving speed, the same level of risk could be estimated.
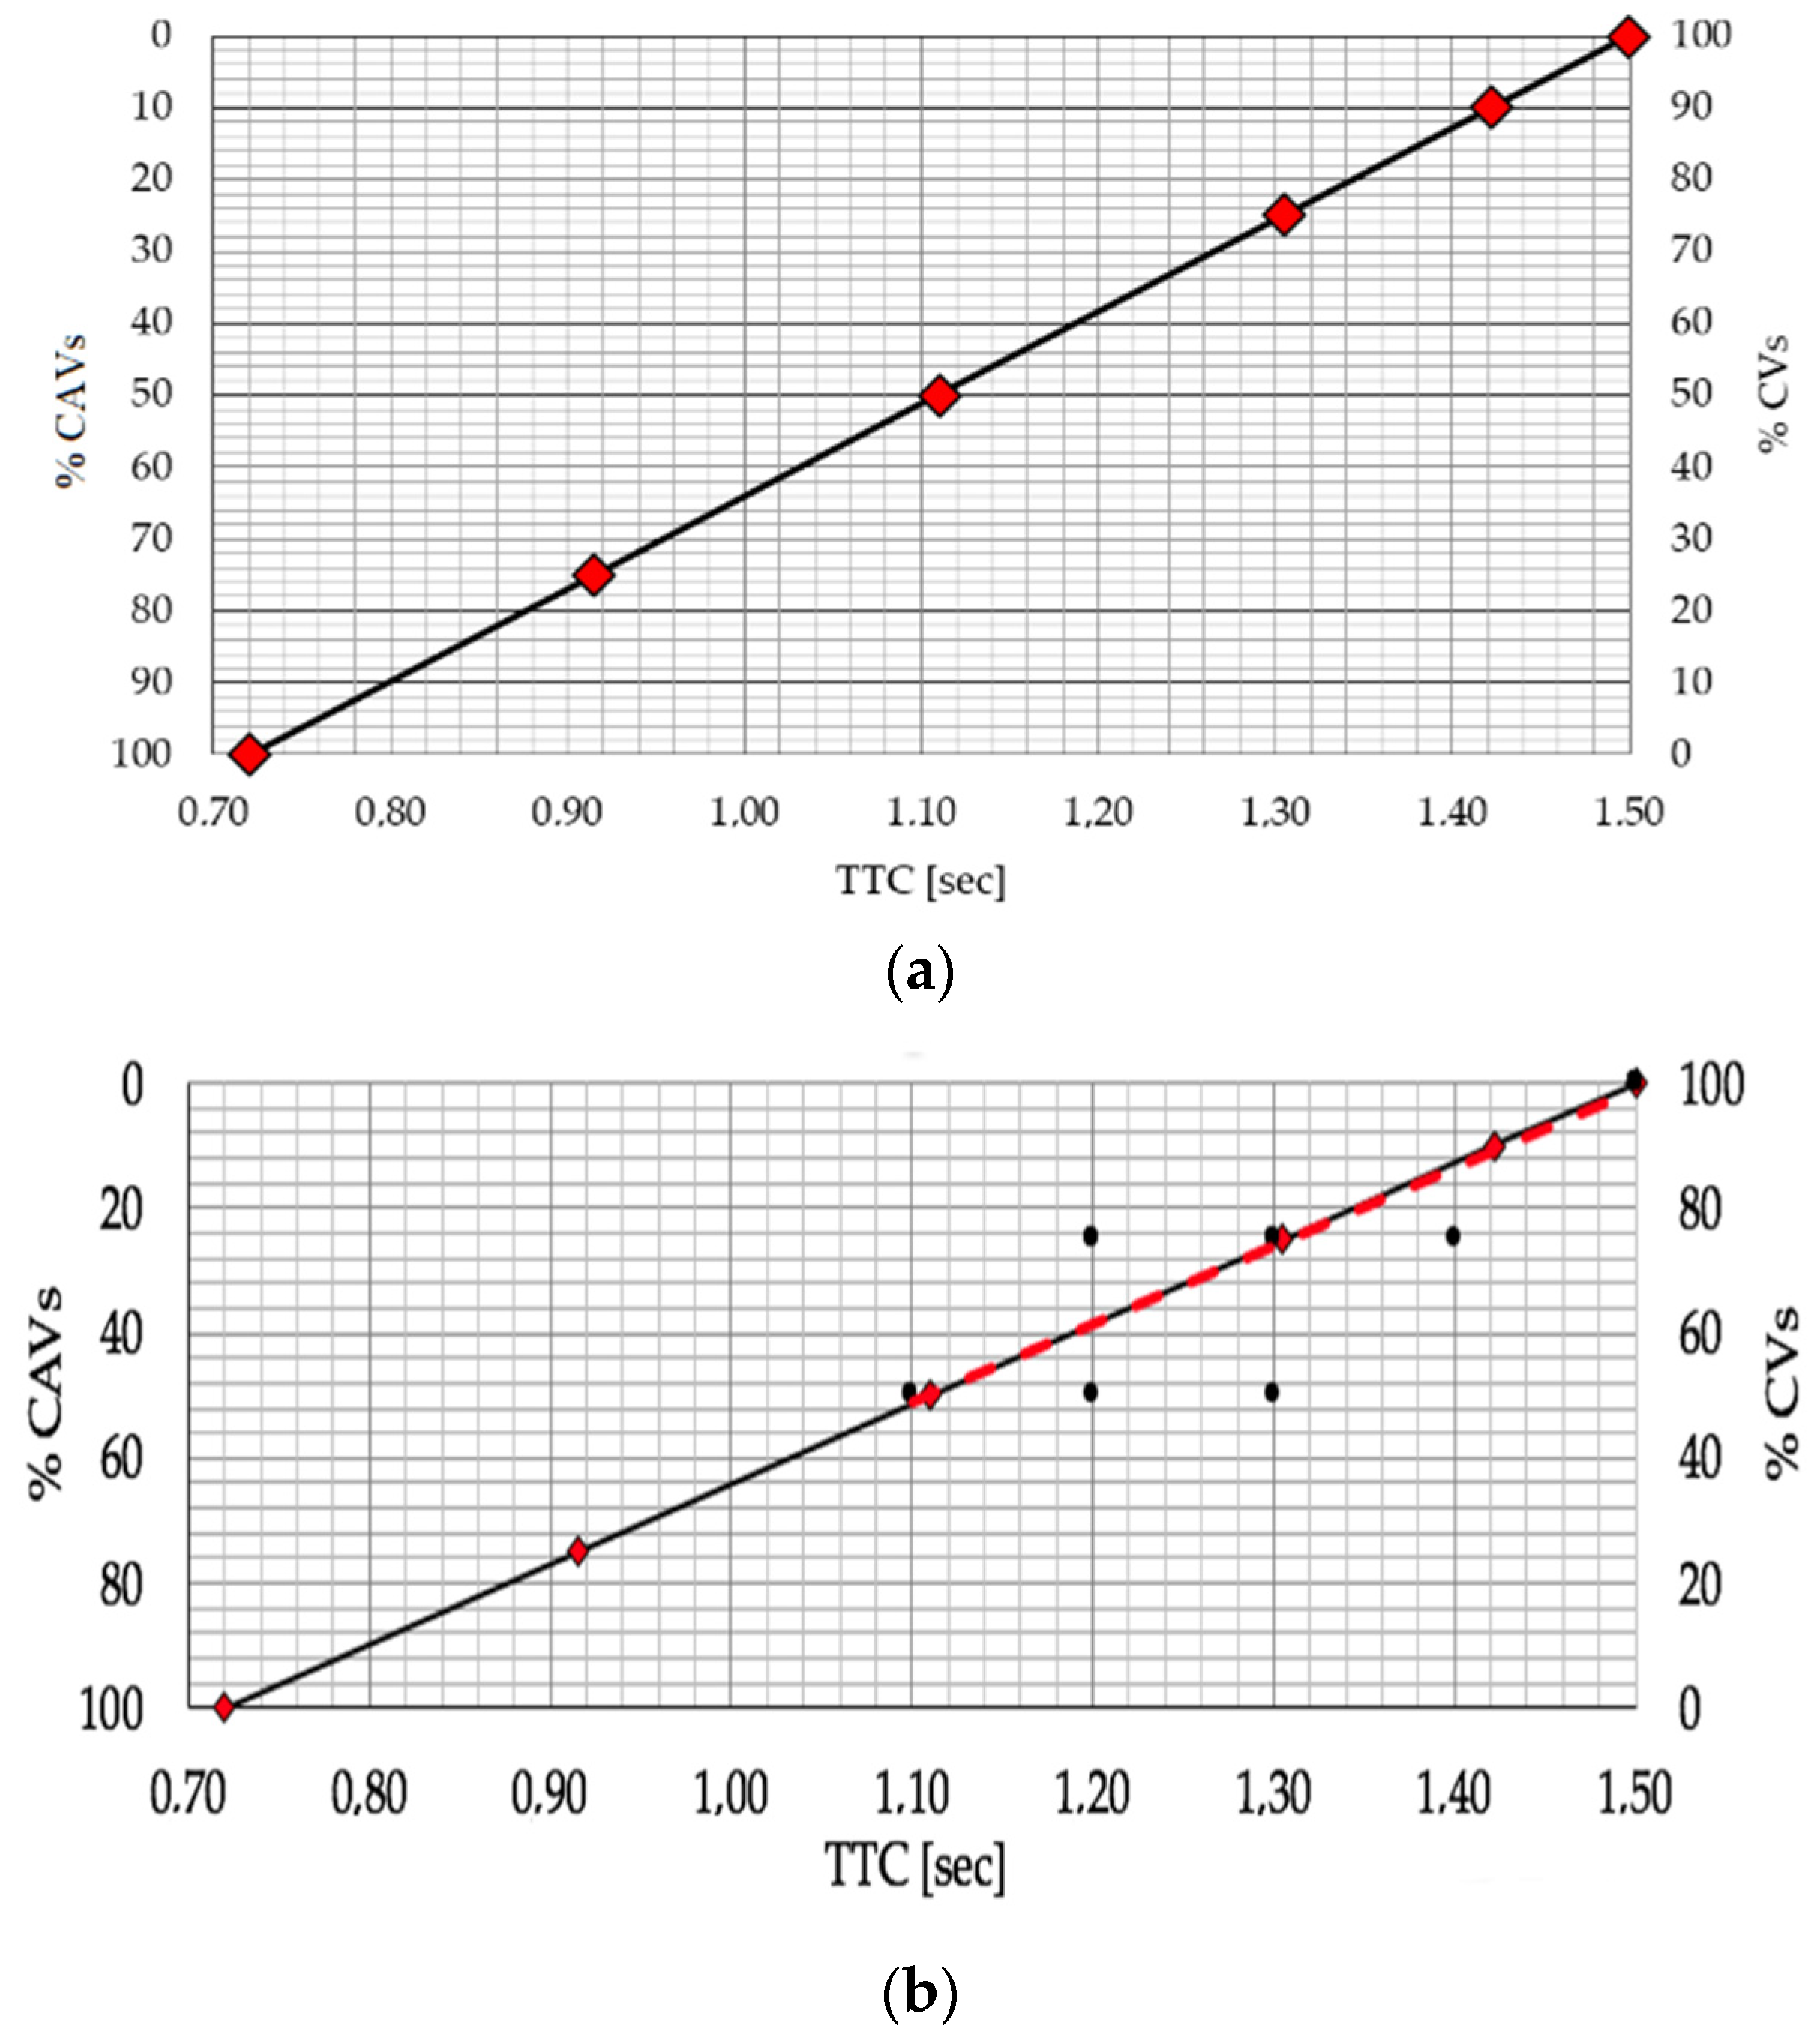
Therefore, considering that the average speed of vehicles at the roundabout entry lines varies, in a limited range as the percentage of CAVs varies, the TTC value can be calculated for constant risk levels (R = constant). It determines the same number of conflicts as the percentage of CAVs varies (10%–25%–50% CAVs). Thus, by analyzing the potential conflicts arising from simulations carried out for a single-lane roundabout, the trend assumed in the initial phase is confirmed. Figure 7 shows the linear relationship of TTC as a function of percentages of CVs and CAVs and its validation is based on the analogy with the risk concept above introduced.
In order to extract the number of conflicts from SSAM when traffic included a mix of CVs and percent of CAVs, a filter was applied onto the TTC; this considers the percentage of CAVs in the traffic mix. Based on the criterion above, introduced to compare the turbo-roundabouts with and without curbs, Table 5 shows the potential conflicts extracted, when the percentage of CAVs is 10% or 25%; for different traffic mixes, reference is made to the conflicts estimated for ¼ double-lane roundabout and ¼ single-lane roundabout (whose sum gives the conflicts for ½ turbo-roundabout without curbs) and for ½ turbo-roundabout with curbs.
Based on the findings shown in Figure 8, if the traffic flow is composed of 75% of CVs and 25% of CAVs, the potential for conflict is reduced by 70% for a turbo-roundabout with curbs. When the traffic flow is composed of 90% of CVs and 10% of CAVs in the same design layout, the potential for conflict is reduced by 50%. These reductions are also related to the reduction in the man-to-driver component, a condition that determines:
- the removal of the perception and reaction time;
- removing probability of distraction when driving;
- the impossibility of CAVs approaching the next vehicle; this condition is imposed by the ultrasound sensors and the LIDAR system that establishes a threshold of maximum proximity to the next vehicle equal to 1.2 m;
- travel trajectory presetting to always keep the vehicle on the center line of the traveled lane.
4. Discussions and Conclusions
The main focus of the research in this paper has been to evaluate the “safety performance” of the original curb settings within turbo-roundabout layouts. Although the literature informs us that internal separations improve road safety, since raised lane dividers should mark entry, circulating and exit lanes, curbs could be an obstacle in weather conditions (e.g., presence of heavy snow), especially when work vehicles must be used for specific activities (e.g., snow removal).
In order to test the above assumptions, we built two scenarios for the comparison between turbo-roundabouts with and without internal traffic separations. Moreover, for each roundabout layout we considered the case of CAVs operations within the traffic flow at two levels: 10% and 25% of CAVs, considering the outlook steps of new vehicle technology penetrating the market.
The results of the study highlight an increased level of safety in turbo-roundabouts with curbs when a percentage of CAVs is present within the traffic flow. In spite of efforts whereby traffic simulation is used to model driving behavior and style of CAVs mixed with conventional vehicles, especially when specific geometric layouts have to be implemented, a strength of this study is the use of surrogate measures of safety which have been estimated through the SSAM tool. For example, the conflict analysis highlighted that if the traffic mix is made of 75 percent of CVs and 25 percent of CAVs at a turbo-roundabout with curbs, the total potential conflicts will reduce by 83 percent compared to a situation where a turbo-roundabout has no curbs and the traffic is made of 100% CVs. When the percentage of CAVs decreases to 10 percent of the overall traffic mix, the total potential for conflicts is reduced by 70 percent, compared to a turbo-roundabout where there is an absence of curbs and the traffic mix is comprised of 100% CVs.
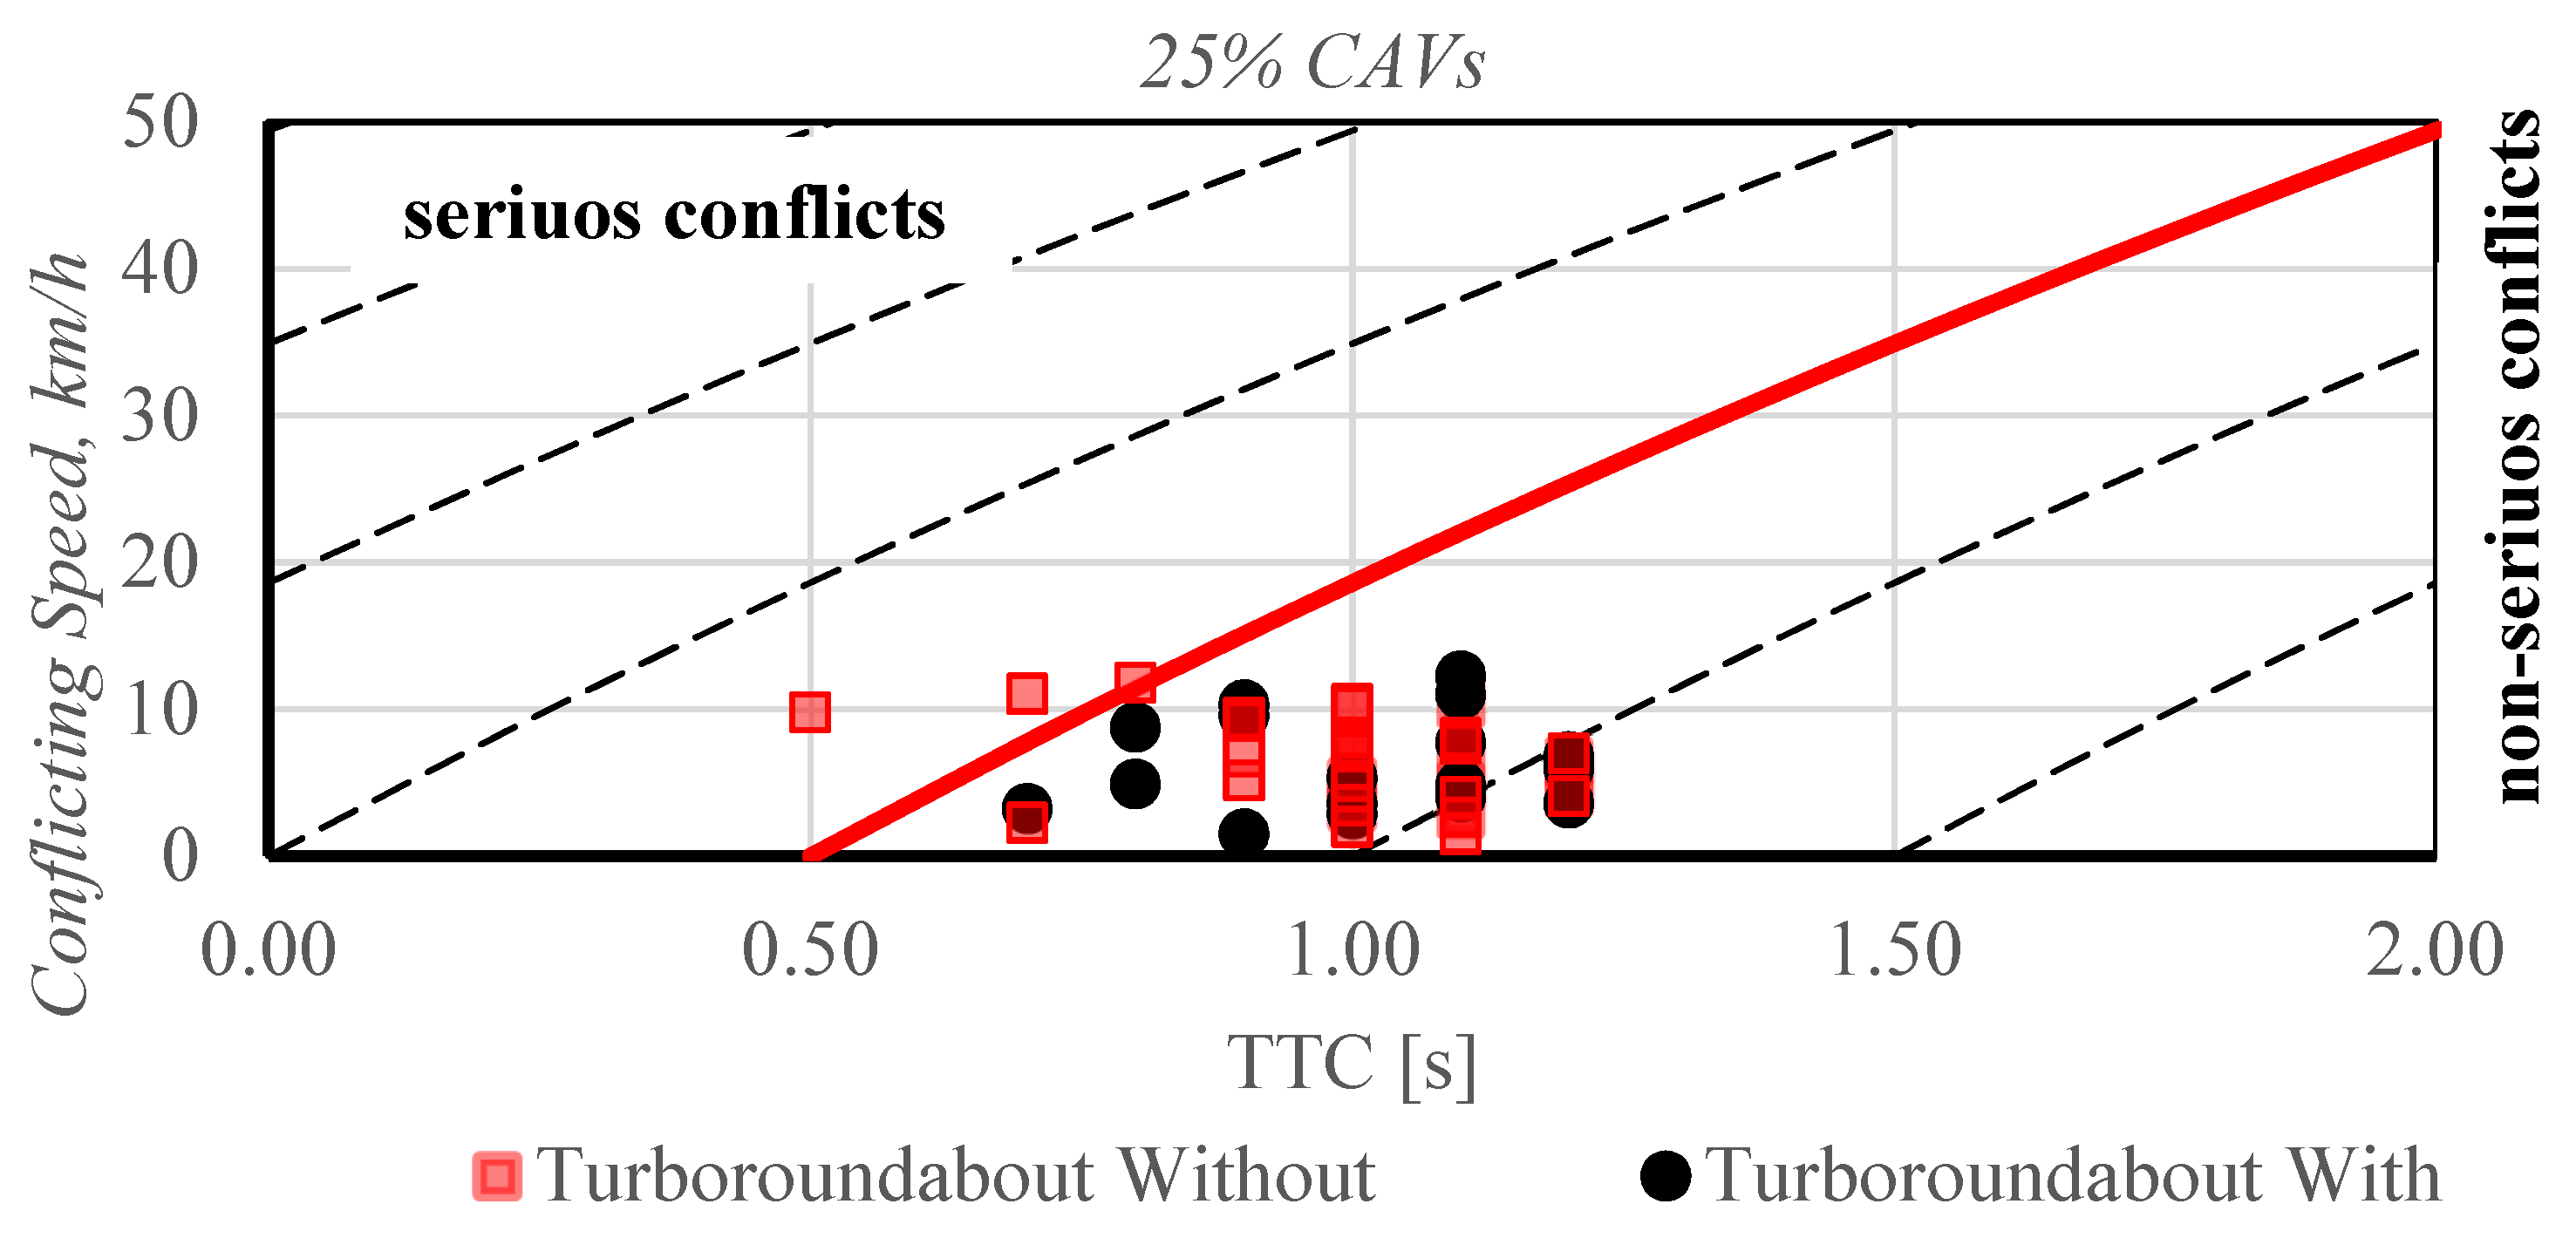
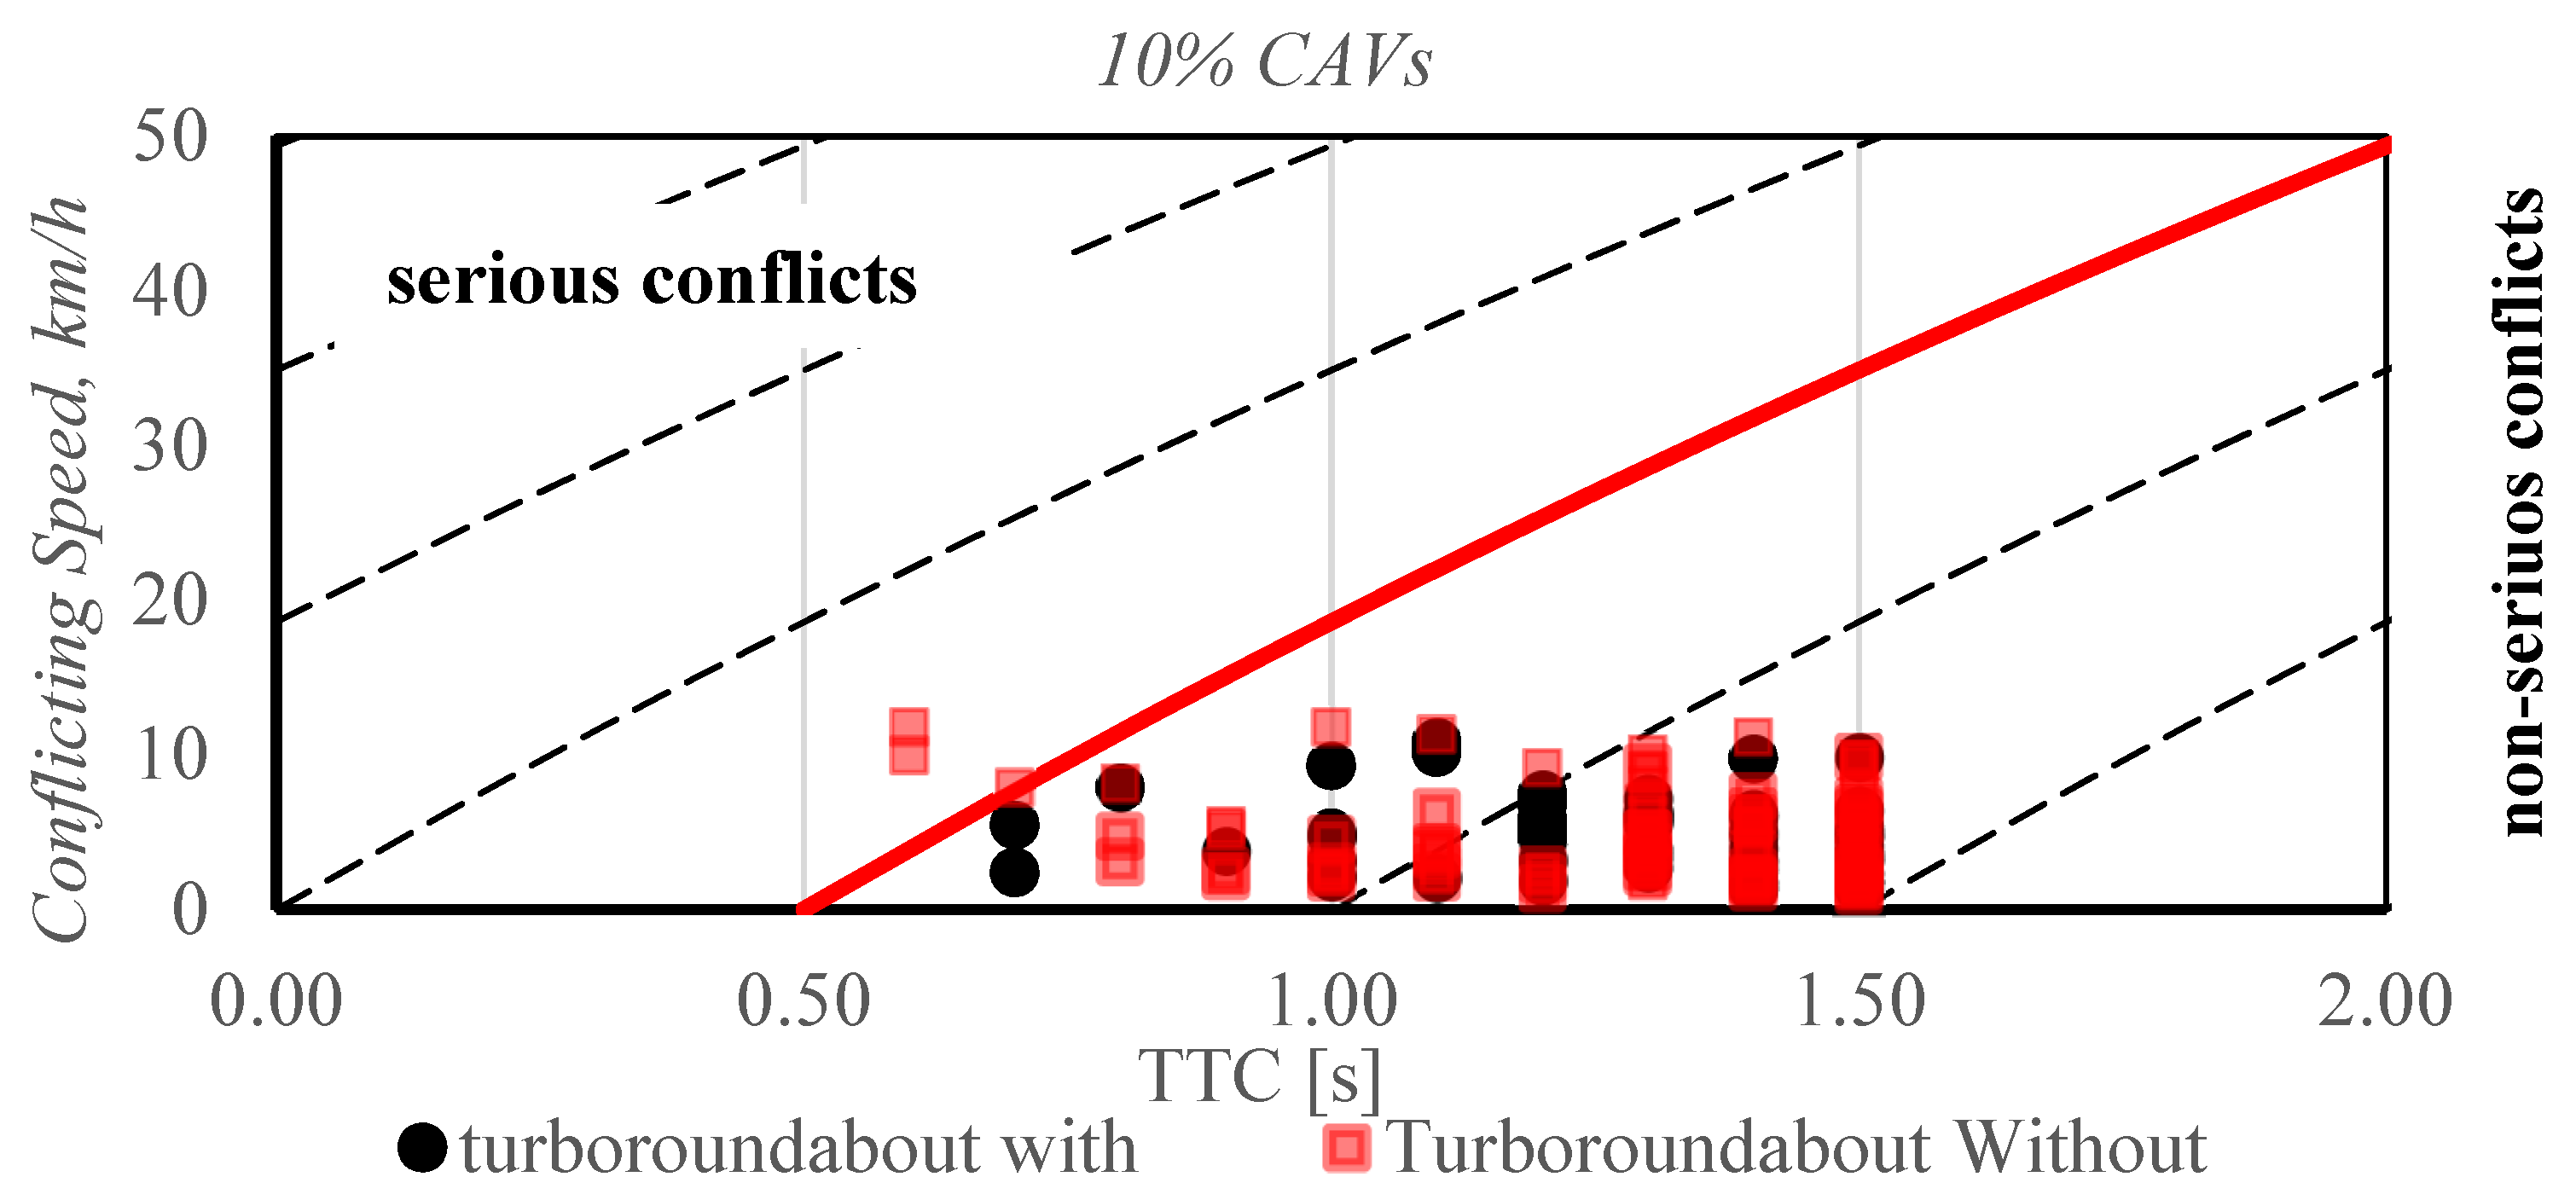
However, there are no CAVs on the road which can ensure an appropriate validation of models where a traffic mix with CAVs is considered. It should be noted that the calibration of VISSIM under traffic conditions, incorporating CAVs, must be considered as a simplified representation of the real behavioral model, since the calibration process should be based on detailed information including interaction between drivers and autonomous vehicles. However, the use of CAVs is far from being effective to date although the needs of green booster within mobility issue [32], neither data collected in the field, nor crash data involving CAVs can be used. In spite of the specific findings obtained, it is reasonable to claim that in the future, when the CAVs will increase, the presence of internal traffic separations would be not significant in terms of potential traffic conflict. Instead, it should be paid attention to the circumstance of more serious conflict due to the absence of curb settings, given by the concurrent combination of lower TTC and higher MAXs associated to the increasing of CAVs percentage.
According to the need for new solutions supporting analysis of CAVs into the traffic mix as also examined by [33], the results from this case study confirm that the analysis through surrogate measures of safety is a preferential means of comparing the safety performance of road entities.
Author Contributions
The authors confirm contribution to the paper as follows: study conception and design: T.G., A.G.; data collection: S.T.; analysis and interpretation of results: T.G., A.G., S.T.; draft manuscript preparation: A.G., T.G., S.T. All authors have read and agreed to the published version of the manuscript.
Funding
This research received no external funding.
Institutional Review Board Statement
Not applicable.
Informed Consent Statement
Not applicable.
Data Availability Statement
The datasets generated for this study are available on kind request to the corresponding author.
Conflicts of Interest
The authors declare no conflict of interest.
References
- Fortuijn, L.G.H. Turbo roundabouts: Design principles and safety performance. Transp. Res. Rec. 2009, 2096, 16–24. [Google Scholar] [CrossRef]
- Tollazzi, T. Alternative Types of Roundabouts: An Informational Guide; Springer, International Publishing: New York, NY, USA, 2015. [Google Scholar]
- Kieć, M.; Ambros, J.; Bąk, R.; Gogolín, O. Evaluation of safety effect of turbo-roundabout lane dividers using floating car data and video observation. Accid. Anal. Prev. 2019, 1251, 302–310. [Google Scholar] [CrossRef] [PubMed]
- Giuffrè, O.; Granà, A.; Tumminello, M.L.; Giuffrè, T.; Trubia, S.; Sferlazza, A.; Rencelj, M. Evaluation of roundabout safety performance through surrogate safety measures from microsimulation. J. Adv. Transp. 2018, 1–14. [Google Scholar] [CrossRef]
- Giuffrè, O.; Granà, A.; Marino, S.; Galatioto, F. Microsimulation-based passenger car equivalents for heavy vehicles driving turbo-roundabouts. Transportation 2016, 31, 295–303. [Google Scholar] [CrossRef] [Green Version]
- Saulino, G.; Persaud, B.; Bassani, M. Calibration and application of crash prediction models for safety assessment of roundabouts based on simulated conflicts. In Proceedings of the 94th Annual Meeting TRB, Washington, DC, USA, 11–15 January 2015. [Google Scholar]
- Tibljaš, A.D.; Giuffrè, T.; Surdonja, S.; Trubia, S. Introduction of autonomous vehicles: Roundabouts design and safety performance evaluation. Sustainability 2018, 10, 1–14. [Google Scholar]
- Michałowska, M.; Ogłoziński, M. Autonomous vehicles and road safety. Commun. Comput. Inf. Sci. 2017, 715, 191–202. [Google Scholar]
- Gettman, D.; Pu, L.; Sayed, T.; Shelby, S.G. Surrogate safety assessment model and validation: Final Report; Georgetown Pike (US) Report FHWA HRT 08–051; Federal Highway Administration: Washington, DC, 2008. [Google Scholar]
- Cunto, F.; Saccomanno, F.F. Calibration and validation of simulated vehicle safety performance at signalized intersections. Accid. Anal. Prev. 2008, 40, 1171–1179. [Google Scholar] [CrossRef]
- Tarko, A. Surrogate Measures of Safety. Lord, D. and Washington, S. Safe Mobility: Challenges, Methodology and Solutions; Emerald Publishing Limited: Bingley, UK, 2018; pp. 383–405. [Google Scholar]
- Sayed, T.; Brown, G.; Naveen, F. Simulation of traffic conflicts at unsignalized intersections with TCS-Sim. Accid. Anal. Prev. 1994, 26, 593–607. [Google Scholar] [CrossRef]
- Guerrieri, M.; Mauro, R.; Tollazzi, T. Turbo-roundabout: Case study of driver behaviour and kinematic parameters of light and heavy vehicles. J. Trans. Eng. Part A Syst. 2019, 145. [Google Scholar] [CrossRef]
- Cuenca, L.G.; Puertas, E.; Andrés, J.F.; Aliane, N. Autonomous driving in roundabout maneuvers using reinforcement learning with Q-Learning. Electronics 2019, 8, 1536. [Google Scholar] [CrossRef] [Green Version]
- Giuffrè, O.; Granà, A.; Tumminello, M.L.; Giuffrè, T.; Trubia, S. Surrogate measures of safety at roundabouts in AIMSUN and VISSIM environment. Lect. Notes Netw. Syst. 2019, 52, 53–64. [Google Scholar]
- Tollazzi, T.; Sraml, M.; Lerher, T. Roundabout arm capacity determined by microsimulation and discrete functions technique. Promet Traffic Trans. 2008, 20, 291–300. [Google Scholar]
- Krivda, V.; Petru, J.; Macha, D.; Plocova, K.; Fibich, D. An analysis of traffic conflicts as a tool for sustainable road transport. Sustainability 2020, 12, 7198. [Google Scholar] [CrossRef]
- Petru, J.; Krivda, V. An analysis of turbo-roundabouts from the perspective of sustainability of road transport. Sustainability 2021, 13, 2119. [Google Scholar] [CrossRef]
- Ministry of Transport, Public Works and Water management Partners for Roads. Roundabouts: Application and design. A Practical Manual. 2009. Available online: https://core.ac.uk/download/pdf/30821772.pdf (accessed on 2 June 2021).
- Giuffre’, O.; Grana’, A.; Giuffre’, T.; Acuto, F.; Tumminello, M.L. Estimating pollutant emissions based on speed profiles at urban roundabouts: A pilot study. In Smart and Green Solut. Transp. Syst.; Sierpiński, G., Ed.; Springer: Berlin/Heidelberg, Germany, 2020; pp. 184–200. [Google Scholar]
- Stutts, J.; Feaganes, J.; Rodgman, E.; Reinfurt, D. The causes and consequences of distraction in everyday driving. Annu Proc Assoc Adv Automot Med. 2003, 47, 235–251. [Google Scholar] [PubMed]
- Zwerling, C.; Peek-Asa, C.; Whitten, P.S.; Choi, S.-W.; Sprince, N.L.; Jones, M.P. Fatal motor vehicle crashes in rural and urban areas: Decomposing rates into contributing factors. Inj. Prev. 2005, 11, 24–28. [Google Scholar] [CrossRef]
- Distracted Driving 2015. NHTSA’s National Center for Statistics and Analysis. 2017. Available online: https://crashstats.nhtsa.dot.gov/Api/Public/ViewPublication/812381 (accessed on 2 June 2021).
- Giuffrè, O.; Granà, A.; Tumminello, M.; Sferlazza, A. Calibrating a microscopic traffic simulation model for roundabouts using genetic algorithms. J. Intell. Fuzzy Syst. 2018, 35, 1791–1806. [Google Scholar] [CrossRef]
- Barceló, J. Fundamentals of Traffic Simulation; Springer: London, UK, 2010; Volume 145, p. 442. [Google Scholar] [CrossRef]
- Feldman, O. The GEH Measure and Quality of The Highway Assignment Models. In Proceedings of the Association for European Transport and Contributors European Transport Conference 2012, Glasgow, Scotland, 8–10 October 2012; p. 18. [Google Scholar]
- Durrani, U.; Lee, C.; Maoh, H. Calibrating the Wiedemann’s vehicle-following model using mixed vehicle-pair interactions. Transp. Res. Part C 2016, 67, 227–242. [Google Scholar] [CrossRef]
- Menneni, S.; Sun, C.; Vortisch, P. An integrated microscopic and macroscopic calibration for psycho-physical car following models. In Proceedings of the 88th Annual Meeting of the Transportation Research Board, Washington, DC, USA, 11–15 January 2009. [Google Scholar]
- Giuffrè, T.; Trubia, S.; Canale, A.; Persaud, B. Using microsimulation to evaluate safety and operational implications of newer roundabout layouts for european road networks. Sustainability 2017, 9, 2084. [Google Scholar] [CrossRef] [Green Version]
- Segata, M.; Lo Cigno, R. Automatic emergency braking realistic analysis of car dynamics and network performance. IEEE Trans. Veh. Technol. 2013, 62, 4150–4161. [Google Scholar] [CrossRef]
- Jitesh, S. Antilock braking system (abs). Int. J. Mechan. Eng. Robotics Res. 2014, 3, 253–259. [Google Scholar]
- Chehri, A.; Mouftah, H.T. Autonomous vehicles in the sustainable cities, the beginning of a green adventure. Sustain. Cities Soc. 2019, 51. [Google Scholar] [CrossRef]
- Williams, E.; Das, V.; Fisher, A. Assessing the sustainability implications of autonomous vehicles: Recommendations for research community practice. Sustainability 2020, 12, 1902. [Google Scholar] [CrossRef] [Green Version]
Figure 1.
The sketch of the turbo-roundabout.

Figure 2.
The case study of the turbo-roundabout.

Figure 3.
Comparison of time gaps among different vehicle-following cases.

Figure 4.
Total conflicts for the turbo-roundabout with curbs.

Figure 5.
Model of the turbo-roundabout without curbs in VISSIM environment.

Figure 6.
Potential conflicts for the turbo-roundabout models with and without curbs.

Figure 7.
Linear relationship of TTC as a function of CVs and CAVs (a) share and its validation (b).
Figure 7.
Linear relationship of TTC as a function of CVs and CAVs (a) share and its validation (b).

Figure 8.
Comparison of potential conflicts for the different level of CAVs within traffic flow.


Table 1.
The turbo-roundabout cross section elements for the selected case study.
| Cross Section Elements | [m] |
|---|---|
| R1 | 18.65 |
| R2 | 22.90 |
| R3 | 24.20 |
| R4 | 28.45 |
| r1 | 18.65 |
| r2 | 22.90 |
| r3 | 24.20 |
| r4 | 28.45 |
| Bv | 4.50 |
| Bu | 4.50 |
| Bv | 3.50 |
| Bu | 3.50 |
Table 2.
Matrix of traffic flow percentages for the turbo-roundabout case study.
| O/D | A | B | C | D |
|---|---|---|---|---|
| A | 0 | 0.15 | 0.50 | 0.35 |
| B | 0.50 | 0 | 0.30 | 0.20 |
| C | 0.50 | 0.35 | 0 | 0.15 |
| D | 0.30 | 0.20 | 0.50 | 0 |
Table 3.
Default and calibrated values of the VISSIM parameters for CAVs.
| VISSIM Parameters W99 | Default Value | Calibrated Value |
|---|---|---|
| CC0 [m] | 1.50 | 1.00 |
| CC1 [s] | 0.90 | 0.50 |
| CC2 [m] | 4.00 | 1.00 |
| CC3 [s] | −8.00 | −6.00 |
| CC4 | −0.35 | −0.10 |
| CC5 | 0.35 | 0.10 |
| CC6 [m/s] | 11.44 | 1.00 |
| CC7 [m/s2] | 0.25 | 0.10 |
| CC8 [m/s2] | 3.50 | 3.00 |
| CC9 [km/h] | 1.50 | 0.50 |
| Reaction time [s] | 1.20 | 0.00 |
| Standstill distance [m] | 2.00 | 1.00 |
| Maximum waiting time [s] | 120.00 | 0.00 |
| Minimum look ahead distance [m] | 0.00 | 20.00 |
| Maximum look ahead distance [m] | 250.00 | 200.00 |
| Look back distance min [m] | 0.00 | 20.00 |
| Look back distance max [m] | 150.00 | 100.00 |
| Observed vehicles | 4.00 | 10.00 |
| Temporary lack of attention: duration [s] | 0.00 | 0.00 |
| Temporary lack of attention: probability [%] | 0.00 | 0.00 |
| Desired position at free flow | any | Middle of lane |
Table 4.
Estimation of potential conflicts for the turbo-roundabout model without curbs.
| ¼ Single Lane | ¼ Double Lane | ||
|---|---|---|---|
| crossing | 0.0 | crossing | 0.0 |
| rear-end | 35.0 | rear and | 152.0 |
| lane change | 13.0 | lane change | 7.0 |
| Total conflict | 48.0 | Total conflict | 159.0 |
Table 5.
Estimation of potential conflicts for the turbo-roundabout model with and without curbs.
| 75%CVs Plus 25%CAVs | |||||
| ½ TURBO with Curbs | ½ TURBO without Curbs | ||||
| ¼ Single-Lane | ¼ Double-Lane | ||||
| Type of Conflict | n. | Type of Conflict | n. | Type of Conflict | n. |
| crossing | 0.0 | crossing | 0.0 | crossing | 0.0 |
| rear end | 14.0 | rear end | 20.0 | rear end | 9.0 |
| lane change | 4.0 | lane change | 4.0 | lane change | 1.0 |
| Total conflict | 18.0 | Total conflict | 24.0 | Total conflict | 10.0 |
| 90%CVs Plus 10%CAVs | |||||
| ½ TURBO with Curbs | ½ TURBO without Curbs | ||||
| ¼ Single-Lane | ¼ Double-Lane | ||||
| Type of Conflict | n. | Type of Conflict | n. | Type of Conflict | n. |
| crossing | 0.0 | crossing | 0.0 | crossing | 0.0 |
| rear end | 27.0 | rear end | 28.0 | rear end | 25.0 |
| lane change | 3.0 | lane change | 7.0 | lane change | 1.0 |
| Total conflict | 30.0 | Total conflict | 35.0 | Total conflict | 26.0 |
Publisher’s Note: MDPI stays neutral with regard to jurisdictional claims in published maps and institutional affiliations. |
© 2021 by the authors. Licensee MDPI, Basel, Switzerland. This article is an open access article distributed under the terms and conditions of the Creative Commons Attribution (CC BY) license (https://creativecommons.org/licenses/by/4.0/).
Share and Cite
MDPI and ACS Style
Giuffrè, T.; Granà, A.; Trubia, S. Safety Evaluation of Turbo-Roundabouts with and without Internal Traffic Separations Considering Autonomous Vehicles Operation. Sustainability 2021, 13, 8810. https://doi.org/10.3390/su13168810
AMA Style
Giuffrè T, Granà A, Trubia S. Safety Evaluation of Turbo-Roundabouts with and without Internal Traffic Separations Considering Autonomous Vehicles Operation. Sustainability. 2021; 13(16):8810. https://doi.org/10.3390/su13168810
Chicago/Turabian StyleGiuffrè, Tullio, Anna Granà, and Salvatore Trubia. 2021. "Safety Evaluation of Turbo-Roundabouts with and without Internal Traffic Separations Considering Autonomous Vehicles Operation" Sustainability 13, no. 16: 8810. https://doi.org/10.3390/su13168810
Note that from the first issue of 2016, this journal uses article numbers instead of page numbers. See further details here.