Article

Biodegradable Material for Oyster Reef Restoration: First-Year Performance and Biogeochemical Considerations in a Coastal Lagoon

1
Aquatic Biogeochemistry Lab, Department of Biology, University of Central Florida, 4000 Central Florida Blvd., Bldg. 20, BIO 301, Orlando, FL 32816, USA
2
Coastal and Estuarine Ecology Lab, Department of Biology, University of Central Florida, 4000 Central Florida Blvd., Bldg. 20, BIO 301, Orlando, FL 32816, USA
3
School of Oceanography, University of Washington, 1503 NE Boat St., Seattle, WA 98195, USA
*
Author to whom correspondence should be addressed.
Sustainability 2021, 13(13), 7415; https://doi.org/10.3390/su13137415
Submission received: 4 June 2021 / Revised: 23 June 2021 / Accepted: 24 June 2021 / Published: 2 July 2021

Abstract

:
Oyster reef restoration efforts increasingly consider not only oyster recruitment, but also the recovery of ecological functions and the prevention of deploying harmful plastics. This study investigated the efficacy of a biodegradable plastic-alternative, BESE-elements®, in supporting oyster reef restoration in east-central Florida (USA) with consideration for how this material also influences biogeochemistry. Four experiments (two laboratory, two field-based) were conducted to evaluate the ability of BESE to serve as a microbial substrate, release nutrients, support oyster recruitment and the development of sediment biogeochemical properties on restored reefs, and degrade under field conditions. The results indicated BESE is as successful as traditional plastic in supporting initial reef development. In the lab, BESE accelerated short-term (10-day) sediment respiration rates 14-fold and released dissolved organic carbon, soluble reactive phosphorus, and nitrate to the surface water (71,156, 1980, and 87% increase, respectively) relative to without BESE, but these effects did not translate into measurable changes in reef sediment nutrient pools under field conditions. BESE lost 7–12% mass in the first year, resulting in a half-life of 4.4–6.7 years. Restoration practitioners should evaluate the biogeochemical properties of biodegradable materials prior to large-scale deployment and consider the fate of the restoration effort once the material degrades.

1. Introduction

Oysters have economic significance not only as a harvestable food source, but also a keystone species and ecosystem engineer [1]. The reef structures generated from oyster colonies within the intertidal and subtidal zones of estuaries provide a habitat for decapods, fishes, and bivalves, thus contributing to the value and influence of oysters (e.g., [1,2]). Moreover, oyster reefs attenuate wave energy to reduce shoreline erosion, improve water clarity by removing suspended particulates, promote denitrification, and support nutrient cycling and storage in the sediments [3,4,5,6,7].
Today, over 85% of shellfish reefs have been lost globally [8], leading to a variety of restoration efforts that often target the local cause of the population decline. For example, in locations where overharvesting is the primary concern, loose shell has been deployed [9,10]. In areas where diseases have reduced populations, disease-resistant oysters have been introduced [1,2]. In locations, such as the east coast of central Florida, where recreational boat wakes are responsible for breaking-off and depositing live oyster above the intertidal zone, community-based restoration re-establishes intertidal elevations and secures shells in positions directly above the sediment interface to take advantage of new recruitment on footprints where historic reefs were located [3,4].
Overall, strategies and approaches to oyster reef restoration are diverse and often regionally unique. Examples include the usage of: metal-based materials, such as gabions [5,6,7] or crab traps [8], rock-based materials, such as ReefBall™, domes, or oyster castles [8,9,10,11,12], limestone materials, such as limestone marl, aggregates, cobbles, or siliceous limestone [10,12,13,14,15], natural fiber-based materials, such as jute, burlap ribbon, or coconut coir [11,16], and plastic-based materials, such as Naltex™ mesh bags or Vexar™ aquaculture mesh [4,17,18]. Many of these approaches utilize recycled oyster shells in the restoration, while others employ alternative substrates for oyster colonization or planting [19]. However, few studies compare materials to evaluate their relative success in supporting oyster restoration, nor address the potential ecological impacts of the materials themselves.
This study was conducted in a region where an industrial aquaculture material, Vexar™ extruded polyethylene (plastic) mesh has been employed to restore over 14,000 m2 of oyster reefs since 2007 (L.J. Walters, Personal Communication). With this technique, the plastic mesh is cut into 0.25 m2 pieces and recycled oyster shells from local restaurants are attached with cable ties. In addition to being economical, Vexar™ mesh successfully provides a stable base for oyster recruitment when weighted down with cement rings following the leveling of the restoration site to the proper elevation. Specifically, Walters et al. [4] documented intertidal Crassostrea virginica reefs restored with Vexar™ mats in Mosquito Lagoon FL, USA, had mean shell heights and live oyster densities equivalent to live reference reefs within 6 months, and 2 years, respectively, of restoration. Furthermore, Chambers et al. [20] documented the sediments beneath Vexar™ restored reefs rapidly developed biogeochemical properties and processes (i.e., nutrient cycling and burial) equivalent to that of live reference reefs, often within the first-year post-restoration. Recovery of avian foraging activities [21], sportfish [22], and infaunal densities [23,24] have also been documented on these reefs.
However, the field-based success of plastic-based materials such as Vexar™ are accompanied by growing concern over restoration activities facilitating the introduction of plastics into the aquatic environment, especially microplastics of <5 mm diameter (e.g., [25,26,27]). Even restoration products that are not entirely plastic-based (e.g., rock, metal, and natural fibers) are rarely able to completely exclude plastics. Rather, small amounts of plastics are still incorporated in the form of cable ties, protective coatings, or mesh bags (e.g., [8,11,28]). In 2010, an estimated 5–13 million metric tons of plastic debris entered Earth’s oceans [29]; this included both primary (those produced at the microplastic size range) and secondary (those resulting from the solar, thermal, and mechanical breakdown of larger plastics) microplastics [30]. The ingestion of microplastics by marine and estuarine organisms at all trophic levels is well documented in hundreds of species (e.g., [27,31,32]), and may negatively impact an organism’s life history [33]. The concern that plastic-based restoration materials could serve as an additional source of secondary microplastics to the environment has prompted an international effort to explore “eco-friendly” alternative materials, and particularly biodegradable materials that naturally decompose over time. This study investigated the efficacy of one such material, Biodegradable EcoSystem Engineering Elements (BESE-elements®, Culemborg, The Netherlands), henceforth referred to simply as “BESE”.
The goal of this study was twofold: (1) to determine if biodegradable BESE material supports comparable oyster recruitment to traditional plastic material; (2) to assess the biogeochemical effects of BESE material under both laboratory and field conditions. This short-term (1 year) study was not intended to provide a comprehensive assessment of the material for long-term use, but rather serves as a compilation of targeted experiments, each with a unique research question and hypothesis (Table 1). The intent of this research is to provide initial data and ideas to the scientific community to prompt future research on the burgeoning topic of the application, and ecological implication, of biodegradable materials in coastal restoration efforts.

2. Materials and Methods

2.1. Site Description and Experimental Approach

This research was conducted to assess the efficacy of using BESE materials to restore intertidal C. virginica reefs within Mosquito Lagoon (ML), the northernmost estuary within the Indian River Lagoon (IRL) system, which stretches 251 km along the Atlantic coast of Florida, USA. Characterized as a hotspot for biodiversity and a critical component of the regional economy [34], ML is a shallow (1.7 m average depth) microtidal coastal lagoon with a long water residence time (mean water half-life ~76 days), salinities of 22.6 to 45.2 ppt, and subtropical water temperatures (typically exceeding 20 °C from March to November, with lows of 0 and 15 °C in winter [35,36]. Areal coverage of natural intertidal C. virginica reefs within ML declined 24% between 1943 and 2009 [3], primarily in popular boating areas due to boat wakes dislodging live oyster clusters and depositing shells above the intertidal zone where survival plus natural recolonization are not possible [4]. Oyster reefs situated in shallow bays and tidal creeks bordered by mangroves and salt marsh plants did not change in aerial coverage over this same time frame [37]. This loss of oyster reef habitat, coupled with declining water quality in ML, initiated a community-based restoration effort in 2007 that remains on-going.
Prior to this study, all oyster reef restoration activities in ML employed Vexar™ extruded polyethylene mesh, a material commonly employed by the aquaculture industry, as the base material for oyster reef restoration projects. Therefore, Vexar™ (henceforth referred to simply as “plastic” restoration material) was used as our experimental reference material, where applicable. Our analysis of BESE material was conducted at two scales, beginning with two controlled laboratory experiments that sought to characterize the chemical and microbial properties of the BESE material itself and how it interacts with site water and sediment, followed by two field-based experiments that sought to compare BESE material to the traditional plastic material. While all experiments are complementary, each is unique in design and statistical approach and is, therefore, described separately.

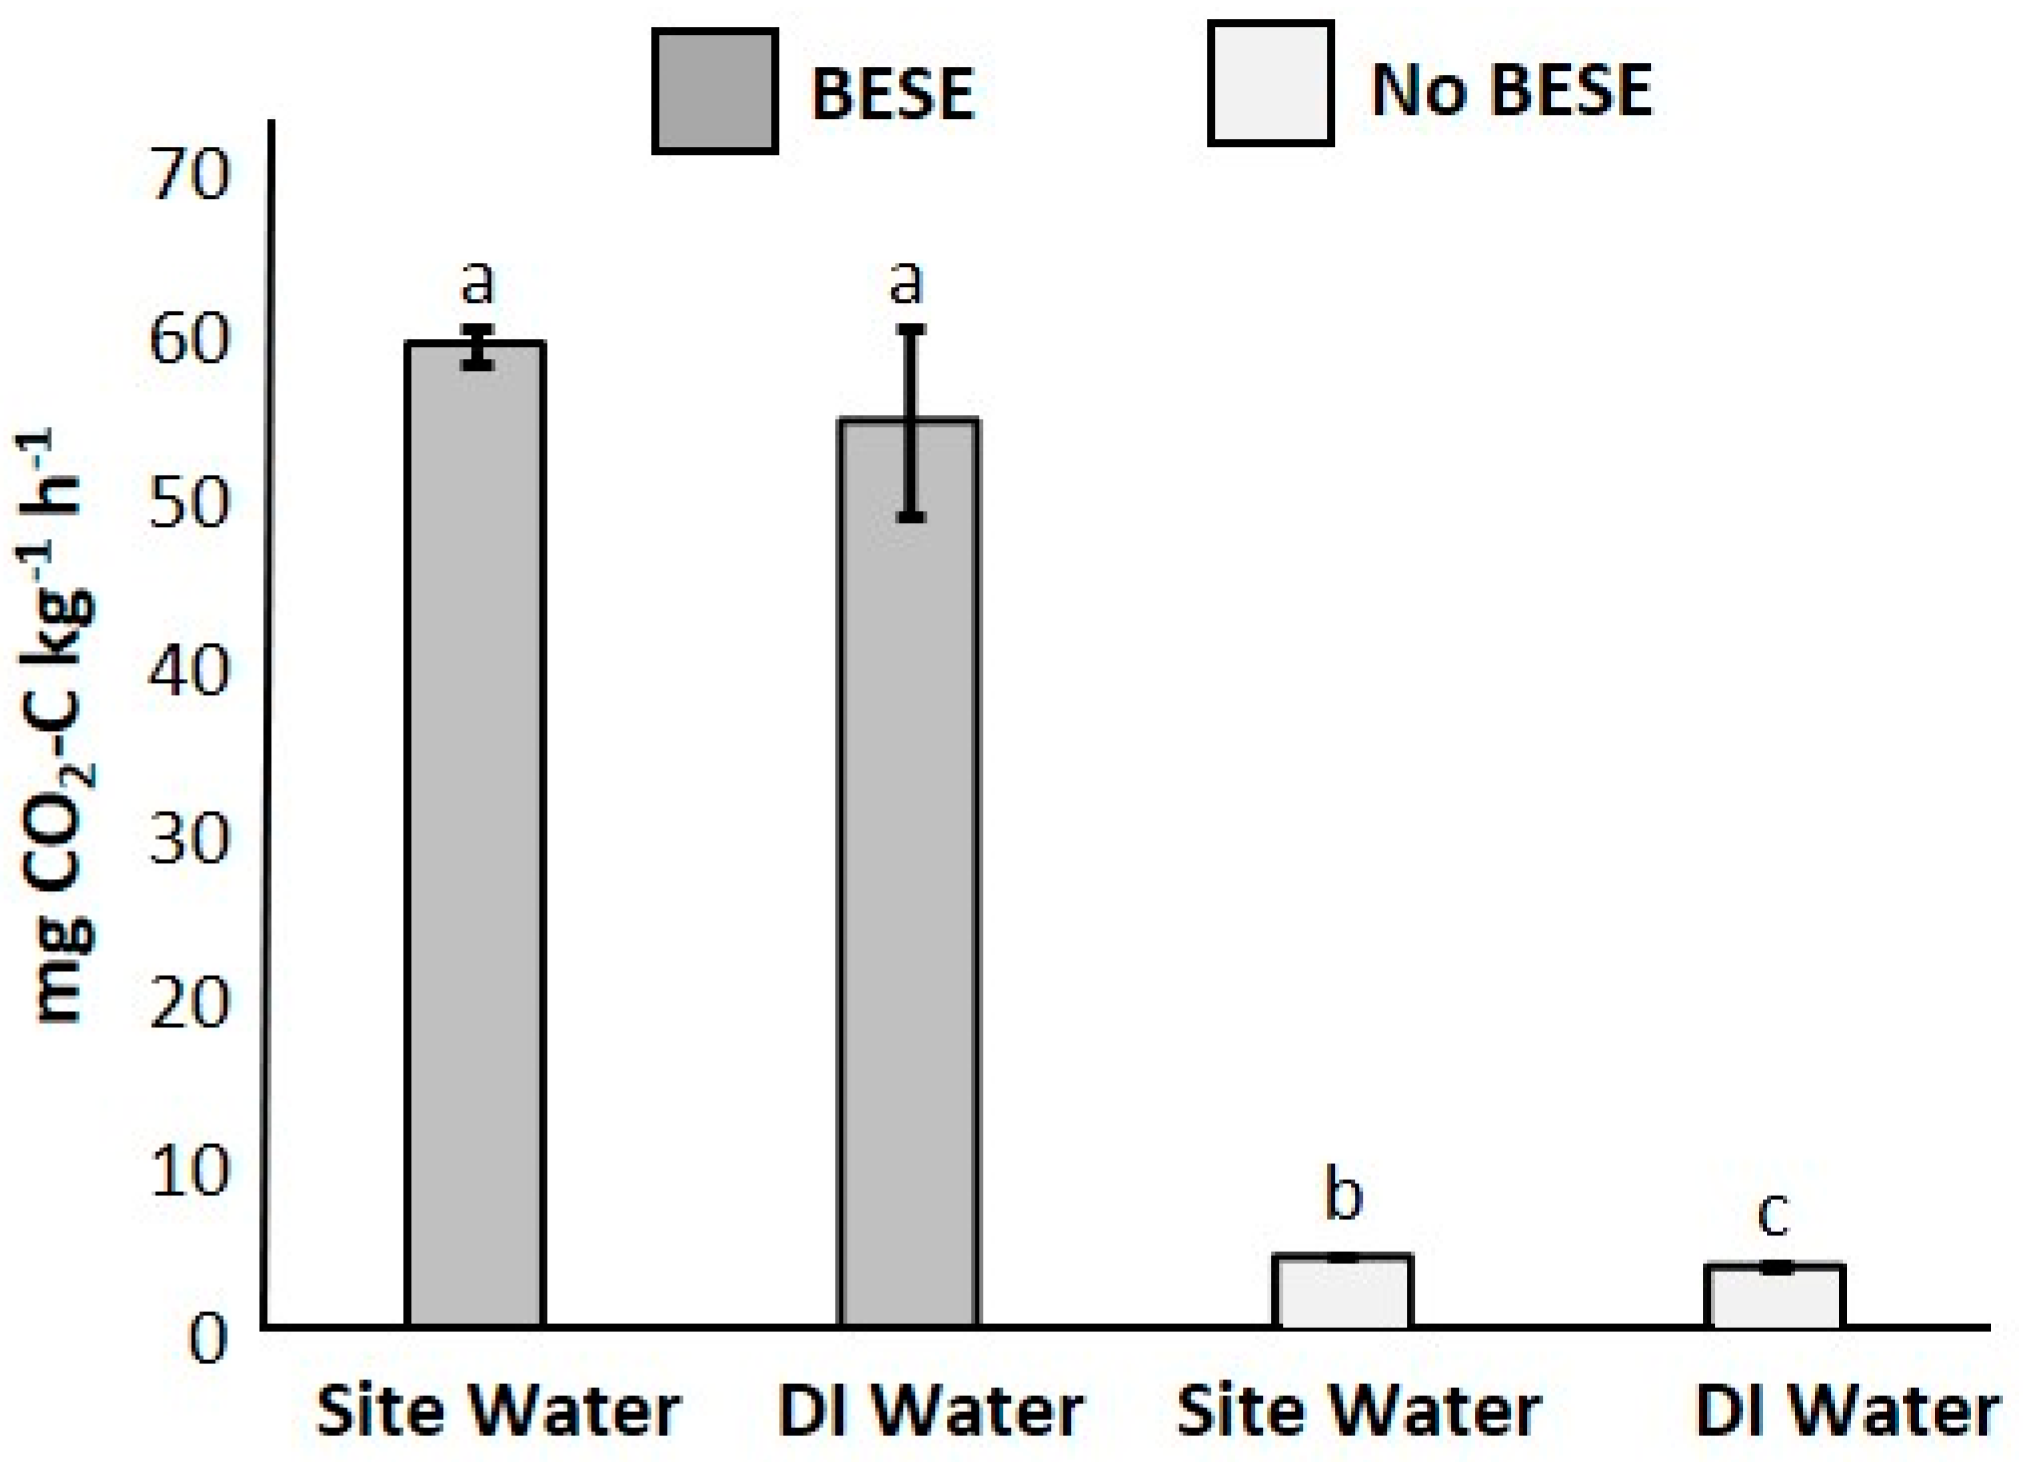
2.2. Laboratory Respiration Experiment

The ability of BESE to serve as a substrate for microbial metabolism was quantified by first characterizing the amount of organic matter (OM), total carbon (C), total nitrogen (N), and total phosphorous (P) within the material, and then by conducting a laboratory microcosm experiment to determine the impact of BESE addition on the potential respiration rate when incubated with site sediment. The quantification of the total C, N, P and OM content of BESE began by manually cutting five random samples of BESE into small fragments, followed by oven drying, ball-mill grinding, and chemical analysis, as described in Section 2.7. Ratio of total C:N:P were calculated as atomic ratios by dividing the content by the atomic weight [38].
For the microcosm experiment, approximately 1 kg (wet wt) of the top 0–5 cm of representative, non-vegetated, intertidal sediment from ML was collected in a sealed polyethylene bag in August 2020, along with 1 L of site surface water in an acid-washed Nalgene bottle. All samples were promptly stored on ice and returned to the laboratory. Water samples were analyzed for dissolved organic C (DOC), nitrite + nitrate (NO3), ammonium (NH4+) and soluble reactive P (SRP; Section 2.6). The sediment sample was homogenized by hand and a subsample analyzed for pH, OM content, and extractable NO3, NH4+ and SRP (Section 2.7).
Within 24 h of collection, 10 g of field-moist sediment was weighed into twenty 120 mL glass serum bottles. Representative BESE was uniformly fragmented into 5 mm × 3 mm sized pieces to achieve consistent surface area; 5 g of BESE was randomly added to 10 selected bottles. Bottles not containing fragmented BESE served as controls. To create an anaerobic sediment environment, all 20 bottles were capped with rubber septa and crimped aluminum seals, evacuated to −75 mmHg, then purged with 99% O2-free N2 gas for 3 min. Five of each of the 10 bottles with and without BESE material received either 20 mL of N2-purged site surface water from ML, or 20 mL of N2-purged deionized (DI) water in a 2 × 2 (BESE with/without × site water/DI water) factorial experimental design with 5 replicates. Water was injected into each bottle to create a slurry of 1:2 (of soil: water) for controlled bottles and 0.5:1:2 (of BESE: soil: water) for BESE-containing bottles. All bottles were placed on an orbital incubator shaker at 150 rpm and kept in the dark at 33 °C.
Microcosm headspace was collected after 24, 48, 72, 96, and 120 h and analyzed on a GC-2014 gas chromatograph (Shimadzu Instruments, Kyoto, Japan) to determine potential CO2 production over time. To quantify the concentration of dissolved inorganic C, soil pH was determined by creating a 1:5 slurry (of soil: DI water) and measured with an Accumet XL200 benchtop pH probe (ThermoFisher Scientific, Waltham, MA, USA). The Ideal Gas Law was used to account for the effect of temperature and pressure within the microcosms, while Henry’s Law was used to estimate the amount of dissolved CO2 in the liquid phase. Potential CO2 production was standardized per g dry soil and calculated by linear regression over time with the intercept forced through zero; only R2 > 0.89 were accepted.

Statistical Approach for Respiration Experiment

The elemental composition of BESE was calculated as mean ± standard error (n = 5). All statistical analyses described for this study were performed in R (version 4.0.1) using R Studio (version 1.3.959) with an alpha value of 0.05. The respiration data were tested for the parametric assumptions of normality using the Shapiro–Wilk test and for homogeneity of variance using Levene’s test. The data violated both assumptions, even after a number of data transformations were attempted. Therefore, the untransformed data were tested for significance using the nonparametric Kruskal–Wallis test, which does not require normality or homogeneity of variances. In addition to overall comparisons, pairwise comparisons across the two water sources and with and without the presence of the BESE material were preformed to determine the robustness of these overall results.

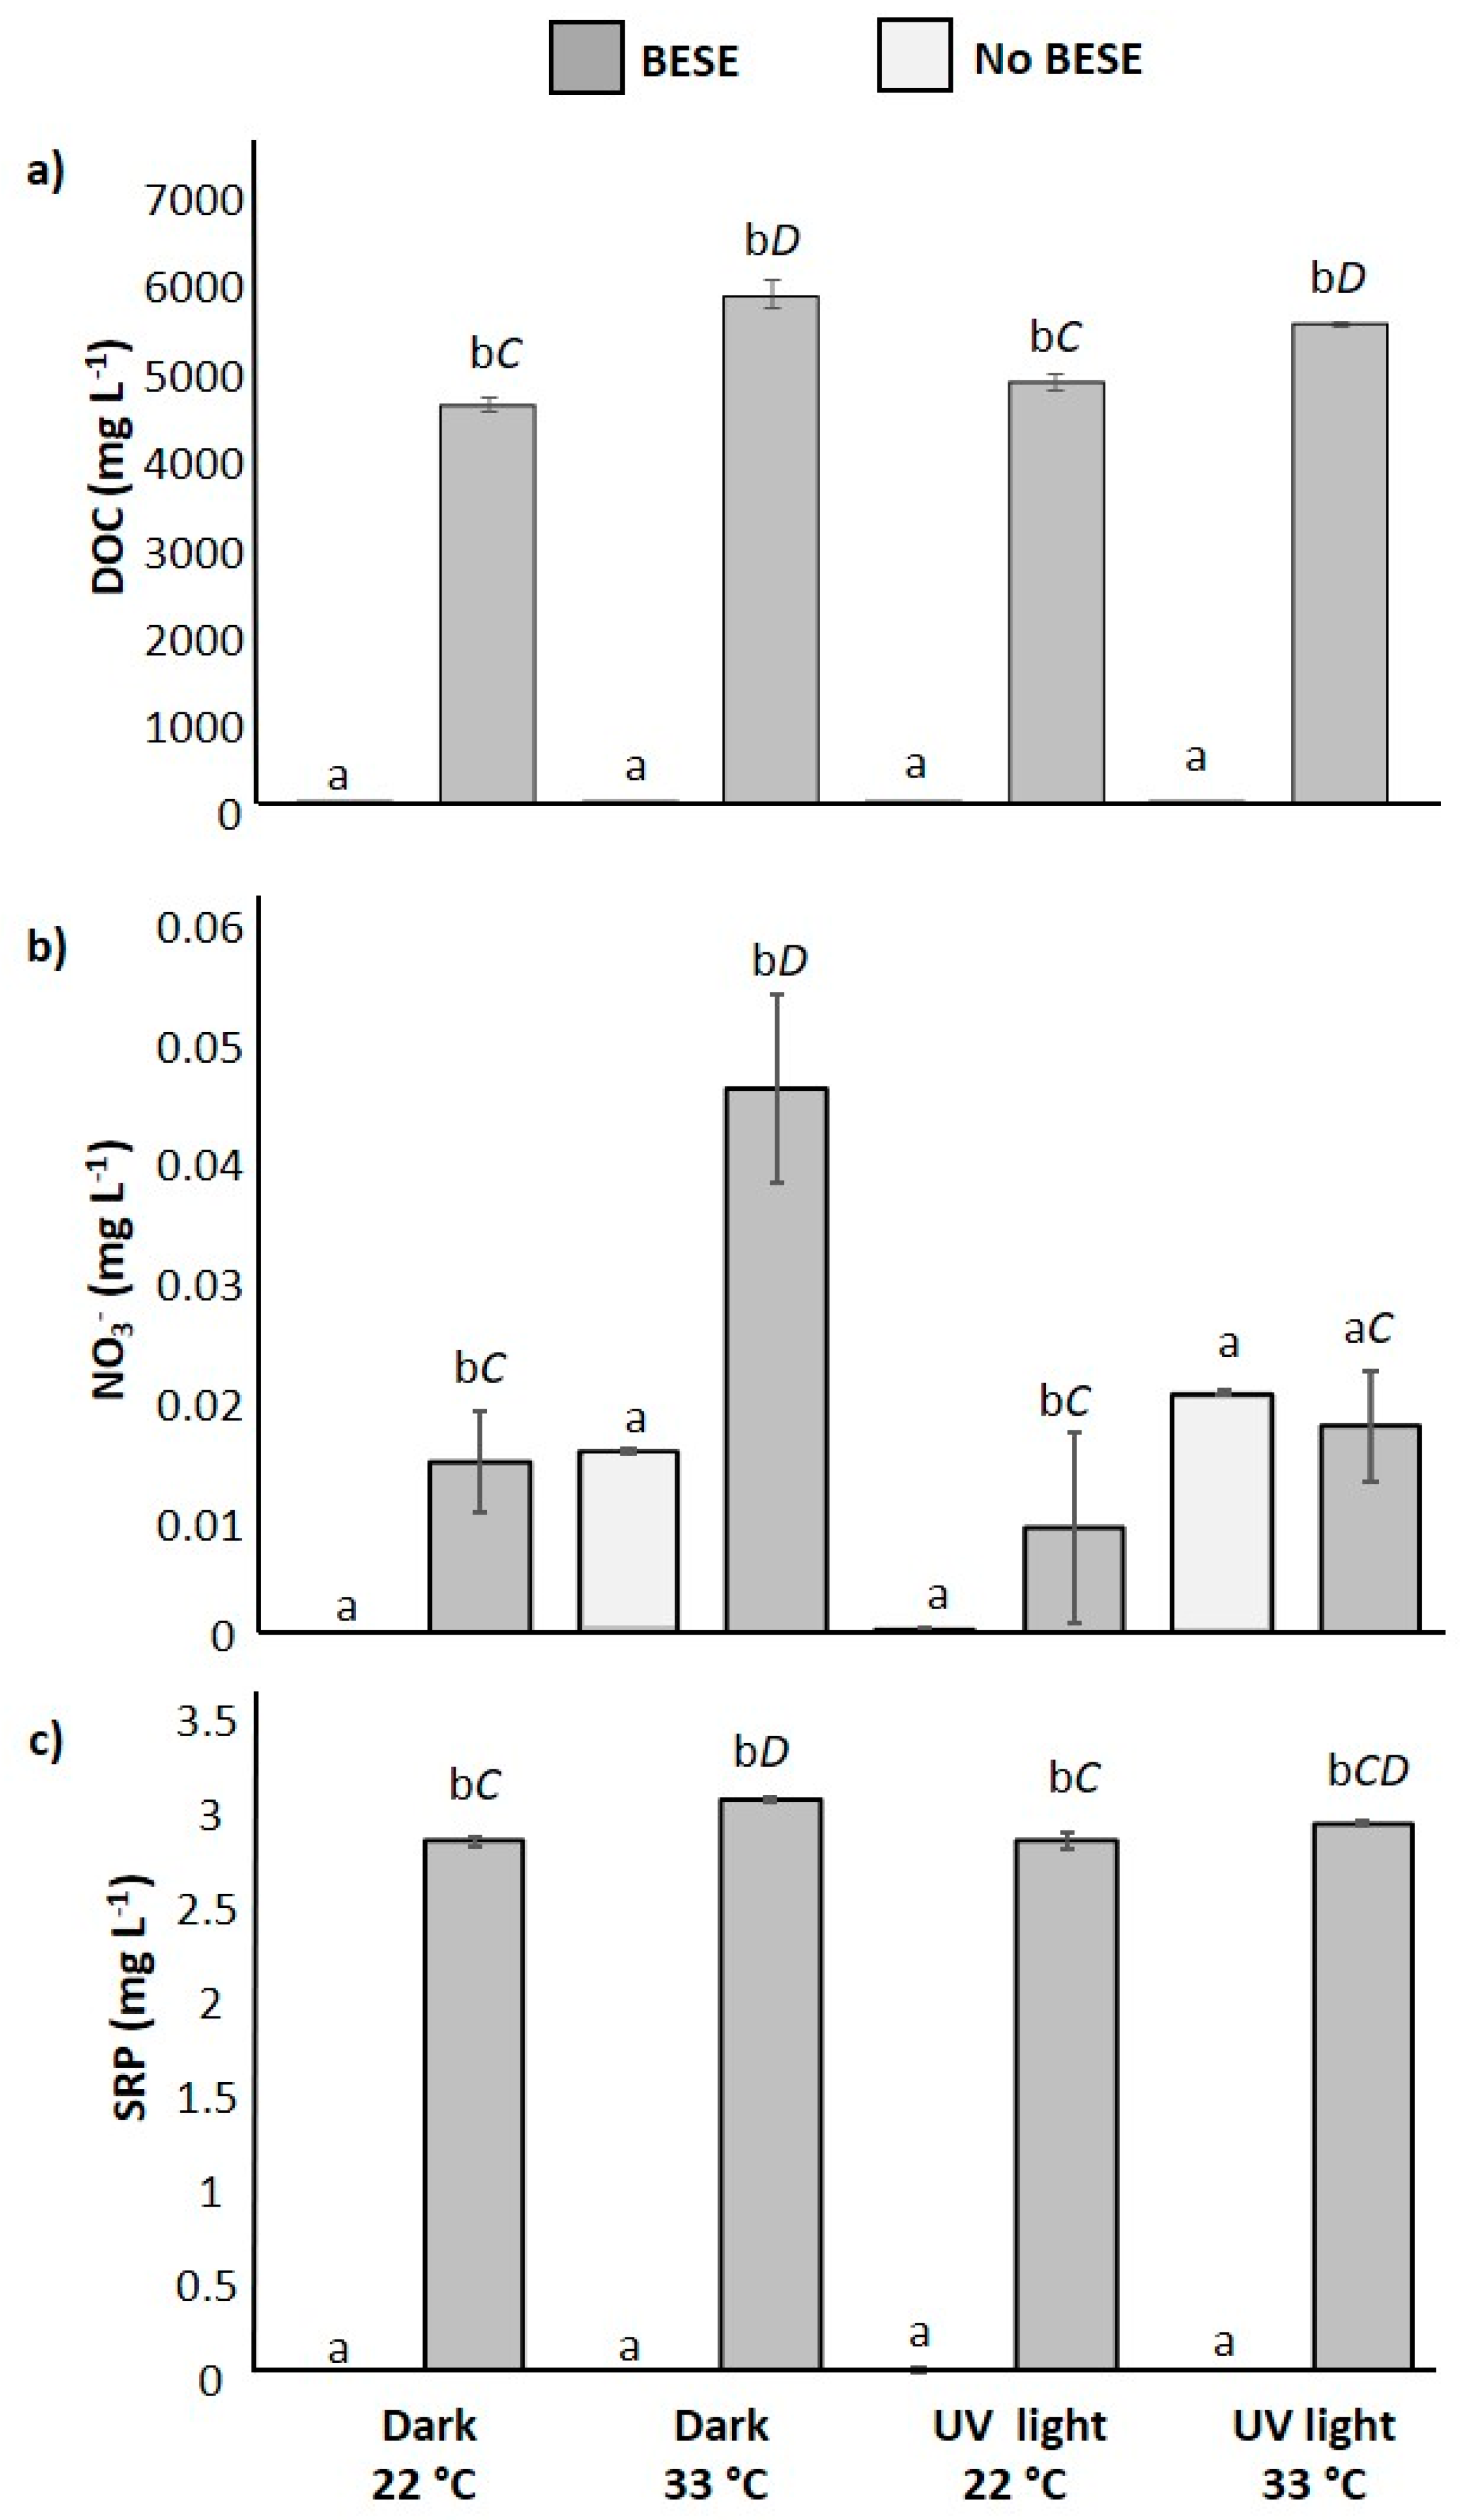
2.3. Laboratory Nutrient Release Experiment

To determine if BESE material can release inorganic N, P, or DOC under idealized laboratory conditions, forty 120 mL glass serum bottles were filled with 30 mL of filtered (0.45 µm membrane filter, as previously described) site water from ML. The pre-incubation filtered site water was analyzed for DOC, NO3, NH4+, and SRP (Section 2.6). BESE material was uniformly fragmented into 5 × 3 mm sized pieces to achieve consistent surface area for all replicate incubations. Twenty of the serum bottles contained 10 g of fragmented BESE at a 1:3 mass ratio BESE:site water. The remaining 20 bottles served as controls (site water only). All bottles were covered with a single layer of plastic wrap with three holes to allow for gas exchange and to reduce evaporation rates.
A 2 × 2 × 2 factorial design with 5 replicates each (40 total bottles) was employed: BESE/No BESE (control), summer maximum water temperature (33 °C)/room temperature (22 °C), and ultra-violet (UV) light exposure/dark. The temperature and light conditions were chosen to mimic ideal abiotic field conditions that may promote nutrient release, either by microbial mineralization and/or photolysis. All bottles were randomly assigned a treatment condition and placed on an orbital shaker at 150 rpm for 5 weeks to simulate water flow. Temperature was elevated to a mean summer maximum using the incubator feature on the shaker (New Brunswick Excella E25) and UV exposure was provided by a full spectrum daylight fluorescent lamp (Aqueon®, Franklin, WI, USA) placed 17 cm above the bottles. Bottles not receiving the UV light treatment were kept in a cardboard box covered by aluminum foil; bottles not receiving elevated temperature were kept on a shaker at ambient laboratory room temperature. At 5 weeks, all bottles were vacuum filtered through a 0.45 µm membrane filter, acidified and stored at 4 °C to be analyzed for DOC, NO3, NH4+, and SRP (Section 2.6).

Statistical Approach for Nutrient Release Experiment

Each parameter measured in the nutrient release study was examined for the parametric assumptions of normality (Shapiro–Wilk test) and homogeneity of variance (Levene’s test). Ammonium concentrations were below detection (BD) reporting limits, and, therefore, no statistics were performed. Nitrate and SRP did not meet the assumptions of normality and homogeneity of variance, even following transformation. Therefore, Kruskal–Wallis tests were performed to compare treatments (BESE/control) using the entire data set. The BESE data were then examined independently, and the parametric assumptions were met with BESE data alone. A two-way ANOVA was used to compare the impact of UV and temperature within the BESE treatment, as well as interaction effects. A Tukey post hoc test was performed to identify significant differences between conditions in the BESE treatment.

2.4. Field BACI Experimental Design

A one-year field experiment employed a Before–After–Control–Impact (BACI) design to assess (1) oyster recruitment success metrics and (2) sediment biogeochemical properties on C. virginica reefs restored with plastic vs. BESE; positive (live reference reef) and negative (dead reef) controls were also included, for four total treatment conditions). The study design was chosen to leverage planned restoration projects within ML during the summer of 2019 to maximize external validity and transferability to real-world restoration efforts. As such, site selection was limited by the geographic distribution of restorable dead reefs and permitting guidelines. Under these constraints, two regions of ML were selected that were separated by 3.8 km, a northern (N; 28°58′8.71″ N, 80°52′52.13″ W), and southern (S; 28°56′19.87″ N, 80°51′41.44″ W) region. In each region, two comparable dead reefs (14–25 m2), in close proximity (<80 m), were slated for restoration that year. In each region, one reef was randomly assigned to be restored with plastic and the other with BESE. Within 370 m of the restoration reefs in each region, a live reference reef and a dead reef (unrestored) were also identified for study to evaluate the possible site-specific confounding environmental variables (e.g., seasonal variations in water chemistry and temperature fluctuations). The resulting design included 8 total study reefs.
All 8 study reefs were monitored for universal oyster metrics (Section 2.4.1) and sediment biogeochemical properties (Section 2.4.2) immediately before restoration. Restoration on all 4 restored reefs occurred between 12 and 19 June, 2019 and consisted of raking the loose dead shell piles down to a low intertidal height. Prior to deployment, restoration mats were prepared as follows: single-layered plastic mesh mats with a 22.2 × 22.2 mm opening surrounded by <2 mm wide plastic borders were cut into 0.25 m2 squares. Disarticulate C. virginica shell, collected from local restaurants and quarantined outside in Florida conditions for 1+ years, were zip-tied (36 per mat) to create a stable surface for spat recruitment (Figure 1a). BESE consisted of a three-dimensional structure developed by BESE-elements® (Culemborg, The Netherlands). The mats were composed of biopolymer Solanyl® and cellulose, obtained from waste from the lumber industry. Solanyl® C110 4M, manufactured by Rodenburd Biopolymers (Oosterhout, The Netherlands), is a biodegradable plastic resin, based on reclaimed side stream potato starch from the food processing industry, and is predicted to biodegrade in 10–20 years [39]. Each BESE sheet measured 922 × 455 × 20 mm and can be layered and snapped together to create a multi-layered mat. For this study, double-layered squares (461 × 455 × 40 mm) were employed (Figure 1b) after the original sheets were cut in half with a circular table saw and snapped together. As with the plastic, 36 disarticulate C. virginica shells were zip-tied to the BESE. At the time of restoration, restoration mats (plastic or BESE) were deployed over the leveled reef and secured to cement rings (~weight: 2.5 kg) designed for irrigation systems (Figure 1c,d). The post-restoration monitoring of reefs restored with plastic, BESE, and all positive and negative control reefs occurred at 1, 6, and 12 months after restoration, with the timing based on previous studies, which have demonstrated a treatment effect within this time period [40].

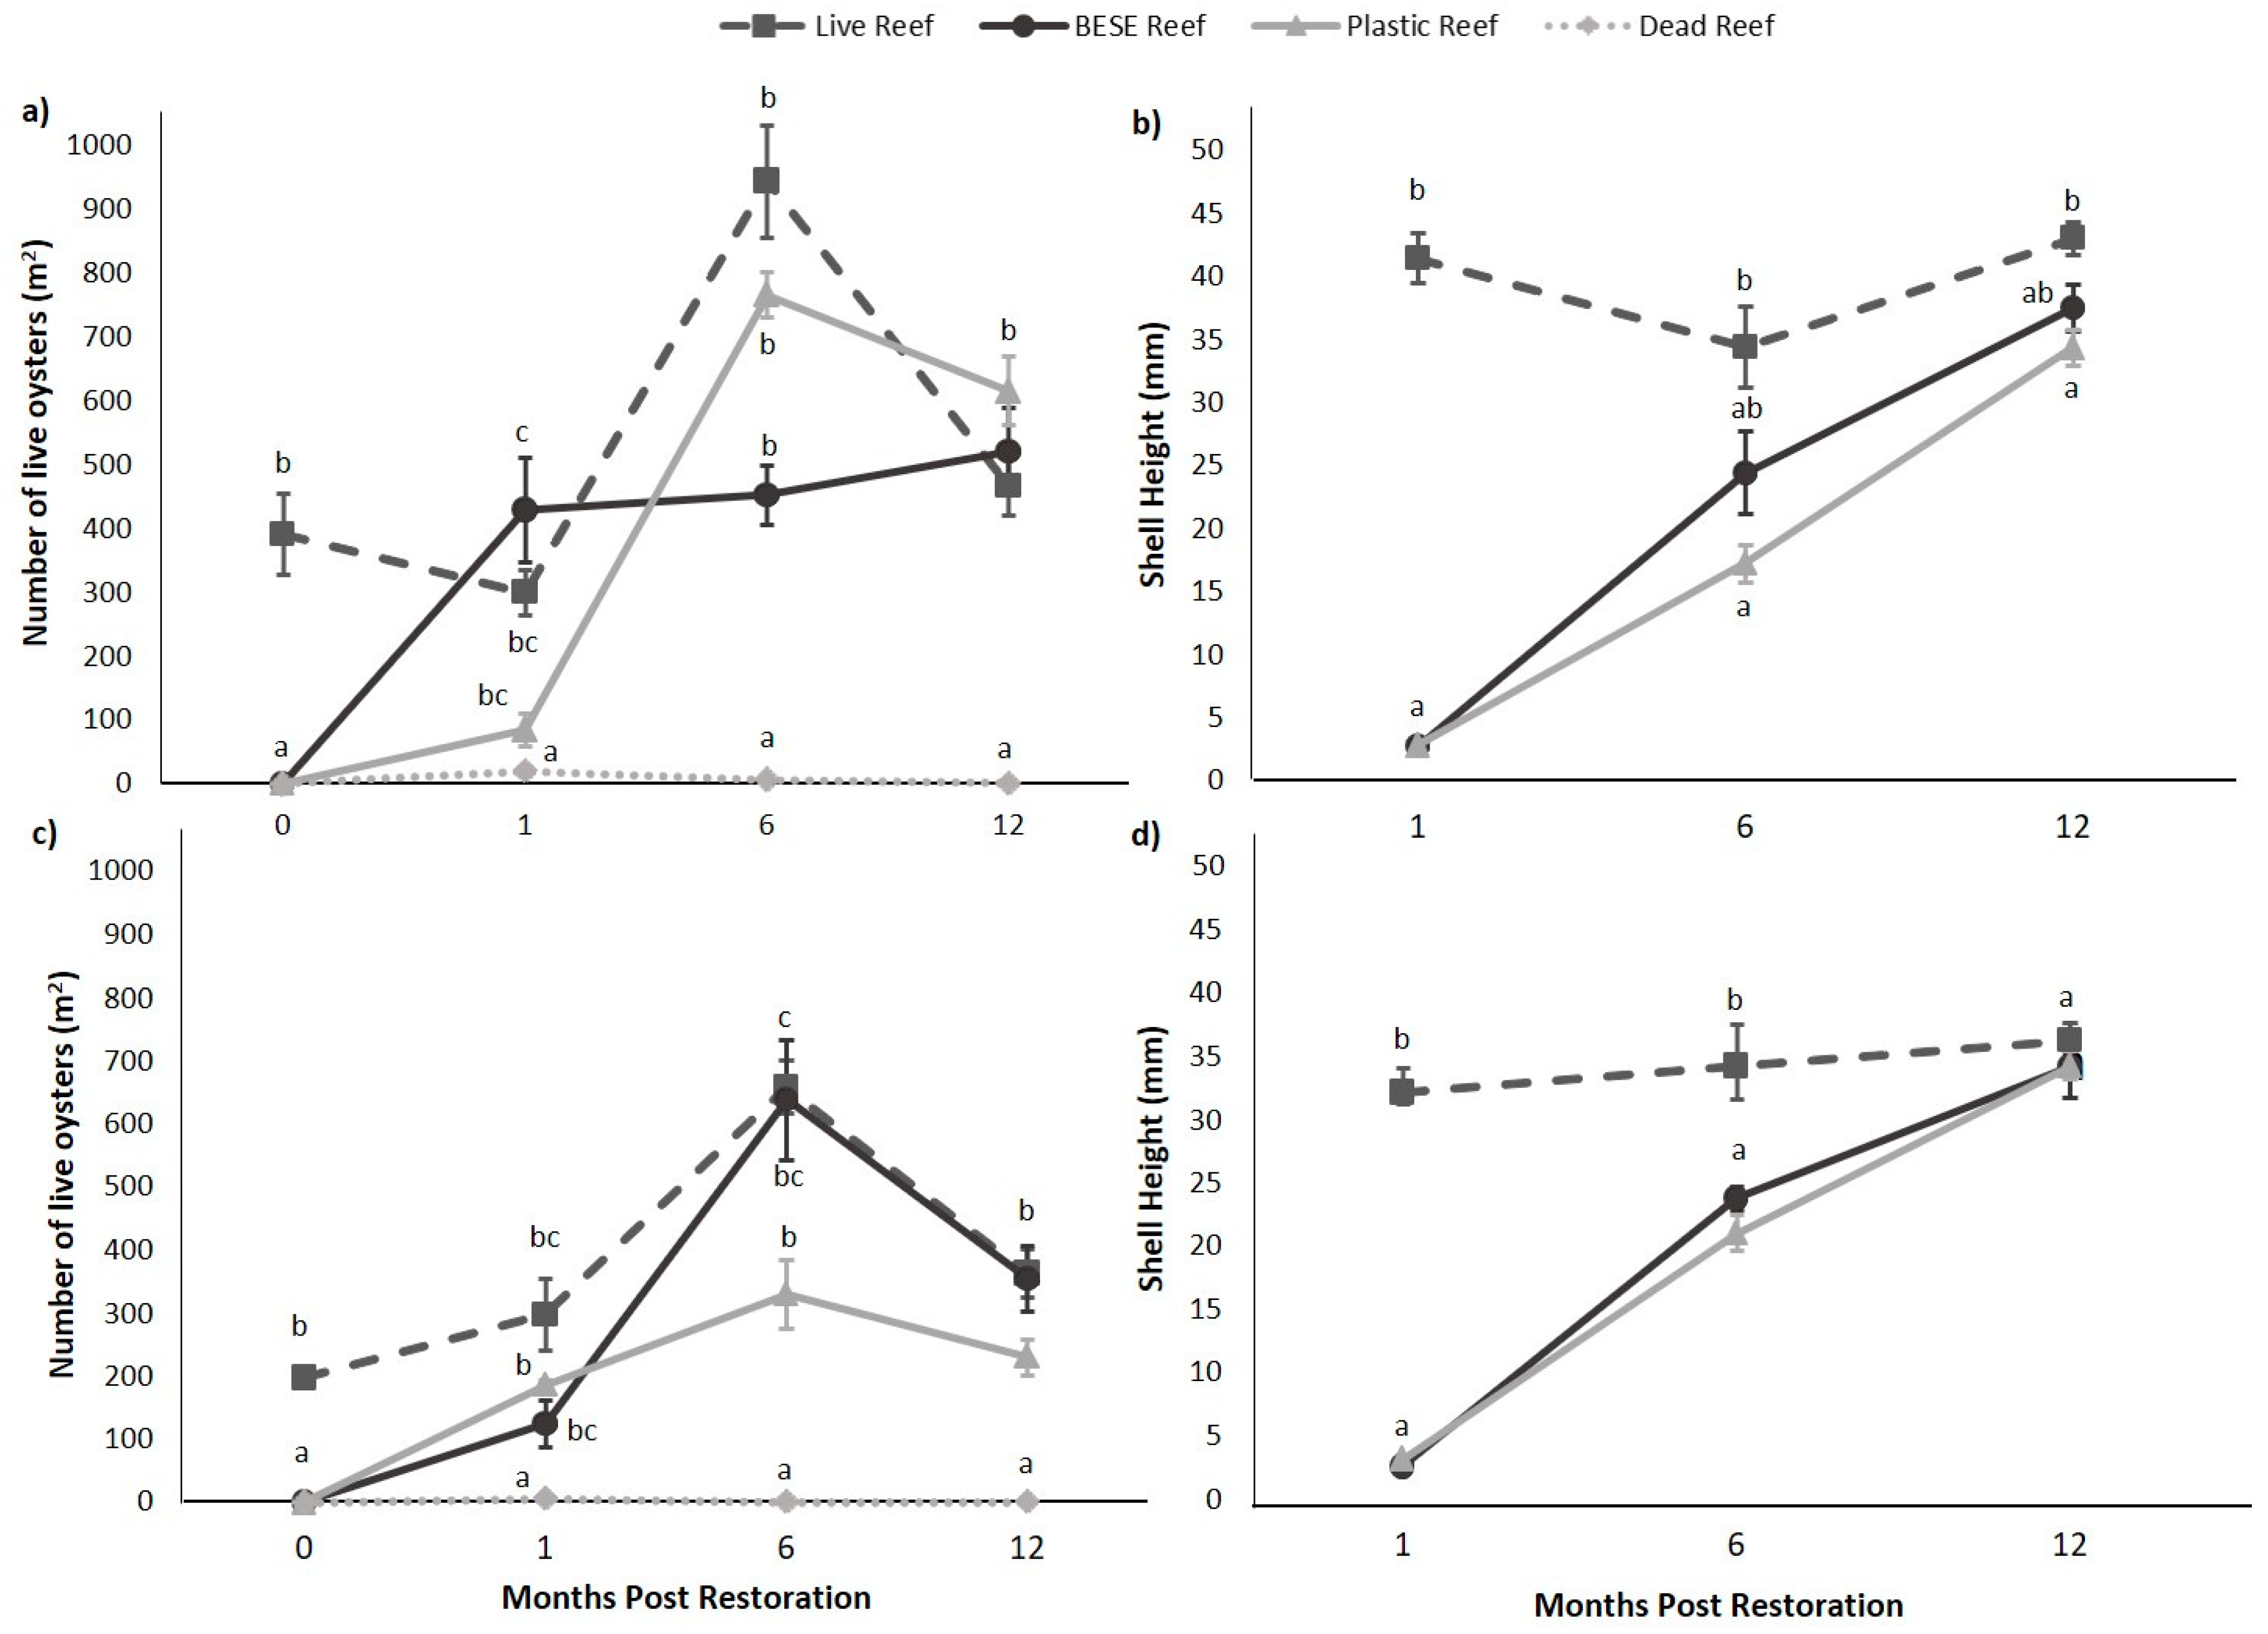
2.4.1. Field BACI Experiment—Oyster Monitoring

Oyster reef condition was assessed on all reefs with two metrics: live oyster density and shell height at 0-, 1-, 6-, and 12-months post-restoration. Oyster monitoring plots and sediment core collection (described below, Section 2.4.2) were always co-located, which was ensured by marking coring locations with flagging and returning to collect oyster monitoring data immediately after sediment collection by a separate set of scientists. For live oyster density measures, the number of all live oysters were counted on 5 oyster mats and averaged per reef. Reefs were randomly selected on each sampling date. On reference reefs, oyster density was always counted at a similar number of sites where haphazardly thrown 0.25 m2 quadrats landed. Shell heights were measured with calipers/rulers for the first 50 oysters in each of the 5 quadrats per reef and were averaged per reef for all treatments (Walters et al. 2021).

Statistical Approach for Oyster Monitoring

The 0-, 1-, 6-, and 12-month post-restoration live oyster density and shell height data were evaluated at each time point for the parametric assumptions of homogeneity of variance and normality using Levene’s test and the Shapiro–Wilk test. Oyster density data violated both assumptions due to abundant zeros within the dataset (i.e., dead reefs). Therefore, a zero-inflated negative binomial general linear model (function “zeroinfl” from the pscl package, version v.1.5.5) was selected as the best fit. The shell height data met the parametric assumptions, and a two-way ANOVA was used to compare differences and interaction effects between treatment and region. Tukey HSD post hoc tests were used to examine significant differences among the treatments within each region for both datasets.

2.4.2. Field BACI Experiment—Sediment Biogeochemistry

For each sediment sampling, five 0–5 cm sediment cores were collected at haphazardly chosen locations on each of the 8 study reefs within the intertidal zone, serving as within-reef replicates. All samples were collected during daily low-tide events (±3 h) to ensure the reef, mats, and sediment were completely exposed to reduce water interference and sediment resuspension during the coring process. The push core method was employed, hammering a beveled 7 cm diameter polycarbonate tube into the sediment using a rubber mallet and wooden board. Prior to coring at each point, sizable pieces of shell (> 2 cm diameter) that interfered with entry of the coring tube were carefully removed from the surface. New coring locations were chosen for each sampling.
Sediment cores were field extruded, placed into sealed polyethylene bags, and stored on ice during transport back to the lab. At each reef, one surface water sample was collected from the top 10 cm of the water column within 2–4 m alongside the reef in 250 mL acid-washed Nalgene bottles and promptly stored on ice. A handheld sonde (ProDSS; YSI Inc., Yellow Springs, OH, USA) was used to record surface water temperature (°C), pH, dissolved oxygen (DO) (mg L−1 and %), salinity (ppt), and conductivity (µS cm−1) at 10 cm water depth within 2–4 m alongside the reef. Upon return to the lab the same day, all samples were transferred to a 4 °C refrigerator and preparation for analysis began. Surface water samples were analyzed for DOC, NO3, NH4+ and SRP, as described in Section 2.6. Sediments were analyzed for dry bulk density (DBD), OM content, total C, total N, total P and extractable DOC, NO3, NH4+ and SRP, as described in Section 2.7, below.

Statistical Approach for Sediment Biogeochemistry

Linear mixed effects modeling (lme) was used with the lmer function (lme4 package, version 1.1–23) to assess treatment, month (time), the interaction effect of treatment:month, and the random variable of reef, after Locher et al. [40]. Pairwise comparisons were used to compare treatments at each time point. The assumption of normality was assessed by visually inspecting QQ plots and residuals, while the homogeneity of variances was assessed using Levene’s test. All sediment biogeochemical data sets were natural log transformed to meet the assumption of normality, while a +1 transformation was also added to the total N and extractable NO3, NH4+ and SRP data prior to transformation to account for values below the analytical detection limit.

2.5. Field BESE Degradation Experiment

To quantify the short-term degradability of BESE material on oyster reefs in ML, a 2 × 2 × 2 factorial design with 5 replicates each was employed. Specifically, mass loss of the two restoration materials (plastic, BESE) were compared at two time points (6 and 12 months of field deployment) and in two regions (N and S), for a total of 40 experimental units. This was achieved by leveraging a common “litter bag” technique (e.g., Ho and Chambers, 2020) in which a known mass of each material (~5 g) is placed in a fiberglass mesh bag (8 × 15 cm with 1 mm mesh), along with a unique stainless-steel identification tag, and securely sewn-closed. Coarse fragmentation of the plastic and BESE material was required to fit it into the litter bags and was done in a uniform manner. Specifically, plastic-containing litter bags (n = 20) included 3 large rectangular pieces (6 × 6 cm) and 2 small pieces (~2.5 × 2 cm). BESE-containing litter bags (n = 20) included: 2 large rectangular pieces (5 × 3.5 cm) and 4 irregularly shaped medium-sized pieces (~4.5 × 3 cm) (4 × 3 cm) (3.5 × 3.5 cm) (4 × 2 cm).
To ensure identical field conditions for treatments, all litter bags were deployed in pairs, with 2 plastic-containing and 2 BESE-containing bags secured together, so 2 of each treatment could be collected at 6 and 12 months. Half of the bags were placed on a live reference reef in the N region of ML (28°57′07.2″ N, 80°52′18.5″ W) and the other half on a live reference reef in the S region (28°56′15.0″ N, 80°51′41.3″ W). Each reef contained a total of 5 deployment points, each with 4 bags (2 plastic and 2 BESE). Bags were deployed amongst oyster clusters at the reef sediment surface and secured to the sediment using large stainless-steel garden stakes. After six months elapsed, one set of litter bags from each deployment point was collected, placed in a gallon plastic bag, stored on ice, and brought back to the lab for further analysis. After twelve months elapsed, the remaining litter bags were collected and stored in the same manner.
Upon arrival to the laboratory, all litter bags were carefully opened, and the remaining contents removed and placed on a 2.00 mm sieve (Fisherbrand No. 10), rinsed with DI water, and gently scrubbed to remove sediment build-up, biofilm, small (<10 mm) bivalves, and calcareous tubeworms (Hydroides dianthus). The cleaned material was placed on an aluminum tin to oven dry until constant weight was achieved at 70 °C. Once dried and cooled in a desiccator, the remaining material was weighed and recorded for mass loss calculations. A single exponential decay function was used to determine the exponential decay constant (k) at each time period, as:
X = e k t
where X is the proportion of the initial mass (X0) remaining at time t [41]. The time required to decompose 50% of the initial material was calculated after Ashton et al. [42] as:
t 50 = ln 2 k

Statistical Approach for Degradation Experiment

Data from two unrecovered bags and one bag that was damaged in the field were excluded prior to analysis. Based on an analysis of normality (Shapiro–Wilk test) and homogeneity of variance (Levene’s test) the data did not meet the parametric assumptions, even when transformed. Therefore, a nonparametric Kruskal–Wallis test was performed to compare the difference in % mass loss between the treatments, both overall and subdivided by region and time. To examine the impact of region and time on % mass loss of the BESE, only the BESE data were examined. This subset of the data met the parametric assumptions of normality and homogeneity of variance and two-way ANOVA was used to evaluate the significance of the two factors, as well as the interaction effect between them. A Tukey HSD post hoc test was used to assess the differences between regions by individual months.

2.6. Laboratory Analysis of Aqueous Nutrients

Once samples were returned to the laboratory, all surface water samples were immediately vacuum filtered through a 0.45 µm membrane filter (Pall Corporation, Port Washington, NY, USA) and preserved to a pH value < 2 with distilled, deionized H2SO4. Samples were then stored at 4 °C until further analysis for nitrate + nitrite (herein referred to as NO3), SRP, and NH4+. Concentrations of NO3, SRP, and NH4+ were determined colorimetrically on a Seal AQ2 Automated Discrete Analyzer (Seal Analytical, Mequon, WI, USA) using EPA methods 353.2 Rev. 2.0, 350.1 Rev. 2.0, and 365.1 Rev. 2.0, respectively [43]. All analytical runs included a 5-point calibration curve and were checked for quality assurance and quality control by including duplicates, spikes, internal blanks and standards, as well as external controls in a minimum of every 10 samples.

2.7. Laboratory Analysis of Sediment Properties

Once the sediment samples returned from the field, they were weighed and homogenized by hand in the laboratory. All samples contained some quantity of shell, so all shell fragments > 2 cm in diameter were omitted from sample processing. Extractable pools of bioavailable nutrients encompass nutrients in the porewater and are adsorbed to the surface of sediment particles that are displaced by the addition of salts. All extractable nutrient pools were determined within 12 h of collection for DOC, NO3, SRP, and NH4+. A solution of 2 M KCl was decanted into 40 mL centrifuge tubes containing 3–4 g of homogenized sediment. The samples were agitated on an orbital shaker at 150 rpm at 25 °C for 1 h, then centrifuged at 4000 rpm at 10 °C for 10 min to separate the supernatant and the sediment. The supernatant was then filtered through a Supor 0.45 µm filter (Pall Corporation, Port Washington, NY, USA); acidified with distilled, deionized H2SO4 to a pH value < 2 and stored at 4 °C. Subsequent analyses for NO3, SRP, and NH4+ were performed, as previously defined for surface water nutrients (Section 2.6).
Sediment samples were dried at 70 °C until a consistent weight was attained, then they were ground in scintillation vials containing ceramic balls with a SPEX Sample Prep 8000 M Mixer/Mill (SPEX, Metuchen, NJ, USA). A portion (<6 mg) of the ground subsamples were used to quantify total C and N on a Vario Micro Cube CN Analyzer (Elementar Americas Inc., Mount Laurel, NJ, USA). A subsample (<0.5 g) of dried, ground reef sediment was combusted at 550 °C for 3–4 h to evaluate OM content via loss in ignition (LOI). Total weights of pre- and post-combusted samples were recorded for LOI calculations. After the LOI analysis, solid-phase total P was determined by way of boiling the resulting ashed subsample in 25 mL of 1 M HCl on a hot plate in the fume hood for 30 min. Cooled liquid samples were then filtered through Whatman #41 filter papers [44] and stored for further total P analysis on Seal AQ2 Automated Discrete Analyzer via method 365.1 Rev. 2.0 [43].

3. Results

3.1. Laboratory Respiration Experiment

BESE was composed of 98.0 ± 0.1% OM. Total C comprised approximately half of the total mass, while total N averaged < 0.02% and total P < 0.01%. Respiration rates were more than an order of magnitude higher (56.7 ± 1.4 mg CO2-C kg−1 h−1) when incubated with BESE material than when incubated with only field sediment and water (4.0 ± 0.1 mg CO2-C kg−1 h−1) regardless of the water source used (p < 0.001; Figure 2). Microcosms that did not contain BESE material had greater CO2 production rates when incubated with site water (4.3 ± 0.03 mg CO2-C kg−1 h−1), than with DI water (3.6 ± 0.02 mg CO2-C kg−1 h−1; p < 0.01). The soils used in all the incubations had a pH of 8.5 and 1.6 ± 0.6% soil OM. The ML site water used contained low nutrients: BD for NO3, SRP, and NH4+ (minimum reporting limits = 0.012 mg NO3 L−1, 0.02 mg SRP L−1, and 0.5 mg NH4+ L−1).

3.2. Laboratory Nutrient Release Experiment

The ML site water used in the nutrient release bottle incubations contained 6.38 ± 0.28 mg L−1 DOC, BD levels of NO3, 0.02 ± 0.01 mg L−1 SRP, and 0.5 ± 0.04 mg L−1 NH4+ to begin. Following the 5-week incubation, surface water DOC was almost three orders of magnitude higher when incubated with BESE (5143 ± 1150 mg L−1) than without (7.22 ± 0.36 mg L−1; F = 29.3, p < 0.001; Figure 3a). Among the BESE treatments, summer maximum water temperatures (33 °C) resulted in 20% greater DOC release (5623 ± 97 mg L−1) than room temperature (22 °C; 4663 ± 69 mg L−1). Similarly, bottles containing BESE also had higher NO3 (0.02 ± 0.001 mg L−1) than those without (No BESE; 0.01 ± 0.005 mg L−1; F = 5.45, p = 0.02; Figure 3b). Within the BESE treatment, bottles incubated in the dark at summer maximum water temperatures (33 °C) had the highest NO3 (0.05 ± 0.01 mg L−1; F = 4.85, p = 0.04). Soluble reactive phosphorus was more than an order of magnitude higher in the BESE treatment (2.88 ± 0.03 mg L−1) than in the control treatment (0.14 ± 0.002 mg L−1; F = 30.9, p < 0.001). Summer maximum water temperature (dark and UV light 33 °C) treatments had the highest SRP (2.96 ± 0.03 mg L−1; F = 13.4, p = 0.002) among the BESE treatments. There were no treatment differences for NH4+.

3.3. Field BACI Experiment

Dead reefs had lower oyster densities than all other treatments throughout the study (all p < 0.001) and were excluded from the shell height analysis due to lack of live oysters. Northern reefs had higher oyster densities than S reefs at time 0-, 6-, and 12-months post-restoration. Restored reefs (both plastic and BESE) reached oyster densities equivalent to their regional live reference reef by 1 month post-restoration, and plastic and BESE oyster densities were equivalent at every time point when viewed by region (Figure 4a,c). Shell height was greater on N reefs than S reefs at 1- and 12-months post-restoration (p ≤ 0.01; Figure 4b,d). At 1- and 6-months, live reefs averaged greater shell lengths than restored reefs in both regions. Shell length increased over time on all restored reefs (plastic and BESE) until both were equivalent to the live reef in the S region at 12-months, and the BESE reef was equivalent to the live reef in the N region.
The only consistent predictor of sediment biogeochemical properties was the random variable of reef (p ≤ 0.01 for all 9 measured parameters), while an interaction between treatment and time was observed for 8 of 9 parameters (all p ≤ 0.002). Addressing the primary research question of treatment effects on biogeochemical properties, extractable NH4+ was the only parameter to show a significant treatment effect in pairwise comparisons for a given time point (p < 0.001). Specifically, extractable NH4+ was lower in dead reef sediments at 1 and 12 months (0.9 ± 0.4 and 0.9 ± 0.5 g kg−1, respectfully) than in live, plastic restored, and BESE restored combined (9.0 ± 1.0 and 9.7 ± 1.0 g kg−1, respectfully). All properties, except total P and total C, differed over time (Table 2).

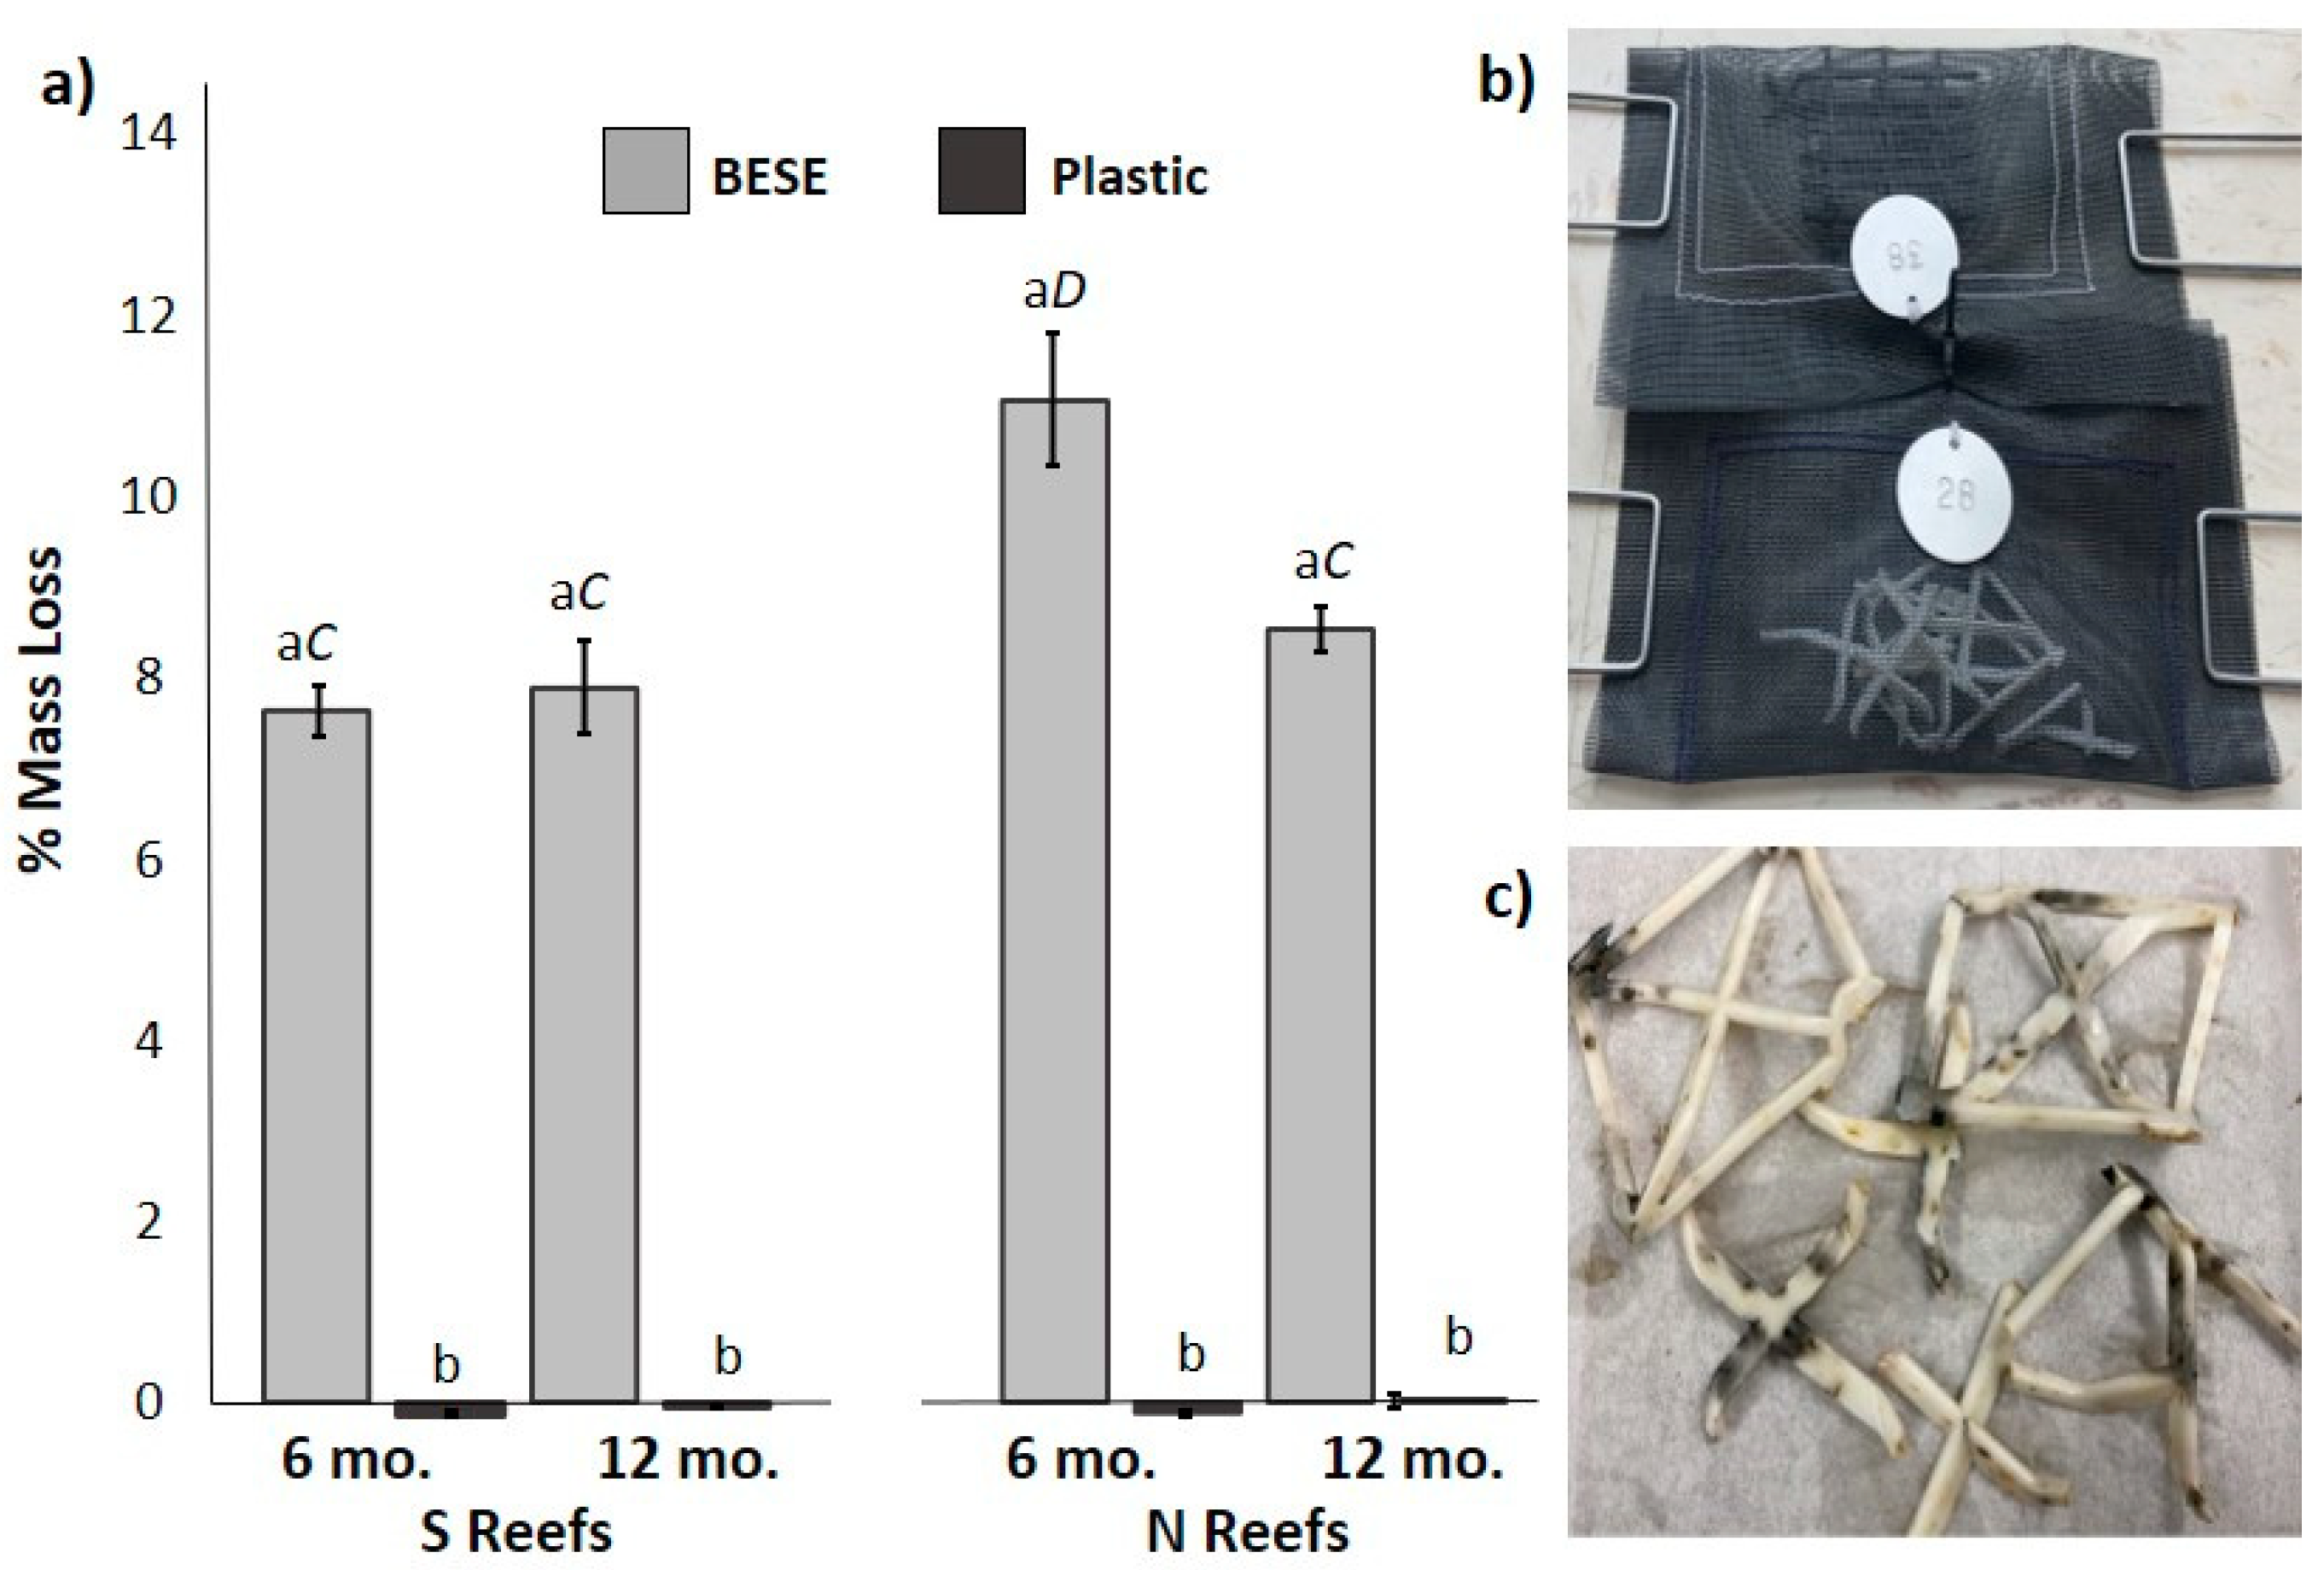
3.4. Field BESE Degradation Experiment

The % mass loss of fragmented BESE material deployed on the sediment surface of two live reference oyster reefs for 6 and 12 months was greater (8.57 ± 0.36% loss) than the fragmented plastic, which on averaged gained a small amount of mass (−0.05 ± 0.03% loss; p < 0.001; Figure 5). BESE mass loss was higher when placed on the N reef for 12 months (11.06 ± 0.51% loss), when compared to 6 months on the N reef and 6 and 12 months on the S reef (8.04 ± 0.25% loss; p = 0.009). Overall, the mass loss of BESE after 6 and 12 months equated to exponential decay constants of 4.4 × 10⁻⁴ ± 1.9 × 10⁻⁵ and 2.9 × 10⁻⁴ ± 1.5 × 10⁻⁵ day−1, respectively. This equates to a t50 of 4.4 ± 0.2 to 6.7 ± 0.45 years for coarsely fragmented BESE on ML oyster reef sediments. Meanwhile, plastic mass remained unchanged or slightly increased with time, presumably due to epiphytic algae that could not be removed.

4. Discussion

4.1. BESE Impacts on Biogeochemical Properties and Processes under Laboratory Conditions

BESE material is almost completely decomposable (~98% organic matter) and predominately composed of C, with an atomic molar C:N:P ratio of 164000:5:1. For context, two other types of potential microbial substrates that are commonly available in the study ecosystem include fresh red mangrove (Rhizophora mangle) leaves (average molar C:N:P of 1128:26:1) and fresh shoal grass (Halodule wrightii) leaves (average 308:22:1; [45]). Therefore, as a substrate for microbial respiration, BESE is extremely rich in C relative to N and P. However, the ratio of N:P alone (5:1) is quite low, suggesting a P availability in excess of many biological organism’s N:P demand (e.g., 16:1 (N:P) for marine phytoplankton [38] and 22:1 for soil microbes [46]). BESE may, therefore, serve as a suitable substrate for microbial communities otherwise limited by C and/or P.
The suitability of BESE for microbial metabolism was demonstrated by the respiration experiment, where the addition of BESE to a closed system caused the rate of CO2 production to increase 14-fold for the 10-day experiment. Roughly 8–18% of the observed respiration was attributed to microbes and nutrients available in the ML site surface water, with the remaining attributed to microbes in the site sediment (control) or the combination of microbes in the site sediment plus on BESE material (in the BESE treatment). The BESE material was not sterilized prior to addition to the microcosm, which was done intentionally because BESE mats would likewise not be sterilized prior to field deployment during restoration activities. This limits our ability to distinguish between the potential contribution of microbes already associate with the BESE material, from the additional microbial growth and activity stimulated by the C, N and P content of the BESE material itself, but does still suggest an apparent priming effect of the BESE. In other words, the addition of BESE stimulated microbial activity and turnover, causing an exponential short-term increase in CO2 production [47]. The brief nature of this experiment cannot determine if the apparent priming effect will translate into a real priming effect that stimulates the mineralization of OM within the site sediment itself (normally seen weeks to months following addition of the substrate; [48]), thereby potentially diminishing soil C burial over time [49].
The laboratory nutrient release experiment corroborates the results of the chemical composition analysis of BESE, demonstrating the stoichiometrically high availability of C and P within the material can translate into ecologically significant releases of DOC and SRP into surrounding surface water (Figure 3). Concentrations of DOC averaged 71,156% higher in BESE-containing bottles than those without BESE. This concentration of DOC in ML site water incubated for 5 weeks with BESE (~5143 mg L−1) is roughly two orders of magnitude greater than observed in boreal peatland catchments (~25 to 55 mg L−1 [50]) and untreated wastewater (~11 to 82 mg L−1 [51]), and almost three orders of magnitude greater than typically observed in ML surface water (1.6 to 22 mg L−1, µ = 9.2 mg L−1, based on 116 observations from 2016–2019; [20,40]). Dissolved OC is considered a major driver of marine food webs because of its role as a low molecular weight substrate for prokaryotes [52,53], but may also have negative ecological consequences, such as contributing to harmful algal blooms [54], reducing water transparency [55], and transporting metals and persistent organic pollutants [56,57].
Similarly, surface water SRP concentrations were, on average, 1980% higher in bottles incubated with BESE relative to those incubated without BESE. In fact, the concentration of SRP in the BESE incubation bottles (~2.9 mg L−1) is more than two orders of magnitude above the concentration within the ML site water collected at the same time (~0.02 mg L−1 SRP) and well above the EPA Class III waters threshold for total P, which dictates that the long-term geometric mean must not exceed 0.01 mg L−1 total P [58]. The ecological implications of this SRP release are unknown and are likely to be site specific. Additionally, the mass of BESE, introduced during restoration, relative to the volume of water and the water exchange rate, are factors for consideration when evaluating BESE as a potential nutrient source in the environment.
In contrast to DOC and SRP, BESE was less of a source of dissolved inorganic N to the surface water under laboratory conditions. All NH4+ concentrations in the nutrient release study were BD. Although NO3 concentrations were elevated (~87% higher) in bottles with BESE, relative to those without BESE, the observed NO3 concentrations remained within the range commonly observed within ML (e.g., BD to 0.09 mg L−1 NO3; [40]) for all treatments. These findings support the earlier assertion that the low N:P of BESE could provide P in excess of organismal metabolic requirements in some environments, favoring P mineralization over immobilization as the BESE decomposes [59].
For DOC, SRP, and NO3, all of which experienced an overall increase when incubated in the laboratory with BESE, warmer temperature (33 °C, representing a maximum summer water temperature within ML) saw the highest releases into the surface water. While not a conclusive indicator that microbial degradation is responsible for nutrient release, the fact that temperature (a key regulator of microbial metabolic rates) influenced nutrient release, while UV light exposure (a key regulator of abiotic photolysis) did not, suggests a strong microbial driver of the observed nutrient release [59]. However, the relative contributions of biotic vs. abiotic process to nutrient release cannot be definitively determined without having controlled for microbial communities through sterilization.

4.2. Performance of BESE under Field Conditions

Restoration was successful with both plastic and BESE, as all restored reefs reached oyster densities equivalent to their live regional reference reef by 1 month post-restoration and exceeded the 1-year densities from previous ML deployments, which have been shown to vary annually based on salinity, temperature, and cell concentrations of the brown tide alga Aureoumbra lagunensis in ML [4]. Furthermore, oyster density did not differ between reefs restored with plastic and those restored with BESE at any time point during the 12-month study in either region, suggesting oysters will recruit equally well on both materials. Monitoring data did suggest a larger regional-scale difference in oyster recruitment within ML, with N reefs (both live and restored) recruiting at higher rates than S reefs and having greater shell heights at some time points. This regional effect within the study ecosystem has been noted previously [20] and is believed to be a consequence of closer proximity to the ocean inlet in the north, promoting higher tidal amplitudes, greater water exchange, and more nutrient availability [36,40].
Previous work has demonstrated the ability of sediments beneath live oyster reefs to serve as biogeochemical hot spots for nutrient accumulation and cycling [60,61], and indicated that many biogeochemical indices in the sediments beneath the restored reef can meet or exceed those of natural reefs within the first year post-restoration [20,40]. The rapid biogeochemical development of recently restored reef sediments has been attributed to the effects of increased water turbulence enhancing sediment entrapment and deposition of suspended particles from the water column [60,62,63], coupled with enhanced biodeposition from newly recruited oysters [40]. Biodeposits, which include both feces (digested) and pseudofeces (ingested and expelled), contain high concentrations of C, N, and P [64,65], and appear to harbor more labile nutrients when they originate for young (<12 month old) oysters, relative to older oysters [40].
We predicted the organic composition of BESE and its ability to serve as a microbial substrate would accelerate the development of biogeochemical properties beneath reefs restored with BESE relative to those restored with plastic (Table 1). The laboratory results conceptually support this idea, but the prediction was not supported by the results of the field BACI study. Despite substantial increases in short-term microbial respiration rate and the enhanced release of DOC, SRP, and NO3 to the surface water with the addition of BESE in the laboratory, BESE reef sediments did not develop biogeochemical properties more rapidly than plastic. The dilution and export of these nutrients in the open water system likely accounted for this difference. Experimental design consideration may have also limited our ability to adequately test our prediction, particularly the low statistical power of the study design. Specifically, the scope of the BACI field experiment was limited to only two reefs restored with each material type, and even those two reefs were in two distinct regions of ML due to the constraints of restoration permits. This study, as well as previous studies in ML, have all demonstrated a strong “reef effect” for sediment biogeochemical parameters, meaning each individual reef tends to be highly unique, including those within the same treatment or category [20,40]. Causes for this high within-treatment variability include the unique site histories of each reef, differences in local flow patterns, proximity to nutrient or pollution sources, exposure to boat traffic or other stressors, spatial variation in disease or predation, and mangrove encroachment [4,37]. Therefore, the low number of replicate reefs, the high within-treatment variability, and the naturally heterogeneous nature of many of the sediment biogeochemical parameters measured, all contributed to low statistical power for the field BACI experiment. The statistical power was so low that significant differences in biogeochemical properties between the positive and negative controls were not even consistently observed, which has been a reliable effect in past studies with higher replication [20,40]. The only significant treatment effect documented in the BACI sediment biogeochemistry study was lower extractable NH4+ on dead reefs compared to live and restored reefs. Ammonium is the primary form of inorganic N in oyster excretions and can be stored and regenerated in the anaerobic reef sediments [66,67,68,69], making it a consistent and strong correlate of oyster density, reef height, and shell length [40].
Additionally, changing from a closed system (laboratory) to an open system (field) likely influenced how BESE interacted with the surrounding sediment and water. For example, BESE material had to be fragmented to fit into the laboratory microcosm bottles, effectively increasing the surface-area-to-volume ratio of the BESE in the laboratory trials, compared to when it is field-deployed for restoration. Studies of forest litter show a positive relationship between decomposition rate and surface-area-to-volume ratio of the substrate [70], suggesting the fragmentation of BESE may have enhanced microbial interaction and metabolism of the substrate. The constant flow and mixing of water under field conditions, as well as the intertidal nature of the study reefs, are all additional factors that may have limited the influence of BESE on the underlying sediment in the field.
As suggested by the laboratory experimental results, the field degradation study further confirmed BESE does indeed biodegrade when deployed in the field. Percent mass loss ranged from 8.0 to 12.0% in the first year of deployment on live oyster reef sediments in ML. Decomposition rate decreased slightly (~5%) from the first the 0–6 months (3.08 ± 0.97 mg d−1) to the second 6–12 months (2.95 ± 0.15 mg d−1), but the rapid initial decay rate of the most labile compounds may have been missed, since the first set of litter bags was not collected until the sixth month [71]. The exponential decay constants (k) calculated for BESE were approximately one order of magnitude lower than for aboveground herbaceous litter decomposing in Louisiana (USA) coastal wetlands [72] and two orders of magnitude less than for mangrove leaf litter in Costa Rica [73]. Decay constants suggest it will take roughly 4.4 to 6.7 years of deployment on ML oyster reefs for BESE to lose half of the mass. This half-life estimate is only an approximation and may be slightly inflated because the litter bag approach required the coarse fragmentation of the BESE and staking the bags directly at the sediment surface, where sediment-microbial interactions may be greater than when deployed as a 3D mat for restoration purposes (see Figure 1). Additionally, when extrapolating these data to other ecosystems, it is important to recognize the recalcitrance (or degradability) of any material is the product of the environmental conditions in which it is located, rather than an intrinsic property of the material [74]. For biodegradable oyster reef restoration materials, factors such as air and water temperatures, salinity, tidal amplitude and daily exposure duration, wave energy, nutrient status of the water and sediment, and the nature of the local floral, faunal, and microbial communities could all contribute to faster or slower rates of decay. Longer-term and site-specific data on BESE decay rates are needed to better inform restoration practitioners of the expected longevity of the material.

4.3. Consideration for Wide-Scale Adoption of Biodegradable Material for Oyster Reef Restoration

When exploring “eco-friendly” alternatives to plastic in oyster-reef restoration, these data suggest that the biogeochemical properties and impacts of each material should be evaluated, in addition to common performance metrics of oyster recruitment and reef development. This includes a scientific study of the novel organic substrate’s impact on C and nutrient cycling and availability within the ecosystem in which they are deployed, as well as how the degradation of the material (both biotic and abiotic) will affect the long-term success of the restoration project. Being “biodegradable” means the material is intended to break-down and be disintegrated by living organisms. Restoration practitioners should consider: How will the chemical composition of the material influence biogeochemical processes in the ecosystem? How long will the material last under field conditions? What will be the fate of the restoration effort once the material is gone?
In ecosystems such as ML, where oyster reef destruction is primarily caused by boat wakes dislodging live oyster clusters from their stable substrate [3,4,75,76], the structural integrity of the restoration mat is key to the long-term success of the project. The traditional technique employed in ML for the past decade, using plastic mats, is predicated on re-establishing the stability of the basal substrate for oyster growth. The breakdown of a biodegradable mat means the connection between the basal reef shells and the underlying sediment may once again be lost when the degradation surpasses some critical threshold that undermines the structural integrity of the mat. In other circumstances where wave energy is not the primary cause of reef degradation, these concerns may be less applicable. For example, Temmick et al. [77] found that BESE was successful at creating emergent properties for marsh grasses when plants were deployed while surrounded by the mesh, promoting successful rooting and establishment so the vegetation could become self-sustaining even after the BESE degrades. This illustrates the need to consider whether the biodegradable material is necessary in perpetuity for restoration success, or if it can serve only a temporary role in restoration without compromising the overall objectives.
In addition to longevity, the practical matter of cost may play a role in the decision of restoration materials. For example, to make a 0.25 m2 oyster restoration mat with traditional Vexar™ extruded mesh with 36 drilled oyster shells attached with 50 lb test cable ties, the cost per mat (excluding donated shells) is USD 2.43. When BESE are used to make a mat of the same dimensions with similar number of oyster shells attached with 18-gauge stainless wire, the cost is USD 9.18 per mat. This 377.8% increase in cost may limit the acreage of damaged reefs that it is possible to restore. On the flip side, using biodegradable materials ensures restoration activities do not serve as an additional source of microplastics to the coastal environment and that, long after the restoration is complete, there will be no persistent materials that could become marine debris and require costly clean-up efforts.

5. Conclusions

As oyster reef restoration activities become increasingly common worldwide, the objectives and approaches have also expanded to include consideration for a variety of ecosystem services provided by oyster reefs, as well as the impact of the restoration intervention itself. Specifically, there is enhanced awareness of the prevalence and consequences of microplastics in the marine environment, which is fueling a desire to find environmentally friendly alternatives to the plastic-based materials previously used by many in oyster reef restoration projects. This study investigated the intersection of emergent biogeochemical properties on restored oyster reefs and the implementation of one biodegradable restoration material, BESE. Through a series of four targeted experiments (two laboratory; two field), the impact of BESE on short-term sediment respiration and nutrient release was quantified, the field-based performance of BESE in supporting oyster reef development and sediment biogeochemical properties evaluated, and the degradation rate of BESE estimated. The results demonstrate that BESE is as successful as traditional plastic mats at promoting oyster recruitment and growth without requiring the use of plastics during restoration. However, BESE does break down through microbial mineralization, as shown (1) in the laboratory, by a 1333% increase in CO2 production rate over 10 days when site sediments were incubated with BESE, as compared to without; (2) in the field, by a 7–12% reduction in BESE mass when deployed on live oyster reef sediments for up to 12 months. Furthermore, BESE released ecologically significant concentrations of DOC and SRP when incubated with site water under laboratory conditions, but these effects did not translate into measurable changes in sediment biogeochemical properties during a small-scale field deployment experiment. This lack of transferability from laboratory to field conditions is likely due to the high degree of water mixing in coastal environments but supports the need for further study of the degree and fate of nutrient release from biodegradable materials. Restoration practitioners, considering employing biodegradable materials in their projects, should evaluate the potential biogeochemical effects of introducing a novel organic substrate to their ecosystem and how eventual degradation will impact the long-term success of the project. Meanwhile, also weighing the current societal preference for using non-plastic substrates, particularly in community-based restoration efforts.

Author Contributions

Conceptualization, L.G.C., L.J.W. and C.K.N.; methodology, L.G.C., L.J.W., J.S.S., P.E.S., and C.K.N.; validation, L.G.C., L.J.W., J.S.S., P.E.S. and C.K.N.; formal analysis, J.S.S. and L.G.C.; resources, L.J.W. and L.G.C.; data curation, C.K.N. and J.S.S.; writing—original draft preparation, C.K.N., L.G.C., and J.S.S.; writing—review and editing, L.G.C., L.J.W., J.S.S., P.E.S. and C.K.N.; visualization, C.K.N. and L.G.C.; supervision, L.G.C. and L.J.W.; project administration, L.G.C. and L.J.W.; funding acquisition, L.G.C. and L.J.W. All authors have read and agreed to the published version of the manuscript.

Funding

This research was funded by the National Science Foundation under the Coupled Human-Natural Systems Program, Award # 1617374 to L.G.C. and L.J.W. and by the Indian River Lagoon National Estuarine Program.

Data Availability Statement

Data will be made available via the UCF data repository, STARS (https://stars.library.ucf.edu/), within 2 years of publication.

Acknowledgments

The authors would like to thank all the volunteers from UCF and the Marine Discovery Center in New Smyrna Beach, FL for making, deploying, and monitoring all restoration materials.

Conflicts of Interest

The authors declare no conflict of interest.

References

  1. Encomio, V.G.; Stickler, S.M.; Allen, S.K.; Chu, F.L. Performance of “natural dermo-resistant” oyster stocks-Survival, disease, growth, condition and energy reserves. J. Shellfish Res. 2005, 24, 143–155. [Google Scholar] [CrossRef]
  2. Carlsson, J.; Carnegie, R.B.; Cordes, J.F.; Hare, M.P.; Leggett, A.T.; Reece, K.S. Evaluating recruitment contribution of a selectively bred aquaculture line of the oyster, Crassostrea virginica used in restoration efforts. J. Shellfish Res. 2008, 27, 1117–1124. [Google Scholar] [CrossRef] [Green Version]
  3. Garvis, S.K.; Sacks, P.E.; Walters, L.J. Formation, Movement, and Restoration of Dead Intertidal Oyster Reefs in Canaveral National Seashore and Mosquito Lagoon, Florida. J. Shellfish Res. 2015, 34, 251–258. [Google Scholar] [CrossRef]
  4. Walters, L.J.; Sacks, P.E.; Campbell, D.E. Boating impacts and boat-wake resilient restoration of the eastern oyster Crassostrea virginica in Mosquito Lagoon, Florida, USA. Florida Sci. 2021, in press. [Google Scholar]
  5. Herbert, D.; Astrom, E.; Bersoza, A.C.; Batzer, A.; McGovern, P.; Angelini, C.; Wasman, S.; Dix, N.; Sheremet, A. Mitigating erosional effects induced by boat wakes with living shorelines. Sustainability 2018, 10, 436. [Google Scholar] [CrossRef] [Green Version]
  6. Safak, I.; Norby, P.L.; Dix, N.; Grizzle, R.E.; Southwell, M.; Veenstra, J.J.; Acevedo, A.; Cooper-Kolb, T.; Massey, L.; Sheremet, A.; et al. Coupling breakwalls with oyster restoration structures enhances living shoreline performance along energetic shorelines. Ecol. Eng. 2020, 158, 106071. [Google Scholar] [CrossRef]
  7. Gilby, B.L.; Olds, A.D.; Chapman, S.; Goodridge Gaines, L.A.; Henderson, C.J.; Ortodossi, N.L.; Didderen, K.; Lengkeek, W.; van der Heide, T.; Schlacher, T.A. Attraction versus production in restoration: Spatial and habitat effects of shellfish reefs for fish in coastal seascapes. Restor. Ecol. 2021. [Google Scholar] [CrossRef]
  8. Johnson, E.E.; Medina, M.D.; Hernandez, A.C.B.; Kusel, G.A.; Batzer, A.N.; Angelini, C. Success of concrete and crab traps in facilitating Eastern oyster recruitment and reef development. PeerJ 2019, 2019, 1–19. [Google Scholar] [CrossRef]
  9. Scyphers, S.B.; Powers, S.P.; Heck, K.L. Ecological Value of Submerged Breakwaters for Habitat Enhancement on a Residential Scale. Environ. Manag. 2015, 55, 383–391. [Google Scholar] [CrossRef]
  10. Dunn, R.P.; Eggleston, D.B.; Lindquist, N. Oyster-sponge interactions and bioerosion of reef-building substrate materials: Implications for oyster restoration. J. Shellfish Res. 2014, 33, 727–738. [Google Scholar] [CrossRef]
  11. Moody, J.A.; Gentry, M.J.; Bouboulis, S.A.; Kreeger, D.A. Effects of Substrate (Protection and Type) on Ribbed Mussel (Geukensia demissa) Recruitment for Living Shoreline Applications. J. Coast. Res. 2020, 36, 619–627. [Google Scholar] [CrossRef]
  12. George, L.M.; De Santiago, K.; Palmer, T.A.; Beseres Pollack, J. Oyster reef restoration: Effect of alternative substrates on oyster recruitment and nekton habitat use. J. Bus. Psychol. 2015, 30, 13–22. [Google Scholar] [CrossRef]
  13. Soniat, T.M.; Burton, G.M. A comparison of the effectiveness of sandstone and limestone as cultch for oysters, Crassostrea virginica. J. Shellfish Res. 2005, 24, 483–485. [Google Scholar] [CrossRef]
  14. Quan, W.; Fan, R.; Wang, Y.; Humphries, A.T. Long-Term Oyster Recruitment and Growth are not Influenced by Substrate Type in China: Implications for Sustainable Oyster Reef Restoration. J. Shellfish Res. 2017, 36, 79–86. [Google Scholar] [CrossRef]
  15. Frederick, P.; Vitale, N.; Pine, B.; Seavey, J.; Sturmer, L. Reversing a Rapid Decline in Oyster Reefs: Effects of Durable Substrate on Oyster Populations, Elevations, and Aquatic Bird Community Composition. J. Shellfish Res. 2016, 35, 359–367. [Google Scholar] [CrossRef]
  16. Soucy, B. Alternative Material Selection for Oyster Restoration with an Emphasis on Living Docks. Master’s Thesis, Florida Institute of Technology, Melbourne, FL, USA, 2020; p. 91. [Google Scholar]
  17. Morris, R.L.; Bilkovic, D.M.; Boswell, M.K.; Bushek, D.; Cebrian, J.; Goff, J.; Kibler, K.M.; La Peyre, M.K.; McClenachan, G.; Moody, J.; et al. The application of oyster reefs in shoreline protection: Are we over-engineering for an ecosystem engineer? J. Appl. Ecol. 2019, 56, 1703–1711. [Google Scholar] [CrossRef]
  18. McClenachan, G.M.; Donnelly, M.J.; Shaffer, M.N.; Sacks, P.E.; Walters, L.J. Does size matter? Quantifying the cumulative impact of small-scale living shoreline and oyster reef restoration projects on shoreline erosion. Restor. Ecol. 2020, 28, 1365–1371. [Google Scholar] [CrossRef]
  19. Goelz, T.; Vogt, B.; Hartley, T. Alternative Substrates Used for Oyster Reef Restoration: A Review. J. Shellfish Res. 2020, 39, 1–12. [Google Scholar] [CrossRef]
  20. Chambers, L.G.; Gaspar, S.A.; Pilato, C.J.; Steinmuller, H.E.; McCarthy, K.J.; Sacks, P.E.; Walters, L.J. How Well Do Restored Intertidal Oyster Reefs Support Key Biogeochemical Properties in a Coastal Lagoon? Estuaries Coasts 2018, 41, 784–799. [Google Scholar] [CrossRef]
  21. Shaffer, M.; Donnelly, M.; Walters, L. Does intertidal oyster reef restoration affect avian community structure and behaivor in a shallow estuarine system? A post-restoration analysis. Florida Field Nat. 2019, 47, 37–98. [Google Scholar]
  22. Lewis, D.; Durham, K.; Walters, L.; Cook, G. Resident fishes as higher trophic level indicators of oyster reef restoration success. Estuaries Coasts. in review.
  23. Harris, K. Oyster Reef Restoration: Impacts on Infaunal Communities in a Shallow Water Estuary. Univ. Cent. Florida Undergrad. Res. J. 2020, 11, 7–17. [Google Scholar]
  24. Copertino, J. Bird Abundance and Diversity and the Impact of Oyster Reef Restoration on the Bird Community in Mosquito Lagoon, Florida, USA. Master’s Thesis, University of Central Florida, Orlando, FL, USA, 2021; p. 106. [Google Scholar]
  25. Eerkes-Medrano, D.; Thompson, R.C.; Aldridge, D.C. Microplastics in freshwater systems: A review of the emerging threats, identification of knowledge gaps and prioritisation of research needs. Water Res. 2015, 75, 63–82. [Google Scholar] [CrossRef]
  26. Cole, M.; Lindeque, P.; Halsband, C.; Galloway, T.S. Microplastics as contaminants in the marine environment: A review. Mar. Pollut. Bull. 2011, 62, 2588–2597. [Google Scholar] [CrossRef]
  27. Waite, H.R.; Donnelly, M.J.; Walters, L.J. Quantity and types of microplastics in the organic tissues of the eastern oyster Crassostrea virginica and Atlantic mud crab Panopeus herbstii from a Florida estuary. Mar. Pollut. Bull. 2018, 129, 179–185. [Google Scholar] [CrossRef] [PubMed]
  28. Walters, L.; Craig, C. Microplastics, Oysters, and the Indian River Lagoon–Final Report to IRL NEP; CEELAB Research Data 4; University of Central Florida Libraries: Orlando, FL, USA, 2021. [Google Scholar]
  29. Jambeck, J.; Geyer, R.; Wilcox, C.; Siegler, T.R.; Perryman, M.; Andrady, A.; Narayan, R.; Law, K.L. The Ocean. Mar. Pollut. 2015, 347, 768. [Google Scholar]
  30. Guo, X.; Wang, J. The chemical behaviors of microplastics in marine environment: A review. Mar. Pollut. Bull. 2019, 142, 1–14. [Google Scholar] [CrossRef]
  31. Carlin, J.; Craig, C.; Little, S.; Donnelly, M.; Fox, D.; Zhai, L.; Walters, L. Microplastic accumulation in the gastrointestinal tracts in birds of prey in central Florida, USA. Environ. Pollut. 2020, 264, 114633. [Google Scholar] [CrossRef]
  32. Zhang, D.; Cui, Y.; Zhou, H.; Jin, C.; Yu, X.; Xu, Y.; Li, Y.; Zhang, C. Microplastic pollution in water, sediment, and fish from artificial reefs around the Ma’an Archipelago, Shengsi, China. Sci. Total Environ. 2020, 703, 134768. [Google Scholar] [CrossRef]
  33. Sussarellu, R.; Suquet, M.; Thomas, Y.; Lambert, C.; Fabioux, C.; Pernet, M.E.J.; Goïc, N.L.; Quillien, V.; Mingant, C.; Epelboin, Y.; et al. Oyster reproduction is affected by exposure to polystyrene microplastics. Proc. Natl. Acad. Sci. USA 2016, 113, 2430–2435. [Google Scholar] [CrossRef] [Green Version]
  34. Dybas, C.L. Florida’s Indian River Lagoon: An Estuary in Transition. Bioscience 2002, 52, 554–559. [Google Scholar] [CrossRef]
  35. Phlips, E.J.; Badylak, S.; Lasi, M.A.; Chamberlain, R.; Green, W.C.; Hall, L.M.; Hart, J.A.; Lockwood, J.C.; Miller, J.D.; Morris, L.J.; et al. From Red Tides to Green and Brown Tides: Bloom Dynamics in a Restricted Subtropical Lagoon Under Shifting Climatic Conditions. Estuaries Coasts 2015, 38, 886–904. [Google Scholar] [CrossRef]
  36. Smith, N.P. Tidal and nontidal flushing of Florida’s Indian River Lagoon. Estuaries 1993, 16, 739–746. [Google Scholar] [CrossRef]
  37. McClenachan, G.; Witt, M.; Walters, L.J. Replacement of oyster reefs by mangroves: Unexpected climate-driven ecosystem shifts. Glob. Chang. Biol. 2020, 1–13. [Google Scholar] [CrossRef]
  38. Redfield, A.C. The biolgoical control of chemical factors in the environment. Am. Sci. 1958, 46, 205–221. [Google Scholar]
  39. BESE. Ecosystem Restoration Products. Available online: http://www.bese-products.com/ (accessed on 18 May 2021).
  40. Locher, B.; Hurst, N.R.; Walters, L.J.; Chambers, L.G. Juvenile Oyster (Crassostrea virginica) Biodeposits Contribute to a Rapid Rise in Sediment Nutrients on Restored Intertidal Oyster Reefs (Mosquito Lagoon, FL, USA). Estuaries Coasts 2020, 44. [Google Scholar] [CrossRef]
  41. Wieder, R.K.; Lang, G.E. A critique of the analytical methods used in examining decomposition data obtained from litter bags. Ecology 1982, 63, 1636–1642. [Google Scholar] [CrossRef] [Green Version]
  42. Ashton, E.C.; Hogarth, P.J.; Ormond, R. Breakdown of mangrove leaf litter in a managed mangrove forest in Peninsular Malaysia. Hydrobiologia 1999, 413, 77–88. [Google Scholar] [CrossRef]
  43. USEPA. Methods for the Determination of Inorganic Substances in Environmental Samples; US Environmental Protection Agency: Washington, DC, USA, 1993. [Google Scholar]
  44. Andersen, J.M. An ignition method for determination of total phosphorus in lake sediments. Water Res. 1976, 10, 329–331. [Google Scholar] [CrossRef]
  45. Breithaupt, J.L.; Duga, E.; Witt, M.; Filyaw, R.; Friedland, N.; Donnelly, M.J.; Walters, L.J.; Chambers, L.G. Carbon and nutrient fluxes from seagrass and mangrove wrack are mediated by soil interactions. Estuar. Coast. Shelf Sci. 2019, 229. [Google Scholar] [CrossRef]
  46. Cleveland, C.C.; Liptzin, D. C:N:P stoichiometry in soil: Is there a “Redfield ratio” for the microbial biomass? Biogeochemistry 2007, 85, 235–252. [Google Scholar] [CrossRef]
  47. Blagodatskaya, E.; Kuzyakov, Y. Mechanisms of real and apparent priming effects and their dependence on soil microbial biomass and community structure: Critical review. Biol. Fertil. Soils 2008, 45, 115–131. [Google Scholar] [CrossRef]
  48. Blagodatsky, S.; Blagodatskaya, E.; Yuyukina, T.; Kuzyakov, Y. Model of apparent and real priming effects: Linking microbial activity with soil organic matter decomposition. Soil Biol. Biochem. 2010, 42, 1275–1283. [Google Scholar] [CrossRef]
  49. Fontaine, S.; Bardoux, G.; Abbadie, L.; Mariotti, A. Carbon input to soil may decrease soil carbon content. Ecol. Lett. 2004, 7, 314–320. [Google Scholar] [CrossRef]
  50. Limpens, J.; Berendse, F.; Blodau, C.; Canadel, J.G.; Freeman, C.; Holden, J.; Roulet, N.; Rydin, H.; Schaepman-Strub, G. Peatlands and the carbon cycle: From local processes to global implications- a synthesis. Biogeosciences 2008, 5, 1739. [Google Scholar] [CrossRef] [Green Version]
  51. Katsoyiannis, A.; Samara, C. The fate of Dissolved Organic Carbon (DOC) in the wastewater treatment process and its importance in the removal of wastewater contaminants. Environ. Sci. Pollut. Res. 2007, 14, 284–292. [Google Scholar] [CrossRef]
  52. Lønborg, C.; Carreira, C.; Jickells, T.; Álvarez-Salgado, X.A. Impacts of Global Change on Ocean Dissolved Organic Carbon (DOC) Cycling. Front. Mar. Sci. 2020, 7, 1–24. [Google Scholar] [CrossRef]
  53. Benner, R.; Amon, R.M.W. The size-reactivity continuum of major bioelements in the Ocean. Ann. Rev. Mar. Sci. 2015, 7, 185–205. [Google Scholar] [CrossRef] [PubMed]
  54. Anderson, D.; Gilbert, P.; Burkholder, J. Harmful Algal Blooms and Eutrophication Nutrient Sources, Composition, and Consequences. Estuaries 2002, 25, 704–726. [Google Scholar] [CrossRef]
  55. Strock, K.E.; Theodore, N.; Gawley, W.G.; Ellsworth, A.C.; Saros, J.E. Increasing dissolved organic carbon concentrations in northern boreal lakes: Implications for lake water transparency and thermal structure. J. Geophys. Res. Biogeosci. 2017, 122, 1022–1035. [Google Scholar] [CrossRef]
  56. Katsoyiannis, A.; Samara, C. Persistent organic pollutants (POPs) in the conventional activated sludge treatment process: Fate and mass balance. Environ. Res. 2005, 97, 245–257. [Google Scholar] [CrossRef]
  57. Evans, C.D.; Monteith, D.T.; Cooper, D.M. Long-term increases in surface water dissolved organic carbon: Observations, possible causes and environmental impacts. Environ. Pollut. 2005, 137, 55–71. [Google Scholar] [CrossRef] [PubMed]
  58. EPA. Water Quality Standards for the State of Florida’s Lakes and Flowing Waters. Fed. Regist. 40 CFR Part 131 2010, 75, 75761–75807. [Google Scholar]
  59. Reddy, K.R.; DeLaune, R. Biogeochemistry of Wetlands: Science and Applications; CRC Press: New York, NY, USA, 2008. [Google Scholar]
  60. Dame, R.; Spurrier, J.; Wolaver, T. Carbon, nitrogen and phosphorus processing by an oyster reef. Mar. Ecol. Prog. Ser. 1989, 54, 249–256. [Google Scholar] [CrossRef]
  61. Kellogg, M.L.; Smyth, A.R.; Luckenbach, M.W.; Carmichael, R.H.; Brown, B.L.; Cornwell, J.C.; Piehler, M.F.; Owens, M.S.; Dalrymple, D.J.; Higgins, C.B. Use of oysters to mitigate eutrophication in coastal waters. Estuar. Coast. Shelf Sci. 2014, 151, 156–168. [Google Scholar] [CrossRef]
  62. Fodrie, F.J.; Rodriguez, A.B.; Gittman, R.K.; Grabowski, J.H.; Lindquist, N.L.; Peterson, C.H.; Piehler, M.F.; Ridge, J.T. Oyster reefs as carbon sources and sinks. Proc. R. Soc. B Biol. Sci. 2017, 284. [Google Scholar] [CrossRef] [PubMed]
  63. Kitsikoudis, V.; Kibler, K.M.; Walters, L.J. In-situ measurements of turbulent flow over intertidal natural and degraded oyster reefs in an estuarine lagoon. Ecol. Eng. 2020, 143, 105688. [Google Scholar] [CrossRef]
  64. Newell, R.I.E.; Fisher, T.R.; Holyoke, R.R.; Cornwell, J.C. Influence of Eastern Oysters on Nitrogen and Phosphorus Regeneration in Chesapeake Bay, USA. In The Comparative Roles of Suspension Feeders in Ecosystems; Dame, R., Olenin, S., Eds.; Springer: Dordrecht, The Netherlands, 2005; Volume 47, pp. 93–120. ISBN 1568-1238. [Google Scholar]
  65. Smyth, A.R.; Murphy, A.E.; Anderson, I.C.; Song, B. Differential Effects of Bivalves on Sediment Nitrogen Cycling in a Shallow Coastal Bay. Estuaries Coasts 2018, 41, 1147–1163. [Google Scholar] [CrossRef] [Green Version]
  66. Dame, R.; Dankers, N.; Prins, T.; Jongsma, H.; Smaal, A. The Influence of Mussel Beds on Nutrients in the Western Wadden Sea and Eastern Scheldt Estuaries. Estuaries 1991, 14, 130–138. [Google Scholar] [CrossRef]
  67. Dame, R.F.; Spurrier, J.D.; Zingmark, R.G. In situ metabolism of an oyster reef. J. Exp. Mar. Bio. Ecol. 1992, 164, 147–159. [Google Scholar] [CrossRef]
  68. Newell, R.I.E.; Cornwell, J.C.; Owens, M.S. Influence of simulated bivalve biodeposition and microphytobenthos on sediment nitrogen dynamics: A laboratory study. Limnol. Oceanogr. 2002, 47, 1367–1379. [Google Scholar] [CrossRef]
  69. Bayne, B.L.; Hawkins, A.J.S. Ecological and Physiological Aspects of Herbivory in Benthic Suspension-Feeding Molluscs. In Plant-Animal Interactions in the Marine Benthos; John, D., Hawkins, S., Price, J., Eds.; Clarendon Press: Oxford, UK, 1992; pp. 265–288. [Google Scholar]
  70. Chae, H.M.; Choi, S.H.; Lee, S.H.; Cha, S.; Yang, K.C.; Shim, J.K. Effect of litter quality on needle decomposition for four pine species in Korea. Forests 2019, 10, 371. [Google Scholar] [CrossRef] [Green Version]
  71. Melillo, J.M.; Aber, J.D.; Linkins, A.E.; Ricca, A.; Fry, B.; Nadelhoffer, K.J. Carbon and nitrogen dynamics along the decay continuum: Plant litter to soil organic matter. Plant Soil 1989, 115, 189–198. [Google Scholar] [CrossRef]
  72. Stagg, C.L.; Baustian, M.M.; Perry, C.L.; Carruthers, T.J.B.; Hall, C.T. Direct and indirect controls on organic matter decomposition in four coastal wetland communities along a landscape salinity gradient. J. Ecol. 2018, 106, 655–670. [Google Scholar] [CrossRef]
  73. Loría-Naranjo, M.; Sibaja-Cordero, J.A.; Cortés, J. Mangrove Leaf Litter Decomposition in a Seasonal Tropical Environment. J. Coast. Res. 2019, 35, 122–129. [Google Scholar] [CrossRef]
  74. Schmidt, M.W.I.; Torn, M.S.; Abiven, S.; Dittmar, T.; Guggenberger, G.; Janssens, I.A.; Kleber, M.; Kögel-Knabner, I.; Lehmann, J.; Manning, D.A.C.; et al. Persistence of soil organic matter as an ecosystem property. Nature 2011, 478, 49–56. [Google Scholar] [CrossRef] [Green Version]
  75. Wall, L.M.; Walters, L.J.; Grizzle, R.E.; Sacks, P.E. Recreational boating activity and its impact on the recruitment and survival of the oyster Crassostrea virginica on intertidal reefs in Mosquito Lagoon, Florida. J. Shellfish Res. 2005, 24, 965–973. [Google Scholar] [CrossRef]
  76. Grizzle, R.; Adams, J.; Walters, L. Historical changes in intertidal oyster (Crassostrea virginica) reefs in a Florida lagoon potentially related to boating activities. J. Shellfish Res. 2002, 21, 749–756. [Google Scholar]
  77. Temmink, R.J.M.; Christianen, M.J.A.; Fivash, G.S.; Angelini, C.; Boström, C.; Didderen, K.; Engel, S.M.; Esteban, N.; Gaeckle, J.L.; Gagnon, K.; et al. Mimicry of emergent traits amplifies coastal restoration success. Nat. Commun. 2020, 11, 1–9. [Google Scholar] [CrossRef]
Figure 1. Pre- and post-deployment of 0.25 m2 Vexar plastic mats (a,c) and BESE elements mats (b,d). All mats were prepared with 36 disarticulate shells and weighed down with cement donuts in the field.
Sustainability 13 07415 g001
Figure 2. Potential respiration rate in microcosms (n = 5) of site sediment and site water incubate with (BESE) or without (No BESE) fragmented BESE. Different letters represent differences (p < 0.05) based on Tukey HSD post hoc tests.
Sustainability 13 07415 g002
Figure 3. Final concentrations (mean ± standard error) of surface water nutrients following 5 weeks of incubation with (BESE) or without (No BESE) fragmented BESE for (a) dissolved organic carbon (DOC), (b) nitrate + nitrite (NO3), and (c) soluble reactive phosphorous (SRP). For all data, n = 5. Different lower-case letters represent differences (p < 0.05) between BESE and No BESE treatments; different upper-case italic letters represent differences (p < 0.05) among BESE treatments exposed to different experimental conditions; all pairwise comparisons were based on Tukey HSD post hoc tests.
Sustainability 13 07415 g003
Figure 4. Oyster monitoring metrics for Northern (a,b) and Southern (c,d) BACI reefs. Values represent mean ± standard error; n = 5. Different letters represent differences (p < 0.05) between treatments (reef type) across both regions (Northern and Southern) based on Tukey HSD post hoc tests. Dead reef shell heights not shown as all values were zero.
Sustainability 13 07415 g004
Figure 5. Field mass loss (%) of coarsely fragmented BESE or plastic (mean ± standard error; n = 5) after 6 and 12 months of deployment on live oyster reefs in the southern (S) or northern (N) region of Mosquito Lagoon (a). Different lower-case letters represent differences (p < 0.05) between BESE and No BESE treatments; different upper-case italic letters represent differences (p < 0.05) among BESE treatments exposed to different experimental conditions; all pairwise comparisons were based on Tukey HSD post hoc tests. Appearance of litter bags pre-deployment (b) and of BESE following retrieval (c) also shown.
Sustainability 13 07415 g005
Table 1. Summary of studies presented, including primary research questions and hypotheses. “Plastic” refers to Vexar™ aquaculture mesh and “BESE” refers to biodegradable BESE-elements®.
StudyPrimary Research QuestionPrimary Hypothesis
Laboratory respirationCan BESE serve as a substrate for microbial respiration?CO2 production will increase with the addition of BESE.
Laboratory nutrient releaseCan BESE release labile nutrients given idealized laboratory conditions?Dissolved inorganic N, P, and organic C will increase when BESE is incubated under warm temperatures and UV light.
Field BACI study—oyster monitoringAre oyster reef restoration success metrics comparable between BESE and plastic materials?Oyster density will be the same on BESE and plastic restored reefs at 12 months post-restoration.
Field BACI study—sediment biogeochemistryDoes the rate or degree to which biogeochemical hot spots develop under recently restored oyster reefs differ between BESE and plastic materials?BESE will accelerate the development of biogeochemical hot spots in sediments beneath oyster reefs.
Field BESE degradationWhat is the initial rate of mass loss for BESE material under field conditions?Significant mass loss of BESE will be observed within the first year of field deployment.
Table 2. Means ± standard errors (n = 10) of sediment biogeochemical properties for the field BACI experiment. Letters represent statistical differences (p < 0.05) based on pairwise comparisons; data not subdivided by month was not significantly different over time. Extr. NH4+ was the only property to show a significant treatment effect; data presented for dead reefs (D) and the mean of live (L), BESE (B), and plastic (P) separately.
Month
01612
OM (g kg−1)89.9 ± 5.3 a86.2 ± 4.7 a,b94.6 ± 5.5 b109.4 ± 4.6 c
DBD (g cm−3)1.02 ± 0.04 a0.92 ± 0.04 a1.03 ± 0.04 ab0.90 ± 0.03 b
Total P (g kg−1)0.81 ± 0.02
Total C (g kg−1) 40.1 ± 1.24
Total N (g kg−1)1.58 ± 0.11 a1.50 ± 0.11 a,b1.75 ± 0.10 b2.33 ± 0.12 c
Extr. DOC (g kg−1)71.8 ± 6.4 a77.2 ± 6.4 a,b57.8 ± 3.5 b87.8 ± 6.5 c
Extr. NO3 (g kg−1)1.83 ± 0.11 a0.51 ± 0.05 b1.05 ± 0.08 c2.42 ± 0.10 a,b
Extr. NH4+ (g kg−1)1.1 ± 0.2 a0.9 ± 0.4(D)
9.0 ± 1.0(L,B,P) b
1.7 ± 0.4 c0.9 ± 0.5(D)
9.7 ± 1.0(L,B,P) c
Extr. SRP (g kg−1)0.81 ± 0.11 a0.67 ± 0.10 a,b0.40 ± 0.06 b,c0.97 ± 0.12 c
Abbreviations: OM (organic matter), DBD (dry bulk density), P (phosphorus), C (carbon), N (nitrogen), Extr. (extractable), DOC (dissolved organic carbon), SRP (soluble reactive phosphorus).
Publisher’s Note: MDPI stays neutral with regard to jurisdictional claims in published maps and institutional affiliations.

