
Evaluation of the Tourism Climate Index in the Canary Islands
by
 and
and
Silvia Alonso-Pérez
1,*, 
Javier López-Solano
1,2,
Lourdes Rodríguez-Mayor
3 and
José Miguel Márquez-Martinón
1 1
School of Architecture, Universidad Europea de Canarias, 38300 La Orotava, Spain
2
Centro de Investigación Atmosférica de Izaña, Agencia Estatal de Meteorología, 28071 Madrid, Spain
3
Independent Researcher, 28001 Madrid, Spain
*
Author to whom correspondence should be addressed.
Sustainability 2021, 13(13), 7042; https://doi.org/10.3390/su13137042
Submission received: 20 May 2021
/
Revised: 15 June 2021
/
Accepted: 18 June 2021
/
Published: 23 June 2021
Abstract
:In this study, we performed a diagnostic and evolutive analysis of the bioclimatology of the Canary Islands, an Atlantic archipelago where the climate itself is a main feature promoting tourism. Among all the tourist-climate indices described in the literature, we evaluated the most widely used, which is the Tourism Climate Index (TCI) proposed by Mieczkowski (1985). Monthly mean TCI time series were calculated using meteorological data from the Spanish State Meteorological Agency database and the European Climate Assessment and Dataset. Our results show TCI values greater than 50 during almost every month in the period 1950–2018, with mean values over the entire time series between 70 and 80. According to the TCI classification scheme, these values correspond to a very good thermal comfort along all of the period. Our results also point to spring as the season with the best TCI, with maximum values around 80 for this index in April—excellent according to the TCI classification. However, we did not find a correlation between inbound arrivals and the TCI index, which might point to a lack of information available to tourists. This opens an opportunity for policymakers and tour operators to better publicize the best seasons for holidays in the islands.
1. Introduction
Weather and climate are key factors to select a touristic destination, to the point that many tourists base their choices (destination and date) entirely by climatic considerations [1]. Tourism operations themselves are also affected by climate and weather, as they impact on the costs of heating and cooling, water provision, and tourist facilities’ maintenance. Moreover, the impact of climate change in a tourist destination may impact the temporal and spatial pattern of tourism demand. Hence, climate and weather can affect the tourism business model. Because of these aforementioned reasons, understanding both local climate conditions through the year and their trends is thus of great importance, not only for developing strategies for the mitigation of climate change impact but also for tourism development [2,3,4].
Many efforts have been made to quantitatively characterize the climatic well-being of tourists from a biometeorological point of view—that is, considering weather parameters and an estimation of the outdoor thermal comfort. One of the first and most widely used indices to characterize the thermal comfort of tourists, the Tourist Climate Index (TCI), was developed by Mieczkowki [1]. This index is representative of light outdoor touristic activities. Different modifications of the TCI arose in the literature, not only to improve the knowledge of its limitations ([5,6,7] and references therein) but also to study the thermal comfort of tourists for more specific types of tourism, such as beach tourism [8,9], outdoor activities on urban destinations [10], or interior tourism [11]. Still, the TCI has been widely used to study the impact of climate on tourism in different geographical areas, such as Europe [12], the Mediterranean [13], Iran [14,15,16,17], the United States and Canada [5], Spain [18], the Caribbean [3], the Republic of Moldova [4], Montenegro [19], Georgia [20,21], China [22], and Indonesia [23].
In this study, for the first time in the literature to our knowledge, we performed a diagnostic and evolutive analysis of the bioclimatology of the Canary Islands, an Atlantic archipelago where the climate itself is a main feature promoting tourism. Among all the tourist-climate indices described in the literature, we evaluated the most widely used, which is the aforementioned TCI. We chose the TCI because of the characteristics of touristic activities in the Canary Islands, which have evolved from the sun and beach model of the 1960s to offer a more extended range of experiences, such as sports, wellness, and rural tourism [24,25].
Climate on the Canary Islands has been studied by many authors [26,27] and references therein [28,29]. There are also many in-depth studies on one of the most characteristic features affecting the climate of the islands, namely, African dust intrusions [30,31,32,33,34]. In the winter, African dust intrusions are more intense and frequent at lower altitudes, i.e., where most tourists are located, while in the summer, these mineral dust intrusions affect medium and high altitudes. It is worth noting that many studies point that the exposure to mineral dust can lead to health problems, increasing morbidity and mortality [35,36,37,38]. Regarding climate change, the impact of global warming in temperature trends [39,40,41,42,43], adaptation strategies [44], and its economic impact on tourism [45] has also been studied for this archipelago. However, to our knowledge, this is the first time a climate comfort index for tourism has been studied in the Canary Islands. Besides the purely scientific interest of this novel study, we also believe this research might help policymakers and tour operators to make decisions, which are especially important to the islands in view of the importance of tourism to their economy.
2. Data and Methods
2.1. The Study Area
The Canary Islands are a Spanish archipelago located near the northern coast of Africa in the North Atlantic subtropical area. The shortest distance to Morocco is 95 km. The climate of this archipelago is characterized by its great stability through the year. Despite its latitude, monthly mean temperatures range from 18 °C to 24 °C [46], while maximum monthly precipitation ranges from 30 mm (eastern islands) to 100 mm (western islands) and take place from autumn to winter [47]. This mild climate is driven by the influence of the Azores high, with establishes cool humid trade winds through the year, only interrupted for short periods by African dust outbreaks [31].
Climate difference between islands is, in principle, not affected by their geographical position. However, it is well known (see for example [29]) that the Canary Islands present a variety of microclimates mainly caused by their differences in orography. In particular, orography plays a crucial role in the exposure to the easterly trade winds, which are one of the key factors affecting precipitation. Overall, the eastern islands (Lanzarote, Fuerteventura, and Gran Canaria) present higher temperature ranges and lower precipitations than the western ones (La Palma, El Hierro, La Gomera, and Tenerife).
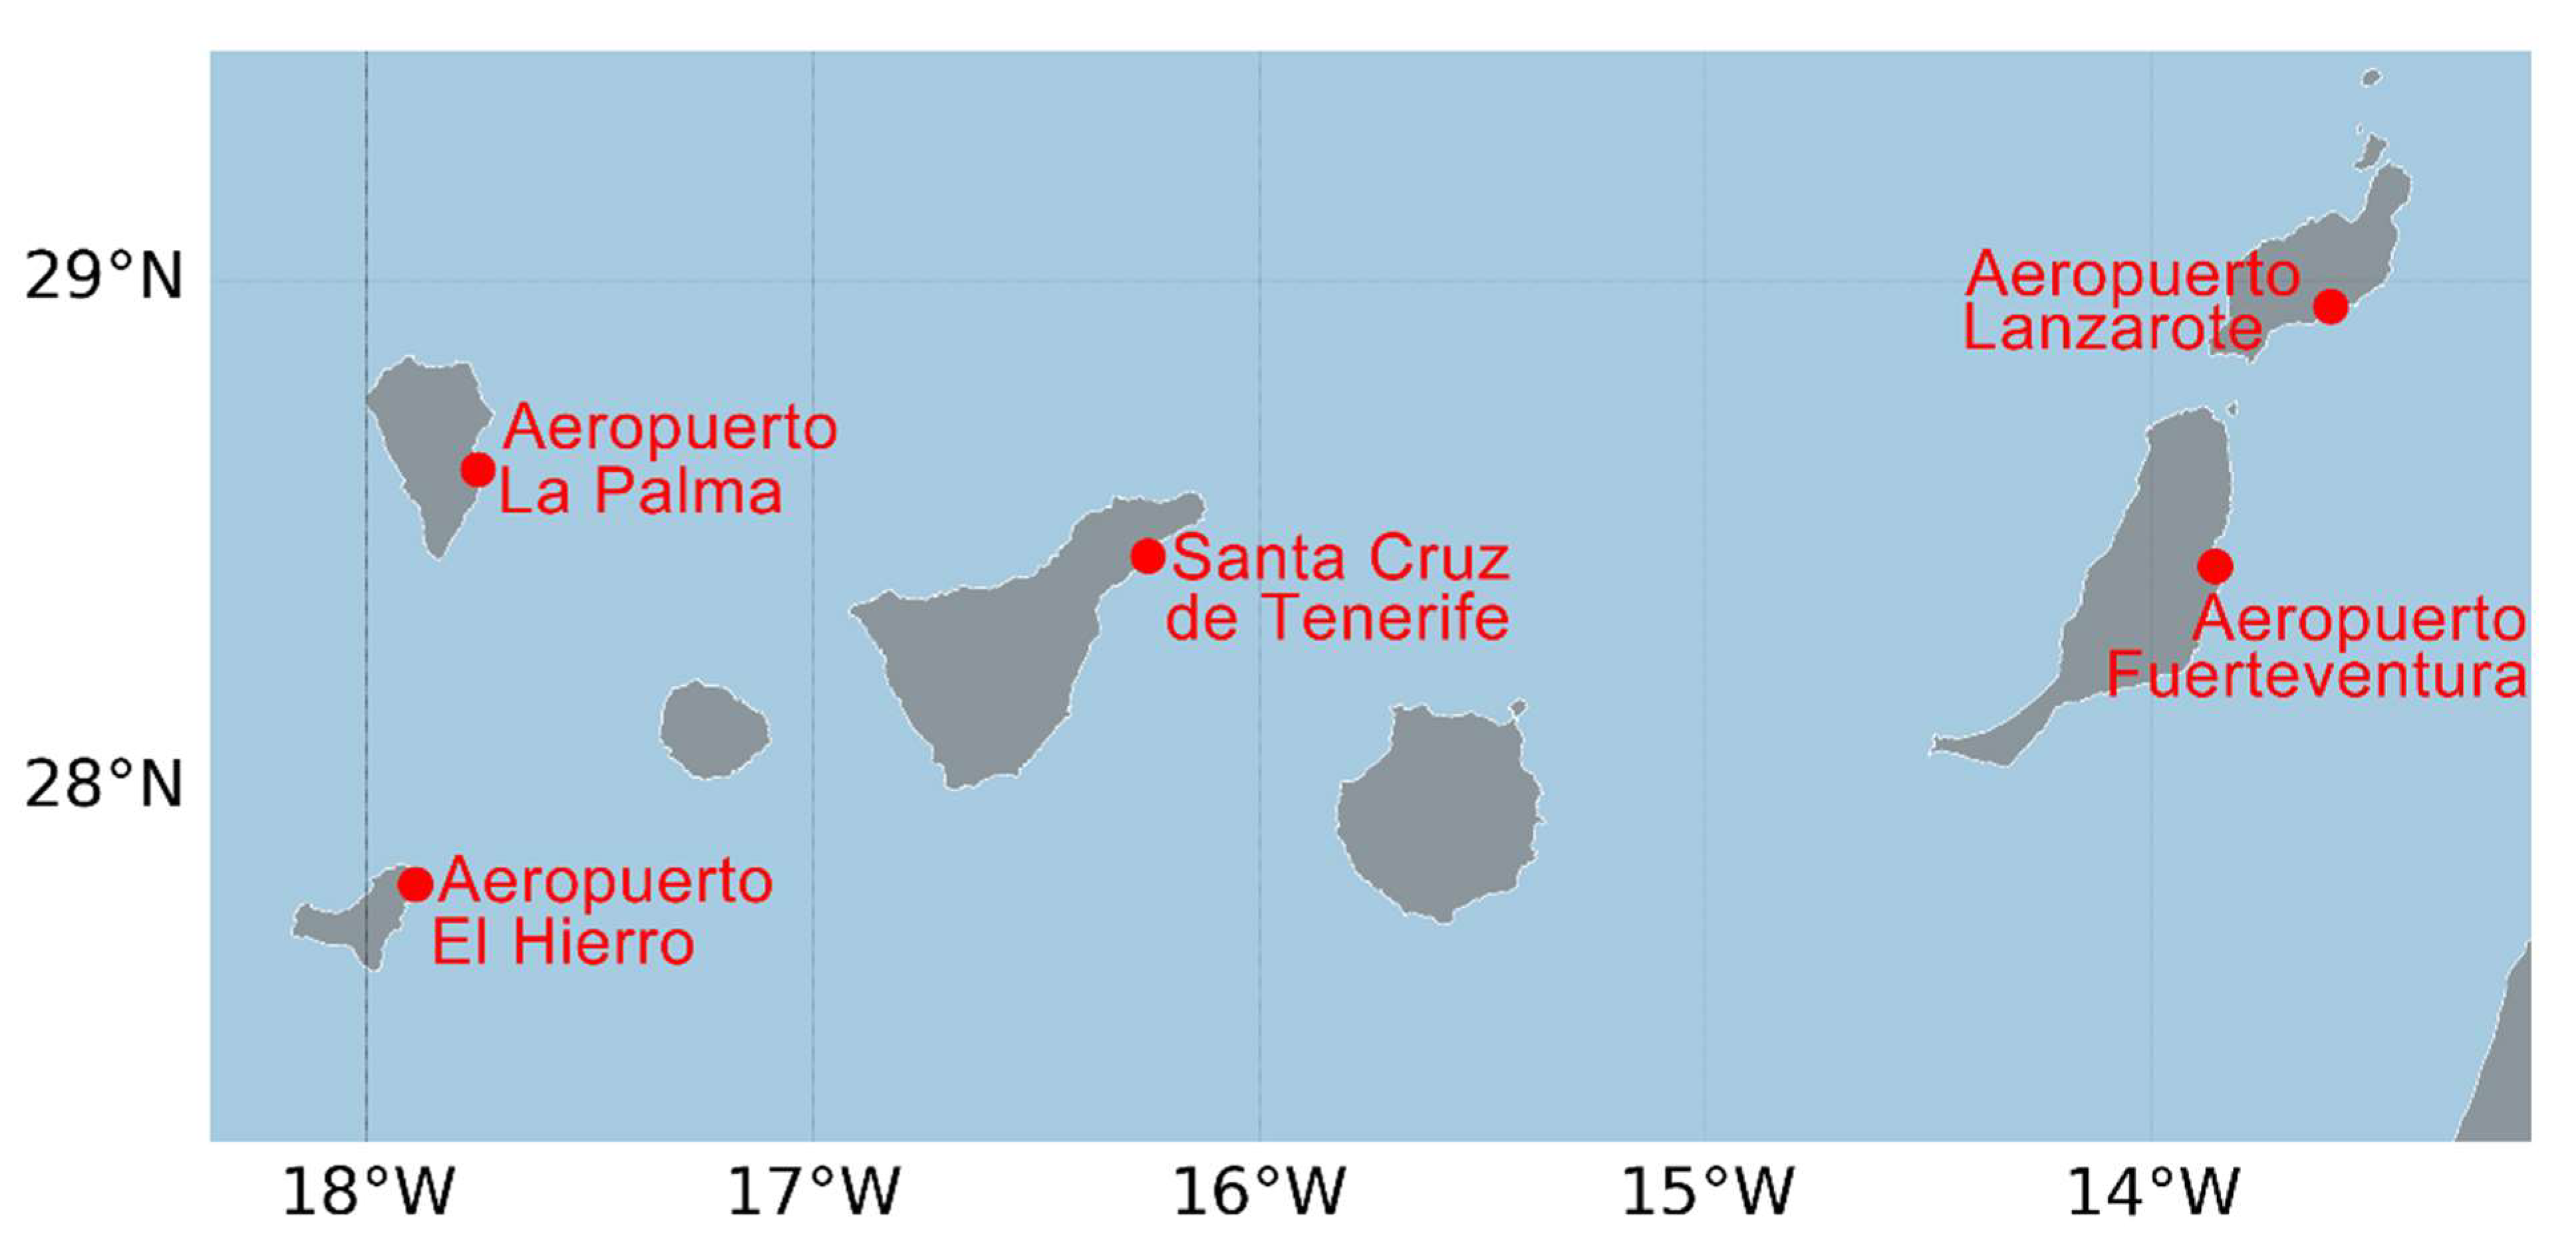
For this study, we selected five sites on the basis of climatic data availability that are representative of the eastern, central, and western islands. These measurement stations are part of the National Spanish Meteorological Agency (AEMET) network. The latitude coverage of these sites ranges from the southernmost to the northernmost island (Figure 1). The sites are located at low altitudes (Table 1), being representative of the most important tourist destinations on beaches and island capitals.
2.2. The Tourism Climate Index
Among all the tourism climate indices that can be found in the literature, we chose the Tourism Climate Index (TCI) developed by Mieczkowski [1]. This index is the most widely used and it is representative of light physical outdoor activities and recreation such as sightseeing, shopping, and other non-specific touristic activities. The common touristic activities in the Canary Islands and the evolution of its tourism model [24,25] make this index a good choice. TCI is calculated as the combination of seven monthly climate variables (maximum and minimum daily air temperature, minimum daily relative humidity, mean daily relative humidity, amount of precipitation, daily insolation, and mean wind speed). These parameters are combined into five subindices (Equation (1)) to calculate the TCI value:
where CID is the so-called “daytime comfort index”, CIA is the “daily comfort index”, R is based on amount precipitation in mm of rain, S is based on the daily solar insolation in hours, and W is based on wind speed in m/s. A rating scheme, with scores from 0 to 5, were used to obtain the subindices, as proposed by Mieczkowski [1], with 0 as an extremely unfavorable value and 5 as the best possible value. Although many authors have modified the original TCI by using daily data to have a better time resolution, we calculated monthly TCI because of data availability (see Section 2.3). Nonetheless, as we used the 1985–2018 monthly TCI time series, we believe a 33-year climatic scale is enough to characterize the variation of TCI values.
TCI = 2·[4·CID + CIA + 2·R + 2·S + W]
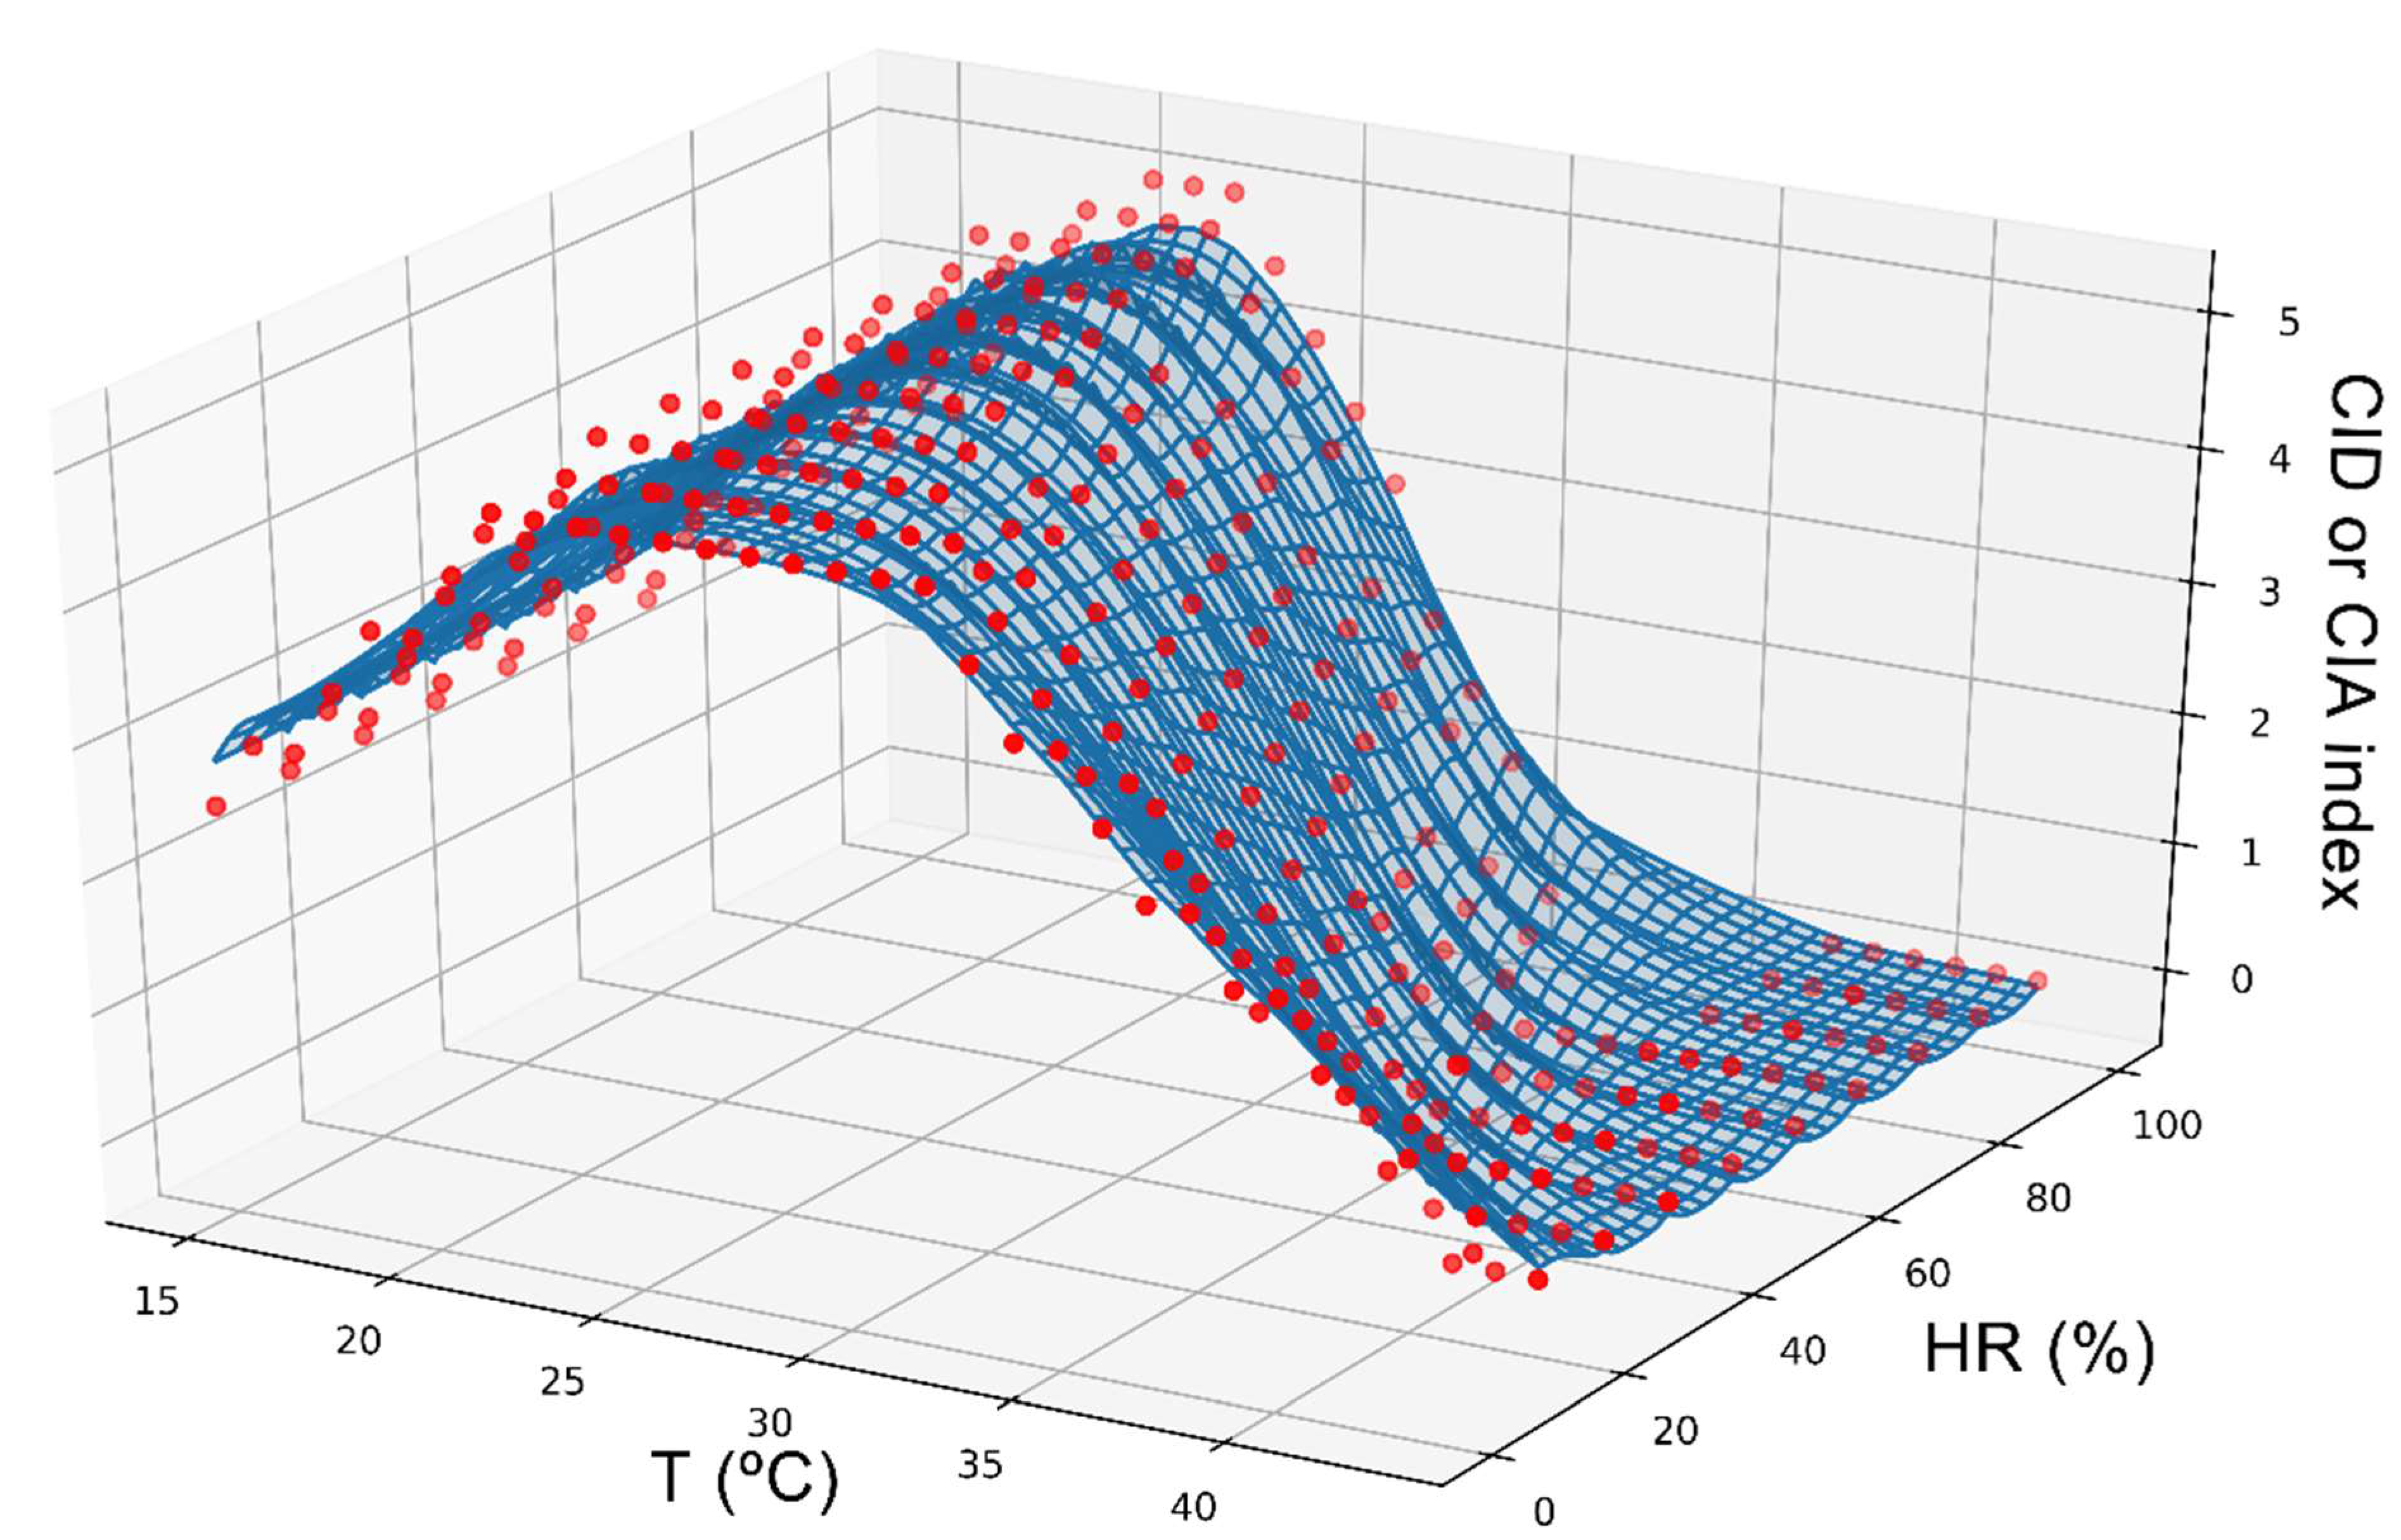
The CID and CIA subindices use the same temperature and relative humidity datasets as input. From these datasets, and following [1], we calculated the maximum daily temperature and the minimum daily relative humidity to determine de CID subindex. On the other hand, the CIA subindex is calculated from the mean daily temperature and mean daily relative humidity. Regarding the functional form of the CID and CIA, since both are thermal comfort indices and thermal comfort is a complex psychological parameter, we need to use a psychometric chart in order to rate their values. We used the thermal comfort rating system proposed by Mieczkowski [1], which is based on the effective temperature chart of the American Society of Heating and Air-Conditioning Engineers [48]. To facilitate the calculation of these subindices, we digitized the mentioned thermal comfort rating system presented in Mieczkowski’s original paper [1]. In this way, we obtained 321 data points, which were chosen for temperatures ranging from 15 to 41 °C and relative humidity ranging from 20 to 100%, since temperatures outside that range and relative humidity below 20% are not common in the area of study [26,27,28,29] (see supplementary material). We then performed a multidimensional smoothing spline fit to the 321 digitized points using a linear radial basis function based on the Euclidean distance. The digitized points and the multidimensional spline fit are shown in Figure 2. It is worth stressing that the functional form is the same for the calculation of both the CIA and CID indices, and that the final output value of each particular index only depends on which input temperature and relative humidity data are used.
Once the scores of the different subindices were calculated, we were finally able to determine the TCI. This index takes values from 0 to 100, which can be converted to descriptive categories using the classification scale shown in Table 2.
2.3. Climatic Data
For each month, we calculated minimum relative humidity using daily averages from the European Climate Assessment and Dataset [49]. The other monthly climatic parameters used in the calculation of the TCI were monthly data retrieved from the National Spanish Meteorological Agency open database, available online: https://opendata.aemet.es/centrodedescargas/inicio, accessed on 12 June 2021 [50]. Data availability is different from one site to other (see the last column in Table 1), and therefore we calculated TCI interannual monthly means over common years, which corresponds to the period 1985–2018. Note that data from this open database is only available as monthly means, and therefore this was the reason to calculate monthly values of TCI. Although some recent studies have used daily data, it is worth noting that the original TCI calculation of Mieczkowski [1] used monthly data. Both databases have passed quality control and homogeneity checks using procedures explained in their websites, although we additionally performed a search for possible outliers, finding no large periods with suspecting data.
2.4. Tourism Statistics
We used tourism statistics to compare against our TCI results. We retrieved monthly data of tourist visitation to the Canary Islands from the Canary Islands Institute of Statistics’ open database, available online: http://www.gobiernodecanarias.org/istac, accessed on 12 June 2021 [51]. In particular, we used monthly means of number of inbound tourists from foreign countries. Data availability limited our study to the period 2009–2018.
3. Results and Discussion
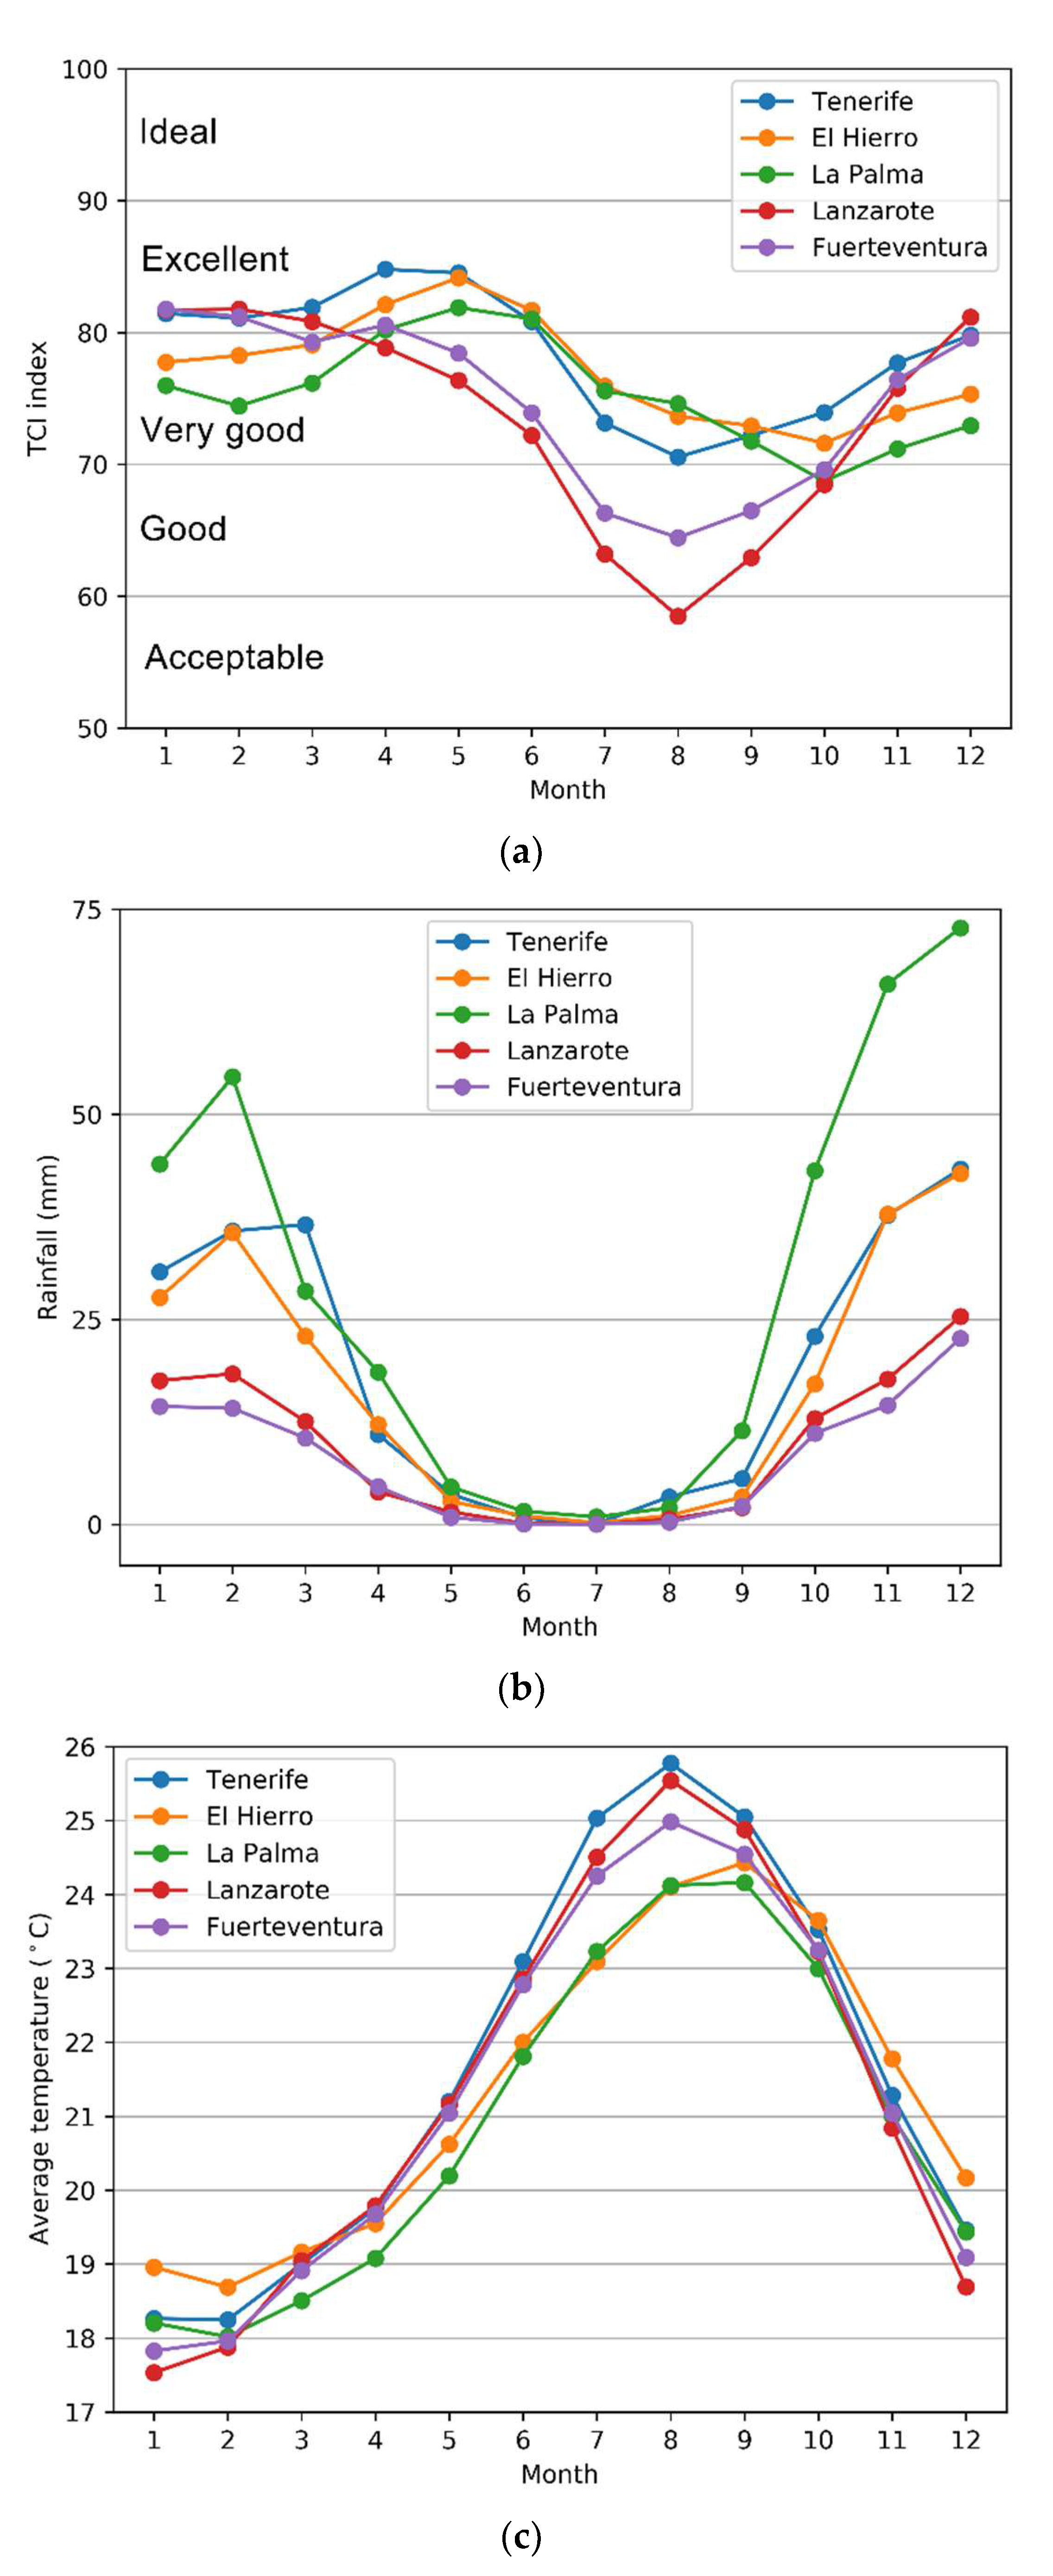
In the 1985–2018 period, monthly mean TCI values in all the sites studied across the Canary Islands scored between 58 and 84, and therefore the climate comfort can be categorized ranging from acceptable to excellent through all the year (Figure 3a). During months of maximum TCI across the Canary Islands, the climate can be categorized as “excellent” for tourism.
Maximum TCI scores for both Lanzarote and Fuerteventura occur during winter, while in Tenerife, La Palma, and El Hierro, they occur in spring. The variation in maximum TCI scores, which ranges between 82 (Lanzarote, Fuerteventura and El Hierro) and 85 (Tenerife), is lower than the variation in minimum TCI scores, ranging from 58 (Lanzarote) to 72 (El Hierro).
For Lanzarote and Fuerteventura (the easternmost islands), and also for Tenerife, the minimum TCI scores occur in summer, when maximum average temperatures (Figure 3c) and minimum rainfall (Figure 3b) occur. El Hierro and La Palma (the westernmost islands) show the lowest TCI scores in autumn and winter, coinciding with the highest rainfall (Figure 3b) and lowest temperatures (Figure 3c) for these islands. The lowest TCI score in the archipelago was found during August in Lanzarote, although the value is still in the “acceptable” climate comfort category.
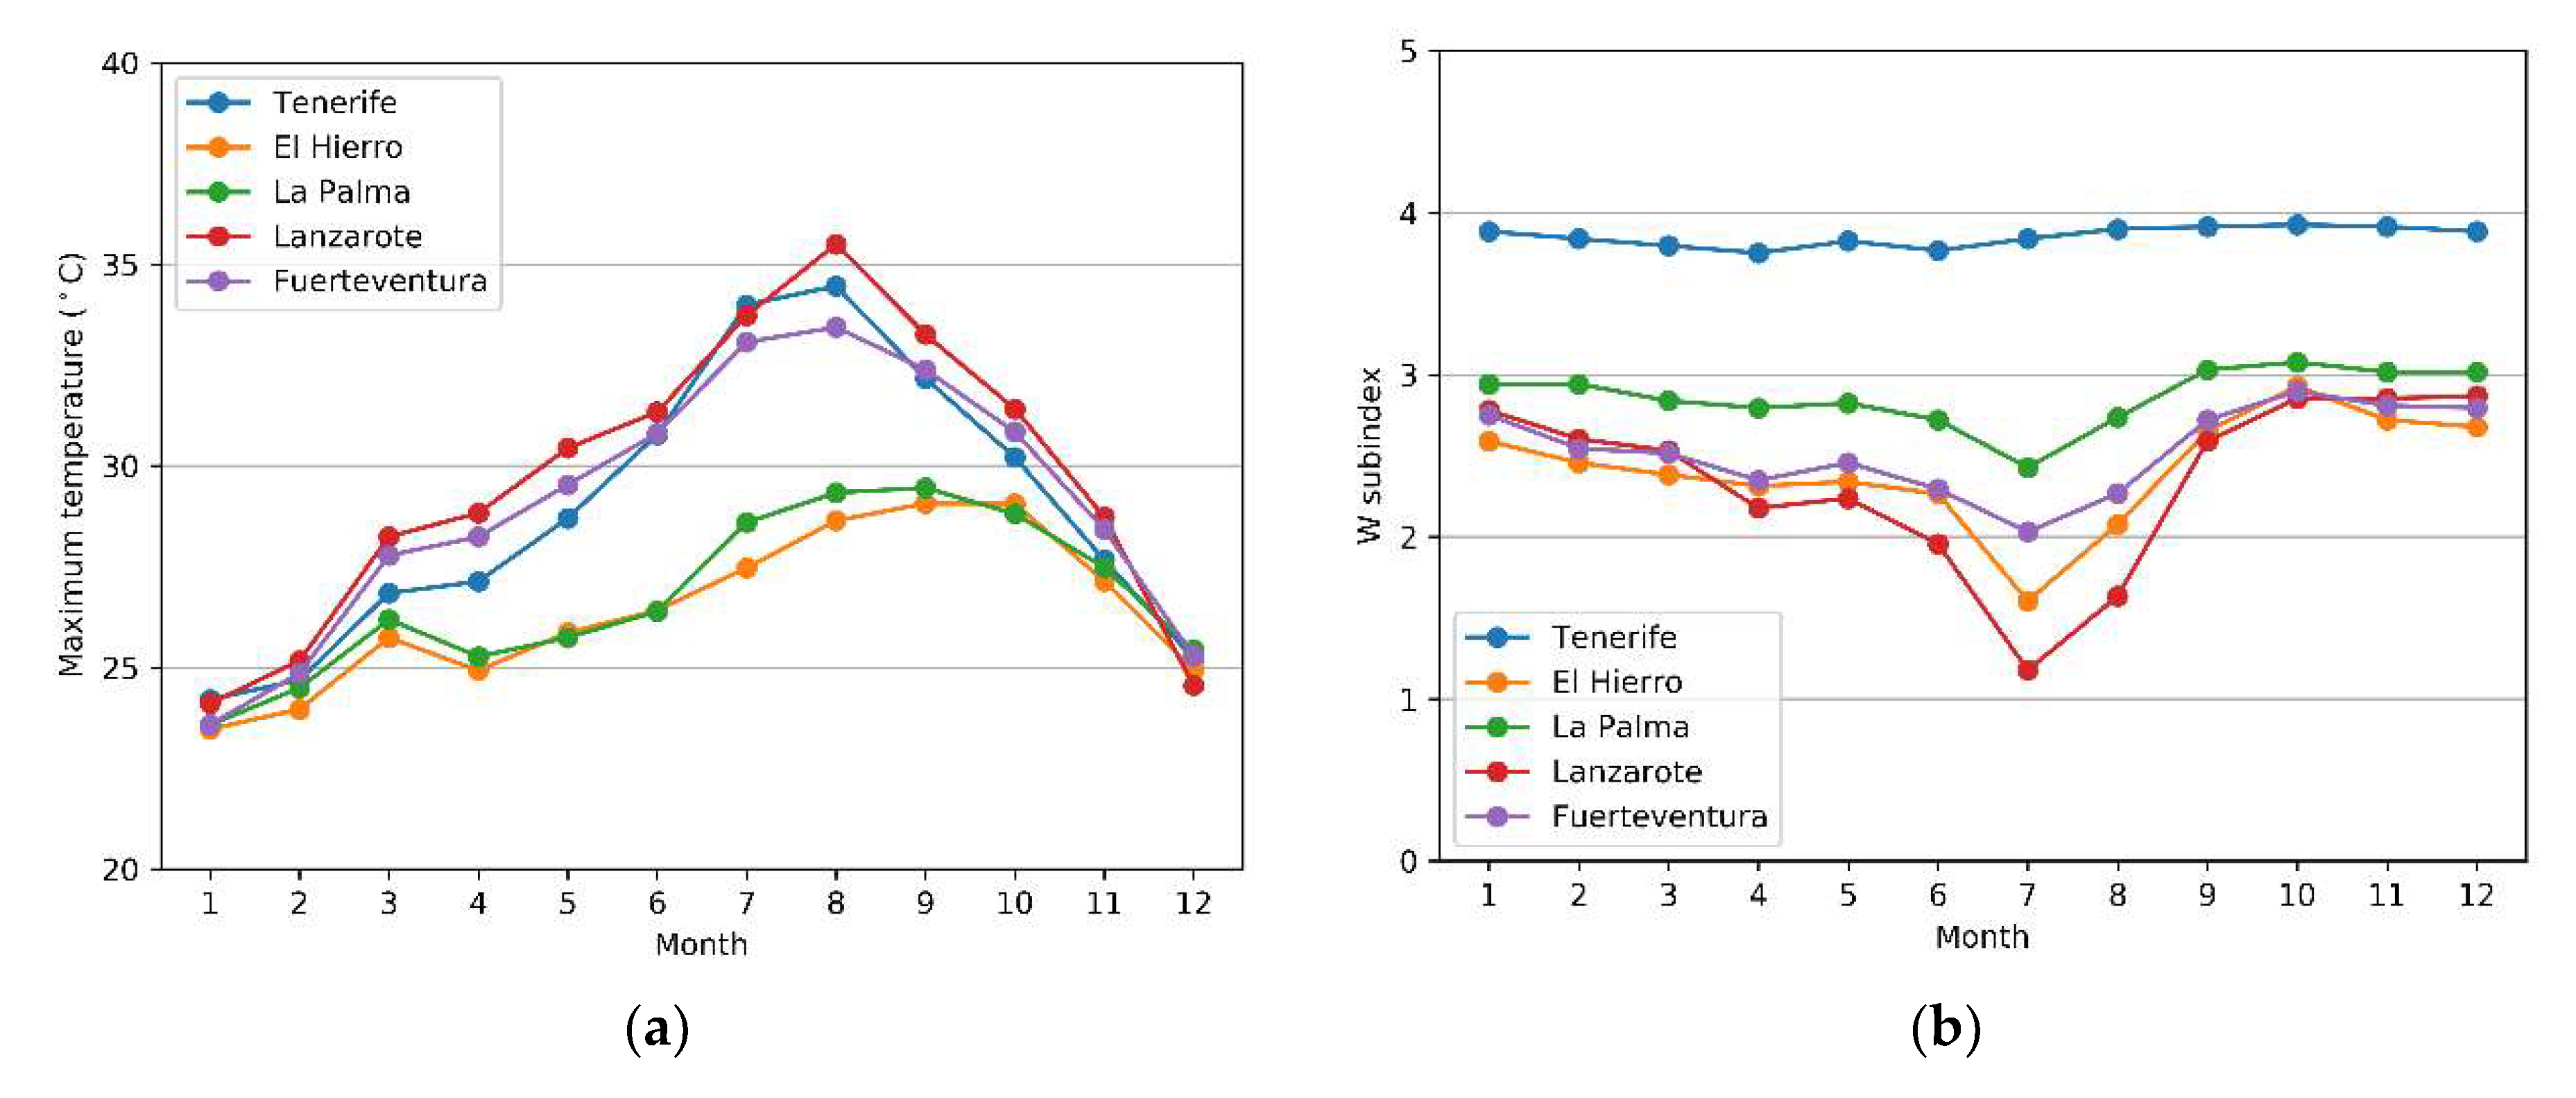
The lower TCI scores in the central and eastern islands during the summer corresponded to minimum values of the CID index (Figure 2), which in turn are caused by quite high maximum temperatures that range from 33 °C up to 34.5 °C (Figure 4a). In contrast, maximum temperatures at El Hierro and La Palma were found to be below 30 °C throughout the year, which translates into a better TCI, especially during the summer. However, it should be stressed that maximum temperature alone does not explain the TCI values. For example, other factors contributing to the better summer TCI score for El Hierro and La Palma are the higher minimum relative humidity and lower daily average temperature (Figure 3c) for these two islands compared to the rest of the archipelago. In Fuerteventura, and especially in Lanzarote, the low W subindices scores, related to the high wind speeds during summer, also contribute to these minimum TCI values (Figure 4b).
All the above shows that the TCI has a reasonable dependency on the weather variables it takes into consideration, and therefore it can be expected to be a representative index for the well-being of tourists. We can now assess whether the annual variability in climate comfort is being determinant of monthly tourism demand in the Canary Islands. For this, we analyzed the possible relation between the annual variability of the TCI index and the number of inbound tourists. It is expected that if climate comfort is determinant, the annual distribution of TCI scores will follow the distribution of tourism demand indicators such as the number of tourists, accommodation costs, overnight stays, or tourism turnover [5,6].
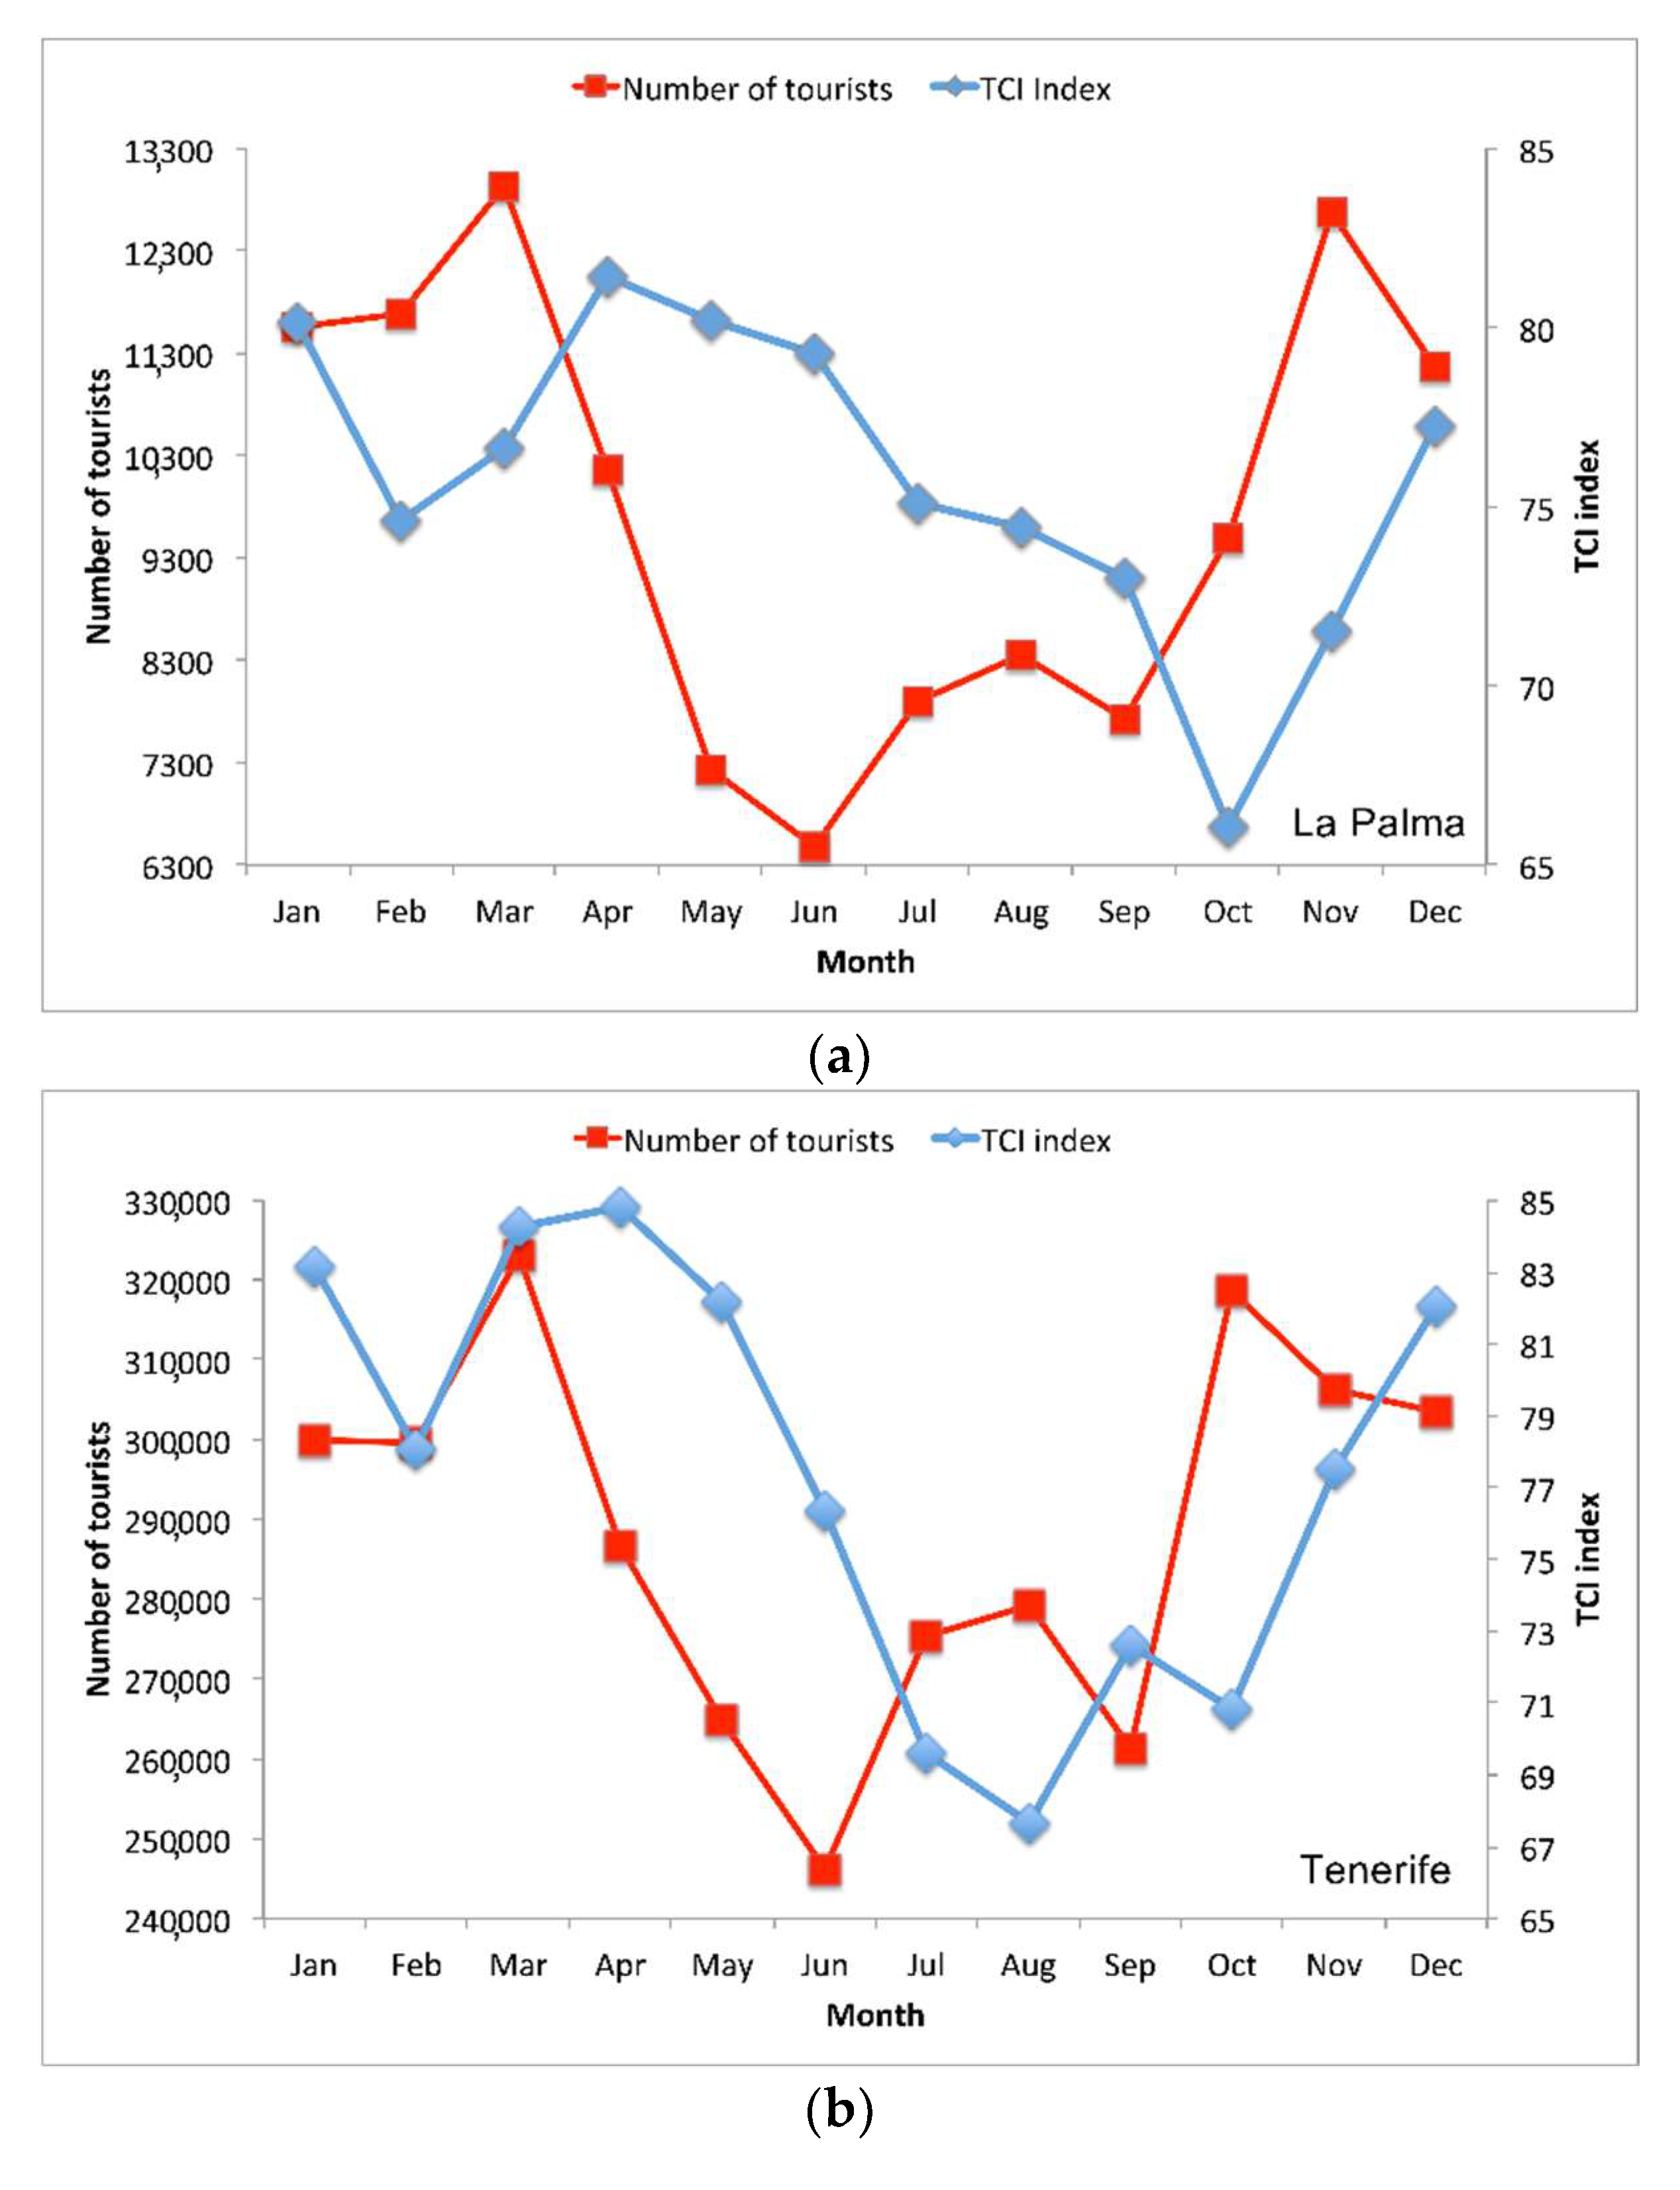
In Figure 5, we show the annual distribution of TCI scores and the number of inbound tourists for three of the study sites: La Palma, as representative of the western islands; Tenerife, as representative of central islands; and Lanzarote, as representative of the eastern islands. In all three cases, we found no correlation between the distributions. Looking at these plots, it seems that inbound tourists in the Canary Islands do not take into consideration weather conditions when planning their holidays in this archipelago. This is expected because the TCI scores are in most cases over 70, which corresponds to very good or excellent climate categories. Still, it is worth noting that the months with the higher TCI values (TCI > 80) in some cases are also those with the lowest number of tourists (see in particular the month of April for La Palma (Figure 5a) and Tenerife (Figure 5b)). Note that there is not even a delay between both curves. A delay like that would imply that tourists first check the weather conditions and then make the reservations, but this does not seem to be the case. This could represent an opportunity for policymakers and tourist operators for marketing campaigns (backed by scientific data) focused in attracting visitors during those months with lower number of tourists but very good and even excellent climate comfort for touristic activities.
It should also be noted that the previous analysis does not take into account the restrictions to travel imposed by work or school periods, which likely play a large role on holiday reservations. It would be interesting to study the relation between the TCI and the number of tourists, with the latter disaggregated by age groups, as tourists already in retirement will not have these kinds of restrictions to travel throughout the year. Unfortunately, data disaggregated by age groups are not available at this time.
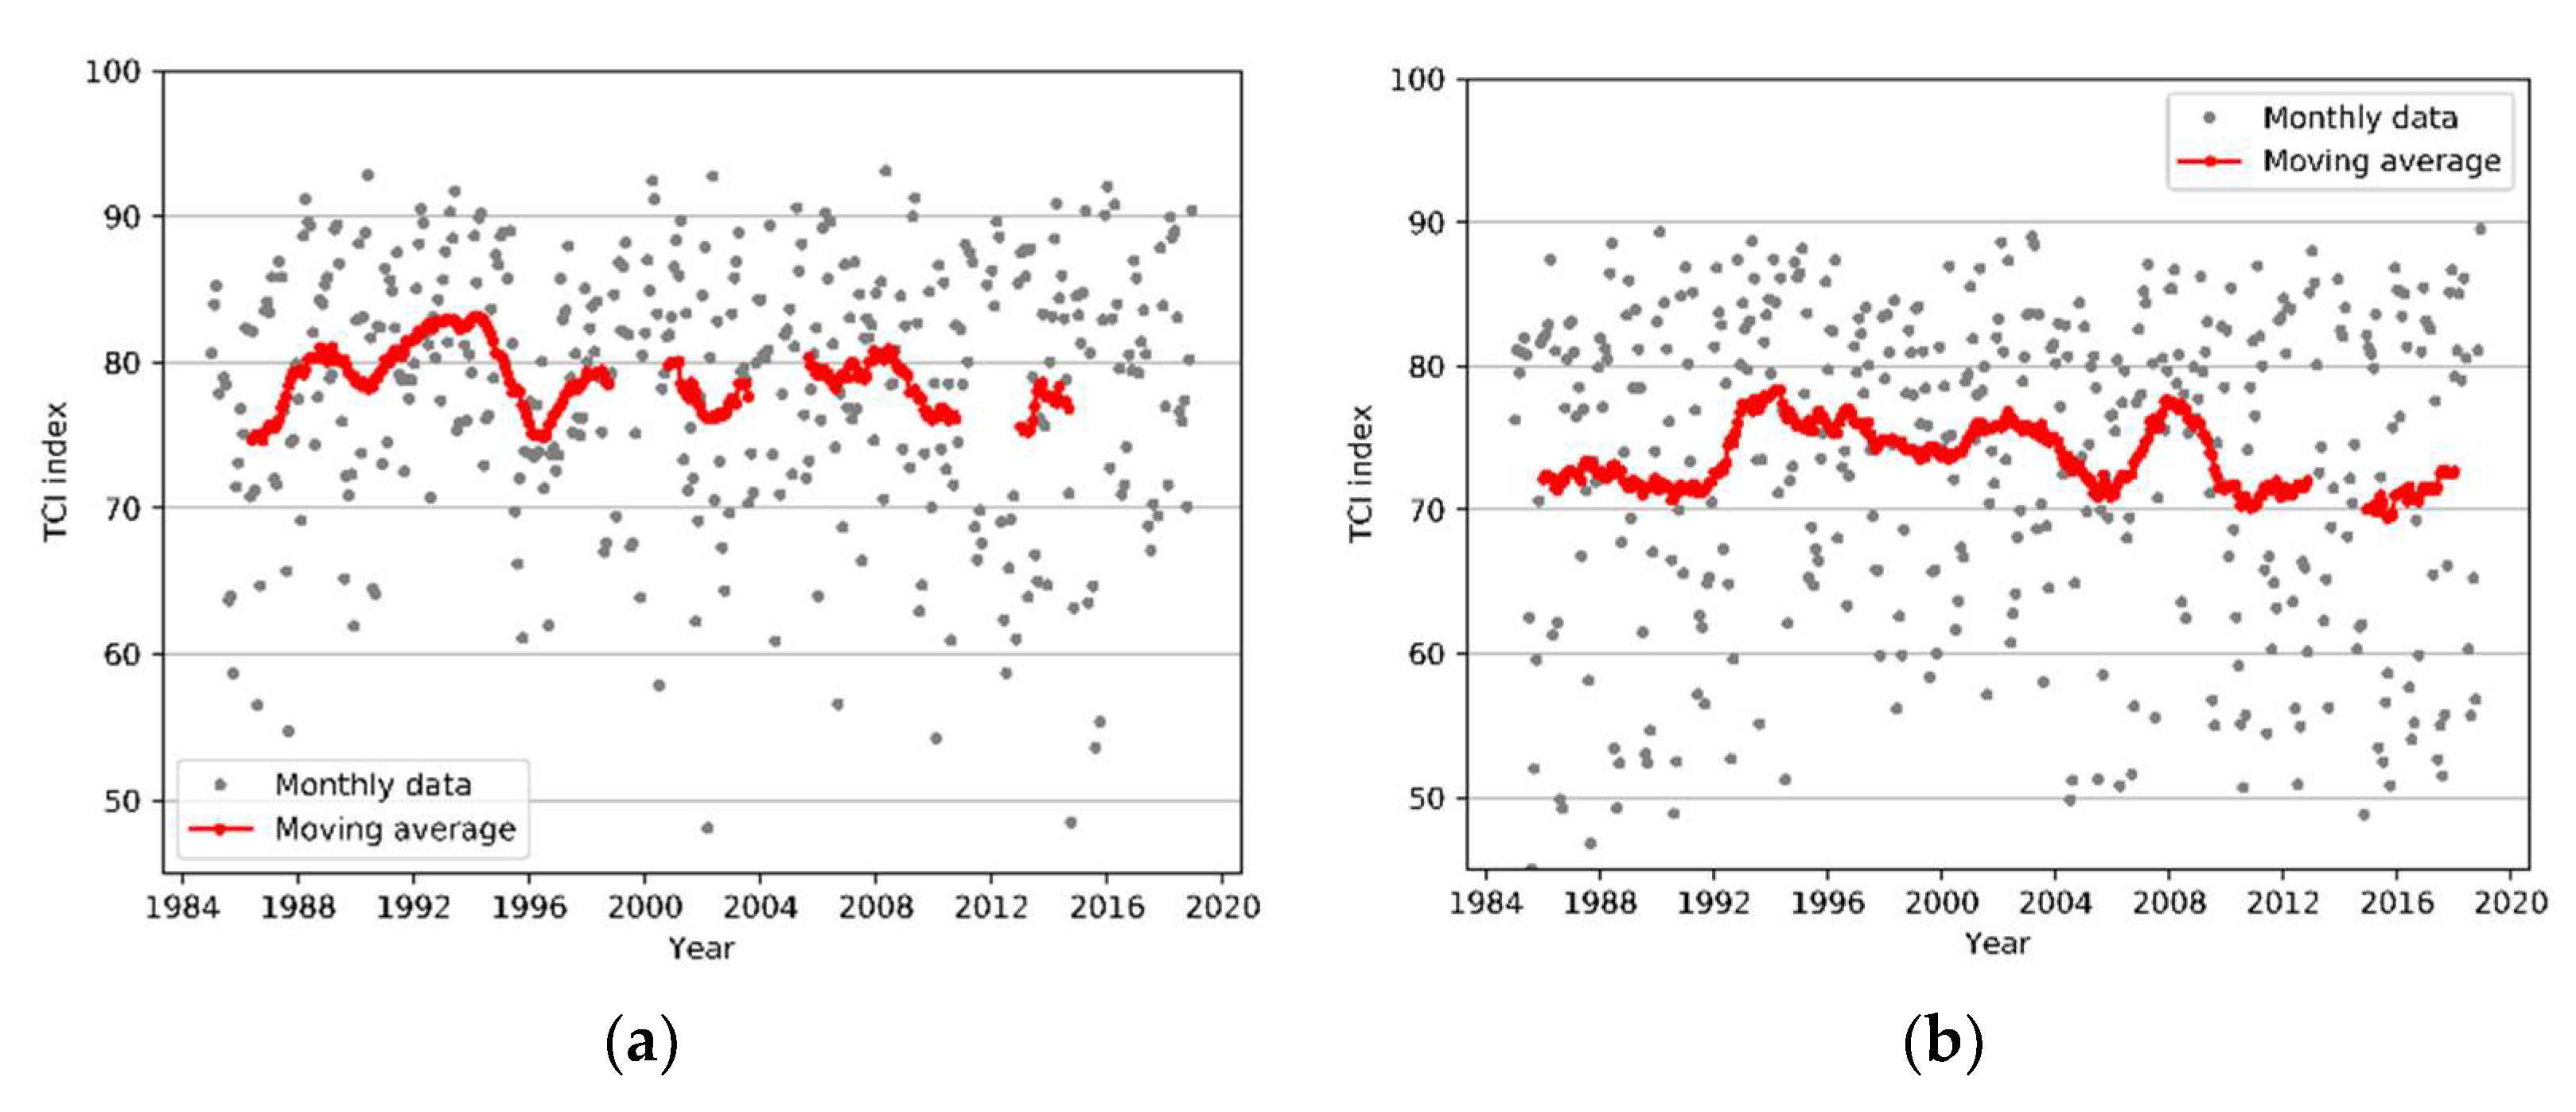
Finally, in Figure 6, we show the TCI monthly data for all the available years for the islands of Tenerife and Lanzarote. Higher variability was found in the case of Lanzarote. This was likely related to the contribution of the higher temperature range in this island, as mentioned above. By contrast, TCI data showed less spread and slightly higher values for the island of Tenerife. In both cases, the TCI values were found to be very stable over time, with no indication of the values becoming worse with time. This indicates that, according to the TCI, climate change does not have a noticeable effect on the tourism. However, note that this is only a very preliminary analysis that does not contemplate seasonality effects. Furthermore, model simulations should be used to predict the future climate of the islands and perform TCI projections.
4. Conclusions
Our results show a change related to geographical longitude in the month corresponding to both minimum and maximum TCI scores. Minimum TCI scores for the central and eastern islands occur in summer, while they occur in autumn in the western islands. Maximum TCI scores in the eastern islands occur in winter, while in the central and western islands, they occur in spring. Among the sites examined in this study, we found that Santa Cruz de Tenerife is the station with better TCI throughout the year, with 7 months classified as excellent climate for tourism (from December to June), and the rest of the year classified as very good. Tenerife is also the island with the largest number of inbound tourists from foreign countries among the five islands studied. However, although the more stable and favorable TCI scores of Tenerife may play a key role in the difference between the number of foreign visitors to the island compared with the rest of the archipelago, other factors such as the number of hotel beds, tourist infrastructure, and tourist attractions have to be taken into account. In any case, we found a variation of 77,000 inbound tourists from foreign countries when we compared the maximum and minimum number of tourists in Tenerife. Climate tourist comfort may be a good reason to support efforts to increase the number of foreign tourists, particularly from April to June, when TCI is very near or over 80. These efforts should take into account factors such as the tourists’ age, which might impose travel restrictions on some dates due to work or school obligations.
We found that the TCI assess the importance of climate as a main attribute of the Canary Islands as a tourist destination for sightseeing and other light outdoor activities thorough the year. However, climate comfort in the archipelago can be affected by a meteorological situation not considered in any tourism climate index: the presence of high concentrations of mineral particulate matter due to African dust outbreaks. As already mentioned, African dust episodes are one the most characteristic features affecting the climate of the Canary Islands. Frequent and intense African dust episodes affecting low altitudes, where most tourist stay, occur from December to March, with maximum contribution to the total suspended particulate concentrations in February [31]. It can be expected that the high particulate matter concentrations to have an effect on the health and therefore the comfort of tourists. The number of inbound arrivals seems to indicate that information on the occurrence and effects of African dust episodes is not taken into consideration by tourists. Due to the possible effect on tourists’ health, an effort to make this information widespread should be made by tourist operators and policymakers.
The weather variables considered in the TCI do not seem to take into full account the importance of these African dust episodes, with little variation between the February and April scores, as shown in Figure 3. We believe that the TCI expression could be improved including a specific index that takes into account the effect of particulate matter pollution in the comfort of tourists. This would require running pools among tourists and correlating their answers with extensive particular matter concentration data. It should be noted that this effort could be useful to improve the TCI formula, not only for the Canary Islands, but also places with high particulate matter concentrations due to anthropogenic causes, e.g., pollution caused by vehicles or factories operating close to touristic areas. We are working in a research project founded by Universidad Europea de Canarias to evaluate the use of low-cost particulate matter sensors to develop a high spatial resolution network. This network could complement the existing data provided by local environmental authorities. In the framework of this project, we aim to propose an improvement to the TCI formula to include the effect of particulate matter pollution in the comfort of tourists.
The results of this work could help policymakers and tour operators to better publicize the best seasons for holidays in the islands, as TCI is a valuable index for understanding how tourism demand evolves over time in a specific region [52].
Supplementary Materials
The following are available online at https://www.mdpi.com/article/10.3390/su13137042/s1.
Author Contributions
Conceptualization, S.A.-P.; methodology, S.A.-P. and J.L.-S.; software, S.A.-P. and J.L.-S.; formal analysis, S.A.-P., J.L.-S., L.R.-M. and J.M.M.-M.; investigation, S.A.-P. and L.R.-M.; writing—original draft preparation, S.A.-P.; writing—review and editing, S.A.-P., J.L.-S., L.R.-M. and J.M.M.-M.; funding acquisition, S.A.-P. All authors have read and agreed to the published version of the manuscript.
Funding
This research was funded by Universidad Europea, grant number 2019/UEM35.
Data Availability Statement
For sources of input dataset, see Section 2. For code and numerical results, please write to [email protected].
Acknowledgments
The authors thank Agencia Estatal de Meteorología and the European Climate Assessment and Dataset project for providing the open meteorological data used in this study. Moreover, we thank the Canary Islands Institute of Statistics for providing the data regarding tourists’ visitations used in this work. We appreciate the discussions regarding data availability with Emilio Cuevas and Juan José Bustos from the Izaña Atmospheric Research Center.
Conflicts of Interest
The authors declare no conflict of interest.
References
- Mieczkowski, Z. The tourism climatic index: A method of evaluating world climates for tourism. Can. Geogr. Le Géographe Can. 1985, 29, 220–233. [Google Scholar] [CrossRef]
- Matzarakis, A. Weather- and climate-related information for tourism. Tour. Hosp. Plan. Dev. 2006, 3, 99–115. [Google Scholar] [CrossRef]
- Moore, W. The impact of climate change on Caribbean tourism demand. Curr. Issues Tour. 2010, 13, 495–505. [Google Scholar] [CrossRef] [Green Version]
- Mihăilă, D.; Piticar, A.; Briciu, A.-E.; Bistricean, P.-I.; Lazurca, L.G.; Puţuntică, A. Changes in bioclimatic indices in the Republic of Moldova (1960–2012): Consequences for tourism. BAGE 2018, 77, 521–548. [Google Scholar] [CrossRef] [Green Version]
- Scott, D.; McBoyle, G. Using a ‘tourism climate index’ to examine the implications of climate change for climate as a tourism resource. In Proceedings of the First International Workshop on Climate, Tourism and Recreation, Freigburg, Germany, 5–10 October 2001; Matzarakis, A., de Freitas, C.R., Eds.; International Society of Biometeorology: Paris, France, 2001. [Google Scholar]
- Anđelković, G.; Pavlović, S.; Ðurđić, S.; Belij, M.; Stojković, S. Tourism climate comfort index (TCCI)–An attempt to evaluate the climate comfort for tourism purposes: The example of Serbia. Glob. NEST J. 2016, 18, 482–493. [Google Scholar] [CrossRef]
- Fichett, J.M.; Hoogendoorn, G.; Robinson, D. Data challenges and solutions in the calculation of tourism climate index (TCI) scores in South Africa. Tourism 2016, 64, 359–370. [Google Scholar]
- Morgan, R.F.; Gatell, E.; Junyent, R.; Micallef, A.; Ozhan, E.; Williams, A.T. An improved user-based beach climate index. J. Coast. Conserv. 2000, 6, 41–50. [Google Scholar] [CrossRef] [Green Version]
- Perch-Nielsen, S.L. The vulnerability of beach tourism to climate change—An index approach. Clim. Chang. 2010, 100, 579–606. [Google Scholar] [CrossRef]
- Tang, M. Comparing the ‘Tourism Climate Index’ and ‘Holiday Climate Index’ in Major European Urban Destinations. Master’s Thesis, University of Waterloo, Waterloo, ON, Canada, 2013. [Google Scholar]
- López, A.M.; García, F.F. Propuesta de un índice climático-turístico adaptado al turismo de interior en la Península Ibérica: Aplicación a la ciudad de Madrid. Investig. Geográficas 2018, 31, 31. [Google Scholar] [CrossRef] [Green Version]
- Perch-Nielsen, S.L.; Amelung, B.; Knutti, R. Future climate resources for tourism in Europe based on the daily Tourism Climatic Index. Clim. Chang. 2010, 103, 363–381. [Google Scholar] [CrossRef] [Green Version]
- Amelung, B.; Viner, D. Mediterranean tourism: Exploring the future with the tourism climatic index. J. Sustain. Tour. 2006, 14, 349–366. [Google Scholar] [CrossRef]
- Bakhtiari, B.; Bakhtiari, A. Determination of Tourism Climate Index in Kerman province. Desert 2013, 18, 113–126. [Google Scholar]
- Shettigar, R.R.; Misra, N.M.; Naik, B.; Patel, K. Eco-friendly extreme pressure lubricants for water based drilling fluids. Int. Proc. Chem. Biol. Environ. Eng. 2015, 90, 8. [Google Scholar] [CrossRef]
- Khaledi, C.K.A. A Case Study of evaluation and distribution of tourism climate by Using TCI: Baluchestan Region of Iran. Open J. Geol. 2017, 7, 1227–1237. [Google Scholar] [CrossRef] [Green Version]
- Bakhtiari, B.; Bakhtiari, A.; Afzali Gorouh, Z. Investigation of climate change impacts on tourism climate comfort in Iran. Glob. NEST J. 2018, 20, 291–303. [Google Scholar] [CrossRef]
- Hein, L. The impact of Climate Change on Tourism in Spain (CICEROWorking Paper 2007:2). Center for International Climate and Environmental Research: Blindern, Norway, 2007; Available online: https://www.cicero.oslo.no/en/publications/internal/251 (accessed on 2 March 2021).
- Joksimovic, M.; Gajic, M.; Golic, R. Tourism climatic index in the valorisation of climate in tourist centers of Montenegro. Glas. Srp. Geogr. Drus. 2013, 93, 15–34. [Google Scholar] [CrossRef]
- Amiranashvili, A.G.; Kartvelishvili, L.G.; Matzarakis, A. The statistical characteristics of tourism climate index in Kakheti (Georgia). J. Georgian Geophys. Soc. 2018, 21, 95–112. [Google Scholar]
- Amiranashvili, A.G.; Kartvelishvili, L.G.; Khakhutashvili, T.V.; Megrelidze, L.D. Changeability of the meteorological parameters associated with some simple thermal indices and tourism climate index in Adjara and Kakheti (Georgia). J. Georgian Geophys. Soc. 2018, 21, 77–94. [Google Scholar]
- Huang, J.; Li, L.; Tan, C.; Sun, J.; Wang, G. Mapping summer tourism climate resources in China. Appl. Clim. 2018, 137, 2289–2302. [Google Scholar] [CrossRef]
- Haryadi, A.; Kusratmoko, E.; Karsidi, A. Climate comfort analysis for tourism in Samosir district. E3S Web Conf. 2019, 94, 05001. [Google Scholar] [CrossRef]
- Garín-Muñoz, T. Inbound international tourism to Canary Islands: A dynamic panel data model. Tour. Manag. 2006, 27, 281–291. [Google Scholar] [CrossRef]
- Medina-Muñoz, D.R.; Medina-Muñoz, R.D. Tourist Competitiveness of the Canary Islands in the European Nordic Market: An analysis based on demand evolution and perception. Scand. J. Hosp. Tour. 2013, 13, 10–23. [Google Scholar] [CrossRef]
- Font-Tullot, I. El Clima de las Islas Canarias. Anu. De Estud. Atlánticos 1959, 5, 57–103. [Google Scholar]
- Dorta-Antequera, P.J. Algunas notas sobre la evolución histórica y metodológica de los estudios del clima en canarias: Estado actual de la cuestión; Cabildo de Gran Canaria: Las Palmas de Gran Canaria. Coloq. De Hist. Canar. Am. 2000, 13, 1602–1620. [Google Scholar]
- García-Herrera, R.; Gallego, D.; Hernández, E.; Gimeno, L.; Ribera, P.; Calvo, N. Precipitation trends in the Canary Islands. Int. J. Clim. 2003, 23, 235–241. [Google Scholar] [CrossRef] [Green Version]
- Mestre, A.; Felipe, L. Atlas Climático de Los Archipiélagos de Canarias, Madeira y Azores: Temperatura Del Aire y Precipitación (1971–2000); Agencia Estatal de Meteorología and Instituto de Meteorología de Portugal: Lisboa, Portugal, 2012. [Google Scholar]
- Dorta, P. Las Invasiones De Aire Sahariano En Canarias; Arte Comunicación Visual: Santa Cruz De Tenerife, Spain, 1999; ISBN 9788469906934. [Google Scholar]
- Alonso-Pérez, S.; Cuevas, E.; Querol, X.; Viana, M.; Guerra, J. Impact of the Saharan dust outbreaks on the ambient levels of total suspended particles (TSP) in the marine boundary layer (MBL) of the Subtropical Eastern North Atlantic Ocean. Atmos. Environ. 2007, 41, 9468–9480. [Google Scholar] [CrossRef]
- Menendez, I.; Derbyshire, E.; Engelbrecht, J.; Suchodoletz, H.; Zöller, L.; Dorta, P.; Carrillo, T.; Rodríguez de Castro, F. Saharan dust and the aerosols on the Canary Islands: Past and Present. In Airbone Particulates; Nova Science Publishers: New York, NY, USA, 2009; pp. 39–80. ISBN 978-1-60692-907-0. [Google Scholar]
- Pérez, S.A.; Cuevas, E.; Perez, C.; Querol, X.; Baldasano, J.M.; Draxler, R.; De Bustos, J.J. Trend changes of African airmass intrusions in the marine boundary layer over the subtropical Eastern North Atlantic region in winter. Tellus B Chem. Phys. Meteorol. 2011, 63, 255–265. [Google Scholar] [CrossRef] [Green Version]
- Alonso-Pérez, S.; Cuevas, E.; Querol, X. Objective identification of synoptic meteorological patterns favouring African dust intrusions into the marine boundary layer of the subtropical eastern north Atlantic region. Appl. Clim. 2011, 113, 109–124. [Google Scholar] [CrossRef]
- Karanasiou, A.; Moreno, N.; Moreno, T.; Viana, M.; de Leeuw, F.; Querol, X. Health effects from Sahara dust episodes in Europe: Literature review and research gaps. Environ. Int. 2012, 47, 107–114. [Google Scholar] [CrossRef]
- Kashima, S.; Yorifuji, T.; Tsuda, T.; Eboshida, A. Asian dust and daily all-cause or cause-specific mortality in western Japan. Occup. Environ. Med. 2012, 69, 908–915. [Google Scholar] [CrossRef] [PubMed]
- Domínguez-Rodríguez, A.; Baez-Ferrer, N.B.; Rodríguez, S.; Abreu-González, P.; Gonzalez-Colaço Harmand, M.; Amarnani-Amarnani, V.; Cuevas, E.; Consuegra-Sánchez, L.; Alonso-Pérez, S.; Fernández, P.A.; et al. Impacto de la exposición a la calima del polvo del Sáhara en los pacientes con insuficiencia cardiaca aguda atendidos en un servicio de urgencias. Emerg. Rev. Soc. Española Med. Urgenc. Emerg. 2019, 31, 161–166. [Google Scholar]
- Dominguez-Rodriguez, A.; Baez-Ferrer, N.; Rodríguez, S.; Avanzas, P.; Abreu-Gonzalez, P.; Terradellas, E.; Cuevas, E.; Basart, S.; Werner, E. Saharan dust events in the dust belt -Canary Islands- and the observed association with in-hospital mortality of patients with heart failure. J. Clin. Med. 2020, 9, 376. [Google Scholar] [CrossRef] [Green Version]
- Oñate, J.J.; Pou, A. Temperature Variations in Spain Since 1901: A Preliminary Analysis. Int. J. Clim. 1996, 16, 805–815. [Google Scholar] [CrossRef]
- Sanroma, E.; Palle, E.; Sanchez-Lorenzo, A. Long-term changes in insolation and temperatures at different altitudes. Environ. Res. Lett. 2010, 5, 024006. [Google Scholar] [CrossRef]
- Martín, J.L.; Bethencourt, J.; Cuevas-Agullo, E. Assessment of global warming on the island of Tenerife, Canary Islands (Spain). Trends in minimum, maximum and mean temperatures since 1944. Clim. Chang. 2012, 114, 343–355. [Google Scholar] [CrossRef]
- Santos, F.; Decastro, M.; Gómez-Gesteira, M.; Álvarez, I. Differences in coastal and oceanic SST warming rates along the Canary upwelling ecosystem from 1982 to 2010. Cont. Shelf Res. 2012, 47, 1–6. [Google Scholar] [CrossRef]
- Luque, A.; Martín, J.L.; Dorta, P.; Mayer, P. Temperature trends on Gran Canaria (Canary Islands). An example of global warming over the Subtropical Northeastern Atlantic. Atmos. Clim. Sci. 2014, 04, 20–28. [Google Scholar] [CrossRef] [Green Version]
- Hernandez, Y.; Guiamaes Pereira, Â.G.; Barbosa, P. Resilient futures of a small island: A participatory approach in Tenerife (Canary Islands) to address climate change. Environ. Sci. Policy 2018, 80, 28–37. [Google Scholar] [CrossRef]
- León, C.J.; Araña, J.E.; González, M.; de León, J. Tourists’ evaluation of climate change risks in the Canary Islands: A heterogeneous response modelling approach. Tour. Econ. 2014, 20, 849–868. [Google Scholar] [CrossRef]
- Fernandopullé, D. Climatic Characteristics of the Canary Islands. In Biogeography and Ecology in the Canary Islands; Kunkel, G., Ed.; Monographiae Biologicae; Springer: Dordrecht, The Netherlands, 1976; pp. 185–206. ISBN 9789401015660. [Google Scholar]
- Garcia-Herrera, R.F.G.; Puyol, D.G.; Hernandez-Martín, E.; Gimeno Presa, L.; Ribera-Rodríguez, P. Influence of the North Atlantic oscillation on the Canary Islands precipitation. J. Clim. 2001, 14, 3889–3903. [Google Scholar] [CrossRef] [Green Version]
- ASHRAE. Handbook of Fundamentals; American Society of Heating, Refrigerating and Air Conditioning Engineers: New York, NY, USA, 1972. [Google Scholar]
- Klein Tank, A.M.G.; Wijngaard, J.B.; Können, G.P.; Böhm, R.; Demarée, G.; Gocheva, A.; Mileta, M.; Pashiardis, S.; Hejkrlik, L.; Kern-Hansen, C.; et al. Daily dataset of 20th-century surface air temperature and precipitation series for the European Climate Assessment. European temperature and precipitation series. Int. J. Clim. 2002, 22, 1441–1453. [Google Scholar] [CrossRef]
- National Spanish Meteorological Agency Open Database. Available online: https://opendata.aemet.es/centrodedescargas/inicio (accessed on 12 June 2021).
- Canary Islands Institute of Statistics’ Open Database. Available online: http://www.gobiernodecanarias.org/istac (accessed on 12 June 2021).
- Hwang, Y.S.; Kim, H.S.H.; Yu, C. The empirical test on the impact of climate volatility on tourism demand: A case of Japanese tourists visiting Korea. Sustainability 2018, 10, 3569. [Google Scholar] [CrossRef] [Green Version]
Figure 1.
Location of the study area and measurement stations (in red).

Figure 2.
Multidimensional spline fit (blue) to the 321 points (red) of the thermal comfort rating chart proposed by Mieczkowski [1].
Figure 2.
Multidimensional spline fit (blue) to the 321 points (red) of the thermal comfort rating chart proposed by Mieczkowski [1].

Figure 3.
Annual distribution of TCI (a), rainfall (b), and average temperature (c) in the period 1985–2018. TCI climate comfort categories are also shown in (a) and range from acceptable to ideal (see Table 2).
Figure 3.
Annual distribution of TCI (a), rainfall (b), and average temperature (c) in the period 1985–2018. TCI climate comfort categories are also shown in (a) and range from acceptable to ideal (see Table 2).

Figure 4.
(a) Annual distribution of maximum temperatures (which is related to the CID index, see Figure 2) and (b) W subindex scores in the period 1985–2018 at Santa Cruz de Tenerife (blue), El Hierro Airport (yellow), La Palma Airport (green), Lanzarote Airport (red), and Fuerteventura Airport (purple).

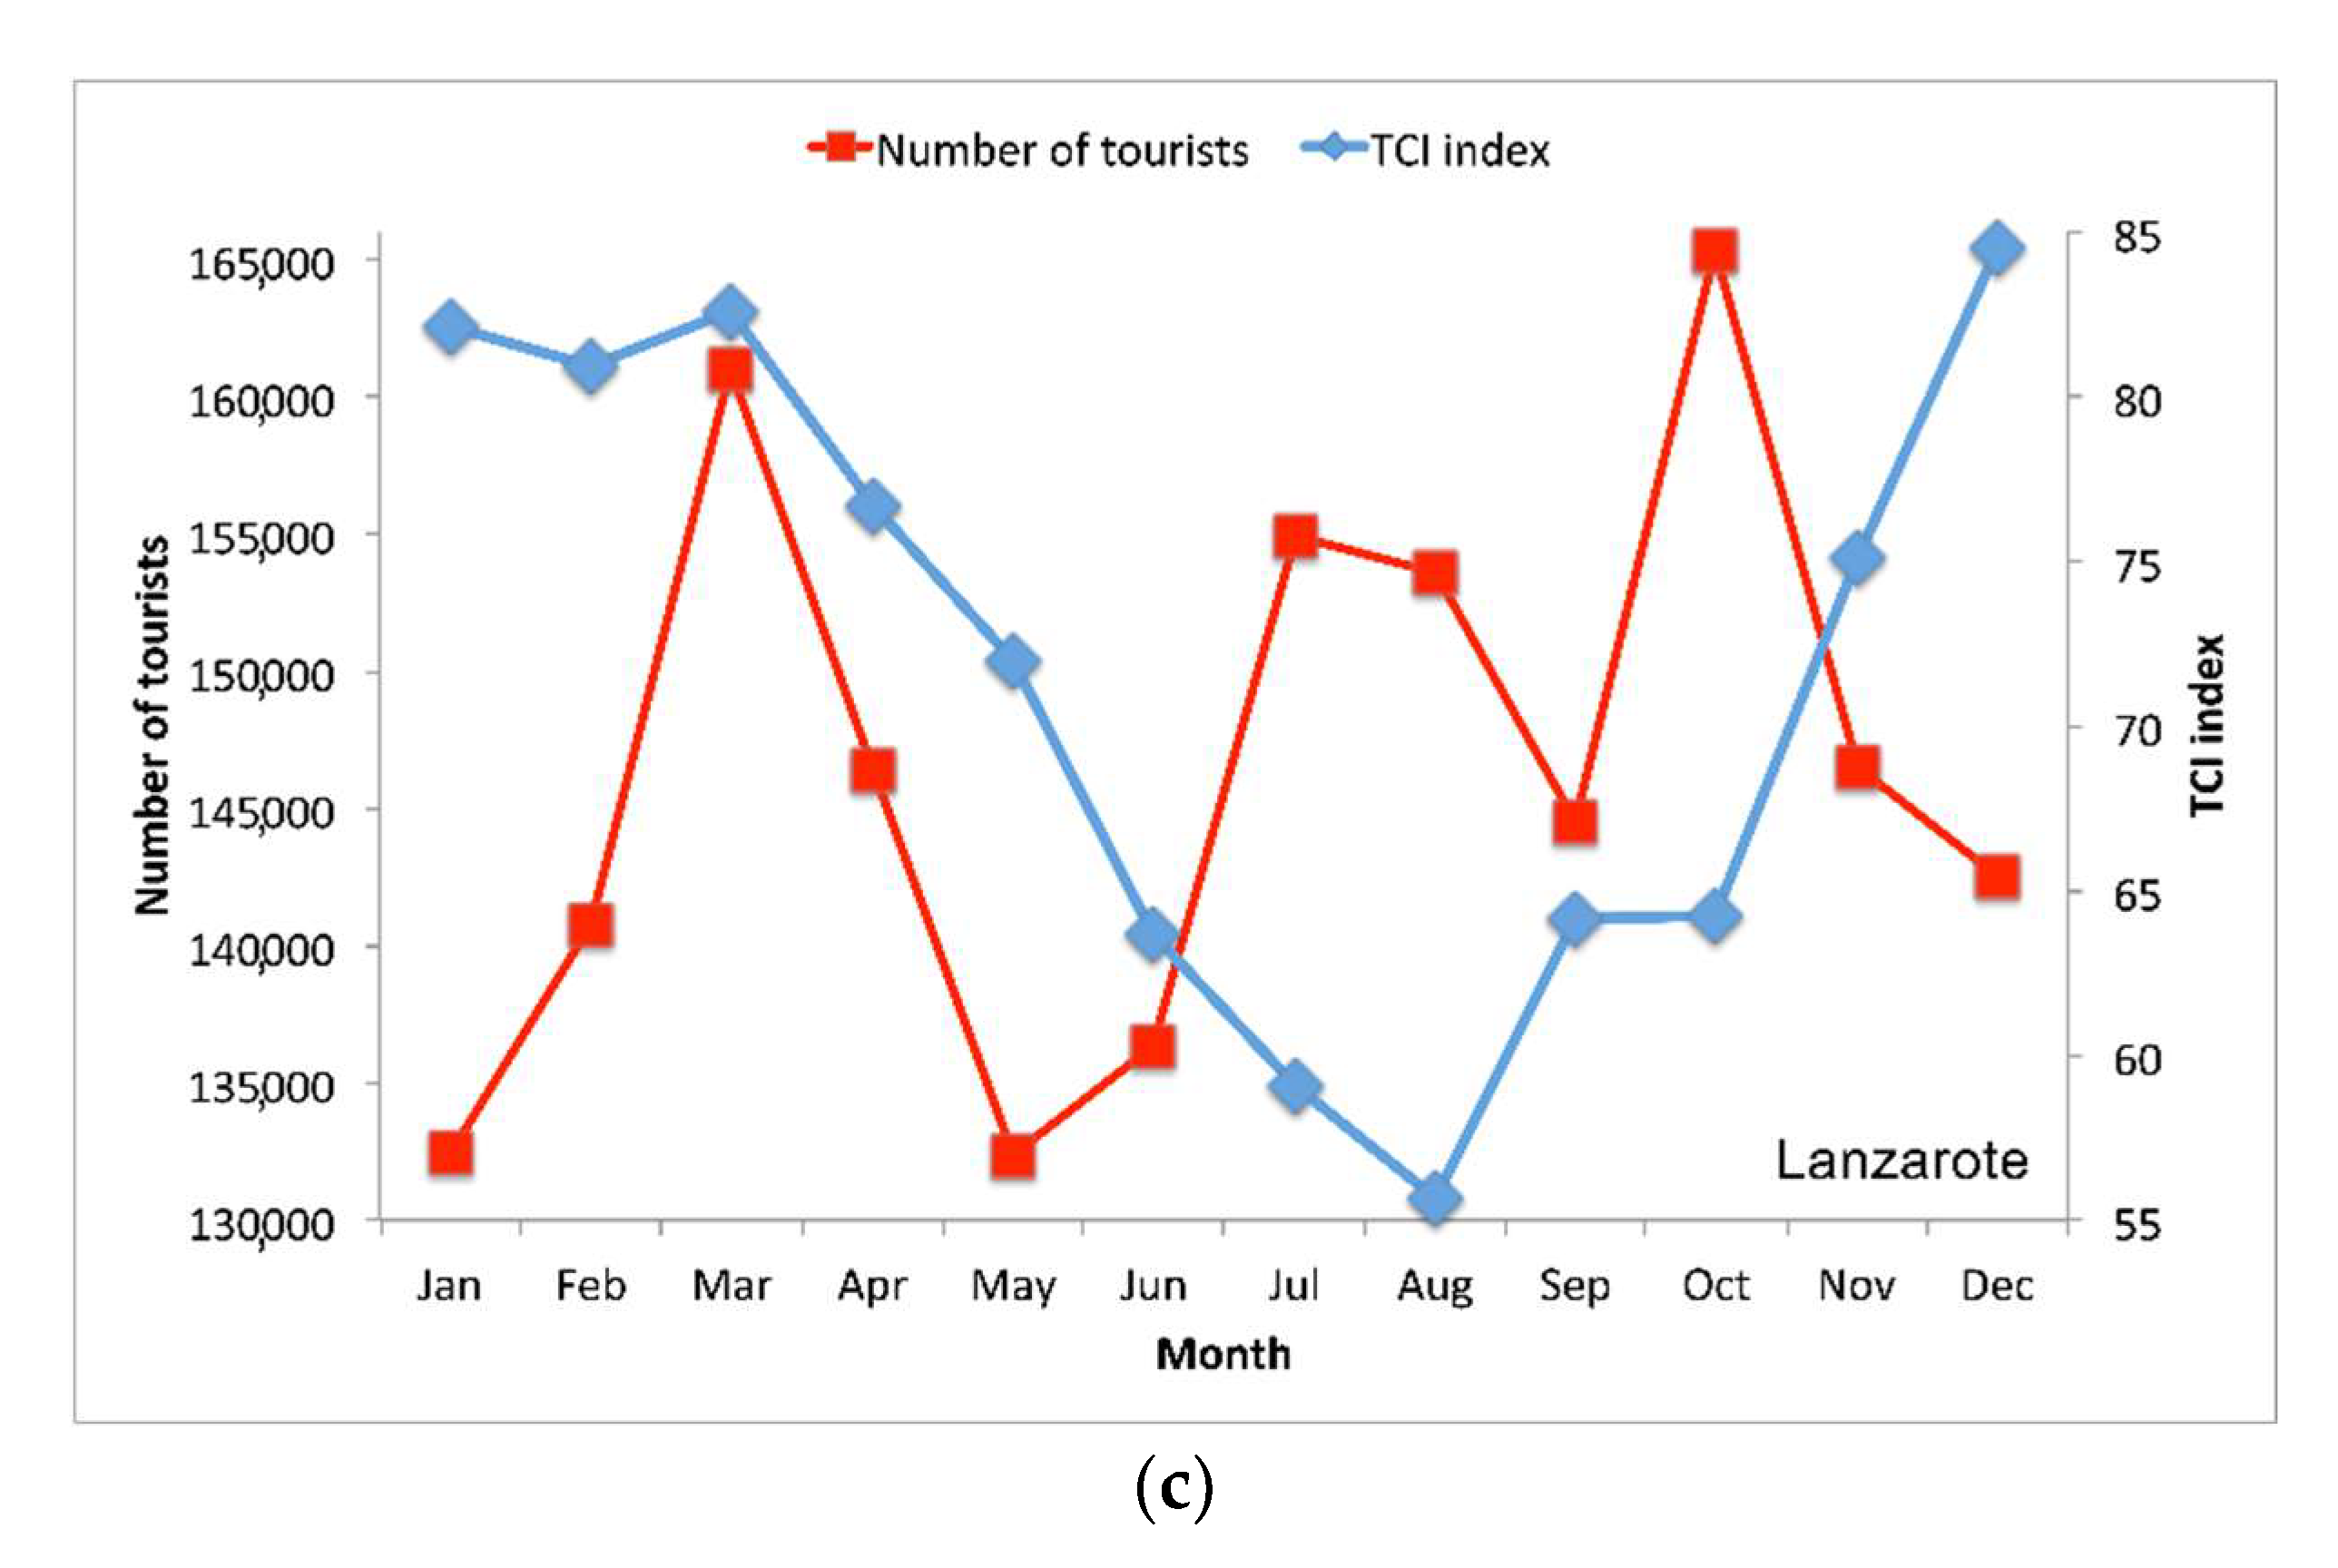
Figure 5.
Annual distribution of TCI index (blue) and number of inbound tourists from foreign countries (red) for La Palma (a), Tenerife (b), and Lanzarote (c) in the 2009–2018 period. Coefficients of correlation are R = −0.10, R = 0.27, and R = −0.31, respectively.
Figure 5.
Annual distribution of TCI index (blue) and number of inbound tourists from foreign countries (red) for La Palma (a), Tenerife (b), and Lanzarote (c) in the 2009–2018 period. Coefficients of correlation are R = −0.10, R = 0.27, and R = −0.31, respectively.


Figure 6.
Monthly TCI values for the 1985–2018 time series (gray dots) and 24-month moving average (red) for Tenerife (a) and Lanzarote (b).
Figure 6.
Monthly TCI values for the 1985–2018 time series (gray dots) and 24-month moving average (red) for Tenerife (a) and Lanzarote (b).


Table 1.
Location, altitude, and period of meteorological data availability at the study sites.
| Station | Latitude | Longitude | Height (m a.s.l.) | Data Availability |
|---|---|---|---|---|
| El Hierro Airport | +27°49′08″ | −17°53′30″ | 32 | 1985–2018 |
| La Palma Airport | +28°37′59″ | −17°45′18″ | 33 | 1985–2018 |
| Santa Cruz de Tenerife | +28°27′47″ | −16°15′19″ | 35 | 1950–2018 |
| Fuerteventura Airport | +28°26′40″ | −13°51′47″ | 25 | 1976–2018 |
| Lanzarote Airport | +28°57′06″ | −13°36′01″ | 14 | 1972–2018 |
Table 2.
Classification scale of TCI values.
| TCI Value | Descriptive Category |
|---|---|
| 90–100 | ideal |
| 80–89 | excellent |
| 70–79 | very good |
| 60–69 | good |
| 50–59 | acceptable |
| 40–49 | marginal |
| 30–39 | unfavorable |
| 20–29 | very unfavorable |
| 10–19 | extremely unfavorable |
| 0–9 | impossible |
Publisher’s Note: MDPI stays neutral with regard to jurisdictional claims in published maps and institutional affiliations. |
© 2021 by the authors. Licensee MDPI, Basel, Switzerland. This article is an open access article distributed under the terms and conditions of the Creative Commons Attribution (CC BY) license (https://creativecommons.org/licenses/by/4.0/).
Share and Cite
MDPI and ACS Style
Alonso-Pérez, S.; López-Solano, J.; Rodríguez-Mayor, L.; Márquez-Martinón, J.M. Evaluation of the Tourism Climate Index in the Canary Islands. Sustainability 2021, 13, 7042. https://doi.org/10.3390/su13137042
AMA Style
Alonso-Pérez S, López-Solano J, Rodríguez-Mayor L, Márquez-Martinón JM. Evaluation of the Tourism Climate Index in the Canary Islands. Sustainability. 2021; 13(13):7042. https://doi.org/10.3390/su13137042
Chicago/Turabian StyleAlonso-Pérez, Silvia, Javier López-Solano, Lourdes Rodríguez-Mayor, and José Miguel Márquez-Martinón. 2021. "Evaluation of the Tourism Climate Index in the Canary Islands" Sustainability 13, no. 13: 7042. https://doi.org/10.3390/su13137042
Note that from the first issue of 2016, this journal uses article numbers instead of page numbers. See further details here.