
Empirical Evidence of Risks of Public-Loan Finance: Comparison between Self-Employers and SMEs


Department of International Trade, Dongguk University, Seoul 04620, Korea
*
Author to whom correspondence should be addressed.
Sustainability 2021, 13(11), 6426; https://doi.org/10.3390/su13116426
Submission received: 13 May 2021
/
Revised: 29 May 2021
/
Accepted: 31 May 2021
/
Published: 4 June 2021
(This article belongs to the Section Economic and Business Aspects of Sustainability)
Abstract
:Public financial loans are very complex. However, previous research has largely neglected the effective management of public funds. More specifically, how to maintain the optimal balance between small businesses and loan providers for managing public funds over time remains unclear. Moreover, little is known about how public funds should be managed to increase survival periods, which are directly related to these institutions’ financial stability. This study tests the difference between public fund borrowers and providers from perspectives on their long-term survival and compares survival periods using 499,554 guaranteed loans. The findings show that 85% guarantee ratios and high credit ratings help increase survival periods. The findings also show that individual-based borrowers, such as self-employers, have a strong tendency to survive much longer than SMEs. Finally, our study extends the literature by offering a risk theory perspective on public financial institutions that explains how guarantee ratios and credit ratings affect the survival periods of borrowers, resulting in these institutions’ financial soundness.
1. Introduction
Due to the recent economic problem of polarization linked to the unequal distribution of wealth for small-medium enterprises (SMEs) and self-employers, the importance of small-loan finance supported by the government has emerged as a major issue [1,2]. However, research demonstrates that small-loan finance is potentially very complex, particularly when financial support is provided by public funds [2]. In particular, research shows that public guarantee loans are important for access to capital for self-employers and SMEs due to the positive impacts on their long-term sustainability [3,4]. While such research focuses on the SME and self-employer categories, how to predict the relationship between small businesses and loan repayment for managing public funds over time remains unclear.
The comparison between self-employers and SMEs demonstrates the need for a better understanding of credit ratings when financial institutions inject public loans. It is believed that such loans depend on credit rationing by lenders [5], but the guarantee of financial support for small business management is still limited due to higher levels of insolvent enterprises than those of self-employers [6]. The risk management theory also demonstrates that personal information is augmented with basic business-specific data to predict repayment [7], but credit ratings for small business management will alter small-business lenders’ prospects regarding the possibility of repayment [8], suggesting that survival rates are important to obtain more robust results. We expect that the potential of repayment may be dependent on guarantee ratios because it is closely related to a small business’s long-term survival, resulting in the optimal balance between the two parties.
Another important approach is to identify why the survival rates may differ between financial institutions if guarantee ratios are critical. It is necessary to determine the influence of these institutions at the level of guarantee ratios to reduce the probability of loan defaults [9]. There is a considerable amount of literature on certain financial organizations that are more willing than commercial banks to lend to riskier borrowers [10,11,12,13,14,15]. What difference is played by the types of loan providers in the guarantee ratio incurred by the potential of borrowers?
In line with these observations, a complete understanding of the balance between the two parties is essential for researchers and practitioners alike. It enables researchers to establish a theoretical approach to managing public funds while helping practitioners ensure the optimal balance for preventing the exhaustion of public funds from a long-term perspective. In so doing, this study tests the survival trends and survival characteristics between the two parties in two important ways. First, we test the difference between public fund borrowers and providers from perspectives on their long-term survival. Second, we compare the characteristics of guarantee accidents by testing two groups (i.e., 499,554 observations). Our approach is important because there have been no previous studies in this line of research.
This study also provides useful insights for public policy planners. They need new solutions from public fund borrowers and providers. Because public financial support was originally designed and offered by public administrations, which allocate budgets to identifiable missions and programs [16], capturing the limitations of public financial funds plays a critical role in redesigning and re-operating public financial programs.
2. Literature Review
Public guaranteed loans are widely used to support self-employers and SMEs, especially after the global financial crisis [17,18]. These loans mainly focus on supporting small business growth and sustainability, and the literature has well documented the positive relationship between entrepreneurship and business sustainability [19,20]. However, public guaranteed loans can have negative effects on the quality of small businesses [18] such as insolvent enterprise, default, and other relevant issues. Hence, the impact of public guaranteed small loans would depend on the credit rating because banks are likely to reduce accident events [20].
The theoretical approach is that in equilibrium, loan markets may be characterized by credit rating as financial institutions making loans consider the interest rate and the riskiness of a loan due to adverse selection or moral hazard [21,22]. A fundamental element of the credit market suggested by Bester [21], especially given the focus of this study is on public loan guarantees, is that the interest rate and credit rating are critical when financial institutions evaluate small firms. For example, loan interest rates and credit ratings are viewed as a pair and are assumed to be negatively correlated because a higher credit rating should reduce the interest rate and accident rate.
Public guaranteed loan programs encourage banks to lend to self-employers and SMEs that are difficult to get financial loans through conventional methods (i.e., collateral). For example, there are two critical barriers: (1) they lack sufficient collateral, and (2) credit constraint continues to be one of the most significant huddles to self-employers and SMEs [23]. In particular, this study focuses on the credit rating of each small business because most public small businesses suffer to provider their collateral at least in the context of Korean SMEs. As a consequence, public guaranteed small business loans could be managed by credit ratings because most defaults may be varied by the level of credit ratings. Thus, when banks implement credit rating models, they carefully screen small businesses’ eligibility for reducing the adverse selection effect [24]. We expect that banks can manage more self-employers and SMEs motivated by opportunities in the market.
In particular, the creation of Mutual Guarantee Institutions (MGIs: private guarantee institutions created by beneficiary SMEs) is valuable for policy makers who focus on solutions that help reduce the financial constraint on self-employers and SMEs [25]. MDIs have provided additional guarantees for public loans and, in turn, have contributed to the development of the sustainability of SMEs in European countries [26]. Especially, MGIs are very active in Spain, France or Germany. In these countries, banks could reduce both the probability of default and the loss given default due to the overcome of the information asymmetries between financial institutions and borrowers. In this sense, MGIs are closely linked to our approach.
Both public guarantee loans and MGIs aim to promote access to credit for self-employers and SMEs [27]. In so doing, banks consider similar strategies to support government programs for self-employers and SMEs lending, ahead of directed credit and interest rates [28,29]. As such, it is possible to capture the increase in the flow of funds towards self-employers and SMEs that face credit constraints, measured in terms of higher employment, investment, and sustainable performance [30,31,32,33].
3. Methodology
The existing literature on public funds using the survival method has been very limited. The literature has been mainly focused on the following three areas: (1) changes in the survival rate using the Kaplan–Meier estimator, (2) differences between two or more groups based on changes in the survival rate, and (3) survival possibilities through the Cox proportional hazards model [34,35,36]. Based on the literature, this study covers the following three areas: (1) the estimation of the survival interval between self-employers and SMEs, (2) comparison of factor characteristics between the two parties, and (3) estimation of how the factor characteristics of guarantee accidents form.
3.1. Sunshine Loans in Korea
Sunshine loans, which were introduced in 2010, are subprime unsecured personal loans offered by nonbank depository institutions in Korea. Similar to the Italian public credit guarantee schemes (CGS), the loans were designed to promote funding opportunities for self-employers and SMEs with limited ability to access the credit market. They usually operate as follows: Once financial institutes issue Sunshine Loans to low-income individuals or low-sales-volume SMEs, the Korean Credit Guarantee Foundation partially guarantees the loans. From the beginning of 2010 to the end of 2014, 700,000 financially vulnerable individuals received loans (approximately US $5.54 billion) [37].
Sunshine Loans have several advantages, but the high credit default rate is deteriorating the soundness of financial institutions. More specifically, the increase in the number of illegal loans or ethical laxity indicates that the abuse of the credit guarantee system is critical because it influences the two parties’ long-term survival. This is directly related to many SMEs who often use Sunshine Loans as a hedging instrument for debt repayment or intentional bankruptcy. Market forces are still not creating an adequate supply of lower-interest-rate subprime unsecured personal loans, and nonbank depository institutions have failed to demonstrate a capacity for preliminary screening or follow-up management in issuing Sunshine Loans [38]. In line with these observations, there is a need for a thorough understanding of public financial funds to improve financial policy handling.
3.2. Survival Approach and Models
Survival analysis has become a popular approach for estimating hazard rates and survival curves due to advances in the use of censored data [39,40]. When a new issue of a certain event is critical in the investigation, the survival approach is necessary for explaining current situations and identifying specific determinants [41]. In particular, survival models have generally been applied in medical and bioengineering sciences, but their applications have been limited in public fund research.
The current study uses the Kaplan–Meier estimator to capture insights into the timing of borrowers and providers’ events. In this study, we do not fix the observation interval because the random censoring data reflect the accidental characteristics of public funds between the two parties. The Kaplan–Meier estimator calculates the survival probability during a certain interval, which is equal to the time of the credit guarantee accident of SMEs or public fund providers. Given that a random interval is i, the survival probability model can be written as follows:
where ni = the number of subjects (small businesses and public fund providers) at the starting point i of risk. di represents the number of subjects of credit guarantee accidents at the interval i.
3.3. Dataset
The Korean Credit Guarantee Foundation provided the Sunshine Loan datasets for this study. These data include the following information: accident events (i.e., bankruptcy and default) related to the guarantee rate, credit rating, and small-loan finance corporations. The data were extracted from the time at which an accident event occurred from the end of July 2010 to the end of December 2013 when small businesses borrowed public funds (or providers lent public funds to small businesses). The type of censoring was random (Type III). More specifically, in the cases where guarantee accident events occurred, we calculated the survival interval from the start of the financial guarantee to the occurrence of the accident event during these periods.
Table 1 shows the basic data from the two market players (fund borrowers and providers), and the guarantee ratios were 85% and 95%. Six small-loan finance providers (i.e., the National Forestry Cooperative Federation [NFCF], Korean Federation of Community Credit Cooperatives [KFCCC], Saving Bank [SB], National Federation of Fisheries Cooperatives [NFFC], National Credit Union Federation of Korea [NCUFK], and NongHyup [NH]) provided Sunshine Loans, and ten credit ratings (i.e., AAA to D) were identified. People who did not include their credit rating were considered to have no credit rating. In particular, we compared SMEs with self-employers to ensure a variety of differences between the two borrowing groups. The total sample consisted of 499,554 guaranteed loans (SMEs = 135,277 vs. self-employers = 364,277) from 2010 to 2013. There were 101,997 survival data entries for SMEs and 308,654 for self-employers. There were 33,280 accident event data entries for SMEs and 55,623 for self-employers.
3.4. Definitions and Measures
To conduct the survival analysis, we defined key variables as follows. First, we defined an accident event as a critical default event triggered by the occurrence of a guarantee accident. We dealt with accident events for both self-employers and SMEs who received public funds when they were still in default. Our approach is supported by Giroux and Wiggins [42], who suggest that it is a dynamic process that finally leads to bankruptcy associated with a critical default event.
The guarantee rate was defined as the subrogation rate when an event occurs. We created a guarantee rate that ranged from 85% at the beginning of a Sunshine Loan to 95% in the altered rate of the loan. This indicates that the guarantee ratios changed over time. However, the credit rating was used at the date when loans were provided by financial institutions. The credit rating was defined as the credit rating gained by a credit information company (NICE in this study, one of the major information service companies in South Korea) that is authorized by the Financial Services Commission. Finally, a small financial provider was defined as a financial institution that helps to support individuals or SMEs’ financial transactions. As shown in Table 1, six financial providers were identified and used in this study.
4. Results
4.1. t-Test
We conducted a t-test to compare the two groups (self-employers vs. SMEs) using SPSS 23. The results of the t-test showed that the difference between the two groups was statistically significant at p < 0.001 (see Table 2), indicating that these groups were quite different.
4.2. Overall Review of Survival Analysis
To test the identity of the survival distribution, we conducted the log-rank, Breslow, and Tarone-Ware tests using Kaplan-Meier method. The test statistic was significant at p < 0.05, indicating that the survival time distributions of the two groups were different. The results for self-employers are provided first below, and then, the results for SMEs are provided. Finally, we discuss similarities and differences from the results of the two groups.
4.3. Result 1: Self-Employers
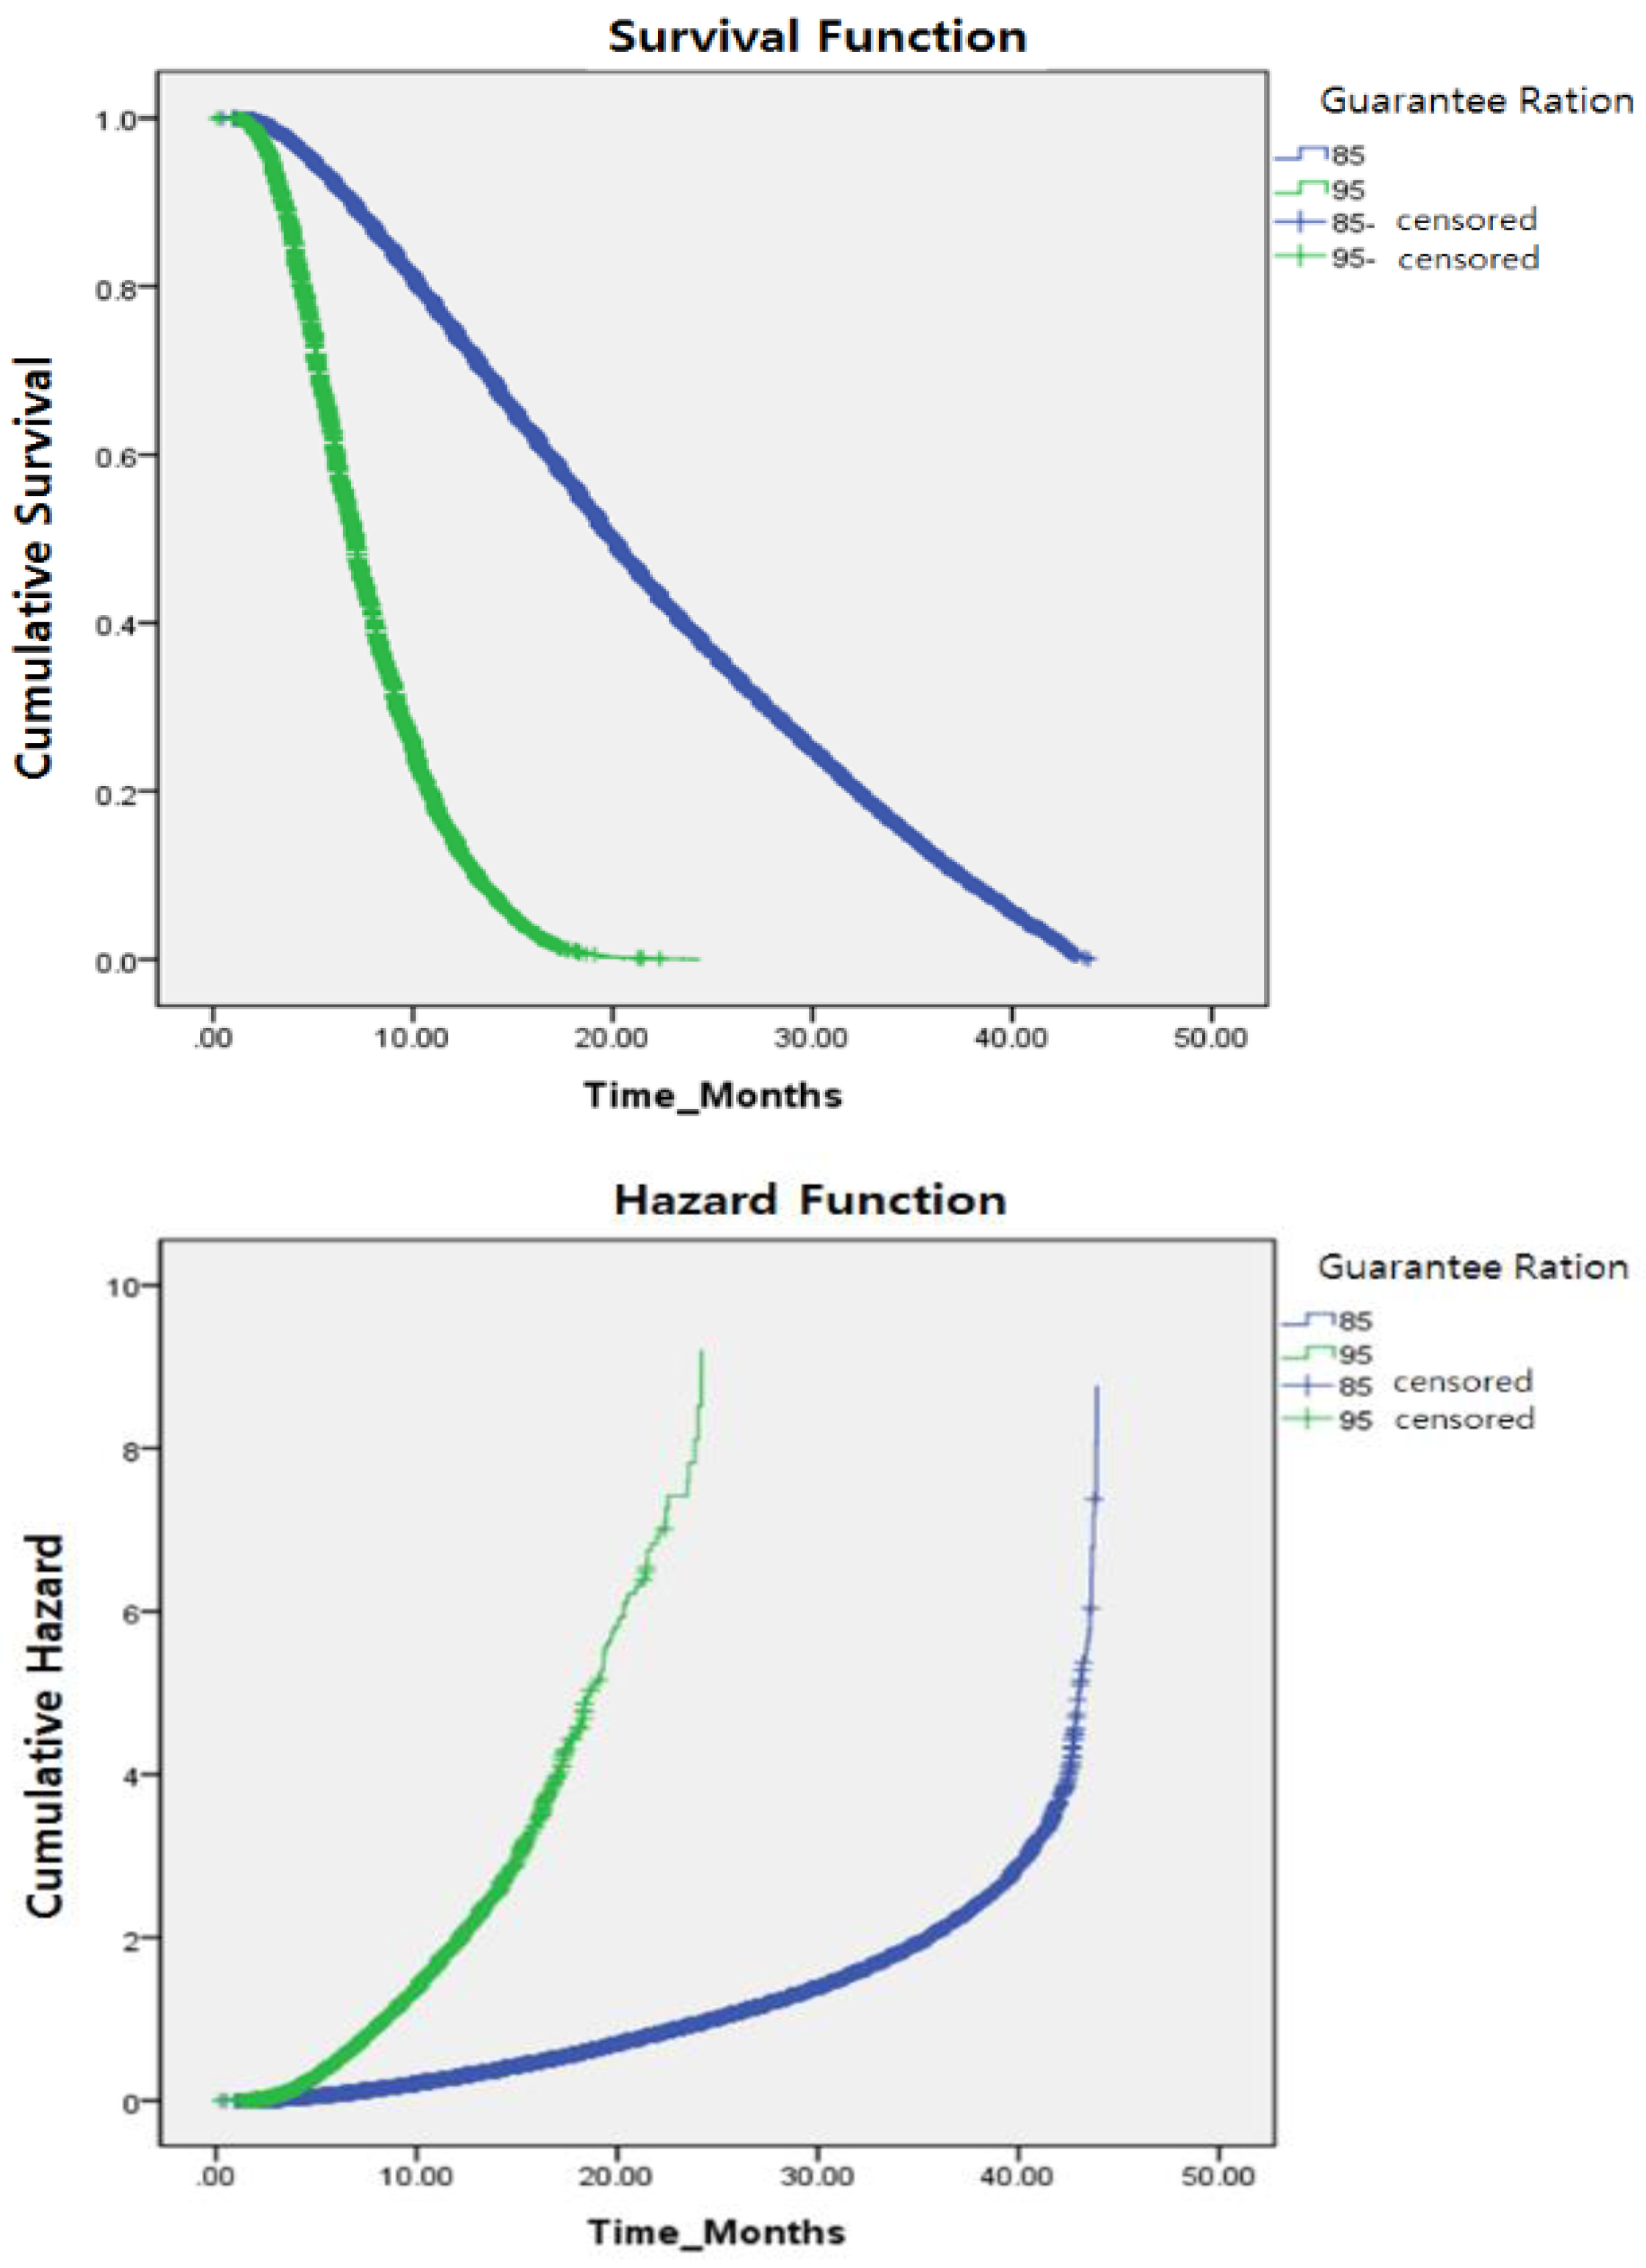
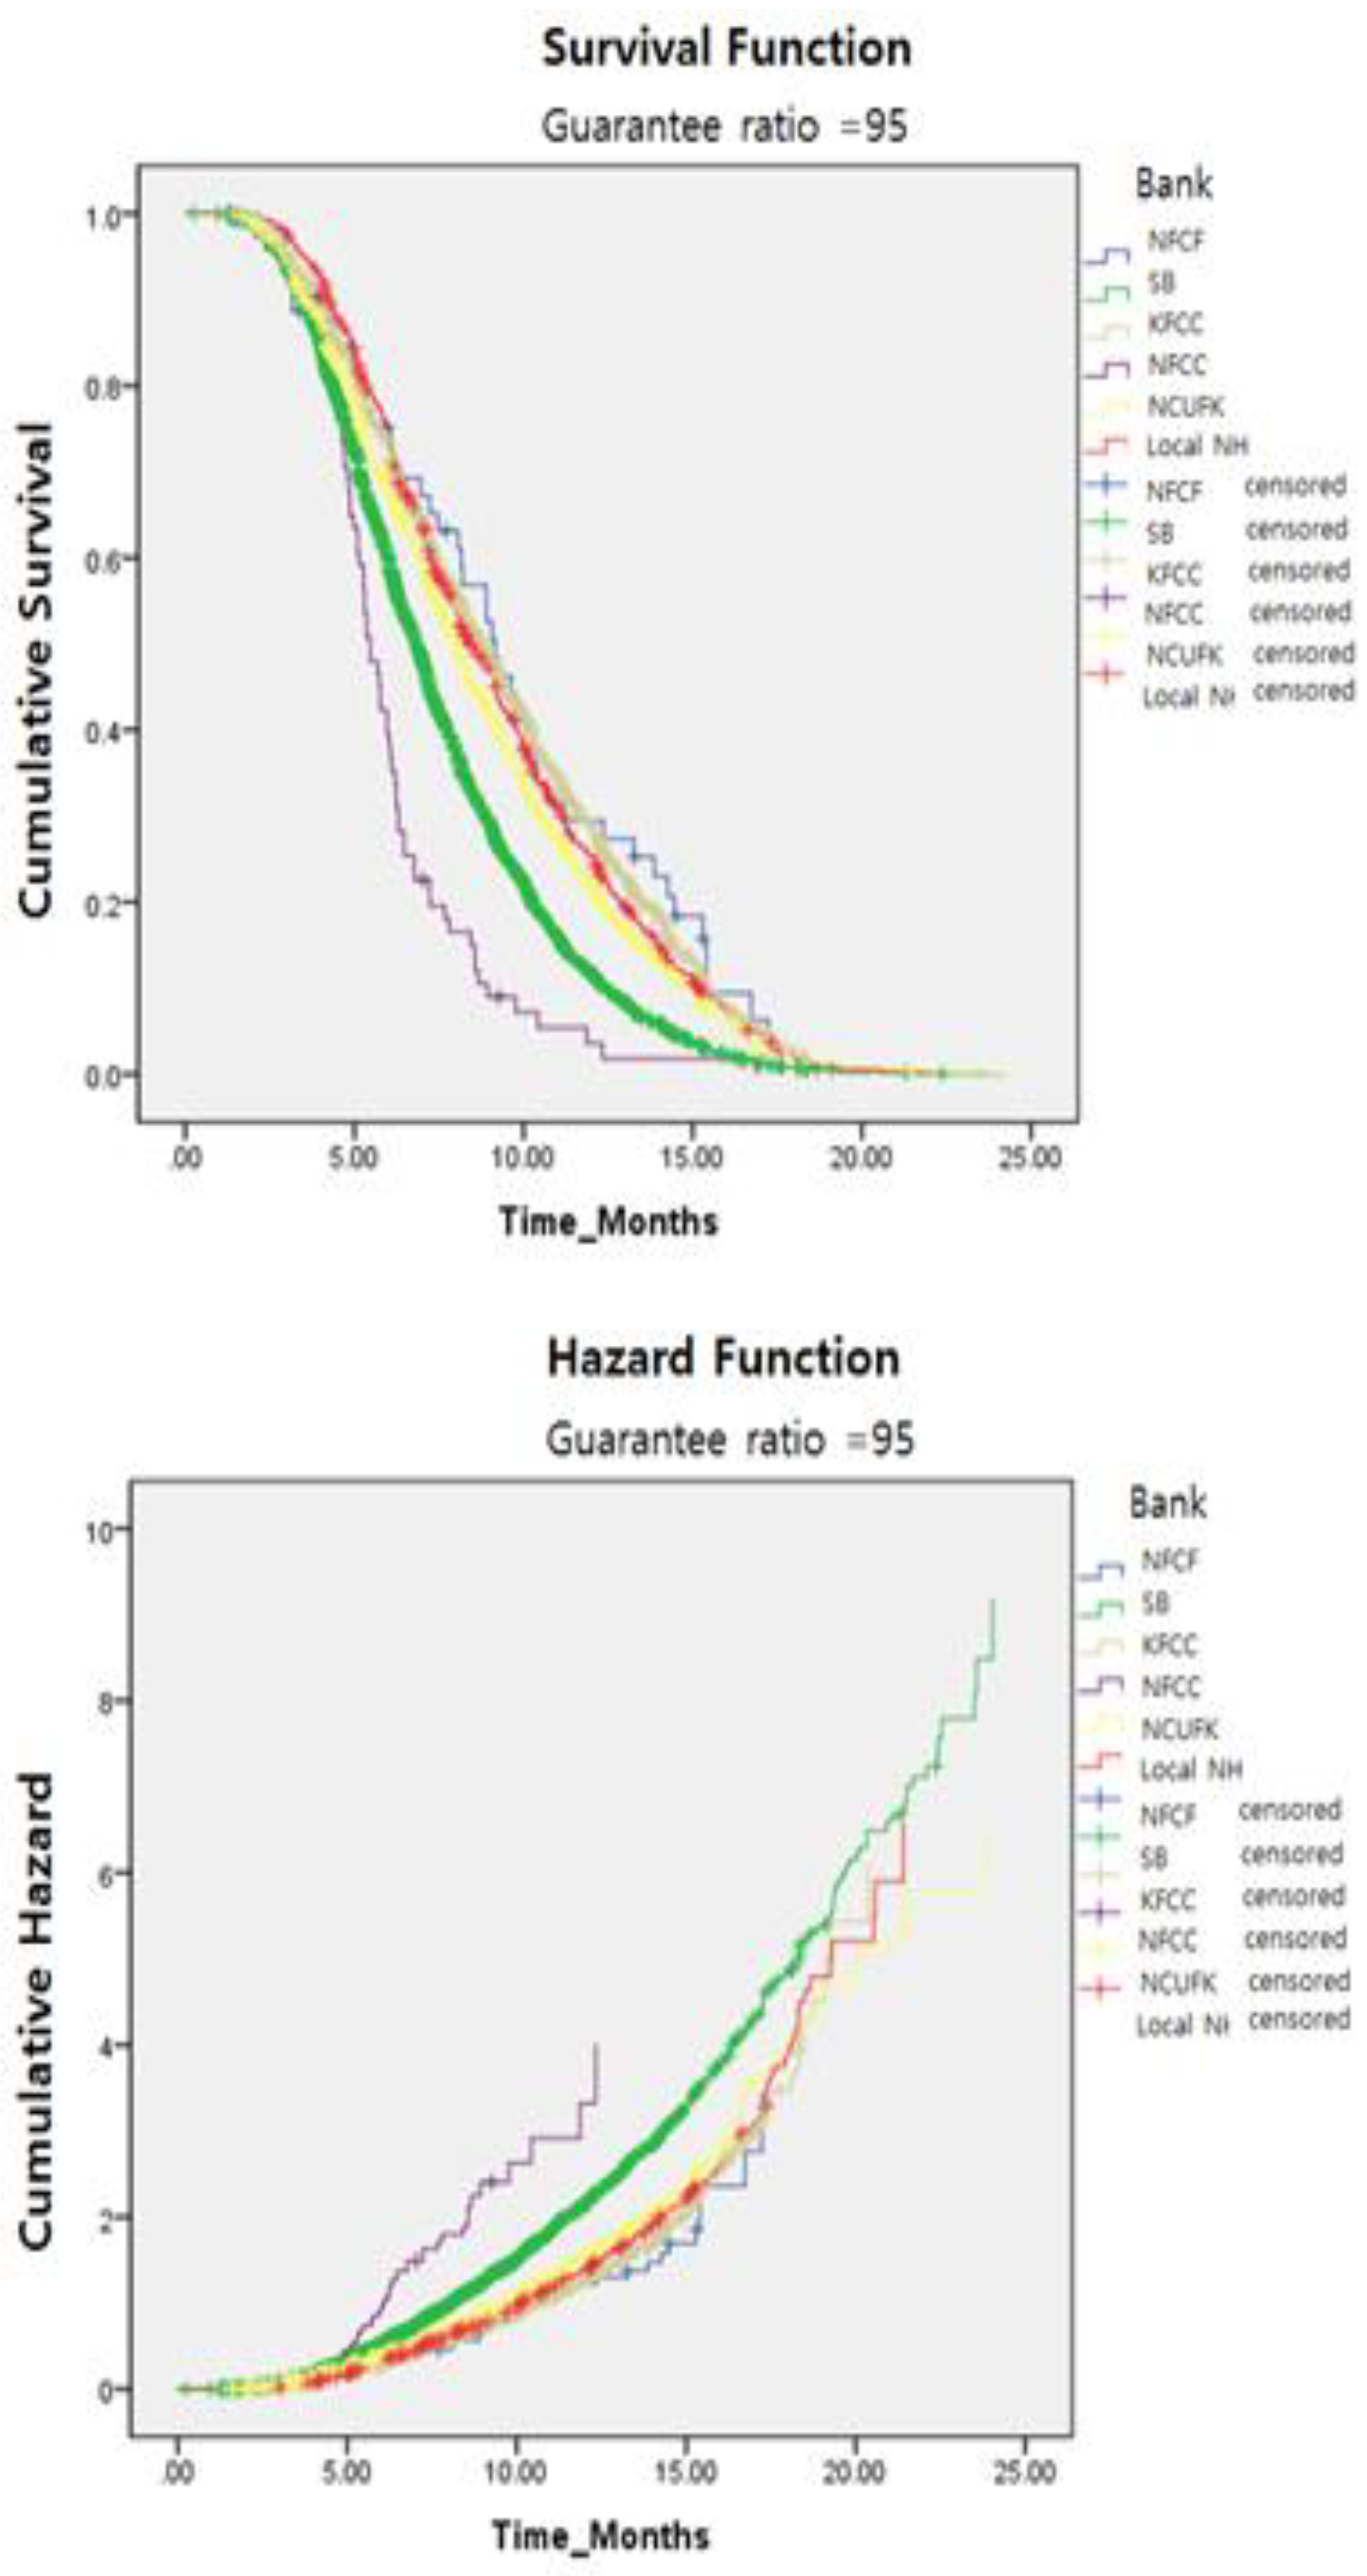
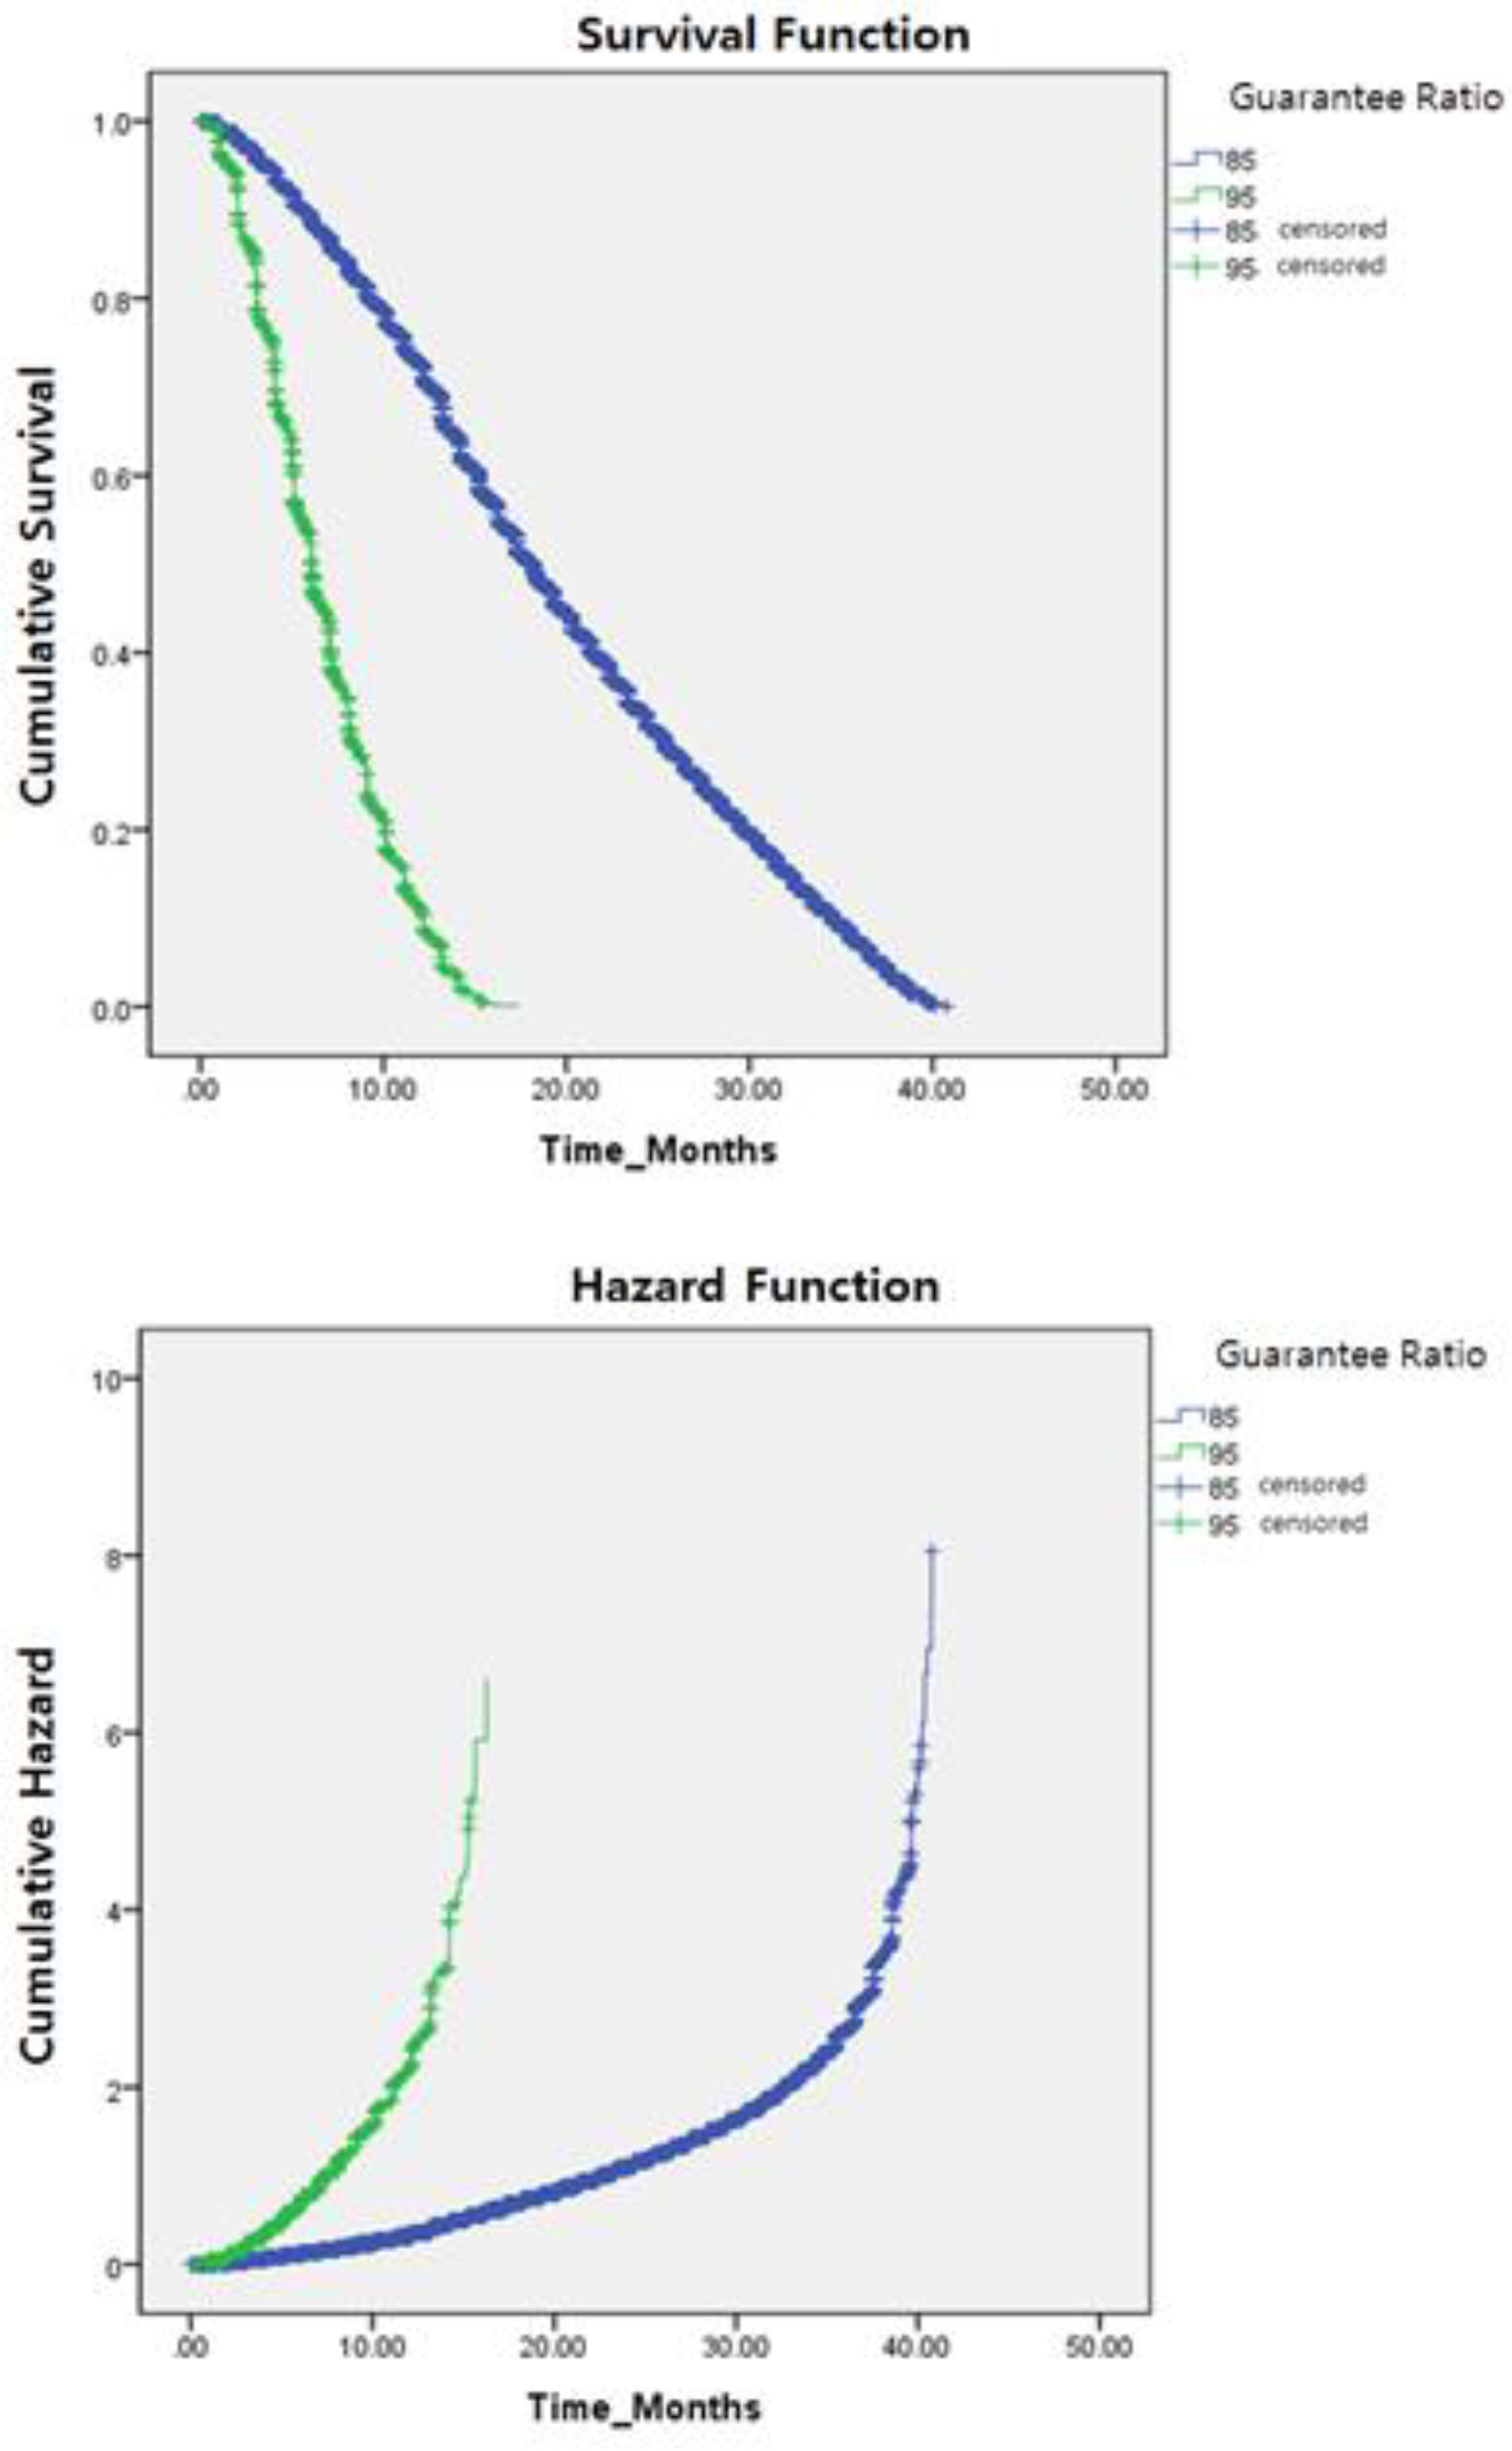
Two types (85% and 95%) of guarantee ratio were identified by the estimated values of the mean survival periods. As shown in Table 3 and Figure 1, the mean survival period for the 85% guarantee ratio was 20.033 months, whereas that for the 95% guarantee ratio was 7.1 months. Consequently, the 85% guarantee ratio survived much longer (12.867 months) than the 95% guarantee ratio.
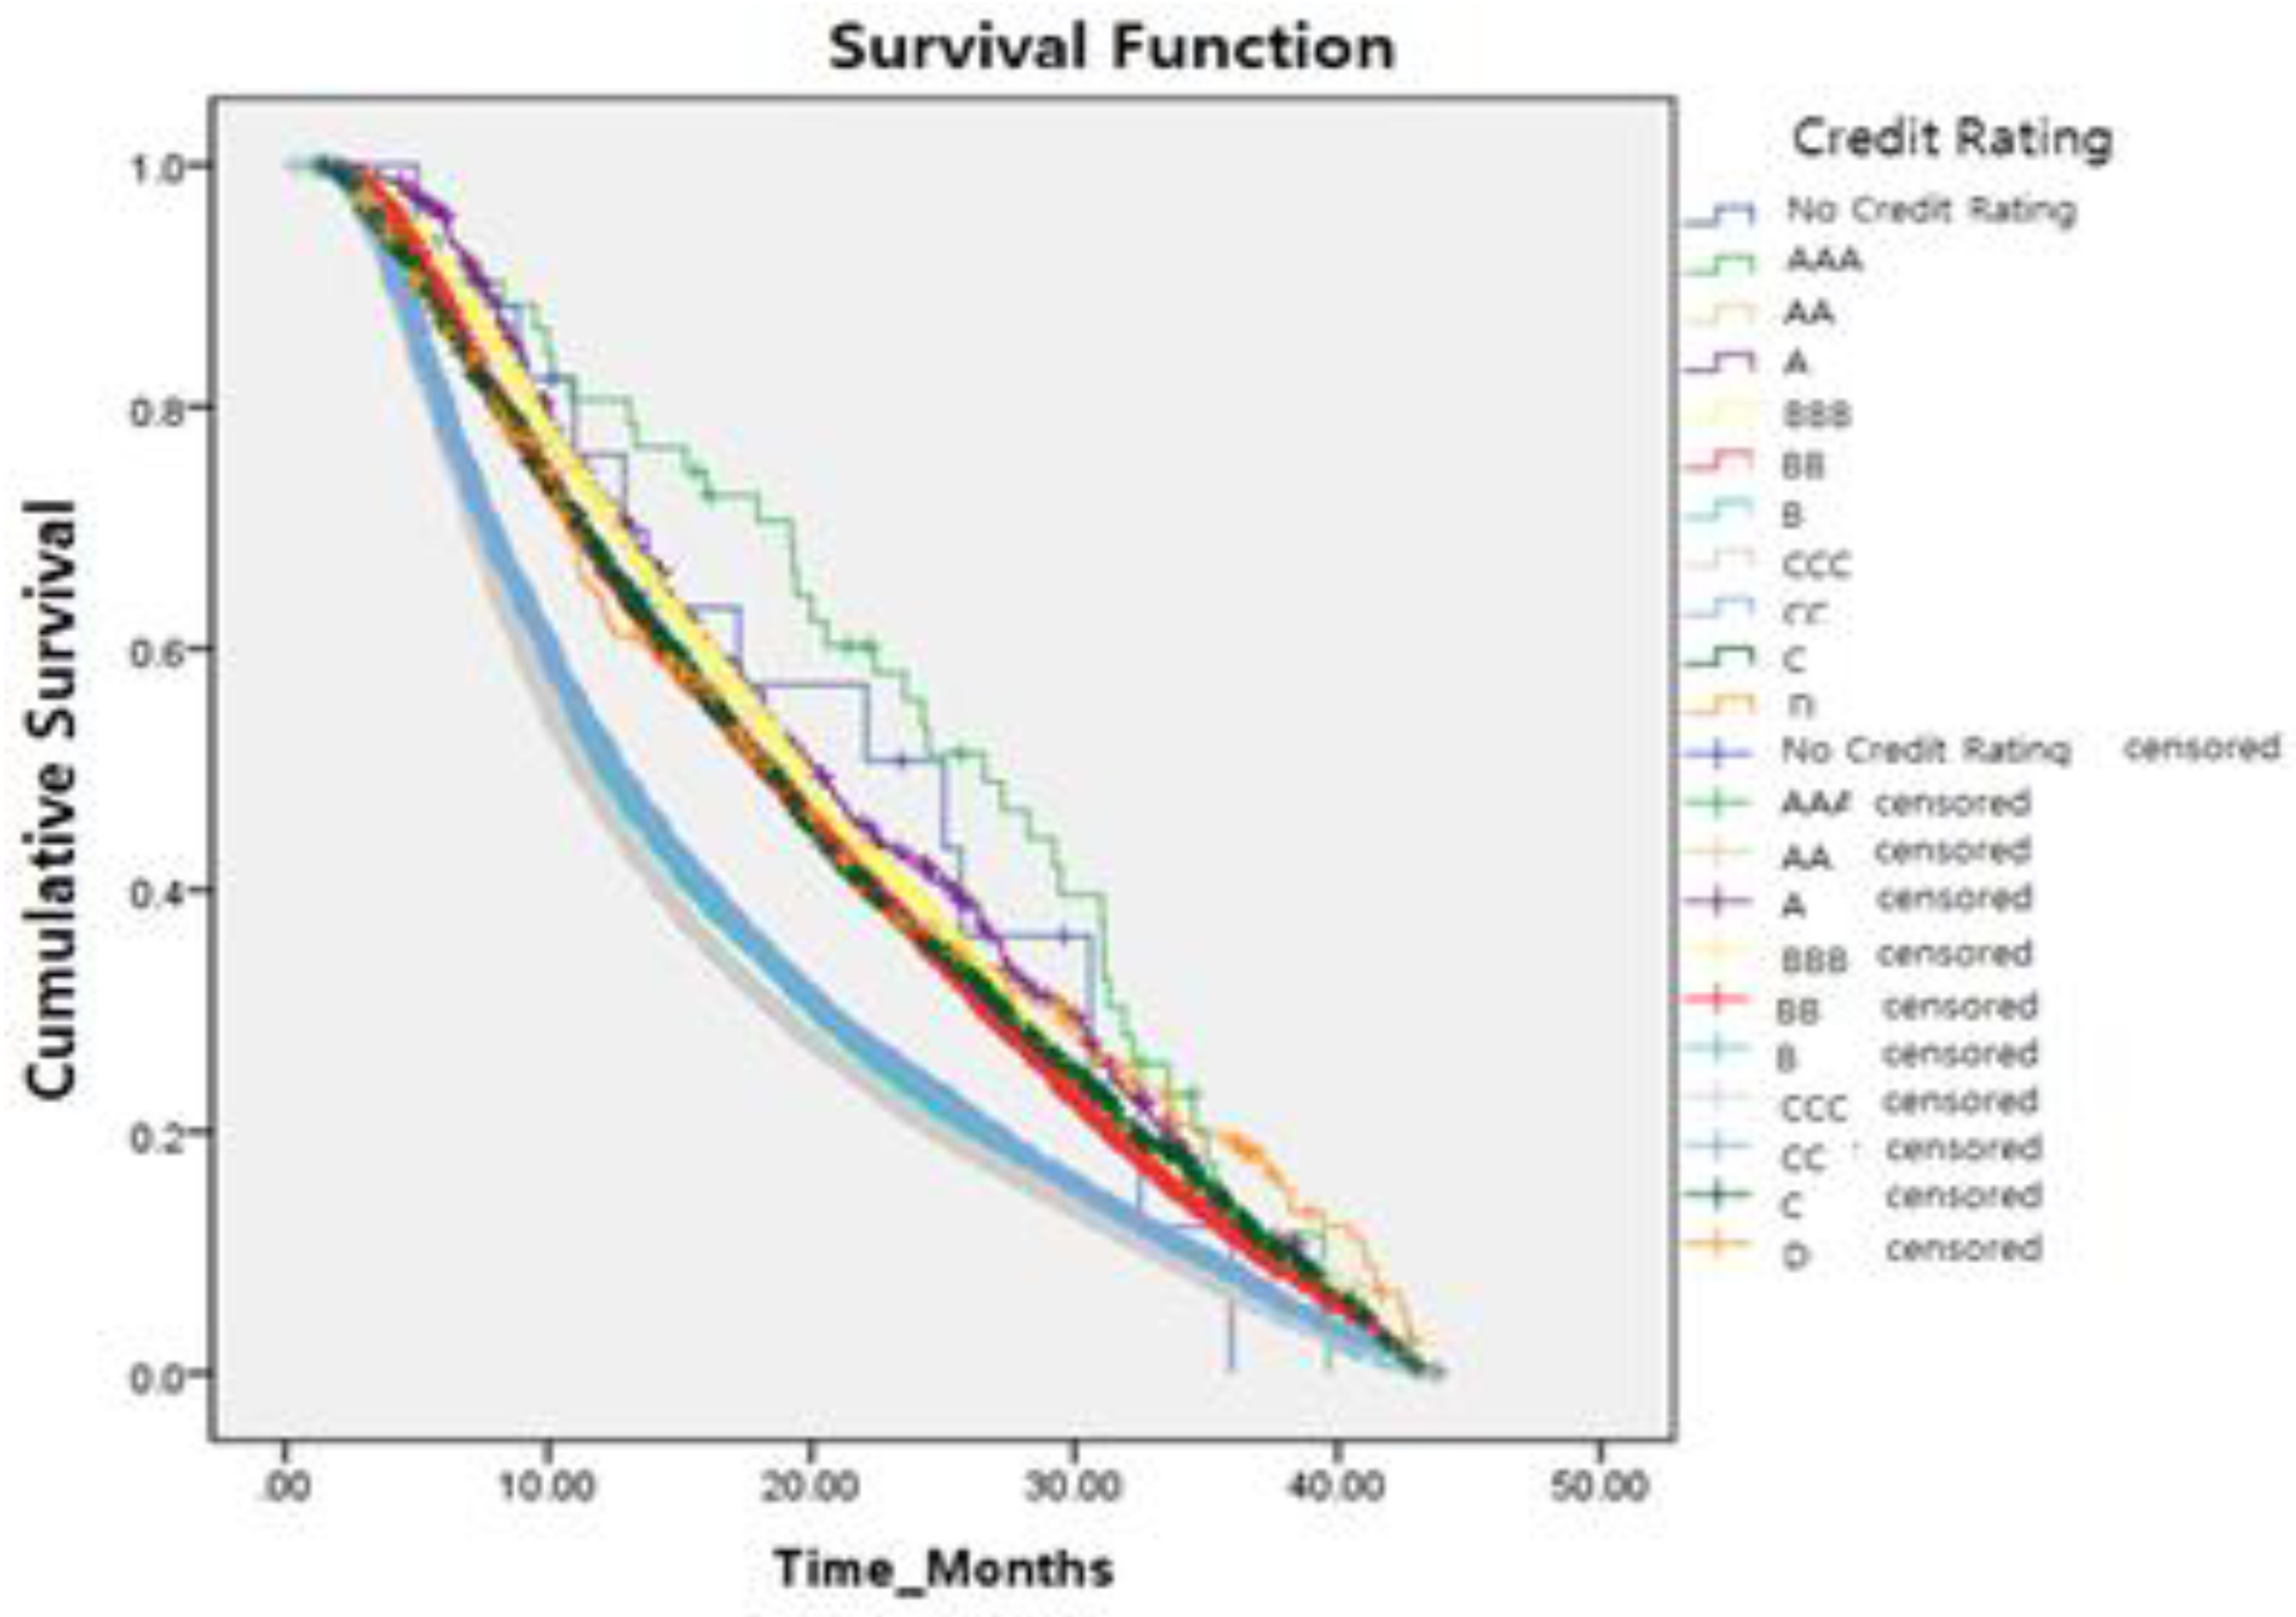
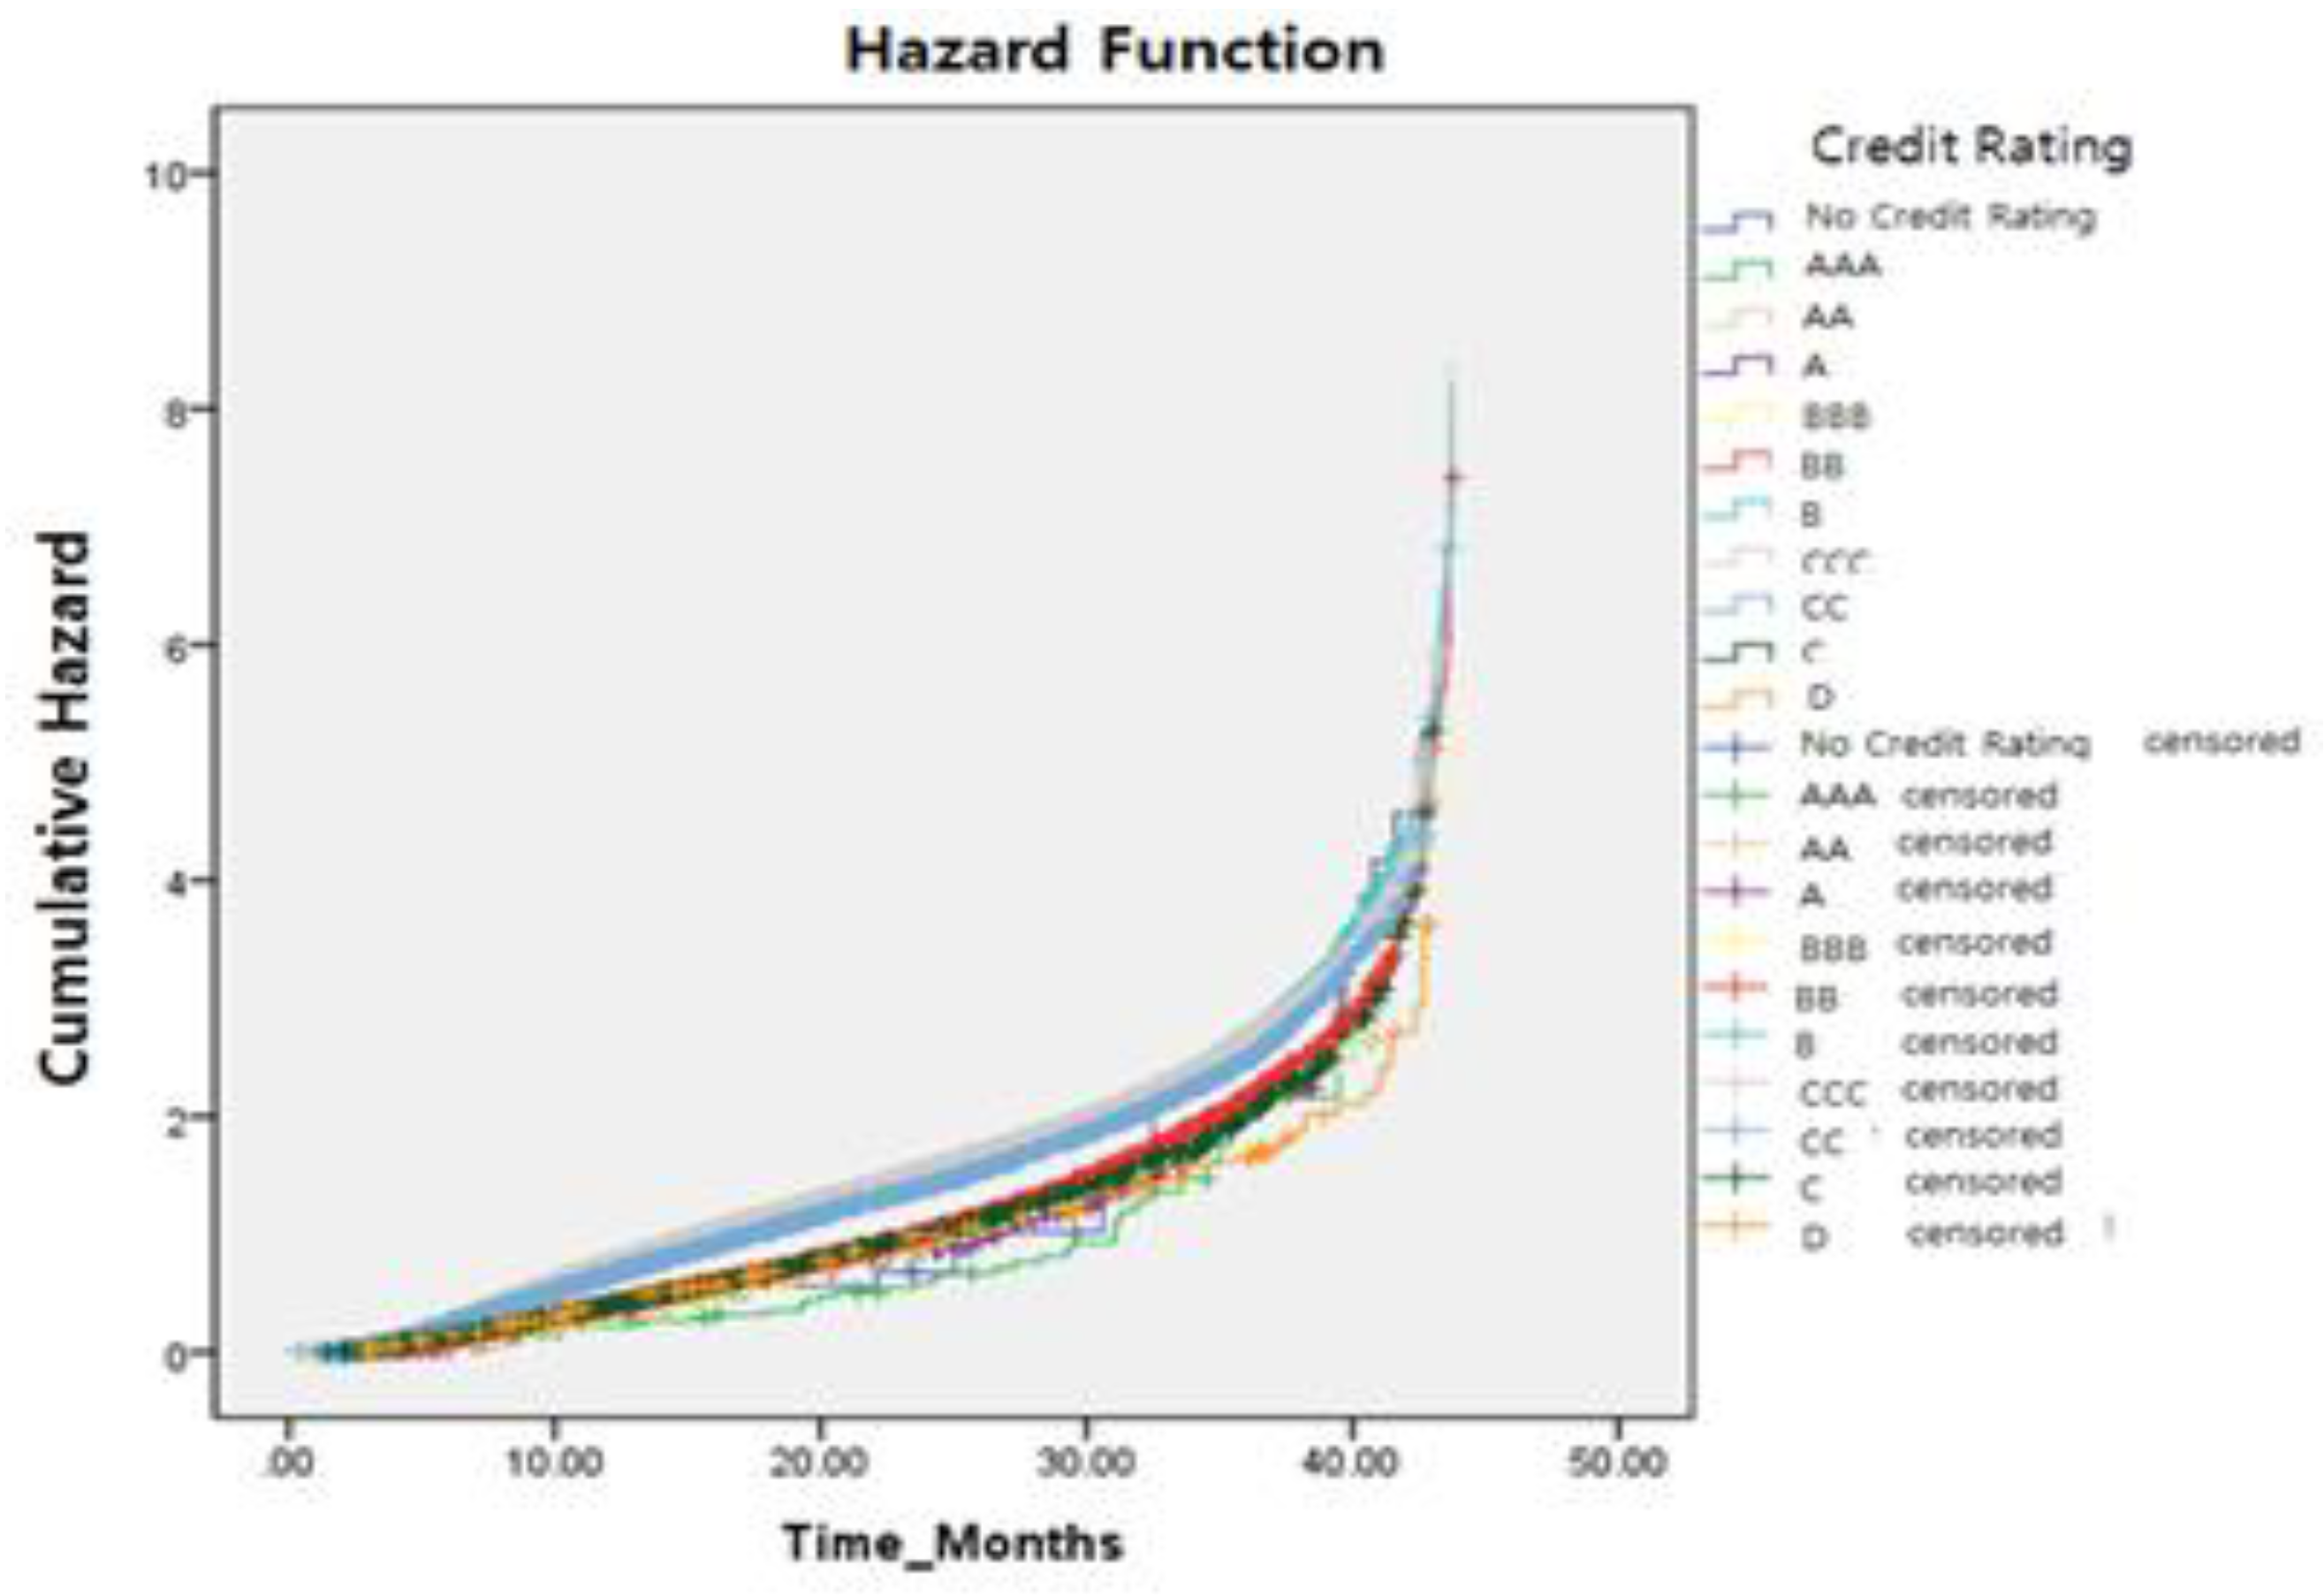
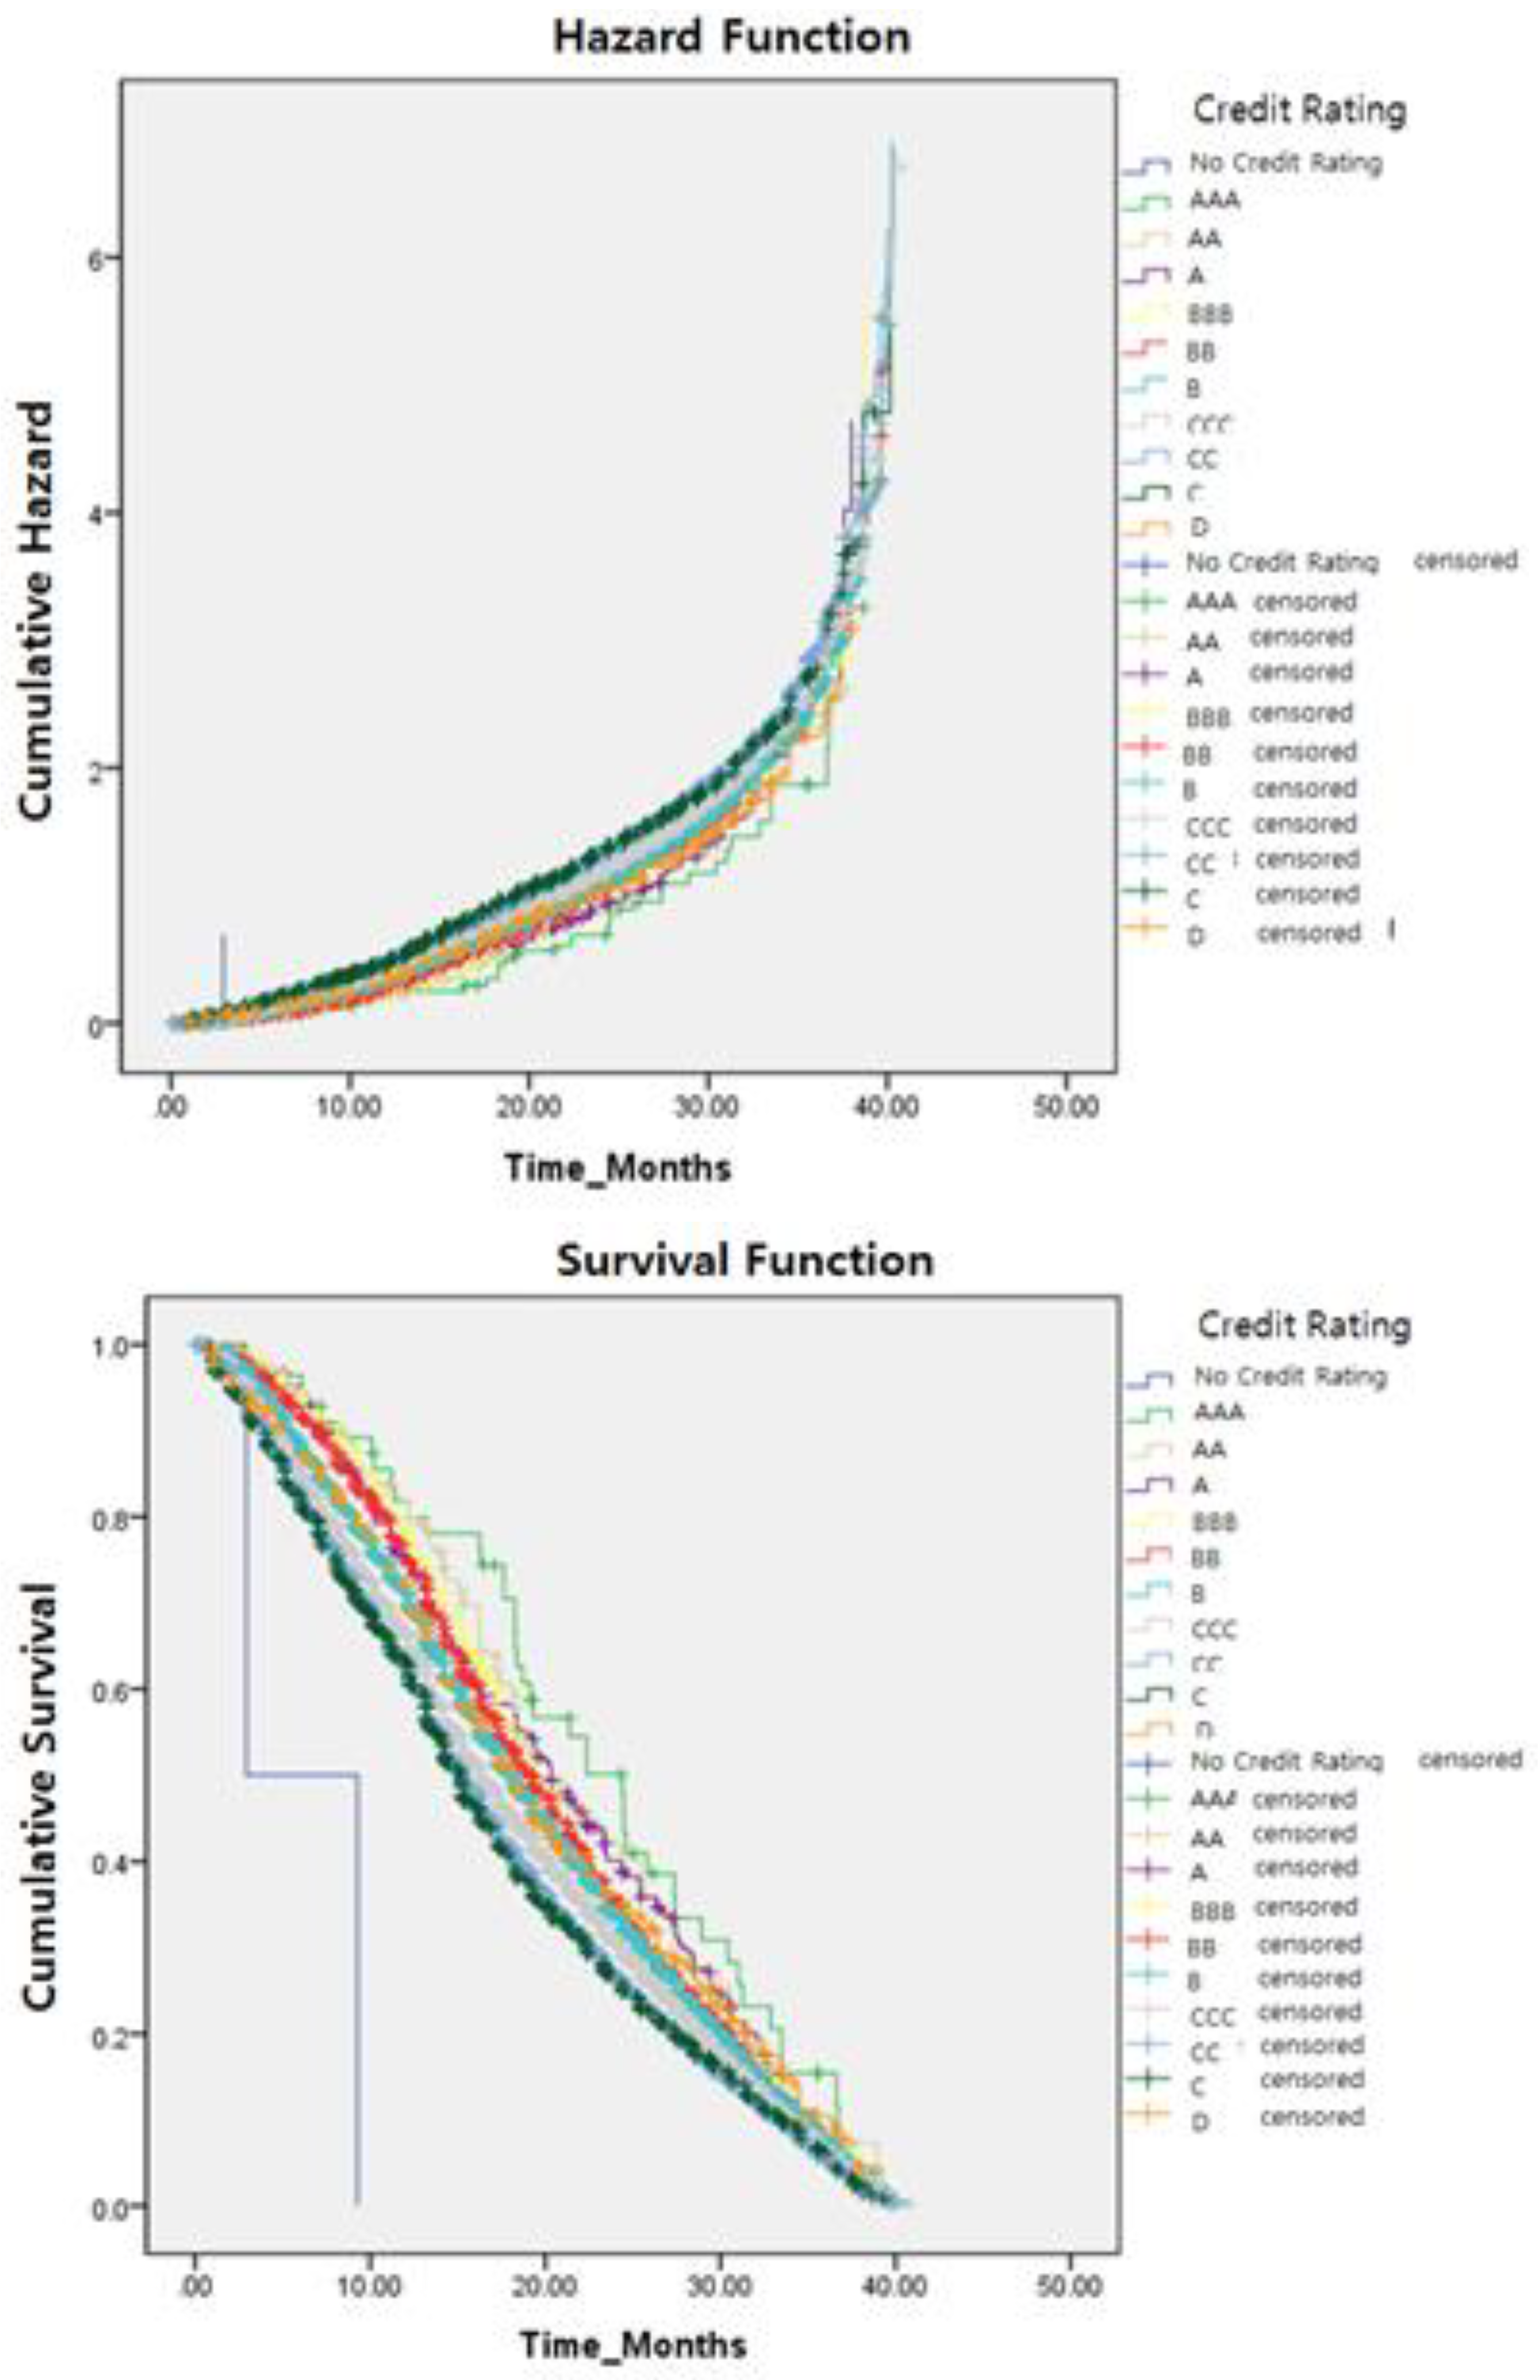
As shown in Table 4 and Figure 2, we estimated the mean survival period values for the credit ratings of self-employers using Kaplan–Meier method. The mean survival periods of the first to tenth credit ratings were 26.567, 19.367, 20.033, 19.433, 18.333, 12.200, 11.200, 12.600, 18.400, and 18.333 months, respectively. These results show that the mean survival periods of three credit ratings (sixth to eighth) were much shorter than those of the other credit ratings. These results are consistent with those of Kang’s study [6], which addressed the relationship between accident rates and the subrogation ratio for self-employers with these credit ratings.
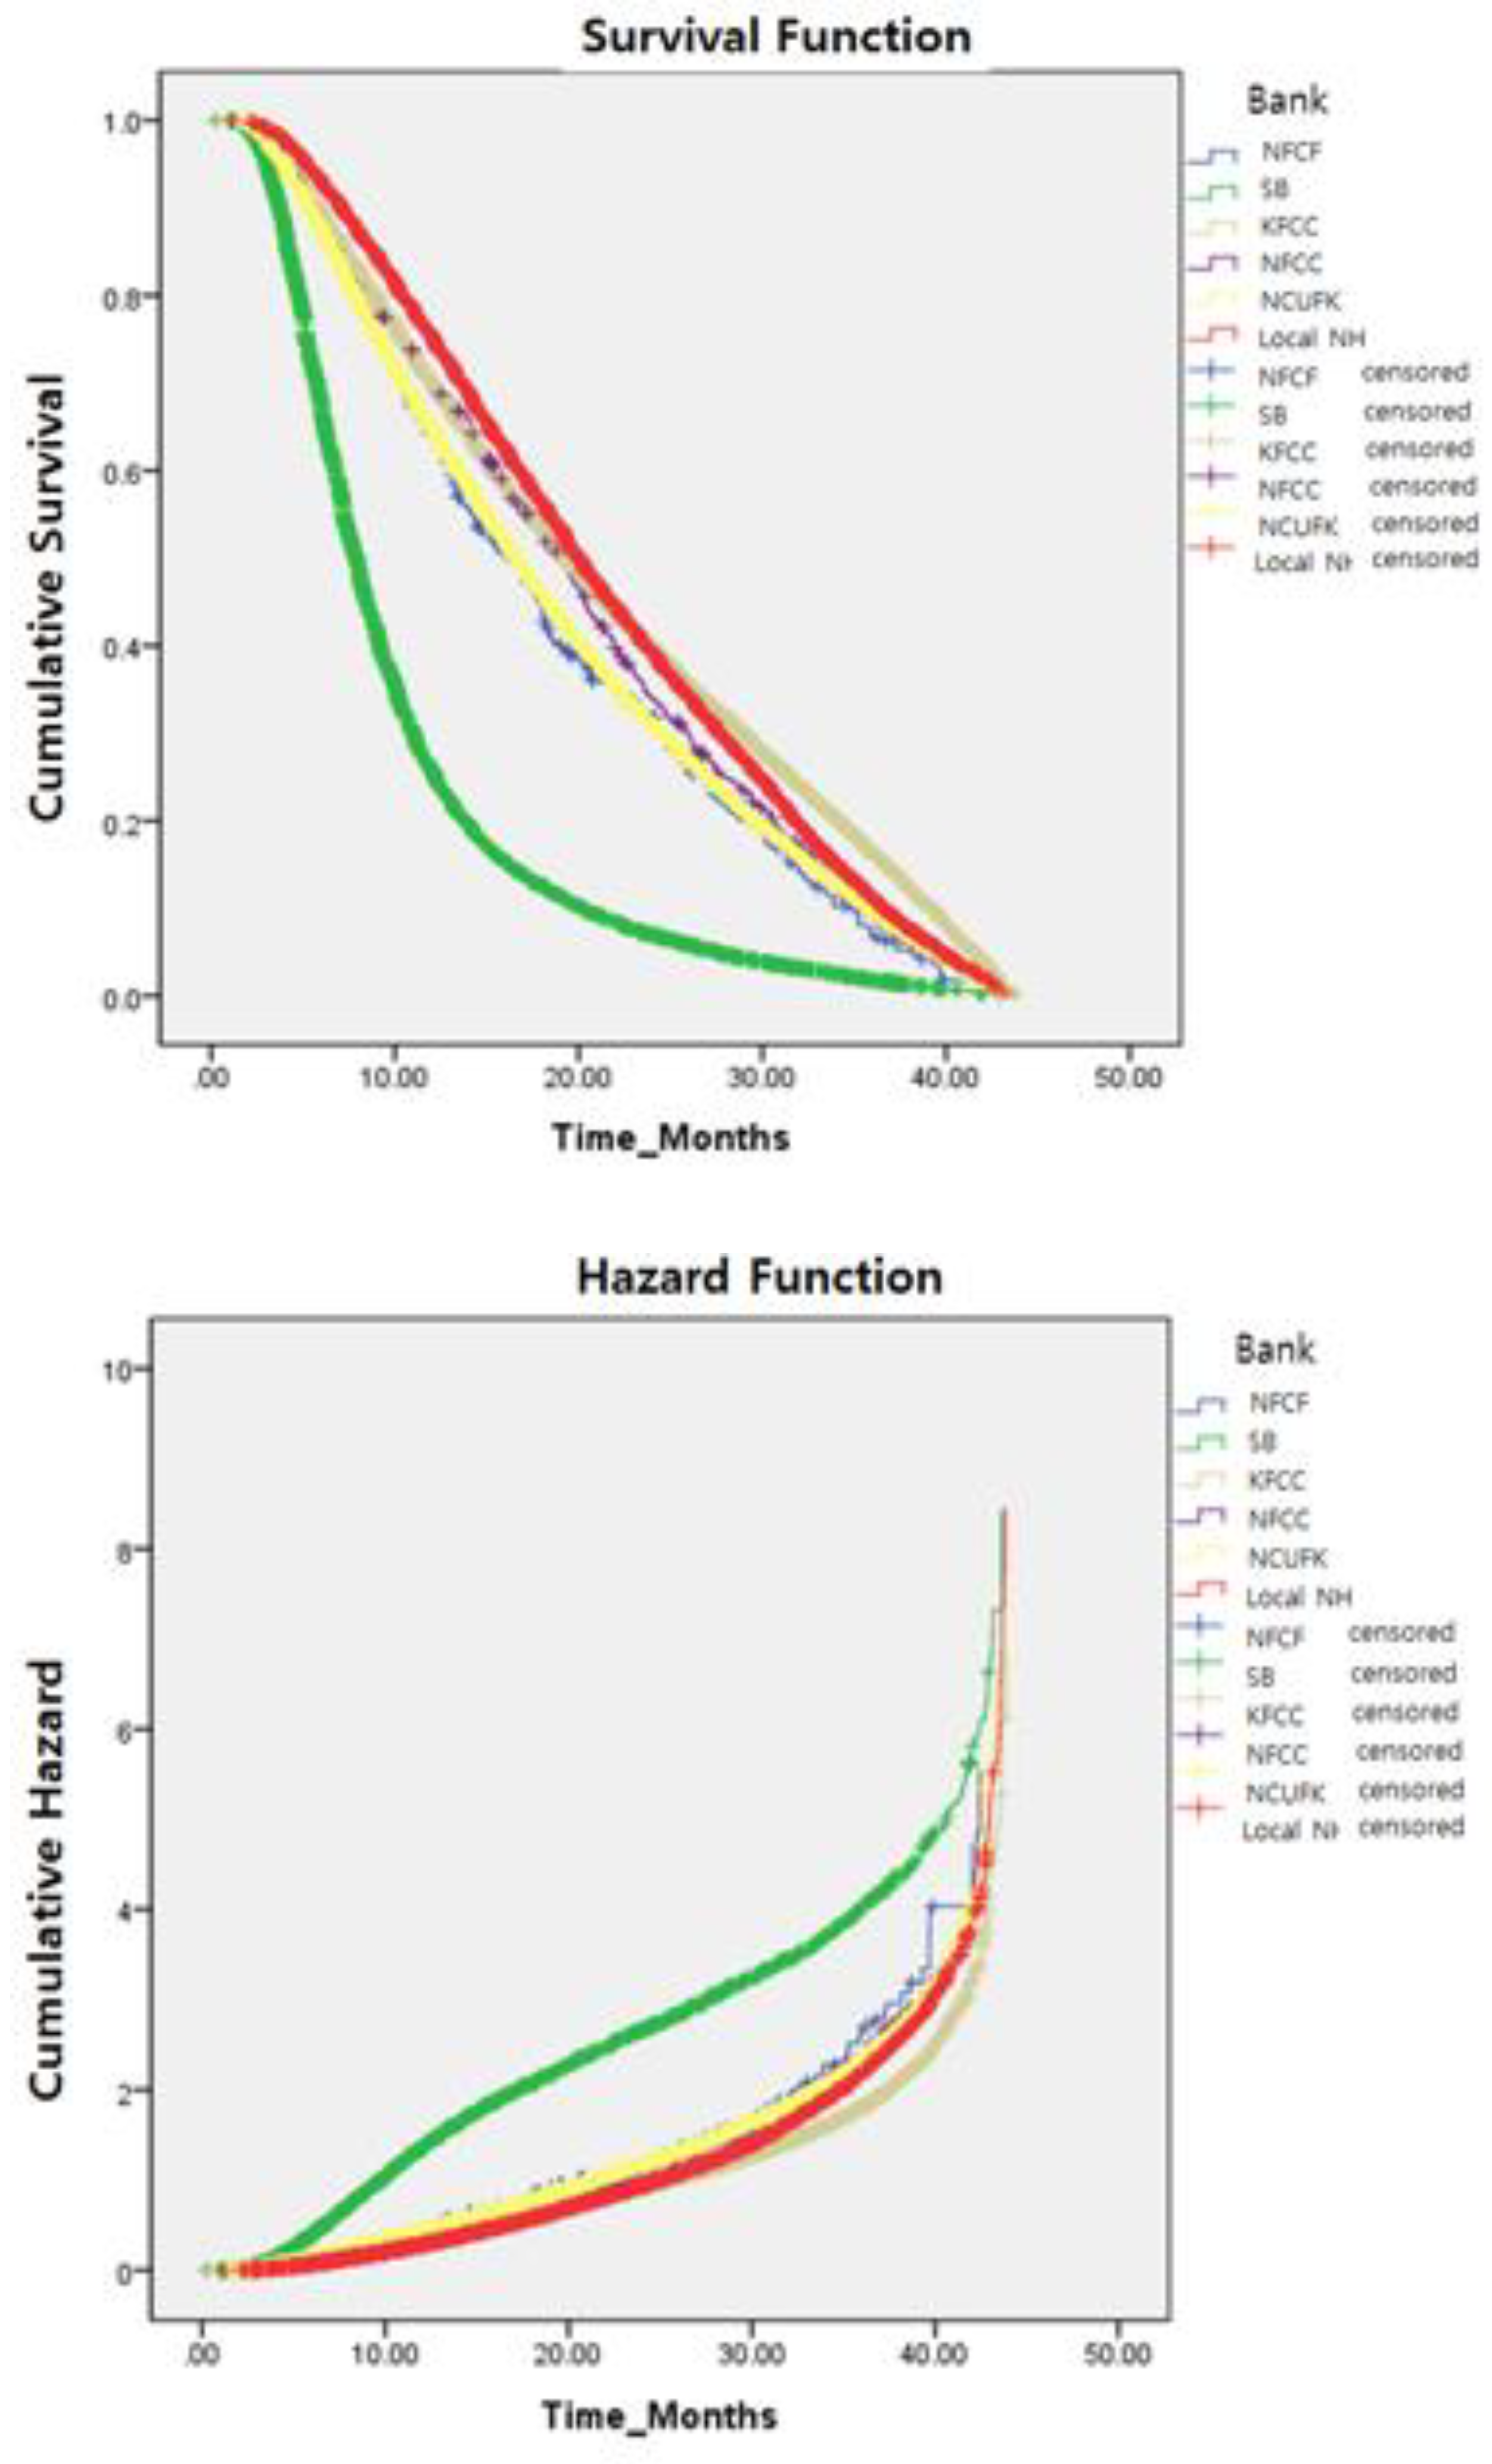
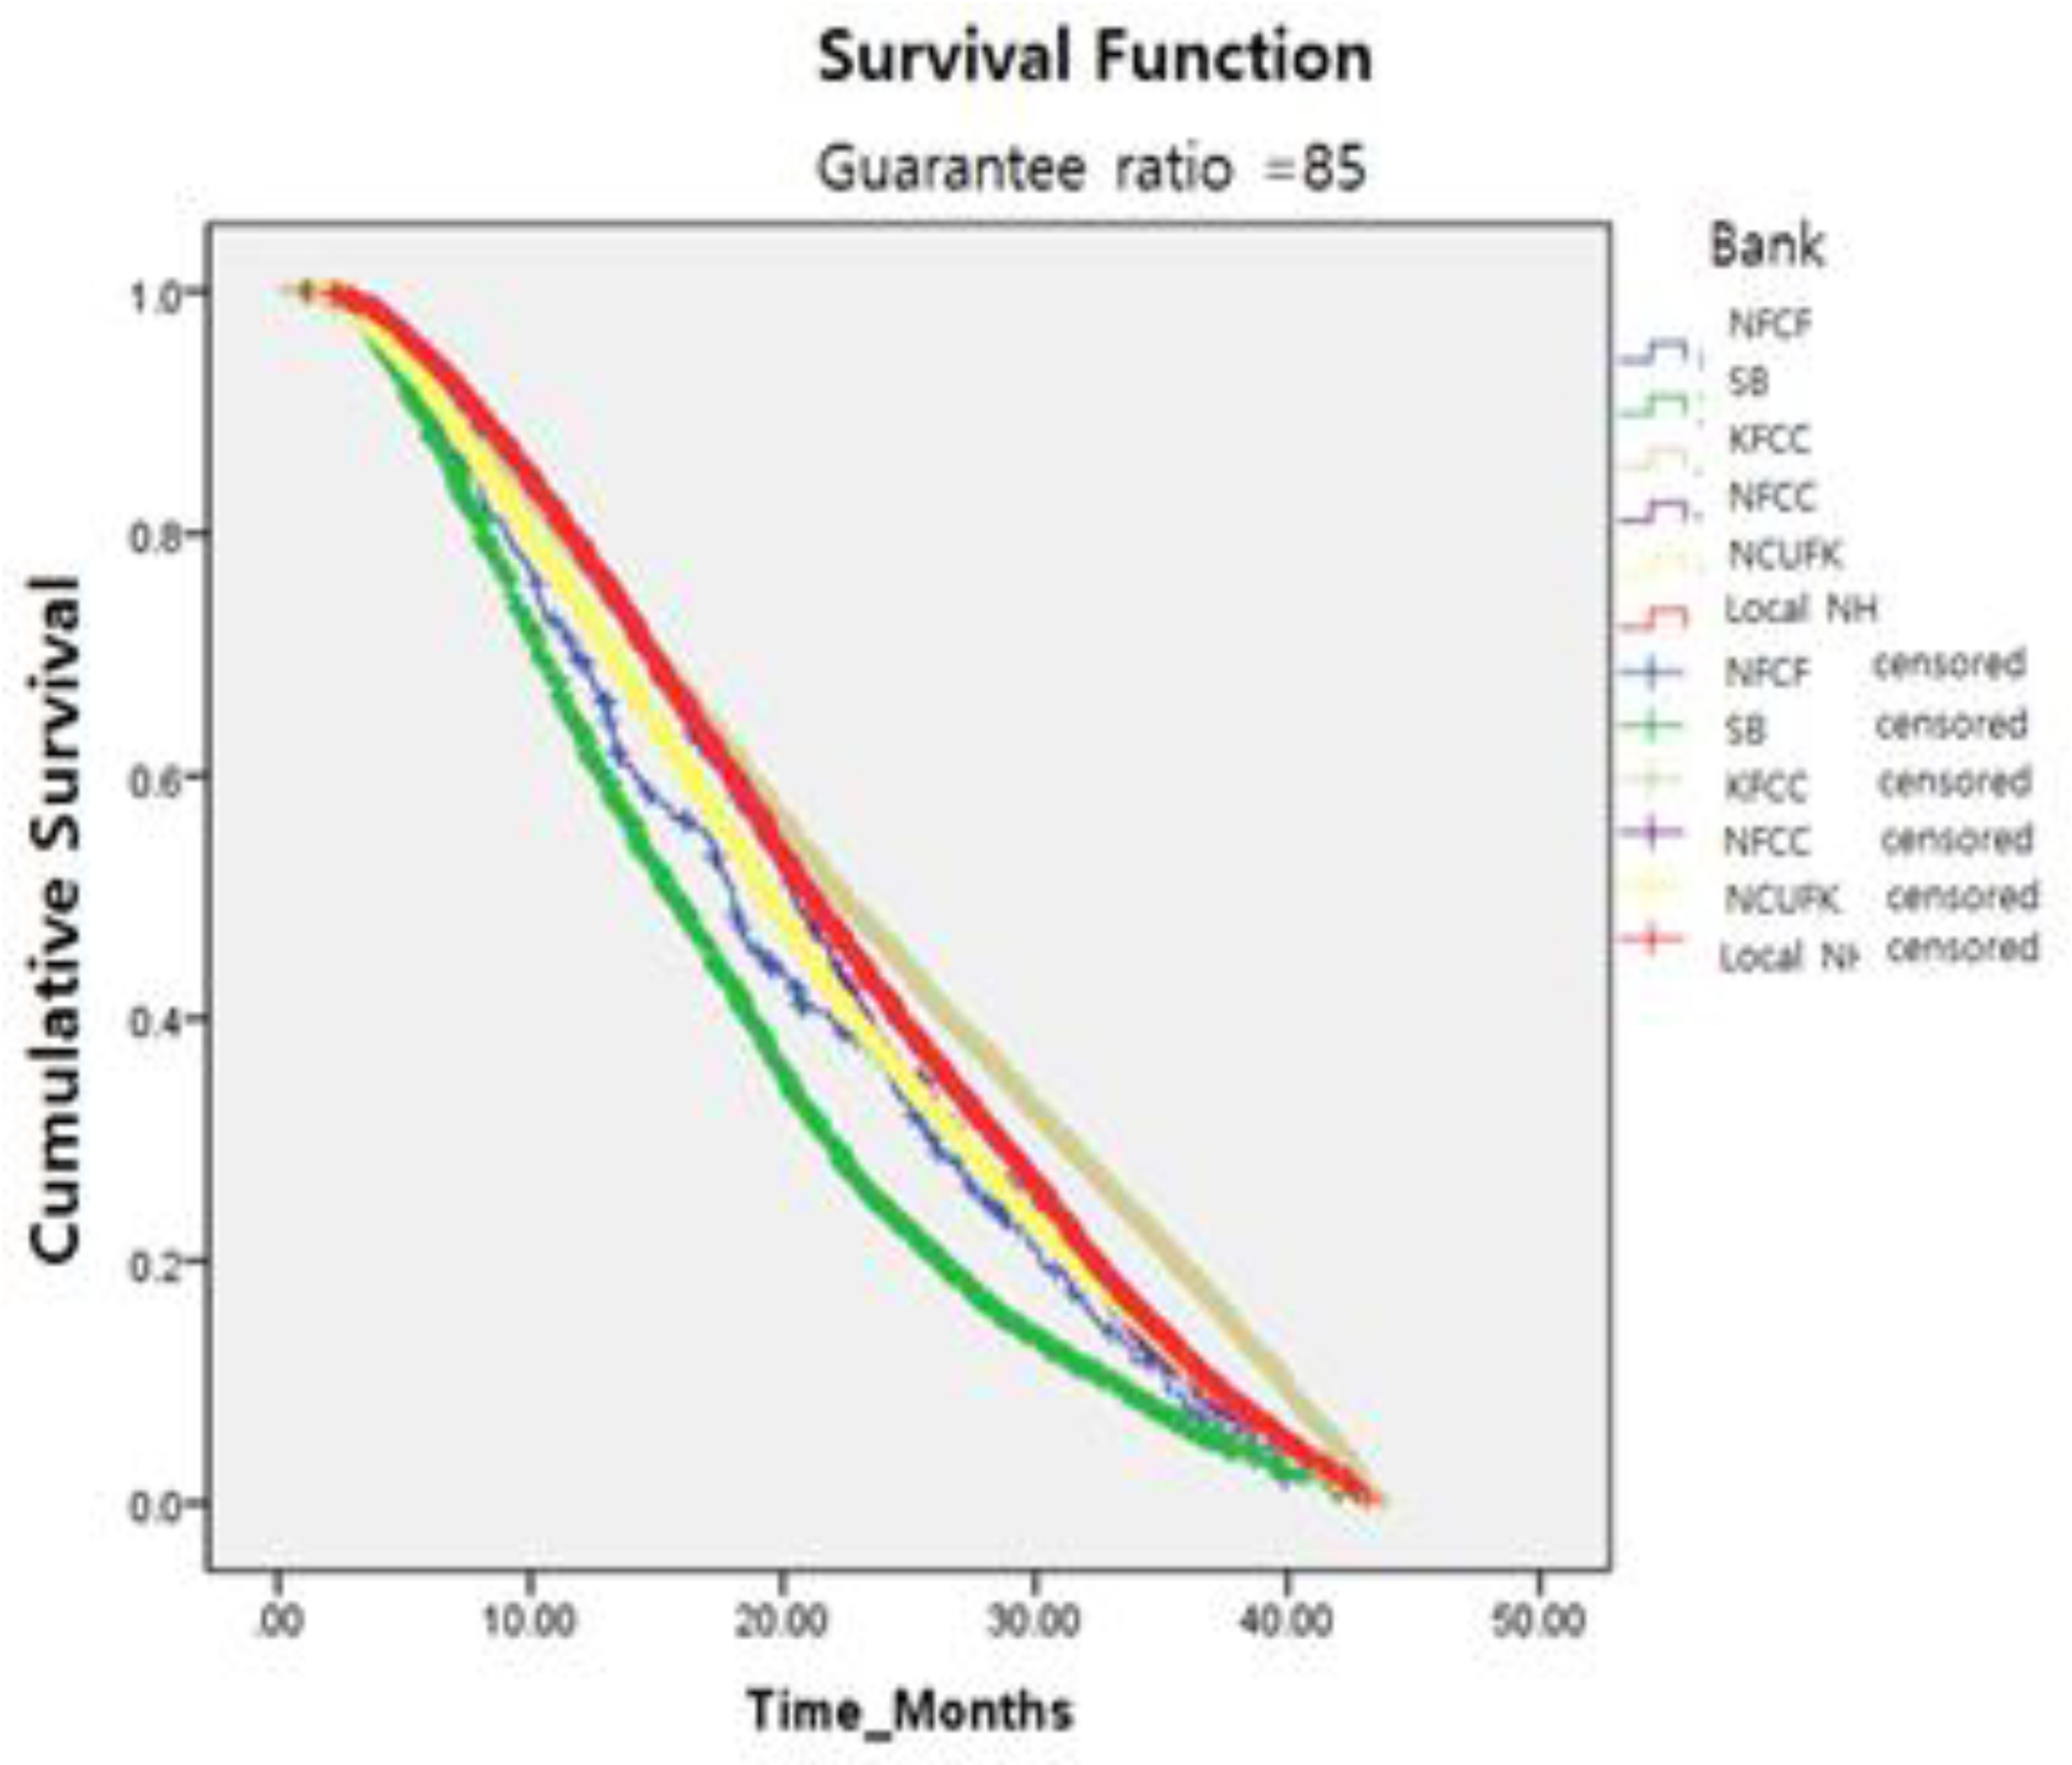
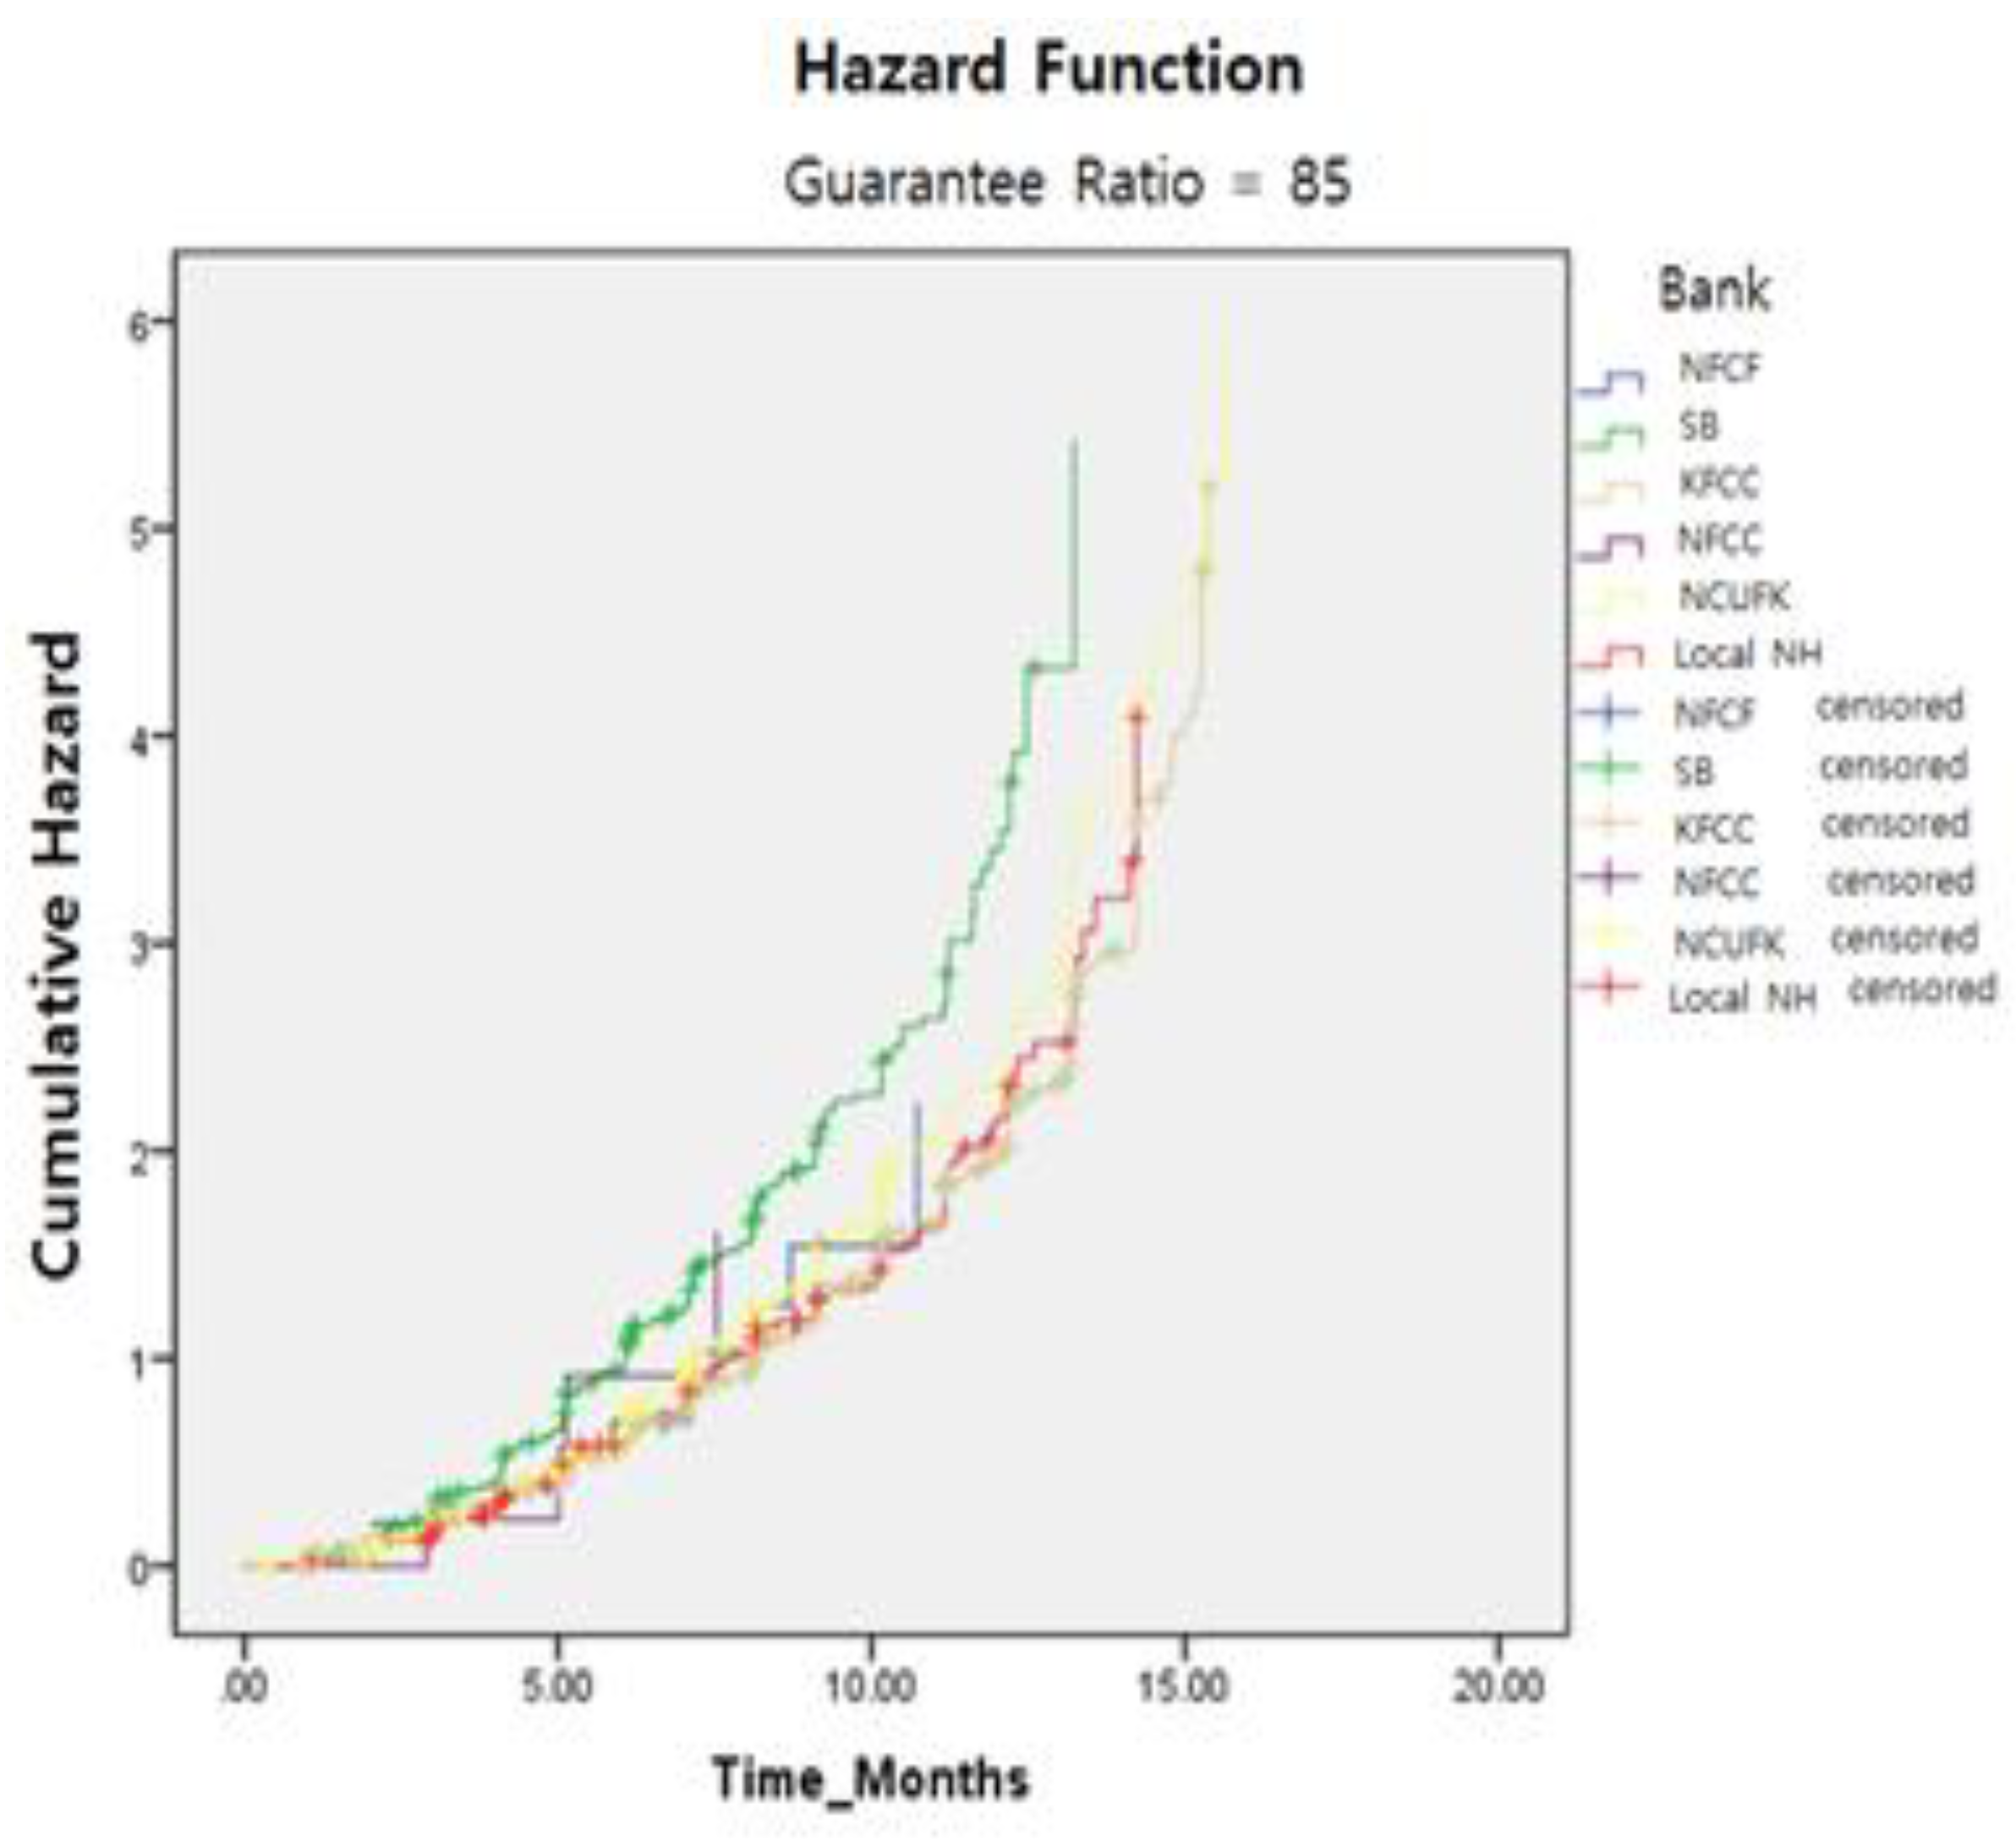
This study estimated mean survival period values based on financial banking institutions (see Table 5 and Figure 3). The estimated values were different across institutions. Specifically, those of NFCF, SB, KFCCC, NFFC, NCUFK, and Local NH were 16.433, 7.9, 19.3, 19.033, 16.533, and 20.067 months, respectively. Interestingly, the mean survival periods of SB were much shorter than those of other institutions. This is probably related to interest rates because the interest rates of SB were very high compared with the others.
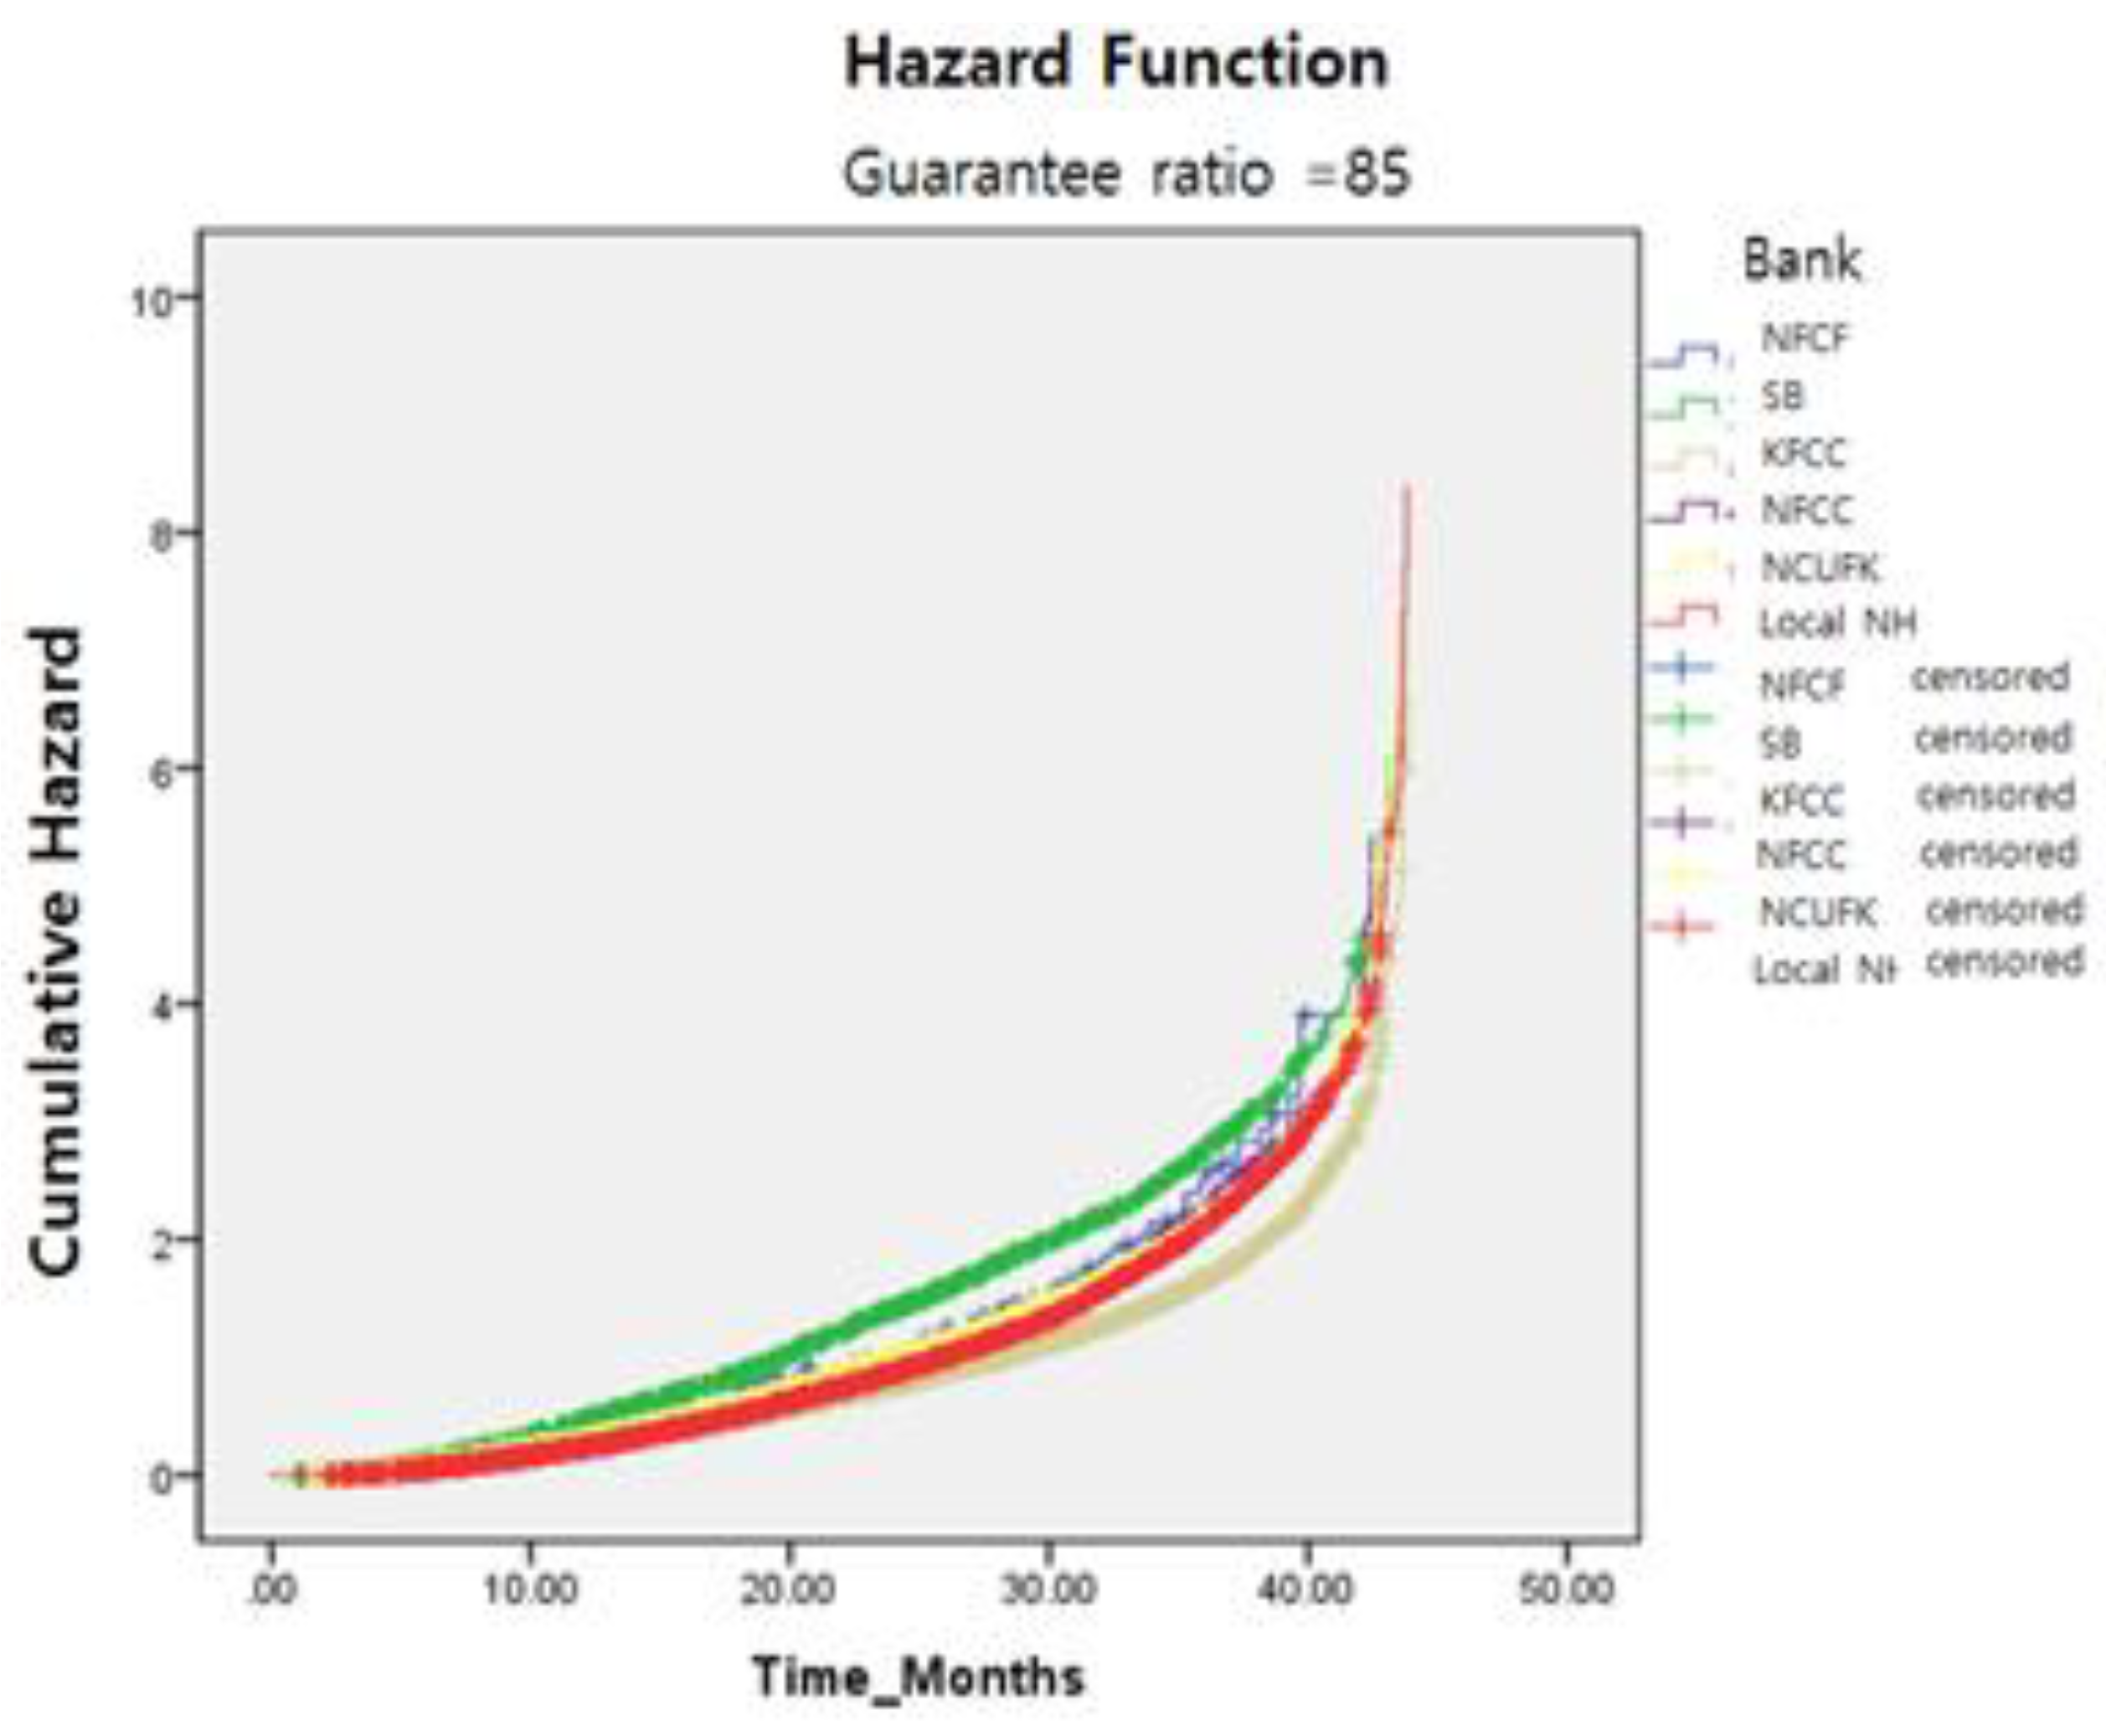
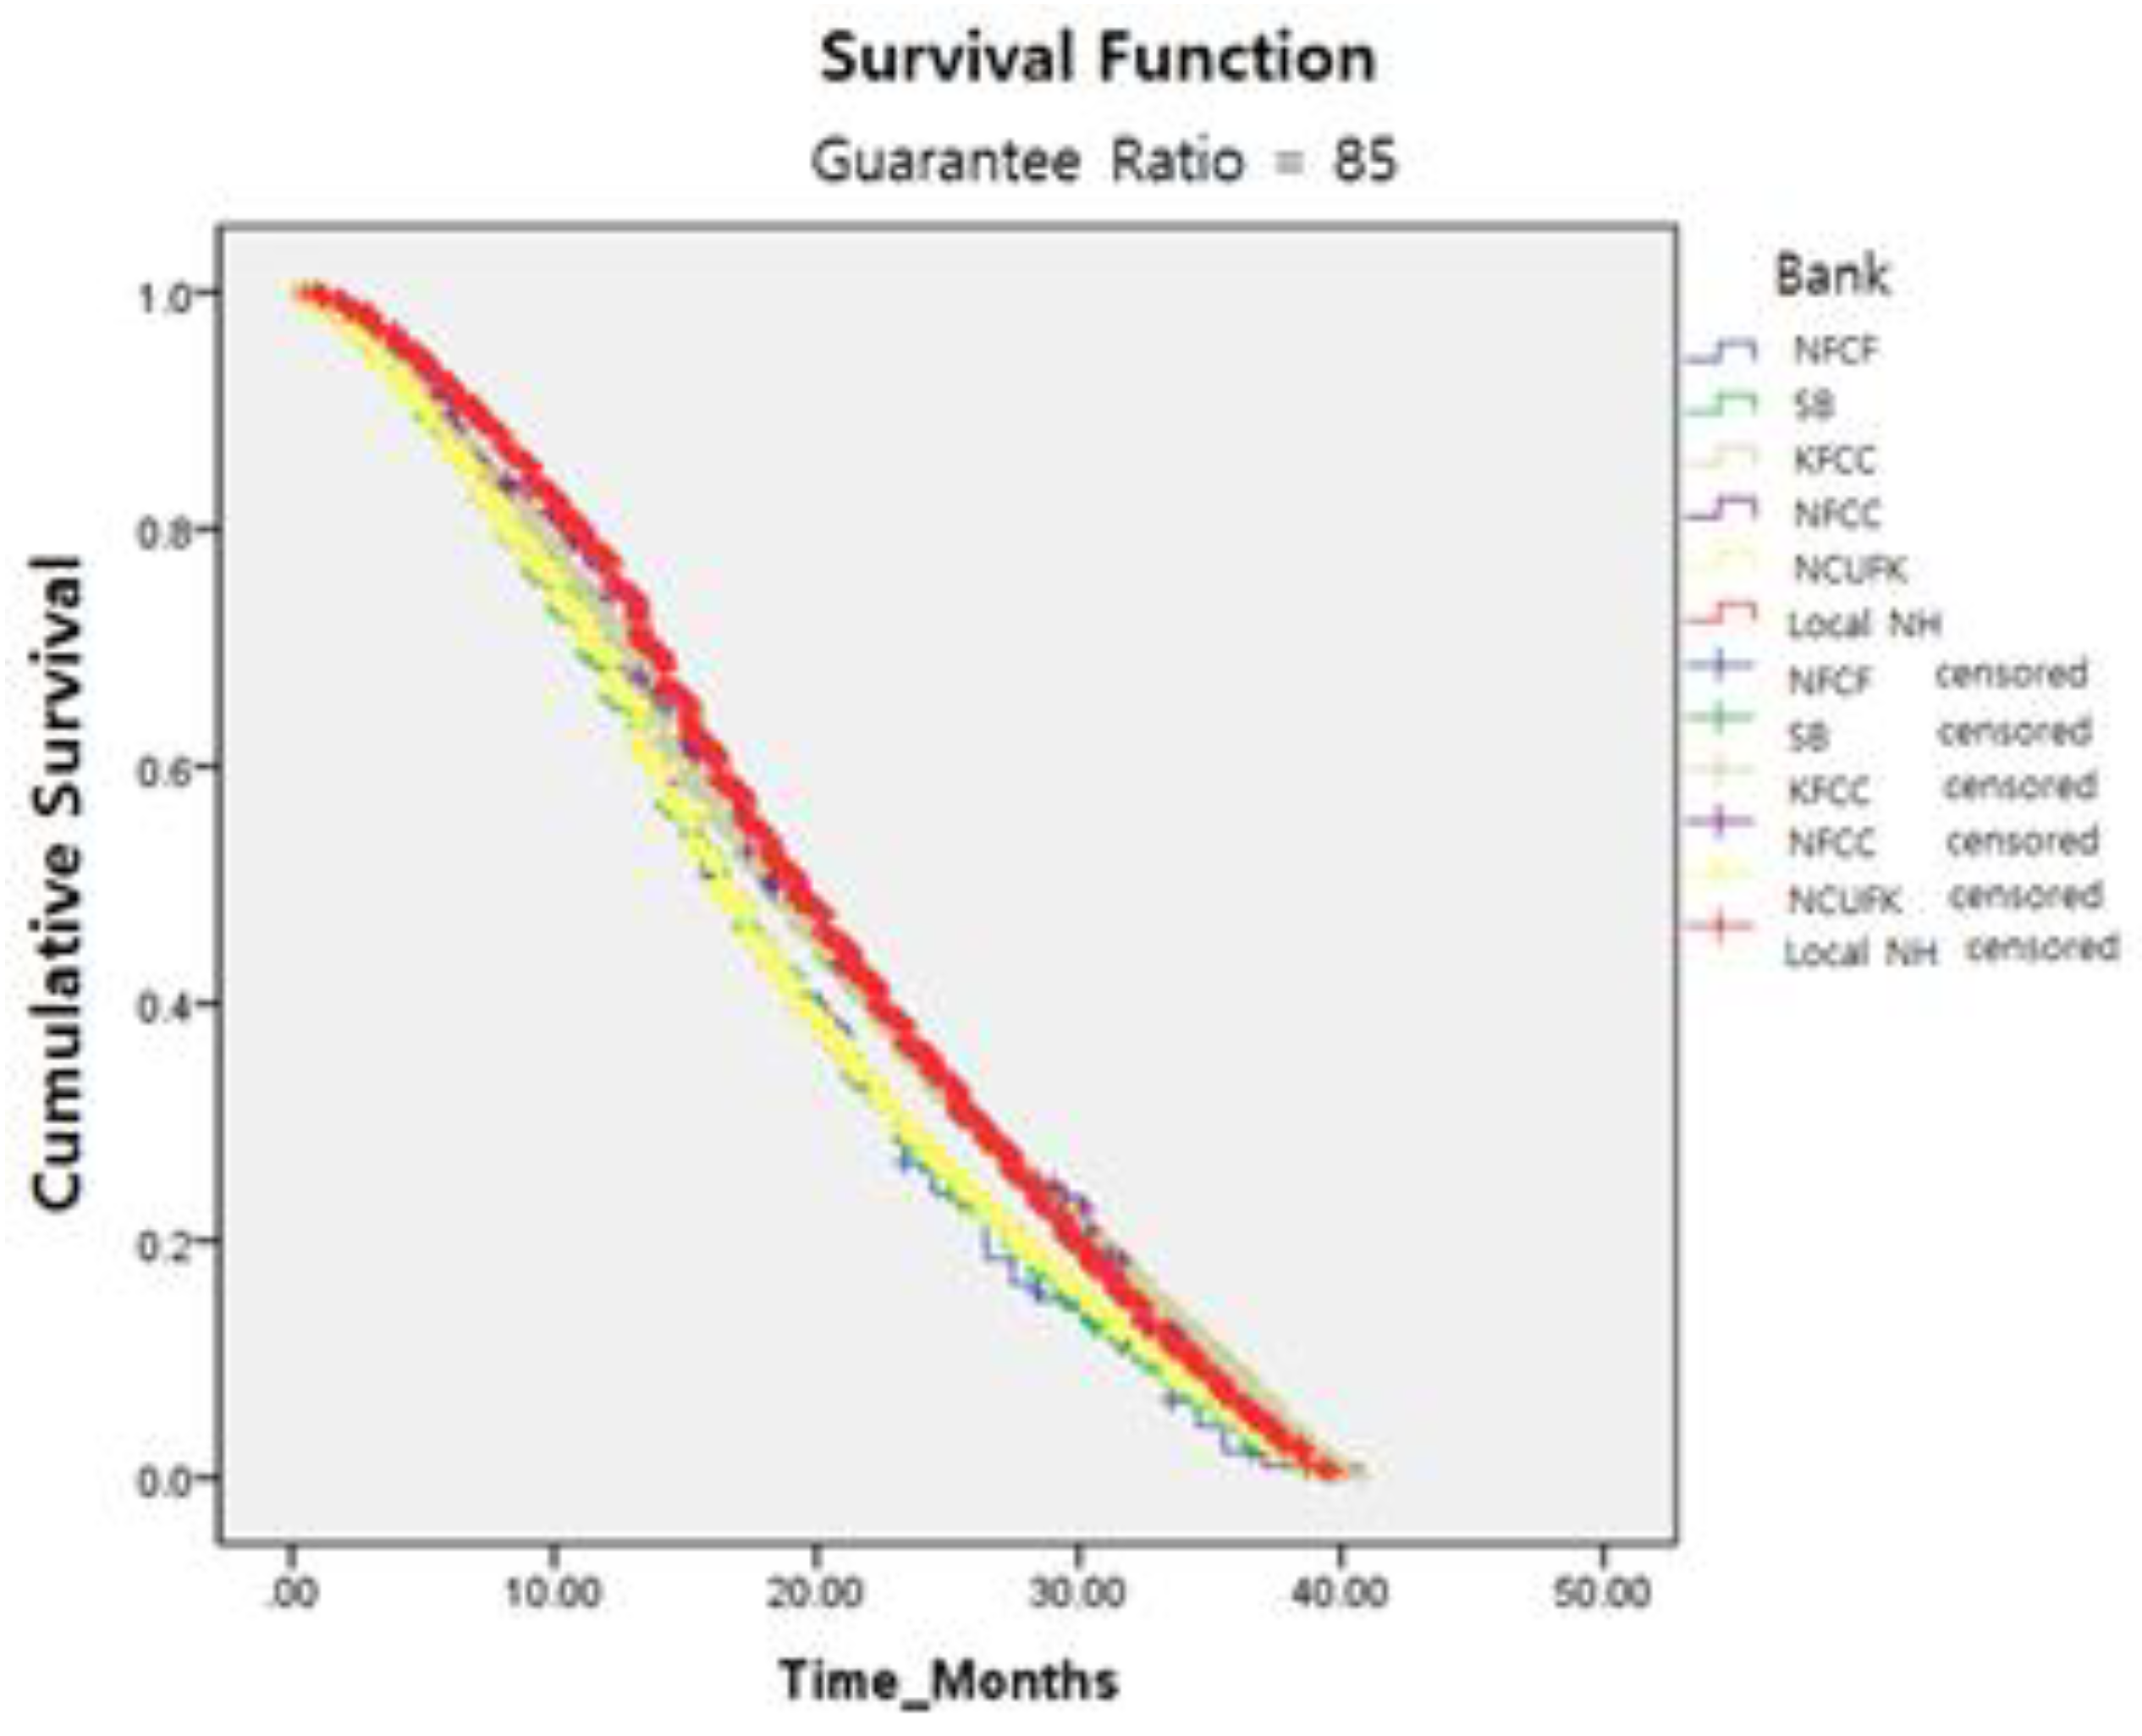
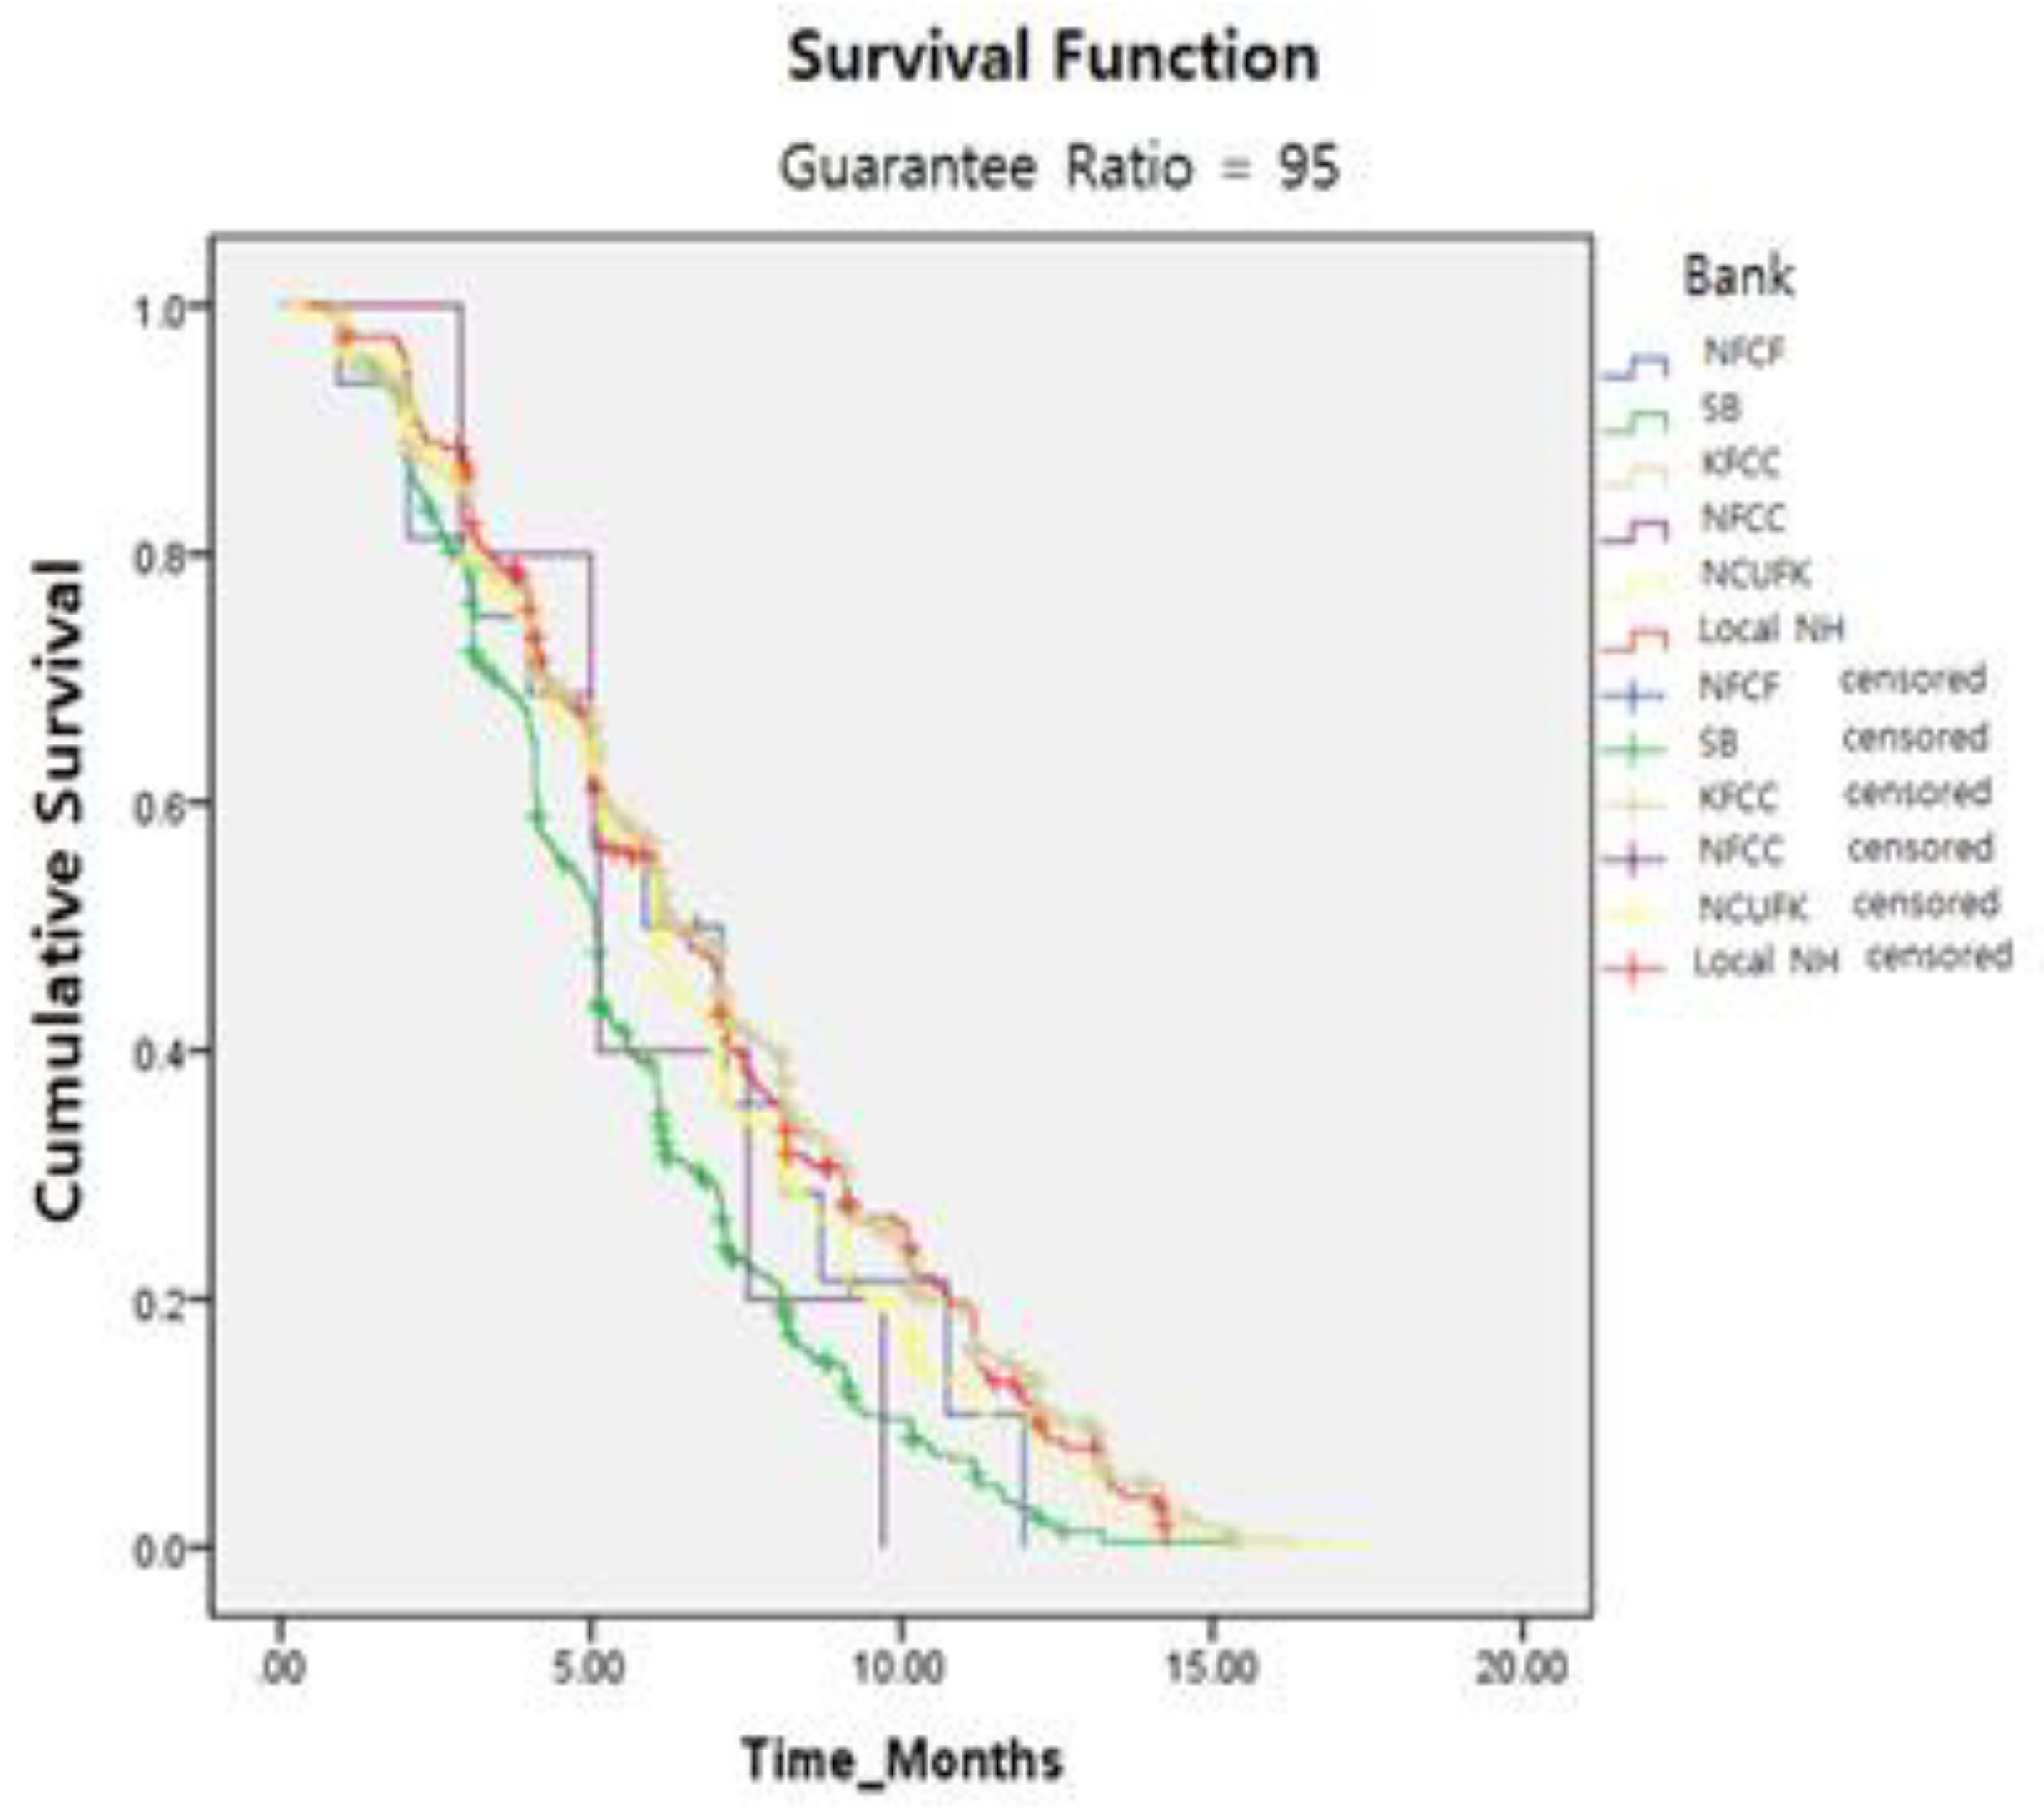
Based on these results, we additionally tested survival periods with a combined dataset (guarantee ratio and financial banking institutions). As shown in Table 6 and Figure 4 and Figure 5, in the case of the 85% guarantee ratio, the mean survival duration of KFCCC was the longest (22.367 months), whereas that of SB was the shortest (15.767 months). In the case of the 95% guarantee ratio, NFCF had the longest survival duration (9.167 months), whereas NFFC had the shortest (5.467 months). More specifically, while the mean survival period for the 85% guarantee ratios was 20.033 months, that for the 95% guarantee ratios was 7.832 months. These findings indicate that lower guarantee ratios are associated with longer survival periods.
It is important to note that this study does not focus on the relationship between guarantee ratio and credit rating. The Korean Government initially designed 85% guarantee ratios based on the average guarantee ratio level offered by six small financial institutions from July 2010 to July 2012. At that time, these institutions’ risks increased by up to 15%, resulting in a reduction of the guarantee supply scale. This is because financial institutions for 85% guarantee ratios should increase the allowance for bad debts by up to 15%. In the case of 95% guarantee ratios, however, they just have to increase allowance for bad debts by up to 5%.
Since the guarantee ratio has increased by 95%, a sharp increase of guarantee supply has accompanied the risk reduction. This indicates that the survival rates of small financial institutions depend on the guarantee ratio. As shown earlier, the highest-level credit ratings are likely to decrease (or increase) risk rates (or survival rates), but the lowest-level credit ratings are likely to increase (or decrease) risk rates (or survival rates). However, financial institutions tend to avoid offering public loans to borrowers with low credit ratings. Additionally, it is difficult to determine survival rates and survival periods. In line with these observations, this study did not conduct cross-tabulation tests between guarantee ratio and credit rating.
4.4. Result 2: SMEs
As noted in Result 1, two types of guarantee ratios (85% and 95%) are identified by the estimated value of mean survival periods. As shown in Table 7 and Figure 6, the mean survival period for the 85% guarantee ratio was 18.2 months, whereas that for the 95% guarantee ratio was 6.1 months. Consequently, the 85% guarantee ratio survived much longer (12.1 months) than the 95% guarantee ratio.
As shown in Table 8 and Figure 7, we estimated the mean survival period values for the credit ratings of SMEs. The mean survival period for the noncredit rating was 2.933 months, and those for the first to tenth credit ratings were 24.4, 20.33, 20.3, 19.367, 19.2, 18.133, 16.267, 15.233, 15.167, and 18.267 months, respectively. Apart from the noncredit rating and tenth credit rating groups, these results show that the survival durations became gradually shorter from the first to tenth credit ratings. Consequently, there are no differences among credit ratings, suggesting that Regional Credit Guarantee Foundations (RCGFs) effectively deal with guaranteeing businesses.
This study estimated mean survival period values based on financial banking institutions for SME loans (see Table 9 and Figure 8). These estimated values were very similar to those of self-employers. Specifically, those of NFCF, SB, KFCCC, NFFC, NCUFK, and Local NH were 15.3, 13.267, 17.267, 18.267, 15.267, and 18.767 months, respectively. Consistent with the findings of self-employers, the mean survival period of SB was much shorter than those of other institutions. These results also explain the similar situation of credit ratings.
Finally, we tested survival periods based on guarantee ratio and financial banking institutions. As shown in Table 10 and Figure 9 and Figure 10, in the case of the 85% guarantee ratio, the mean survival duration of Local NH was the longest (19.3 months), whereas that of NFCK was the shortest (16.267 months). The difference in survival periods was 3.033 months. These results on financial institutions are quite different from those of self-employers. In the case of the 95% guarantee ratio, the longest survival periods were those of KFCCC (6.4 months) and Local NH (6.4 months), whereas the shortest was that of SB (5.067 months). More specifically, while the mean survival period for the 85% guarantee ratios was 18.2 months, the mean survival period for the 95% guarantee ratios was 6.1 months. These survival durations were also similar to those of self-employers.
4.5. Survival Comparison Between Self-Employers and SMEs
There was a difference in the survival periods between self-employers and SMEs. While the average survival period of self-employers was 12.867 months, that of SMEs was 16.867 months. Although this difference is unique, an absolute comparison is impossible due to product characteristics. This is because in the case of operation and foundation funds for SMEs, the principal and interest after the one-year grace period are repaid, suggesting that the survival period of SMEs may be longer than that of self-employers. Considering this issue, a study comparing the two parties is needed.
In terms of guarantee ratios (see Table 11 and Table 12), the survival periods of self-employers were much longer than those of SMEs for both guarantee ratios (85% and 95%). Regarding credit ratings, self-employers with the sixth to eighth credit ratings were likely to have short survival periods, whereas SMEs with the seventh to ninth credit ratings had shorter survival periods. Finally, regarding small financial banking institutions, SB had the shortest survival period of both parties. Meanwhile, for the self-employer group, there were wider variations in survival periods compared to the SME group. These results are consistent with the credit rating findings.
5. Conclusions
Previous research has mainly shown that public loans, through which self-employers and SMEs borrow money from public financial institutions, yield more beneficial results than commercial bank loans [4]. However, these studies have largely neglected the effective management of public funds. More specifically, how to ensure the optimal balance between small businesses and loan providers for managing public funds over time remains unclear. Moreover, little is known about how public funds should be managed to increase the survival periods, which are directly related to these institutions’ financial stability. To address these issues, this study explores the differences between self-employers and SMEs using survival analysis and investigated survival periods using key estimation criteria, such as guarantee ratios, credit ratings, and public financial institutions.
In the first step, we used a large empirical field dataset to investigate real customers’ reactions to survival periods. In particular, we explored survival periods for each individual group (self-employers vs. SMEs). The findings clearly show that individual-based borrowers, such as self-employers, have a strong tendency to survive much longer than SMEs. From the financial additionality perspective, these public credit schemes in Korea allow the targeted self-employers (or SMES) to borrow at longer maturities. Thus, this study elucidates which borrowers (individuals vs. small firms) are healthy and sheds light on the directions of public finance.
In the next step, we examined the differences between the two parties. Specifically, we focused on guarantee ratios, credit ratings, and banks that either enhanced the survival periods of these borrowers or decreased the financial risks of public institutions. Our results suggested that 85% guarantee ratios and high credit ratings help increase survival periods and reduce the financial solidity of public financial institutions. Moreover, no general approach is able to guide these institutions’ directions because each bank deals with its customers in a unique way.
5.1. Theoretical Implications
This study contributes to the literature in three ways. First, it extends previous research by investigating how public financial loans influence SMEs’ performance in the early stages. Although prior research has emphasized the consequences of public loans compared with commercial banks [43,44,45], little is known about the survival periods of SMEs and their implications. The current empirical study represents a first attempt to address the limitations of the public-loan supply and provides key insights into how long public finance loans help SMEs survive. Specifically, our study extends the literature [46,47] by offering a risk theory perspective on public financial institutions that explains how both guarantee ratios and credit ratings affect the survival periods of borrowers and these institutions’ financial soundness.
Second, this study extends knowledge of the optimal balance between public-loan borrowers and financial institutions by exploring approaches to managing risks that are beyond the institutions’ control. More specifically, the current study is the first to offer a desirable approach to determining how public financial institutions can manage borrowers’ survival periods, which are outside the institutions’ direct control [48], by showing that financial institutions can influence borrowers’ risks through the enhancement of guarantee ratios and strategic allocation of public loans for those with low credit ratings.
Finally, this study also provides new insights into the theoretical framework of MGIs on the sustainable stability of public financial loans [20]. As noted earlier, public guaranteed loans are directed to self-employers and SMEs that can be considered as a booster of firm growth. The impact of these public financial loans is similar with MGIs, whereas the degree of effectiveness of guaranteed loans relies on the criteria according to which these loans are designed and implemented [49]. In particular, a theoretical model—suggested by Minelli and Modica [50] who compare the respective merits of different policies in ameliorating credit constraints—supports our findings highlighting the ways in which public loan guarantees are valuable for the financial stability of banks against incurring losses from default.
5.2. Managerial Implications
The current study provides several important implications for financial institutions. The findings suggest that for public or commercial financial institutions to avoid financial risks, they should carefully systematize their credit rating evaluation method. Specifically, financial managers should be aware that poor evaluation systems can undermine financial soundness, resulting in the decline of survival periods. Thus, it is crucial for financial institutions to develop integrated evaluation systems to decrease financial risks within public loan evaluation processes.
Financial institutions should also limit the public-loan supply for those with low credit ratings by offering additional government-support options. Specifically, as it is difficult to limit guarantee ratios for small start-up businesses, our findings suggest that those with low credit ratings should be individually managed by enhancing acceptances and guarantees. For example, the limitation of the guarantee ratio may temporarily worsen business situations, whereas it might help SMEs manage financial flows and ensure long-term business survival.
This study also offers implications for credit rating agencies that design evaluation methods for individual people and firms. Their systems primarily focus on stable recovery from financial loans, whereas they neglect business survival and competitive advantages. Our findings suggest that SMEs should be evaluated using a variety of evaluating factors, such as big data. Of course, financial institutions must reinforce their financial soundness regarding public loans, but our findings imply that identifying and segmenting borrowing groups, including self-employers, might be valuable for the development of evaluation systems.
5.3. Academic Contribution
In the presence of public guaranteed small business loans, little is known about how public funds should be managed to increase survival periods, which are directly related to these institutions’ financial stability. This study explores the differences between self-employers and SMEs using survival analysis and investigated survival periods using key estimation criteria, such as guarantee ratios, credit ratings, and public financial institutions. The findings of our study show that 85% guarantee ratios and high credit ratings help increase survival periods. The findings also show that individual-based borrowers, such as self-employers, have a strong tendency to survive much longer than SMEs. Finally, our study extends the literature by offering a risk theory perspective on public financial institutions that explains how both guarantee ratios and credit ratings affect the survival periods of borrowers, resulting in these institutions’ financial soundness. Therefore, the results hold values for both banks and small businesses
5.4. Limitations and Future Research Directions
As with all studies, this study has a few limitations that may provide potential opportunities for further research. First, in our empirical study, we investigated survival periods. Specifically, we examined how guarantee ratios and credit ratings affect them. Although the results from the empirical data from public financial institutions were valuable, further field research is needed because commercial banks also deal with similar service products, suggesting that an integrated mechanism for small business loans including self-employers would contribute to stabilizing the lending system for relevant financial issues.
Another opportunity is related to the use of big data, which these institutions may apply for the diversification of the current evaluation systems. In addition to economic data, using nonmetric resources, such as patents, trading areas, business ideas, and other intangible resources, is crucial for managing public loans and guiding the growth of SMEs, resulting in generalization to financial evaluation contexts. Thus, the application of big data may be a promising avenue for future research.
Author Contributions
Conceptualization, K.J. and H.-Y.H.; methodology, H.-Y.H.; software, H.-Y.H.; validation, K.J. and H.-Y.H.; formal analysis, H.-Y.H.; investigation, K.J.; resources, H.-Y.H.; data curation, H.-Y.H.; writing—original draft preparation, H.-Y.H.; writing—review and editing, K.J.; visualization, K.J.; supervision, H.-Y.H.; project administration, H.-Y.H.; All authors have read and agreed to the published version of the manuscript.
Funding
This research received no external funding.
Institutional Review Board Statement
Not applicable.
Informed Consent Statement
Not applicable.
Conflicts of Interest
The authors declare no conflict of interest.
References
- Beck, T.; Demirguc-Kunt, A. Small and medium-size enterprises: Access to finance as a growth constraint. J. Bank. Financ. 2006, 30, 2931–2943. [Google Scholar] [CrossRef]
- Kang, M.S.; Son, H.Y.; Ha, H. Latent growth curve modeling for the relationship study between a new loan on security and a new loan on credit of credit union. J. Korea Serv. Manag. Soc. 2015, 16, 221–245. [Google Scholar]
- Perotti, R.; Strauch, R.; von Hagen, J. Sustainability of Public Finances; CEPR: London, UK, 1998. [Google Scholar]
- Lee, Y. A study on microcredit programs in the Republic of Korea: Focusing on small microcredit bank. J. Labor Studies 2015, 30, 81–138. [Google Scholar]
- Stiglitz, J.E.; Weiss, A. Credit rationing in markets with imperfect information. Am. Econ. Rev. 1981, 71, 393–410. [Google Scholar]
- Kang, M.S. Annual Report of Sunshine Loan Analysis; KOREG: Daejeon, Korea, 2014. [Google Scholar]
- Frame, W.S.; Srinivasan, A.; Woosley, L. The effect of credit scoring on small-business lending. J. Money Credit Bank. 2001, 33, 813–825. [Google Scholar] [CrossRef]
- Feldman, R.J. Small business loans, small banks and big change in technology called credit scoring. Region 1997, 11, 19–25. [Google Scholar]
- Jiménez, G.; Saurina, J. Collateral, type of lender and relationship banking as determinants of credit risk. J. Bank. Financ. 2004, 28, 2191–2212. [Google Scholar] [CrossRef] [Green Version]
- Esty, B.C. Organizational form and risk taking in the savings and loan industry. J. Financ. Econ. 1997, 44, 25–55. [Google Scholar] [CrossRef]
- Gorton, G.; Rosen, R. Corporate control, portfolio choice, and the decline of banking. J. Financ. 1995, 50, 1377–1420. [Google Scholar] [CrossRef]
- Saunders, A.; Strock, E.; Travlos, N. Ownership structure, deregulation, and bank risk taking. J. Financ. 1990, 45, 643–654. [Google Scholar] [CrossRef]
- Cowling, M.; Robson, P.; Stone, I.; Allinson, G. Loan guarantee schemes in the UK: The natural experiment of the enterprise finance guarantee and the 5 year rule. Appl. Econ. 2018, 50, 2210–2218. [Google Scholar] [CrossRef] [Green Version]
- Falagiarda, M.; Prapiestis, A.; Rancoita, E. Public loan guarantees and bank lending in the COVID-19 period. Econ. Bull. Boxes 2020, 6, 1–9. [Google Scholar]
- Dvoulety, O. Effects of soft loans and credit guarantees on performance of supported firms: Evidence from the Czech public programme START. Sustainability 2019, 9, 2293. [Google Scholar] [CrossRef] [Green Version]
- Kraan, D. Programme budgeting in OECD countries. OECD J. Budg. 2007, 7, 7–47. [Google Scholar] [CrossRef] [Green Version]
- Beck, T.; Levine, R.; Levkov, A. Big bad banks? The winners and losers from bank deregulation in the United States. J. Financ. 2010, 45, 1637–1667. [Google Scholar] [CrossRef] [Green Version]
- Lee, Y. Government guaranteed small nosiness loans and regional growth. J. Bus. Ventur. 2018, 33, 70–83. [Google Scholar] [CrossRef]
- Lee, Y. Entrepreneurship, small businesses, and economic growth in cities. J. Econ. Geogr. 2017, 17, 311–343. [Google Scholar] [CrossRef] [Green Version]
- Caselli, S.; Corbetta, G.; Cucinelli, D.; Rossolini, M. A survival analysis of public guaranteed loans: Does financial intermediary matter? J. Financ. Stab. 2021, 54. In press. [Google Scholar] [CrossRef]
- Bester, H. Screening vs. rationing in credit markets with imperfect information. Am. Econ. Rev. 1985, 75, 850–855. [Google Scholar]
- Ughetto, E.; Scellato, G.; Cowling, M. Cost of capital and public loan guarantees to small firms. Small Bus. Econ. 2017, 49, 319–337. [Google Scholar] [CrossRef]
- Kerr, W.; Nanda, R. Financing constraints and entrepreneurship. In Handbook of Research on Innovation and Entrepreneurship; Sudretsch, D., Falck, F., Heblich, S., Eds.; Edward Elgar Publishing: Cheltenham, UK, 2011; pp. 88–103. [Google Scholar]
- Columba, F.; Gambacorta, L.; Mistrulli, P.E. Mutual guarantee institutions and small business finance. J. Financ. Stab. 2010, 6, 45–54. [Google Scholar] [CrossRef] [Green Version]
- de la Fuente-Cabrero, C.; de Castro-Pardo, M.; Santero-Sabchez, R.; Laguna-Sanchez, P. The role of mutual guarantee institutions in the financial sustainability of new family-owned small business. Sustainability 2019, 11, 6409. [Google Scholar] [CrossRef] [Green Version]
- Bartoli, F.; Ferri, G.; Murro, P.; Rotondi, Z. Bank-firm relations and the role of Mutual Guarantee Institutions at the peak of the crisis. J. Financ. Stab 2013, 9, 90–104. [Google Scholar] [CrossRef]
- Gai, L.; Ielasi, F.; Rossolini, M. SMEs, public credit guarantees and mutual guarantee institutions. J. Small Bus. Enterp. Dev. 2016, 23, 1208–1228. [Google Scholar] [CrossRef]
- Llisteri, J. Credit guarantee schemes: Preliminary conclusions. Financier 1997, 4, 5–11. [Google Scholar]
- Beck, T.; Deminguc-Kent, A.; Laeven, L.; Maksimovic, V. The determinants of financing obstacles. J. Int. Money Financ. 2006, 25, 932–952. [Google Scholar] [CrossRef] [Green Version]
- Levitsky, J. Credit guarantee schemes for SMEs: An international review. Small Enterp. Dev. 1997, 8, 4–17. [Google Scholar] [CrossRef]
- González, P.; Sánchez, H.M.; Sobrino, R. The European framework of guarantee systems/schemes: Main characteristics and concepts. J. Small Medium Enterp. Dev. 2006, 1, 127–165. [Google Scholar]
- González, P.; Sánchez, H.M.; Sobrino, R. The American framework of guarantee systems/schemes: Main concepts and characteristics. J. Small Medium Enterp. Dev. 2007, 2, 39–68. [Google Scholar]
- Beck, T.; Klapper, L.F.; Mendoza, J.C. The Typology of Partial Credit Guarantee Funds around the World; World Bank: Washington, DC, USA, 2008. [Google Scholar]
- Audertsch, D.B.; Mahmood, T. New firm survival: New results using a hazard function. Rev. Econ. Stat. 1995, 77, 97–103. [Google Scholar] [CrossRef]
- Honjo, Y. Business failure of new firms: An empirical analysis using a multiplicative hazard model. Int. J. Ind. Organ. 2000, 18, 557–587. [Google Scholar] [CrossRef]
- Lee, Y. A study on the corporate insolvency prediction model of technology guaranteed firms using survival analysis. Mark. Econ. Stud. 2010, 39, 1–24. [Google Scholar]
- Pae, J.; Kang, M. Sunshine Loan Operation and Performance; KOREG: Daejeon, Korea, 2015. [Google Scholar]
- Oh, Y. Differentiating the guaranteed rate: A way to improve the Sunshine loan program. KDI Focus 2015, 40, 1–11. [Google Scholar]
- Efron, B. Logistic regression, survival analysis, and the Kaplan-Meier curve. J. Am. Stat. Assoc. 1988, 83, 414–425. [Google Scholar] [CrossRef]
- Lariviére, B.; Poel, D. Investigating the role of product features in preventing customer churn, by using survival analysis and choice modeling: The case of financial services. Expert Syst. Appl. 2004, 27, 277–285. [Google Scholar] [CrossRef]
- Gokovali, U.; Bahar, O.; Lozak, M. Determinants of length of stay: A practical use of survival analysis. Tour. Manag. 2007, 28, 736–746. [Google Scholar] [CrossRef]
- Giroux, G.A.; Wiggins, C.E. An events approach to corporate bankruptcy. J. Bank Res. 1984, 15, 179–187. [Google Scholar]
- Kim, H. The profitability improving effects of Korean SME policy lending programs. Korean Dev. Stud. 2005, 27, 46–87. [Google Scholar]
- Kim, S.; Min, K.; Oh, S. A study on the governmental policy’ loan of small business. J. Korean Acad. -Ind. Coop. Soc. 2012, 13, 1594–1602. [Google Scholar]
- Lee, K.; Woo, S.; Binh, K. An empirical study on SME’s financing gap and its implication on the reallocation of government-sponsored financing resources. Korean Econ. Dev. Stud. 2015, 21, 91–118. [Google Scholar]
- Kang, J.W.; Heshmati, A. Effect of credit guarantee policy on survival and performance of SMEs in Republic of Korea. Small Bus. Econ. 2008, 31, 445–462. [Google Scholar] [CrossRef]
- Oh, I.; Lee, J.; Heshmati, A. Evaluation of credit guarantee policy using propensity score matching. Small Bus. Econ. 2009, 33, 335–351. [Google Scholar] [CrossRef]
- Yun, S.; Kim, C. A study on the relationship between business cycle and credit guarantee for micro-business. Korean Ind. Bus. Stud. 2014, 29, 209–229. [Google Scholar]
- Beck, T.; Demirguc-Kunt, S.; Maksimovic, V. Financing patterns around the world: Are small firms different? J. Financ. Econ. 2008, 89, 467–487. [Google Scholar] [CrossRef] [Green Version]
- Minelli, E.; Modica, S. Credit market failures and policy. J. Public Econ. Theory 2009, 11, 363–382. [Google Scholar] [CrossRef]
Figure 1.
Survival and hazard functions of self-employers’ guarantee ratio (Unit: Month).

Figure 2.
Survival and hazard functions of self-employers’ credit ratings (Unit: Month).


Figure 3.
Survival and hazard functions of financial banking institutions (Unit: Month).

Figure 4.
Survival and hazard functions of financial institutions: 85% of guarantee ratio (Unit: Month).
Figure 4.
Survival and hazard functions of financial institutions: 85% of guarantee ratio (Unit: Month).


Figure 5.
Survival and hazard functions of financial institutions: 95% of guarantee ratio (Unit: Month).
Figure 5.
Survival and hazard functions of financial institutions: 95% of guarantee ratio (Unit: Month).

Figure 6.
Survival and hazard functions of businesses’ guarantee ratio (Unit: Month).

Figure 7.
Survival and hazard functions of SMEs’ credit ratings (Unit: Month).

Figure 8.
Survival and hazard functions for SMEs: Financial banking institutions (Unit: Month).

Figure 9.
Survival and hazard functions for SMEs: 85% of guarantee ratio vs. financial institutions (Unit: Month).
Figure 9.
Survival and hazard functions for SMEs: 85% of guarantee ratio vs. financial institutions (Unit: Month).


Figure 10.
Survival and hazard functions for SMEs: 95% of guarantee ratio vs. financial institutions (Unit: Month).
Figure 10.
Survival and hazard functions for SMEs: 95% of guarantee ratio vs. financial institutions (Unit: Month).


Table 1.
Basic statistics for two borrower groups (Unit: case, %).
| Self-Employers | SMEs | ||||||
|---|---|---|---|---|---|---|---|
| Survive | Default | Total | Survive | Default | Total | ||
| Guarantee ratio | 85% | 107,910 | 32,884 | 140,794 | 64,117 | 29,343 | 93,460 |
| 95% | 200,744 | 22,739 | 223,483 | 37,880 | 3937 | 41,817 | |
| Bank | NFCF | 1013 | 320 | 1333 | 447 | 176 | 623 |
| SB | 155,722 | 24,085 | 179,857 | 10,541 | 2532 | 13,073 | |
| KFCCC | 43,887 | 9478 | 53,365 | 49,072 | 16,989 | 66,061 | |
| NFFC | 3210 | 572 | 3782 | 984 | 260 | 1244 | |
| NCUFK | 48,043 | 8828 | 56,871 | 24,321 | 6987 | 31,308 | |
| Local NH | 56,729 | 12,340 | 69,069 | 16,632 | 6336 | 22,968 | |
| Credit rating | No credit rating | 72 | 13 | 85 | 11 | 2 | 13 |
| AAA | 1526 | 43 | 1569 | 818 | 46 | 864 | |
| AA | 4606 | 178 | 4784 | 2178 | 142 | 2320 | |
| A | 7204 | 399 | 7603 | 2921 | 294 | 3215 | |
| BBB | 18,803 | 1534 | 20,337 | 6916 | 837 | 7753 | |
| BB | 46,438 | 5396 | 51,834 | 13,789 | 2627 | 16,416 | |
| B | 99,919 | 15,894 | 115,813 | 28,970 | 8192 | 37,162 | |
| CCC | 100,313 | 21,946 | 122,259 | 31,139 | 11,629 | 42,768 | |
| CC | 27,192 | 8746 | 35,938 | 12,666 | 7449 | 20,115 | |
| C | 2235 | 1288 | 3523 | 2074 | 1756 | 3830 | |
| D | 346 | 1288 | 3523 | 2074 | 1756 | 3830 | |
| Total | 308,654 | 55,623 | 364,277 | 101,997 | 33,280 | 135,277 | |
Table 2.
T-test results: self-employers vs. SMEs.
| Mean (SD) | t-Test | |||
|---|---|---|---|---|
| Self-Employers | SMEs | t-Value | p-Value | |
| Guarantee ratio | 91.13 (4.86) | 88.09 (4.66) | 203.80 | 0.000 |
| Credit rating | 6.18 (1.30) | 6.31 (1.47) | −30.50 | 0.000 |
Table 3.
Estimates of survival period (Unit: Month).
| Guarantee Ratio | Estimate | S.E | 95% Confidence Interval | |
|---|---|---|---|---|
| Lower Bound | Upper Bound | |||
| 85% | 20.033 | 0.083 | 19.870 | 20.197 |
| 95% | 7.100 | 0.030 | 7.041 | 7.159 |
| Total | 12.867 | 0.063 | 12.742 | 12.991 |
Log Rank (Mantel Cox) = 36,684.314, df = 1, p < 0.000, Breslow (Generalized Wilcoxon) = 30,046.339, df = 1, p < 0.001, Tarone-Ware = 33,358.439, df = 1, p < 0.001.
Table 4.
Estimates of survival periods: credit ratings (Unit: Month).
| Guarantee Ratio | Estimate | S.E | 95% Confidence Interval | |
|---|---|---|---|---|
| Lower Bound | Upper Bound | |||
| Non-credit rating | 25.033 | 7.255 | 10.813 | 39.254 |
| AAA (1) | 26.567 | 2.993 | 20.700 | 32.434 |
| AA (2) | 19.367 | 1.296 | 16.826 | 21.907 |
| A (3) | 20.333 | 0.944 | 18.483 | 22.184 |
| BBB (4) | 19.433 | 0.395 | 18.658 | 20.208 |
| BB (5) | 18.333 | 0.254 | 17.836 | 18.830 |
| B (6) | 12.200 | 0.115 | 11.975 | 12.425 |
| CCC (7) | 11.200 | 0.084 | 11.035 | 11.365 |
| CC (8) | 12.600 | 0.153 | 12.300 | 12.900 |
| C (9) | 18.400 | 0.487 | 17.446 | 19.354 |
| D (10) | 18.333 | 0.277 | 15.831 | 20.836 |
| Total | 12.867 | 0.063 | 12.742 | 12.991 |
Log Rank (Mantel Cox) = 1170.650, df = 10, p < 0.000, Breslow (Generalized Wilcoxon) = 1560.397, df = 10, p < 0.001, Tarone-Ware = 1506.185, df = 10, p < 0.001.
Table 5.
Estimates of survival periods: banks (Unit: Month).
| Bank | Estimate | S.E | 95% Confidence Interval | |
|---|---|---|---|---|
| Lower Bound | Upper Bound | |||
| NFCF | 16.433 | 0.960 | 14.551 | 18.316 |
| SB | 7.900 | 0.038 | 7.825 | 7.975 |
| KFCCC | 19.300 | 0.189 | 18.930 | 19.670 |
| NFFC | 19.033 | 0.629 | 17.800 | 20.266 |
| NCUFK | 16.533 | 0.163 | 16.213 | 16.853 |
| Local NH | 20.067 | 0.147 | 19.779 | 20.991 |
| Total | 12.867 | 0.063 | 12.742 | 12.991 |
Log Rank (Mantel Cox) = 15,323.519, df = 5, p < 0.000, Breslow (Generalized Wilcoxon) = 1762.493, df = 5, p < 0.001, Tarone-Ware = 16,432.371, df = 5, p < 0.001.
Table 6.
Estimates of survival periods: guarantee ratios (85~95%) vs. banks (Unit: Month).
| Bank (85% vs. 95%) | Estimate | S.E | 95% Confidence Interval | |
|---|---|---|---|---|
| Lower Bound | Upper Bound | |||
| NFCF (85%) | 18.000 | 0.648 | 16.729 | 19.271 |
| SB (85%) | 15.767 | 0.185 | 15.405 | 16.129 |
| KFCCC (85%) | 22.367 | 0.208 | 21.958 | 22.775 |
| NFFC (85%) | 20.467 | 0.559 | 19.371 | 21.562 |
| NCUFK (85%) | 19.400 | 0.180 | 19.047 | 19.753 |
| Local NH (85%) | 21.200 | 0.153 | 20.901 | 21.499 |
| Total (85%) | 20.033 | 0.083 | 19.870 | 20.197 |
| NFCF (95%) | 9.167 | 0.807 | 7.585 | 10.748 |
| SB (95%) | 6.867 | 0.032 | 6.804 | 6.930 |
| KFCCC (95%) | 8.833 | 0.142 | 8.556 | 9.111 |
| NFFC (95%) | 5.467 | 0.210 | 5.055 | 5.879 |
| NCUFK (95%) | 8.033 | 0.125 | 7.788 | 8.279 |
| Local NH (95%) | 8.433 | 0.193 | 8.055 | 8.812 |
| Total (95%) | 7.832 | 0.030 | 7.041 | 7.159 |
| Total | 12.867 | 0.063 | 12.742 | 12.991 |
Log Rank (Mantel Cox) = 1690.981, df = 5, p < 0.000, Breslow (Generalized Wilcoxon) = 1583.079, df = 5, p < 0.001, Tarone-Ware = 1750.735, df = 5, p < 0.001.
Table 7.
Estimates of survival periods (Unit: Month).
| Guarantee Ratio | Estimate | S.E | 95% Confidence Interval | |
|---|---|---|---|---|
| Lower Bound | Upper Bound | |||
| 85% | 18.200 | 0.087 | 18.029 | 18.371 |
| 95% | 6.100 | 0.105 | 5.895 | 6.305 |
| Total | 12.867 | 0.080 | 16.709 | 17.024 |
Log Rank (Mantel Cox) = 9458.827, df = 1, p < 0.000, Breslow (Generalized Wilcoxon) = 8667.654, df = 1, p < 0.001, Tarone-Ware = 9073.151, df = p < 0.001. Note: Estimation is limited to the largest survival time if it is censored.
Table 8.
Estimates of survival periods: credit ratings for SMEs (Unit: Month).
| Guarantee Ratio | Estimate | S.E | 95% Confidence Interval | |
|---|---|---|---|---|
| Lower Bound | Upper Bound | |||
| Non-credit rating | 2.933 | - | - | - |
| AAA (1) | 24.400 | 2.750 | 29.011 | 29.789 |
| AA (2) | 20.333 | 1.543 | 17.309 | 23.358 |
| A (3) | 20.300 | 1.053 | 18.236 | 22.364 |
| BBB (4) | 19.367 | 0.484 | 18.417 | 20.316 |
| BB (5) | 19.200 | 0.312 | 18.589 | 19.811 |
| B (6) | 18.133 | 0.190 | 17.761 | 18.505 |
| CCC (7) | 16.267 | 0.144 | 15.984 | 16.550 |
| CC (8) | 15.233 | 0.159 | 14.921 | 15.546 |
| C (9) | 15.167 | 0.295 | 14.589 | 15.745 |
| D (10) | 18.267 | 0.751 | 16.794 | 19.739 |
| Total | 16.867 | 0.080 | 16.709 | 17.024 |
Log Rank (Mantel Cox) = 288.940, df = 10, p < 0.000, Breslow (Generalized Wilcoxon) = 464.801, df = 10, p < 0.001, Tarone-Ware = 402.543, df = 10, p < 0.001.
Table 9.
Estimates of survival periods for SMEs: banks (Unit: Month).
| Bank | Estimate | S.E | 95% Confidence Interval | |
|---|---|---|---|---|
| Lower Bound | Upper Bound | |||
| NFCF | 15.300 | 0.670 | 13.987 | 16.613 |
| SB | 13.267 | 0.306 | 12.667 | 13.866 |
| KFCCC | 17.267 | 0.136 | 17.000 | 17.534 |
| NFFC | 18.267 | 0.968 | 16.370 | 20.164 |
| NCUFK | 15.267 | 0.152 | 14.969 | 15.565 |
| Local NH | 18.767 | 0.170 | 18.434 | 19.099 |
| Total | 16.867 | 0.080 | 16.709 | 17.024 |
Log Rank (Mantel Cox) = 356.212, df = 5, p < 0.000, Breslow (Generalized Wilcoxon) = 472.616, df = 5, p < 0.001, Tarone-Ware = 431.382, df = 5, p < 0.001.
Table 10.
Estimates of survival periods for SMEs: Guarantee ratios (85~95%) vs. banks (Unit: Month).
Table 10.
Estimates of survival periods for SMEs: Guarantee ratios (85~95%) vs. banks (Unit: Month).
| Bank (85% vs. 95%) | Estimate | S.E | 95% Confidence Interval | |
|---|---|---|---|---|
| Lower Bound | Upper Bound | |||
| NFCF (85%) | 16.267 | 1.012 | 14.283 | 18.250 |
| SB (85%) | 16.333 | 0.320 | 15.706 | 16.961 |
| KFCCC (85%) | 18.300 | 0.138 | 18.029 | 18.571 |
| NFFC (85%) | 18.333 | 0.861 | 16.645 | 20.022 |
| NCUFK (85%) | 16.300 | 0.158 | 15.991 | 16.609 |
| Local NH (85%) | 19.300 | 0.219 | 18.871 | 19.729 |
| Total (85%) | 18.200 | 0.187 | 18.029 | 18.371 |
| NFCF (95%) | 5.867 | 1.929 | 2.086 | 9.647 |
| SB (95%) | 5.067 | 0.124 | 4.823 | 5.311 |
| KFCCC (95%) | 6.400 | 0.114 | 6.176 | 6.624 |
| NFFC (95%) | 5.133 | 0.146 | 4.847 | 5.420 |
| NCUFK (95%) | 6.067 | 0.114 | 5.844 | 6.290 |
| Local NH (95%) | 6.400 | 0.371 | 5.672 | 7.128 |
| Total (95%) | 6.100 | 0.105 | 5.895 | 6.305 |
| Total | 16.867 | 0.080 | 16.709 | 17.024 |
Log Rank (Mantel Cox) = 248.426, df = 5, p < 0.000, Breslow (Generalized Wilcoxon) = 200.597, df = 5, p < 0.001, Tarone-Ware = 213.810, df = 5, p < 0.001.
Table 11.
Comparison of survival periods: Self-employers vs. SMEs (Unit: Month).
| Category | Self-Employers | SMEs | |
|---|---|---|---|
| Guarantee ratio | 85% | 20.033 | 18.200 |
| 95% | 7.100 | 6.100 | |
| Credit rating | Non-credit rating | 25.033 | 2.933 |
| AAA (1) | 26.567 | 24.400 | |
| AA (2) | 19.367 | 20.333 | |
| A (3) | 20.333 | 20.300 | |
| BBB (4) | 19.433 | 19.367 | |
| BB (5) | 18.333 | 19.200 | |
| B (6) | 12.200 | 18.133 | |
| CCC (7) | 11.200 | 15.233 | |
| CC (8) | 12.600 | 15.233 | |
| C (9) | 18.400 | 16.167 | |
| D (10) | 18.333 | 18.267 | |
| Bank | NFCF | 16.433 | 15.300 |
| SB | 7.900 | 13.267 | |
| KFCCC | 19.300 | 17.267 | |
| NFFC | 19.033 | 18.267 | |
| NCUFK | 16.533 | 15.267 | |
| Local NH | 20.067 | 18.767 | |
| Total | 12.867 | 16.867 |
Table 12.
Comparison of survival periods for guarantee ratio and bank: Self-employers vs. SMEs (Unit: Month).
Table 12.
Comparison of survival periods for guarantee ratio and bank: Self-employers vs. SMEs (Unit: Month).
| Category | Self-Employers | SMEs | |
|---|---|---|---|
| Guarantee ratio | NFCF | 18.000 | 16.267 |
| (85%) | SB | 15.767 | 16.333 |
| KFCCC | 22.367 | 18.300 | |
| NFFC | 20.467 | 18.333 | |
| NCUFK | 19.400 | 16.300 | |
| Local NH | 21.200 | 19.300 | |
| Guarantee ratio | NFCF | 9.167 | 5.867 |
| (95%) | SB | 6.867 | 5.067 |
| KFCCC | 8.833 | 6.400 | |
| NFFC | 5.467 | 5.133 |
Publisher’s Note: MDPI stays neutral with regard to jurisdictional claims in published maps and institutional affiliations. |
© 2021 by the authors. Licensee MDPI, Basel, Switzerland. This article is an open access article distributed under the terms and conditions of the Creative Commons Attribution (CC BY) license (https://creativecommons.org/licenses/by/4.0/).
Share and Cite
MDPI and ACS Style
Ji, K.; Ha, H.-Y. Empirical Evidence of Risks of Public-Loan Finance: Comparison between Self-Employers and SMEs. Sustainability 2021, 13, 6426. https://doi.org/10.3390/su13116426
AMA Style
Ji K, Ha H-Y. Empirical Evidence of Risks of Public-Loan Finance: Comparison between Self-Employers and SMEs. Sustainability. 2021; 13(11):6426. https://doi.org/10.3390/su13116426
Chicago/Turabian StyleJi, Kwangchul, and Hong-Youl Ha. 2021. "Empirical Evidence of Risks of Public-Loan Finance: Comparison between Self-Employers and SMEs" Sustainability 13, no. 11: 6426. https://doi.org/10.3390/su13116426
Note that from the first issue of 2016, this journal uses article numbers instead of page numbers. See further details here.