
Financial Inclusion’s Role in Economic Growth and Human Capital in South Asia: An Econometric Approach


1
School of Economics, Wuhan University of Technology, Wuhan 430070, China
2
Department of Economics and Statistics, Sabaragamuwa University of Sri Lanka, P.O. Box 02, Belihuloya 70140, Sri Lanka
*
Author to whom correspondence should be addressed.
Sustainability 2021, 13(8), 4303; https://doi.org/10.3390/su13084303
Submission received: 22 February 2021
/
Revised: 8 April 2021
/
Accepted: 8 April 2021
/
Published: 13 April 2021
Abstract
:Many of the 2030 sustainable development goals have targeted the strengthening of financial inclusion, which is currently a key policy priority on the agendas of most governments in developing nations. The process of facilitating banking and financial services for individuals is called financial inclusion, which supports growth and the broader development goals of an economy. Although economic growth and human capital development indices have been analyzed using different proxy variables, insufficient attention has been paid to constructing a composite index for measuring this to achieve greater sustainability in terms of the economy, communities, and the environment. This study sought to address this gap using secondary data from eight countries in South Asia from 2004 to 2018. A financial inclusion index was developed through principal component analysis using an econometric approach of panel data with vector error correction models and a Granger causality test. As per the results of the study, financial inclusion has a long-run impact on human capital development in South Asian countries, whereas it has a short-run positive impact on economic growth. Domestic credits to the private sector also impact the short-run growth and human capital development in the economy. This ensures the confidence of vulnerable communities in their economy, as well as information management, and allows for quality enhancements of transactions with fewer environmental impacts. Government intervention to improve access to financial services, including ATMs and commercial banking, is one policy allowing digital finance to accelerate the achievement of sustainable development goals in South Asian countries.
1. Introduction
The historical roots of financial inclusion (FI) go back to the early 2000s [1], and currently, it is popular in all countries regardless of their achievements in terms of the development of the economy. Affordability and accountability are provided by financial inclusion for accessing both goods and services in nonfinancial sectors to fulfill the financial requirements of individuals through sustainable practices. Especially vulnerable people, like those who are usually locked out of the conventional banking system due to their low income, are also eligible for basic services in the formalized financial structure [2]. Loans, insurance, money transfers, pensions, and savings are the finance products and services that are marked by different financial institutions, including finance institutions, cooperatives, insurance brokers, and commercial banks, with the aim of fighting poverty. FI is a major requirement for economies and is popular among scholars, politicians, policymakers, and financial stakeholders, either formal or informal, as well as with the general public. However, the G20 and World Bank have taken steps toward increasing FI in developing countries with the aim of poverty alleviation and greater economic inclusion [3].
Today, every economy expects to reach sustainable development through competition within the global economy. The United Nations have set 17 sustainable development goals (SDGs) for 2030 under the five broad aspects of people, planet, prosperity, peace, and partnership. The main focus of prosperity is to assure a prosperous living status for all human beings with economic, social, and technological advancements that are favorable to the environment. This can improve access to enhanced finance strategies that are environmentally sustainable [4]. Investments at regional and country levels are mainly considered under the SDGs regarding FI [5,6]. This is linked, either directly or indirectly, with several other SDGs, including eradicating poverty, ending hunger, achieving food security, promoting sustainable agriculture, profiting health and well-being, achieving gender equality and economic empowerment of women, etc. Promoting economic growth and jobs through enhancing industry, innovation, and infrastructure [7] in a sustainable manner is also a broad focus.
There is a need for a FI system improvement to promote sustainable development [8]. Several scholars have shown that the direct means of eradicating poverty is through developing the financial sector [9], while some have argued that it causes indirect effects [10]. Most prior studies have confirmed the need for FI for sustainability with different implementation strategies. Sustainability includes the three interconnected ‘pillars’ of the economy, communities, and the environment.
FI is a global challenge for developing economies, but also a common topic for developed economies. FI increases the ability to acquire economic resources and ensure the livelihood of all people in different economic systems. Increasing the accessibility of financial infrastructure increases the economic power of human beings. There are millions of people who are omitted from the formal financial (FF) sector as a result of inadequate earnings and facilities in developing regions. Financial exclusion leads to reduced funds available for investment, which leads to low capital accumulation. Thus, FI helps to overcome this issue via greater economic expansion. Over 70% of the world’s population has no access to banking services for their fundamental financial needs [11,12], and roughly 75% of adults earn less than 2 USD per day, which is the international poverty line, and do not have a bank account [13]. Furthermore, in developing countries, 50% of the population does not have a bank account. FI is an attempt to convert the unbanked population into a banked population by enhancing access to FF services including savings, payments, credit, and insurance. FI and growth go hand in hand [14] through job creation, reducing vulnerability, and increasing investment. This further enhances the accessibility and affordability of financial goods and services to work toward the sustainable goals of economies [15].
The community-based approach to sustainable development was supported by FI through enhancing social inclusion [16]. Using financial services, including maintenance of accounts and credits in a formal banking system, is positively affected by education, age, and income [17]. FI tends to raise human development indicators, leading to enhanced social welfare [18,19,20,21,22]. Thus, it is more important for poor communities [23] and it reduces poverty rates and inequality [24], which in turn ensures universal human rights and the meeting of fundamental human needs.
Digital finance transformation involves the building of a digital identity, developing a financial infrastructure, and designing digital financial markets that will create sustainable, balanced development [25]. Most bank customers have welcomed the transition from paper-intensive to digital banking [26]. The digitalization of financial activities is useful for the bank as well as for bank customers and suppliers, enhancing more sustainable double (i.e., win-win) or triple bottom line (i.e., win-win-win) business models [27]. Most banks save money by adopting digital options instead of paper statements, which can reduce greenhouse gas emissions [26]. The digitalization of banks reduces paper use and office space, as well as the consumption of materials, energy, and other resources, ensuring environmental sustainability.
The sustainability of the economy, community, and environment affected by FI differs in developed and developing regions. Although most developing countries entered into the Maya declaration, the first global commitment to promote FI in 2011, South Asia has been progressing slowly in all aspects of FI [28]. The South Asia region includes eight countries: Afghanistan, Bangladesh, Bhutan, India, the Maldives, Nepal, Pakistan, and Sri Lanka. India (nominal GDP 2019 = $2.94 trillion) is the largest and fastest-growing economy in South Asia, and covers more than 80% of the region’s total GDP, followed by Bangladesh (nominal GDP 2019 = $317.5 billion) and Pakistan (nominal GDP 2019 = $284.2 billion) [29]. Even though South Asia is the most populous region geographically and the outlook remains moderately favorable, economic trends are highly divergent between countries [30].
A huge disparity was recorded within the regional development status, including FI, among the South Asian countries (Table 1). Generally, GNI per capita reflects the economic status of a country, which is calculated by considering the U.S. dollar value of a country’s final income (before income tax), divided by its population in a year. The GNI per capita was highest in Sri Lanka and lowest in Nepal in 2019. The human capital index (HDI) is the measurement of a country’s overall achievement in terms of its social and economic development, which covers health, education, and economic well-being. Despite the improvement in human development in South Asia, this part of the world lags behind other countries and regions. Seventy percent of the poor population in the world is from 10 countries including three from South Asia: Bangladesh, India, and Pakistan. Formal financial (FF) services are around eightfold lower [31] compared to high-income countries, while 60% of the adults in South Asian countries are not enrolled in FF services. However, the prevalence of FI in the target region is quite uncertain in comparison to other regions. The use of FF services from the bank is relatively poor in this region [32]. Hence, the main objective of this study is to examine the effect of FI on development indicators in South Asian economies.
2. Literature Review
The literature on FI is very rich and its application is common to all regions regardless of their economic and development achievements. The importance of financial institutions in the resource allocation process was initially discussed by Schumpeter [33]. In the 1970s, FI was accessed simply by using financial services. However, it is broader in current studies, including savings, deposits, access to facilities, quality of service, and the financial advantages of digital technology [2]. Broadly, the definition pertaining to FI is not universal, though every scholar attempted to explain it within a limited scope that covers all the theoretical parts.
Financial inclusion is a global phenomenon that is emphasized by the World Bank, G20, and Central Banks in each country, as well as the Asian Development Bank. FI encourages communities in poverty to enter into FF services in reasonable and sustainable ways [34,35] to reduce poverty in emerging economies, including developing regions [36]. The opposite of FI is financial exclusion (FE), which describes accessibility issues for different kinds of financial services: banking, saving, credits, and insurance [37,38]. Financial exclusion challenges consumers by denying them access to certain appropriate conventional financial services at reasonable, secure, and cheap rates from the banking sector [39]. It is the result of several causes such as low income; unfavorable interest rates; a lack of awareness and literacy; self-exclusion; and demographic and geographical factors such as the remoteness, low density, and dispersion of villages. Moreover, FE occurs especially with poverty and social exclusion [40]. Thus, financial access is a challenge for developing, marginal and vulnerable communities that have lower levels of education and facilities [41].
Previous studies have discussed different measurements for FI with several proxy variables. The FI index has been measured in a multidimensional approach including the three components of banking: penetration, availability, and usage [42]. While applying the same approach, a cross-country comparison has been made to identify the association between the levels of human development and FI [43]. This study assigns equivalent weight to all selected components using a factor analysis; this was mentioned as a limitation in the methodology [9,44]. In this paper, the common normalization method has been applied as the min-max approach. The absence of a statistically proven method for standardization was the limitation of this method. Principal component analysis (PCA) with the standardized normalization was applied in this study for constructing an FI index to overcome these issues.
Growth theories in economics are mainly divided into two types, exogenous and endogenous growth models. Exogenous growth models explain exogenous technological enhancement as a key factor associated with economic growth, in addition to capital formation and labor productivity. The endogenous growth model highlights the importance of enhancing innovations, research, and development to create technology as an endogenous factor, in addition to the contribution of knowledge and human capital enhancements to economic growth [45]. Although many studies have created economic growth models of capital formation and human capital accumulation, technological development has been studied at a relatively lower rate. Technological enhancement contributes to both visible and invisible production sectors. New technological enhancements in financial technology with digitalization, including automated teller machine (ATM) usage, online banking, and cashless payments, have been incorporated as determinants of economic growth in several studies [46,47].
The link between FI and growth is very rich according to the literature [48,49], and that relationship is mostly positive [50]. Econometric analyses can be conducted to see the functional relationship of FI with economic growth. Such econometric analyses include vector autoregressive (VAR) models and Granger causality analysis [51]. VAR defines this functional relationship between FI as an input and economic growth as an output in an economic system. Granger causality analysis is a test of statistical hypotheses in which to forecast the direction of a time series. An empirical study of the Indian economy using these two analytical methods showed a positive association between FI and economic growth, specifically related to three components of FI (penetration, availability, and usage). Prior literature focused on the relationship between income inequalities, while mainly focusing on cross-country studies.
Many past studies have suggested an inverse association of FI with economic growth. Better household access to finance is significantly associated with lower inequality, whereas there is less evidence that access is causally related to lower poverty [52]. Empirical studies have shown that FI increases financial stability [53] and decreases income inequality irrespective of the size of the financial system [54]. Financial inclusiveness for 63 developed and developing countries (2014–2017) was positively related to economic growth [55]. Another empirical study using cross-sectional data for 40 countries organized under the Organization for Economic Co-operation and Development (OECD) between 2004 and 2011 suggested that FI helps reduce income inequality irrespective of income level, and FI is more effective for countries with weak financial systems [56]. Furthermore, FI dominates in countries with weaker financial systems. Thus, our study hypothesizes:
Hypothesis 1a (H1a).
Financial Inclusion increases economic growth in South Asia.
The factors associated with human capital development were analyzed by a few researchers [57,58,59]. Information and communication technology (ICT) was identified as a key determinant of human capital development since it empowers human beings with technological knowledge, skill acquisition, and facilitating education [60]. Human capital and available financial products were used to develop a new variable on new financial innovators and establish the long-run impact on economic growth, supporting the argument of the endogenous growth model [61]. Development in the financial sector was also identified as a key factor associated with human capital development by providing more credits on education and skill enhancement [62]. Thus, FI, which combines ICT and the financial sector, is also intrinsically interconnected with human development. The nexus between FI and human capital investment has been firmly established in the literature [14,63]. The two-way causality between these two variables is also discussed [64]. Prior studies have found FI and human development to be positively correlated [65,66], including one study of frontier countries from 2005 to 2014, where low human development was associated with low financial inclusion [67]. Thus, our study also hypothesizes:
Hypothesis 1b (H1b).
FI index increases the human development index in South Asia.
South Asia has a relatively large number of workers in the world context and the World Bank highlighted that development of the South Asian region will contribute to reducing global poverty by accelerating economic growth. Although previous studies established the positive impact of FI on economic growth for individual countries in South Asia, leading to reduced poverty and income inequality, few studies have been conducted on the same relationships for the whole region. Furthermore, we have considered the impact of financial inclusion on both social and human development indicators, while most other studies focused on only one of those two aspects. We have focused on cross-country comparisons of FI for developing countries since FI has been shown to be critical for adequate development.
3. Materials and Methods
3.1. Data and Variables
Panel data for all countries in South Asia from 2004 to 2018 were used for this analysis. Two dependent variables were considered. Economic growth was measured using gross domestic product (GDP) per capita purchasing power parity (PPP, in current USD), while human capital development was measured through the human development index (HDI). FI was used as the independent variable (Table 2). World development indicators (WDIs), a financial access survey (FAS), and the human development report (HDR) were the three main secondary data sources used.
The human development index has been measured using three sub-indices: life expectancy related to health, expected years of schooling and mean years of schooling as education attainment, and GNI per capita as the standard of living, which is widely used to measure human capital enhancement [59,71,72]. Many researchers have also used GDP per capita as a proxy for economic growth [18,51,56,73]. This study also used the GDP per capita based on purchasing power parity (PPP). FI was derived using five indicators: domestic credit to the private sector, ATMs, commercial bank branches, outstanding deposits, and outstanding loans. Domestic credit to the private sector (as a % of GDP) was used with the aim of incorporating the potential of the private sector in development and investment processes, and it positively affects economic growth [74,75]. The second and third measurements were the number of ATMs and branches of commercial banks per 100,000 adults, which have been widely used in previous FI studies [53,76]. ATMs offered significant benefits to banks by providing convenience, reducing the workload, and minimizing transaction costs. Similar to prior research methodologies [43,77,78], two measurements to cover the services of the banking sector, namely outstanding deposits and outstanding loans (as a % of GDP), were utilized to cover deposits and credits, respectively.
3.2. Analyzing Methods
3.2.1. Principal Component Analysis
Financial inclusion was measured using the index method with three main components: access, usage, and quality of the financial services. However, FI was not measured in a straightforward, quantitative way because it is an unobservable concept [79]. Principal component analysis (PCA) is a mechanism of constructing a new composite component to represent FI using the three subcomponents for deriving a predictive model. Uncorrelated components were created through principal components (PCs) and a weighted linear combination of the original variables was used for constructing each component [80], allowing for larger variances in PCs as much as possible. At first, initial variables were standardized by transforming them into normalized variables to avoid the various scale effects of the variables [81].
3.2.2. Panel Unit Root Test
The stationary of the time series is checked by the unit root tests. Stationary is a statistical property that describes a time series that does not vary throughout a considered period of time. The long-run equilibrium generated by a nonstationary time series was generally supported by most of the economic and financial theories. There are several approaches for the test of stationarity, but this study used three methods. The first was the Levin‒Lin‒Chu test—a new test using pooled t-statistics [82]. The Levin‒Lin‒Chu test preserves the most important similar alternative for the coefficient of the first-order serial correlation. That coefficient must be equivalent in all units. The second was the Im‒Pesaran‒Shim test, which is an extended version of the Levin‒Lin‒Chu test [83]. In addition to the pooling of data for each cross-section (countries), the average of augmented Dickey‒Fuller (ADF) statistics was introduced as a new approach. An ADF‒Fisher unit root test, as proposed by Maddala and Wu, was the third test, using a nonparametric approach. The unit roots of each cross-sectional unit were measured using a combination of probability values [84]. The null hypothesis of all unit root tests is defined as the presence of nonstationary time series versus the alternative (stationary).
3.2.3. Panel Co-Integration Test
After testing the stationarity of panel data, the panel co-integration test was applied. It tested the occurrence of long-run associations among variables. In this section, two-panel co-integration tests were applied. The first test was the Pedroni residual co-integration test, which is based on seven measurements to check the null of no co-integration versus the alternative hypothesis of co-integration [85]. Of these seven measurements, co-integration “within” dimension is presented by the first four statistics, while co-integration in the “between” dimension is measured through the remaining statistics. The Kao residual co-integration test is the second test of this study and assumes that the co-integrating vectors are equal. This test is considered as an ADF test version for testing on residuals. Residuals are derived by using auxiliary regression with the pooled specification. The null hypothesis for the test is the absence of co-integration in the heterogeneous and homogenous panels [86].
3.2.4. Panel Vector Error Correction Model (Panel VECM)
Although a co-integration analysis shows the presence of a causal relationship between the variables, the time lapse of their impact was not captured. VECM was used to fill this gap, allowing for checking the relationships between variables in the long and short-run. Since both cross-section and time series data were considered together, this study utilized panel VECM. Panel VECM was specified in four models as follows for this study:
Model 1: GDP per capita PPP (current USD) and financial inclusion.
Model 2: Human development index and financial inclusion.
Model 3: GDP per capita PPP (current international USD) with domestic credit to private sector (% of GDP), automated teller machines (ATMs) (per 100,000 adults), commercial bank branches (per 100,000 adults), outstanding deposits with commercial banks (% of GDP), and outstanding loans from commercial banks (% of GDP).
Model 4: Human development index with domestic credit to private sector (% of GDP), automated teller machines (per 100,000 adults), commercial bank branches (per 100,000 adults), outstanding deposits with commercial banks (% of GDP), and outstanding loans from commercial banks (% of GDP). A representative example of Model 3 or Model 4 is as follows.
Equation (3) presents an HDI with other FI components individually. The first difference of the model is ∆, the time duration from 2004 to 2018 is t, the eight South Asian countries used in this study are i, the lag length is q, and the speed of convergence of each individual is represented by β. ECT stands for the error correction term. The speed of adjustment from long-run to short-run was explained by the term of ETC. After finding both the short-run and the long-run impact, the direction of the association was tested using the Granger causality test as the final tool of the data analysis.
4. Results
4.1. Pretest Analysis Results
Descriptive statistics of the selected variables in the study are presented in Table 3. All variables except two (GDP per capita and ATMs) have not taken the form of normal distribution, as per Jarque–Bera statistics, while skewness and kurtosis have also deviated from the standard values, indicating the necessity of transformation. Log transformation is used for all variables. According to the correlation matrix (Table S1), each cell shows a correlation between the two variables and the corresponding p values. All the variables related to GDP per capita and other explanatory variables had a significantly positive correlation greater than 0.50. Among them, automated teller machines (per 100,000 adults) are greatly (0.845) associated with GDP per capita and HDI. For the other dependent variable, HDI is also positively associated with all explanatory variables.
Generally, a principal component analysis (PCA) tries to place the maximum information from the initial variables compressed into the first component, then the maximum remaining information in the second, etc.
PCA results are presented in Table 4. Eigenvectors have presented the direction in which the data dispersed, whereas eigenvalues show the relative importance of these different directions. The eigenvalue of the principal components for the first dimensions is 4.24 and the eigenvalue was greater than 1 when 85% of the variations in the selected variables were presented. The standardized five variables generated five components. However, the first component of the analysis estimates the FI index through the given weights for the first principal component of each variable, since the first component is higher than eigenvalue 1. Thus, a new variable financial inclusion index was constructed as the linear combination of the selected initial five variables.
The following formula was the constructed index for the FI for the eight South Asian countries:
All the variables used for the construction of PCs contributed equally, with weights of around 0.4. The constructed financial inclusion index is a single aggregate measurement and can be considered as a benchmark for ranking the countries within the region from highest to lowest. Afghanistan and Pakistan have shown lower FI compared to the other South Asian countries, whereas Bhutan has the highest FI, followed by Nepal. According to previous studies, Afghanistan has the lowest FI level in the region as a result of having the highest percentage (85%) of unbanked adult population [87]. Our findings are aligned with prior research reporting the highest FI for Nepal [44]. Five variables that are directed at FI have led to one PC in the analysis. Based on the discriminant scores, the countries were classified as low-level and high-level FI countries [20]. Similarly, for this analysis, the loading of the first component could be used to identify the behavior of the FI in South Asian countries, and further established an upward positive trend of FI for each of the South Asian countries throughout the 15 years.
4.2. Panel Unit Root Test Results
Country-specific effects and linear trends for the log-transformed variables were considered, and the outcomes of the panel unit root test are presented in Table S2. The stationarity of two variables, number of ATMs and outstanding deposits, was recorded at the level I(0) for three tests. Except for the above two variables, which were stationary at level, all other variables rejected the null hypothesis having unit root at first difference.
4.3. Co-Integration Test Results
Having established stationarity for the majority of variables at the first difference, panel co-integration was applied using two approaches. The first was Pedroni’s panel co-integration test, based on two specifications, as presented in Table S3. The null hypothesis of not having co-integration was rejected by both the first specification with intercept and the second specification with deterministic trend and intercept in Models 1 and 2. Two target variables and FI showed that the null hypothesis of no co-integration with intercept and trend was rejected in the Pedroni measurements. The same hypothesis was rejected in Models 3 and 4 for all four test statistics at a different level of significance. In addition, the test of Kao residual of co-integration was also utilized in presenting co-integrating relationships for selected variables. The existence of long-run associations among variables is summarized for each model in Table S3.
4.4. Panel VECM Results
Having confirmed co-integration among the variables in each model, the next task would be determining the dynamic relationship between target variables and explanatory variables. Panel VECM was applied to test both short-run and long-run relationships of FI with economic growth and HDI. The t-statistics of the error correction terms (ECT) were used to explain the long-run association and the value if ECT should be negative and significant to confirm the long-run associations between variables. The ECT coefficient value of GDP per capita is negative but insignificant with the FI index in Model 1 (Table 5). However, ECT was negative and significant with the five variables used in creating the FI index, showing the individual effects of the FI measurement on economic growth. According to the results in Model 3, the t-value associated with the ECT coefficient is significant at the 5% level. This corresponds to a 5% annual adjustment toward long-run equilibrium. Moreover, the Wald test has been used to check short-run causality between the variables in each model. The results in Model 1 revealed that GDP per capita (GDPPC) and FI are significantly linked in the short-run (χ2: 4.8049, p-value: 0.0905). The outcomes of the short-run relationship between GDPPC and the five variables of FI for selected countries by Model 3 show that GDPPC has influence only with outstanding deposits (χ2: 9.8735, p-value: 0.0072) out of five variables.
Increasing the accessibility and quality of services will lead to an efficient FI system that would accelerate the economic growth of South Asian countries. Increasing deposits and loans within the country will lead to increased money circulation in the country, which will generate both macro and micro impacts. FI will further encourage non-banked individuals to join the formal financial system, which will further reduce money laundering, tax avoidance, and transaction costs of the macro-economy. From a micro-economic perspective, this will further reduce poverty and the income inequality of individuals and households through improved financial access, quality, and bank penetration. The positive association between FI and stable economic growth was established [88] for Bangladesh, especially for pro-poor growth, in both global and South Asian contexts [89]. However, this argument was challenged by some researchers while showing the insignificant association between domestic credit and economic growth aiming at poverty alleviation [90]. Credit accessibility [91] and financial inclusion [55,92,93] were found to have positive relationships with economic growth, while an inverse association was established between financial development and economic growth [94].
The log of HDI confirms the long-run connection of HDI with FI, as established in Model 2. However, the individual variables used for creating FI have not established a long-run relationship with HDI separately, as given in Model 4. The error correction term in Model 2 implies that the log of HDI adjusted by 17% in one year to the long-run equilibrium when FI was considered as the independent variable. A similar finding was found confirming the close relationship between the levels of human development and FI through correlation analysis, using two indices based on the newly constructed financial inclusion index and human development index [43,95], while HDI and FI are positively related in some studies [64]. The insignificant long-run association between credit delivery and economic growth was also established in previous studies [90], while we have established a significant short-run relationship.
However, this study also established an insignificant association between HDI and FI in the short-run (χ2: 2.1749, p-value: 0.3371) in Model 2. The relationship between HDI and five FI-related variables is presented in Model 4. According to the results, a short-run relationship runs from HDI to outstanding deposits (χ2: 9.514) at the 1% significance level and from HDI to outstanding loans (χ2: 4.6433, p-value: 0.0981).
4.5. Panel Granger Causality Results
The pairwise Granger causality test was used to examine the directions of causality between variables for eight South Asian countries, as aimed at four models presented in Table 6. According to the results of Model 1, bidirectional causality between GDP per capita (log) and FI index was captured in the short-run, showing that increasing the gross domestic product will increase FI and vice versa.
The pairwise Granger causality tests in Model 2 show that directional causality in the long-run is significant at 5%, which indicates that any change in FI causes changes in HDI. However, a change in HDI does not have a causal impact on FI in the long-run. Bidirectional causality among log of GDP per capita and log of outstanding deposit to GDP variables in the long-run was examined in this analysis. Nevertheless, directions of causality related to FI variables are changed while considering the short-run. According to the outputs, there is enough evidence to reject the null hypotheses that log of domestic credit to the private sector does not Granger-cause log of GDP per capita; moreover, log of GDP per capita does not Granger-cause the number of ATMs and commercial bank branches. Any changes in domestic credits to the private sector will cause a change in GDP per capita. Furthermore, increasing the gross domestic product will spread more ATMs and commercial branches in the South Asian countries. Using the panel Granger analysis results for Model 4 suggests that increasing domestic credit to the private sector, commercial bank branches, outstanding deposits with commercial banks, and outstanding loans from the commercial bank will enhance the HDI. Additionally, there is bidirectional causality between the number of ATMs and HDI. Economic growth and an increase in human capital may increase the demand for financial products and services (ATMs and commercial branches). This is in line with the literature showing an association between economic growth and financial sector performances [96,97].
4.6. Diagnose Test Results
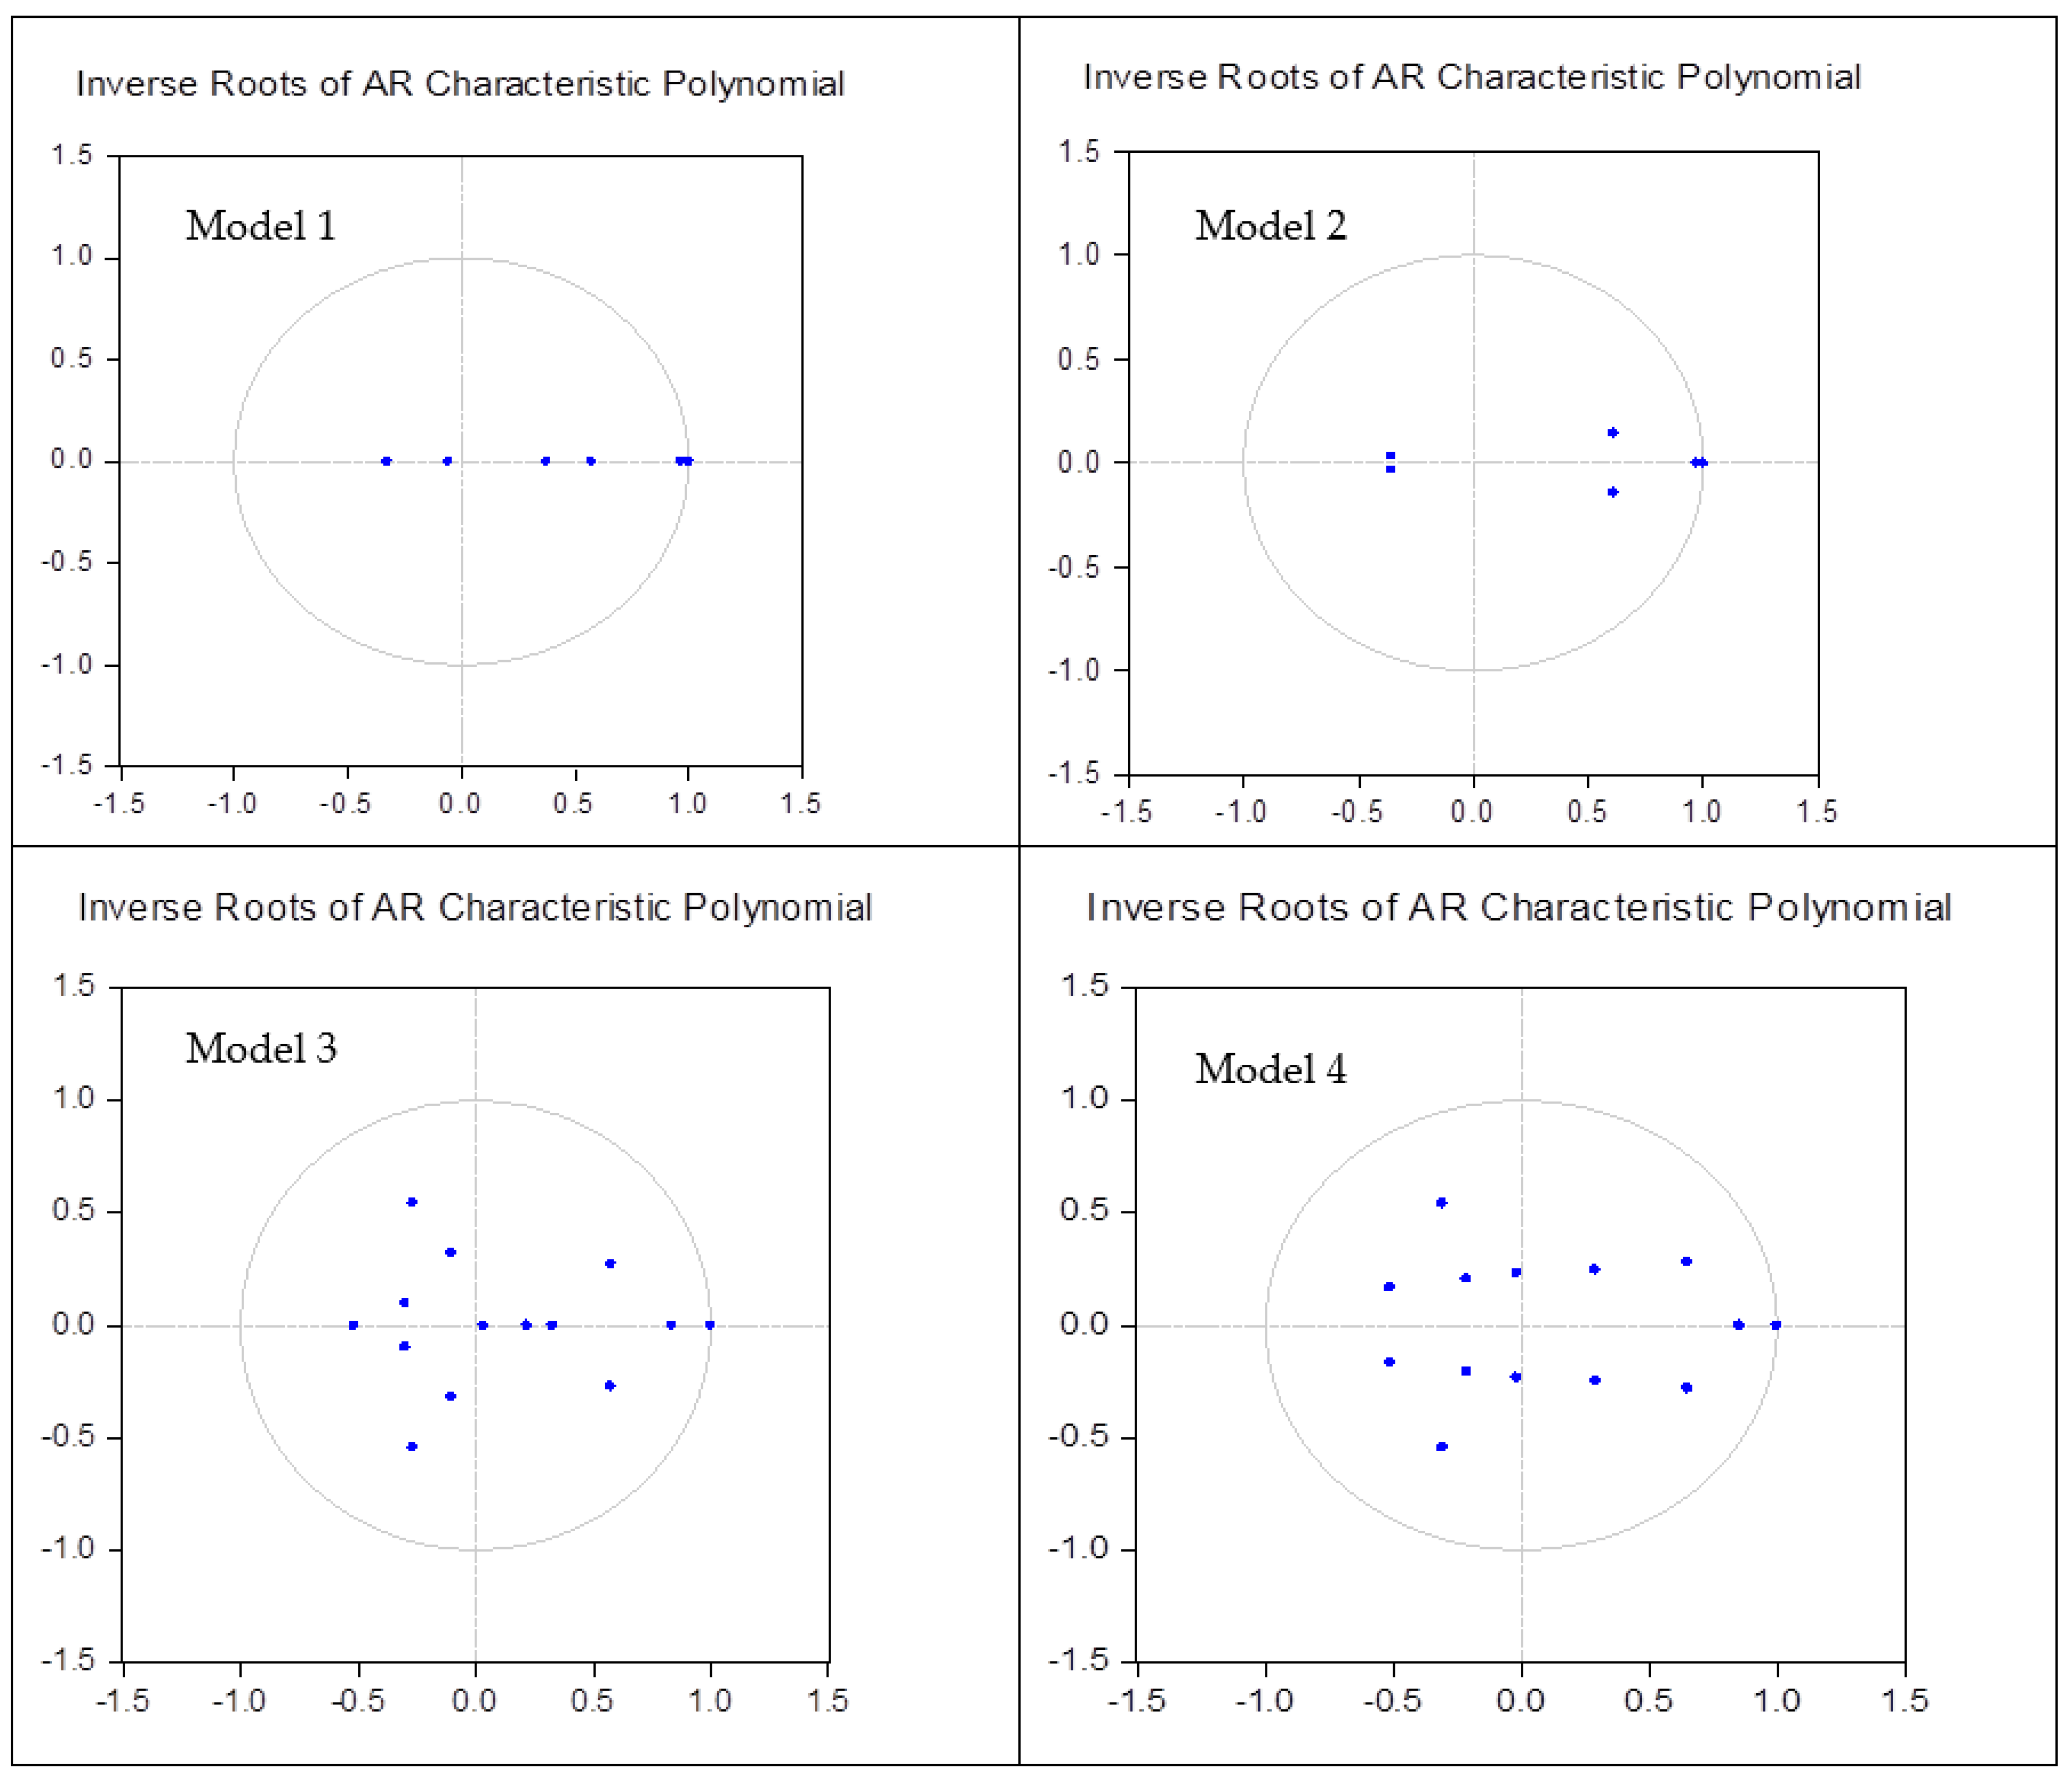
The last step of the panel VECM is to examine the response of the dependent variables to the shocks of the independent variables using the impulse response function (IRF). This represents the response of a given impulse to another variable. Practically, it indicates that, when a time series plot changes by one unit of measurement, another variable changes (up or down) by some amount in the second period. Results of log of GDP per capita, log of HDI, and FI can be seen in Figure 1 for 10 years and to one standard deviation shock. The responses initially generated a very small positive shock of log of GDP per capita to FI and log of human development index to FI with the same distribution for all 10 periods. Thus, the positive shocks of GDP per capita and HDI have a similar positive effect with FI. All models were tested by using residuals. To test for serial correlations, we applied VEC residual portmanteau tests with the null hypothesis that there would be no residual autocorrelations up to lag h. The results showed that all the models are absent of serial correlations (Table S4) up to four lags. In addition, we checked the stability of each model and observed that all the inverse roots are inside the unit circle in all the models (see Figure 2).
4.7. Limitations and Future Studies
Even though the current study provides significant results for the field of finance, it has a few limitations. Firstly, many variables were already used precisely to explain FI in different geographical contexts, and the study was limited to a few measurements due to the availability of data for all South Asian countries. The nexus between FI and development indexes could be further elaborated in future studies by using a relatively large sample. In addition, it can be further extended to a comparison of developed and developing countries in the future. Secondly, some general conclusions were made based on the eight selected South Asian countries. However, it would be better to create a cross-country comparison in line with FI in future studies. Thirdly, our study used a principal component analysis for FI since this is not a broadly applied method to construct an index. However, considering the relevant indicators based on several proxies and dimensions, the FI index could be constructed to enrich the efficacy and precision of the measurements.
5. Discussion and Conclusions
This study attempted to examine how FI affects the economic growth and human development of eight South Asian countries based on panel data for 2004–2018. Firstly, the study used PCA to construct FI, since that is not a straightforward measurement. Five variables involved in FI have led to one PC in the analysis. We used the panel co-integration, VECM, and Granger causality approaches to examine the effect of FI on economic growth and human development index as two major objectives.
First, the study provides strong evidence that the development of FI is an important causal factor of human capital development in South Asian countries in the long-run but not in the short-run. The impact of FI on human capital development, either directly or indirectly, takes a certain time to show its positive impact. The development of FI leads to increased deposits and improved access to financial services, which leads to increased investment in education and household expenditure on healthcare. This further facilitates risk mitigation for vulnerable communities that are unable to provide healthcare and educational facilities for their children. Credit enhancements also reduce the poverty level of a region, which leads to people being able to meet their basic human needs, including educational and healthcare facilities. The positive influence of FI on human capital development in the long-run is supported by all of the above implications. Second, the study concludes that economic growth is not correlated with FI in the long-run, but it does have a relationship in the short-run. Since all of the South Asian economies are based on the service sector (more than half of the total GDP), FI has an immediate and significant short-run impact on economic growth. However, most of the FI mechanisms and the speed of FI are hampered by the financial policies of the respective economies, resulting in a negative long-run impact of FI on economic growth. Finally, the study proposed policy implications to promote economic, community, and environmental sustainability through promoting FI in South Asia.
In terms of the economic aspects, FI has assisted with development in South Asian countries, with the banks playing a dominant role by introducing inclusive digital financial services (mobile money, online accounts, electronic payments, insurance, and credits). Fintech is one of the emerging technologies currently used by many developing countries [98]. Introducing Fintech apps (like PayPal, Get Report) assists with attracting the younger generation, since these are not widespread in the region at present. Both government and private organizations competitively engage in adopting new technologies in the financial sector based on digital platforms to help their customers. This accelerates the money circulation in the country with the expansion of investment and consumption behaviors, which leads to a high rate of economic growth. In terms of environmental aspects, increasing financial demand, as a result of increasing FI, creates competitiveness in the market, leading to a gain in the comparative advantages of using financial innovations. One of the key mechanisms of financial innovation is the application of green concepts in FI (inclusive green finance) to create sustainable and resilient policies for the South Asian countries. Those were limited in earlier academic and policy discussions; this study forces us to rethink new mechanisms of FI to accelerate economic growth in the long-run, integrating green finance and FI policies. The current study only established a positive short-run impact of FI on economic growth.
In terms of the community aspect, half of the unbanked population in the world was recorded from seven developing economies, including India, Bangladesh, and Pakistan in South Asia. The share of inactive accounts is also high in South Asia. The proportion of inactive accounts in India is 48%, while Afghanistan, Nepal, and Sri Lanka have reported more than 50% active accounts. The percentage of inactive accounts is 21% in Bangladesh and 13% in Pakistan. Thus, ensuring confidence in new banking networks and their sensitivity through higher financial literacy is needed to encourage individuals and firms to adopt banking products and services. For example, the Indian government introduced biometric identification cards in 2014 to boost account ownership in India; this was highly successful [99]. Therefore, governments should pay more attention to the Fintech revolution in their economies to incorporate global financial development in their economic growth process, mainly in the short-run. Furthermore, small‒medium enterprises (SMEs) are the drivers of change in regional development, economic growth, and employment generation—and, ultimately, poverty reduction [100]. However, access to finance is widely seen as the major constraint on growth for individuals and firms [101,102]. Providing micro-credit through a formal process is highly useful for the development of an SMEs sector as well as the country as a whole. Public sector banks are more widespread in South Asia than in other regions. Hence, public banks can provide services to people in remote areas, including poor people, through large, expanding, and subsidized bank branches, to foster inclusive growth. Government intervention in credit allocation and the financial sector development is also critical at this development stage. FI will further affect the human development of South Asia in the long-run. Financial education will help with prudent borrowing, record keeping, and savings decisions, which further leads to human capital development. Hence, South Asia should further prioritize providing financial education for the entire community in their development policy agenda.
Supplementary Materials
The following are Available online at https://www.mdpi.com/article/10.3390/su13084303/s1, Table S1: Pearson correlation matrix of model variables; Table S2: Levin–Lin–Chu, Im‒Pesaran‒Shim, and augmented Dickey‒Fuller‒Fisher panel unit root test results; Table S3: co-integration test results; Table S4: diagnostic tests results.
Author Contributions
J.W. conceptualized and supervised the study. U.T. carried out the design of the research, data collection, and analysis. G.S. substantially revised the manuscript and finalized the paper. All authors have read and agreed to the published version of the manuscript.
Funding
The authors have not received any funding for this study.
Institutional Review Board Statement
Not applicable.
Informed Consent Statement
Not applicable.
Data Availability Statement
All data generated or analyzed during this study can be obtained upon request from the corresponding author.
Acknowledgments
We thank our colleagues from the School of Economics, Wuhan University of Technology, for their comments and assistance that improved the manuscript, as well as the professors from the same school who encouraged us.
Conflicts of Interest
The authors declare that they have no competing interests.
Abbreviations
| ATMs | Automated Teller Machines |
| ECT | Error Correction Term |
| FAS | Financial Access Survey |
| FE | Financial Exclusion |
| FF | Formal Financial |
| FI | Financial Inclusion |
| GDP | Gross Domestic Products |
| GDPPC | GDP per capita |
| GNI | Gross National Income |
| GPFI | Global Partnership for Financial Inclusion |
| HDR | Human Development Report |
| PCA | Principal Component Analysis |
| PC | Principal Component |
| PPP | Purchasing Power Parity |
| PVECM | Panel Vector Error Correction Model |
| SDG | Sustainable Development Goals |
| SME | Small‒Medium Enterprises |
| VAR | Vector Auto Regressive |
| WDI | World Development Indicators |
References
- Raza, M.S.; Tang, J.; Rubab, S.; Wen, X. Determining the nexus between financial inclusion and economic development in Pakistan. J. Money Laund. Control 2019, 22, 195–209. [Google Scholar] [CrossRef]
- Ozili, P.K. Impact of digital finance on financial inclusion and stability. Borsa Istanb. Rev. 2018, 18, 329–340. [Google Scholar] [CrossRef]
- Rewilak, J. The role of financial development in poverty reduction. Rev. Dev. Financ. 2017, 7, 169–176. [Google Scholar] [CrossRef]
- CBSL. Annual Report; Central Bank of Sri Lanka: Colombo, Sri Lanka, 2015.
- Demirguc-Kunt, A.; Klapper, L.; Singer, D. Financial Inclusion and Inclusive Growth: A Review of Recent Empirical Evidence; Policy Research Working Paper; No. 8040; World Bank: Washington, DC, USA, 2017. [Google Scholar]
- Sahay, R.; Cihak, M.; N’Diaye, P.; Barajas, A.; Mitra, S.; Kyobe, A.; Mooi, Y.N.; Yousefi, S.R. Financial inclusion: Can it meet multiple macroeconomic goals? Staff. Discuss. Notes 2015, 15, 17. [Google Scholar] [CrossRef]
- United Nations. South-South Coorporation in a Digital World; United Nations Development Programme: New York, NY, USA, 2018. [Google Scholar]
- Zhu, B.; Zhai, S.; He, J. Is the development of China’s financial inclusion sustainable? Evidence from a perspective of balance. Sustainability 2018, 10, 1200. [Google Scholar] [CrossRef] [Green Version]
- Amidžić, G.; Massara, A.; Mialou, A. Assessing Countries’ Financial Inclusion Standing—A New Composite Index; Working Paper/14/36; IMF: Washington, DC, USA, 2014; Available online: https://ssrn.com/abstract=2407529 (accessed on 11 June 2020).
- Jeanneney, S.G.; Kpodar, K. Financial development and poverty reduction: Can there be a benefit without a cost? J. Dev. Stud. 2011, 47, 143–163. [Google Scholar] [CrossRef]
- Sehrawat, M.; Giri, A. Panel data analysis of financial development, economic growth and rural-urban income inequality. Int. J. Soc. Econ. 2016, 43, 998–1015. [Google Scholar] [CrossRef]
- Yadav, P.; Sharma, A.K. Financial inclusion in India: An application of TOPSIS. Humanomics 2016, 32, 328–351. Available online: www.emeraldinsight.com/0828-8666.htm (accessed on 11 June 2020). [CrossRef]
- World Bank. The Little Data Book on Financial Inclusion; World Bank: Washington, DC, USA, 2012; Available online: http://hdl.handle.net/10986/12253 (accessed on 11 June 2020).
- King, R.G.; Levine, R. Finance and growth: Schumpeter might be right. Q. J. Econ. 1993, 108, 717–737. [Google Scholar] [CrossRef]
- World Bank. The Little Data Book on Financial Inclusion; World Bank: Washington, DC, USA, 2018; Available online: http://hdl.handle.net/10986/29654 (accessed on 11 June 2020).
- Bold, C.; Porteous, D.; Rotman, S. Social Cash Transfers and Financial Inclusion: Evidence from Four Countries; CGAP: Washington, DC, USA, 2012; pp. 1–28. [Google Scholar]
- Fungacova, Z.; Weill, L. Understanding financial inclusion in China. China Econ. Rev. 2015, 34, 196–206. [Google Scholar] [CrossRef] [Green Version]
- Omar, M.A.; Inaba, K. Does financial inclusion reduce poverty and income inequality in developing countries? A panel data analysis. J. Econ. Struct. 2020, 9, 9–37. [Google Scholar] [CrossRef]
- Agnello, L.; Mallick, S.K.; Sousa, R.M. Financial reforms and income inequality. Econ. Lett. 2012, 116, 583–587. [Google Scholar] [CrossRef]
- Adalessossi, K.; Kaya, N. The measure of the financial inclusion in the African countries. Adv. Manag. Appl. Econ. 2015, 5, 23–32. [Google Scholar]
- Park, C.-Y.; Mercado, R.J. Financial inclusion, poverty, and income inequality in developing Asia. SSRN Electron. J. 2015, 1–17. [Google Scholar] [CrossRef] [Green Version]
- Nanda, K.; Kaur, M. Financial inclusion and human development: A cross-country evidence. Manag. Labour. Stud. 2016, 2, 127–153. [Google Scholar] [CrossRef]
- Beck, T.; Demirguc-Kunt, A.; Levine, R. SMEs, growth, and poverty: Cross-country evidence. J. Econ. Growth 2005, 10, 199–299. [Google Scholar] [CrossRef]
- Clarke, G.; Xu, L.; Zou, H. Finance and income inequality: What do the data tell us? South. Econ. J. 2006, 72, 578–596. [Google Scholar] [CrossRef] [Green Version]
- Arner, D.W.; Buckley, R.P.; Zetzsche, D.A.; Veidt, R. Sustainability, FinTech and financial inclusion. Eur. Bus. Organ. Law Rev. 2020, 21, 7–35. [Google Scholar] [CrossRef]
- Angus, W.H.Y.; Nancy, M.P.B. Sustainable business model archetypes for the banking industry. J. Clean. Prod. 2018, 174, 150–169. [Google Scholar] [CrossRef]
- Bocken, N.; Allwood, J. Strategies to reduce the carbon footprint of consumer goods by influencing stakeholders. J. Clean. Prod. 2012, 35, 118–129. [Google Scholar] [CrossRef]
- ADB. Financial Inclusion in Asia: An Overview; ADB Economics Working Paper Series; Asian Development Bank: Manila, Philippines, 2015. [Google Scholar]
- International Monetary Fund. GDP Current Prices, in Billions of Dollars. World Economic Outlook, Washington, DC. Available online: www.imf.org/external/datamapper/NGDPD@WEO/OEMDC/ADVEC/WEOWORLD (accessed on 11 October 2020).
- Prospects, W.E.S.A. Chapter III. Regional Developments and Outlook; United Nations: New York, NY, USA, 2019. [Google Scholar]
- Cull, R.; Demirgüç-Kunt, A.; Mordu, J. Banking the World: Empirical Foundations of Financial Inclusion; MIT Press: Cambridge, MA, USA; London, UK, 2013; Available online: EconPapers.repec.org/RePEc:mtp:titles:0262018425 (accessed on 11 June 2020).
- Mani, M. Financial inclusion in South Asia—Relative standing, challenges and initiatives. South Asian Surv. 2018, 22, 158–179. [Google Scholar] [CrossRef]
- Schumpeter, J.A. The Theory of Economic Development: An Inquiry into Profits, Capital, Credit, Interest and the Business Cycle; Harvard University Press: Cambridge, UK, 1911. [Google Scholar]
- United Nation. Digital Financial Inclusion. International Telecommunication Union (ITU), Issue Brief Series, Inter-Agency Task Force on Financing for Development; United Nation: New York, USA, 2016; Available online: http://www.un.org/esa/ffd/wp-content/uploads/2016/01/Digital-Financial-Inclusion_ITU_IATF-Issue-Brief.pdf (accessed on 11 June 2020).
- Bruhn, M.; Love, I. The real impact of improved access to finance: Evidence from Mexico. J. Financ. 2014, 69, 1347–1376. [Google Scholar] [CrossRef]
- GPFI. G20 Principles for Innovative Financial; Alliance for Financial Inclusion (AFI): Bangkok, Thailand, 2011; Available online: www.gpfi.org/sites/gpfi/files/documents/G20%20Principles%20for%20Innovative%20Financial%20Inclusion_Bringing%20the%20Principles%20to%20Life.pdf (accessed on 11 June 2020).
- Kempson, E.; Whyley, C. Understanding and combating financial exclusion. Insur. Trends 1999, 21, 18–22. [Google Scholar]
- Sinclair, S.P. Financial Exclusion: An Introductory Survey; Centre for Research in Socially Inclusive Services (CRISIS); Heriot-Watt University: Edinburgh, UK, 2001. [Google Scholar]
- Chant Link and Associates. A Report on Financial Exclusion in Australia; Chant Link & Associates for ANZ: Victoria, Australia, 2004; Available online: www.anz.com/resources/b/9/b9d9e5004f1d3eb8a57cb558b54e5b8d/Financial-Exclusion-Final-Report.pdf?MODAJPERES (accessed on 11 June 2020).
- Barboni, G.; Cassar, A.; Demont, T. Financial exclusion in developed countries: A field experiment among migrants and low-income people in Italy. J. Behav. Econ. Policy 2017, 1, 39–49. Available online: http://sabeconomics.org/journal/RePEc/beh/JBEPv1/articles/JBEP-1-2-6.pdf (accessed on 11 June 2020).
- Bernheim, B.D.; Ray, D.; Yeltekin, S. Poverty and self-control. Econometrica 2015, 83, 1877–1911. [Google Scholar] [CrossRef]
- Sarma, M. Index of Financial Inclusion; Icrier Work. Pap. No 215; Indian Council for Research on International Economic Relations: Delhi, India, 2008. [Google Scholar]
- Sarma, M.; Pais, J. Financial inclusion and development. J. Int. Dev. 2011, 23, 613–625. [Google Scholar] [CrossRef]
- Singh, D.; Stakic, N. Finacial inclusion and economic growth nexus: Evidence from SARRC countries. South Asia Res. Vol. 2020, 41, 1–21. [Google Scholar] [CrossRef]
- Chirwa, G.T.; Odhiambo, N.M. Exogenous and endogenous growth models: A critical review. Comp. Econ. Res. 2018, 21, 63–84. [Google Scholar] [CrossRef] [Green Version]
- Ketley, R. The Return to Cash; Genesis Analytics Newsletter: Johannesburg, South Africa, 2018. [Google Scholar]
- Srouji, J. Digital payments, the cashless economy, and financial inclusion in the United Arab Emirates: Why is everyone still transacting in cash? J. Risk Financ. Manag. 2020, 13, 260. [Google Scholar] [CrossRef]
- Dahiya, S.; Kumar, M. Linkage between financial inclusion and economic growth: An empirical study of the emerging Indian economy. Vision 2020, 24, 184–193. [Google Scholar] [CrossRef]
- Anarfo, E.B.; Abor, J.Y.; Osei, K.A.; Gyeke, D. Financial inclusion and financial sector development in Sub-Saharan Africa: A panel VAR approach. Int. J. Manag. Financ. 2019, 15, 444–463. [Google Scholar] [CrossRef]
- Babajide, A.A.; Adegboye, F.B.; Omankhanlen, A. Financial inclusion and economic growth in Nigeria. Int. J. Econ. Financ. Issues 2015, 5, 629–637. [Google Scholar]
- Sharma, D. Nexus between financial inclusion and economic growth: Evidence from the emerging Indian economy. J. Financ. Econ. Policy 2016, 8, 13–36. [Google Scholar] [CrossRef]
- Honohan, P. Cross-country variation in household access to financial services. J. Bank. Financ. 2008, 32, 2493–2500. [Google Scholar] [CrossRef] [Green Version]
- Neaime, S.; Gaysset, I. Financial inclusion and stability in MENA: Evidence from poverty and inequality. Financ. Res. Lett. 2018, 24, 230–237. [Google Scholar] [CrossRef]
- García-Herrero, A.; Turégano, D.M. Financial Inclusion, Rather Than Size, Is the Key to Tackling Income Inequality; BBVA Research Working Paper 1505; BBVA Research: Madrid, Spain, 2015. [Google Scholar] [CrossRef]
- Nizam, R.; Karim, Z.A.; Rahman, A.A.; Sarmidi, T. Financial inclusiveness and economic growth: New evidence using a threshold regression analysis. Econ. Res. Ekon. Istraživanja 2020, 33, 1465–1484. [Google Scholar] [CrossRef]
- Kim, J.-H. A Study on the effect of financial inclusion on the relationship between income inequality and economic growth. Emerg. Mark. Financ. Trade 2012, 52, 498–512. [Google Scholar] [CrossRef]
- Tsaurai, K. Investigating the determinants of human capital development in emerging markets. Int. J. Educ. Econ. Dev. 2018, 2, 172–181. [Google Scholar] [CrossRef]
- Praise, U.I.; George-Anokwuru, C.C. Empirical analysis of determinants of human capital formation: Evidence from the Nigerian data. J. World Econ. Res. 2018, 7, 73–81. [Google Scholar] [CrossRef]
- Rastogi, C.; Gaikwad, S. A study on determinants of human capital development in BRICS nations. Nfiib Bus. Rev. 2017, 6, 38–50. [Google Scholar] [CrossRef]
- De Grip, A.; Sauermann, J. The effect of training on productivity: The transfer of on-the-job training from the perspective of economics. Educ. Res. Rev. 2013, 8, 28–36. [Google Scholar] [CrossRef]
- Chou, Y.K.; Chinn, M. Human Capital, Financial Innovations and Growth: A Theoretical Approach; Department of Economics, University of Melbourne: Melbourne, Australia, 2001. [Google Scholar]
- Kargbo, A.A.; Ding, Y.; Kargbo, M. Financial development, human capital and economic growth: New evidence from Sierra Leone. J. Financ. Bank Manag. 2016, 4, 49–67. [Google Scholar]
- Matekenya, W.; Moyo, C.; Jeke, L. Financial inclusion and human development: Evidence from Sub-Saharan Africa. Dev. S. Afr. 2020, 1–18. [Google Scholar] [CrossRef]
- Kuri, P.K.; Laha, A. Finacial inclusion and human development in India: An inter-state analysis. Indian J. Hum. Dev. 2011, 5, 61–77. [Google Scholar] [CrossRef]
- Raichoudhury, A. Financial inclusion and human development: A cross country analysis. Asian J. Bus. Res. 2016, 6, 34–48. [Google Scholar] [CrossRef]
- Datta, S.K.; Singh, K. Variation and determinants of financial inclusion and their association with human development: A cross-country analysis. Iimb. Manag. Rev. 2019, 31, 336–349. [Google Scholar] [CrossRef]
- Ababio, J.O.; Attah-Botchwey, E.; Osei-Assibey, E.; Barnor, C. Financial inclusion and human development in frontier countries. Int. J. Financ. Econ. 2021, 26, 42–59. [Google Scholar] [CrossRef]
- World Development Indicator (WDI); World Bank. Available online: databank.worldbank.org/source/world-development-indicators (accessed on 11 June 2020).
- FAS. International Monetary Fund. Available online: data.imf.org/?sk=E5DCAB7E-A5CA-4892-A6EA-598B5463A34C (accessed on 11 June 2020).
- HDR. United Nations Development Programme. Available online: http://hdr.undp.org/en/data# (accessed on 11 June 2020).
- Arisman, A. Determinants of human development index in ASEAN countries. Signifikan 2018, 7, 113–122. [Google Scholar] [CrossRef]
- Tsaurai, K. Determinants of human capital development in Africa. Int. J. Econ. Bus. Adm. 2020, 8, 377–391. [Google Scholar] [CrossRef]
- Bara, A.; Mudxingiri, C. Financial innovation and economic growth: Evidence from Zimbabwe. Invest. Manag. Financ. Innov. 2016, 13, 65–75. [Google Scholar] [CrossRef] [Green Version]
- Akpansung, A.O.; Babalola, S.J. Banking sector credit and economic growth in Nigeria: An empirical investigation. Cbn. J. Appl. Stat. 2012, 2, 51–62. [Google Scholar]
- Olowofeso, E.O.; Adeleke, A.O.; Udoji, A.O. Impact of private sector credit on economic growth in Nigeria. CBN J. Appl. Stat. 2015, 6, 81–101. [Google Scholar]
- Vo, D.H.; Nguyen, N.T.; Van, L.T.-H. Financial inclusion and stability in the Asian region using bank-level data. Borsa Istanb. Rev. 2021, 21, 36–43. [Google Scholar] [CrossRef]
- Inoue, T.; Hamori, S. Financial access and economic growth: Evidence from Sub-Saharan Africa. Emerg. Mark. Financ. Trade 2016, 52, 743–753. [Google Scholar] [CrossRef]
- Nguyen, T.T.H. Measuring financial inclusion: A composite FI index for the developing countries. J. Econ. Dev. 2020, 23, 77–99. [Google Scholar] [CrossRef]
- Camara, N.; Tuesta, D. Measuring Financial Inclusion: A Multidimensional Index; BBVA Research Paper No. 14/26. 2014. Available online: ssrn.com/abstract=2634616 (accessed on 12 December 2020).
- Jolliffe, I.T. Principal Component Analysis; Springer: New York, NY, USA, 2002. [Google Scholar]
- Le, T.-H.; Chuc, A.T.; Taghizadeh-Hesary, F. Financial inclusion and its impact on financial efficiency and sustainability: Empirical evidence from Asia. Borsa Istanb. Rev. 2019, 19, 310–322. Available online: www.sciencedirect.com/science/article/pii/S2214845019301267 (accessed on 11 June 2020). [CrossRef]
- Levin, A.; Lin, C.-F.; Chu, C.-S.J. Unit root tests in panel data: Asymptotic and finite-sample properties. J. Econ. 2002, 108, 1–24. [Google Scholar] [CrossRef]
- Im, K.S.; Pesaran, M.H.; Shin, Y. Testing for unit roots in heterogeneous panels. J. Econom. 2003, 115, 53–74. [Google Scholar] [CrossRef]
- Maddala, G.; Wu, S. A comparative study of unit root tests and a new factors. J. Econom. 1999, 122, 81–126. [Google Scholar] [CrossRef]
- Pedroni, P. Critical values for cointegration tests in heterogeneous panels with multiple regressors. Oxf. Bull. Econ. Stat. 1999, 61, 653–670. [Google Scholar] [CrossRef]
- Kao, C. Spurious regression and residual-based tests for cointegration in panel data. J. Econom. 1999, 90, 1–44. [Google Scholar] [CrossRef]
- Ghafori, A.M. Financial Inclusion in Afghanistan; Financial Inclusion Department: Phnom Penh, Cambodia, 2019. [Google Scholar]
- Ibor, B.; Ikpa Offiong, A.; Samuel Mendie, E. Financial inclusion and performance of micro, small and medium scale enterprises in Nigeria. Int. J. Res. Granthaalayah 2017, 5, 104–122. [Google Scholar] [CrossRef]
- Park, C.Y.; Mercado, R.V.J. Financial inclusion, poverty, and income inequality. Singap. Econ. Rev. 2018, 63, 185–206. [Google Scholar] [CrossRef]
- Okoye, L.U.; Adetiloye, K.A.; Erin, O.; Modebe, N.J. Financial inclusion as a strategy for enhanced economic growth and development. J. Internet Bank. Commer. 2017, 22, 1–14. [Google Scholar]
- Gine, X.; Townsend, R.M. Evaluation of financial liberalization: A general equilibrium. J. Dev. Econ. 2014, 2, 269–304. [Google Scholar]
- CGAP. Financial Inclusion and Stability: What Does Research Show? (Issue Brief); Consultative Group to Assist the Poor: Washington, DC, USA, 2012. [Google Scholar]
- Bertram, O.A.; Nwankwo, S.N.P.; Onwuka, I.O. Full financial inclusion (FFI): A prerequisite for inclusive economic development in Nigeria. Adv. Soc. Sci. Res. J. 2016, 3, 65–78. [Google Scholar]
- Arcand, J.L.; Berkes, E.; Panizza, U. Too Much Finance? (IMF Working Paper 12/161); International Monetary Fund: Washington, DC, USA, 2012. [Google Scholar]
- Hathroubi, S. Inclusive finance, growth and socio-economic development in Saudi Arabia: A threshold cointegration approach. J. Econ. Dev. 2019, 44, 77–111. [Google Scholar] [CrossRef]
- Dietrich, A.; Wanzenried, G. The determinants of commercial banking profitability in low-, middle-, and high-income countries. Q. Rev. Econ. Financ. 2014, 54, 337–354. [Google Scholar] [CrossRef]
- Athanasoglou, P.P.; Brissimis, S.N.; Delis, M.D. Bank-specific, industry-specific and macroeconomic determinants of bank profitability. J. Int. Financ. Mark. Inst. Money 2008, 18, 121–136. [Google Scholar] [CrossRef] [Green Version]
- Haddad, C.; Hornuf, L. The emergence of the global fintech market: Economic and technological determinants. Small Bus. Econ. 2019, 53, 81–105. [Google Scholar] [CrossRef] [Green Version]
- World Bank Group. Measuring Financial Inclusion and the Fintech Revolution; World Bank Group: Washington, DC, USA, 2017. [Google Scholar]
- Ahmed, V.; Wahab, M.A.; Mahmood, H. Effectiveness of HRD for Developing SMEs in South Asia. Available online: mpra.ub.uni-muenchen.de/30780/ (accessed on 7 September 2020).
- Duygan-Bump, B.; Levkov, A.; Montoriol-Garriga, J. Financing constraints and unemployment: Evidence from the great recession. J. Monet. Econ. 2015, 75, 89–105. [Google Scholar] [CrossRef] [Green Version]
- Singh, A.; Tandon, P. Financial Inclusion in India: An analysis. Int. J. Mark. Manag. Res. 2013, 1, 41–54. [Google Scholar]
Figure 1.
Impulse response function (IRF).

Figure 2.
Residual stability test of ECM model. Note: x axes are real values and y axes are imaginary values of inverse roots of autoregressive (AR) terms.
Figure 2.
Residual stability test of ECM model. Note: x axes are real values and y axes are imaginary values of inverse roots of autoregressive (AR) terms.


Table 1.
Financial inclusion and development indicators.
| Components | SL | PAK | NPL | IND | BAN | SA | EA |
|---|---|---|---|---|---|---|---|
| GNI per capita (USD) 2019 | 4020 | 1530 | 1090 | 2130 | 1940 | 2019 | 8299 |
| Human capital index (0–1) | 0.58 | 0.39 | 0.49 | 0.44 | 0.48 | 0.46 | 0.61 |
| Access to formal finance | |||||||
| Financial institution account (% aged 15+) | 74% | 18% | 45% | 80% | 41% | 68% | 73% |
| Usage of formal finance (% aged 15+) | |||||||
| Saved at a financial institution | 29% | 6% | 17% | 20% | 10% | 17% | 31% |
| Borrowed from a financial institution | 17% | 3% | 14% | 8% | 9% | 8% | 21% |
| Digital payment in the past year | 47% | 18% | 16% | 29% | 34% | 28% | 58% |
GNI: Gross national income per capita, SL: Sri Lanka, PAK: Pakistan, NPL: Nepal, BAN: Bangladesh, SA: South Asia, EA: East Asia. Source: [15].
Table 2.
Description of data and sources.
| Variable | Description | Measurement | Legend | Sources |
|---|---|---|---|---|
| Economic growth | PPP GDP per capita | Current USD | LGDPPC | WDI |
| Human development | HDI | Index score | LHDI | HDR |
| Bank penetration | Domestic credit to private sector | % of GDP | LDOCREGDP | WDI |
| FI access | Automated teller machines (ATMs) (per 100,000 adults) | Number | LATMS | FAS |
| Branches in commercial banks (per 100,000 adults) | Number | LBRA | FAS | |
| FI usage | Outstanding deposits (commercial banks) | % of GDP | LODEGDP | FAS |
| Outstanding loans (commercial banks) | % of GDP | LOLGDP | FAS |
Table 3.
Descriptive summary of the variable.
| Statistics | GDP per Capita | HDI | Credit to Private Sector | ATMs | Bank Branches | Outstanding Deposits | Outstanding Loans |
|---|---|---|---|---|---|---|---|
| Mean | 6842 | 0.580 | 35 | 10 | 10 | 44 | 33 |
| Median | 4559 | 0.568 | 35 | 7 | 10 | 41 | 33 |
| Maximum | 18,945 | 0.778 | 87 | 44 | 19 | 83 | 70 |
| Minimum | 925 | 0.400 | 3 | 0 | 0 | 4 | 1 |
| Std. Dev. | 5019.42 | 0.087 | 18.09 | 9.34 | 4.61 | 16.97 | 15.97 |
| Skewness | 0.91 | 0.43 | 0.13 | 1.29 | −0.23 | 0.02 | −0.27 |
| Kurtosis | 2.64 | 2.71 | 2.86 | 4.57 | 2.63 | 2.62 | 2.47 |
| Jarque–Bera | 15.12 | 3.58 | 0.39 | 40.19 | 1.51 | 0.63 | 2.46 |
| Probability | 0.001 | 0.1669 | 0.824 | 0.000 | 0.471 | 0.728 | 0.293 |
Table 4.
Results of principal component analysis.
| Eigenvalue | Difference | Proportion | Cumulative | |
|---|---|---|---|---|
| Component 1 | 4.236 | 3.793 | 0.847 | 0.847 |
| Component 2 | 0.443 | 0.256 | 0.089 | 0.936 |
| Component 3 | 0.188 | 0.068 | 0.038 | 0.973 |
| Component 4 | 0.119 | 0.105 | 0.024 | 0.997 |
| Component 5 | 0.014 | - | 0.003 | 1.000 |
Table 5.
Results of panel VECM.
| Independent Variables | Model 1 | Model 2 | Model 3 | Model 4 |
|---|---|---|---|---|
| Δ(LGDPPC) | Δ(LHDI) | Δ(LGDPPC) | Δ(LHDI) | |
| CointEq1 | −0.012 (0.009) | −0.017 ** (0.008) | 0.005 ** (0.002) | 0.005 (0.002) |
| Δ(LGDPPC(-1)) | 0.098 (0.103) | 0.197 * (0.117) | ||
| Δ(LGDPPC(-2)) | 0.026 (0.091) | 0.020 (0.010) | ||
| Δ(LHDI(-1)) | 0.087 (0.109) | 0.056 (0.115) | ||
| Δ(LHDI(-2)) | 0.194 * (0.100) | 0.178 (0.010) | ||
| Δ(FI(-1)) | 0.036 * (0.020) | 0.003 (0.003) | ||
| Δ(FI(-2)) | 0.001 (0.017) | 0.002 (0.003) | ||
| Δ(LDOCREGDP(-1)) | −0.023 (0.069) | −0.010 (0.011) | ||
| Δ(LDOCREGDP(-2)) | 0.055 (0.052) | 0.014 (0.009) | ||
| Δ(LATMS(-1)) | 0.009 (0.020) | 0.004 (0.003) | ||
| Δ(LATMS(-2)) | −0.029 (0.018) | 0.003 (0.003) | ||
| Δ(LBRA(-1)) | 0.101 (0.067) | 0.018 (0.011) | ||
| Δ(LBRA(-2)) | 0.020 (0.057) | −0.007 (0.001) | ||
| Δ(LODEGDP(-1)) | 0.195 ** (0.063) | 0.027 (0.010) | ||
| Δ(LODEGDP(-2)) | −0.029 (0.066) | 0.0144 (0.011) | ||
| Δ(LOLGDP(-1)) | −0.023 (0.069) | −0.006 (0.012) | ||
| Δ(LOLGDP(-2)) | −0.053 (0.057) | −0.0167 (0.010) | ||
| Constant | 0.045 *** (0.009) | 0.007 *** (0.002) | 0.041 *** (0.011) | 0.006 (0.002) |
Note: standard errors in brackets and, * for 10%, ** for 5%, *** for 1% level of significance.
Table 6.
Results of panel Granger causality.
| Null Hypothesis | F-Statistics | Prob. | Null Hypothesis | F-Statistics | Prob. |
|---|---|---|---|---|---|
| FI → LGDPPC | 6.898 *** | 0.001 | FI → LHDI | 3.794 ** | 0.026 |
| LGDPPC → FI | 2.675 * | 0.075 | LHDI → FI | 0.057 | 0.945 |
| LDOCREGDP → LGDPPC | 3.111 ** | 0.049 | LDOCREGDP → LHDI | 3.775 ** | 0.026 |
| LGDPPC → LDOCREGDP | 1.292 | 0.280 | LHDI → LDOCREGDP | 0.865 | 0.424 |
| LATMS → LGDPPC | 1.637 | 0.201 | LATMS → LHDI | 3.242 ** | 0.044 |
| LGDPPC → LATMS | 5.135 *** | 0.008 | LHDI → LATMS | 5.201 *** | 0.007 |
| LBRA → LGDPPC | 1.168 | 0.315 | LBRA → LHDI | 3.534 ** | 0.033 |
| LGDPPC → LBRA | 4.297 ** | 0.016 | LHDI → LBRA | 1.118 | 0.331 |
| LODEGDP → LGDPPC | 4.682 ** | 0.012 | LODEGDP → LHDI | 8.172 *** | 0.001 |
| LGDPPC → LODEGDP | 3.676 ** | 0.029 | LHDI → LODEGDP | 0.668 | 0.515 |
| LOLGDP → LGDPPC | 3.525 ** | 0.034 | LOLGDP → LHDI | 4.068 ** | 0.020 |
| LGDPPC → LOLGDP | 3.135 ** | 0.048 | LHDI → LOLGDP | 0.852 | 0.430 |
Note: ***, **, * mean significance at the 1%, 5%, and 10% level, respectively; “→” Shows the direction.
Publisher’s Note: MDPI stays neutral with regard to jurisdictional claims in published maps and institutional affiliations. |
© 2021 by the authors. Licensee MDPI, Basel, Switzerland. This article is an open access article distributed under the terms and conditions of the Creative Commons Attribution (CC BY) license (https://creativecommons.org/licenses/by/4.0/).
Share and Cite
MDPI and ACS Style
Thathsarani, U.; Wei, J.; Samaraweera, G. Financial Inclusion’s Role in Economic Growth and Human Capital in South Asia: An Econometric Approach. Sustainability 2021, 13, 4303. https://doi.org/10.3390/su13084303
AMA Style
Thathsarani U, Wei J, Samaraweera G. Financial Inclusion’s Role in Economic Growth and Human Capital in South Asia: An Econometric Approach. Sustainability. 2021; 13(8):4303. https://doi.org/10.3390/su13084303
Chicago/Turabian StyleThathsarani, US, Jianguo Wei, and GRSRC Samaraweera. 2021. "Financial Inclusion’s Role in Economic Growth and Human Capital in South Asia: An Econometric Approach" Sustainability 13, no. 8: 4303. https://doi.org/10.3390/su13084303
Note that from the first issue of 2016, this journal uses article numbers instead of page numbers. See further details here.