1. Introduction
The sustainable development of mankind should contribute to a free, fair, solidary, and tolerant society, ruled by the respect for nature and the human person, integrating, in all its activities, the foundations of AGENDA 2030 to achieve the Sustainable Development Goals (SDGs) [
1]. Higher Education Institutions (HEIs) are privileged environments for knowledge creation both through teaching and research processes. Complementarily, HEIs play a crucial role in the civic training of their audiences, so they assume a central part in Sustainable Development [
2,
3,
4]. As such, they must themselves be identified as models of sustainability [
5,
6,
7]. The sustainability implementation in HEIs does not only involve issues like the creation of green spaces and the requalification of leisure areas, or the strategy development to reduce the consumption of paper, plastic, energy, and water, or even the creation of programs to encourage recycling but also topics of utmost importance like the implementation of a set of additional actions aimed at the creation of a Smart Campus, by using the Internet of Things (IoT) concept as a practical tool to achieve the SDGs [
6,
7,
8].
What are known as ‘traditional learning environments’ are passing through a rapidly changing process to ‘digital learning environments’, a preliminary step before the Smart Campus [
3,
9,
10]. Digital Natives from our days care much more about their mobility and network connection to social networks and remote live classes rather than attending in-person to a class in a classroom or lab and studying from conventional notebooks or papers [
11,
12,
13]. This shift is changing the way how students of today learn, study, and live, and on how they seek these new experiences to meet their campus life expectations [
6,
7,
8].
A Smart Campus begins with a pervasive and trusted wired and wireless connectivity, both indoors and outdoors [
10,
13,
14,
15]. That’s the base, nevertheless, it is only the start of a Smart Campus. Strictly speaking, a Smart Campus ensures the secure connection of equipment and devices, apps, and persons to permit new experiences and utilities, and enhance operational effectiveness and efficiency [
12,
13]. Therefore, whenever all of the academic community, equipment, and devices, apps on-campus, exchange a communal technology infrastructure, they can hang together to make available a set of experiences and features that weren’t practical before [
10,
12,
13].
Additionally, by using Internet of Things (IoT) technologies, we ensure almost the total IP (Internet Protocol) convergence, allowing us to take advantage of the existing IP networks to communicate different types of data traffic such as voice, video, and data (IoT data included). This IP convergence enables cost-saving opportunities when it comes to the inclusion of IoT technologies on the campus, such as sensors, IP gateways, and other wireless access technologies, to monitor and control the campus infrastructures, such as lighting, power systems, air-conditioning systems, security surveillance, etc, and therefore perform optimized management of all available resources, which can improve the campus energy efficiency, reduce the waste production, and streamline the creation of a Smart & Sustainable Campus, where it is expected that everyday artifacts are connected, enhancing the availability and ubiquity of new “smart” services to foster sustainable development in the campus [
14,
15].
At this point, the campus becomes an ecosystem for innovation, due to the inclusion of IoT technologies, data becomes available at a low-cost and can be used to improve or create new services and operational efficiencies, that pave the way to a more sustainable campus.
In short, the advantages of a Smart Campus fit into three conceptual categories: Smart Learning, Smart Living, and Smart Safety and Security. All of them facilitate student’s integration and engagement which is critical to assist pupils to shift to academic life and help out to reach all the capabilities they need to thrive and be successful.
The combination of quantitative and qualitative demand for student facilities and services on-campus and lack of research funding from public or private sources is the main reason for higher education institutions to invest in efficient campus management, otherwise known as a smart campus. Using sensor technologies to measure space use in real-time, operational applications can be developed to improve the quality of the space but also collect information on utilization of spaces, user satisfaction, and energy consumption, supporting several campus management decisions such as building renovation, optimization of cleaning schedules, operating hours, and purchase of quantities in food facilities [
10]. With this information, four stakeholder perspectives are defined, through which added value can be measured: Strategic: improving quality of the place, enabling collaboration and innovation, supporting image and culture; Functional: increasing flexibility and user satisfaction, allowing user-friendly support to user activities; Financial: reducing costs and increasing revenues; and Physical, reducing footprint [
16].
This work introduces the conceptual approach of Application-oriented Architecture-AoA. AoA has been designed to streamline the design and development of “smart” solutions inside the campus, by focusing on the Application side and reshaping the classic concept of “service” to a piece of “functionality”. Each piece of functionality—e.g., an Application—has a clear and objective purpose. AoA provides mechanisms to have multiple applications interacting and sharing data and functionalities, ensuring coexistence between new and legacy systems. This work presents two main contributions: (1) a conceptual AoA model; and (2) the systematization of the procedure to create a new application is tested using three case studies (RnMonitor, Refill_H2O, and BiRa).
The remainder of this document is organized as follows:
Section 2 presents related works with a focus on the identification of architectures and technologies that have been used to put forward successful smart campus implementations;
Section 3 introduces the main architectural styles that can be followed in software design and relates its use in the context of the smart campus application case;
Section 4 presents the AoA conceptual approach, describes generic AoA model and puts forward a systematization of the procedure to create a new application;
Section 5 presents three case studies that have been instantiated using AoA;
Section 6 elaborates a discussion with a focus on the benefits of the proposed AoA; lastly in
Section 7 the conclusions are presented along with the future work.
2. Related Works
In this section, a review most relevant related works regarding Smart Campus architectures is presented. The focus of this section is to address current approaches in contrast with retrospective implementations and offer new perspectives and point out priorities for future investigation and research. The research approach was based on two stages. The first stage was based on the manual screening and consequent selection of works more focused on conceptual and architectural smart campus representations using the query “smart campus” OR “smartcampus” in the search field “Keywords” in two databases, DOAJ (Directory of Open Access Databases) and IEEE Xplore. The second stage focused on an overview of other relevant FIWARE-based applications and did not include a comprehensive searching. Instead, the works that have been addressed were selected by proximity to the topic under study.
2.1. Smart University of Málaga
Smart University of Málaga (UMA) has the main view of applying Smart-City concept into a smaller scale, imposing the University of Málaga as the global reference in environmental sustainability, not using a huge investment but evolving to become progressively “smarter”, providing an urban-lab for associated approaches, generating new lines of teaching, researching, and innovation. With the use of a Smart Campus, there is an expectation of talented students and researchers, who will encourage inter-disciplinary research, offer new courses and degrees related to the Smart Cities domain.
Figure 1 depicts the UMA smart campus architecture. UMA displays a layered architecture based on 5 layers.
On the top layer, sensors, actuators, and devices are deployed, allowing the measurement of several parameters, such as electricity, water, fire, irrigation, radiation, parking, and gases. These devices communicate using the UMA campus WiFi, Zigbee, and LoRaWAN radio access technology networks to have data stored and managed by FIWARE (that will be addressed in
Section 2.10, which offers a flexible approach for the development of new add-ons and features, which makes it possible to merge data from various devices, accepting all kinds of existing connectivity. Lastly, all the collected data is displayed for the analysis, research, and learning members of the UMA, allowing also the usage of Open Data. With the use of FIWARE, the monitoring of IoT devices deployed on the campus is centralized [
17].
2.2. University of West Bohemia (UWB)
The University of West Bohemia (UWB) has been developing projects around the idea of a Smart Campus, cf.
Figure 2, a model of a city with testbeds for smart technologies, such as the development of new IoT Edge Devices, which communicate via LoRaWAN networks, a wireless modulation utilized to create long-range communications, which has a chirp spread spectrum, maintaining low power characteristics but with an increased communication range [
18], around the 9 faculties of the campus. SmartCAMPUS UWB project integrates all new applications and projects using an app-oriented architecture as a common application back-end service, allowing an easier and faster product and project development on the campus. Some of the main core applications that are already integrated into the campus are in the domains of the Environment, detecting and measuring temperature and humidity; applications in the Cloud, which collects and evaluates information from implemented systems; Parking, which manages car parking with IoT devices; Virtual classroom, a virtual reality simulator for student teaching, allowing the simulation of test situations that can happen in a real class. More applications are being developed in the SmartCAMPUS UWB and can be found in [
19].
2.3. University of Jyvaskyla Kokkola
The University of Jyvaskyla Kokkola, Finland as created the CiNetCampus environment project aiming at an environment that enables high-quality, flexible, and effective studying for the traditional classroom classes and online, focusing on improving the requisites of studying in a virtual environment, offering solutions for video distributing to students, enabling interaction in connection with learning and offering a bidirectional video conference. The CiNetCampus is built on top of the video content management system (VCMS), consisted of multiple applications that are playing a role in the implementation of teaching, but looking like one single system. The VCMS is a platform designed for diverse applications, implemented as separate software modules but managing different functions of the environment. As a module-based structure, it eases the implementation of new functionalities to the environment as needed. The existing applications integrated into the system include Text-Chat module, Video-Chat module, Lecturer’s View, Learning Style, Participation Data, Video Segmentation, and other modules used to control quality [
21].
2.4. Arizona State University
Smart Campus, Cities and Regions (Smart CCR) IoT is a testbed based on modernizing blue light safety poles, BlueLight IoT, across Arizona State University. Each pole contains a smart device that is connected to a wide range of sensors, such as environment monitoring, motion, and sound detection, carbon dioxide, cameras, etc. This system is built around the combination of edge and cloud computing, to handle large amounts of collected data. These pole modules contain a standardized interface that can collect data from multiple sensors, having a distributed data processing framework that handles large-scale data analytic applications, such as video surveillance systems to track an entity. Users can subscribe and retrieve data, using the provided and standardized interface [
22].
2.5. Nati et al.
A Smart Campus testbed is described in [
23] with the main starting objective of building an experimental facility that allows users to test several IoT technologies in a real-world setting, which will grow into a Smart Campus, covering indoor and outdoor environments. One of the key points of the infrastructure was the support of rapid experimentation and prototyping cycles for several IoT techniques and smart building solutions, promoting flexibility of the testbed on several demands of experiments. The architecture is divided into three tiers, Server: hosting back-end functionalities and providing an entry-point, Gateway: forming the testbed infrastructure allowing the final tier, IoT, a user-centric component to merge IoT sensor nodes that are reachable and connected to the network, via WiFi or Ethernet.
2.6. FI-STAR FP7
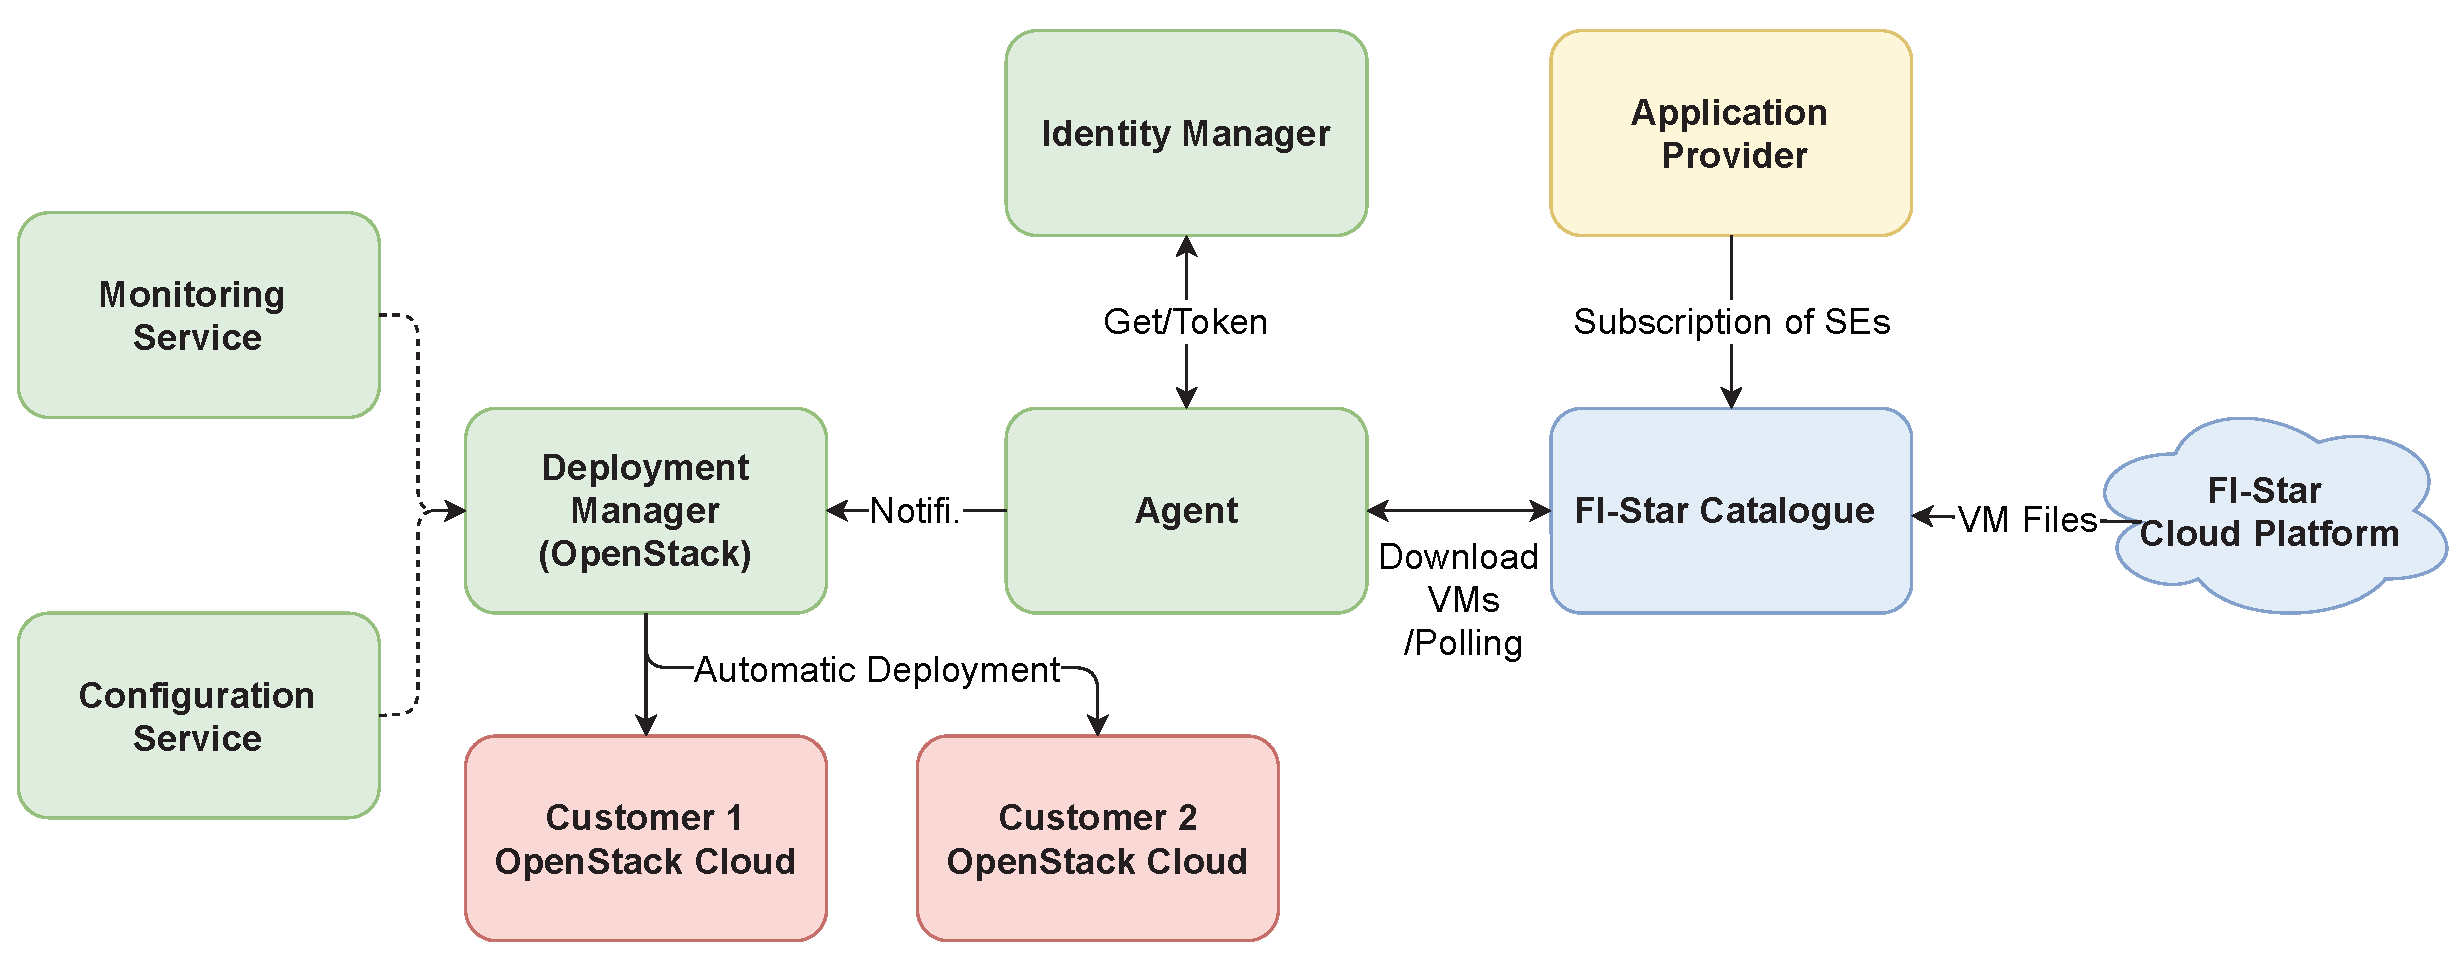
FI-STAR FP7 application is an automatic migration and deployment of cloud services for the healthcare area, involving the utilization of cloud services to monitor patients, offering a set of software modules that are executed and managed automatically, to allow flexible developments of healthcare applications. One of the key concepts of the project is the suppression of healthcare restrictions since patient data is normally confidential and restricted, a restriction which is mainly responsible for the minimal usage of cloud technology, where the providing offers services using the public cloud and the consumer using the private cloud, achieving maximum security over the data transfer. The main solution of this project includes features such as the deployment that can be executed by both customers or trusted external platform provider, specification of client preferences, the option to choose if the automation includes downloading or deployment, and checking the subscription status to trigger an automatic download and the consideration of a certain customer configuration before redeploying [
24]. The FI-Star application components are demonstrated in
Figure 3.
2.7. RnMonitor
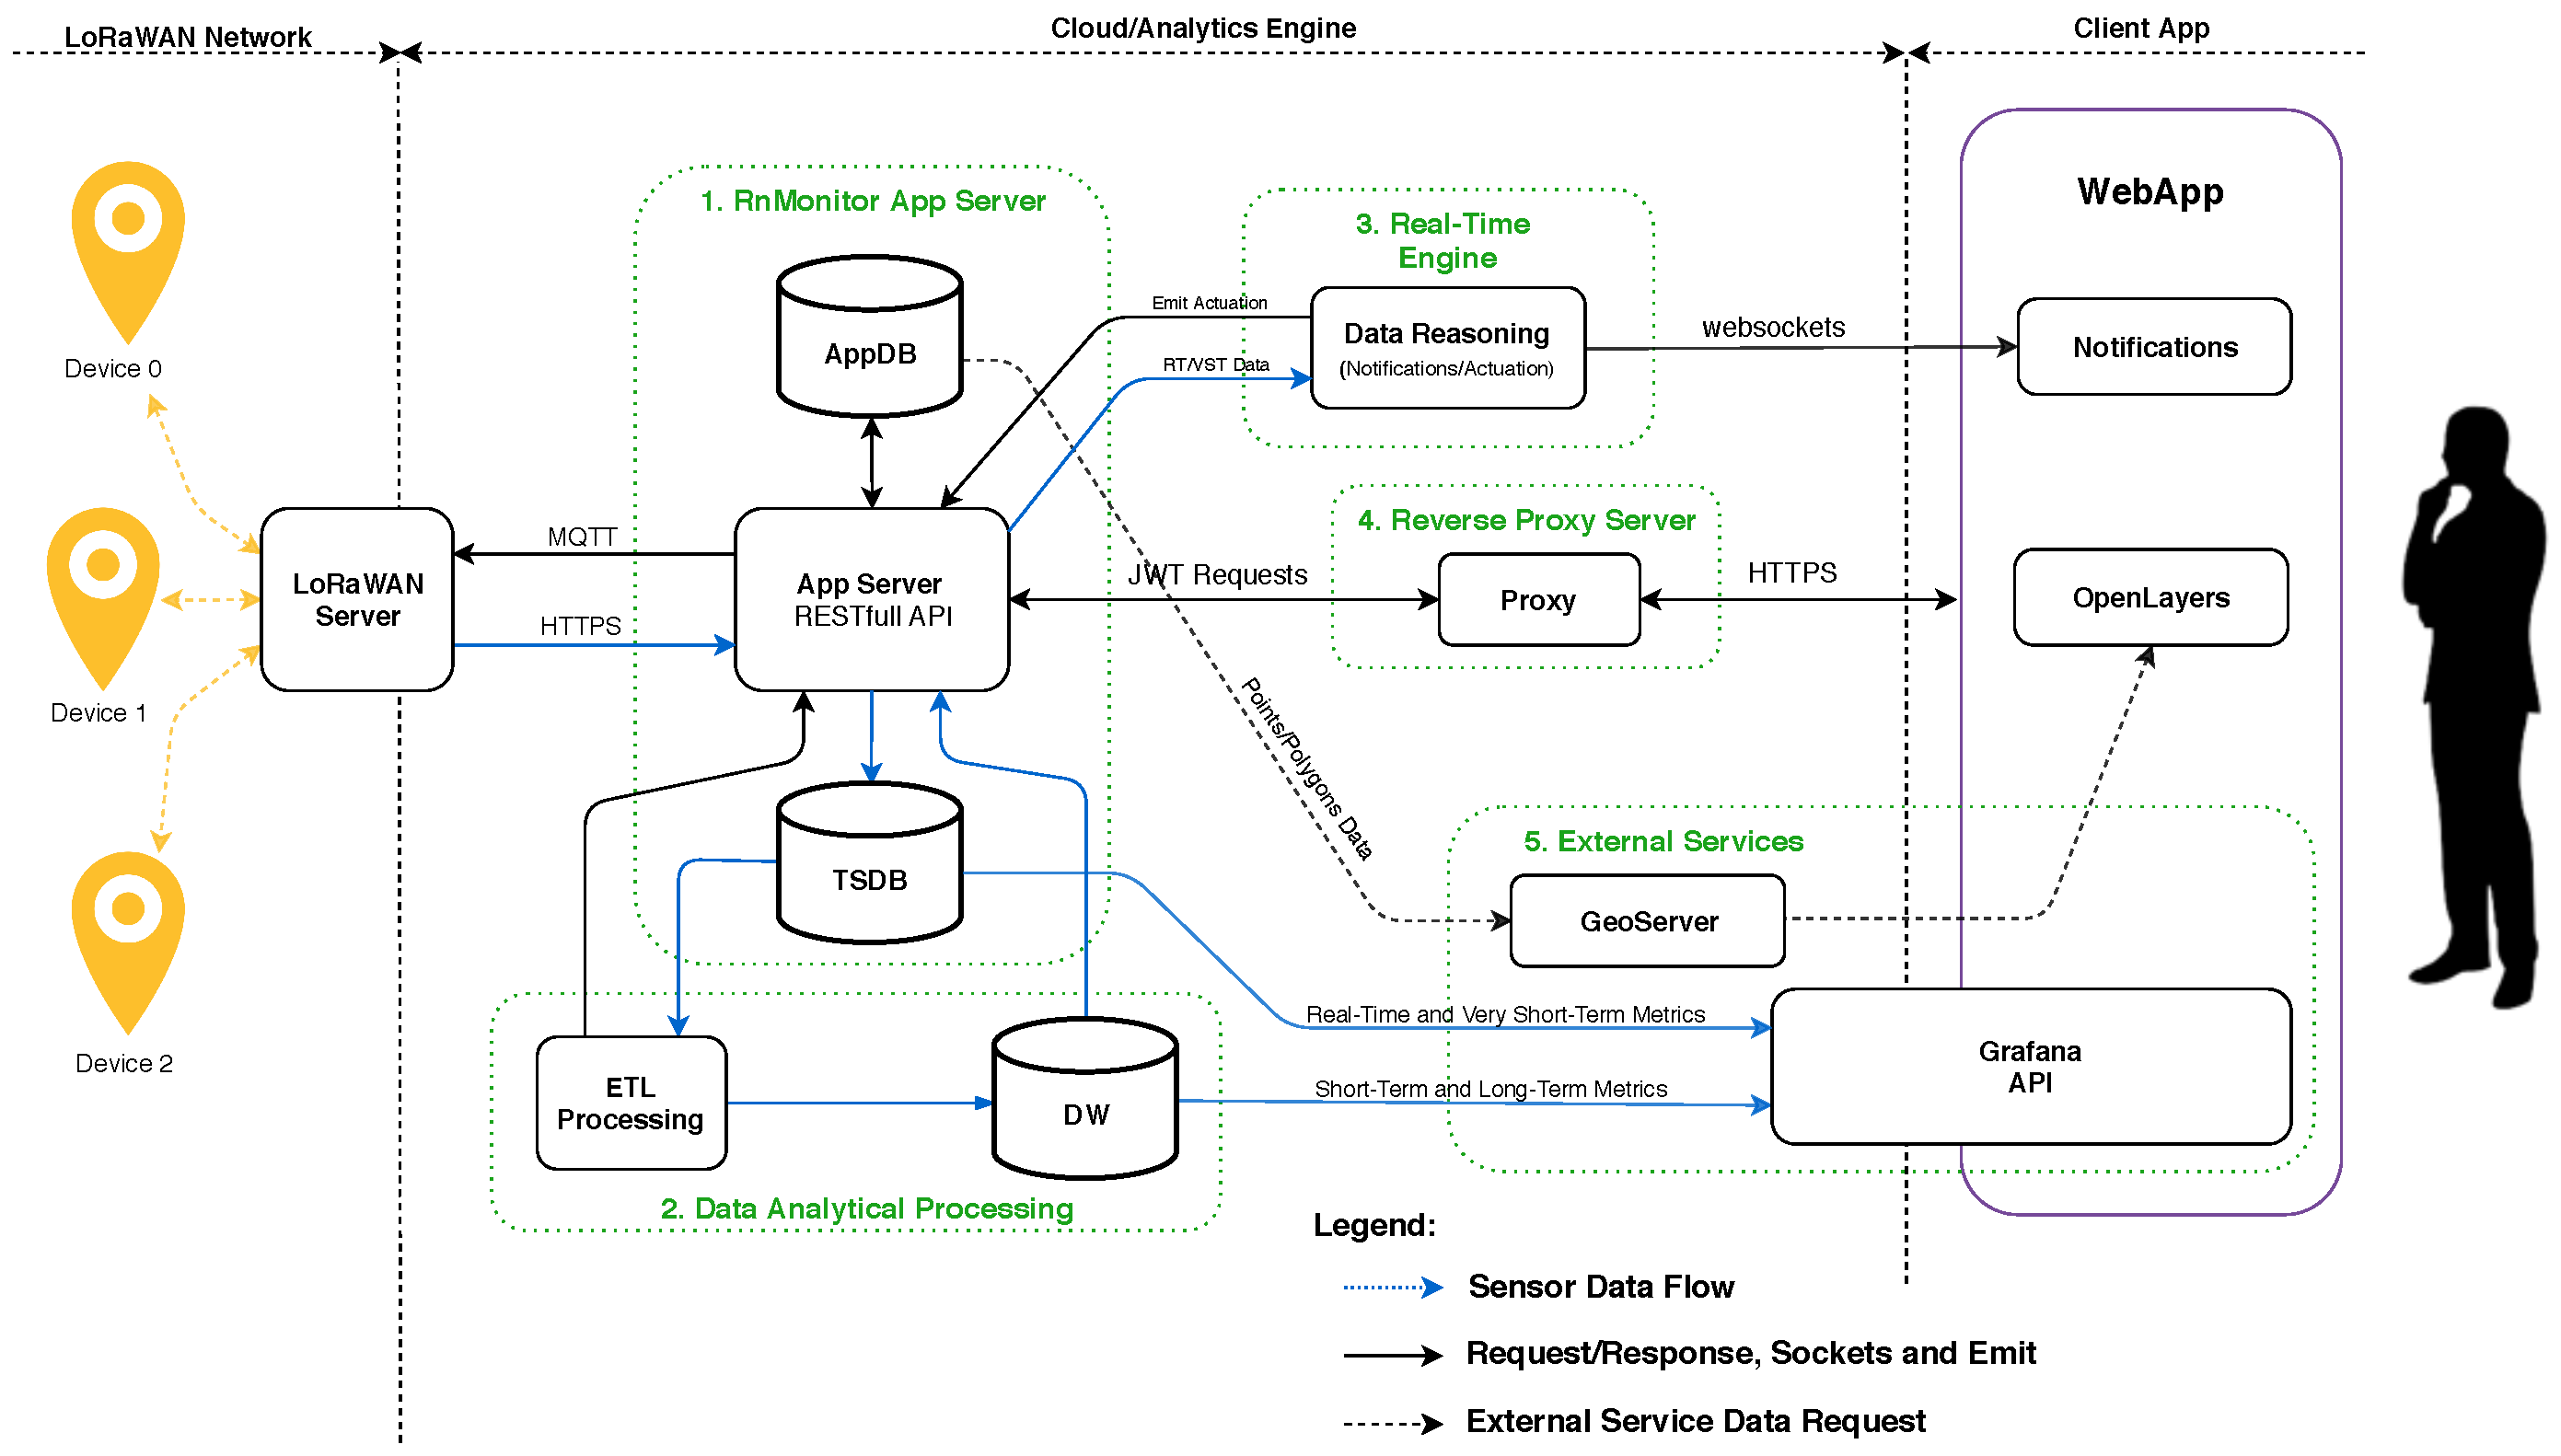
The legacy RnMonitor system’s conceptual design is depicted in
Figure 4, composed of three main blocks: (1) IoT Edge Devices and LoRaWAN Network; (2) Cloud/Analytic Engine, and (3) Client App, which will be described in depth.
As referred in [
25], the application takes advantage of several IoT Edge Devices installed in several rooms of distinct buildings that measure relevant indoor air quality parameters, such as radon gas concentration, relative humidity, atmospheric pressure, temperature, and carbon dioxide, which include long-range and low power connectivity by using the LoRaWAN communications technology.
The first step on the development of the RnMonitor application, using a monolithic architecture, was the discussion of the requirements, to develop the services to be used in the cloud/analytics engine, the block that is responsible for the storage and management of the data collected by the IoT Edge Devices. As depicted in
Figure 4, the entry point of the IoT Edge Devices collected data is the AppServer, a NodeJS RESTful API designed to work for storing and managing two data types: application relational data and IoT collected data. To store the application relational data, a MongoDB database was implemented, providing a document-based, distributed database built for modern applications, which contains a “2dsphere” index, allowing the usage of spatial queries. Directly connected to the MongoDB, GIS services are available with the usage of Geoserver [
25].
On the other hand, a time-series database was installed in the server, to store and manage the data collected by the IoT Devices after decoding from Base64 to directly connect to a Grafana as-a-service, a user-friendly open-source dashboard technology. More information about the cloud/analytics engine can be found in [
26].
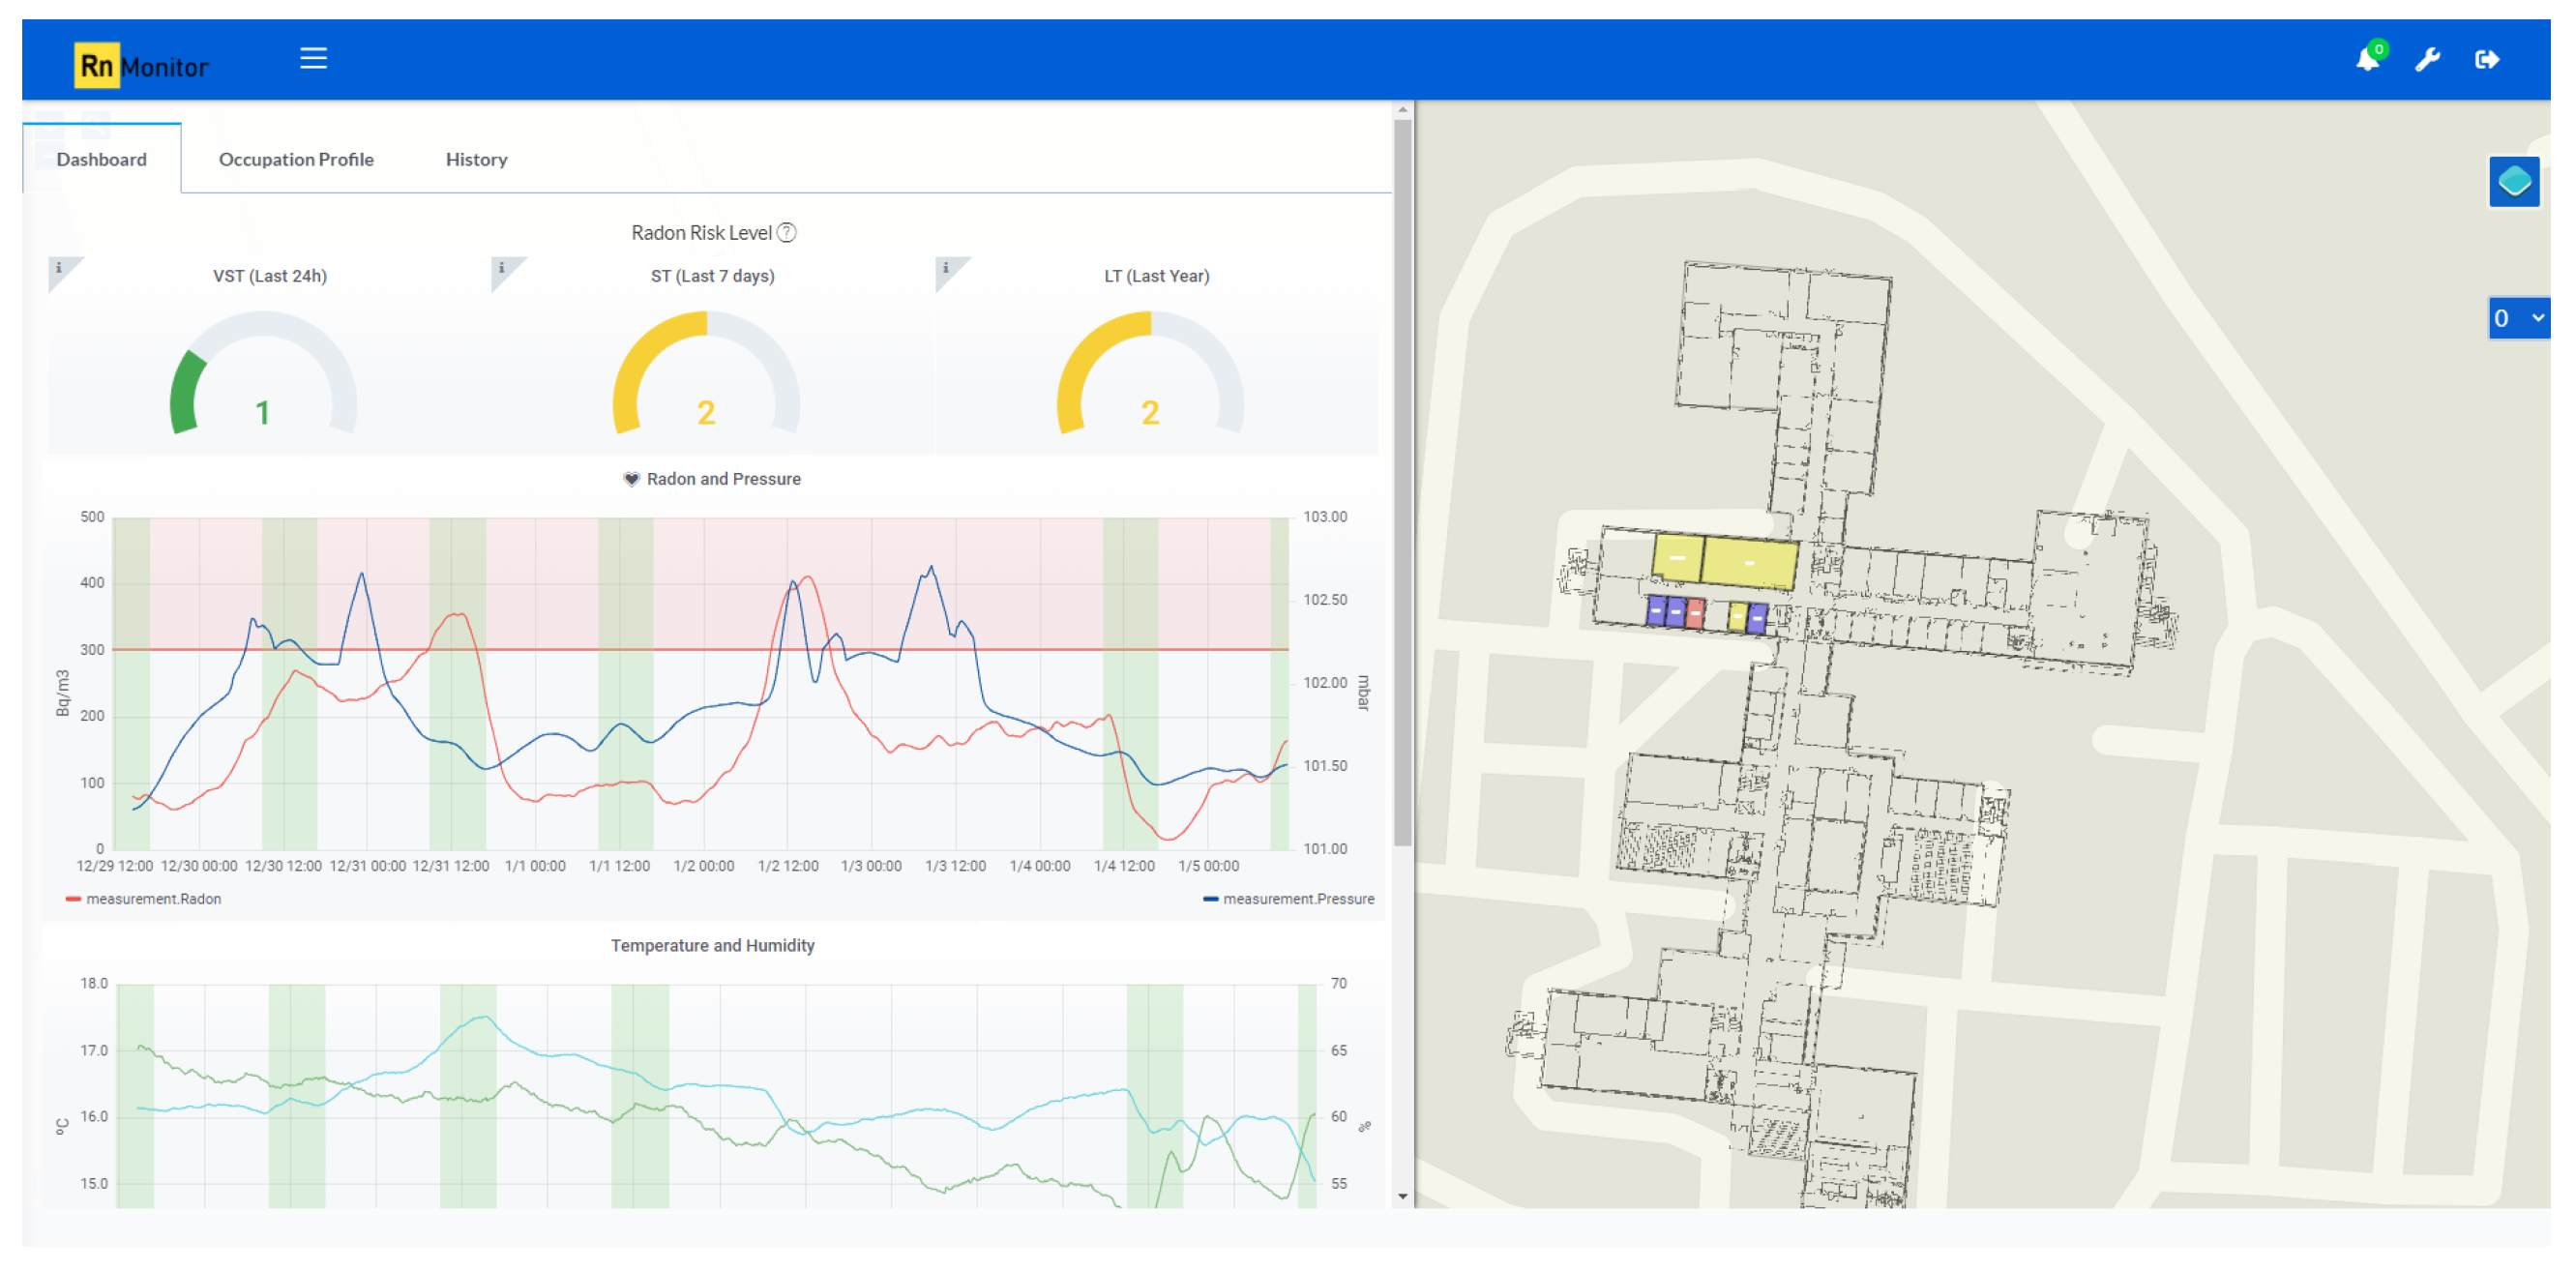
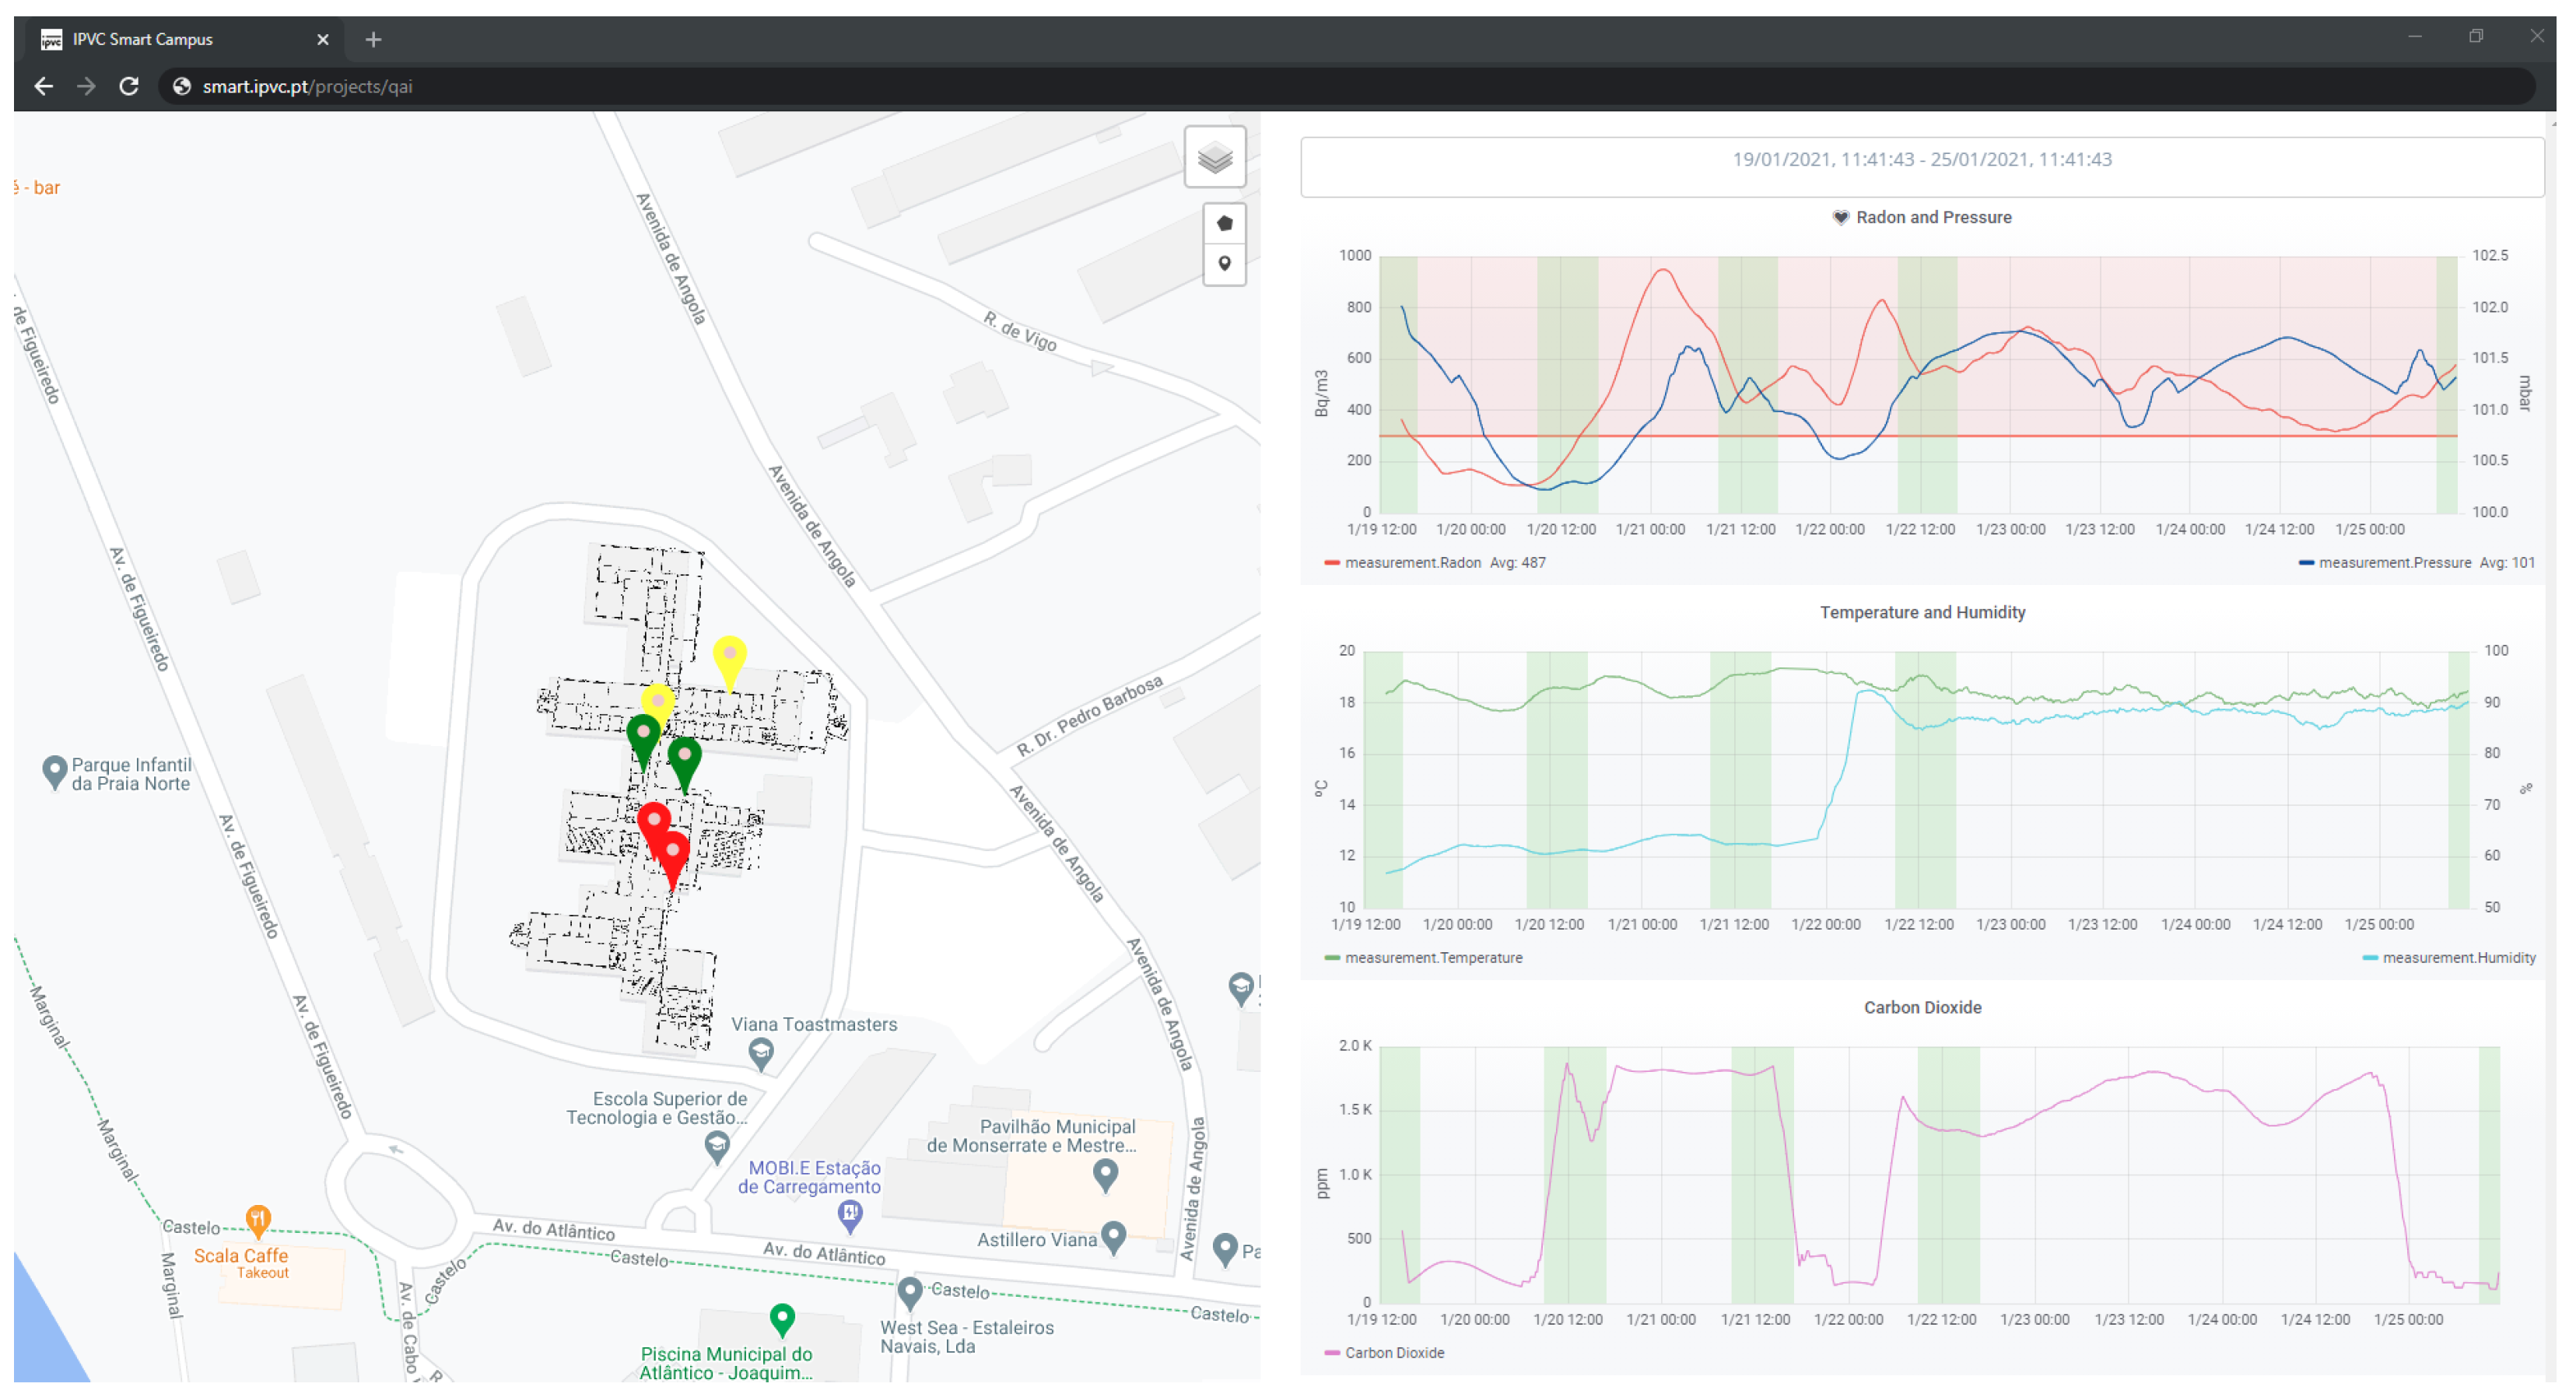
Figure 5 displays the map-centered front-end interface, containing two features defined as layers-Sensors and Polygons, that is represented by the color associated with the Radon Risk Indicator, colors which range from Green-Safe to Yellow-Warning, Orange-Alert or Red-Critical, triggering notifications via sockets to the device responsible and/or owner [
25].
2.8. Montegancedo SmartCampus
The Polytechnic University of Madrid has three buildings that are very far apart geographically. This particularity, contemplated with a large amount of information for the university’s functioning, makes information management complicated and difficult. To solve this problem, the Smart Campus idea was created, derived from the concept of the Smart City, to create applications for Spatial Data Infrastructures, Internet of Things, Cloud Computing, Big Data, and Automation. Thus, a Spatial Data Infrastructure was created to control, manage, update and analyze all the information collected by sensors, in a geographic way, displaying the data through dashboards and web map services. The creation of the Smart Campus makes it possible to satisfy the needs of the facilities, enabling the automation of the usual functioning of services and buildings.
2.9. IISc Smart Campus
The IISc Smart Campus presents a project that is being developed by the Indian Institute of Science. This “living laboratory” offers a platform to try and test several IoT technologies and Smart City services, with a testbed of around 10,000 students, faculty, staff, and resident members. The Smart Campus aims to support several vertical utilities, such as smart power, water, and transportation management, with smart water management as the initial domain of the validation. The Smart Campus is architectured as layered, having on the bottom level the sensors and actuators, collecting real-time observations on the state of the water distribution network within the campus, followed by the networking and communication layer which is required to transport data from the sensors to the data platform or trigger the actuators based on control decisions, the data acquisition, and management which allows several data analytics and visualization that help with a manual and fast automated decision-making about the water domain and the IoT fabric management, allowing a faster and better data management and lastly, decision-making, reducing the number of possible malfunctions.
2.10. Other Relevant FIWARE-Based Approaches
FIWARE is an open-source integration platform created to ease and simplify the development of smart solutions in several application domains, such as Cities, Industry, AgriFood, and Energy [
27]. FIWARE combines reusable components, named Generic Enablers (GE), that can be seen as available and ready complementary components to be used with the Orion Context Broker, i.e., the FIWARE architecture central element, which is responsible for: (1) interfacing with the IoT device and other physical third-party systems (e.g., robots, programmable logic controllers); (2) context Data/API management, publication, and monetization; (3) Processing, analysis, and visualization of contextualized information. Additionally, a set of tools that ease the deployment and the configuration of FIWARE and other third-party components are also available as open-source [
27].
2.10.1. IDS Association Reference Model
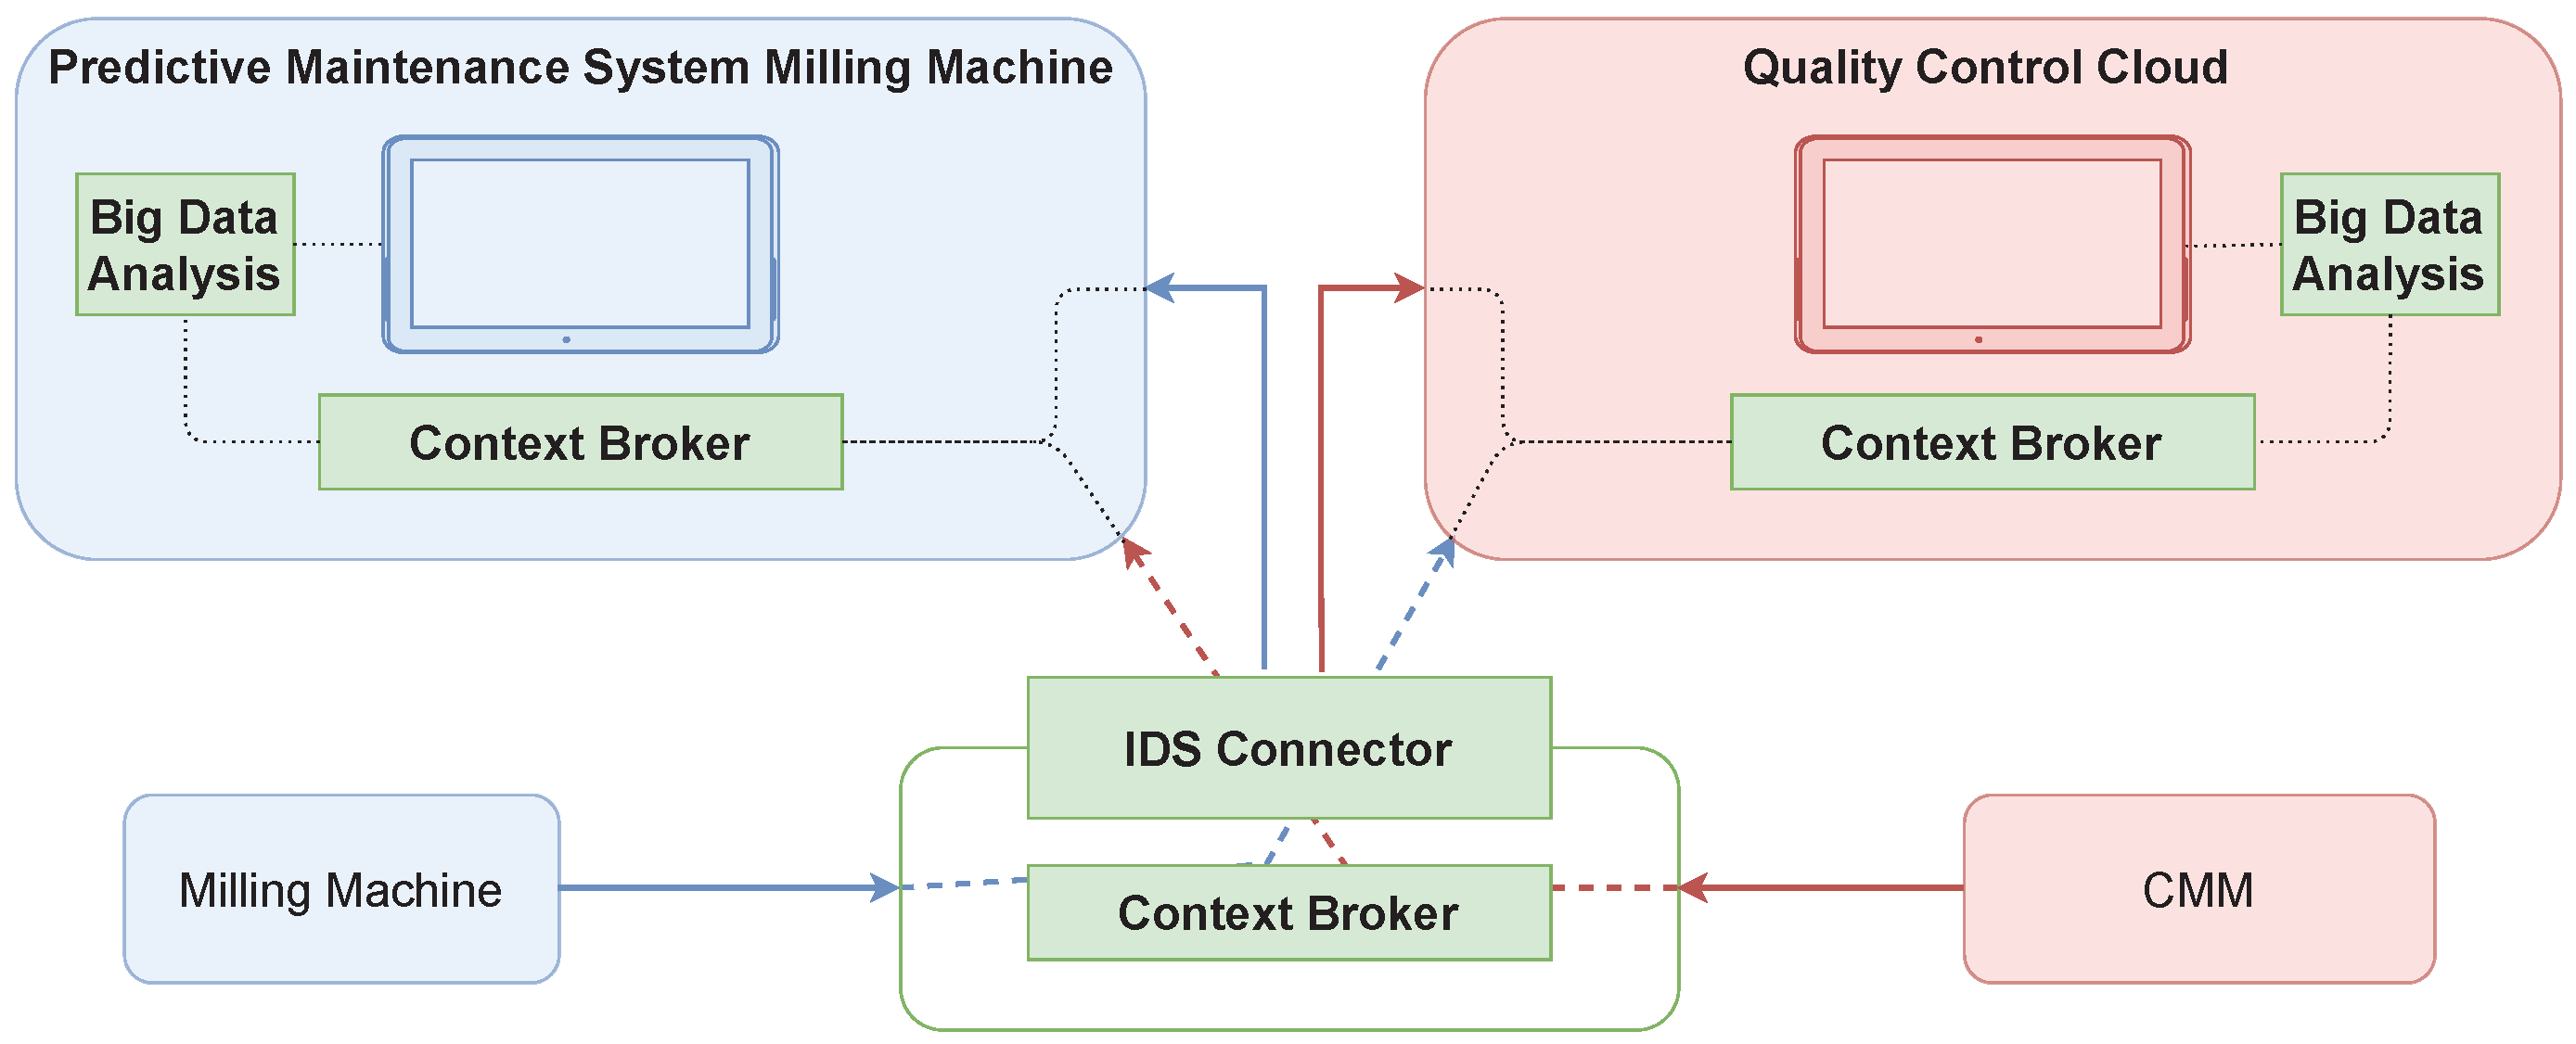
Since a new digital evolution of the IoT will change services and infrastructures with connected sensors around cities that affect the daily life and activities of the people. The Industrial Data Spaces (IDS) Association, as referred in [
28], created a Reference Architecture model that is aiming to provide a common structure for the design and deployment of Industry IoT infrastructures, based on FIWARE Generic Enablers, as illustrated in
Figure 6, validating the architecture by testing it in the real industry use case scenarios, to improve the maintenance and quality control of milling machines.
2.10.2. Takamatsu City’s Smart System
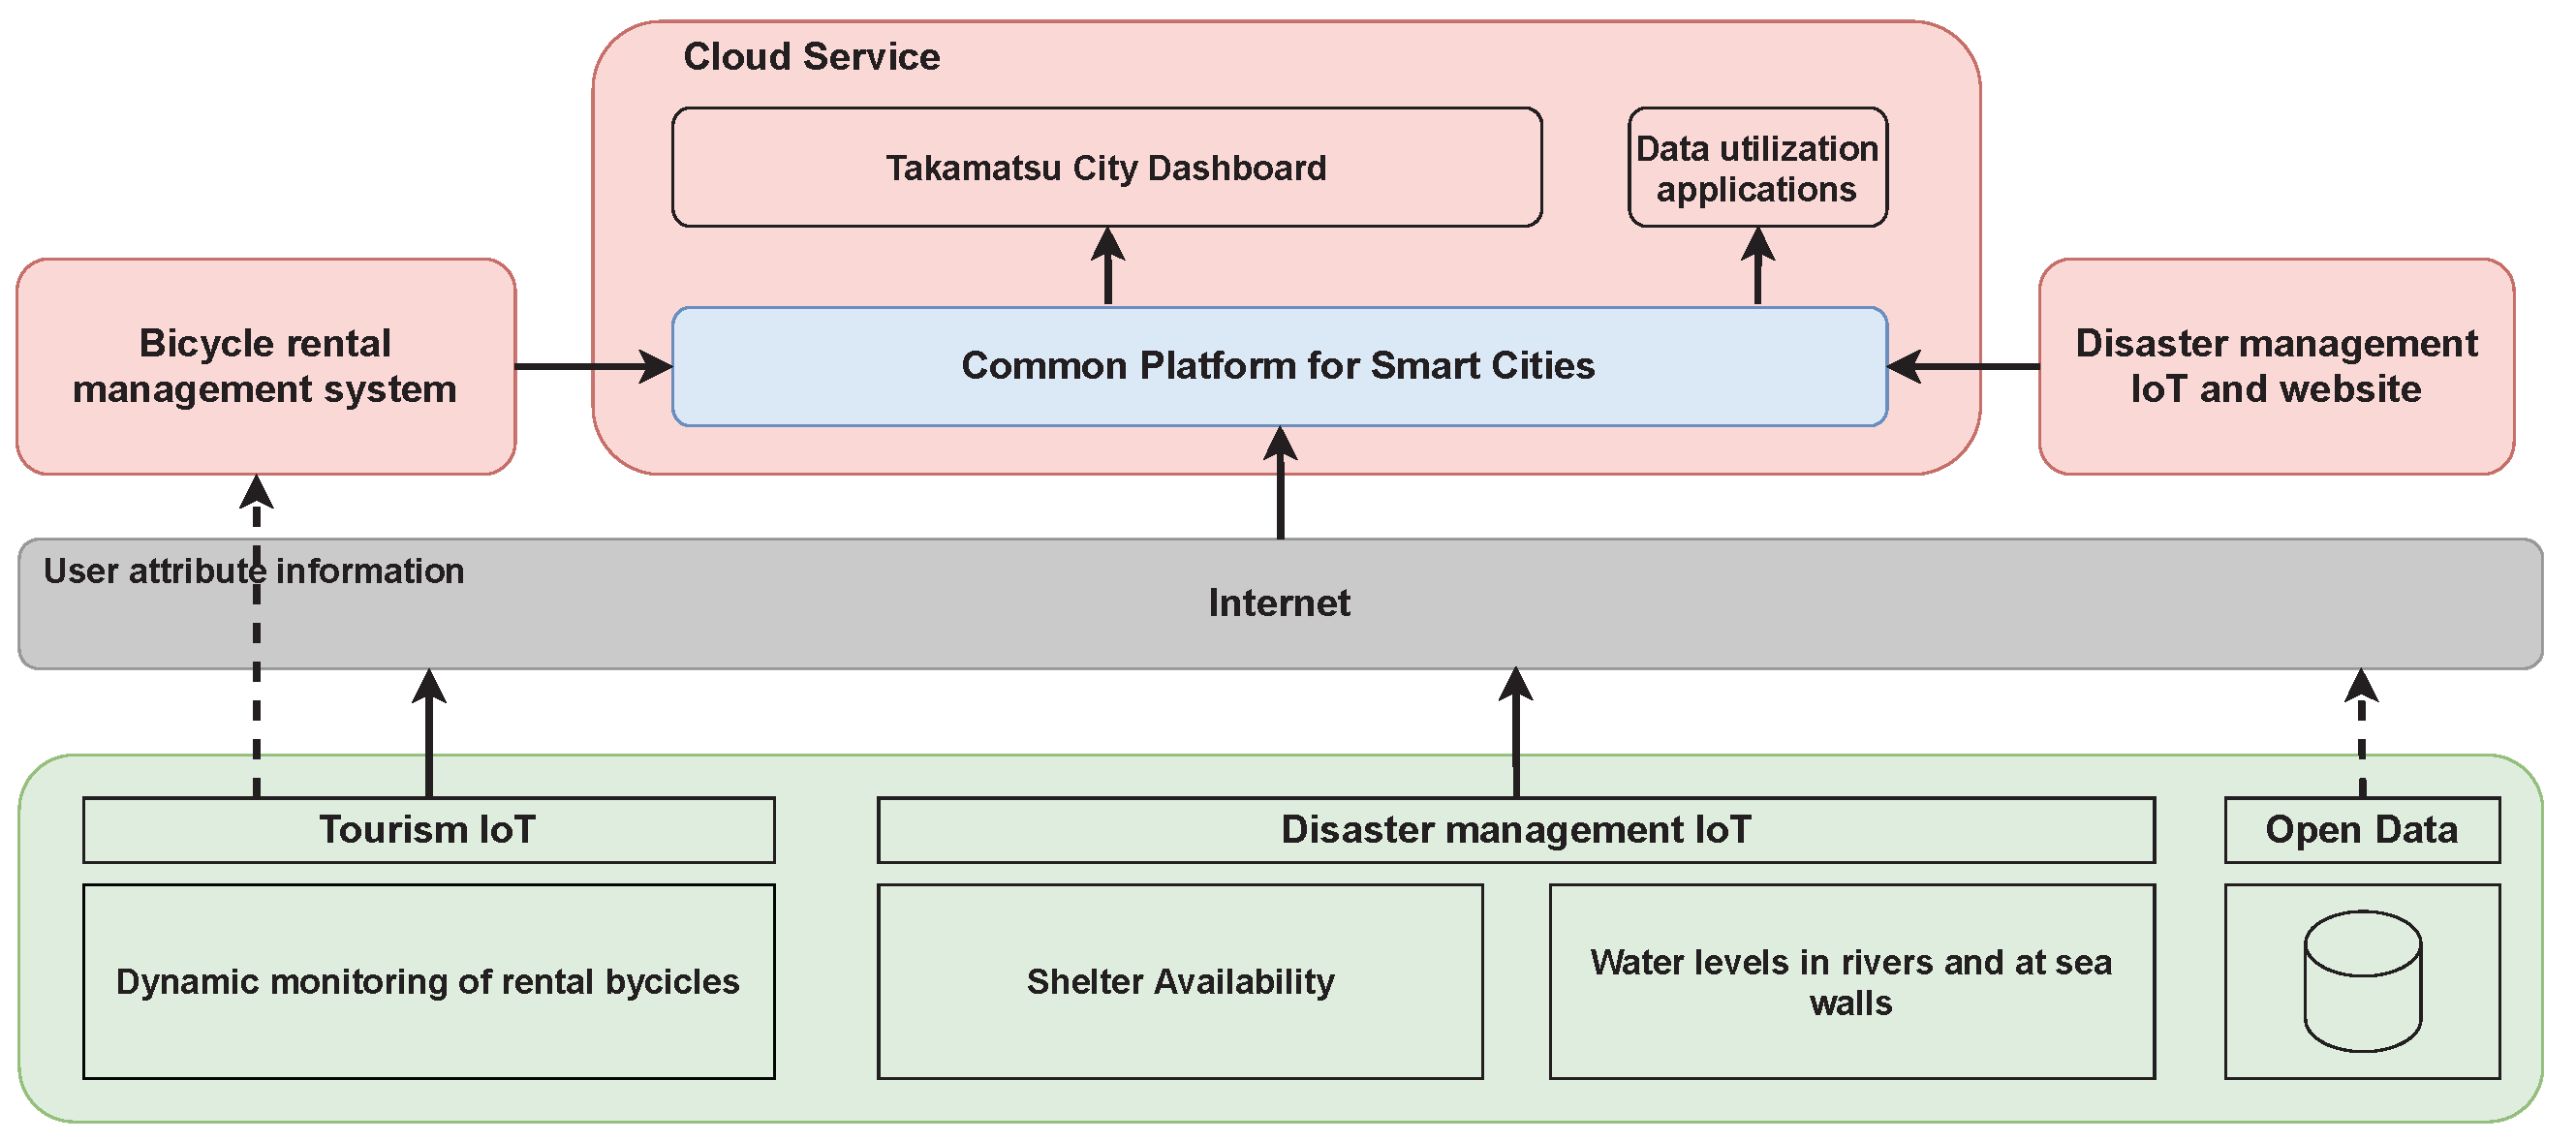
Takamatsu City, Kagawa Prefecture, was the first in Japan to adopt the FIWARE platform, cf.
Figure 7, in leveraging the power of IoT technologies and open APIs to collect, store and analyze data related to issues of the city, such as disaster management, revitalization of communities, improvement of safety and tourism, offering local governments and area developers a “Data Utilization Platform Service”, a security-enhanced service for smart cities using FIWARE. Flooding and shelter availability are two key issues on disaster management, having IoT devices collecting water and tide levels, as well as rainfall amount, data that is processed by FIWARE to evaluate the risk of flooding and sensors collecting power usage on shelters, that will determine whether or not more shelters need to be opened. Bicycle usage data is also one of the key points of Takamatsu City FIWARE approach, gathering GPS log data of rental bicycles, analyzing points of departure, destinations, and travel routes [
29].
2.10.3. E-Health for Remote Patient Monitoring
A healthcare project was researched by Fazio et al. [
30], which provides a software architecture to describe how an intelligent cloud platform can speed up the design of a real e-health Remote Patient Monitoring (RPM) architecture featuring an agile software development methodology, improving the patients’ remote assistance, optimizing the workflow of the health-related staff, such as doctors, physicians, medical assistants, and other operators. Taking part in remote monitoring technologies and communications, a reduction of medical help and efficient detection of accidents and risks is granted. The RPM system consists of four components, such as devices, which include sensors and measurement systems, telecommunications, allowing data transfer from the devices to the platform, data management system, which stores, processes and obtains the data from the patients, and the application software, via web or smartphone app, which helps the overall application users.
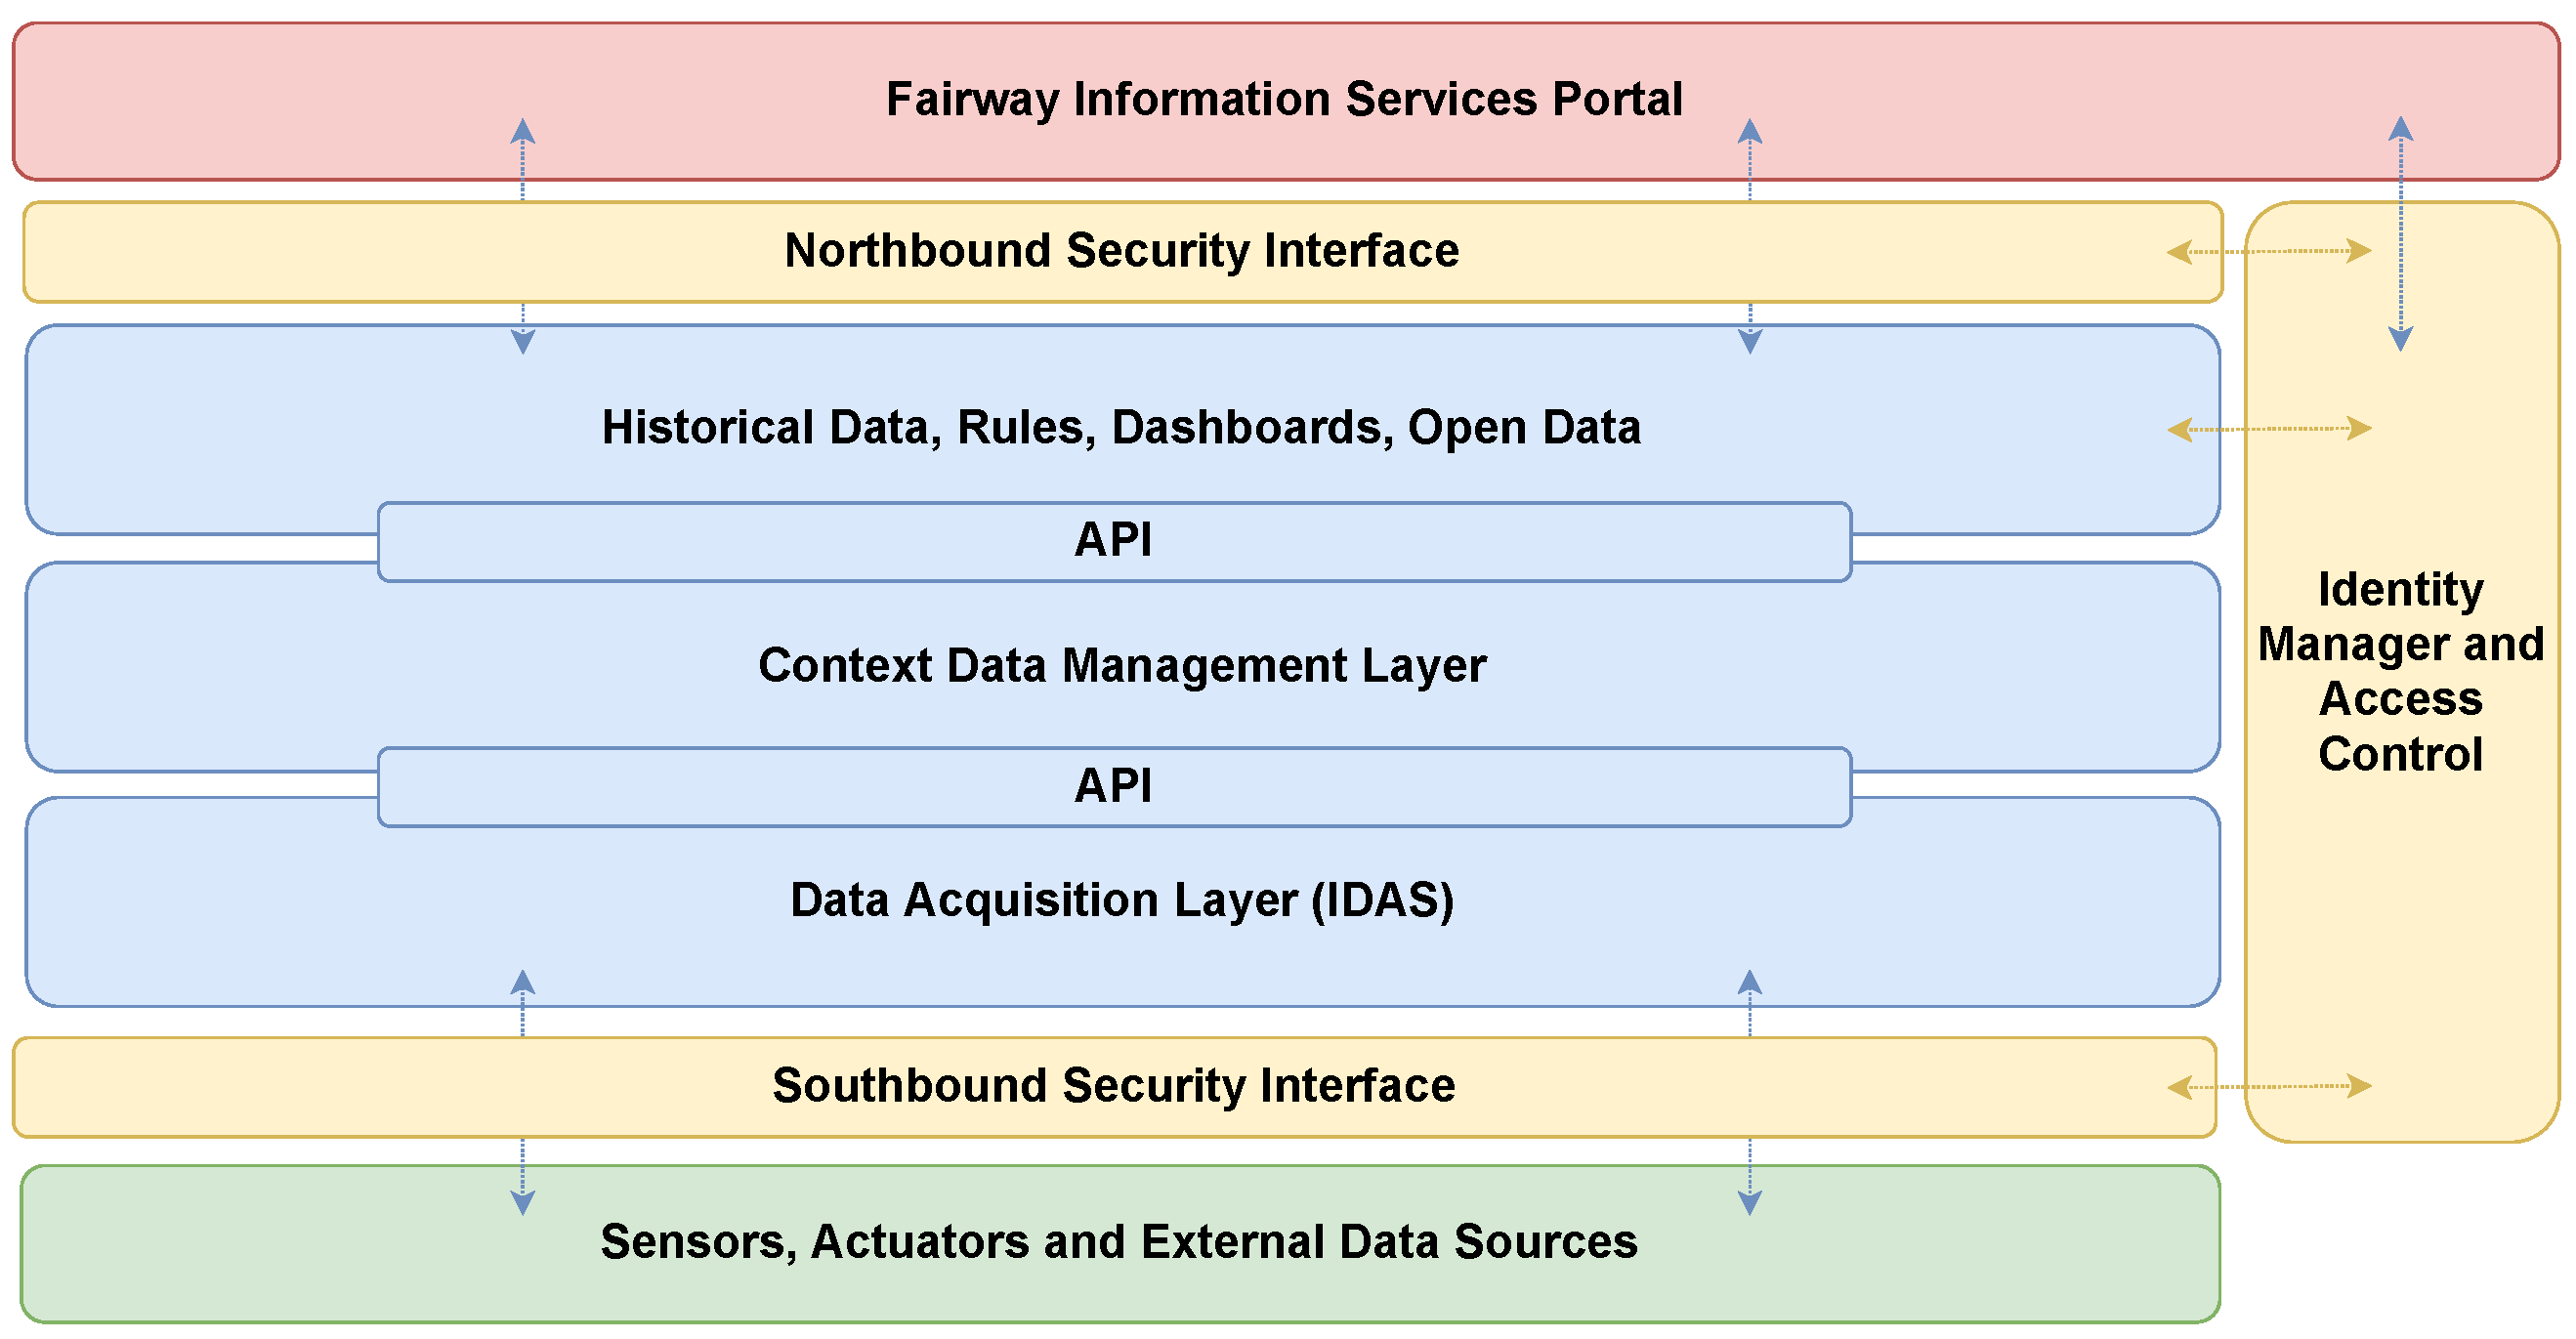
2.10.4. Advanced Implementation of River Information Services
To control, store and optimize the use of the Guadalquivir river tidal window, the River Information Services (RIS) developed an advanced implementation project, improving the overall performance by exchanging data in real-time between both internal and external sources, enabling interoperability between all services, providing security and data store and management. The collected data is displayed in a web portal, presenting dashboards of real-time, prediction, and historic data, allowing the visualization of the depth of the channel, offering information to the skippers, provide notifications of obstacles and difficult conditions and maneuver the ships with high precision data [
31]. The system architecture is depicted in
Figure 8.
2.11. Discussion
As evidenced in the related works presented before, several works have the approach of deploying and managing IoT-based systems to provide new and autonomous “smart” services.
Table 1 compares the presented works based on the four key criteria previously introduced:
As it can be observed, the majority of the researches are focused on the development and deployment of architecture or in the design of a secure and interoperable scenario, being able to communicate and share allowed data with other applications. On the other hand, the IPVC Smart & Sustainable Campus (IPVC-S2C) main objective is to provide a common architecture model to deploy highly secure and scalable IoT applications, providing an easy and on-the-fly integration of all the legacy or new application requirement components.
3. Software Architectures & Design
Software architectures provide developers a level of abstraction that enables them to focus on components, their roles, and interconnecting interfaces, instead of “code” itself. Software architecture is not operational software, but rather a representation that enables a software engineer to analyze the effectiveness of the system design in meeting the stated requirements, consider architectural alternatives at a stage when it is easy and cheap to make design changes, and reducing the risks associated with software construction [
37].
Any architectural representation makes use of “software components” to describe the system organization. These components can be as simple as a program module, a database, or a middleware component, but the level of abstraction at which components are defined may be higher, focusing on system functionality. Whatever the abstraction level is, architectural design, besides describing the system’s components and the way they interact with each other, addresses how the described architecture achieves non-functional requirements for performance, reliability, security, and others.
A system’s architectural design may be drawn based on architectural styles or patterns that have proved to be the best architectural solution for a set of known problems. The main architectural styles are [
37]:
Monolithic: single application component containing all the application’s functionality, and mixing components’ roles like data persistence, business logic, or user interface, e.g., [
26,
38];
Layered (or N-tier) architecture: several application components organized in role-based layers, e.g., [
17,
28,
30]. Typically, the top layer includes only components that deal with the user interface and the bottom layer has the components that deal with data persistence, one or several middle layers or tiers deal with the business logic at different levels of abstraction. A major characteristic of the layered architecture is that components at one layer depend only on components of the layer below them.
Event-driven: based on functions initiated by the capture of events, rather than as a response to a function request, e.g., [
39,
40].
Services-oriented architecture: components are implemented as services or exhibit a services API, through which other components may interact for realizing the application business logic. Services may be provided by the same component and built around the same data model and storage or each service may be provided in a different component with its data model and storage. In the first case, we are before a Service-oriented Architecture (SoA) style, and in the second, we are before a microservices architecture style, e.g., [
21,
23,
24].
Other architectural styles exist, and a given application may exhibit characteristics of several of the architectural styles.
A good design should be able to reuse architectural building blocks. Reuse is a long-time idea, also in software engineering. Software Engineers and developers have long reused ideas and abstractions in an ad hoc manner. There is a more organized approach to artifact reuse in software, known as Component-based software engineering (CBSE), which emphasizes software design and construction using reusable software components [
41]. Components, in this context, are defined at a very concrete (non-conceptual/non-abstract) level, corresponding to operational software, with a formally defined program interface, with specific input and output parameter types, and a very well-defined behavior. These reusable components may be assembled with other reusable or newly-made tangible operational software components to obtain a system function directly mappable to functional requirements. “CBSE shifts the emphasis from programming software to composing software systems” [
41].
CBSE involves a process that, in the architectural design phase, after establishing the set of requirements for the system being built and modeling those requirements as a functional system model, software engineers try to determine which requirements are prone to be directly mapped to existing components. This enables components reuse and composition. The development phase is mainly based on the composition of components, rather than construction. Only components with new functionality, or functionality that could not be aggregated into existing components, need to be developed from scratch [
41,
42]. Needed existing components may be acquired from components’ repositories, as off-the-shelf components. CBSE full potential is only achievable through proper tool support. One that enables component search, comparison, composition, and construction/adaptation.
In the context of a smart campus, aimed at supporting a set of projects for the internet of things (IoT), and backing up higher education in the fields of software development and engineering, and of electronics, embedded systems, and communications, CBSE may come in another flavor. The goals, in this setting, are:
For students majoring in electronics, embedded systems, and communications, to be able to build applications by composing components of functionality (applicational components) with components that abstract deployed sensors and actuators.
For students majoring in software engineering and development, to be able to build applications by composing existing applicational components with other components that they build, and with components that abstract deployed sensors and actuators.
To streamline IoT-based applications’ construction, in this setting, we need a platform that provides the tools for components reuse, by offering a components repository and a way of composing applications through these applicational components.
By elevating the abstraction level of the provided components to a level close to what can be found in low-code platforms, such as outSystems or Mendix, IoT-based applications’ development may be streamlined by enabling electronic’s students to focus on the cyber-physical components, and generate, after components’ composition, applications that interact with them. And, enabling software engineering’s students to focus on software design and development, interacting with sensors and actuators through a standard services API.
For the developers that don’t want to delve into the code, the architectural style used is component-based, with each component being a functional part of the application. We called this an Application-oriented Architecture-AoA. The AoA is component-based at the developer level and hides from him, other architectural styles used beneath the platform provided tools. This is further explained in the next section.
4. Application-Oriented Architecture—A Conceptual Approach
The concept of AoA is based on CBSE, as seen in the previous section, and its components’ repository is inspired by the app stores (e.g., Apple’s AppStore, Android’s Play store) from the mobile world, where applications in the app store may be used standalone or may share and integrate data between them. In AoA, each applicational component is an application element or can be seen as an application itself, just as in the mobile app stores.
4.1. AoA-Conceptual Approach
Service-oriented Architectures-SoA, for example, can be seen as a technical solution on the IT side to solve an application architectural problem, limiting the IT side to a rigid API based on WebServices. On the other hand, AoA centers the solution on the Application side, reshaping the concept of “service”, or component, to a piece of “functionality” that has a clear and objective purpose, e.g., “I use this app to locate myself in the building”. Accordingly, AoA has its strengths in leveraging functionality directly mapped from user requirements, and not in the technical details of software design or development.
This means addressing what non-IT developers, such as electronic’s engineering students want to focus on when developing IoT applications, that is:
Common Platform: results in easy implementation, because the same platform is accessed by all applications without the need of dedicated IT resources; fast adoption, i.e., new applications can be rapidly deployed which reduces the integration time; cost-effective because it can be based on open-source technologies;
Standard User Interfaces: clear, simple, and standardized user interfaces, for example, dashboards should rely on well-known and standard components, such as the ones delivered by the Grafana open-source visual analytics components;
Packaged Solution: an application can be seen as a file, a package, a black box, or a graphical canvas specifically delimited in a website. The rule is, everything that is essential to its operation should be packaged inside a container;
Available On-demand: can be installed or made available upon request and based on the user needs, i.e., GooglePlay/AppStore-like approach.
Lightweight: can run on resource-constrained computer systems, such as smartphones or tablets, as a native or web application;
In the context of a smart campus, this approach enables developers to build a functional application directly derived from the end-user needs. Remember that, in this context, developers may be students majoring in software engineering, but also electronics engineering, along with researchers or professors.
AoA enables a user-driven deployment model for applications across the IPVC Smart & Sustainable Campus (IPVC-S2C) Digital Ecosystem, as shown in
Figure 9, which will be evaluated later in
Section 5 after the specification and development of the following four “horizontal” applications:
RnMonitor, Indoor Air Quality assessment, and Radon Risk Management application, cf. [
26,
43,
44];
Refill_H20: smart distribution of drinkable water within the IPVC community with the main goal of reducing plastic consumption in academia, cf. [
45];
BiRa: a smart mobility application used for the management of the IPVC electric bicycle, cf.
Section 5.3;
These applications include specific IoT Edge Devices, that may include sensors and/or actuators. These devices communicate the acquired data through available communication infrastructures, reaching the IoT Agent available in the Application server, which creates a standardized interface to all IoT interactions. After data contextualization by the Application server, authenticated users, such as Staff, Professors, and/or Students can access the functionalities delivered by a specific Application front-end, designed in the scope of the IPVC Smart & Sustainable Campus.
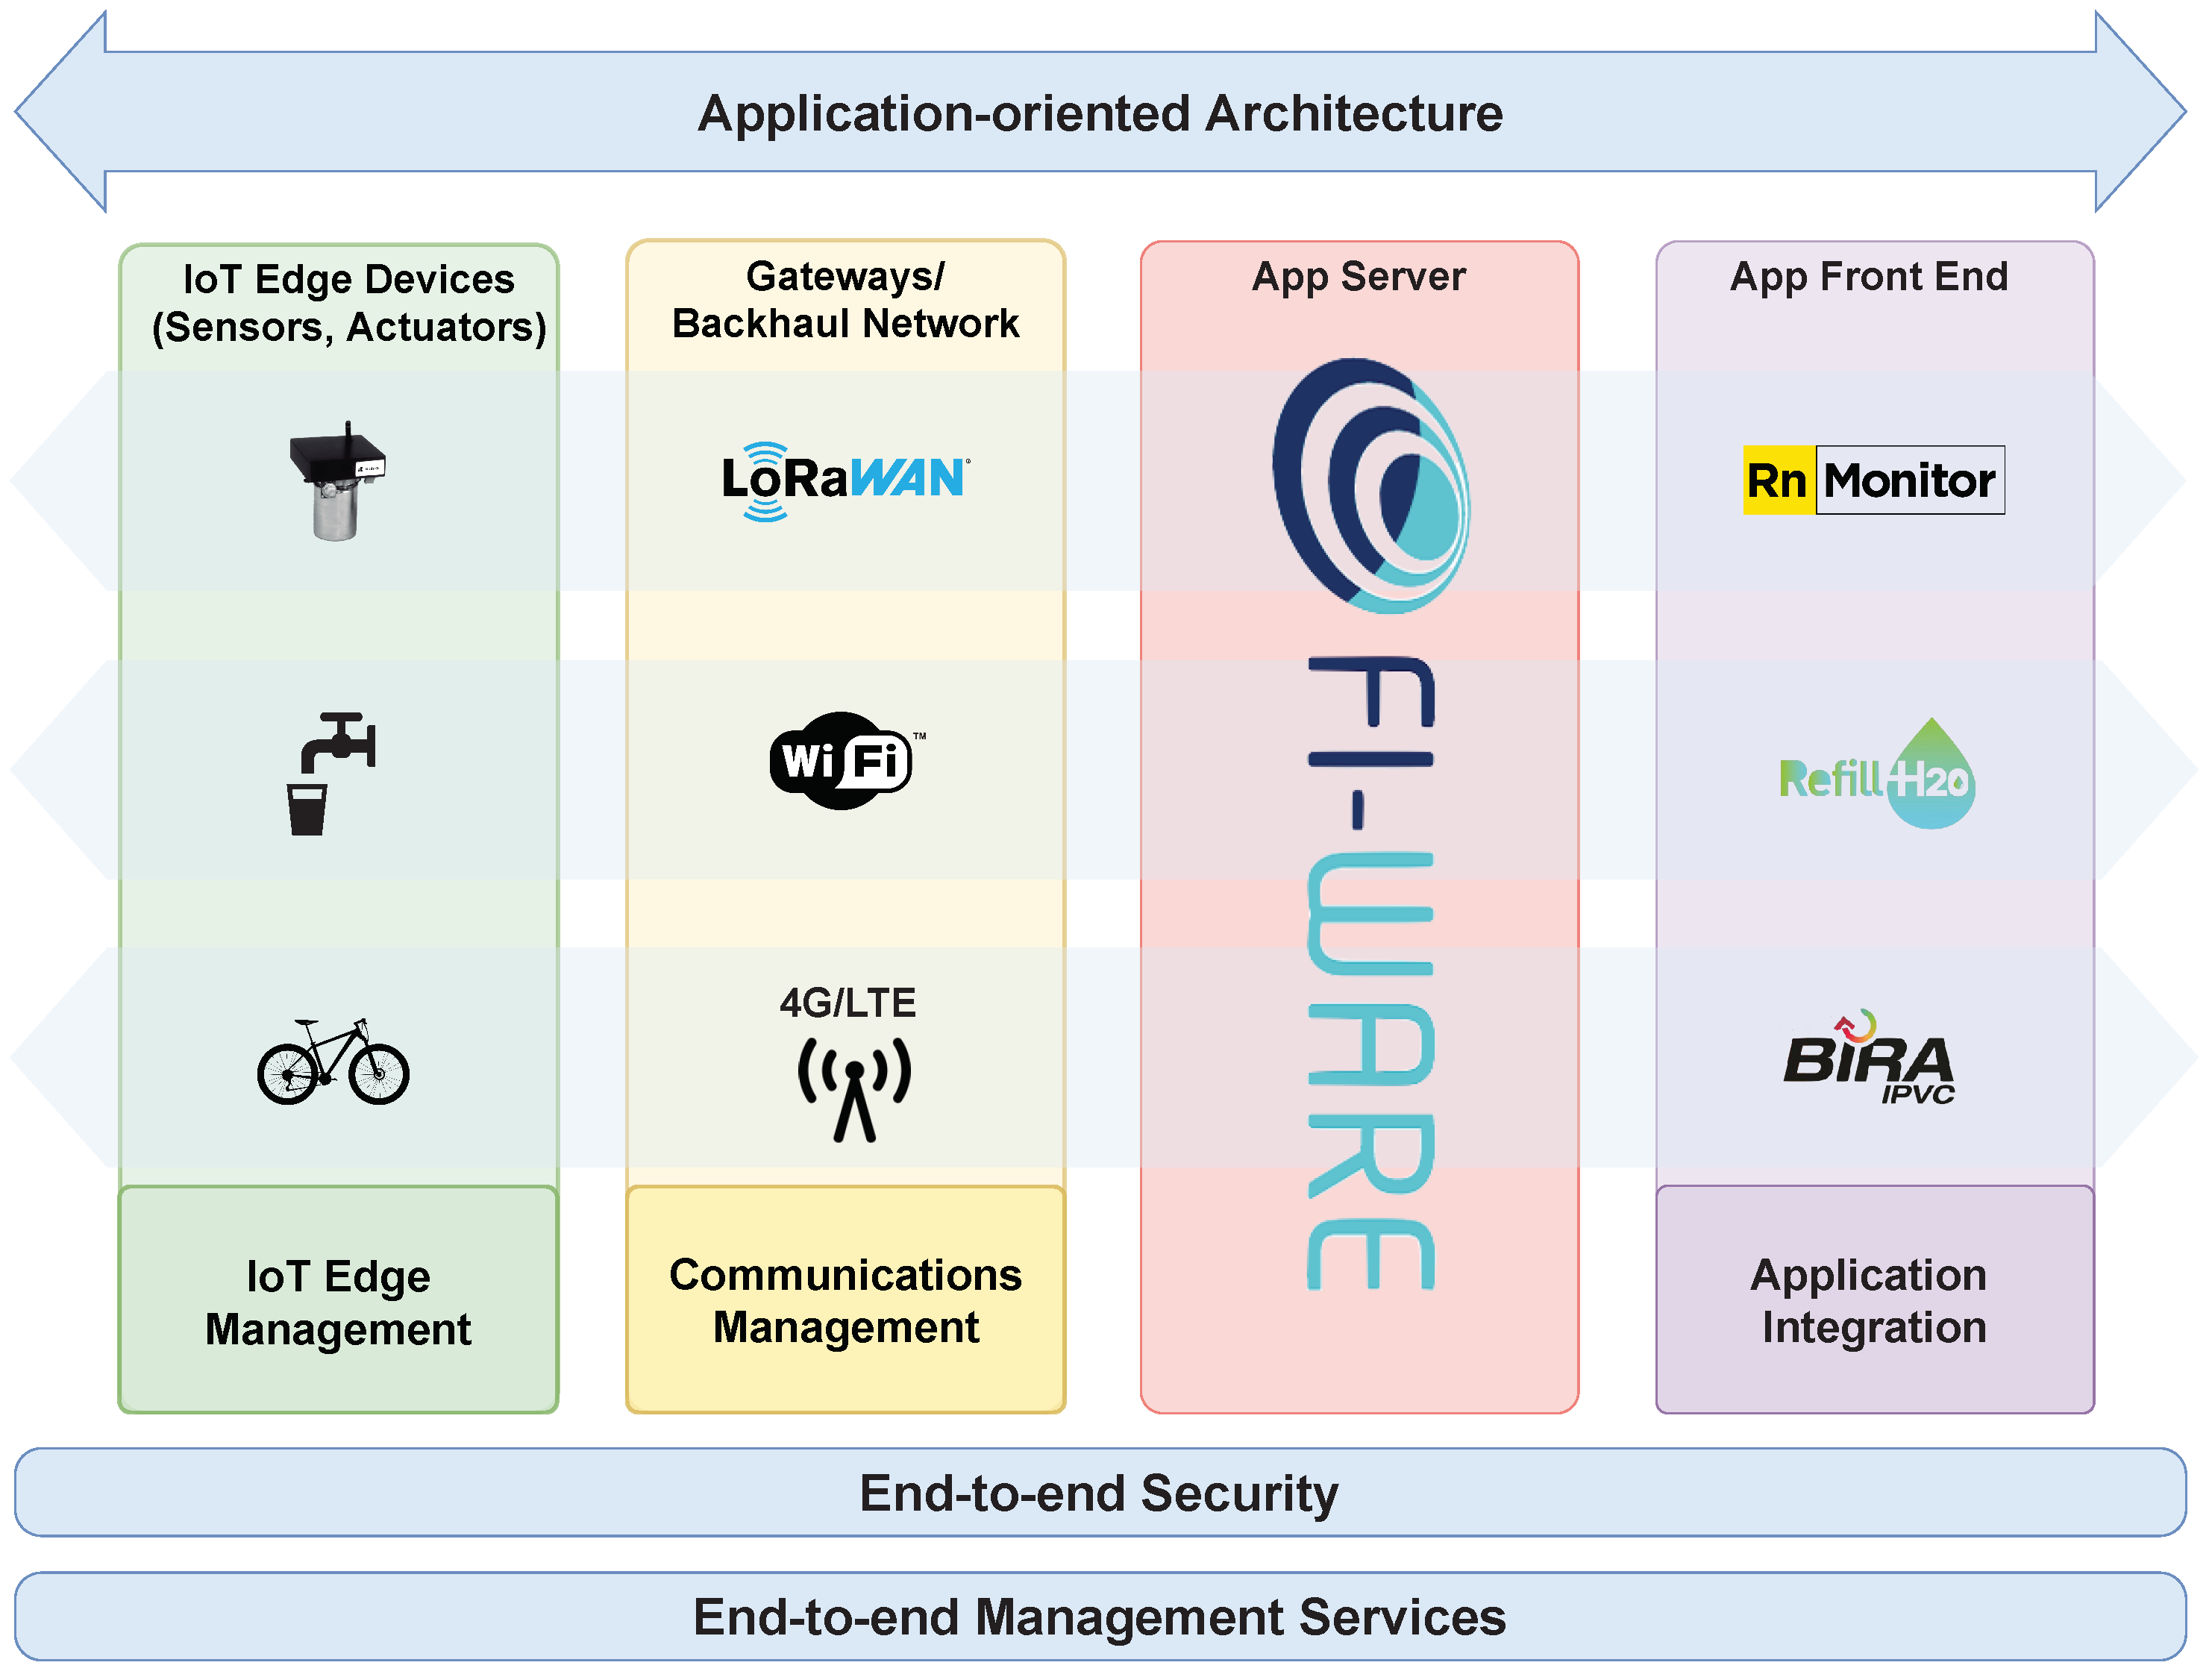
Note that, in the proposed framework, edge intelligence can also be considered. This possibility enables the decentralization and distribution of the computational cost among the IoT Edge devices. In this computational approach, the data can be pre-processed using signal processing techniques and other analytics tools before its transmission up to the Application Server. By using this approach only information with historical value is archived, which could be later used for tuning prediction models and to optimize the processing on the Application server side. The design and development of application-specific IoT Edge devices can be performed through the integration of 3rd party components and modules (sensors/actuators, microcontrollers, communications), accelerating the development of “smart” solutions to enable the IPVC-S2C. The AoA conceptual framework depicted in
Figure 9 can be used to describe horizontal applications built across four “vertical” pillars:
IoT Edge Devices (IoT-ED): includes the devices with sensing, actuation, and “smart” control capabilities. These devices can be commercial or application-specific, i.e., devices that were designed in the scope of R&D projects [
26,
44], or are the result of academic projects (BSc or MSc degrees. Legacy devices can be also included in this pillar;
Radio Access Technologies (RAT): networks and communication infrastructures that already existent on the campus, such as Wi-Fi or LoRaWAN; or external communication infrastructures available through commercial operators, such as 4G/LTE or Sigfox.
Application Server (App-S): manages, processes and routes contextualized information with relation to a specific application. At least, it includes the Orion Context Broker, the core element of every application based on FIWARE technology.
Application Front-End (App-F): the Application itself, what uses demand and see, that. In this conceptual framework, the requirements to put forward an Application must start. For example, what is the purpose of a specific application, and what are its core functionalities. In AoA, the answers to these questions are the starting points to the design of the application, which must be the focus on user-driven deployment.
With this approach, an application is seen from its functional perspective, being the technical perspective served by a common platform that can deal with multiple data sources, i.e., application-specific IoT Edge devices and other legacy devices that have been in use on the campus such as the authentication/identification terminal used for classroom attendance record, or the bar ticket acquisition system.
4.2. Using FIWARE as the Common Platform
By using the FIWARE as the common platform, full support is offered, keeping up with the speed of innovation which will allow future extensions and easy adaptation to new scenarios and functionalities. Some advantages such as offering a robust and reliable baseline technology, an easy to integrate and customizable solution for external systems, and strong cost-benefit advantages and agility can be achieved with the use of this kind of architecture [
46]. Moreover, a FIWARE-based architecture offers native modularity, high flexibility, and enhanced interoperability which enables long-term maintenance—and development—for applications, and offers a high degree of future-proofing—having a continuously open channel for new IoT Devices integration—from various third-party manufacturers.
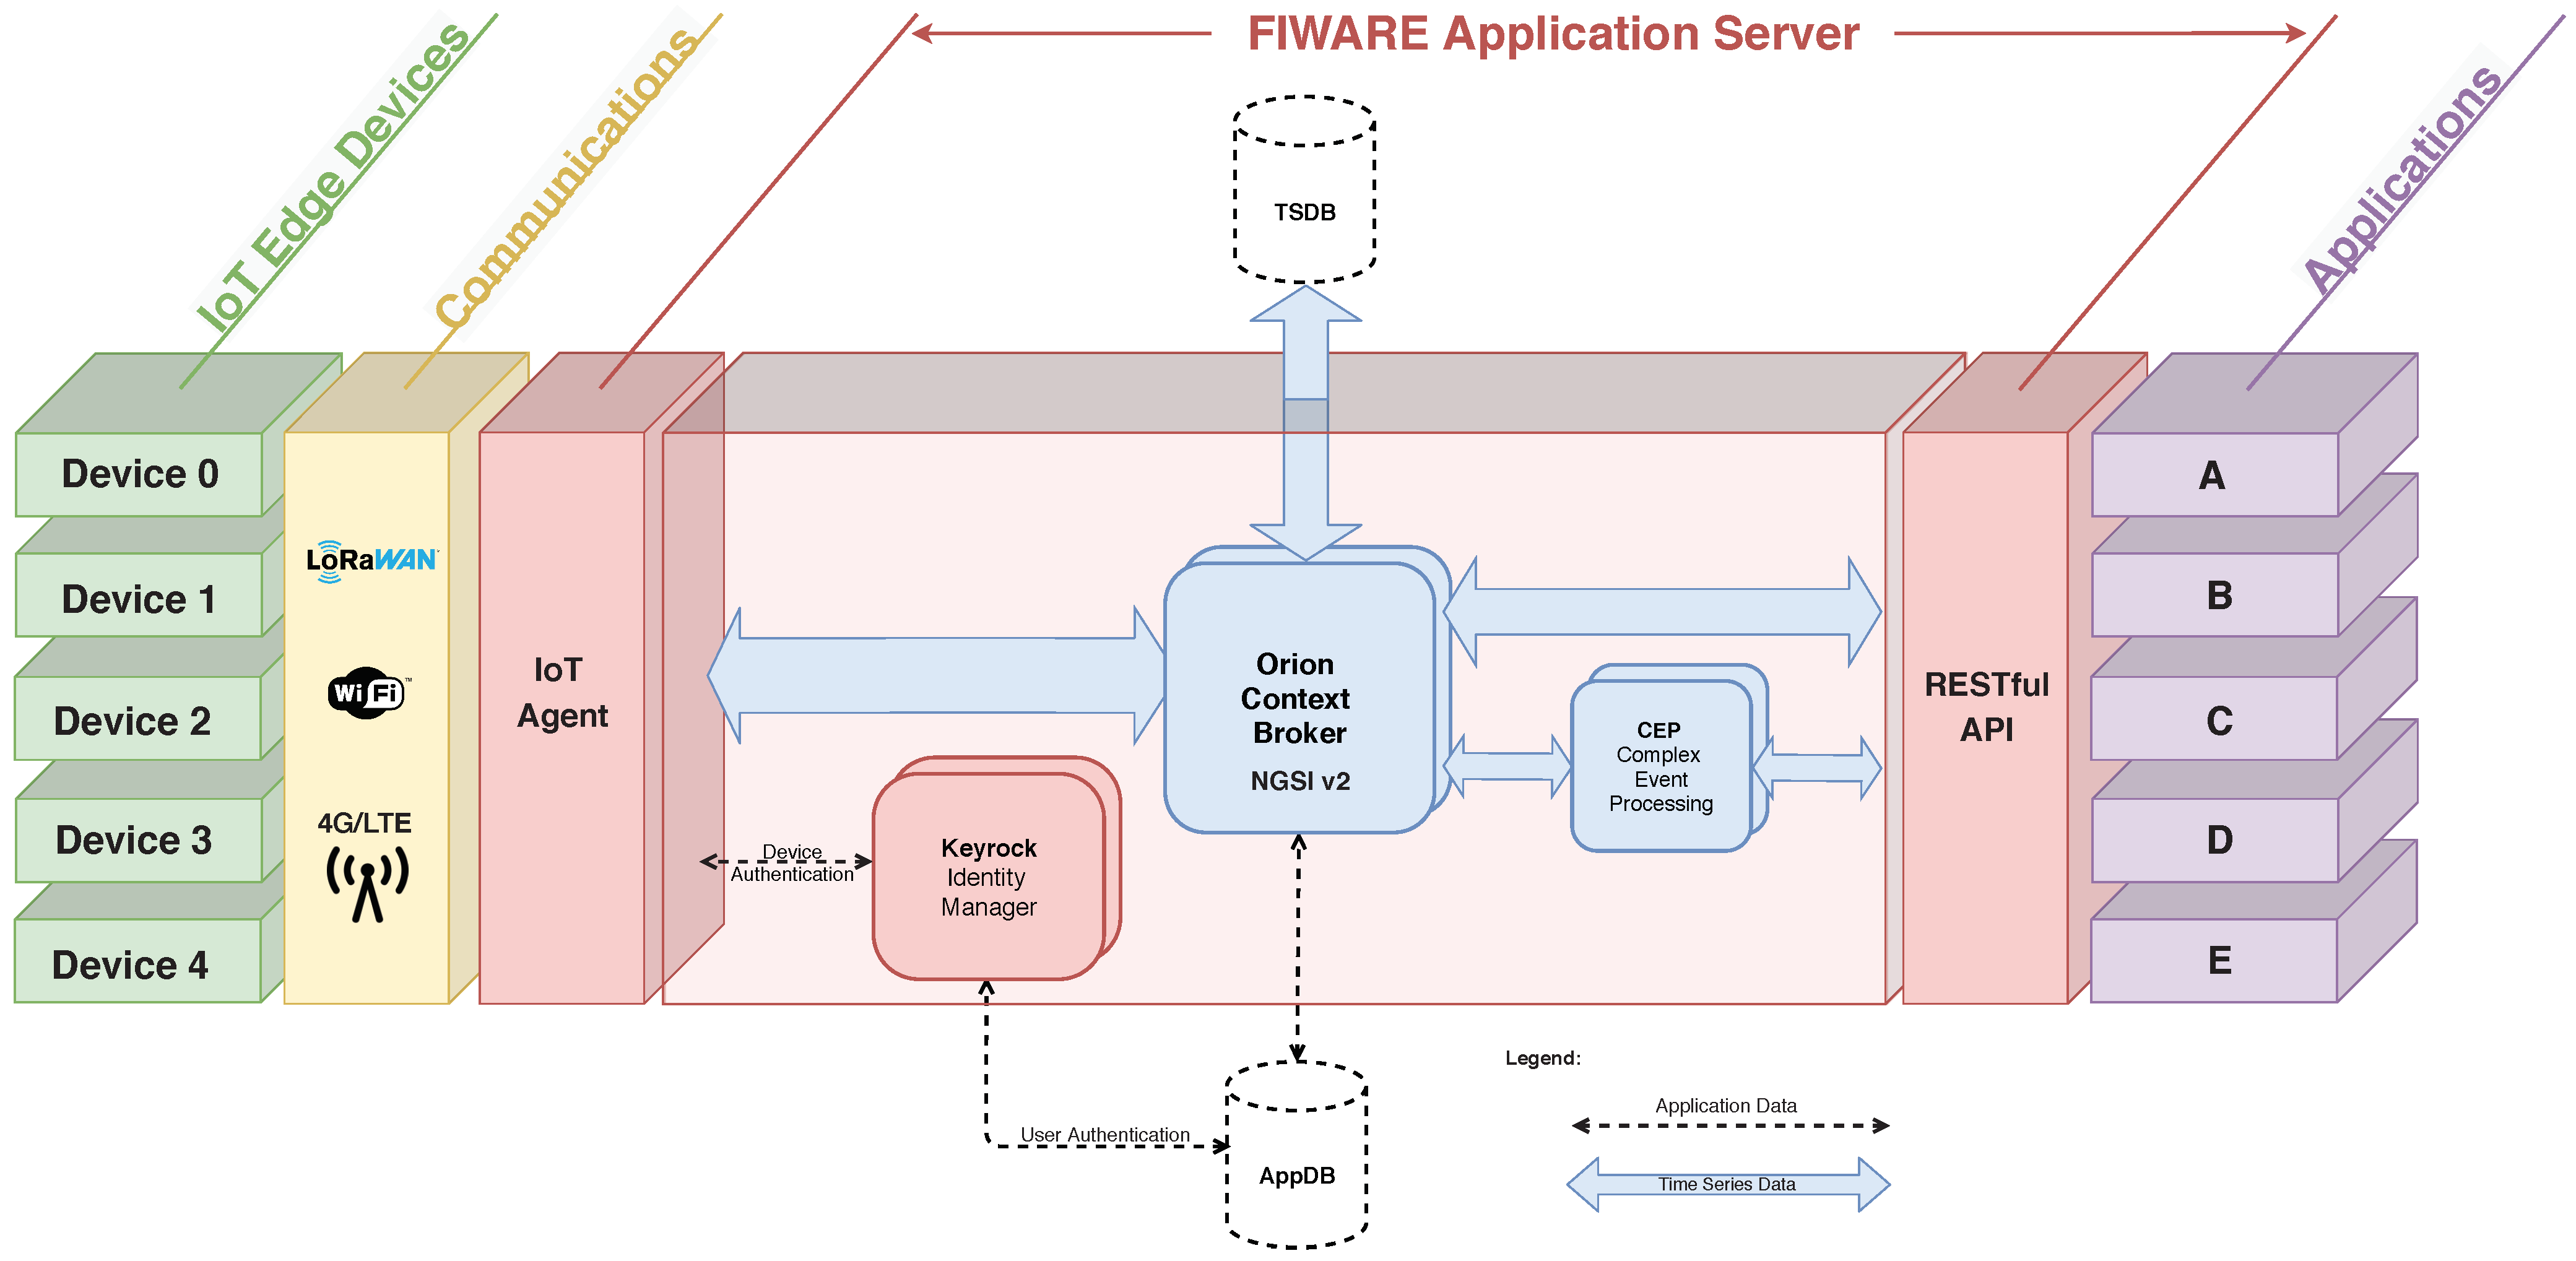
Figure 10 depicts the detailed end-to-end App-oriented Architecture. The adopted common platform is base on FIWARE, cf. Application Server, whose composition is based on five FIWARE Generic Enablers. The core element of the FIWARE Application Server is the Orion Context Broker. This block is built upon an NGSIv2 RESTful API.
One of the key concept features of the IPVC-S2C is the data management publication and monetization, which will unlock the value in the most important asset of the organization, by enabling an Open Data publication platform that will allow the usage and publication of datasets that match right-time context data, assigning access terms and policies as well as pricing and pay-per-use schemas.
To create applications on the spot, the concept feature of an App Generator, a special application that, through a simple user graphical interface, to which the user fills and responds to a series of simple forms, and using the drag-and-drop functionality, will allow the instantiation of new applications, with the available IoT Device open data and a simple front-end user interface, without requiring any prior knowledge of the application’s operation, allowing the joining and mixing of data from several sensors to enable new metrics and different ways of visualizing data in the context of the application.
Another application that will be useful for the end-user will be the App Store, a special application, working with an interactive panel of applications, which will operate as a version controller, allowing the dissemination and distribution of applications instantiated in IPVC-S2C by the entire IPVC community, according to certain access permission. In this way, all instantiated applications will be merged into one application, thus allowing easy access to them.
4.2.1. Authentication (Users & Devices)
Security-related questions are also solved through using this architecture, since FIWARE offers components that ensure that only the right individuals get access to certain resources, using the same usernames, passwords, roles, and permissions for all instantiated applications, granting access control, a selective restriction of access to resources, with mechanisms of authentication, confirming who the end-user is and who he claims to be, and authorization, ensuring that the end-user has permission to access a certain resource. With the use of FIWARE, applications do not need to store or use passwords directly but need to confirm who the user is from a trusted source.
4.2.2. Transparent IoT Integration
An IoT Agent is configured for each different technology used in IoT Edge Devices, becoming the bridge between these and the FIWARE context broker. Any group of devices can send their data that is managed by the Context Broker. With the use of IoT Agents, most of the common IoT problems, such as device-specific protocols or mapping the received data to a data processing process are overcome, standardizing the interface to all IoT interactions at the context information level.
4.2.3. Storage (Operational + Data)
Two external databases are part of the architecture, an operational Application Database (AppDB) and a Time-Series Database (TSDB) for data storage and management. The AppDB is a MongoDB, i.e., a NoSQL BSON document-oriented database that provides high performance and its core function is to keep specific application data persistence and store context data, such as subscriptions, entities, and registrations, with an important feature of being easily scalable, providing tools to efficiently distribute data across multiple machines [
47]. On the other hand, the TSDB is used to store time-series data regarding specific parameters collected by the IoT Edge devices, e.g., GPS coordinates, temperature or humidity, etc. TSDBs have optimized performance for recent short-term time-series data, allowing efficient querying and managing of data, with high scalability and usability [
48]. InfluxDB, an open-source time-series platform is the database that will be responsible for storing and querying IoT collected data, enabling monitoring in dashboards, visualizing and data exploring, supporting high volumes of streaming data that is generated by the IoT very quickly, being able to analyze and query data, and is one of the key aspects for a system that requires data scalability and availability [
49].
4.2.4. Processing (Events + Notifications)
To process real-time data, a Complex Event Processing (CEP) will be used, allowing immediate response to changing conditions, notifying users by sending emails, SMS messages, HTTP requests, etc, allowing the management of rules by exposing CRUD operations.
To protect the back and front-end operations, the Keyrock Identity Manager (IdM), combined with WILMA PEP Proxy will be installed. The IdM will be responsible for the application and services access and security, having an OAuth2-based authentication and authorization. It ensures that only the right user if the permissions are granted and the user role allows, gets access to the application resources. Since the IdM supports reusable attributes (like emails and others), it allows easy and convenient management of profile information and can be configured in multiple applications, which will reduce the developer work since it is not needed to run and manage single-application user authentication but use the IdM user profile storage as a Software as a Service (SaaS). The WILMA PEP Proxy will offer a Policy Execution Point to protect the back-end applications, serving as a gatekeeper for resource access, where users must provide sufficient information to allow their request [
27].
5. The IPVC Smart & Sustainable Campus
The IPVC Smart & Sustainable Campus (IPVC-S2C) focus on the integration of new and legacy IoT applications, functionality-oriented, providing mechanisms to generate applications on-the-fly, allowing data to be shared among applications. One of the key factors of using the IPVC-S2C is the usage of the previously introduced Application-oriented Architecture-AoA, that uses a common infrastructure with the aim of removing several layers of monolithic application requirements, such as communication protocols, data management, data process, and access management.
Similar to the architecture described in [
50], the implementation of new applications integrated into the IPVC-S2C has a methodology divided into five levels:
Business Level: can be referred to the high level of the architecture from a business point of view and is the basis for the other levels, describing who takes part in the architecture, their specific activities, and interactions;
Functional Level: this level contains the functional requirements of the architecture and the requested characteristics. These requirements can be organized as follows: IoT devices, data management, data visualization, identity management, and security;
Process Level: defines how the participants communicate with each other and how they can publish data, use the application and how to exchange data between consumers and providers;
Information Level: provides the model that the participants and components must follow to improve communication and integration, describing the components defined in the functional and business levels as well as the relationships between them;
System Level: describes the overall system architecture and is divided into configuration and execution phases.
The first step in the integration of any new application is to define the application architecture with the end-user, describing who takes part, and what represents each characteristic, determining who are the Data Consumers, the Data Providers, how the Web Application works, and what Security mechanisms will be considered.
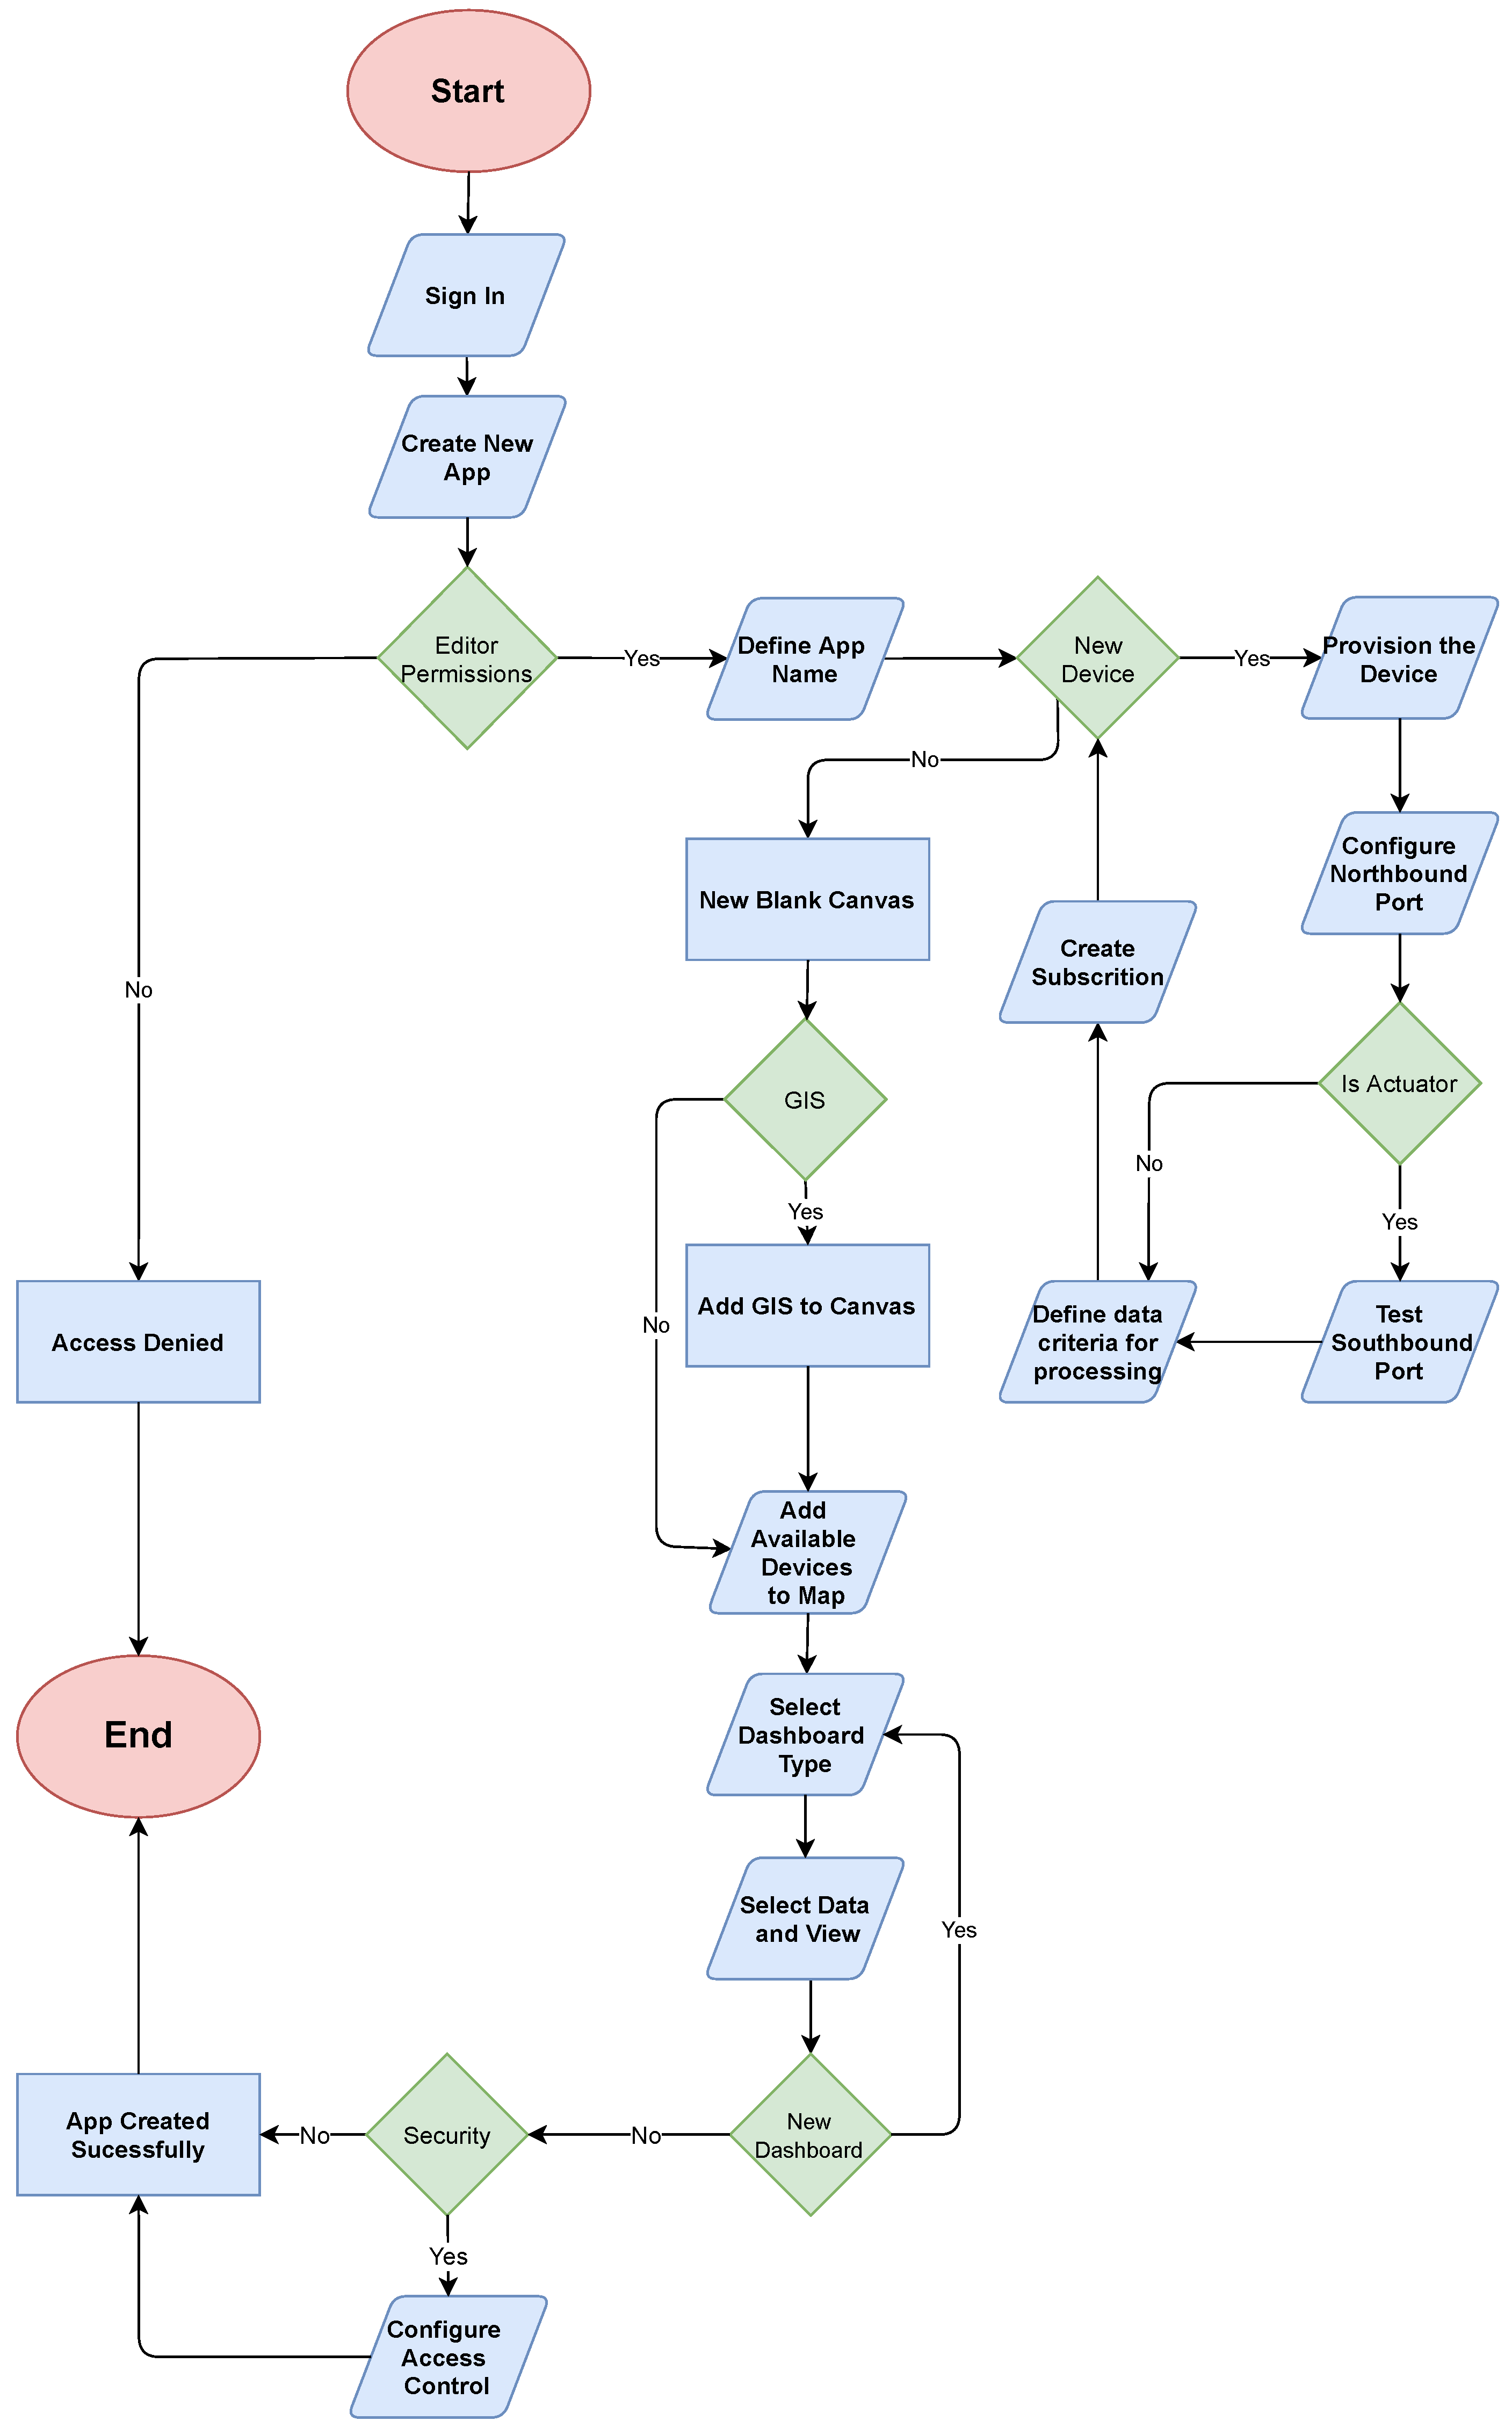
To use the IPVC-S2C application generator, and as depicted in
Figure 11, the user must provide valid editor permission, otherwise, an error message pops-up since access was denied.
When the user is authenticated as editor successfully (AE), a modal form is opened where the new application name must be provided to generate a new service group. In case the new application provides new IoT devices, they must be provisioned, according to a specific data model, transmitted via POST request, where parameters such as Id and all the measurement parameters must be specified. To build the bridge between the measurement of the IoT Sensor and the specified IPVC-S2C, a request must be made to the northbound port, where the IoT Agent is listening for communications, using one of three different protocols: HTTP, MQTT, or CoAP, to bring a standard interface to all IoT interactions at the context information management level.
If the device is capable of working as an actuator, this information needs to be provided by the AE, since HTTP requests can be generated by the Orion Context Broker and sent to the IoT device via IoT Agent to alter the state of the real world by their actions (e.g., a Smart Window can be opened with a Southbound command from the IoT Agent).
Since every smart system requires to know the current state of the objects at any time and to obtain information each time the context data changes, a subscription must be created by the AE to use the asynchronous notification mechanism, meaning the application does not need to persist on polling query requests, reducing the amount of data transmitted between the system components, resulting in improved network traffic.
After registering all the new devices, the AE is prompted with a Yes-No form modal, questioning if the new application requires a simple geographic information system map. Case “yes” is selected, the canvas is populated with a Google Map as the base of the application, a simple high-level building management tool for easier visual data analytics, containing polygons (limited and previously added by the system administrator) organized hierarchically: building > floor > room. If the AE selects the “no” option, the next step is the selection of the IoT devices to be displayed in the application, that can be the ones that were previously inserted and/or the devices that contain data with no restraints from other applications. If the application has a GIS as the base layer, as previously selected, the selected IoT devices will display as georeferenced markers.
The next step in the instantiation of the new application is the configuration of the data visualization tools, using the provided graphical user interface. Several Grafana dashboards that contain raw or metric data from the devices selected above, can be associated with each IoT device to create user-friendly visual data analytics, where key performance indicators and time range period can be defined according to the application requirements. One key feature of using Grafana to create the dashboards is the possibility of creating rules to have visual alert notifications.
The last step in the creation of a new IPVC-S2C application is to provide, replying to another Yes-No form if the application requires access control. If “Yes” is selected, the AE must create a new “Organization” and specify which members, from an existing member list, do make part of the organization, designating the roles of “owner” or “member”. If “No” is selected, the application is created successfully, being available to everyone under the “/projects” domain.
Taking advantage of the IPVC-S2C architecture it can be ensured that all parts of the system interact and use data with a warranty of security.
The following subsections will describe multiple in-use application projects and respective architectures, components, and functionalities using the Smart and Sustainable Campus architecture. Several legacy applications have been adapted and embedded in this architecture and will be described below.
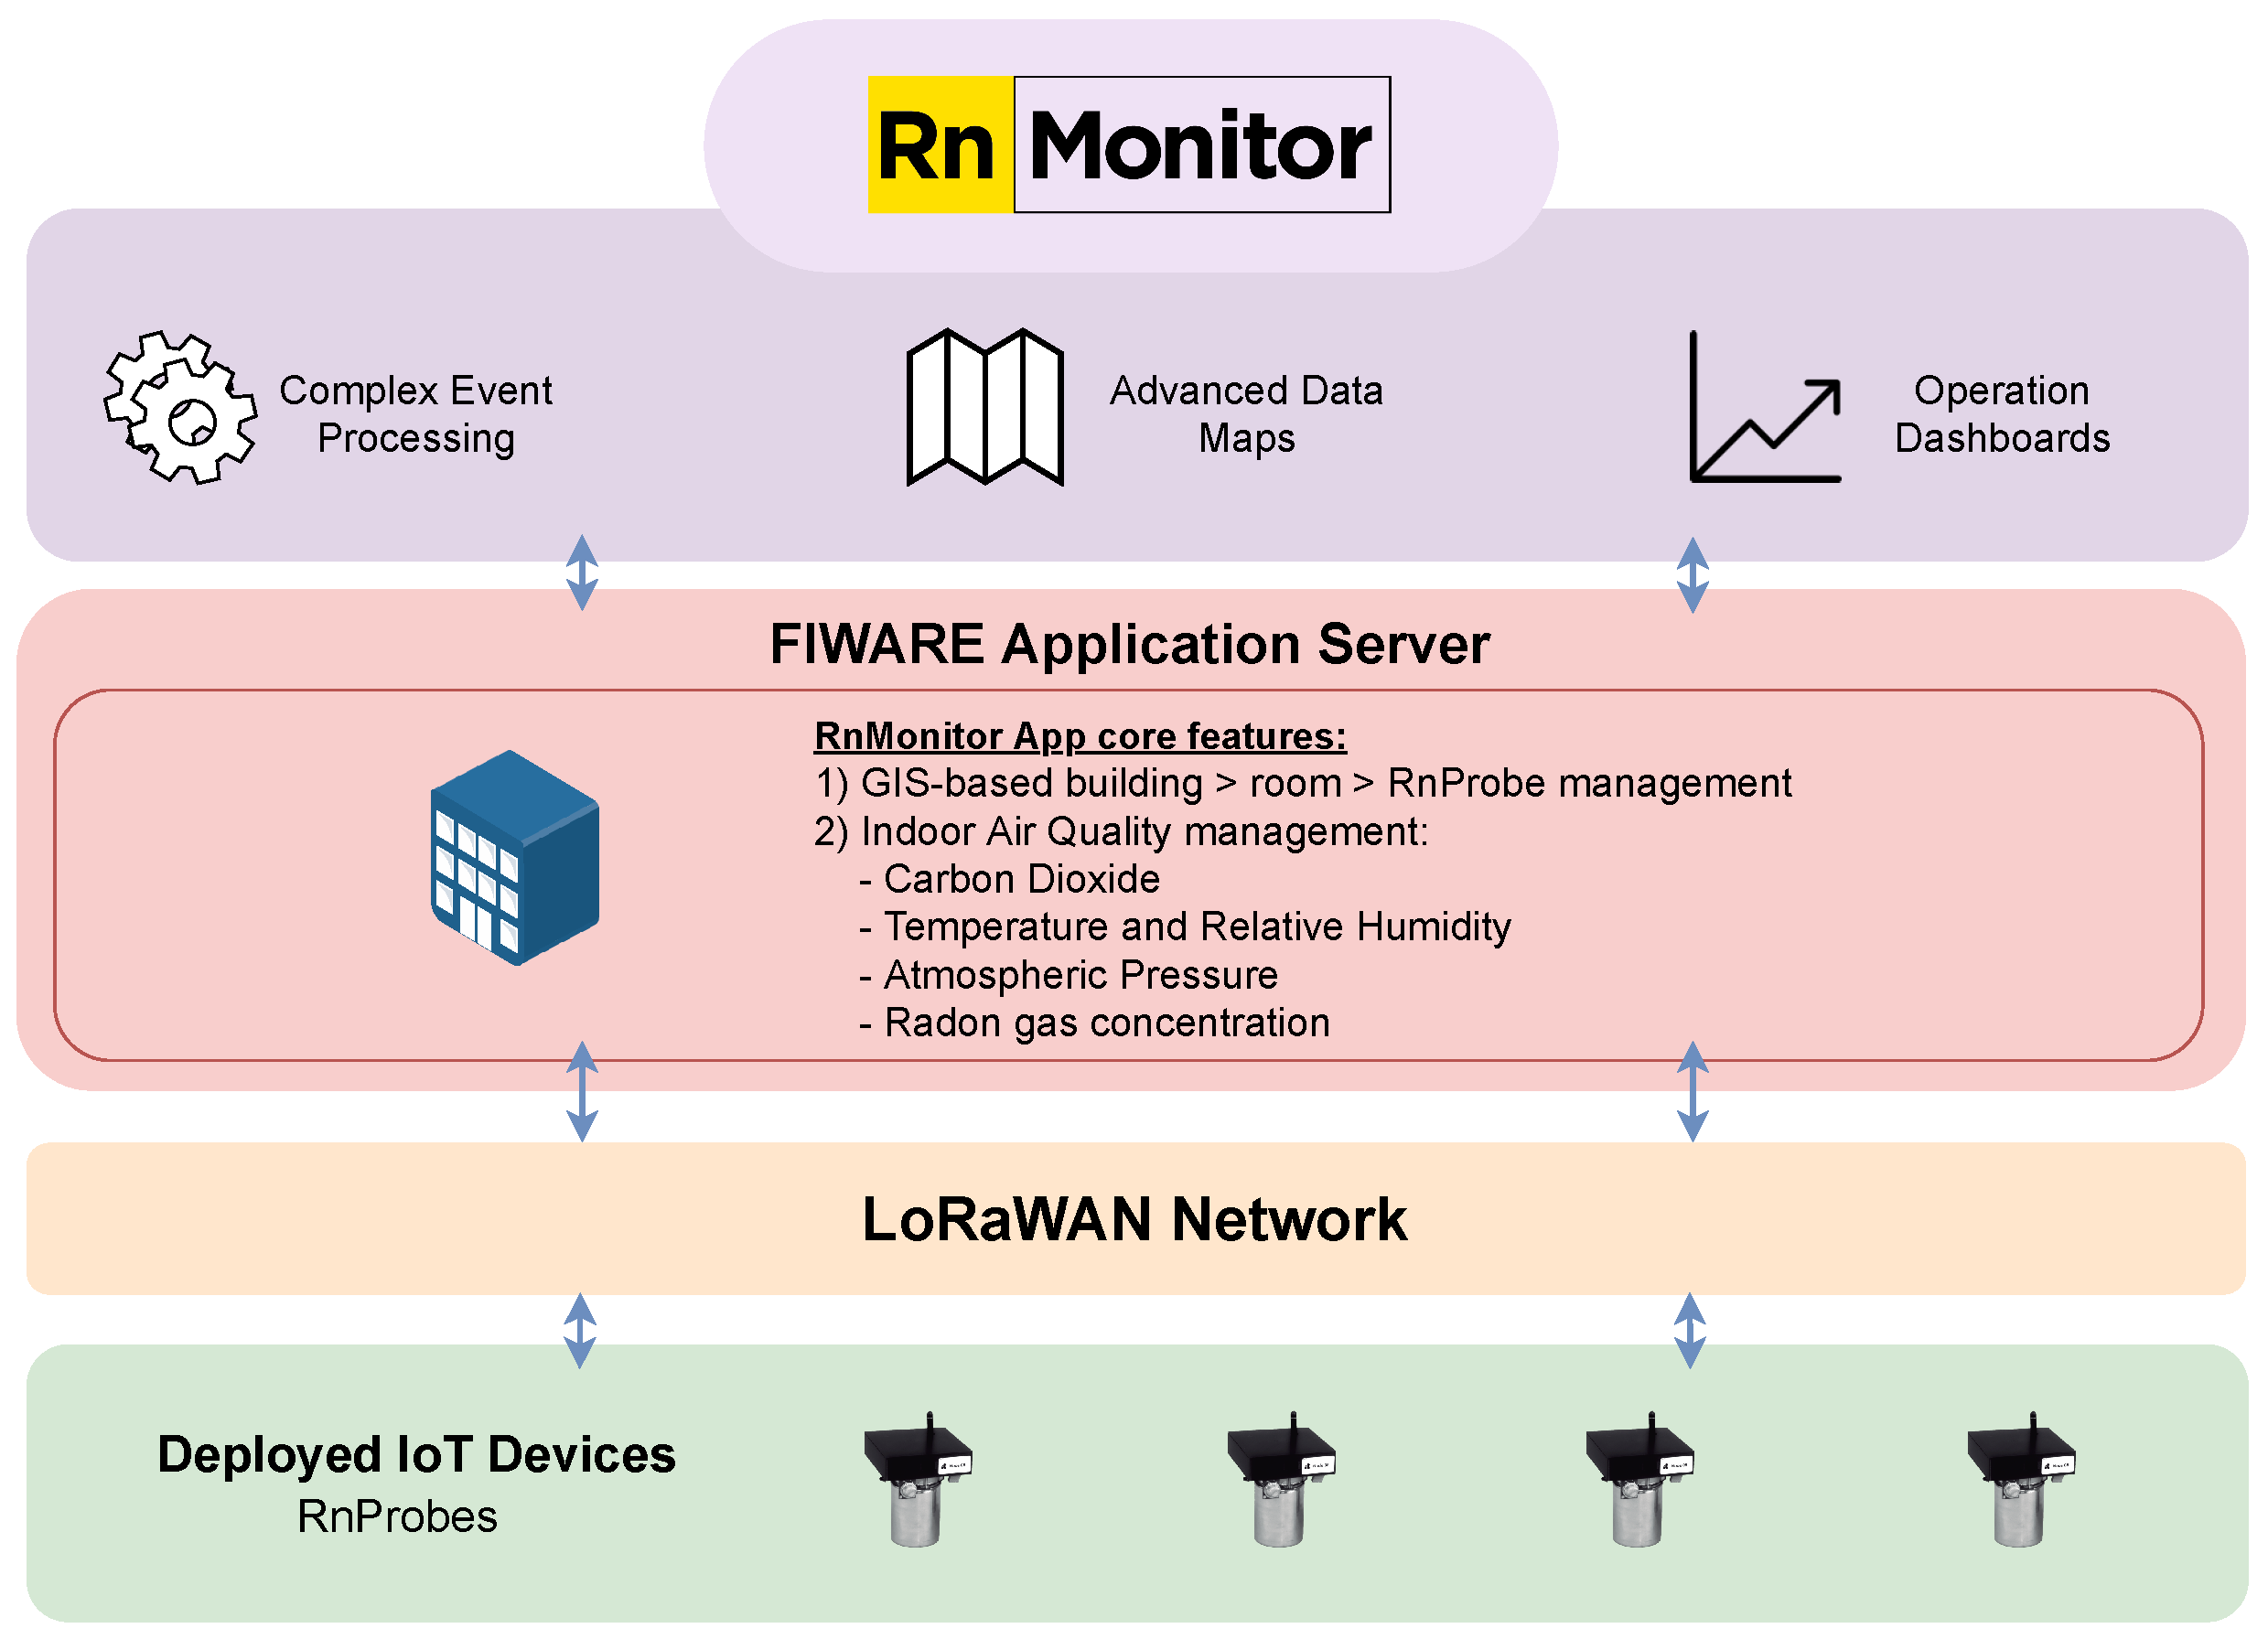
5.1. RnMonitor App
The RnMonitor App is a Web Geographic Information System based platform developed for expedite in situ deployment of multiple
RnProbes [
26], a LoRa-based IoT Edge devices that are installed in buildings to monitor and evaluate the risk of indoor radon gas [
44]. These probes are designed to measure radon gas concentration, but also several indoor air quality parameters, such as carbon dioxide concentrations, temperature, relative humidity, atmospheric pressure, and volatile organic compounds.
In this specific use case, the main application requirements are the installation of several RnProbes and IAQ IoT Devices that collect and send data every ten minutes, through the IPVC LoRaWAN network, a long-range and low power network technology, into the northbound port of the IPVC-S2C application.
Figure 12 depicts the RnMonitor application architecture with its core components after its definition in the functional level, resulting in three main application blocks:
IoT and Communication: which includes the IoT Devices and communications via LoRaWAN;
FIWARE App Server: includes the IPVC-S2C;
Web Application: includes the front-end application that is available to the end-user.
Besides, the end-users require to view the information using two visual analytic tools: (1) A building management web-based application and (2) Multiple dashboards containing raw data and metrics associated with the Portuguese radon legal limit, between three different periods: Very-Short-Term for periods between 24 h and 1 week, Short-Term for periods between 1 week and 3 months and Long-Term for periods between 3 months and a year. If a specific condition occurs, regarding the radon legal limit, the user must be notified to trigger manual actions, improving the overall indoor air quality.
Figure 13 depicts the Front-End application of the RnMonitor Application. This application and its respective data are shown after being configured with the right permissions, via a login form, establishing a trust relationship between all components thus allowing a secure data flow between participants.
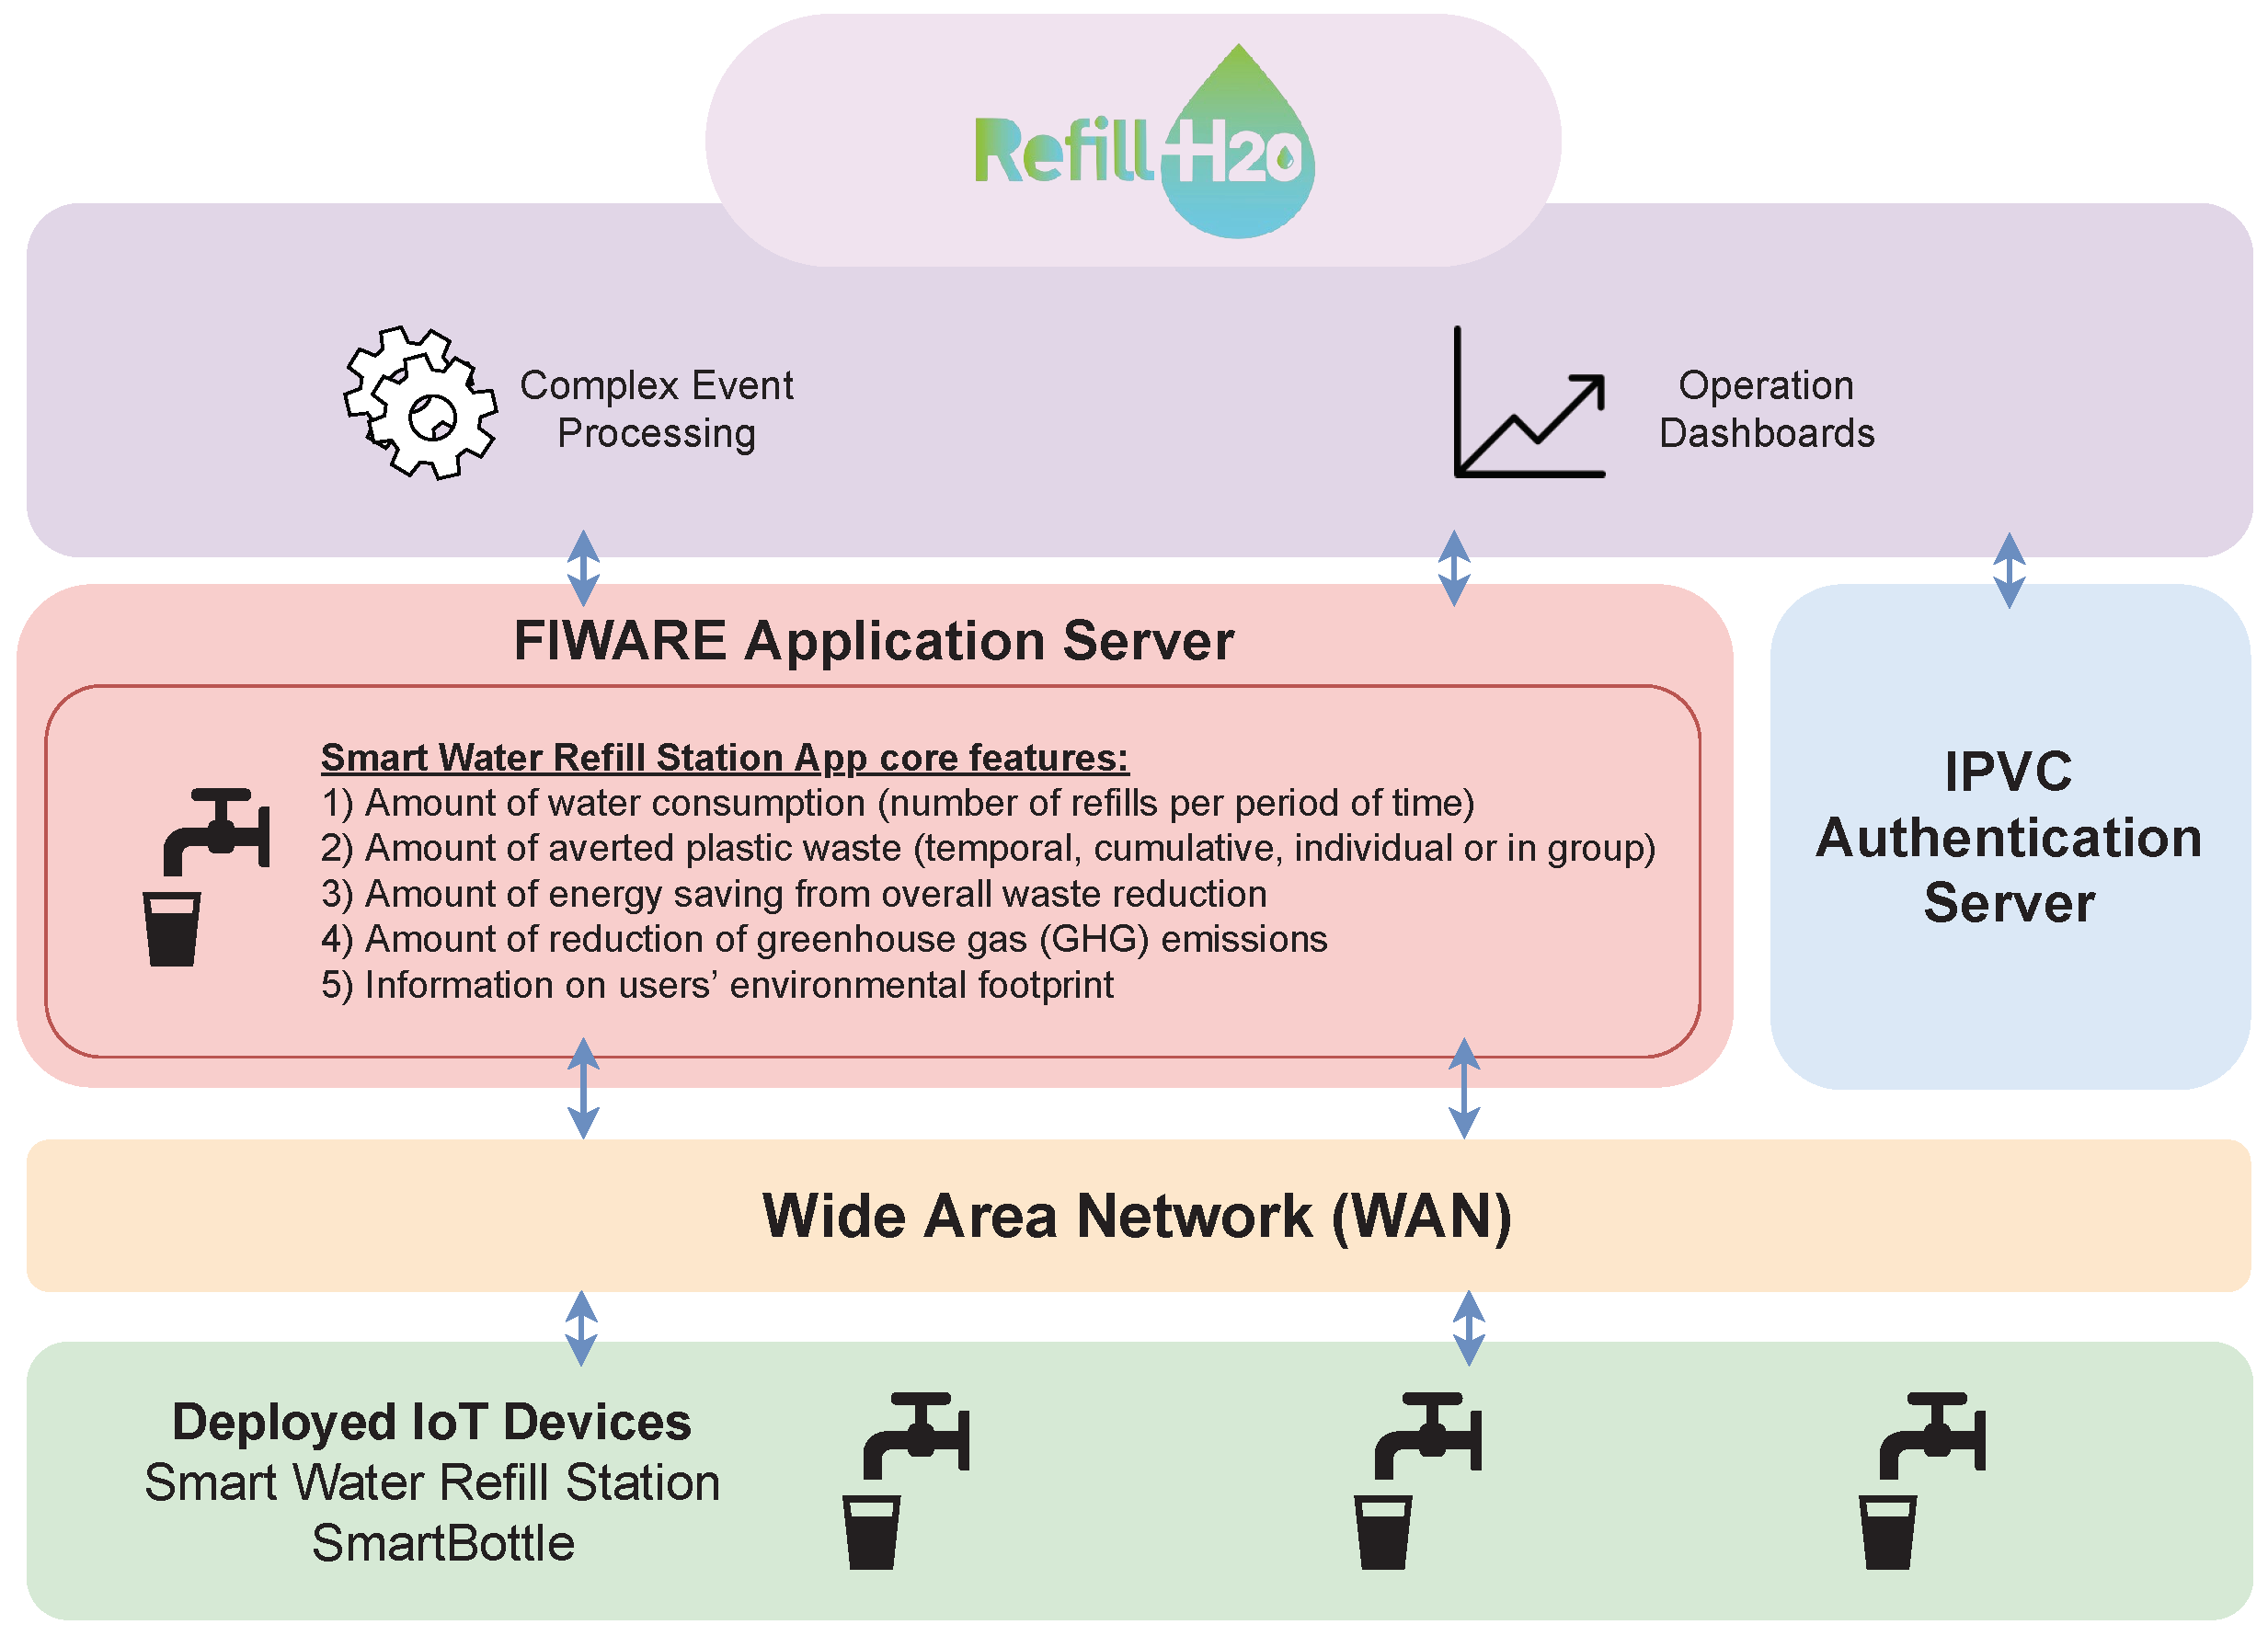
5.2. Refill_H2O App
The Refill_H2O is an EEA Grants Portugal environmental project, cf. [
51], that aims to eliminate the use of plastic water bottles on the IPVC Campus (Polytechnic Institute of Viana do Castelo), through the design and development of an interactive smartbottle that ‘communicates’ with a water refill station, to foster more eco-friendly attitudes among users in academia, e.g., students, teachers, and employees, and thus contributing to the reduction of plastic consumption in the bars, canteens and halls of residence within the IPVC community, since public higher education institutes have a critical role in creating a sustainable future, bearing a huge moral and responsibility to increase the awareness on the students, staff, and workers for the worldwide waste of plastic that reaches the rivers, seas and oceans [
52].
The smartbottle is equipped with a radio frequency identification (RFID) chip, that integrates with the refill station management system, enabling the following features: (1) automatic filling process (no physical contact with the equipment); (2) the estimated average amount of water consumption through a mobile application (number of refills per period); (3) estimated amount of averted plastic waste (considering different metrics: temporal, cumulative, individual or referring to colleges, classes, etc.); (4) energy saving from overall waste reduction and reduction of greenhouse gas (GHG) emissions; and (5) information on users’ environmental footprint.
After discussing the application requirements, the physical and application system architecture was structured, which is depicted in
Figure 14 and is composed of five main components: the deployed IoT Devices (Smart Water Refill Station) that retrieves data from a Radio Frequency Identification (RFID) authenticated SmartBottle or Student Card, the IPVC Wide Area Network (WAN) network, the IPVC Authentication Server and the front-end application.
To use the physical water dispenser station, the user must provide authentication via Student ID Card, by placing the card in the RFID tag or via smartbottle, which specifications are mentioned in [
45], which enables the system to compare the RFID data with the system Smart Water Refill Station embedded database. The RFID reader transmits the user ID, alongside the amount of dispensed water to the IPVC-S2C application, using the WAN network, allowing a permanent connection between all components and enabling data management and processing.
The client application is based on responsive web technologies that will include visual analytics tools, including dashboard-based technologies, like Grafana, which provides a powerful interface that displays useful information in a clear and user-friendly way. The user interface includes three main functional areas:
Dashboard: the core area of the application to monitor and visualize real-time raw data and key performance indicators (KPI) and related statistics. Each dashboard is divided into three classes. Comparison of the dispensed water of the campus and user (if authenticated) total high-score that allows the visualization of data as ranking divided in school, degree, and individual;
Authentication: this functional area will enable user authentication, allowing the application to change accordingly to the user. The application front-end will differ according to three types of user permissions: Station, making the default application on full screen, and untouchable. This is the user setting that will be used on the Smart Water Refill Station tablet; Regular User (Staff or Student), which will allow the applications’ reasoning machine to compare the collected data and display them in dashboards, and No Authentication, displaying general data of the campus.
User and System Administration: this functional area will ensure all the back-office operations regarding user management and system administration tasks.
5.3. BiRa IPVC App
BiRa IPVC application project is developed taking part in the U-bike Portugal [
53], a nationwide project with the main objective of promoting smooth mobility, encouraging the adoption of more sustainable mobility habits in higher education scenarios, focusing on the young sections of the population, extending to the academic community, sensitizing the transportation shift, from the car to a healthier and environmentally friendly bicycle.
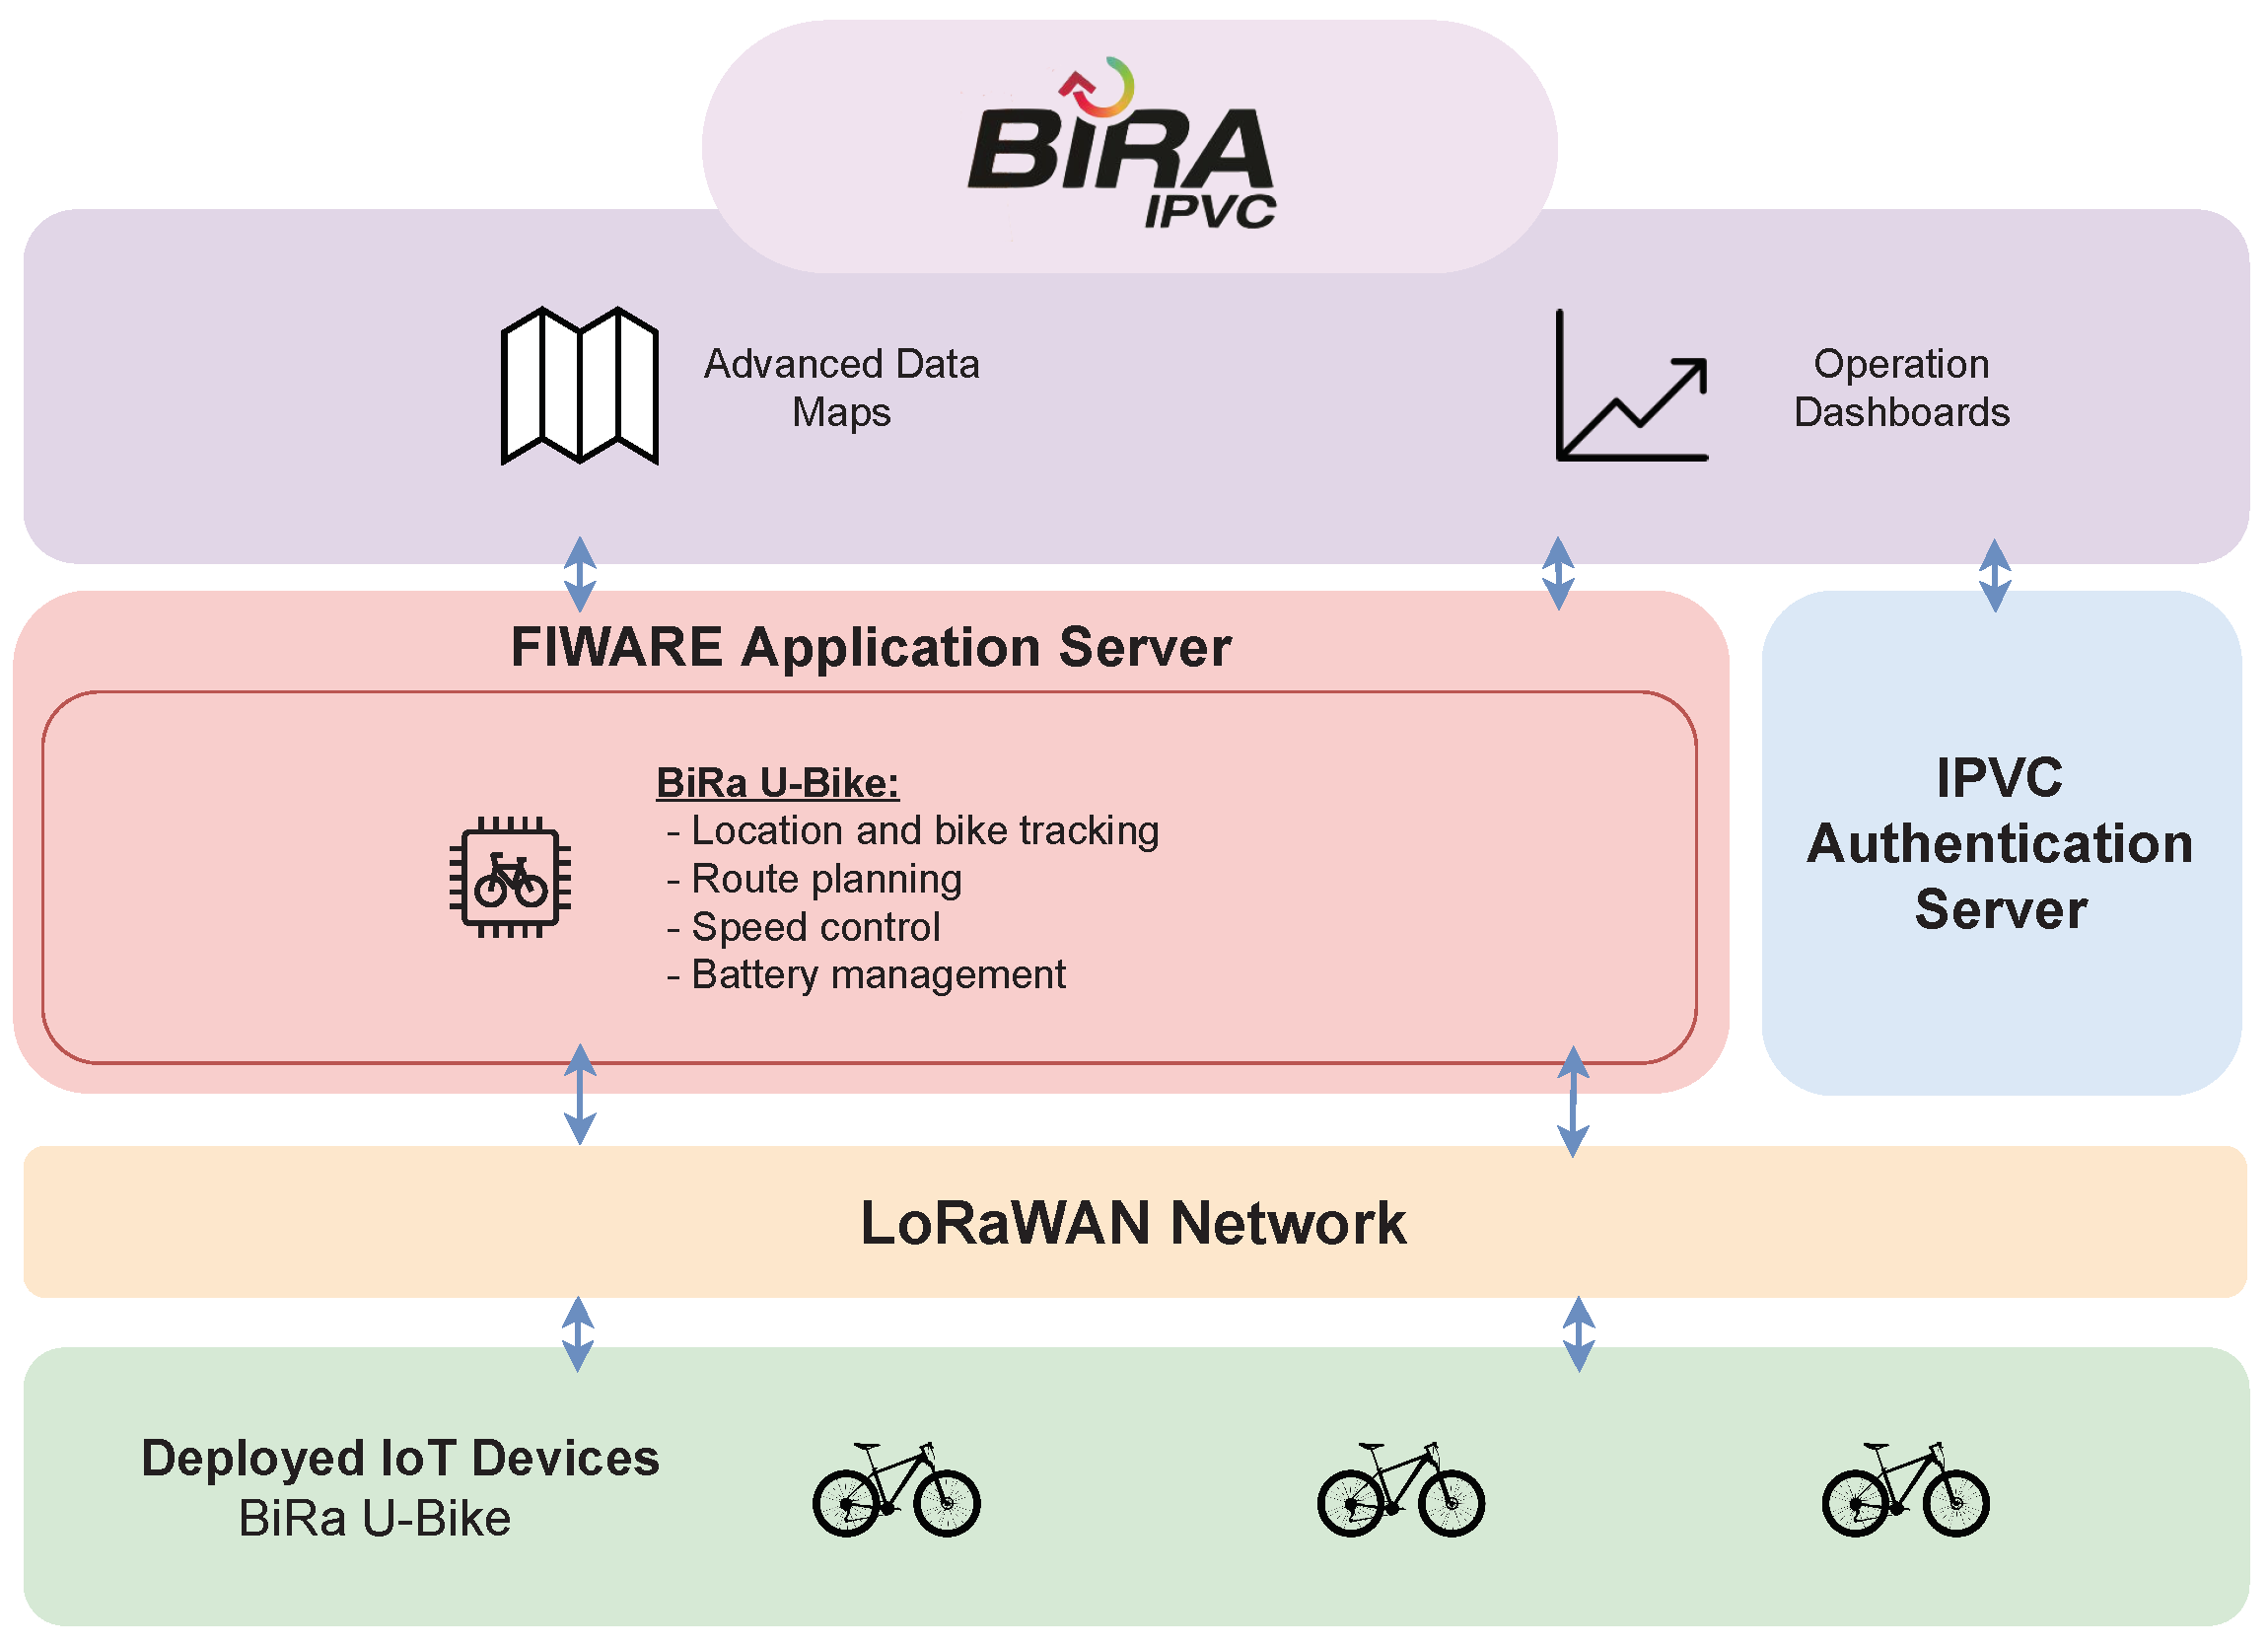
As depicted in
Figure 15, the application is divided into four main component blocks:
IoT and Communication: includes the BiRa U-Bikes and LoRaWAN communication protocols;
FIWARE App Server: includes the IPVC-S2C;
IPVC Authentication Server: includes the IPVC authentication databases and external services;
Web Application: includes the front-end application and its features, which are available to the end-user.
Each bicycle is assigned to a specific IPVC community member and has a GPS device attached, that tracks several context information parameters such as location, route, speed, and battery level, communicating using the IPVC LoRaWAN network. To view the collected data, a front-end application, displaying a geographic information system map with the last known location of the bicycle, after the user authentication, is displayed, allowing the visualization of historic data by displaying multiple points (routes) on the map according to the selected data range picker.
The usage of the IPVC-S2C is essential since it allows a product-ready application that standardizes the adoption of a common interface for IoT and Big Data analytics, allowing better management of the usage and maintenance of the BiRa bicycles.
6. Discussion
To evaluate the results, we will use the two implementations of the RnMonitor application, by comparing the legacy version, cf.
Section 2.7, with the new RnMonitor version instantiated using the AoA approach in the IPVC-S2C platform, cf.
Section 5.1. The evaluation will be performed based on the following three software development criteria:
Computational resources: compares how the data is stored, the processing power of both applications, and the application requirements;
Software development effort: the estimation of the realistic amount of effort, expressed in terms of person/hour or money required to develop and maintain both applications. Effort estimates are used as input to project plans, budgets, investment analysis, and pricing processes.
Functionalities: comparing the features available to the end-user, according to the features requested.
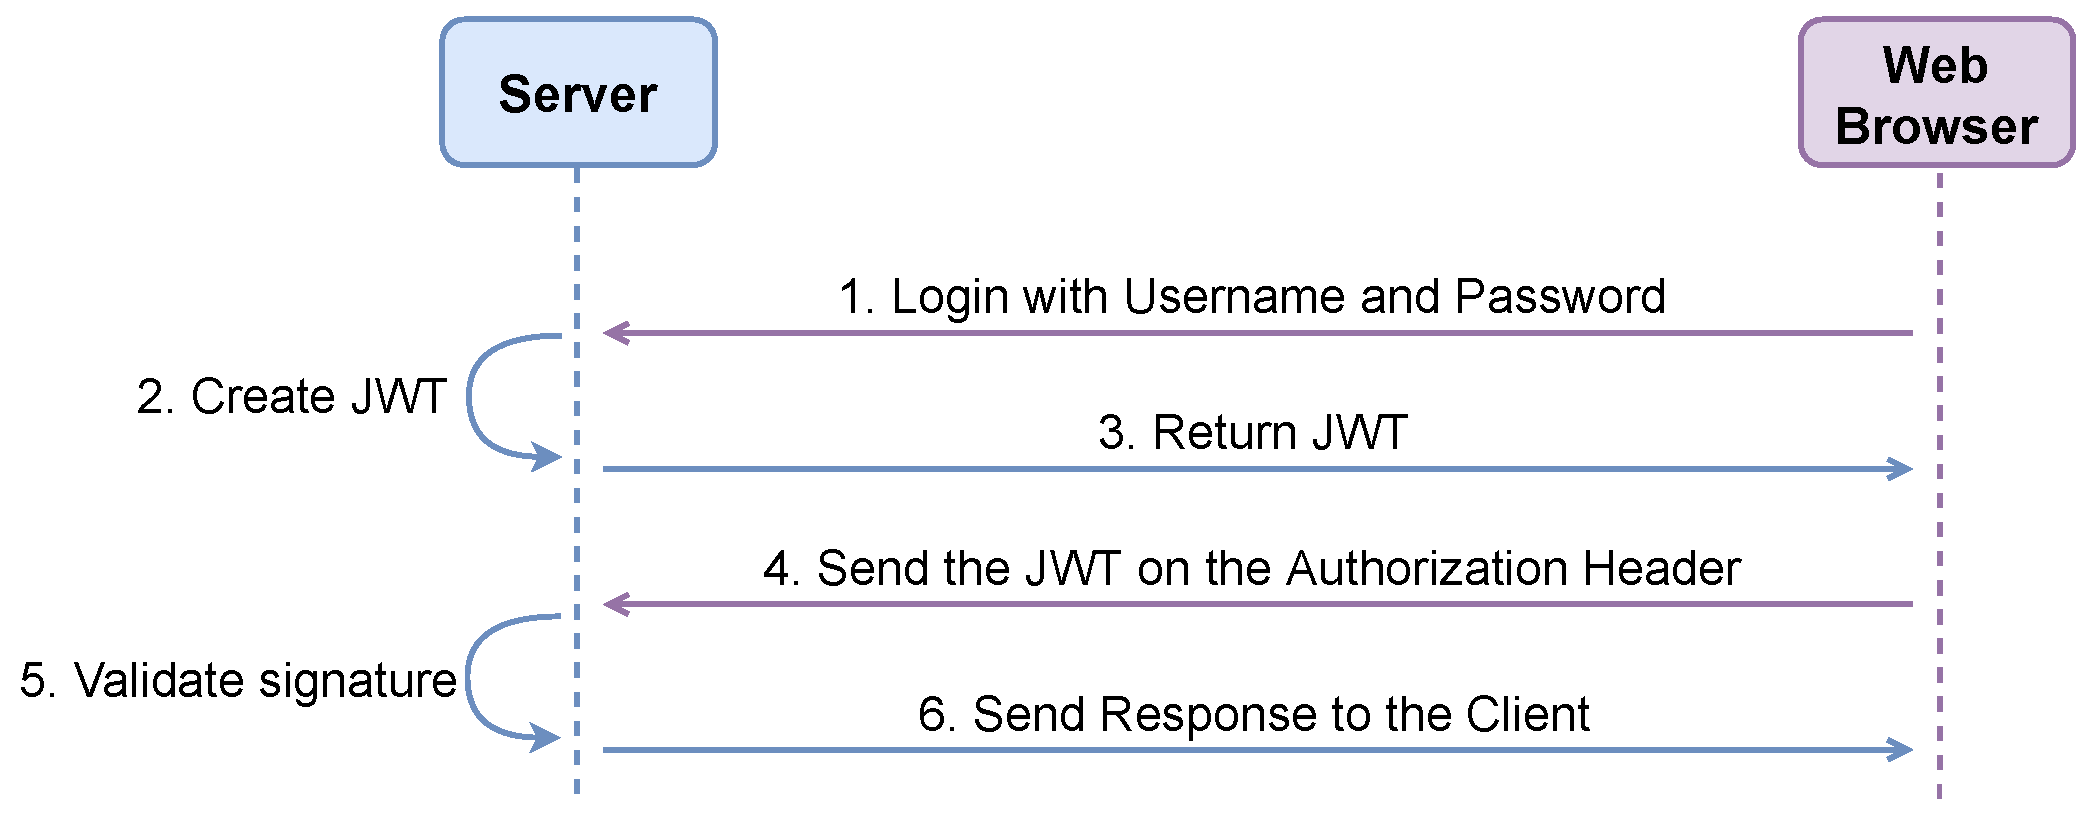
Firstly, we will compare the application architecture. The legacy RnMonitor application is architectured as a monolithic application, where a single application component with all the functionalities is vertically implemented. On the other hand, the RnMonitor application instantiated in the IPVC-S2C is structured as layered, having several different application layers, which are the deployed devices, the communication via LoRaWAN Network, the FIWARE Application Server which supports most of the data management, and the front-end application. In both cases, multiple services are installed, including data management and storage databases, MongoDB and InfluxDB. The legacy RnMonitor access data using APIs, specifically developed in NodeJS, and allows user-friendly data visualization through front-end services and WebGIS technologies, i.e., Geoserver and Openlayers, allowing to display spatial information using maps in a variety of output formats, and Grafana, which directly integrates with a time-series database, enabling rich data visualization based on spatial queries [
26]. To achieve security, authentication via login is deployed, allowing the usage of JSON Web Token (JWT), cf.
Figure 16, a standard for safety passing claims in constrained environments, divided into three different elements: the header, the payload, and the signature/encryption [
54], only allowing valid and signed requests between the front and back-end of the application, to send a response.
To transmit real-time notifications to the end-user, after data reasoning in the analytics engine, the system uses socket-oriented connections, providing, this way, bi-directional communication between the server and the client application [
26].
On the other hand, the application instantiated in IPVC-S2C, as specified in
Section 5.1, consumes multiple microservices and several built-in features that foster the application development. Using the IPVC-S2C platform, each inserted entity represents the state (physical or conceptual) of an object in the real world, in this specific scenario, the IoT Devices, where the current spatio-temporal state must be known at any moment, being the temporal context dynamic, e.g., the variation of parameters such as temperature or radon gas concentration. Since the IPVC-S2C is a smart solution based on data streams, the application must be constantly reacting to changes in the real world.
Regarding the RnMonitor legacy implementation, all the operations related to a change in the state of the system are synchronous, and if contextual changes occur, after reasoning by the analytics engine, the end-user can be notified. On the other hand, by using the IPVC-S2C, an asynchronous notifications mechanism is adopted, which can be subscribed by any application served by the platform, to trigger specific contextual information. In this case, when a certain physical event occurs, the application can disable the permanent poll, or repeat specific query mechanisms. This way, the volume of requests and the amount of data transferred among the system components can be reduced, which results in lower computational resource needs and a faster response time, when compared to the RnMonitor legacy version. Furthermore, the legacy version has a monolithic architecture, its development started from an application requirements list, and all the components and services were implemented from scratch.
On the other hand, the new RnMonitor version, built using the IPVC-S2C platform, includes multiple services that were developed in the legacy and that are already able to be used in this case, such as the northbound port for device communication that enables a secure data collection from the deployed IoT devices and the southbound port for actuation in the real-world. This approach, allows easier and faster application development, removing multiple back-end layers and APIs that have been developed specifically for the legacy version. As a result, the instantiation of the new RnMonitor application in the IPVC-S2C took less than half of the time effort (person/hour) than the legacy version, resulting in a reduction of more than 50% in the final cost.
Regarding the application functionalities, we can consider that the legacy application of RnMonitor is more complete and has more features since it was developed only for that purpose. The application instantiated in the IPVC-S2C allows a faster but less complete integration.
Given the requirements, both applications respond to the needs presented by the end-user, being able to demonstrate the collected data, via dashboards and maps, and providing notifications if a certain condition occurs.
7. Conclusions and Future Work
This paper presented the IPVC Smart & Sustainable Campus (IPVC-S2C) platform design, a testbed for IoT experimentation, providing the IPVC community involvement since it is embedded in a real-life environment, allowing IoT applications to be developed and used effectively to support “smart” decision making in the university campus management. The current research shows the design methodology of an Application-oriented Architecture-AoA that serves as the ground for the specification of a FIWARE-based Smart and Sustainable Campus.
With the use of FIWARE technologies, the design of new applications is simplified and legacy systems in use on the campus integrated. The usage of the Orion Context Broker provides context to data that comes from different IoT Edge devices. Using this AoA, several entities can collect, manage and display data, removing the process of interacting directly with data sources. As an outcome of the project, students have more opportunities to participate in the development of a new IoT-based project which can be used for education context or training for a company.
Future work will be focused on the integration of other existing monolithic applications that are in use on the campus. Context data notifications will also be implemented to advise the responsible user via notification or trigger actions in response to certain conditions. Usability and benchmark tests should be developed and deployed for all applications to evaluate the application flow, security to improve interoperability. The goal of these tests is to ease user interaction and perceptibility. As requested by the community, new FIWARE Generic Enablers that are not displayed in the architecture can be implemented, such as the Cosmos Generic Enabler, enabling simpler Big Data analysis over context which can be integrated with Big Data platforms [
27], improving the quality of the IPVC Smart & Sustainable Campus testbed, offering the community a high performance, life-long open IoT research platform.


