
Resource Optimization-Based Software Risk Reduction Model for Large-Scale Application Development


1
Department of Software Engineering, Faculty of Engineering and CS, National University of Modern Languages, Islamabad 44000, Pakistan
2
College of Computer & Information Sciences, King Saud University, Riyadh 11543, Saudi Arabia
3
Department of Computer Science, Sukkur IBA University, Sukkur 65200, Pakistan
*
Author to whom correspondence should be addressed.
Sustainability 2021, 13(5), 2602; https://doi.org/10.3390/su13052602
Submission received: 15 January 2021
/
Revised: 20 February 2021
/
Accepted: 22 February 2021
/
Published: 1 March 2021
(This article belongs to the Special Issue Sustainable Information Systems)
Abstract
:Software risks are a common phenomenon in the software development lifecycle, and risks emerge into larger problems if they are not dealt with on time. Software risk management is a strategy that focuses on the identification, management, and mitigation of the risk factors in the software development lifecycle. The management itself depends on the nature, size, and skill of the project under consideration. This paper proposes a model that deals with identifying and dealing with the risk factors by introducing different observatory and participatory project factors. It is assumed that most of the risk factors can be dealt with by doing effective business processing that in response deals with the orientation of risks and elimination or reduction of those risk factors that emerge over time. The model proposes different combinations of resource allocation that can help us conclude a software project with an extended amount of acceptability. This paper presents a Risk Reduction Model, which effectively handles the application development risks. The model can synchronize its working with medium to large-scale software projects. The reduction in software failures positively affects the software development environment, and the software failures shall reduce consequently.
1. Introduction
Software development consists of several phases with a clear definition of tasks to be performed in each phase. Phase-wise distribution of software development decreases the amount of burden that can be put on one specific development activity. In the analysis phase, we gather and analyze the requirements, while in the design phase, the system design is generated. Software is developed based on the system’s design, and later it is tested to identify any possible errors. Testing software is done by using several methods to decrease or eliminate all the possible errors. If all these phases are done according to the schedule, the software can meet success, but this is usually not the case due to the diversity in the development activity.
The scenario presented in the above paragraph presents a pleasant picture of the software development lifecycle where there is no problem, and things are being executed with perfection. However, the software development activity is not that easier, especially when we are talking about large-scale application development. In fact, the determination of the project scale in itself is not a very trivial task. Several segregated pieces of information are present in literature [1], which guide us in qualitative terms on how small and large-scale projects can be identified. However, there was lacking information about the scales of the projects in absolute terms. Therefore, it is vital that we identify the project scale with respect to the quantifiable data that we can use to gauge the scale of a software project. In this regard, some work has been done that differentiates the projects based on the quantitative values and identifies if a project is small-medium, or large [2]. The values are in terms of the project factors, and these project factors are the building blocks. The values are assigned to these building blocks (variables) for the resource allocation that these projects will use during their development.
The orientation of risk is a byproduct of misappropriation of resources [3]. It is believed that if the resource allocation can be improved, the orientation of risks and the impact of risks can be reduced. In this research, the project factors work as a controlling segment of the risk factors that can arise during the software development lifecycle. The Risk Reduction Model is set to deal with the projects by improving resource allocation and reducing/eliminating risks in software development. The objective of this research was to enable the software practitioners to eliminate software risks and rationalize the resource allocation by using the risk reduction model. This Risk Reduction Model is the main contribution of this research which will help to optimize resource allocation and minimize software risks.
A recent systematic review [4] has categorized the purpose of the risk management activities in eight categories. According to their classification, the work presented in this paper can be categorized as monitoring and reviewing the risk, and treatment of risk.
2. Literature Review
This section discusses state of the art in software risk management, and different approaches are discussed in this section. To secure the software development life cycle (SDLC) from risks, it is essential to consider project planning and to manage the risks that are expected in the entire software development process. Most of the failures occur because of poor risk management and identification. Therefore, considerable emphasis is given on identifying the risk so that a safeguard strategy can be prepared for that purpose [5]. Benaroch [6] provides some guidelines about the handling of the risks based on their impact. Miller [7] has presented a list of 60 risk factors, while Lin [8] has presented a comprehensive list of the project scheduled risk factors that includes a checklist catalog of 109 risk factors in 12 areas of software projects, including schedule, product, personnel, or customers. A framework [9] presents 194 questions that can help identify the risk factors, to exhibit the level of commitment in identifying, managing, handling, or avoiding the risk factors that can be present in the software development life cycle. Software risk management, over time, has evolved as a demanding discipline with respect to its influence on the software project’s success.
Along with the initiative to address the risks, the right approach/model is to be chosen accordingly. The word ‘approach’ is used to describe a way of handling an issue, while a model provides a top-level view of addressing the issue by using some approach. Sometimes these words are used interchangeably, e.g., Misra [10] has used the words interchangeably for the software risk models. Some approaches are discussed here.
2.1. Halls P2I2 Approach
Hall [11,12] identified that four factors people, process, infrastructure, and implementation, are the core to define and implement the risk management strategy. The people factor is as essential as any plan matters, not how good it is, has to be implemented by the people working in a team. The process factor identifies the process that should be considered to reduce the possible threats of the risk orientation. The infrastructure determines the requirements, resources, and results to undertake risk management in an organization. The implementation factor covers activities like identification, prioritizing, handling, and mitigating the risks. As the model is based on four prime factors, there are some limitations that this model possesses. There is a duplication of tasks in the process and infrastructure and produces redundancy and wastage of resources. This model over-emphasizes team communication, which is subjective in nature. The implementation phase of the model can’t work independently and is based on the rest of the three factors delaying the implementation until other factors are not synchronized.
2.2. Karolak’s Approach
It is a just-in-time approach and has [13] focus on managing the risks in the early phases of software development activity to reduce the time and cost required to manage risks. Karolak has identified some basic risk categories and associates risk factors with them, which are linked with the risk metrics and the questions that belong to the said risk factor and ultimately to the risk category. Miorando [14] has stated that the model is oriented to certain limitations. The questionnaire used in the formation of the model is isolated and not verified by the independent confirmatory studies. The model also lacks the adequate involvement of the users and tries to predict the technology risks directly without user involvement, which may provide inconsistent results.
2.3. Kontio Riskit Approach
The implementation of the Riskit framework [15] helps the individuals to identify and communicate the information, opportunities, and risks to the concerned people to take necessary and immediate actions for rectification. Riskit is also responsible for effectively managing the risk portion of the project, starting from the identification to the monitoring of the risk factors. Talet [16] has mentioned that Konito’s idea is to use the experience and information gained from the previous project to manage risks in the current projects under consideration effectively. Felderer [17] has mentioned that apart from meaningful usage, the model has certain limitations. The model is dependent on the stakeholder’s intentions, and the development activity is not free from their influence. The model also requires that the ‘experience repository’ be well understood before applying this model.
2.4. Deursen and Kuiper’s Approach
Duerson and Kuiper [18] proposed an innovative risk identification approach by considering the project based on primary and secondary facts. Primary facts are relevant to the system where the system is studied. In contrast, secondary facts are relevant to the stakeholders where the requirement documents, contracts, and communications are evaluated to identify any possible risk. After completing this phase, the primary and secondary lists are matched to see if they are consistent with each other. This technique enjoys the benefit of covering the risk both at the micro and macro level of the software system. Ghaleb [19] has mentioned some limitations of this model. Among the model’s limitations, one is that the model advocates the ‘viewpoints’ concept, while it does not broadly discriminate among the system and user viewpoints. Like Kontio’s and Foo’s model, the data used in this mode is non-confirmatory qualitative data. The system is bound to produce inconsistent results when the users are interviewed from varying perspectives.
2.5. Roy’s Approach
Roy [20,21] developed a framework that is considered to have a pro-risk application and is focused on two aspects, namely, business domain and operational domain. The business domain measures the financial and other business points of the environment where the project has to be developed. The operational domain considers the formal modeling of diversified aspects of risk management in the projects. The activities include, but are not limited to, the calculation of risk values, risk assessment, mitigation plan, implementation of the mitigation plan, and continuous monitoring. The model is significantly resource-intensive and observes considerable complexity.
2.6. Tiwana and Keil’s Approach
Tiwana and Keil [22,23] have proposed a swift technique that can help the risk managers to quickly assess the project risks and their impact. The tool was developed as a result of the data gathered from 60 companies based on the questionnaire that was sent to them. This application has the advantage that instead of having the full-fledge detailed application, this is cost-effective and quick in identifying the threats to the system. Along with some features, the model has certain limitations. The model does not observe absolute scaling and has been designed to provide quick and straightforward results. At the cost of simplicity, the model may provide inconsistent results when the measuring scales are not effectively used.
2.7. Misra et al.’s Approach
Misra [10] proposed an innovative idea for risk management, focusing on how the risk origin can be identified very early while the software development starts. The models discussed considers the ‘what’ question regarding the risk management process. At the same time, this approach is inclined to find answers for ‘how’ the process can be detailed enough to find the origin of risks and assess and mitigate them initially. Simultaneously, they are identified to reduce the cost of the project, and the cost of mitigating risks by exploring the strategic dependencies. The model’s application is limited because it is too centric on the activities and does not focus on the people and processes that make these activities work. Along with that, the mitigation support provided in this model is minimal and not adequate in case of absolute disasters.
2.8. Foo and Muruganathan’s Approach
Foo [24] believes that the impact of any risk factor can be quantified, and thus, the uses an approach that is based on a survey to seek opinion and impact of the risks. This way, an ultimate threat level to the system can be defined. Their proposed model is called the Software Risk Assessment Model (SRAM), which takes into consideration the risk at any specific situation to predict the risks. By considering the nine risk factors, they provide a list of three relevant categories, and the assessor chooses the most relevant in their opinion. The prioritized list is prepared based on the assessor’s perception. Foo’s model has certain limitations. The model is based on user feedback and accepts the results without any validation of the results. Single source result accumulations are less authentic than the mixed-method research, where a number of methods work together to confirm each other’s findings. The factors based on which the model has been developed are vague in nature and not well descriptive. It is hard to establish a meaningful understanding without a thorough understanding of the model.
2.9. SEI’s Software Risk Management Approach
SEI’s (Software Engineering Institute) at Carnegie Melon University has elaborated a risk management framework that comprises of three modules
- Software risk evaluation deals with the identification, dealing, and mitigation of the risk factors under consideration for the given projects [25,26]. The module uses a structure called the risk taxonomy. The taxonomy is a defined structure that helps in organizing and classifying the risks into their categories and has been extremely helpful in classifying the risks into different phases like requirements engineering and analysis, design, software development, software testing, contract risks, etc.
- Continuous risk management is a principle-based approach that deals with the process, methods, and tools to help in the continuous management of risks throughout all phases of the software development lifecycle.
- Team risk management is a team-based approach that focuses on developing the process, methods, and tools to determine the relationship between the customer and the teams and also the inter-team communication.
SEI’s model has certain features and limitations. The model is limited in its application as it follows the waterfall approach, and consequent phases can’t be started until the initial phase is completed, hence causes a lot of resources to be wasted. The model also over-emphasizes the need for risk taxonomy and classification of the risks, instead of establishing cohesive ways of addressing the risks in the early stages. It is evident from the presented approaches that each approach has some features and limitations; it is, therefore, vital to present a model that can manage the risks in large-scale application development. In Section 3, Shahzad’s risk reduction model (S-RRM), specifically suitable/applicable to large-scale applications, is presented.
3. Model Formulation
An overview of S-RRM is presented in this section. Risks are caused when anomalies and inconsistencies in resource allocation are observed during the software development activity. The crux of the study is to implement the findings of this research in a way that the risks are reduced, and the resource allocation is rationalized in return. The implementation of the core interests can be observed in the proceeding section, where the model’s application demonstrates the risk reduction and effectiveness is resource allocation. The focus of this study is to implement the findings with the least amount of complexity and a good amount of understanding. This model defines two core objectives, i.e., to rationalize the resource allocation and to minimize (eliminate) software risks.
3.1. Methodology
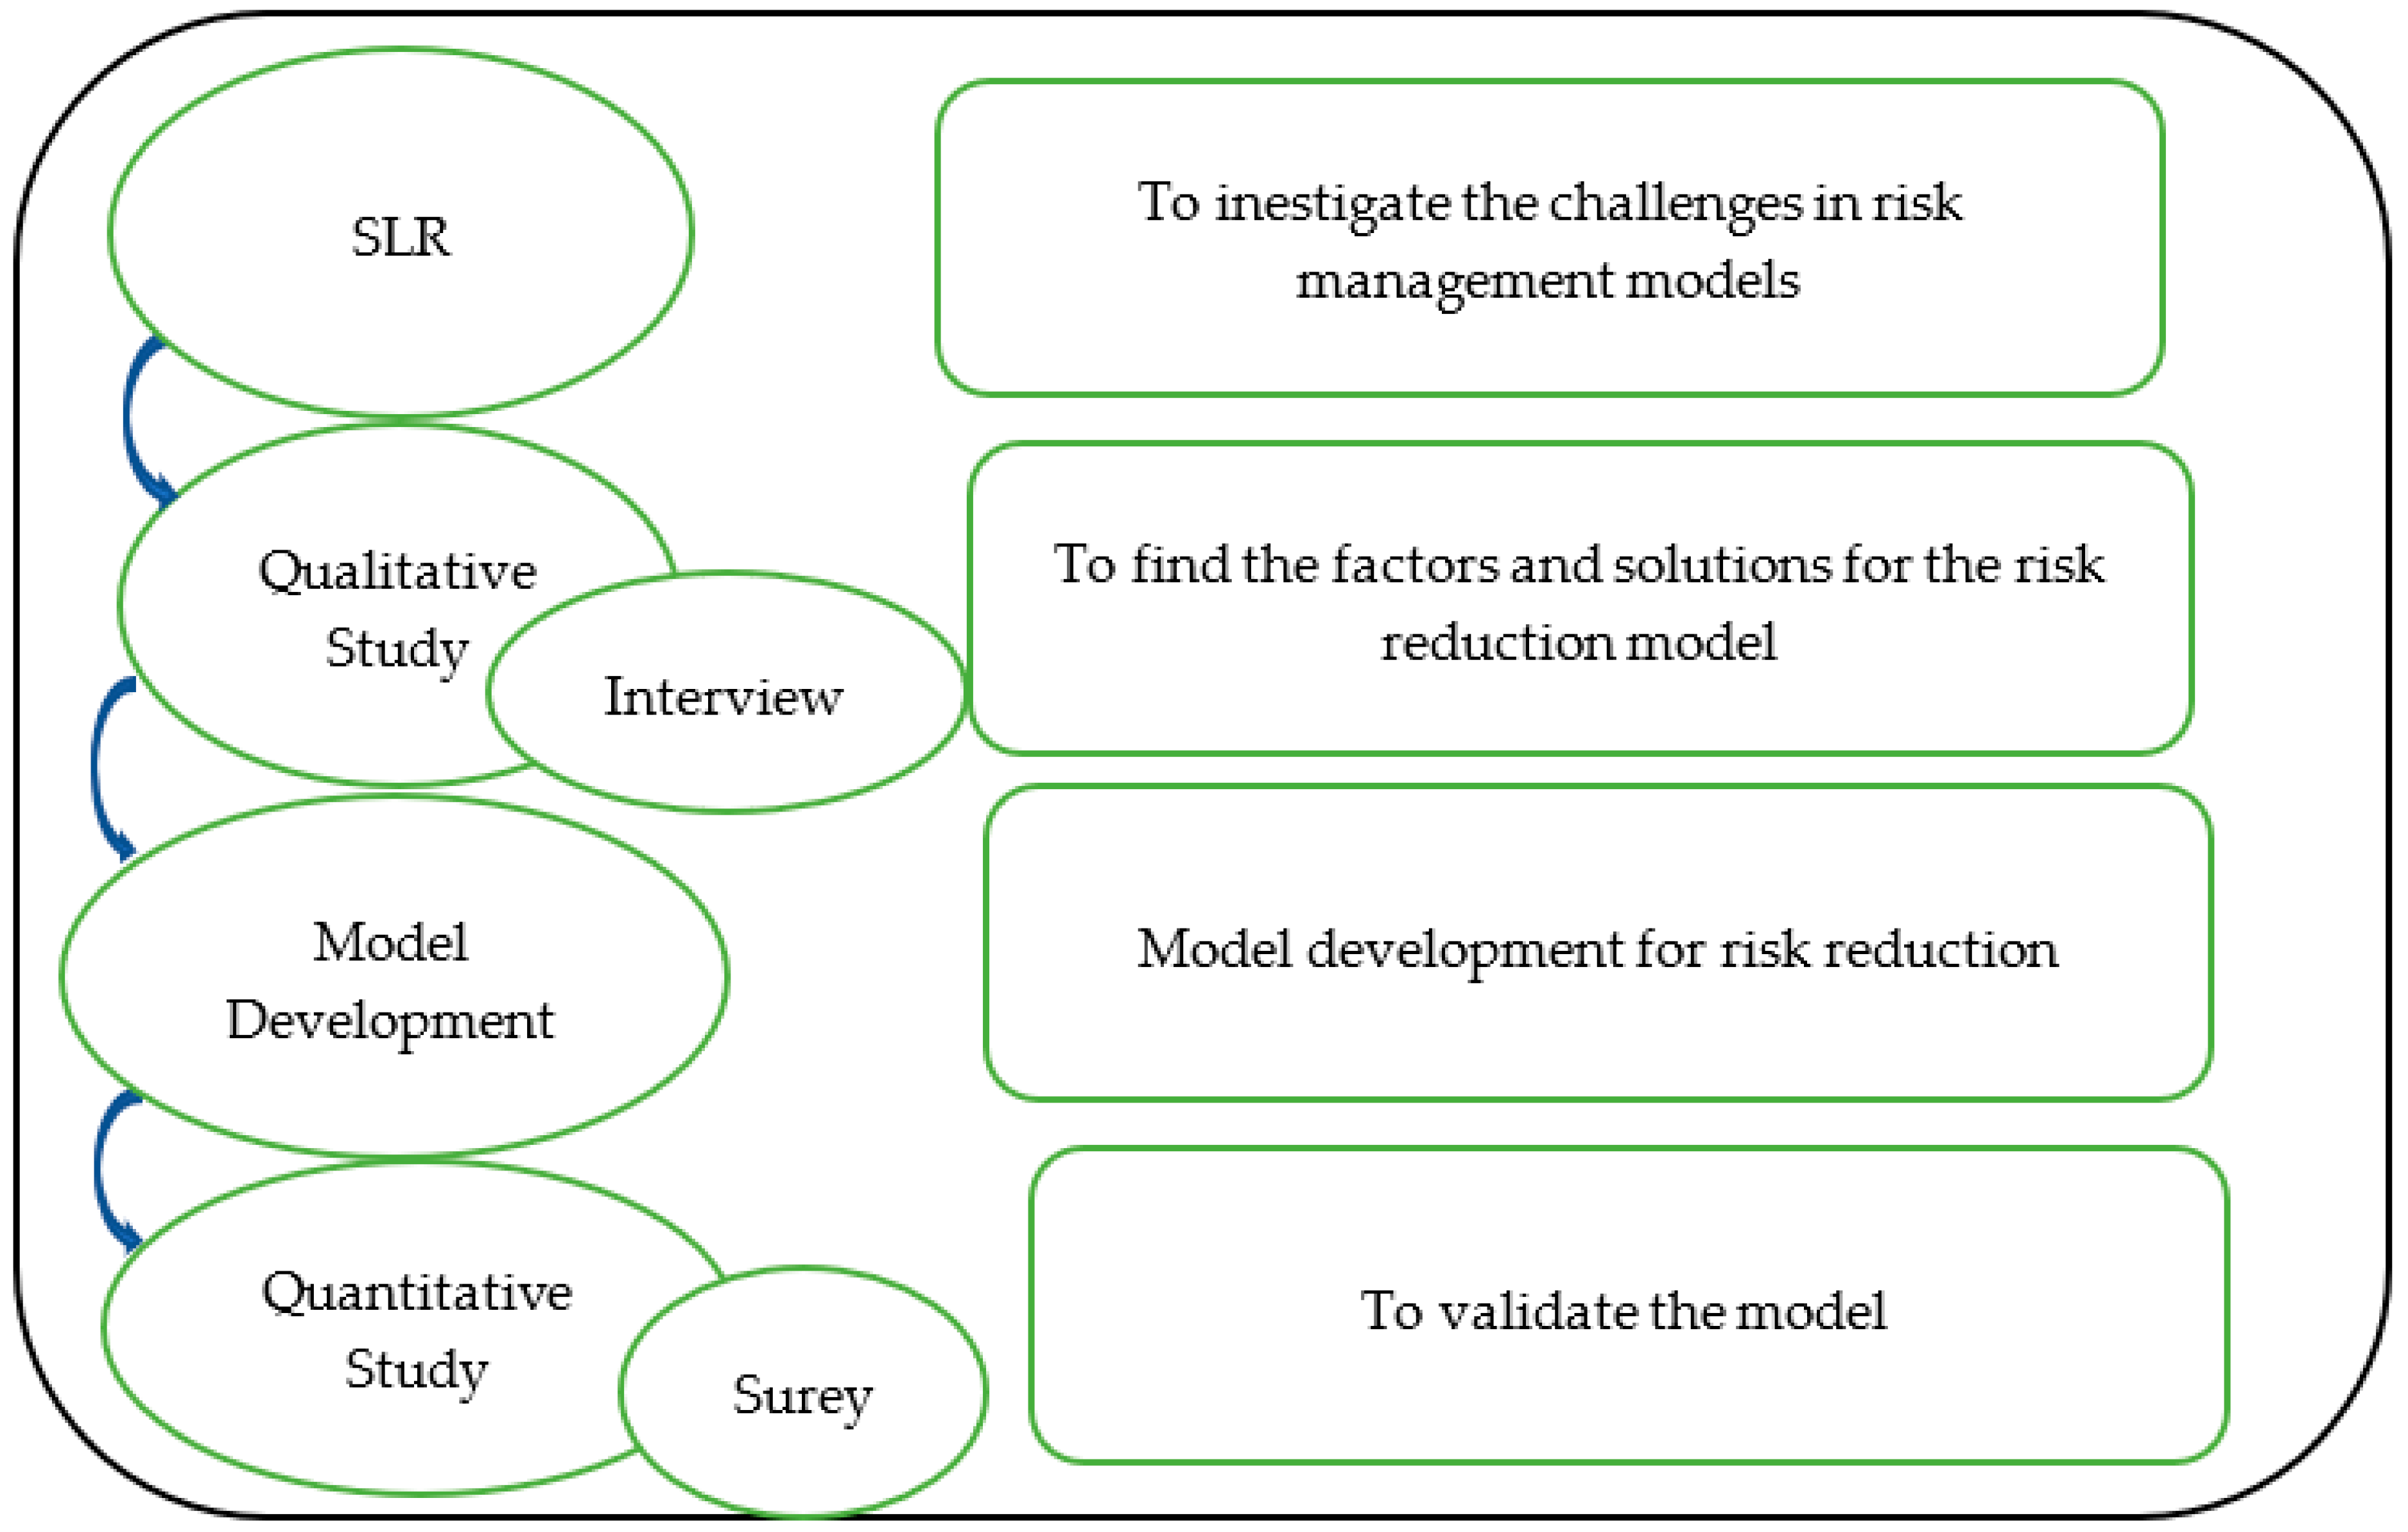
As depicted in Figure 1, for the introduction of risk reduction model, a survey was conducted among experienced respondents in the form of a questionnaire. To validate the findings of the survey, a qualitative research method was applied. In this qualitative method, interviews of experienced respondents were conducted. After evaluation of findings of interviews, a triangulation process was applied to the findings of both survey and interviews. This triangulation process compares and evaluates both results and gives the final more validated and justified results.
Interviews were conducted with eight experts. Five of them were from industry, and three of them were from academia. Details are presented in Table 1. The interpreted results of the interviews were discussed with the respondents in re-interviews. A model was formed on the basis of the findings of the interviews. The model was validated by a survey. The population size of the survey was 169. Most of them were programmers, team leads, and project managers. Details about the survey population are presented in Table 2.
3.2. Components of the Model
The basic components of the model are the project factors, risk factors, and the generic software development model. The model is based on the eight project factors. It is observed that the time, cost, team, and computational resources are four factors that participate in the software development, and they make the lifecycle run by injecting the resources, while the other four factors are observatory factors that observe that if the core of the model is working well or there is any inconsistencies that makes it difficult for the model to work properly.
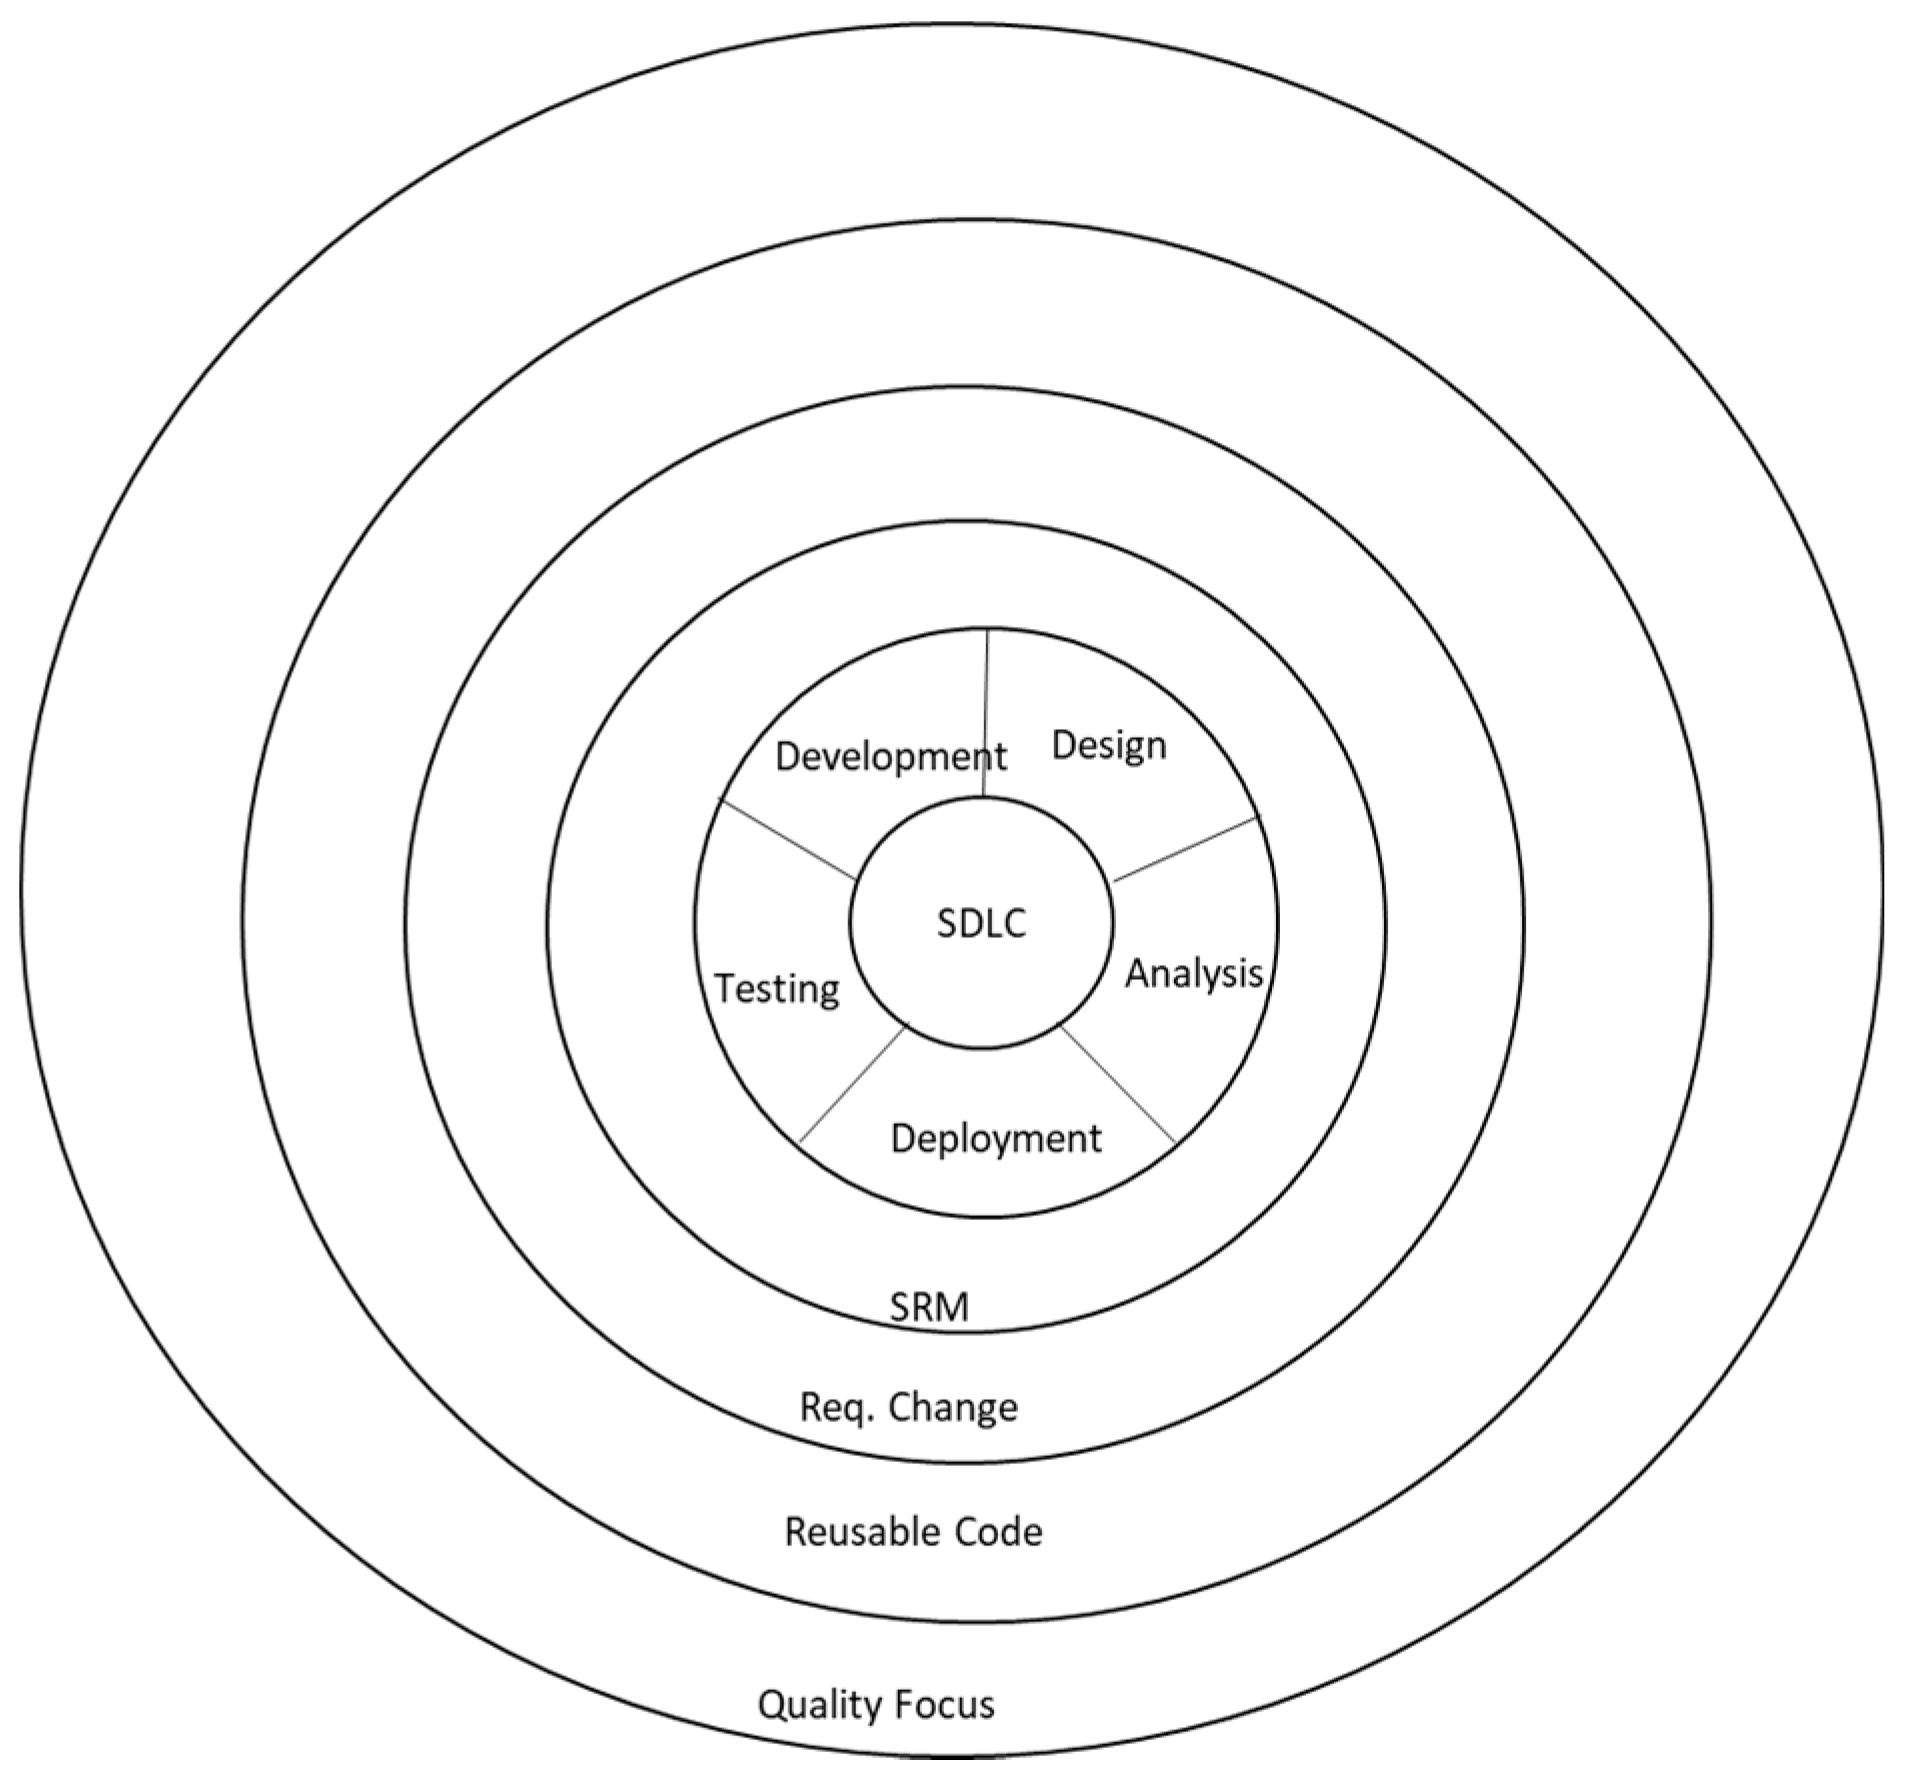
The software development takes place with the participatory factors, while the continuous external observation considers the development quality, e.g., if there are not sufficient allocations for software development, they may be noticed and demonstrated in the working of the model. The inconsistencies have been channelized by partitioning them into specific risk factors. The proposed model uses the generic software development model by considering the analysis, design, development, testing, and deployment activities. Four participatory factors make this model work. The core of the model contains generic steps like Analysis, Design, Development, Testing, and Deployment. Four observatory factors discriminate this model from the other the way that this model specifically represents this study on the resource rationalization by reducing the risks.
Among the observatory factors, the first is ‘requirement change.’ This process starts from the mid of the analysis phase and continues itself until the testing phase. The reason that it starts from the mid-of-analysis is that in the beginning, the requirements are decided, and by the mid of that phase, the chances to change the requirements are extremely low. The ‘requirement change’ can observe the software development that starts and ends with the static requirements, although this is not probable.
Among the observatory factors, the second is ‘reusable code’ that determines that if, at any point in time, there is a need for the reusable code? This begins from the analysis and moves until the testing phase to determine that if such a need arises, the code may be developed. Developing the reusable code can be extremely expensive in the way that it increases the development activity and the cost to test and integrate the component. The third observatory factor is ‘Software Risk Management (SRM)’; the SRM is a continuous process and continues until the life of the process itself. Starting from the analysis phase and moving through to the deployment, it continues observing that if there is any risk factor being triggered and proposes the way to handle the risk. The last factor is ‘quality focus’ that covers the whole process, and like the SRM, representing that the quality focus is observed throughout the software development process.
The generic view of the model demonstrates the working of the model and highlights the role of observatory factors in the model presented in Figure 2. The justification for developing the model comes from the fact that it requires minimal user input and is capable of doing the cost estimation very quickly. At the same time, the model allows customization to be made in the quality process and leads to a rationalized solution based on the given input values. The model can be executed without a deep knowledge of project management, unlike other models. Other models in the domain are effort-intensive and require a deep project management understanding, less customization, and very detailed input for different scales of software.
3.3. Logic
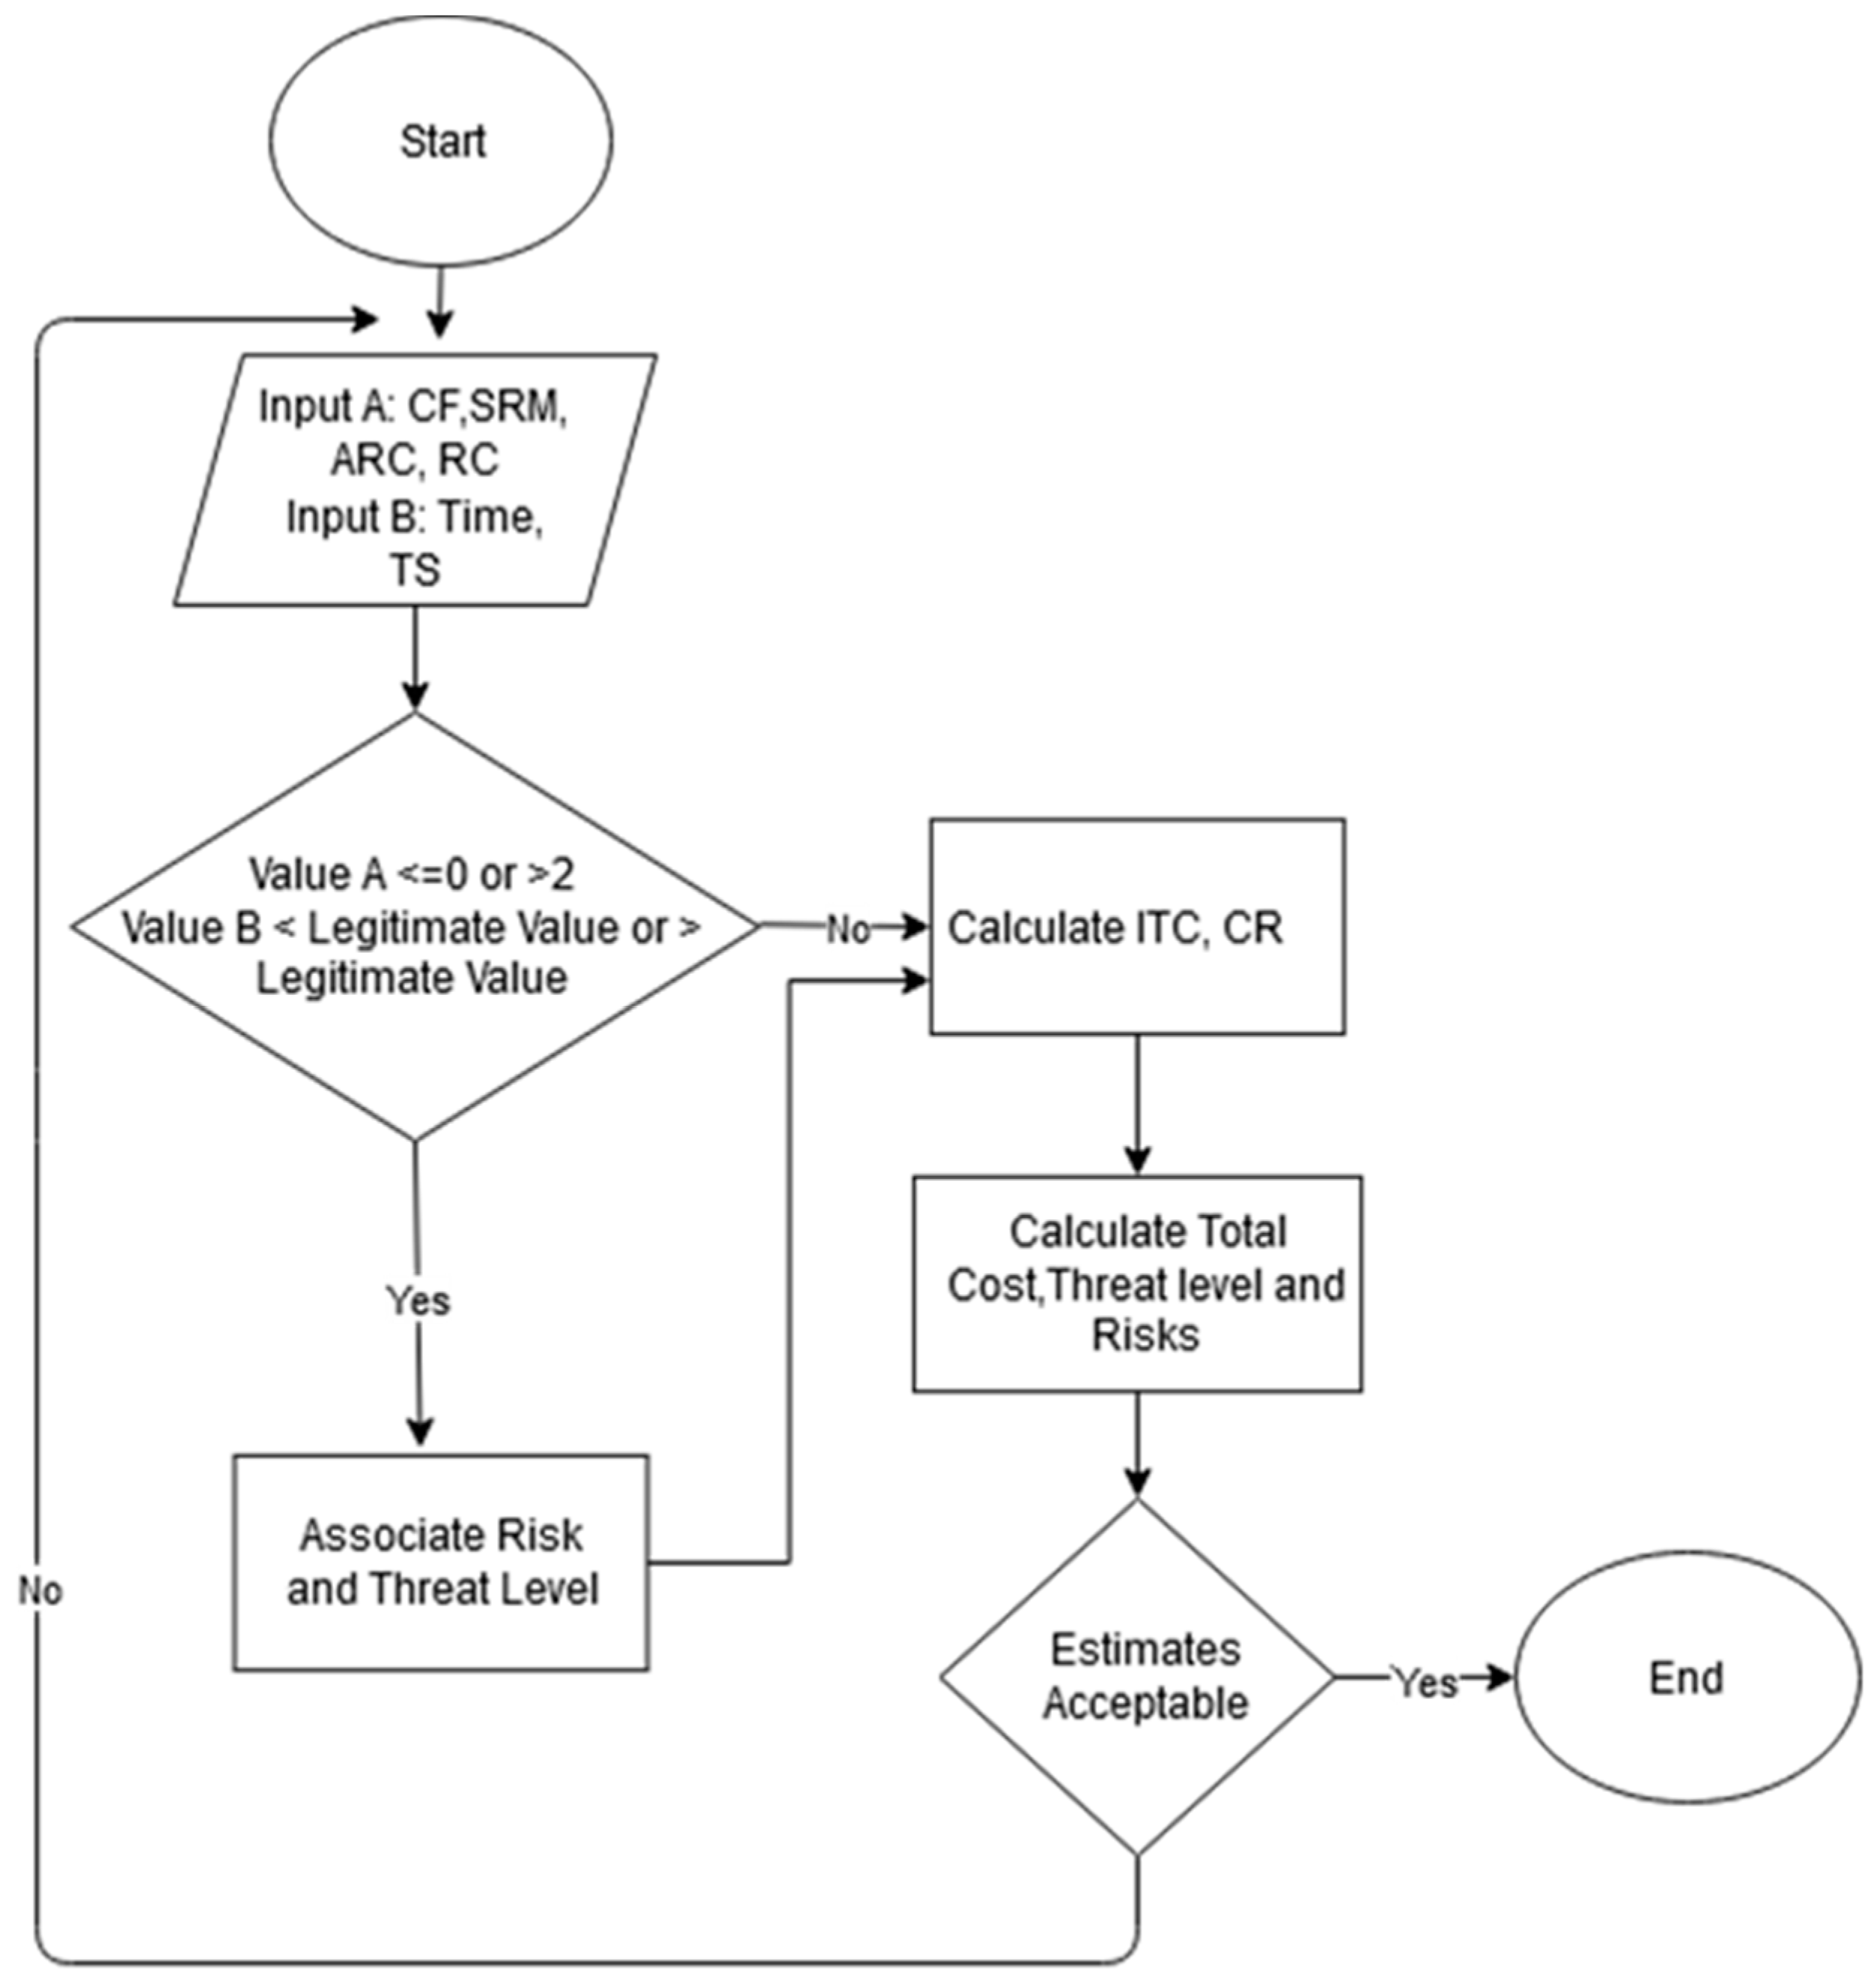
The logic of the model is shown in Figure 3. The initial inputs are the Time, Team Size, and for observatory factors (quality focus, requirement change, software risk management, and availability of reusable code), the initial calculation of cost and computational resource is based on these six input values. The range of legitimate value for these six inputs, has already been identified as a result of a quantitative study, which is further solicited by the findings of the qualitative study, shown in Table 1 [27]. If the values of the four observatory factors or the participatory factors are beyond range, the risks are associated with them, and the threat level is immediately calculated. Based on the initial input, three output values are generated, the total cost, threat level, and the risk factors. This estimate demonstrates the number of risks that may be associated with software development if the activity is started without a change of the input values. The user may like to change the values to their near possible legitimate values, and the estimation can be improved. Shahzad et al.’s work on software risk management [28,29,30,31,32,33] and on cost estimation [34,35,36] present similar findings.
While participatory project factors like cost, time, team size, and computational resources are deterministic and cover the complete software development cycle, the observatory project factors have limited scope in some cases. The ‘Requirement Change (RC)’ is the main resource consumer, it consumes mire resources than the ‘Quality Focus (QF)’, ‘SRM’, and ‘Availability of Reusable Code (ARC).’ As the impact of poor ‘Requirement Change’ handling may be catastrophic, more resources are applied to manage the delayed changes.
Development Cost (DC) = (19 ∗ 40 ∗ Team Size ∗ Time)
Development Cost (DC) = (19 ∗ 40 ∗ Team Size ∗ Time)
Total Cost = CRC + DC + QF + RC + ARC + SRM
SRM = (0.05 ∗ DC ∗ scale)
QF = (0.05 ∗ DC ∗ scale)
ARC = (0.05 ∗ DC ∗ scale)
RC = (0.2 ∗ DC ∗ scale)
Scale [0,1,2]
In (1), the development cost is a multiple of the number of individuals and the time required to develop software. The constant factors—19 represents the wage rate per hour, while 40 is the average-working hour per week. The formulation of Equation (1) is based on the findings of the study on the wage rate analysis [27]. The findings of the study were verified by contemporary analysis. In (2), the cost of the computational resources is set to 10% of the development cost. In (3), the total cost is determined as the sum of the development cost, computational resources cost, and the sum of computational resources cost. Along with this summation, the cost of ‘Requirement Change’, ‘Quality Focus’, ‘SRM’, and ‘Availability of Reusable Code’ are also managed as in (4–7). The scale of the emphasis is determined by (8) having possible values of 0, 1, or 2, depending on the need of the development team. Table 3 and Table 4 defines the equations.
Eight test cases have been prepared by deviating from the above parameters, and the responses of the model have been recorded and demonstrated in ‘Iteration 2’ of each test case.
3.4. Input and Output
Based on the logic of the model proposed and the results of the studies conducted, especially in the domain of the project scaling and the wage rate study, have suggested the following numeric parameters that can be considered for the large-scale projects (Figure 4).
4. Model’s Behaviour
The model consists of the building blocks, shown in Section 3, and the set of values that have been derived from the studies are given in Table 3. A detailed description of the model’s behavior is exhibited by applying the test cases and the case studies using the proposed model. However, it can be observed how the model is going to respond if based on the set of values that are presented in the model as an input. Table 5 tries to model all the possible causes of the set of legitimate and illegitimate values. The range of legitimacy can be observed in Table 3.
The values for ‘Time’ and ‘Team size’ are mandatory, and no estimation can be made without them. The model checks that if the values are in the range of the legitimate values or not. If the fields are not empty, an estimation is made based on the values provided, and if the value is not legitimate, the respective risk factors come into existence. In addition, a respective threat level is introduced. The ‘development cost’ and ‘computational resource cost’ are calculated from the ‘Time’ and ‘Team size’ values and don’t need a separate input. The values for observatory factors cannot be null. A zero means that the concerning factor is not being given any importance while the value like 1, 2 show the level of focus that is being put for that specific observatory factor.
5. Objectives of the Model
The model serves two basic objectives that include the followings:
5.1. Optimize Resource Allocation
Spending on software development activity increases extensively when the development of the lifecycle is de-tracked. It is important to determine the right and required amount of resources to accomplish a given task. As the magnitude of the problem grows, the resource requirement also grows, and effective management of resources helps to improve the software development life cycle. It does this by reducing the utilization of resources to an extent where the used resources exactly match the required resources. The determination of required resources is provided in this study, taking into consideration the literary arguments and the findings of this research.
5.2. Minimize Software Risks
Software risks are the signals that are sent to the software development individuals through the software development lifecycle. It is important that the signal identification mechanism is in place that can determine that the risks are present in the software development lifecycle. Risks are handled based on the priority of handling and the resource of the project under consideration. The risks are only handled if the software firm has sufficient resources to handle them and if there is the awareness that there is a risk. Recognition of the risk is out of the scope of the study, and it is believed that the software team developing the project is well aware of the project risks, and then the decision is made that if the risk is to be handled, avoided, or mitigated.
In broader terms, it can be concluded that the model is responsible for guiding the software team by observing the quality and maturity of the process by compartmentalizing the SRM, requirement change, and reusability issues. It can be concluded that the risks can be decreased (if not eliminated), and as a result, the resources can be optimized to develop the software within time and schedule.
5.3. Variables
The variables used in the introduced model are:
- Time
The software must be completed within a specific time and schedule. To complete software under given time-effective models can be used.
- 2
- Team Size
Team size is the size of developers and all the members included in the process of software development. Less team size will reduce the cost, but the team must be expert.
- 3.
- Dev. Cost
It is the cost spent in the development of overall software, including all resources. The development cost should be according to budget.
- 4.
- Computational Resources
The resources which are necessary to develop software are called computational resources.
- 5.
- Availability of Reusable Code
The code that is already developed and can be reused in the development of software helps to reduce the cost and efforts.
- 6.
- Quality Focus
The quality rate of software must be checked and focused. The quality of software increases its usability and reliability.
- 7.
- Risk Management
To identify, access, and control the risks in software development process is risk management. Risk management helps to mitigate and prevent risks in software.
- 8.
- Requirement Change
It is the change in requirements according to the need for software. If the requirements are non-functional or more ambiguous than there is a need for requirement change to improve the quality of software.
6. Model Verification
The data presented in Table 5 presents the legitimate values that can help reduce risks. It is obvious that risk comes into the system because of inconsistencies and anomalies that, when reduced or eliminated, will help to reduce the risks.
The set of legitimate values has been identified. To validate the working of model 8, different test cases are run, where the data sets presented are unique and inconsistent. The data for test cases were collected from the documents of two software companies. The model in the first phase is capable of identifying the inconsistencies and overruns, and in the second phase, it is capable of reducing the risks by the least possible cost adjustments (sometimes positive and sometimes negative). The overall cost and risks are presented at the end of first.
The model requires inconsistent data to be tested. Due to the nature of the data, the actual development companies refrain from making their failures public; therefore, similar test cases are prepared that, in some cases, are like the actual and officially unshared data. The test cases identify the behavior of the model by deploying the inconsistencies. Inconsistent values are presented in a data set to ensure that the model can manage the inconsistencies and is capable of meeting its objectives. Test cases are used to verify the model.
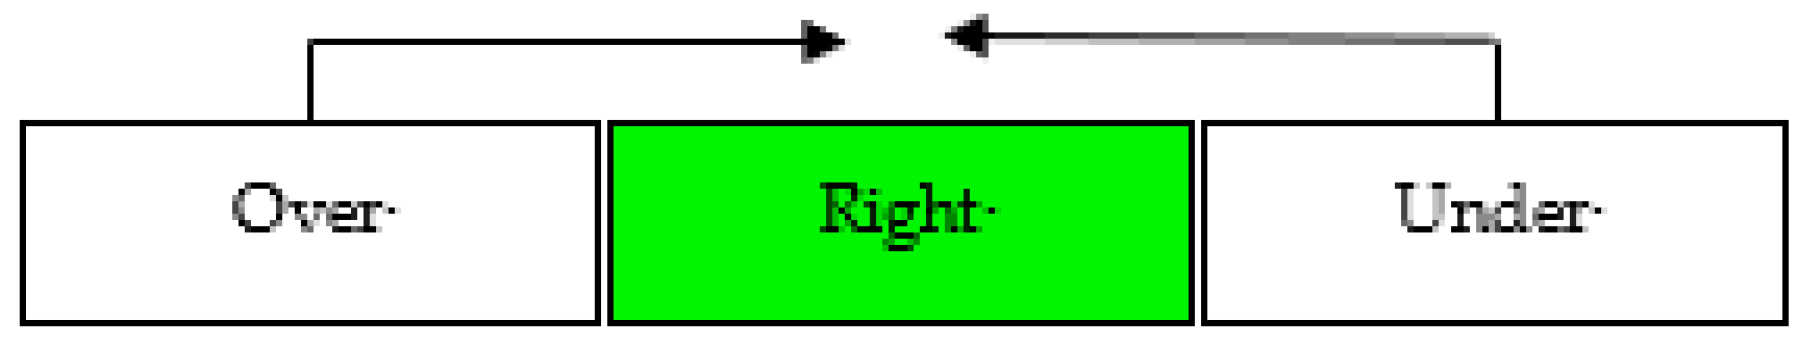
The legitimate ranges of values have been discussed in the previous section, while several test cases have been developed to see the worth of the model. Software resources are required to be placed to complete the software in time and within budget. This is evident from the test cases that sometimes total budget increase from the initial allocations and demonstrates an over allocation. These “over allocations” are the ‘right allocations’ in the perspective of this study, as initial cuts on resources may damage the process itself. At the same time, the model brings over allocations to the right allocations where the resources are being wasted. The concept is demonstrated in Figure 5.
The results of eight test cases have been presented in Table 6, where for 6 out of 10 cases, the cost decreased, while the quality was improved, i.e., both objectives were completely met. In 3 out of 10 cases, the cost was decreased, while the quality remained constant, whereas in 1 case, the cost was increased by improving the quality. The model has optimally performed in all cases and has provided good results. It can be identified that the model proposed is capable of accurately identifying and eliminating the risk factors by optimizing resource utilization. Table 6 provides the statistical evidence.
6.1. Comparison of S-RRM with Existing Models
The COCOMO (Constructive Cost Model) has strength in traceability and user-friendliness, while in the core functions like risk analysis accuracy, it does not perform adequate results, however it is highly effective when the historical data is available. The model has not been tested for accuracy. The SLIM (software lifecycle management) model has its strength in traceability and the input definition, and the model can adjust the objectives. The model does not provide any support for Risk analysis. The model is equally strong in user-friendliness, and in the definition of the model is well structured and descriptive. The proposed model (as an outcome of this research) has the capability to be applied in the initial stages of software development, and it is designed to be there in the initial phases rather than later in the development activity. The model, however does not take into consideration the historical data and estimates based on the available data. The model can adjust to objectives. On test data, the model possessed the accuracy level (meeting to objective) by 90%. The proposed model has extensive support for risk management and is traceable with the extremely simple implementation by developing the risk correlation. The model provides detailed output calculating the cost, risks, suggestions, and threat level of the system. The model also bears the characteristics of being user-friendly.
Like SEER-SEM and COCOMO and unlike the SLIM model, the S-RRM provides an effective risk management module integrated into the model itself to do the continuous monitoring and resolution of the risks orienting to the system. Likewise, the model contains the quality focus, availability of reusable code, and the requirement change factor introduced that are governed throughout the software development life cycle, as shown in Figure 4. Unlike SEER-SEM, COCOMO (who can be applied to medium scale software as well) and the SLIM model, the S-RRM can be applied to the large-scale software development process. There are a number of factors that make it suitable to address large-scale software development.
6.2. Applicability of the Model
The model provides a solution following the generic software development lifecycle. Thus, the model is applicable to the projects being completed in outsourced or in freelancing models. This model can be used in a distributed environment—when the software development activity being executed each geographically distinct location is considered as a distinct unit of development. The model can also be applied within agile environments—when each sprint-cycle is considered as a distinct activity.
7. Discussion
It has been observed that spending on software development activity increases extensively when the development lifecycle is de-tracked. It is important to determine the right and required amount of resources to accomplish a given task. As the magnitude of the problem grows, the resource requirement also grows, and effective management of resources help improve the software development life cycle. It does this by reducing the utilization of resources to an extent where the used resources exactly match the required resources. The determination of required resources is provided in this study, considering the literary arguments and the findings of this research. Software risks are signals sent to software development individuals. It is important that the signal identification mechanism is in place that can determine that the risks are present in the software development lifecycle. The risk reduction model has been introduced in this study, where risks are handled based on the priority of handling and the resource of the projects under consideration. The risks are only handled if the software firm has sufficient resources to handle them and if there is an awareness that there is a risk. In broader terms, it can be concluded that the risk reduction model (RRM) can provide guidelines to the software teams by observing the quality and maturity of the process by compartmentalizing the risk management, requirement change, and reusability issues. It can be concluded that by deploying the RRM, the risks can be decreased (if not eliminated), and as a result, the resources can be optimized to develop the software within time and schedule.
8. Conclusions
It has been noted that investment in software development activities has increased significantly as the development lifecycle is de-tracked. To achieve assigned tasks, it is important to determine the right and required number of resources. With the extent of problems, there is also an increase in the requirement of resources, and effective resource management helps to improve the software development lifecycle. It does this by reducing resource utilization, i.e. the resources used correspond exactly to the resources required. The assessment of the resources required is given in this research, taking into account the literary reasons and the results of this analysis. Software risks are a form of signals which are sent to software developers. These signals must be efficient enough to determine if there is any risk present in the software development life cycle to improve the quality of risk identification mechanisms risk reduction model has been introduced in this research. In the risk reduction model, the risks are handled according to their priority level. If the organization knows about the presence of risk, or has a sufficient budget to handle the risks, then the risks are handled. Thus, it can be inferred that the RRM can provide guidelines to software development teams by tracking the maturity and quality of the process by compartmentalizing risk management, reusability problems, and change of specifications. It can be observed that the risks can be minimized (if not eliminated) by applying the RRM, and as a result, developing the projects on schedule, on time, and under budget. By following the generic software development lifecycle, the RRM model is introduced. The projects that can be outsourced or freelance projects can also use RRM to improve the quality of risk identification. The model can be extended to an agile environment, where each sprint-cycle is perceived to be a distinct operation. This model can be used in a distributed environment where the software development operation being carried out at each geographically distinct location is perceived to be a different development entity.
The model provides a solution following the generic software development lifecycle. Thus, the model is applicable to the projects being completed in outsourced or in freelancing models. This model can be used in a distributed environment—when the software development activity being executed, each geographically distinct location is considered as a distinct unit of development. The model can also be applied within agile environments—when each sprint-cycle is considered as a distinct activity. In the future, this model will be applied to more cases to have more data, and a sensitivity analysis will be conducted to observe the behavior of different variables.
Author Contributions
Conceptualization, B.S. and F.-e-A.; methodology, B.S., F.-e-A., and M.I.; validation, A.A. and M.S.; data curation, M.S., A.A., and M.I.; writing—original draft preparation, B.S., F.-e-A., and A.A.; writing—review and editing, B.S. and F.-e-A.; funding acquisition, F.-e-A. and M.I. All authors have read and agreed to the published version of the manuscript.
Funding
This research was funded by Deanship of Scientific Research at King Saud University, RG-1441-490.
Institutional Review Board Statement
Not applicable.
Informed Consent Statement
Not applicable.
Acknowledgments
The authors extend their appreciation to the Deanship of Scientific Research at King Saud University for funding this work through research group no. RG-1441-490.
Conflicts of Interest
The authors declare no conflict of interest.
References
- Turner, J.R.; Ledwith, A.; Kelly, J. Project management in small to medium-sized enterprises: A comparison between firms by size and industry. Int. J. Manag. Proj. Bus. 2009, 2, 282–296. [Google Scholar] [CrossRef]
- Kozlowski, R.; Matejun, M. Characteristic features of project management in small and medium-sized enterprises. E+M Ékon. Manag. 2016, 19, 33–48. [Google Scholar] [CrossRef]
- Mustafa Bakri Haniza, H.; Mohamed, N.; Said, J. Mitigating asset misappropriation through integrity and fraud risk elements: Evidence emerging economies. J. Finan. Crime 2017, 24, 242–255. [Google Scholar] [CrossRef]
- Masso, J.; Pino, F.J.; Pardo, C.; García, F.; Piattini, M. Risk management in the software life cycle: A systematic literature review. Comput. Stand. Interfaces 2020, 71, 103431. [Google Scholar] [CrossRef]
- Shahzad, B.; Almiudimigh, A.S. Stress testing: Project parameters and limitations. In Proceedings of the Regional Conference on Knowledge Integration in ICT, Kualalampur, Malaysia, 1–2 June 2010. [Google Scholar]
- Benaroch, M.; Jeffery, M.; Kauffman, R.J.; Shah, S. Option-Based Risk Management: A Field Study of Sequential Information Technology Investment Decisions. J. Manag. Inf. Syst. 2007, 24, 103–140. [Google Scholar] [CrossRef]
- Miler, J.; Górski, J. Risk Identification Patterns for Software Projects. Found. Comput. Decis. Sci. 2004, 29, 115–131. [Google Scholar]
- Lin, H.; Lai, A.; Ullrich, R.; Kuca, M.; McClelland, K.; Shaffer-Gant, J.; Pacheco, S.; Dalton, K.; Watkins, W. Cots software selection process. In Proceedings of the 2007 Sixth International IEEE Conference on Commercial-off-the-Shelf (COTS)-Based Software Systems (ICCBSS’07), Banff, AB, Canada, 26 February–2 March 2007. [Google Scholar]
- Roy, G.G.; Woodings, T.L. A framework for risk analysis in software engineering. In Proceedings of the Proceedings Seventh Asia-Pacific Software Engeering Conference, APSEC 2000, Singapore, 5–8 December 2002; pp. 441–445. [Google Scholar]
- Misra, S.C.; Kumar, U.; Kumar VShareef, M.A. Risk management models in software engineering. Int. J. Proc. Manag. Benchmarking 2007, 2, 59–70. [Google Scholar] [CrossRef]
- Royce, W.W. Managing the Development of Large Software Systems (1970). In Proceedings of the Ideas That Created the Future; The MIT Press: Cambridge, MA, USA, 2021; pp. 321–332. [Google Scholar]
- Hall, A. Proceedings of the 9th international conference on Software Engineering; IEEE Computer Society Press: Monterey, CA, USA, 1987. [Google Scholar]
- Karolak, D.W.; Karolak, N. Software Engineering Risk Management: A Just-in-Time Approach; IEEE Computer Society Press: Monterey, CA, USA, 1995. [Google Scholar]
- Miorando, R.F.; Ribeiro, J.L.D.; Cortimiglia, M.N. An economic–probabilistic model for risk analysis in technological innovation projects. Technovation 2014, 34, 485–498. [Google Scholar] [CrossRef]
- Kontio, J. Software Engineering Risk Management: A Method, Improvement Framework, and Empirical Evaluation; Helsinki University of Technology: Espoo, Finland, 2001. [Google Scholar]
- Talet, A.N.; Mat-Zin, R.; Houari, M. Risk management and information technology projects. Int. J. Dig. Inform. Wirel. Commun. 2014, 4, 1–10. [Google Scholar]
- Felderer, M.; Schieferdecker, I. A taxonomy of risk-based testing. Int. J. Softw. Tools Technol. Transf. 2014, 16, 559–568. [Google Scholar] [CrossRef] [Green Version]
- Deursen, A.v.; Kuipers, T. Identifying objects using cluster and concept analysis. In Proceedings of the 21st International Conference on Software Engineering, Los Angeles, CA, USA, 22 May 1999; pp. 246–255. [Google Scholar]
- Ghaleb, T.A.; Alsri, A.A.; Shabaneh, L.; Niazi, M. A Survey of Project Risk Assessment and Estimation Models. In Proceedings of the World Congress on Engineering, London, UK, 2–4 June 2014. [Google Scholar]
- Keil, M.; Cule, P.E.; Lyytinen, K.; Schmidt, R.C. A framework for identifying software project risks. Commun. ACM 1998, 41, 76–83. [Google Scholar] [CrossRef]
- Schmidt, R.; Lyytinen, K.; Keil, M.; Cule, P. Identifying Software Project Risks: An International Delphi Study. J. Manag. Inf. Syst. 2001, 17, 5–36. [Google Scholar] [CrossRef]
- Tiwana, A.; Keil, M. Functionality Risk in Information Systems Development: An Empirical Investigation. IEEE Trans. Eng. Manag. 2006, 53, 412–425. [Google Scholar] [CrossRef]
- Tiwana, A.; Keil, M. The one-minute risk assessment tool. Commun. ACM 2004, 47, 73–77. [Google Scholar] [CrossRef]
- Foo, S.-W.; Muruganantham, A. Software risk assessment model. In Proceedings of the Proceedings of the 2000 IEEE International Conference on Management of Innovation and Technology. ICMIT 2000. ‘Management in the 21st Century’ (Cat. No.00EX457), Singapore, 12–15 November 2000; p. 24. [Google Scholar]
- Alberts, C.; Audrey, D. A Framework for Categorizing Key Drivers of Risk. In Technical Report CMU/SEI-2009-TR-007; Software Engineering Institute, Carnegie Mellon University: Pittsburgh, PA, USA, 2009. [Google Scholar]
- Alberts, C.; Audrey, D. Risk Management Framework; Software Engineering Institute, Carnegie Mellon University: Pittsburgh, PA, USA, 2010. [Google Scholar]
- Shahzad, B.; Aziz, R.; Said, A. Using Wage Rate Analysis to Determine Software Project Scale. Res. J. Appl. Sci. Eng. Technol. 2014, 8, 221–225. [Google Scholar] [CrossRef]
- Shahzad, B.; Safvi, S.A. Effective risk mitigation: A user prospective. Int. J. Math. Comput. Simul. 2008, 2, 70–80. [Google Scholar]
- Lali, M.I.U.; Mustafa, R.U.; Saleem, K.; Nawaz, M.S.; Zia, T.; Shahzad, B.; Kalloubi, F.; Nfaoui, E.H.; El Beqqali, O. Finding Healthcare Issues with Search Engine Queries and Social Network Data. Int. J. Semantic Web Inf. Syst. 2017, 13, 48–62. [Google Scholar] [CrossRef]
- Shahzad, B.; Afzal, M.T. Optimized solution to shortest job first by eliminating the starvation. In Proceedings of the The 6th Jordanian Inr. Electrical and Electronics Eng. Conference (JIEEEC 2006), Amman, Jordan, 14–16 March 2006. [Google Scholar]
- Alwagait, E.; Shahzad, B. Maximization of Tweet’s viewership with respect to time. In Proceedings of the 2014 World Symposium on Computer Applications & Research (WSCAR), Sousse, Tunisia, 18–20 January 2014. [Google Scholar]
- Shahzad, B.; Afzal, M.T. Enhanced Shell Sorting Algorithm. Int. J. Computer Inform. Eng. 2007, 21, 528–532. [Google Scholar]
- Shahzad, B.; Al-Ohali, Y.; Abdullah, A. Trivial model for mitigation of risks in software development life cycle. Int. J. Phys. Sci. 2011, 6, 2072–2082. [Google Scholar]
- Yaseen, S.; Abbas, S.M.A.; Anjum, A.; Saba, T.; Khan, A.; Malik, S.U.R.; Ahmad, N.; Shahzad, B.; Bashir, A.K. Improved Generalization for Secure Data Publishing. IEEE Access 2018, 6, 27156–27165. [Google Scholar] [CrossRef]
- Al-Muhtadi, J.; Shahzad, B.; Saleem, K.; Jameel, W.; Orgun, M.A. Cybersecurity and privacy issues for socially integrated mobile healthcare applications operating in a multi-cloud environment. Heal. Inform. J. 2017, 25, 315–329. [Google Scholar] [CrossRef]
- Shahzad, B.; Ullah, I.; Khan, N. Software Risk Identification and Mitigation in Incremental Model. In Proceedings of the 2009 International Conference on Information and Multimedia Technology, Jeju, Korea, 16–18 December 2009; pp. 366–370. [Google Scholar]
- Van Solingen, R.; Rico, D.F. Calculating Software Process Improvement’s Return on Investment. In Advances in Computers; Elsevier BV: Amsterdam, The Netherlands, 2006; pp. 1–41. [Google Scholar]
- Ma, X.; Fu, H. The Research on the Influence of Foreign Exchange Rate on the Outsourcing: Chinese Case Empirical Study. In Proceedings of the 2011 International Conference on Management and Service Science, Wuhan, China, 12–14 August 2011; pp. 1–4. [Google Scholar]
Figure 1.
Methodology.

Figure 2.
Generic software development cycle with observatory factors. SDLC, software development life cycle; SRM, Software Risk Management.
Figure 2.
Generic software development cycle with observatory factors. SDLC, software development life cycle; SRM, Software Risk Management.

Figure 3.
Shahzad’s risk reduction model’s (S-RRM’s) logic.

Figure 4.
Proposed model.

Figure 5.
Under-over-and right allocations.


Table 1.
Respondents of interviews.
| No. | Experience Type | Rank | Experience in Years | Development Experience | Scale | ||
|---|---|---|---|---|---|---|---|
| S | M | L | |||||
| 1 | Academic | Professor | 20 | Yes | √ | √ | |
| 2 | Academic | Assistant Professor | 6 | Yes | √ | ||
| 3 | Industry | Team Leader | 8 | Yes | √ | √ | |
| 4 | Industry | Project Manager | 12 | Yes | √ | √ | |
| 5 | Industry | Team Leader | 7 | Yes | √ | √ | |
| 6 | Academic | Professor | 17 | Yes | √ | ||
| 7 | Academic | PhD student | 2 | Yes | √ | ||
| 8 | Industry | Software Developer | 5 | Yes | √ | √ | |
Table 2.
Survey population details.
| Measure | Number |
|---|---|
| Confidence Level | 95% |
| Confidence Interval | 5 |
| Population | * |
| Population accessed | 300 |
| Sample Size | 169 |
| percentage | 50 |
* Unknown population size
Table 3.
The range of legitimate values to reduce risk.
| Factor | Large-Scale |
|---|---|
| Time (weeks) | 53–100 |
| Team Size | 26–50 |
| Cost | Time × Team Size × 19 |
| Computational Resources | 10% cost |
| Availability of reusable code | 0,1,2 |
| Quality Focus | 0,1,2 |
| Risk management | 0,1,2 |
| Requirement Change | 0,1,2 |
Table 4.
Explanation of the equations.
| No. | Equations | Purpose | Source | |
|---|---|---|---|---|
| 1 | Development cost = (19 ∗ 40 ∗ Team size ∗ Time) | The user inputs the variables, while the constant 19 is the wage rate per hour; 40 means the total working hours in a week | Study on wage rate analysis in Section 3. | |
| Constant | 19, 40 | |||
| variable | Team Size, Time | |||
| 2 | Computational resource Cost is a constant and is fixed at 10% of the development cost | As mentioned in Section 3. | ||
| Constant | 0.1 | |||
| Variable | Computational resource cost | |||
| 3 | The scale is a variable, and its value varies from 0–2. Zero being no change and 2 being massive changes, while DC is also a variable. Constant is 0.05, which shows the intensity of changes. | Software development is developed in 5 phases, meaning that each phase consumes approximately 20% of resources. If the changes are not major, the resources required to complete them are ¼ of the total time required for one phase. | ||
| Constant | 0.05 | |||
| Variable | Scale, DC | |||
| 4 | Each software development phase consumes approximately 20% of resources. If the changes are not major, the resources required to complete them are ¼ of the total time required for one phase. | |||
| Constant | 0.05 | |||
| Variable | Scale, DC | |||
| 5 | ARC=(0.05*DC*scale) | Software development is generally divided into 5 phases, meaning that each phase consumes approximately 20% of resources. If the changes are not major, the resources required to complete them are ¼ of the total time required for one phase. | ||
| 6 | Software development is generally divided into 5 phases, meaning that each phase consumes approximately 20% of resources. | |||
| Constant | 0.20 | |||
| Variable | Scale, DC | |||
| 7 | Determines the intensity of change to be done. | |||
| Variable | 0,1,2 | |||
| 8 | Adds cost of computational resources, development cost, requirement change cots, quality focus, and cost of doing risk management. | |||
| Variable | ||||
Table 5.
Model’s behavior against a set of legitimate/illegitimate values.
| Behavior | |||||
|---|---|---|---|---|---|
| Factor | Type | Input | Null | Legitimate | Illegitimate |
| Time (weeks) | Direct Input | Mandatory | No Calculation | Total cost and the resource allocation for each factor | Total cost and the resource allocation for each factor with risks and threat level |
| Team Size | Direct Input | Mandatory | No Calculation | Total cost and the resource allocation for each factor | Total cost and the resource allocation for each factor with risks and threat level |
| Dev. Cost | Calculated from Time and Team Size | Assertive | Not Possible | Legitimate if the time and team size are legitimate | Illegitimate if either time or team size is illegitimate |
| Computational Resources | Calculated from Dev. Cost | Not Possible | Legitimate if the time and team size are legitimate | Illegitimate if either time or team size is illegitimate | |
| Availability of reusable code | Direct Input | Default value is 0 | Not Possible | 0 is a legitimate value but contains the risk factors | 1,2 are legitimate values to eliminate risks and the threat level. |
| Quality Focus | Direct Input | Default value is 0 | Not Possible | 0 is a legitimate value but contains the risk factors | 1,2 are legitimate values to eliminate risks and the threat level. |
| Risk management | Direct Input | Default value is 0 | Not Possible | 0 is a legitimate value but contains the risk factors | 1,2 are legitimate values to eliminate risks and the threat level. |
| Requirement Change | Direct Input | Default value is 0 | Not Possible | 0 is a legitimate value but contains the risk factors | 1,2 are legitimate values to eliminate risks and the threat level. |
Table 6.
Test cases for large-scale projects.
| Time | TS | Cost | CR | QF | RC | ARC | SRM | Risks | Threat | Total Cost | Cost/Quality | |
|---|---|---|---|---|---|---|---|---|---|---|---|---|
| Test Case # 1 | 115 | 55 | 4,807,000 | 480,700 | 1 | 1 | 1 | 0 | T [1,2,37], TS [3,6,8], SRM [3,6] | 22.77(8, 7.94,6.83) | 6,729,800 | |
| RRM | 100 | 50 | 3,800,000 | 380,000 | 1 | 1 | 1 | 1 | Nil | 0 | 5,510,000 | D/I |
| Test Case # 2 | 40 | 40 | 1,216,000 | 106,400 | 1 | 1 | 1 | 0 | T [1,2,37], SRM [3,6] | 15.86 (8,7.86) | 1,687,200 | |
| RRM | 53 | 26 | 1,047,280 | 106,704 | 1 | 1 | 1 | 1 | Nil | 0 | 1,520,532 | D/I |
| Test Case # 3 | 55 | 60 | 2,508,000 | 250,800 | 2 | 2 | 2 | 0 | TS [3,6,8], SRM [3,6] | 15.9(7.94,7.86] | 4,263,600 | |
| RRM | 53 | 50 | 2,014,000 | 201,400 | 2 | 2 | 2 | 1 | Nil | 0 | 3,524,500 | D/I |
| Test Case # 4 | 55 | 75 | 3,135,000 | 313,500 | 2 | 2 | 2 | 2 | TS [3,6,8] | 7.94 | 5,643,000 | |
| RRM | 53 | 50 | 2,014,000 | 209,000 | 2 | 2 | 2 | 2 | Nil | 0 | 3,632,800 | D/NC |
| Test Case # 5 | 115 | 23 | 2,010,200 | 139,840 | 0 | 2 | 2 | 2 | T [1,2,37], TS [3,6,8], QF [2] | 21.77 (8,7.94,5.83) | 3,356,160 | |
| RRM | 100 | 26 | 1,976,000 | 158,080 | 1 | 2 | 2 | 2 | Nil | 0 | 3,418,480 | I/I |
| Test Case # 6 | 50 | 35 | 1,330,000 | 553,000 | 1 | 1 | 1 | 1 | T [1,2,37], CR [9] | 12.08 (8,4.08) | 2,348,500 | |
| RRM | 53 | 35 | 1,409,800 | 143,640 | 1 | 1 | 1 | 1 | Nil | 0 | 2,046,870 | D/NC |
| Test Case # 7 | 55 | 25 | 1,800,000 | 13,200 | 1 | 1 | 1 | 0 | TS [3,6,8], CR [9], Cost [8,9,37,38], SRM [3,6] | 26.8(7.94,4.08,6.92, 7.86) | 2,353,200 | |
| RRM | 53 | 26 | 1,047,280 | 104,728 | 1 | 1 | 1 | 1 | Nil | 0 | 1,518,556 | D/I |
| Test Case # 8 | 55 | 25 | 1,800,000 | 13,200 | 2 | 2 | 2 | 2 | TS [3,6,8], CR [9], Cost [8,9,37,38] | 18.94(7.94,4.08,6.92) | 3,073,200 | |
| RRM | 53 | 26 | 1,047,280 | 104,728 | 2 | 2 | 2 | 2 | Nil | 0 | 1,885,104 | D/NC |
Publisher’s Note: MDPI stays neutral with regard to jurisdictional claims in published maps and institutional affiliations. |
© 2021 by the authors. Licensee MDPI, Basel, Switzerland. This article is an open access article distributed under the terms and conditions of the Creative Commons Attribution (CC BY) license (http://creativecommons.org/licenses/by/4.0/).
Share and Cite
MDPI and ACS Style
Shahzad, B.; Fazal-e-Amin; Abro, A.; Imran, M.; Shoaib, M. Resource Optimization-Based Software Risk Reduction Model for Large-Scale Application Development. Sustainability 2021, 13, 2602. https://doi.org/10.3390/su13052602
AMA Style
Shahzad B, Fazal-e-Amin, Abro A, Imran M, Shoaib M. Resource Optimization-Based Software Risk Reduction Model for Large-Scale Application Development. Sustainability. 2021; 13(5):2602. https://doi.org/10.3390/su13052602
Chicago/Turabian StyleShahzad, Basit, Fazal-e-Amin, Ahsanullah Abro, Muhammad Imran, and Muhammad Shoaib. 2021. "Resource Optimization-Based Software Risk Reduction Model for Large-Scale Application Development" Sustainability 13, no. 5: 2602. https://doi.org/10.3390/su13052602
Note that from the first issue of 2016, this journal uses article numbers instead of page numbers. See further details here.