Article

Examining the Dynamics and Determinants of Energy Consumption in China’s Megacity Based on Industrial and Residential Perspectives

1
Key Lab of Guangdong for Utilization of Remote Sensing and Geographical Information System, Guangdong Open Laboratory of Geospatial Information Technology and Application, Guangzhou Institute of Geography, Guangdong Academy of Sciences, Guangzhou 510070, China
2
Department of Resources and Urban Planning, Xinhua College of Sun Yat-sen University, Guangzhou 510520, China
3
School of Geography and Planning, Sun Yat-sen University, Guangzhou 510275, China
4
School of Geography, Geomatics and Planning, Jiangsu Normal University, Xuzhou 221116, China
5
School of Architecture and Urban Planning, Guangdong University of Technology, Guangzhou 510090, China
6
College of Geographic Science, Shanxi Normal University, Linfen 041000, China
*
Authors to whom correspondence should be addressed.
Sustainability 2021, 13(2), 764; https://doi.org/10.3390/su13020764
Submission received: 5 January 2021 / Revised: 12 January 2021 / Accepted: 12 January 2021 / Published: 14 January 2021
(This article belongs to the Special Issue Urban Energy Systems Adaptation to Future Climate)

Abstract

:
Cities are regarded as the main areas for conducting strategies for energy sustainability and climate adaptation, specifically in the world’s top energy consumer—China. To uncover dynamic features and main drivers for the city-level energy consumption, a comprehensive and systematic city-level total energy consumption accounting approach was established and applied in China’s megacity, which has the highest industrial electricity consumption. Compared with previous studies, this study systematically analyzes drivers for energy consumption based on industrial and residential perspectives. Additionally, this study analyzes not only the mechanisms by which population size, economic growth, and energy intensity affect energy consumption but also the effects of population and industry structural factors. According to the extended Logarithmic mean Divisia index (LMDI) method, the main conclusions drawn from this research are as follows: (1) The total energy consumption of Suzhou presented an overall increasing trend, with 2006–2012 as a rapid growth stage and 2013–2016 as a moderate growth stage. (2) The energy consumption structure was mainly dominated by coal, which was followed by outsourced electricity and natural gas. (3) Scale-related factors have dominated changes in energy consumption, and structural and technological factors have had profound effects on energy consumption in different development periods. (4) Population size and economic output were the main drivers for increments in industrial energy consumption, whereas energy intensity and economic structure performed the important curbing effects. The income effect of urban residents was the biggest driver behind the increase in residential energy consumption, whereas energy intensity was the main limiter. These findings provide a scientific basis for an in-depth understanding of the determinants of the evolution of urban energy consumption in China’s megacity, including similar cities or urban areas in the developing world.

1. Introduction

As public resources for human survival and social and economic development, energy resources are basic material resources for modern societies and are the most powerful engine for regional economic development [1,2]. Particularly, since the Industrial Revolution, the acquisition of affordable, stable, and clean energy supplies has become the cornerstone of economic growth and social prosperity worldwide [3]. Additionally, since the reforms and opening-up of China’s economy, the rapid process of industrialization and urbanization has made the country’s total energy production and consumption grow rapidly [4,5]. China has already become the world’s largest energy producer and consumer. As of 2016, the total global primary energy consumption had reached 13.276 billion tons of oil equivalent, and 23% of which was consumed by China [6].
The rapid economic growth and energy consumption in China have increased the pressure to guarantee its energy supply and security, which has also brought a series of problems in the fields of ecology and the environment [7,8]. Under the pressure of global climate change and ecological and environmental protection, controlling energy consumption is not only a need for the sustainable development of China but also an urgent requirement for the whole world [9,10,11,12]. To actively respond to the energy issue, in the “11th Five-year Plan” (2006–2010), the energy consumption per unit gross domestic product (GDP) aimed to be reduced by approximately 20% by 2010 compared with 2005. In 2009, the Chinese government made a commitment at the Copenhagen Climate Conference that the country will have its proportion of non-fossil energy consumption reach 15% by 2020. Moreover, in the “12th Five-year Plan” (2011–2015), the energy consumption per unit GDP was proposed to be reduced by 16%, and the proportion of non-fossil energy should account for 11.4% of the primary energy consumption by 2015. In 2013, the State Council drew the red line for energy consumption in 2015 to keep the total at four billion tons of standard coal equivalent (tce). Furthermore, in the “13th Five-year Plan” (2016–2020), the energy consumption per unit GDP is proposed to be reduced by 15%, and the proportion of non-fossil energy shall account for 15% of primary energy consumption by 2020. In the “13th Five-year Plan” Development Plan for Energy, the National Energy Administration proposed for the first time that the entire country had to implement dual control of energy intensity and total energy consumption during the “13th Five-year Plan” period. Therefore, ecological, clean, and efficient energy uses are the core of China’s energy strategy [13].
Based on a geographical perspective, research on a country’s energy consumption issues should not only make assessments in terms of changes to the total but also consider the changes in the regional pattern. Moreover, the country must implement national energy conservation, emission reduction, and consumption reduction policies from the perspective of the regional spatial pattern to provide them with clearer pertinence and better operability [14,15]. Cities are areas in which human economic and social activities are concentrated, and industrial production and urban life consume considerable energy [16]. Approximately 85% of China’s carbon emissions come from urban energy consumption, and this proportion is far higher than that of the European Union and the United States, which are 69% and 80%, respectively [17]. Therefore, understanding the increasing trend of energy consumption on a city scale and its influencing factors will be important to control total energy consumption and reduce energy consumption intensity [18,19,20]. Additionally, an in-depth analysis of the urban energy system is regarded as the main measure for conducting policy and regulation for energy transition and sustainability, especially for climate mitigation and adaptation in the future.
Presently, studies regarding urban energy consumption can be roughly divided into those with a few main goals. Examples include estimating and accounting of total energy consumption, determining the influencing factors of total energy consumption and their mechanisms of action, analyzing scenarios and having a simulation prediction of total energy consumption, and recommending implementation paths and policy measures for energy conservation and emission reduction. Among them, accounting for total energy consumption is the basis of energy system research. Moreover, analyzing the influencing factors of total energy consumption is the key to the implementation of scenario analysis and the formulation of energy conservation and emission reduction measures. Regarding urban statistics, energy consumption data for urban areas are comparatively limited, whether on a city or an industry scale [21]. Data collection is the precondition to calculate total energy consumption on a city scale, and the key issue in this accounting is the determination of urban boundaries and the scope of accounting. The first type of accounting system is for total direct energy consumption within the boundaries of a city. Then, the second type is for outsourced energy, electricity, heat, and others outside the boundaries of a city. Finally, the third type is for the embodied energy in a city, such as the consumption of goods and services [22,23]. The accounting methods for total urban energy consumption mainly include the inventory analytical method [24], the input–output (IO) analytical method [25], the life cycle analysis (LCA) method [26,27], and the night light data [28]. The applicability of the inventory analytical method is relatively high. Its advantages are in the time series analysis of continuous periods, which account for the total energy consumption based on different industrial sectors and energy types [21,24].
Research on the influences of energy consumption on a city scale mainly uses methods, such as index decomposition analysis (IDA), structural decomposition analysis (SDA), or regression analysis, to analyze the key influencing factors of growth in urban energy consumption. As shown in Table 1, the IDA-based logarithmic mean Divisia index (LMDI) method has been widely applied to research on the influencing factors of energy consumption and its carbon emissions on a city or regional scale [29,30,31,32,33]. For example, Fernández González used the IDA-based LMDI method to uncover the driving factors of energy consumption intensity in 20 European Union countries from 1995 to 2010 [34]. Jung et al. adopted the LMDI method to identify the main drivers for energy-related carbon emissions in eco-industrial parks in South Korea [35], their results confirmed the role of reduced energy intensity in eco-industrial parks in reducing energy-related emissions. Cansino et al. used the LMDI method with six decomposition factors to evaluate the performance of Chile’s energy-related emissions and found that energy intensity is the main curbing factor [36]. Moreover, Wang et al. combined the LMDI method and C-D production function to analyze the driving factors dominating China’s energy consumption in 1991–2011 [37]. Then, Ma et al. adopted the LMDI and decoupling methods to confirm whether the carbon intensity in the commercial building sector decouples from economic development in China’s top five urban agglomerations [38]. Chen et al. decomposed energy-related emission changes using the LMDI method in 2000–2011 in Macao [39]. Chong et al. also examined the influencing factors of energy consumption in Guangdong in 2004–2014 using the LMDI method [40]. Then, Gu et al. used the LMDI method to explore determinants of energy-related carbon emission changes in 1995–2016 in Shanghai [41]. Furthermore, Shao et al. adopted the extended LMDI method to explore techno-economic drivers of energy-related industrial carbon emission changes in Shanghai in 1994–2011 [42]. Research on these city or regional scale energy consumptions and carbon emissions have provided a useful reference for understanding the composition and evolutionary trends in total urban energy consumption and its underlying mechanism.
Research on energy consumption in China at the city scale has mostly focused on metropolises, such as Beijing and Shanghai [58,59,60]. Additionally, their large populations and economic aggregation have given these cities a high total energy consumption (Figure 1). Using total electricity consumption in a city as an example, the electricity consumption in Suzhou has presented a rapidly increasing trend since 2000, growing from 19 billion kWh in 2000 to 102 billion kWh in 2010 and then 150 billion kWh in 2017. The total electricity consumption of Suzhou has grown steadily nearer to that of Shanghai, which ranks first in China. Moreover, the industrial electricity consumption in Suzhou exceeded that of Shanghai in 2009. Hence, the former became the city with the highest industrial electricity consumption among the seven cities with the largest GDP in the entire country and has maintained this increasing trend. In 2017, the industrial electricity consumption in Suzhou was higher than that of the sum of Guangzhou and Shenzhen; Tianjin and Chongqing; and Beijing and Shanghai. As a major industrial city in China and a second-batch low-carbon pilot city, Suzhou is in a critical period of transitional upgrade and innovative development. Thus, the city urgently should adopt new industrialization technologies with low energy consumption and low emissions. Suzhou is facing strong pressures for energy conservation, emission reduction, and consumption reduction. Hence, the city urgently should transform its own industrial structure, optimize its energy structure, and improve its technological level to accomplish the goals of energy conservation, emission reduction, and consumption reduction. This background highlights the necessity of learning the basic underlying causes of energy consumption including the influencing factors of energy consumption.
The marginal contributions of this research are as follows: (1) This study achieves meticulous energy consumption accounting by the energy type and industry sector on a city scale. (2) This study further expands and optimizes the LMDI model by drawing lessons from classic IDA theory and the Kaya identity equation to analyze the factors influencing energy consumption. (3) This study analyzes not only the mechanisms by which population size, economic output, and energy intensity affect energy consumption but also the effects of population structural factors and industry structural factors.

2. Methodology and Data Collection

2.1. City-Level Total Energy Consumption Accounting

The inventory analytical method is currently one of the more widely applied methods for energy consumption and carbon emission accounting on a city scale. This method mainly refers to the technical process of greenhouse gas emission inventory compiled by the Intergovernmental Panel on Climate Change (IPCC) [61]. This study adopts the accounting process based on the energy balance table [21,24] because of the inconsistency in the statistical data on energy in China [62]. The objectives are to account for the total energy consumption in Suzhou by energy variety and industry type and screen the dominant energy varieties and key industry categories of energy consumption.
The specific accounting processes for total energy consumption in Suzhou are as follows: (1) The accounting period was determined to be from 2006 to 2016. (2) The total energy consumption of industrial enterprises above the designated size by the sector and type was directly obtained from the Suzhou Statistical Yearbook. However, particular attention was paid to the statistical item of “comprehensive energy consumption = total production and consumption of various energy industries − secondary energy yield of processing and conversion.” During conversion to total energy consumption, attention was paid to the deduction of the amount of coke in repeated calculations. (3) The total energy consumption of the industrial enterprises was calculated from the reverse deduction of the industrial enterprises above the designated size. In this process, certain ratios and empirical parameters were used to convert raw coal, gasoline, diesel, fuel oil, liquefied petroleum gas, natural gas, and liquefied natural gas. Nevertheless, the consumption of cleaned coal and coke by the industrial enterprises above the designated size prevailed. (4) For the total energy consumption of the primary industry, the construction industry, tertiary industry, and residents’ living activities, data on the total energy consumption of Jiangsu Province by the sector and type were used as an essential reference. The Energy Balance Table of Jiangsu Province (Physical Quantity) was used as the basis for decomposition. Additionally, the primary, construction, and tertiary industries were decomposed according to the percentage of added value. The residential consumption was decomposed according to the proportion of the urban to the rural population. Meanwhile, the statistical data on energy for Jiangsu Province and Suzhou were incomplete. Hence, the total energy consumption of Jiangsu Province was mainly gathered from the Jiangsu Statistical Yearbook and the China Statistical Yearbook. Then, the data on total energy consumption by the sector and type were mainly based on the China Energy Statistical Yearbook and the Energy Balance Table of Jiangsu Province (physical quantity) for calculation and sorting. (5) Based on the principle of total energy balance, although simultaneously using relevant research reports and policy documents as references to verify the data, the data on total energy consumption by the sector and type for the entire Suzhou from 2006 to 2016 were systematically constructed.

2.2. Extended LMDI Method Based on the Kaya Identity

Based on the index number theory [63,64], an IDA aims to uncover the impacts of a number of pre-defined factors on an aggregate of interest [64], which begins with defining a governing function [65]. IDA has been popularly adopted in energy and environmental studies [66] since it was first use to analyze industrial energy consumption in the late 1970s and 1980s [64], as shown in Table 1. In the course of IDA application and optimization, from Ang’s systematic elaboration on methods, such as the Laspeyres index decomposition and Divisia index decomposition [67], the LMDI was recommended for the decomposition of the total index [44]. This method not only eliminates the decomposition residual error in the Laspeyres method but also solves the “0” value problem in the Divisia method [66]. Compared with various IDA methods, the LMDI method is the preferred one [44,65].
The Kaya identity equation is one of the best-known IDA methods [68,69,70] and decomposes total energy consumption into three influencing factors as follows:
E = P × ( G P ) × ( E G )
where P represents the population size, G represents the GDP, E represents total energy consumption, G/P represents per capita GDP, and E/G represents the energy consumption intensity.
However, the classic Kaya identity equation evidently fails to consider all the effects of structural changes, such as in the economic structure (G), energy structure (E), and population structure (P), on energy consumption. Given the current evolutionary trend of diversification in the industry structure and the urban–rural population structure [23], we further expanded and optimized the classic Kaya identity equation as follows:
E = E 1 + E 2 + E 3 + E 4 + E 5 + E 6
where Ei represents energy consumption by agriculture (i = 1), energy consumption by production (i = 2), energy consumption by construction (i = 3), energy consumption by service (i = 4), energy consumption by urban residents (i = 5), and energy consumption by rural residents (i = 6).
Formula (2) can be expressed as:
E 1 = E 1 G D P 1 × G D P 1 G D P × G D P P × P = e 1 × s 1 × g × p
E 2 = E 2 G D P 2 × G D P 2 G D P × G D P P × P = e 2 × s 2 × g × p
E 3 = E 3 G D P 3 × G D P 3 G D P × G D P P × P = e 3 × s 3 × g × p
E 4 = E 4 G D P 4 × G D P 4 G D P × G D P P × P = e 4 × s 4 × g × p
E 5 = E 5 T I u r b a n × A I u r b a n × P u r b a n P × P = e 5 × A I u r b a n × U R × p
E 6 = E 6 T I r u r a l × A I r u r a l × P r u r a l P × P = e 6 × A I r u r a l × ( 1 U R ) × p
where GDPi (i = 1, 2, 3, 4) represents the GDP of agriculture, industry, the construction industry, and the service industry, respectively; p = P represents the total population size; g is the per capita GDP; ei (i = 1, 2, 3, 4, 5, 6) is the energy consumption intensity of industries and residents; si (i = 1, 2, 3, 4) is the industrial structure; Purban and Prural represent the urban and rural population sizes, respectively; TIurban and TIrural characterize the total income of urban and rural residents, respectively; AIurban and AIrural represent the per capita income of urban and rural people; and UR is the urbanization level.
The difference in total energy consumption from Years 0 to T is referred to as the total effect ΔE, whose formula is
Δ E = E T E 0 = Δ E p + Δ E g + Δ E e i + Δ E s i + Δ E A I u r b a n + Δ E A I r u r a l + Δ E U R + Δ E P r u r a l
Finally, ΔE was further decomposed without a residual by using the further expanded and optimized LMDI decomposition technique [44,66]:
Δ E p = i = 1 6 ( E i t E i 0 ln E i t ln E i 0 ln ( p t p 0 ) )
Δ E g = i = 1 4 ( E i t E i 0 ln E i t ln E i 0 ln ( g i t g i 0 ) )
Δ E e i = i = 1 6 ( E i t E i 0 ln E i t ln E i 0 ln ( e i t e i 0 ) )
Δ E s i = i = 1 4 ( E i t E i 0 ln E i t ln E i 0 ln ( s i t s i 0 ) )
Δ E A I u r b a n = E 5 t E 5 0 ln E 5 t ln E 5 0 ln ( A I u r b a n t A I u r b a n 0 )
Δ E A I r u r a l = E 6 t E 6 0 ln E 6 t ln E 6 0 ln ( A I r u r a l t A I r u r a l 0 )
Δ E U R = E 5 t E 5 0 ln E 5 t ln E 5 0 ln ( U R t U R 0 )
Δ E P r u r a l = E 6 t E 6 0 ln E 6 t ln E 6 0 ln ( P r u r a l t P r u r a l 0 )
According to Formulas (10)–(17), the mechanism of action for energy consumption can be decomposed into the following: the population size effect (ΔEp–effect), the economic output effect (ΔEg–effect), the energy intensity effect (ΔEe–effect), the economic structure effect (ΔEs–effect), the urbanization effect (ΔEUR–effect), and the income effect of urban and rural residents (ΔEAI–effect).

2.3. Data Sources

The population size, population structure, economic aggregate, industry structure, and energy data used in this study came from the Suzhou Statistical Yearbook (2007–2017), Jiangsu Statistical Yearbook (2007–2017), China Statistical Yearbook (2007–2017), and China Energy Statistical Yearbook (2007–2017), including the statistical bulletins of the relevant years, which mainly included the population size, total urban and rural population, GDP, and industrial value-added. Other data included the energy consumption of industrial enterprises above the designated size by the sector and type in Suzhou from 2006 to 2016, the total energy consumption in Jiangsu Province by the sector and type, and the Energy Balance of Jiangsu Province (Physical Quantity). To enhance the comparability of the data, the GDP and the GDP by the industry are expressed in 2006 prices.

3. Empirical Analysis in Suzhou

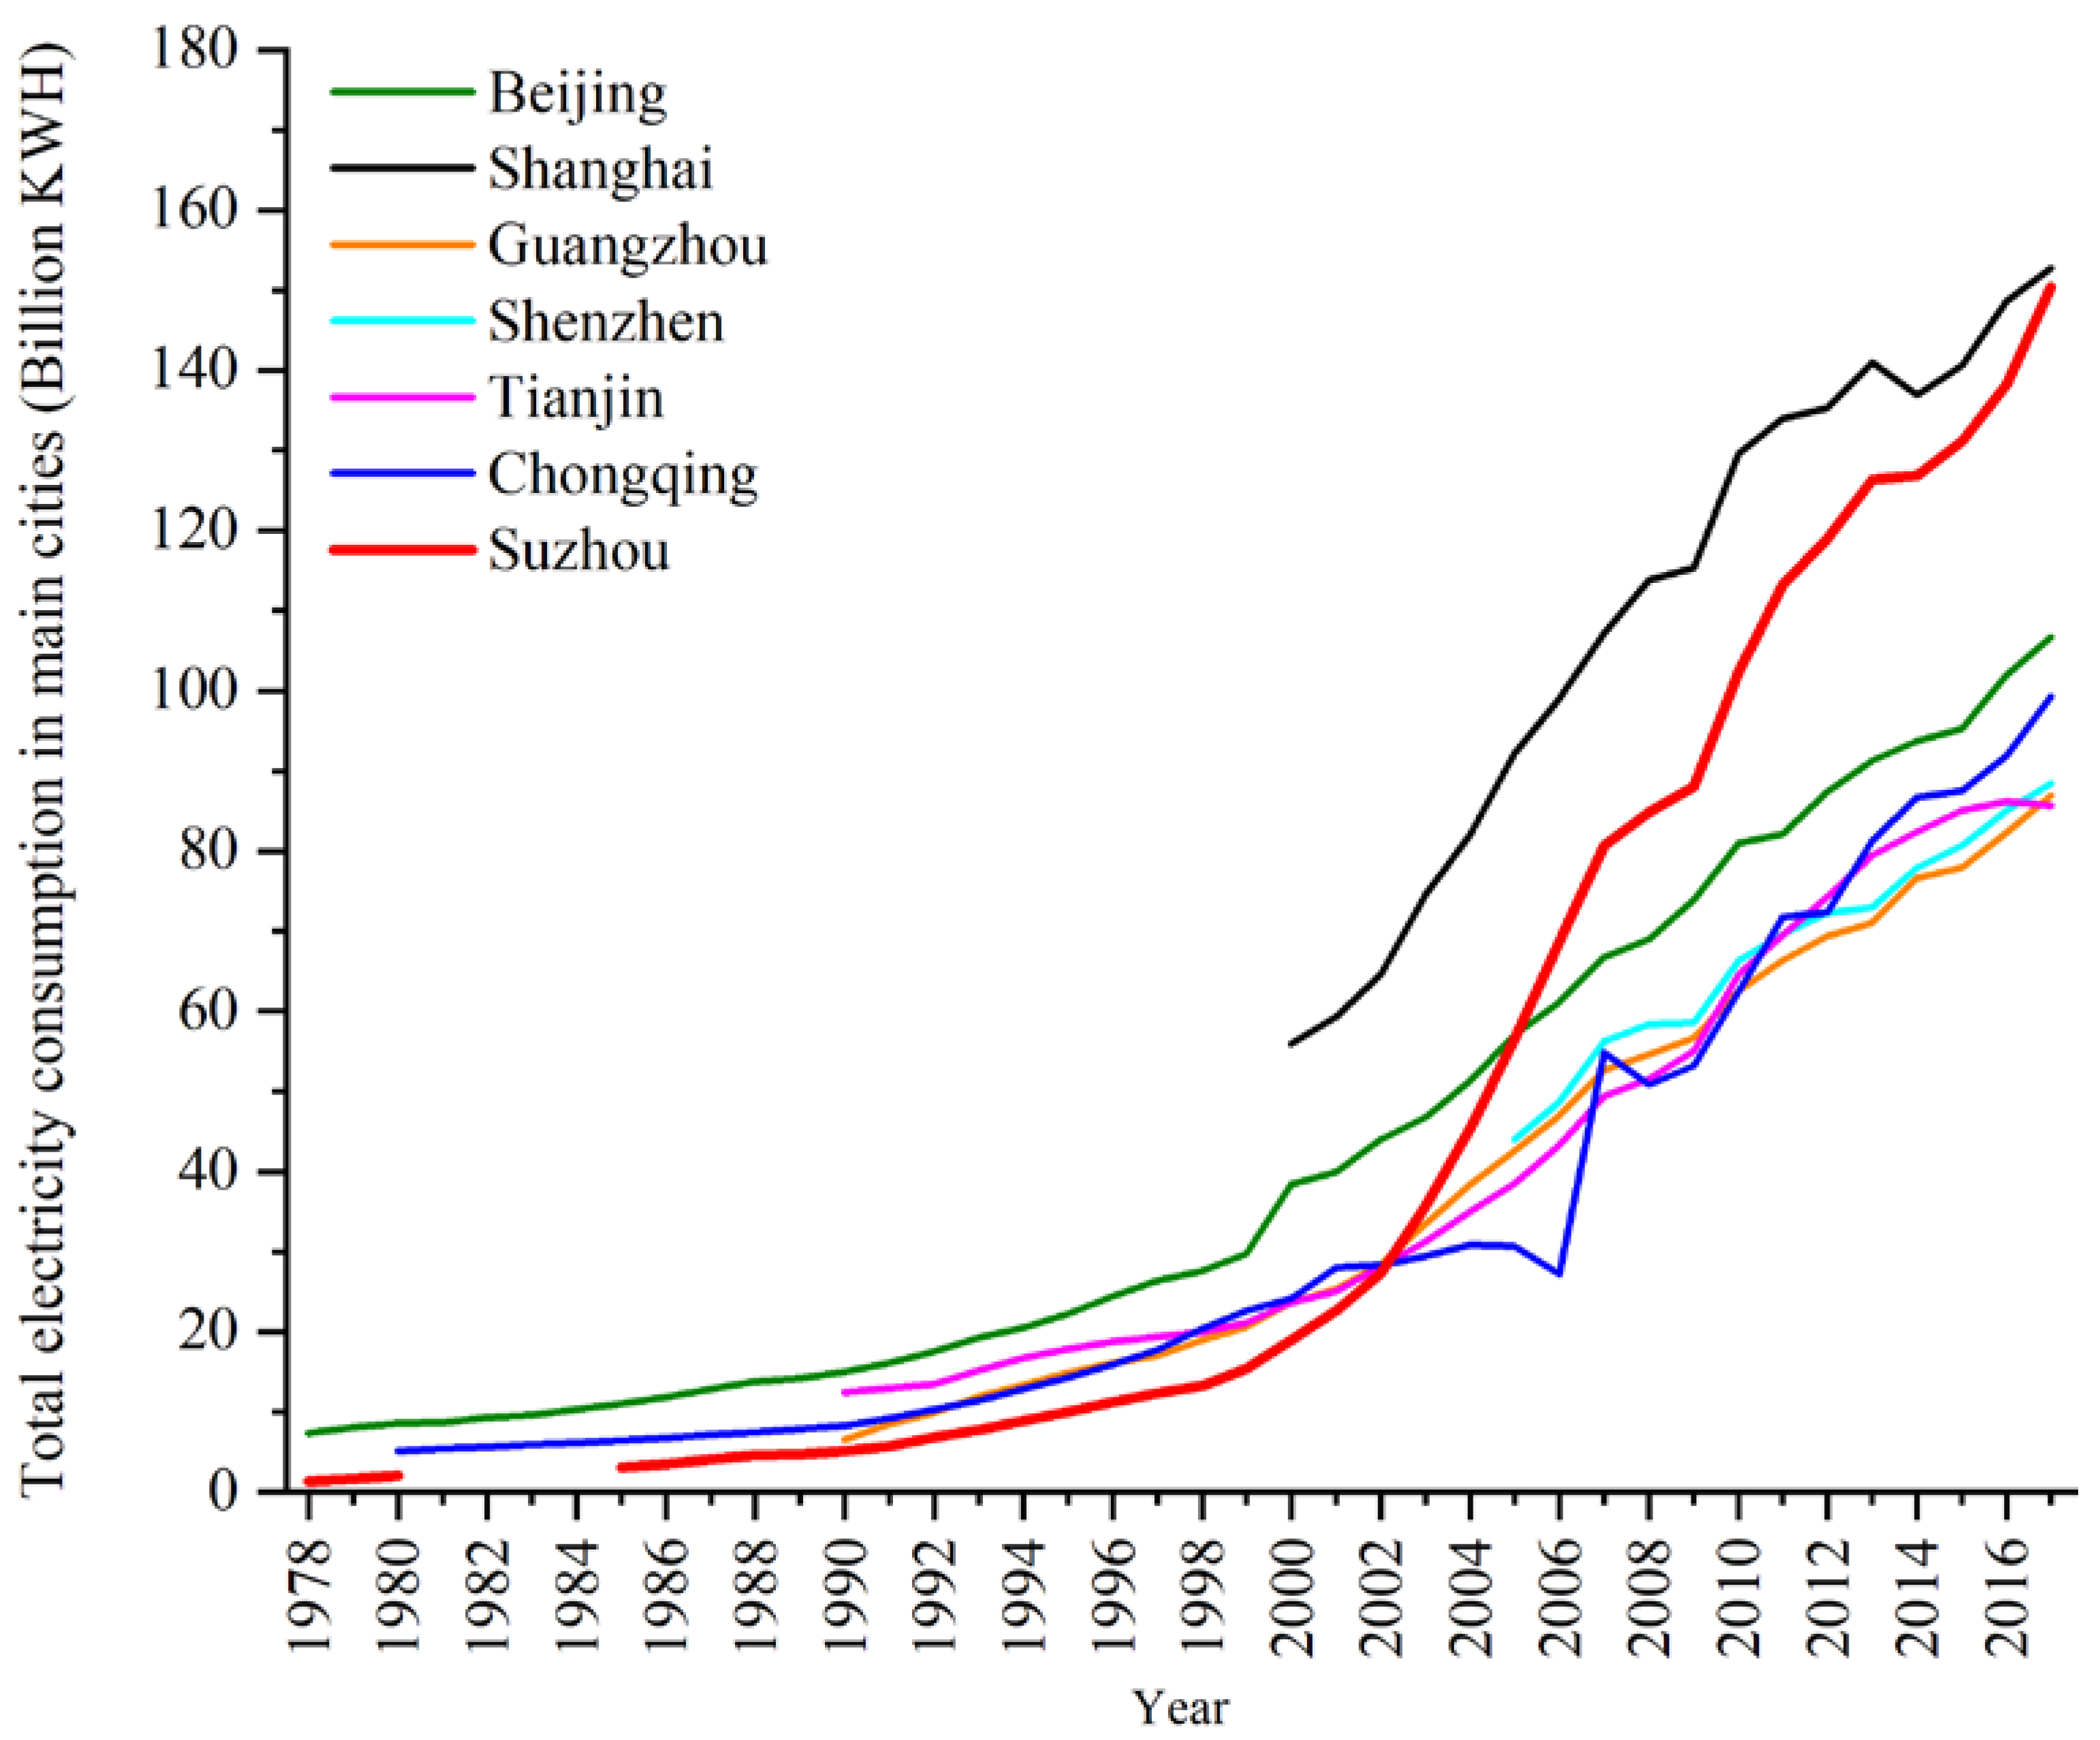
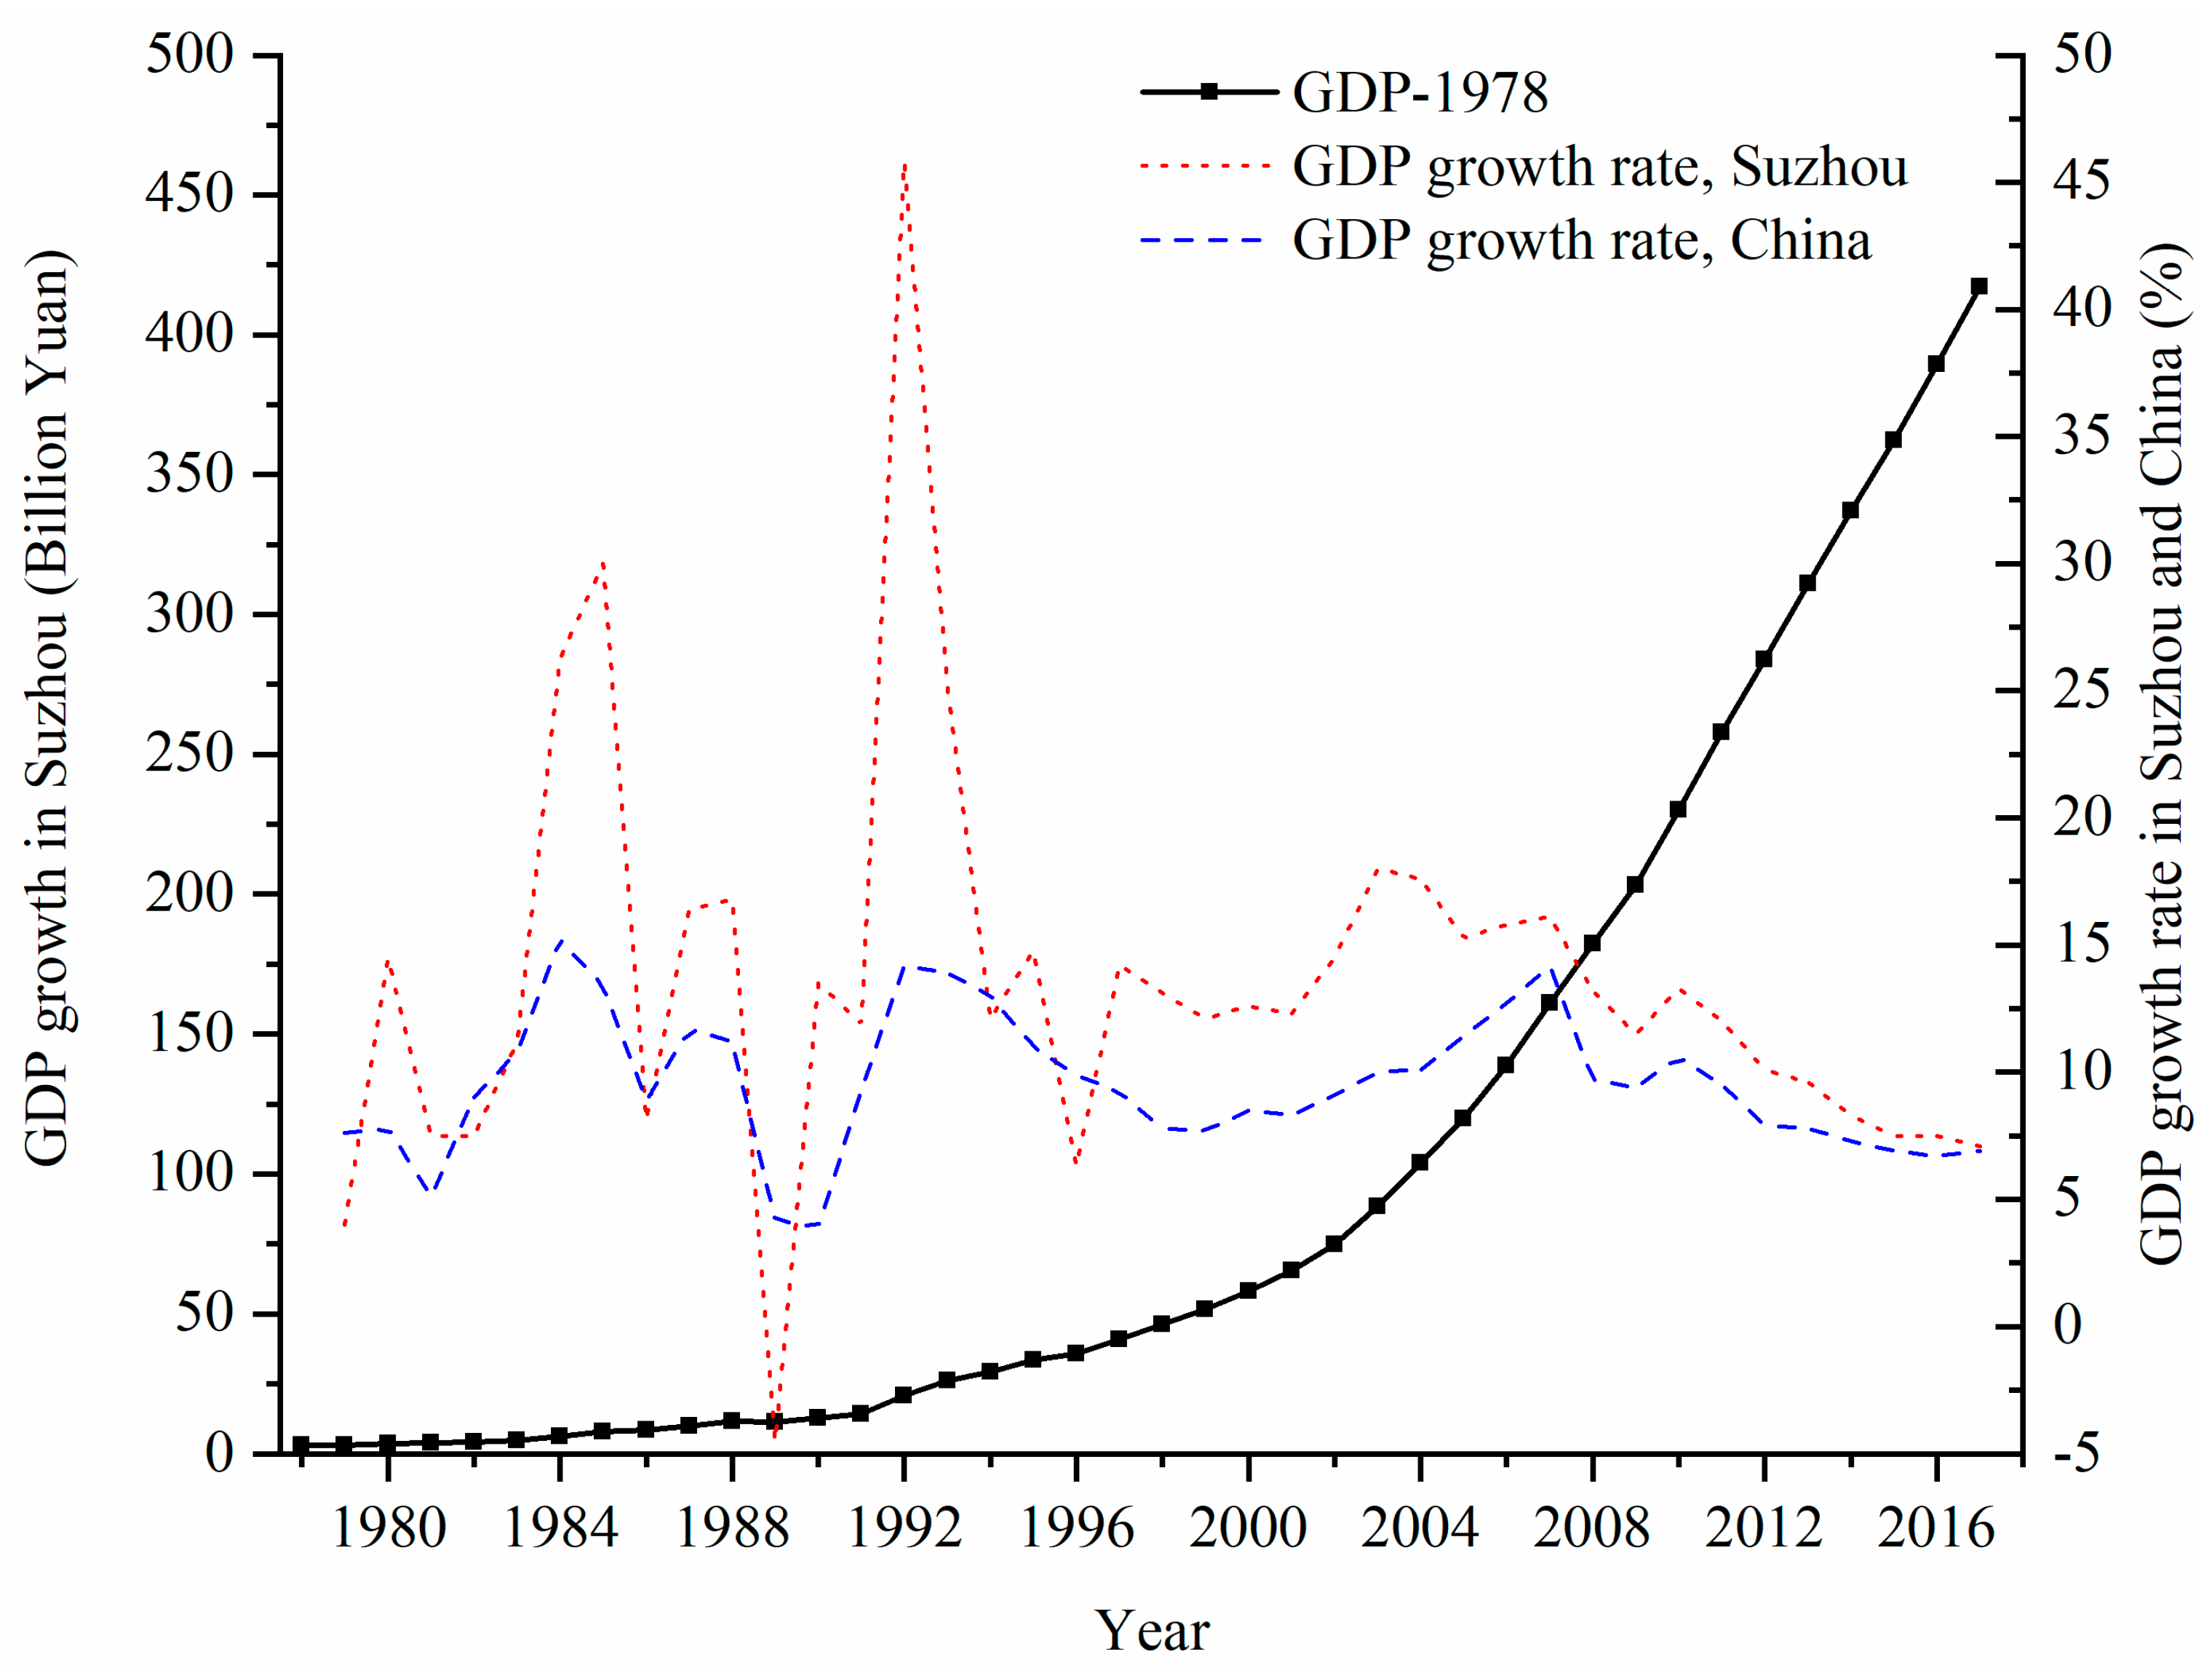
3.1. Analysis of the Economic Growth Process in Suzhou

GDP was adopted to characterize the economic growth process. Since the reform and opening-up, Suzhou has been in a stage of rapid economic growth overall. In 2016, the entire city achieved a regional GDP of 1389.57 billion yuan (Figure 2). Then, in 2016, the economic aggregate of the city was higher than that of the 12 provinces of Yunnan, Inner Mongolia, Heilongjiang, Shanxi, Jilin, Guizhou, Xinjiang, Gansu, Hainan, Ningxia, Qinghai, and Tibet. The economic aggregate of Suzhou was also higher than that of most large- and medium-sized cities in China, ranking seventh behind Shanghai, Beijing, Shenzhen, Guangzhou, Chongqing, and Tianjin in GDP. This city had the largest economic aggregate among prefecture-level cities. Since 2002, the economic growth in Suzhou has presented a two-stage character. After entry to the World Trade Organization, the GDP accelerated at a rate higher than 10% per year. Then, after the 2008 financial crisis, the GDP growth rate has slowed every year. Although its GDP growth rate has been higher than the national average, the gap has gradually reduced. The GDP growth rate was higher than the national average by 2.7 percentage points in 2010 but only by 0.8 percentage points in 2016.

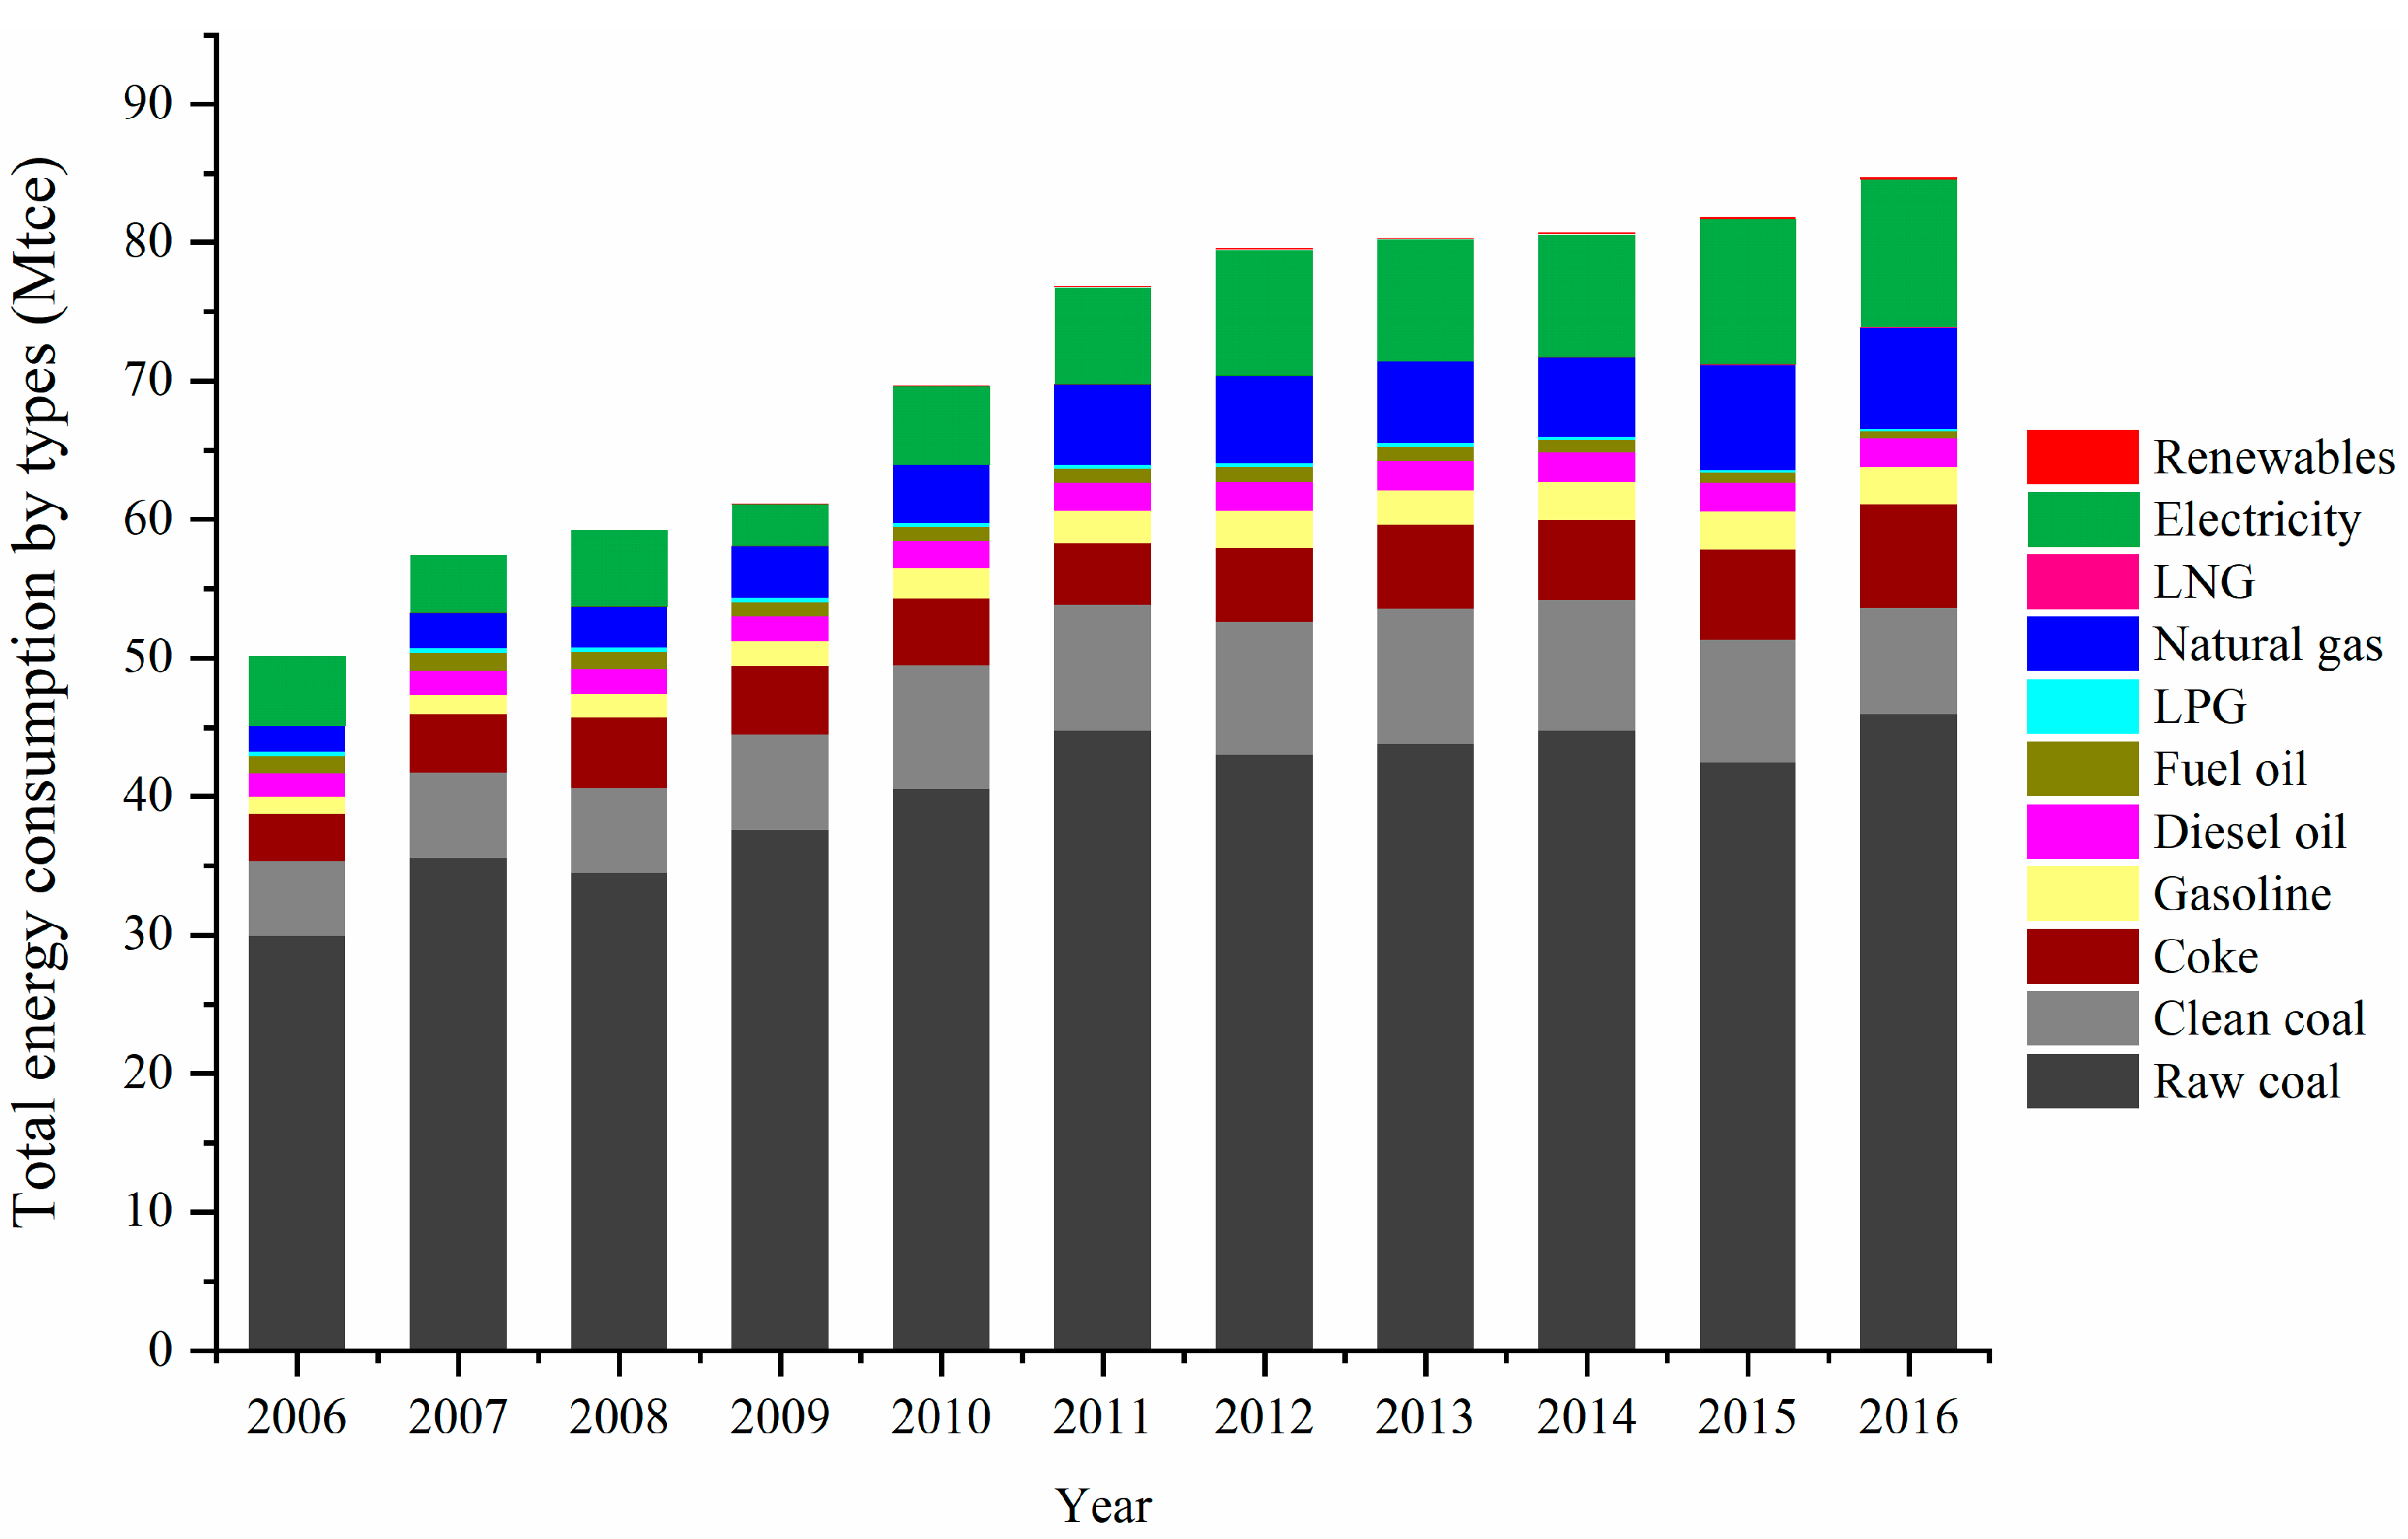
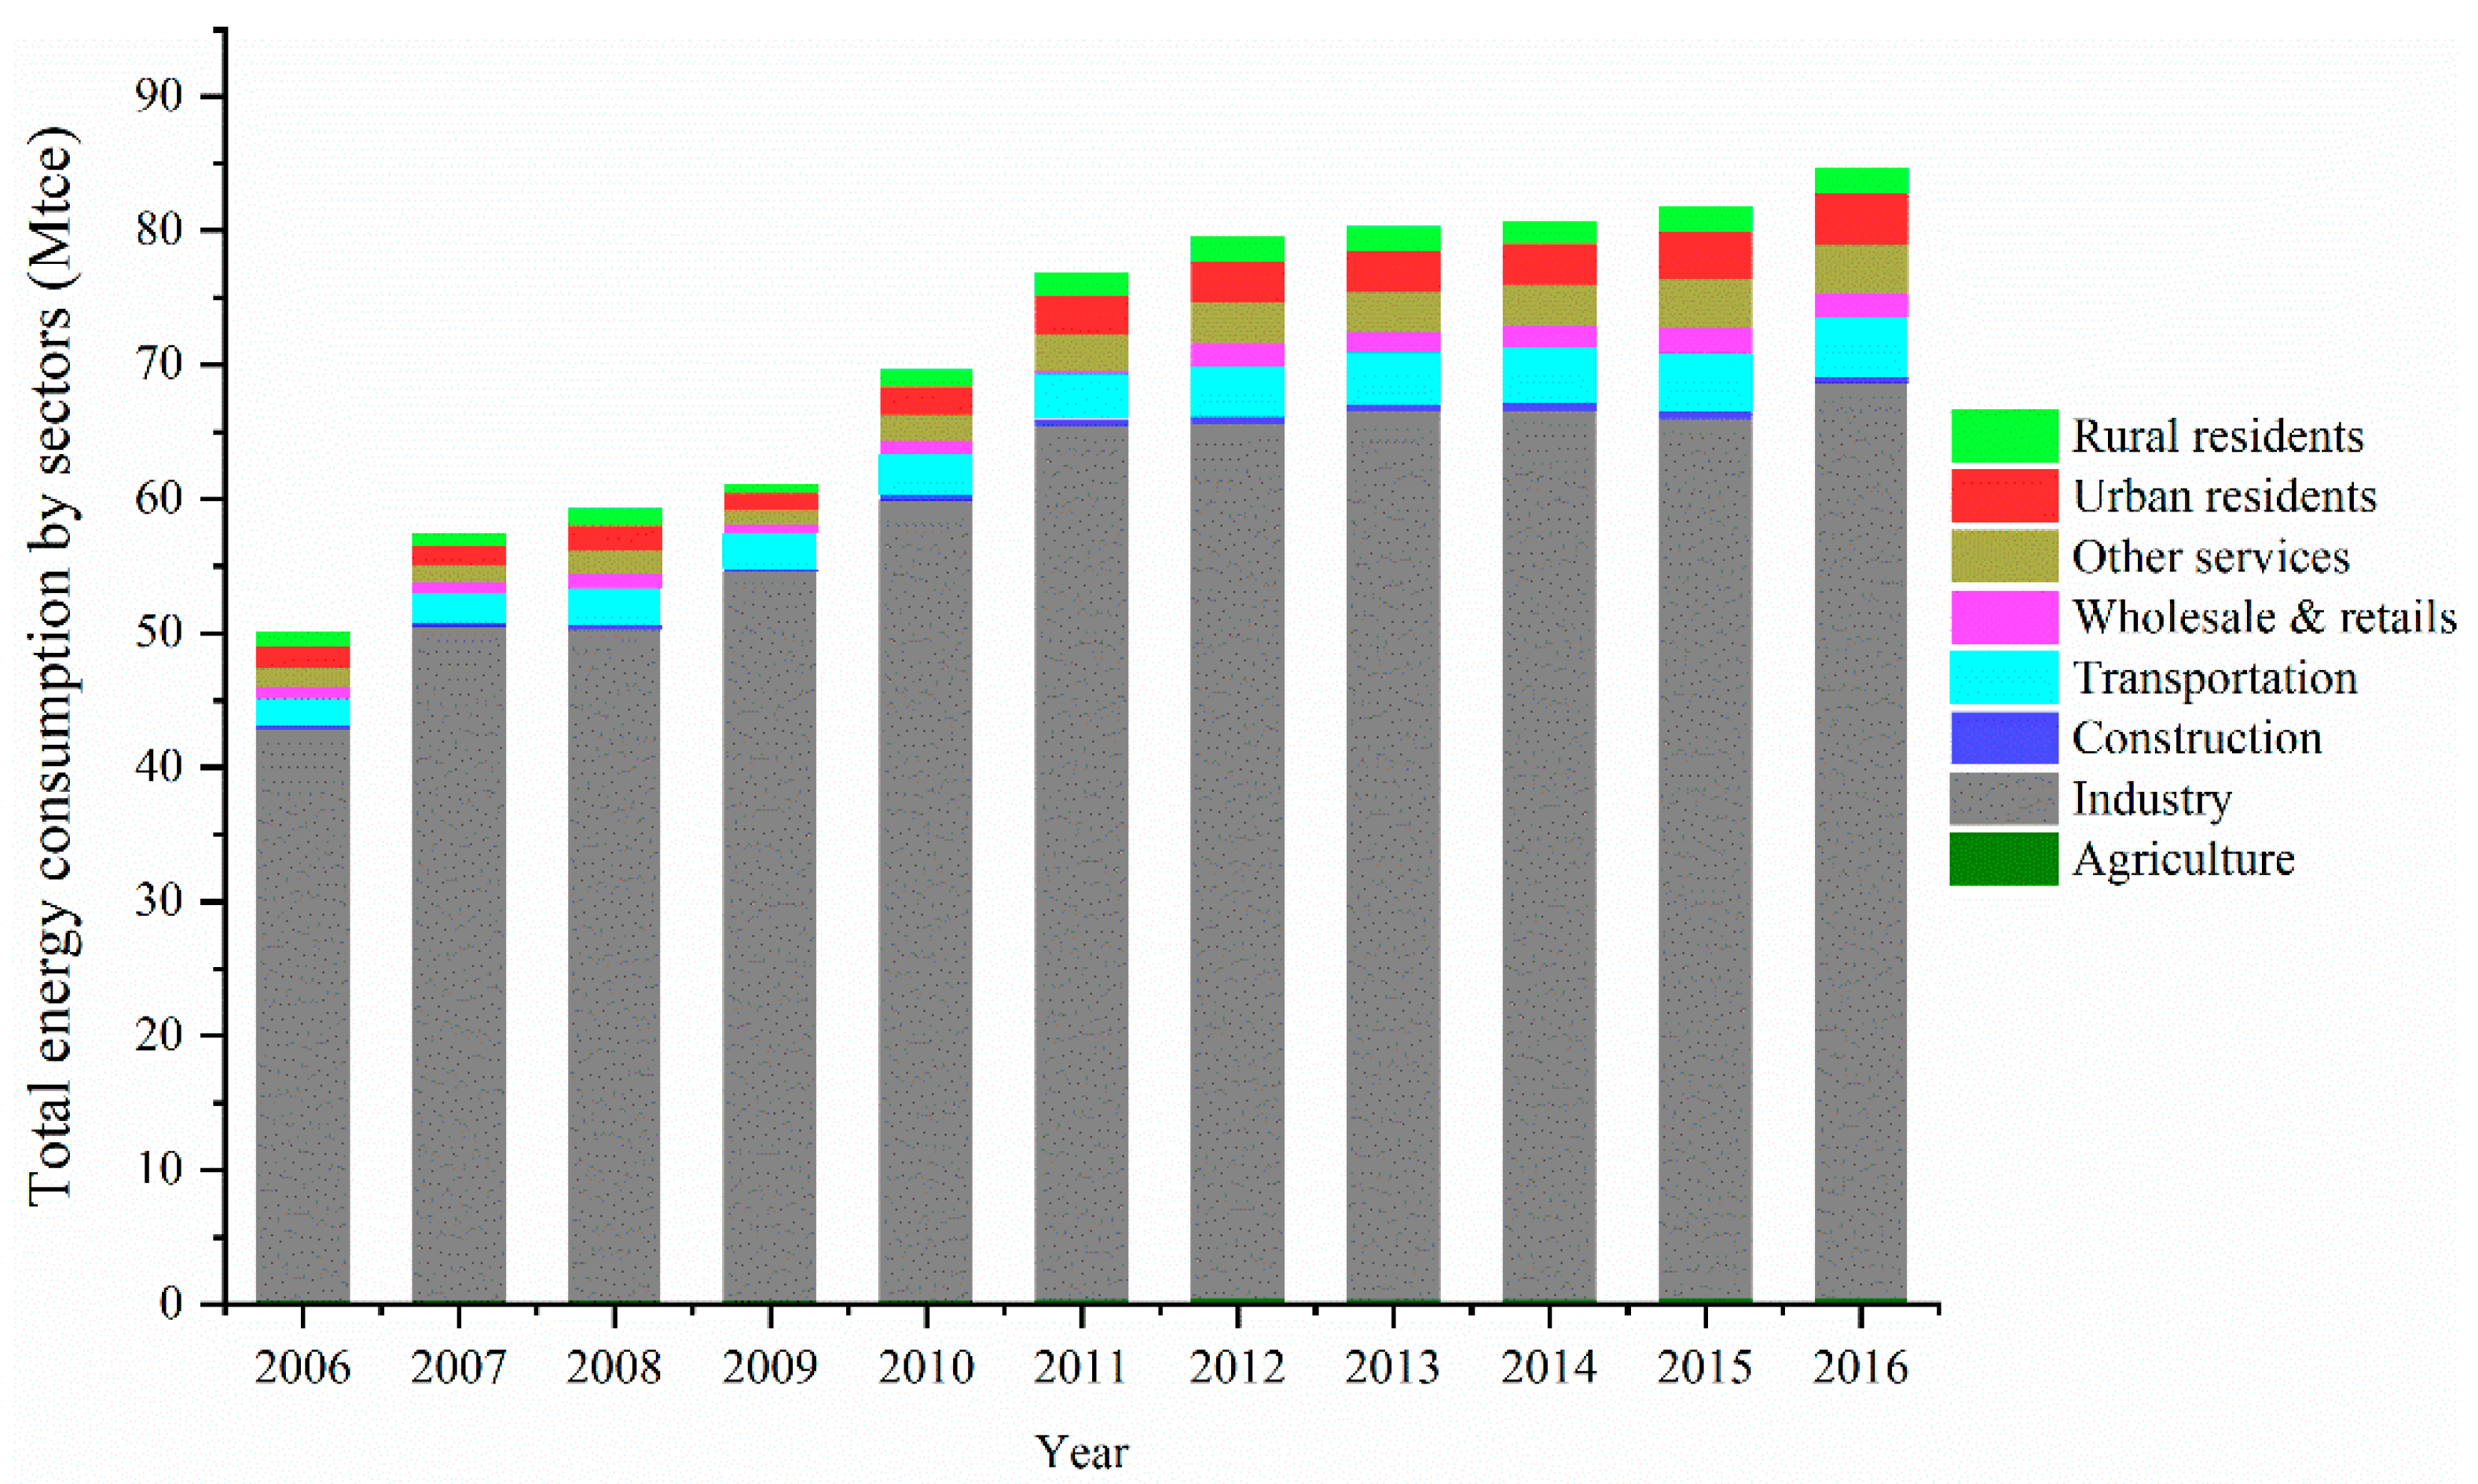
3.2. Total Energy Consumption and the Trends of Structural Changes in Energy Consumption in Suzhou

Total energy consumption in Suzhou presented an overall increasing trend (Figure 3), with 2006–2012 being a rapid growth stage and 2013–2016 being a moderate growth stage. From 2006 to 2012, the total energy consumption in Suzhou rapidly increased from 50.1 million tons of coal equivalent (Mtce) in 2006 to 79.58 Mtce in 2012, with an average annual growth rate of 8.93%. During the same period, the average annual growth rate of energy consumption in Jiangsu Province was 7.17%, and the national average annual growth rate of energy consumption was 5.75%. From 2013 to 2016, total energy consumption in Suzhou slowly increased from 80.34 Mtce in 2013 to 84.7 Mtce in 2016.
From 2006 to 2016, the energy structure of Suzhou has consistently presented mainly coal-based properties with diversification and mutual supplementation of natural gas, petroleum, electricity, and other sources (Figure 4). The energy consumption structure was mainly based on coal, but the predominant position of coal has gradually abated; the proportion of raw coal in the total energy consumption decreased from 59.79% in 2006 to 54.20% in 2016. The total amount and percentage of cleaned coal gradually decreased, and the proportion out of total energy consumption decreased from 12.15% in 2013 to 9.06% in 2016. Moreover, the total amount and percentage of coke gradually increased, and its proportion increased from 7.18% in 2014 to 8.84% in 2016. Then, the proportion of total natural gas consumption out of total energy consumption rapidly increased from 3.78% in 2006 to 8.71% in 2016. The proportion of outsourced electricity out of total energy consumption grew to 12.57%. Furthermore, the proportion of renewable energy (photovoltaic power, biomass power, wind power) has continued to grow, and local renewable energy power generation has reached 2.42 billion kWh. Although the energy consumption structure mainly based on coal did not fundamentally change, the proportions of raw and clean coal out of total energy consumption in Suzhou have trended downward year by year. Therefore, the adjustment of the energy structure in Suzhou has achieved preliminary effects.
Energy consumption in Suzhou is mainly focused on the industry. Total energy consumption by the industry continuously increased from 42.47 Mtce in 2006 to 68.26 Mtce in 2016. However, the proportion of energy consumption by the industry has decreased to 80.57% in 2016, followed by living consumption and the transportation sector. The total energy consumption by residents’ living activities rapidly increased from 5.28% in 2006 to 6.76% in 2016, and the percentage of energy consumption by the transportation sector increased from 3.91% in 2006 to 5.22% in 2016. The proportion of energy consumption by the industry in Suzhou was comparatively high mainly because its industrial structure has been upgraded relatively slowly. Moreover, the economic scale of the urban industry in Suzhou is large. In 2016, the industrial enterprises above the designated size realized 3071.39 billion yuan in the total output value. This value was second only to that of Shanghai, ranking the second-largest industrial city in the nation. Furthermore, the heavy industrialization characteristics of the manufacturing industry in Suzhou are more evident. In 2016, the proportion of the total output value of heavy industrial enterprises above the designated size out of the total value output of industry was 76.07%, which was far higher than the 55.44% in 2002.

3.3. Analysis of the Driving Factors of Change in Total Energy Consumption in Suzhou

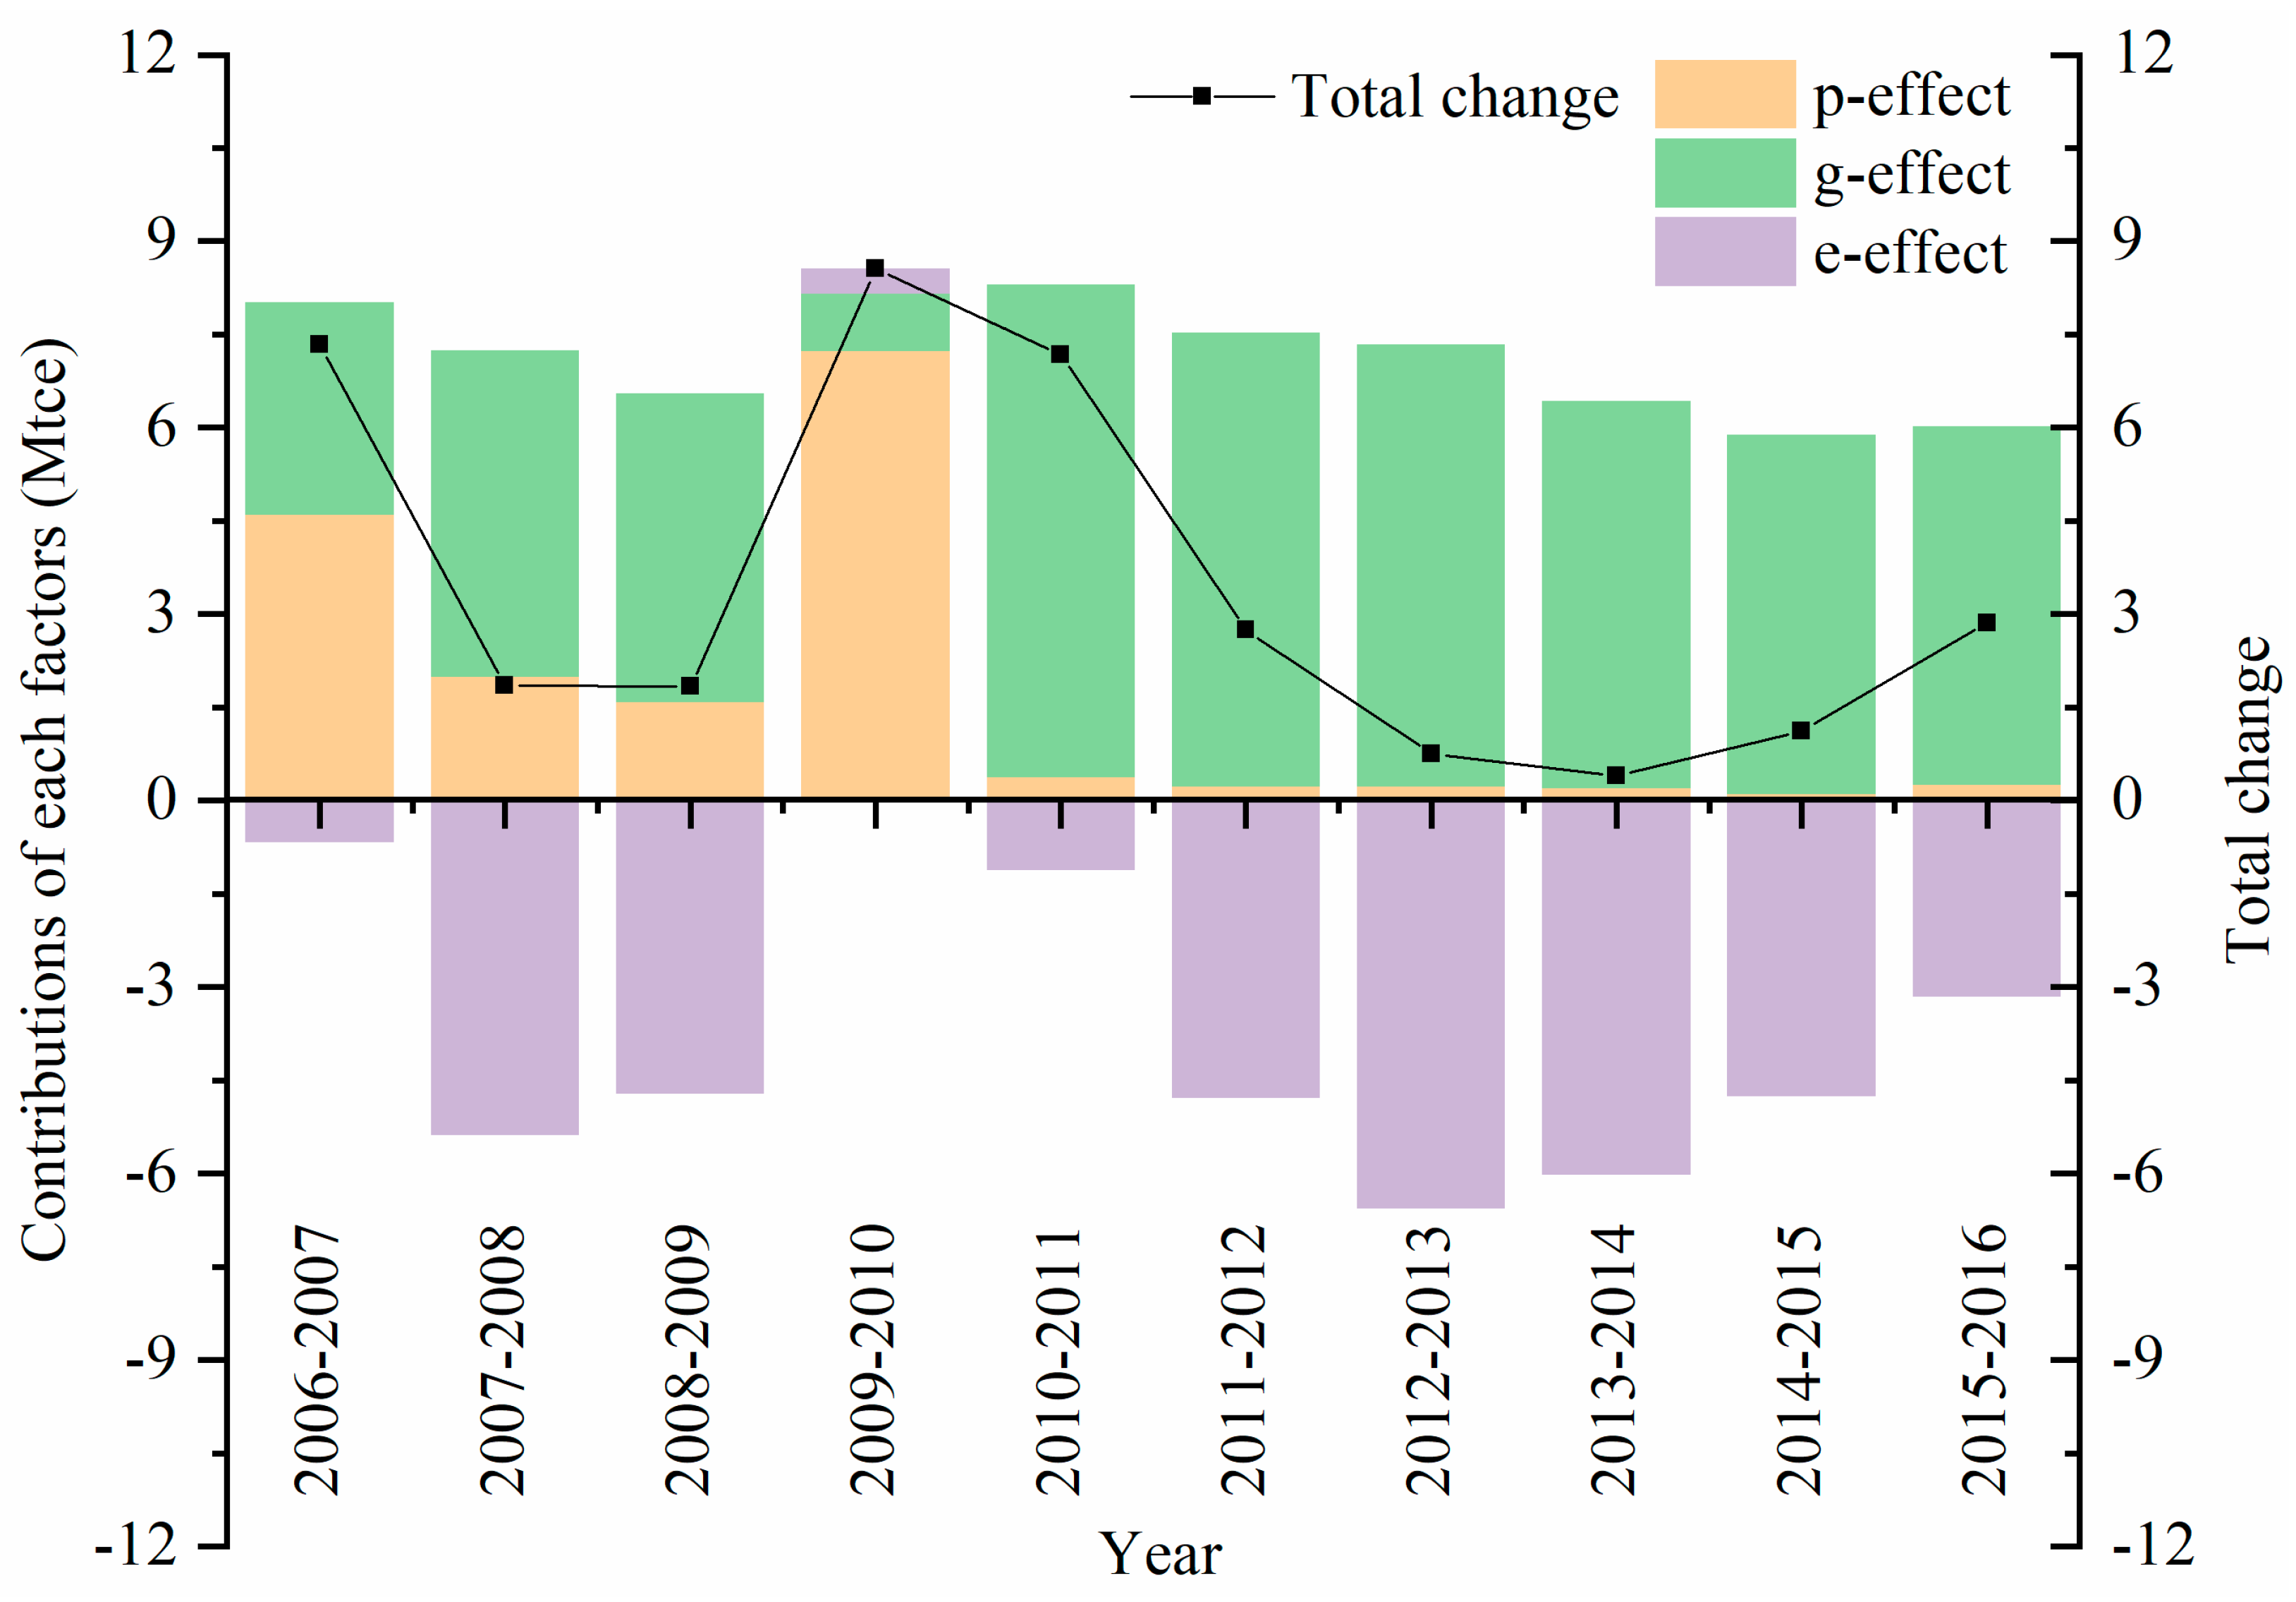
3.3.1. Population–Economy–Technology Decomposition of total Energy Consumption in Suzhou

Under the analytical framework of IDA, a population (P)–economy (G/P)–technology (E/G) decomposition analysis was performed on the total energy consumption in Suzhou from 2006 to 2016 according to Formula (1). Total energy consumption in Suzhou came mainly from the interaction between the driving effect of economic growth and the braking effect of technological progress. Significant differences were observed in the contribution functions of the three major factors in each stage (Figure 5). During this period, the evolution of total energy consumption in Suzhou can be divided into three key stages:
Although the rapid growth period in 2006–2010 included the 2008 global financial crisis, the economic growth in Suzhou was still substantial. After the 2008 global financial crisis, the economy of Suzhou rapidly rebounded in 2009. During the same period, the energy consumption intensity in Suzhou decreased from 0.099 tce/thousand yuan in 2007 to 0.085 tce/thousand yuan in 2010. Additionally, the energy consumption per unit GDP was between the average level in Jiangsu Province and the national average. Despite the decline in the energy consumption per unit GDP, the rapid growth of the economic aggregate has caused the total energy consumption of Suzhou to grow rapidly. The technological progress effect with lower energy consumption intensity failed to fully realize energy conservation and emission reduction effects. In 2006–2007 and 2009–2010, the population size effect was mainly caused by the rapid growth of the permanent population.
For the moderate growth period in 2010–2013, in this stage (post-financial crisis era), Suzhou’s economy entered a period of profound adjustment by taking advantage of the opportunity and accelerating the replacement of old growth drivers with new ones. The contribution of the tertiary industry to the GDP from 2011 to 2012 was significantly higher than that of the secondary industry. Since then, the contribution of the tertiary industry to the GDP has become increasingly greater than that of the secondary industry. After 2010, the scale of GDP growth in Suzhou gradually slowed down, the economy entered a new normal, and the pulling effect of economic growth on total energy consumption decreased year by year. Energy consumption intensity started to experience a full braking effect, which kept the growth of energy consumption within limits. Furthermore, the reduction in total energy consumption caused by the technological progress effect increased from 1.13 Mtce in 2010–2011 to 4.78 Mtce in 2011–2012 and then 6.57 Mtce in 2012–2013 (Table 2).
For the slow growth period from 2013 to 2016, the energy consumption intensity in Suzhou continued to decrease, falling from 0.067 tce/thousand yuan in 2014 to 0.061 tce/thousand yuan in 2016. However, the rate of reduction in energy consumption intensity was significantly lower than that in the moderate growth period from 2010 to 2013. Although Suzhou’s current economy is in a new normal state, the braking effect of technological progress on total energy consumption from 2013 to 2016 presented a weaker pulling effect than that of the economic growth on total energy consumption. This case became the most important contributing factor to the slow growth of total energy consumption in that stage.
After 2010, the economic new normal gradually decreases or even tends toward stability the pulling effect of the economic growth effect on total energy consumption. However, the growth rate of total energy consumption presented a U-shaped trend overall. The main reason was that the braking effect of the technological progress effect on total energy consumption presented a changing trend from weak to strong and then from strong to weak.

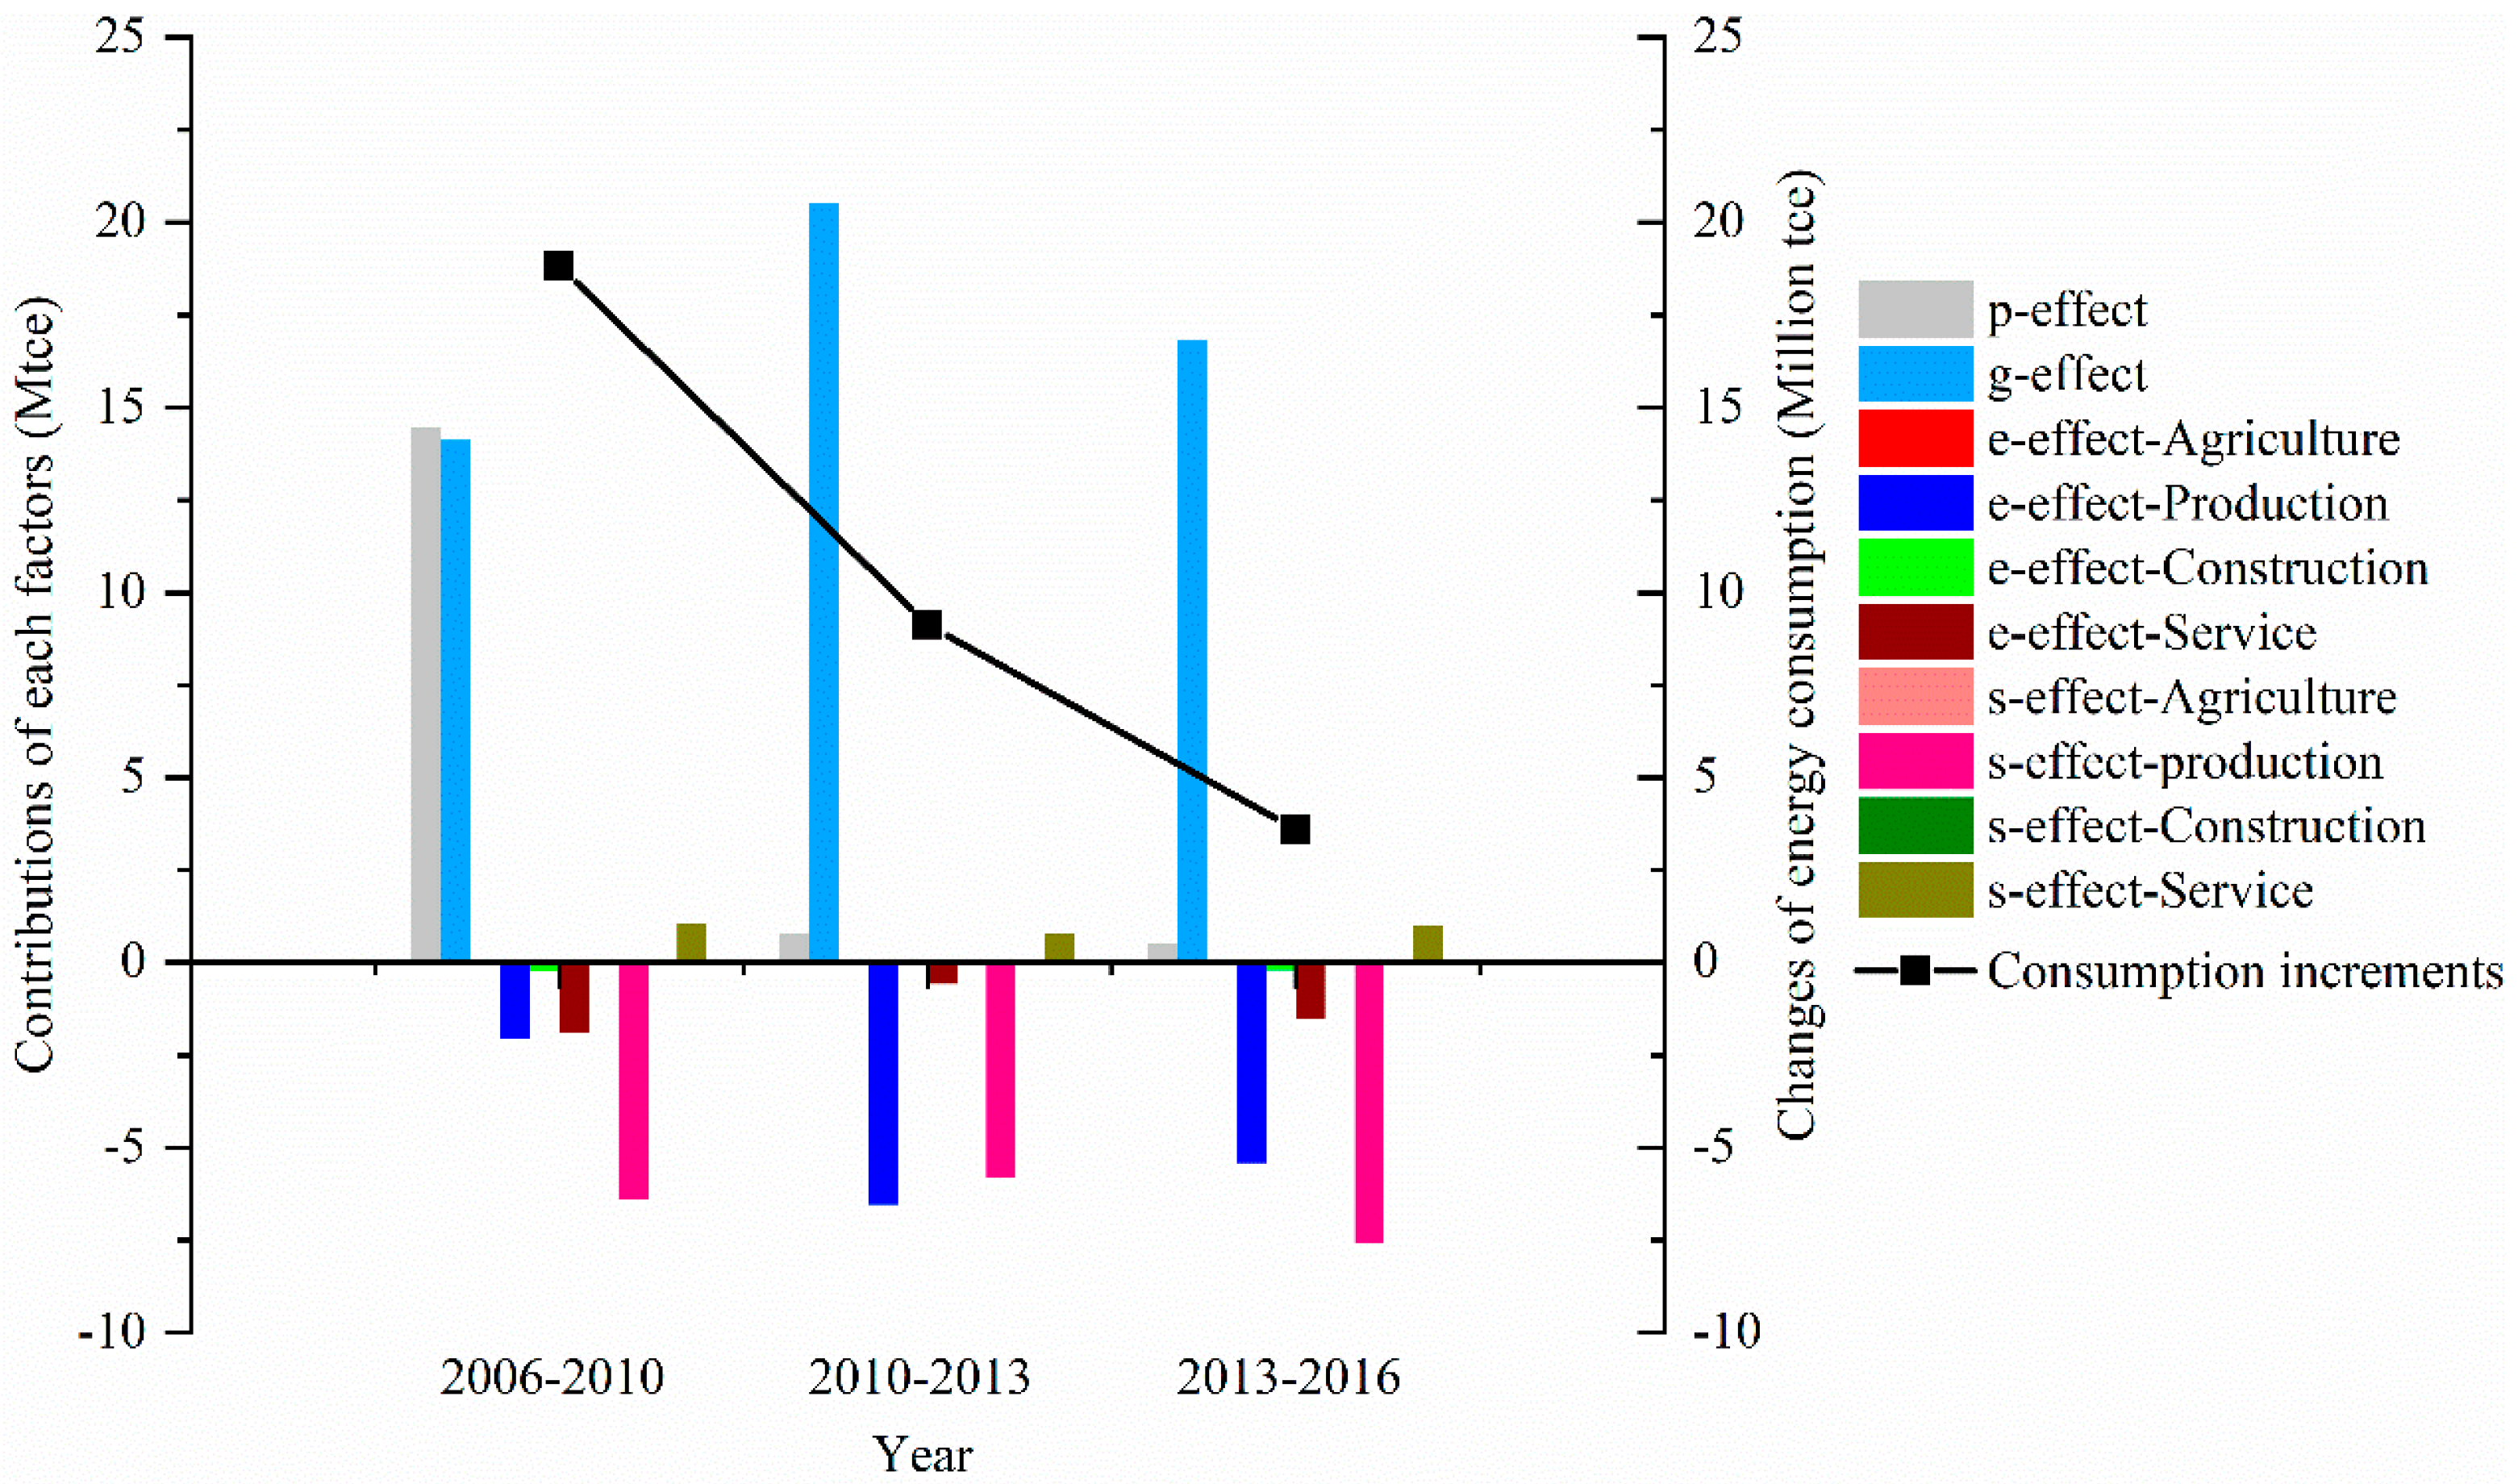
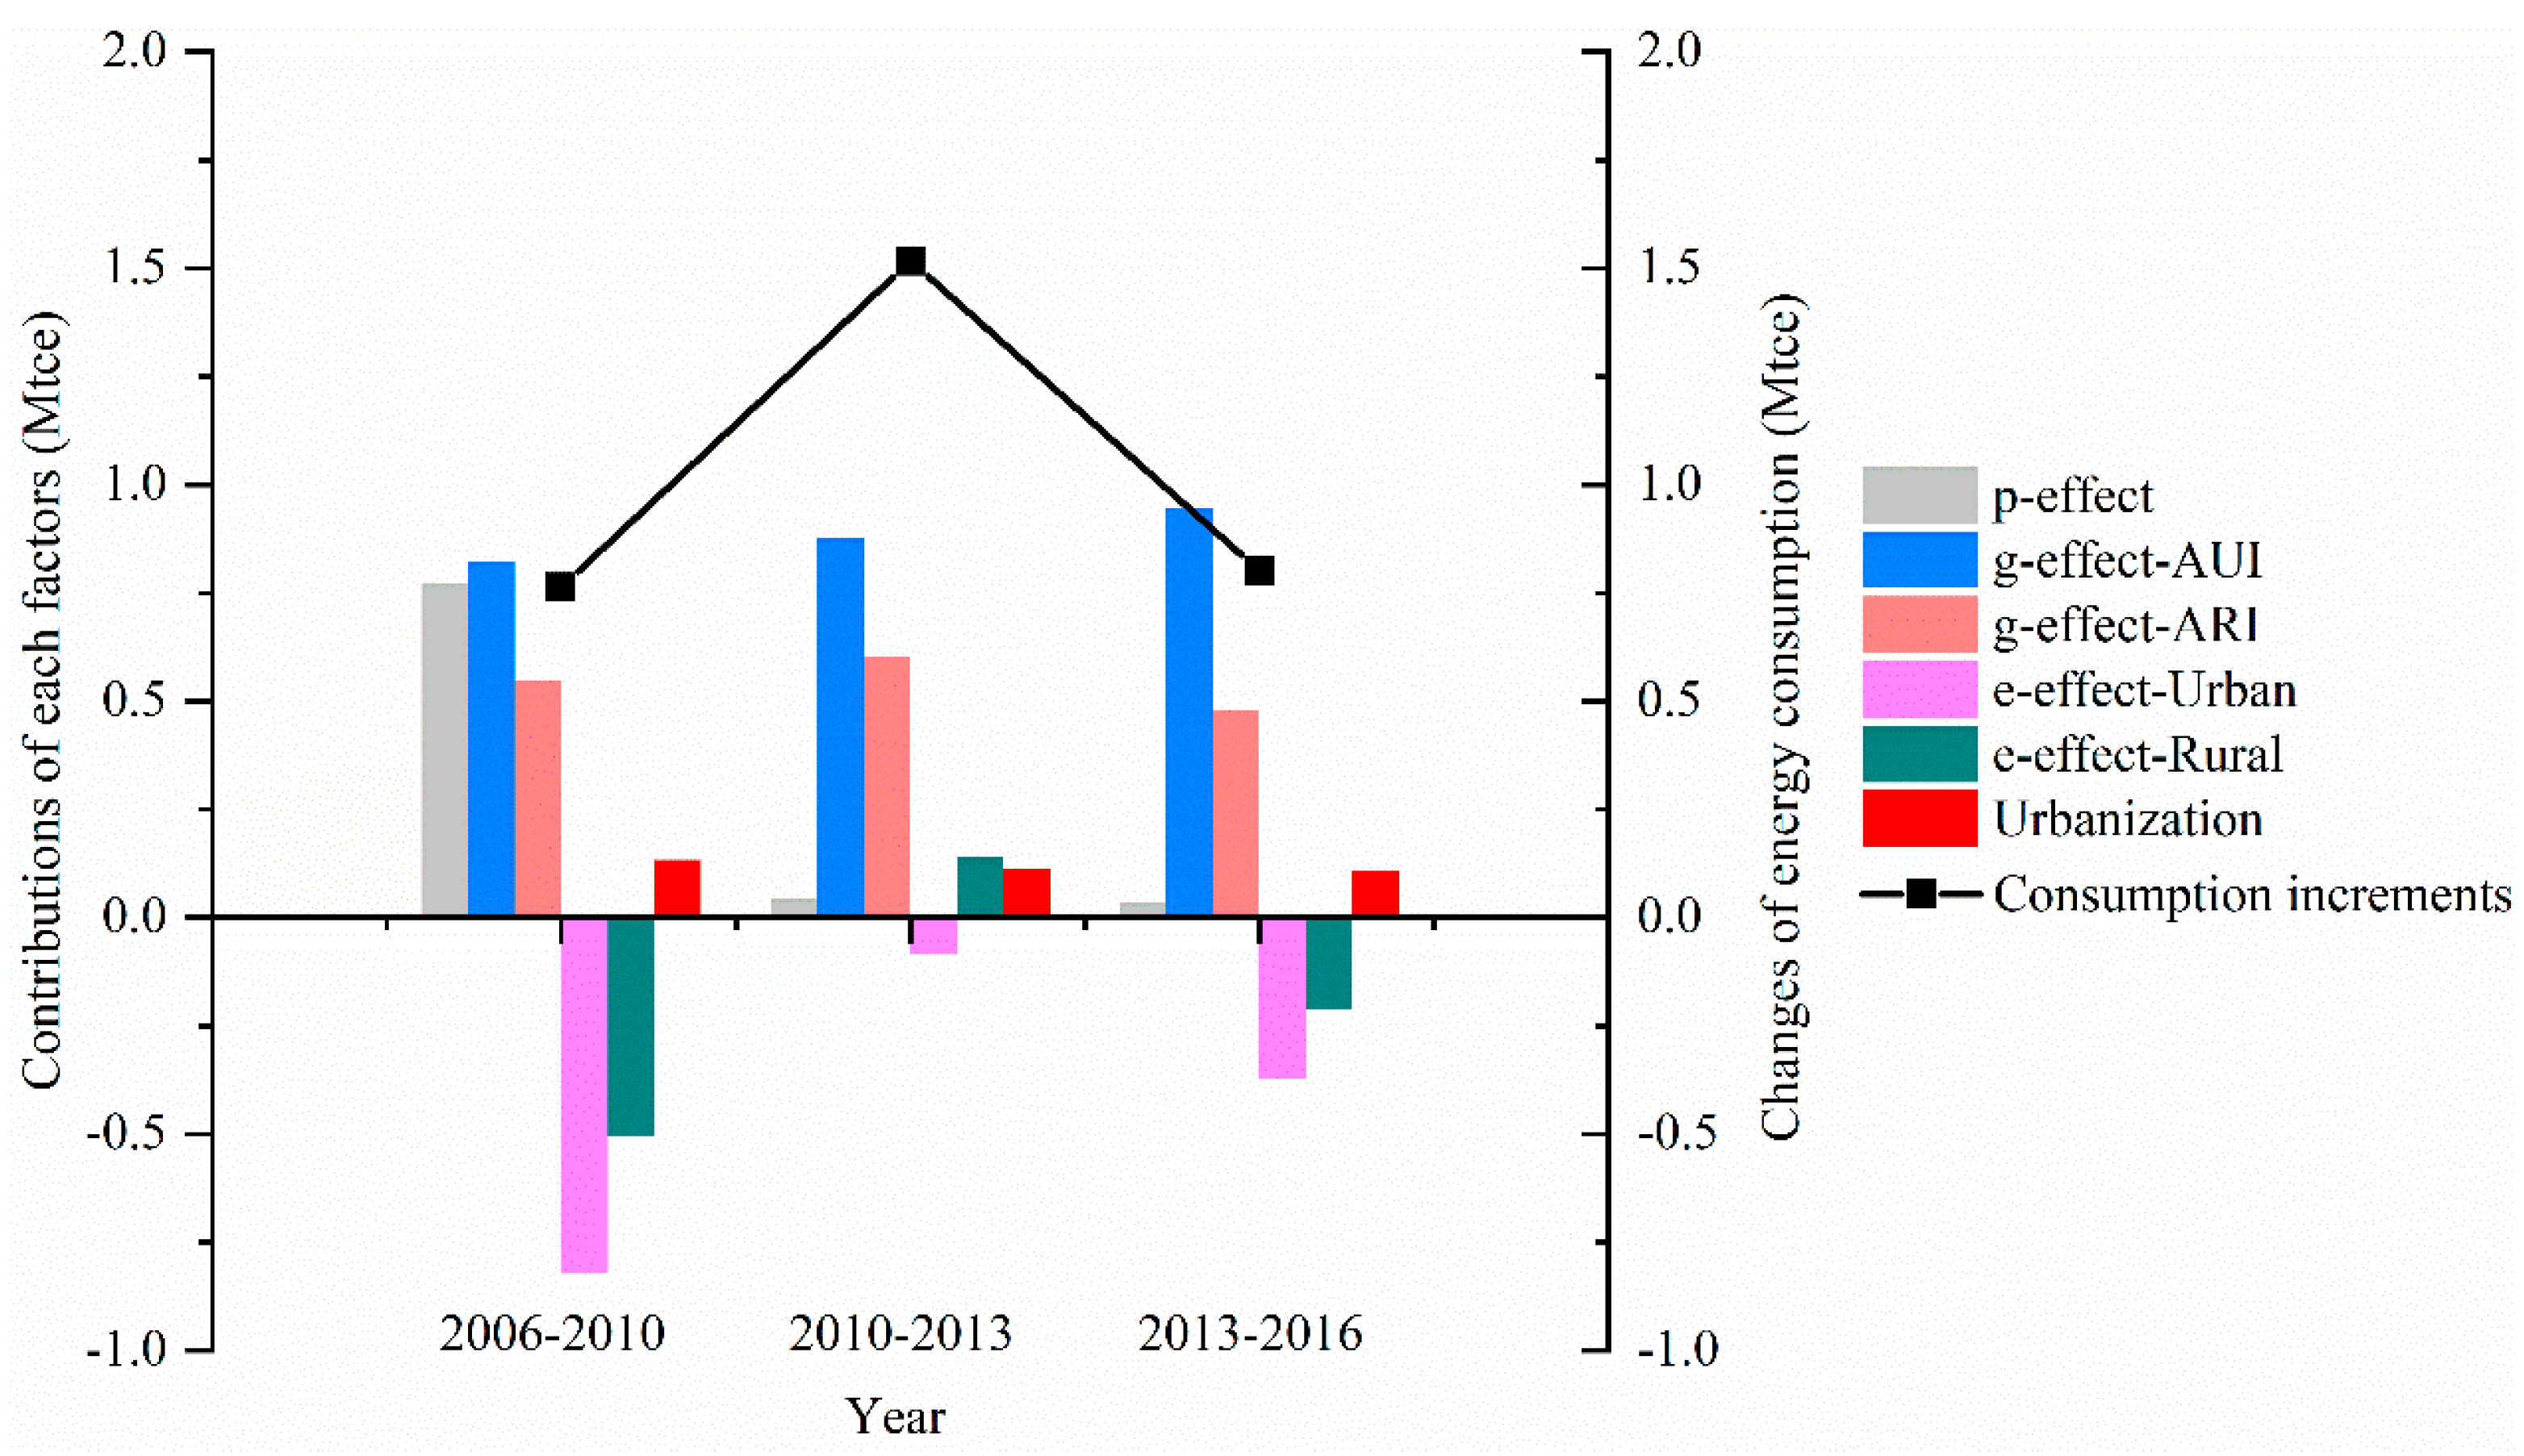
3.3.2. Population–Economy–Technology–Structure Decomposition of Total Energy Consumption in Suzhou

According to the expanded and optimized LMDI decomposition technique, a multifactor decomposition analysis was conducted on the changes in the total energy consumption of all sectors in Suzhou from 2006 to 2016 (Table 3). By contrast, the influence mechanisms of the population size, economic output, and energy intensity effects on total energy consumption were analyzed simultaneously, along with the influence of population and industry structural factors on total energy consumption. The evolution of energy consumption in Suzhou was divided into three stages: the first stage is in 2006–2010, the second stage is in 2010–2013, and the third stage is in 2013–2016. Additionally, energy consumption in Suzhou was divided into two major sectors, namely, industrial activities (agriculture, industry, construction industry, and service industry) and consumption by residents (consumption by urban residents and consumption by rural residents).
Based on the three stages shown in Figure 6, the changes in the energy consumption of the industrial sector in Suzhou and their influencing factors were analyzed.
The first stage (2006–2010): In the Outline of the 11th Five-year Plan for National Economic and Social Development in Suzhou (2006–2010), the following is evidently proposed “the average annual growth in regional GDP will be approximately 12%, per capita regional GDP will be quadruple that of 2000, the level of urbanization will reach approximately 70%, and great effort will be made to double the total in the service industry.” The permanent population of Suzhou rapidly increased from 8.098 million in 2006 to 10.466 million in 2010, with an average annual growth rate of 6.62%. During the same period, the registered household population in Suzhou increased from 6.16 million in 2006 to 6.38 million in 2010, illustrating the comparatively strong population aggregation capacity of Suzhou. Furthermore, the employment absorption capacity in Suzhou continuously increased to 6.875 million employed personnel at the end of 2010. With the increase in population aggregation and employment absorption capacities, its population aggregation effect and structural change enabled the level of urbanization in Suzhou to rapidly increase from 65.08% in 2006 to 70.03% in 2010. The per capita GDP rapidly increased from 61,097.84 yuan in 2006 to 78,494.37 yuan in 2010. This growth made the population size and economic output effects the main driving factors of the increase in energy consumption during this period.
From 2006 to 2010, the industry structure was predominated by the secondary industry, followed by the tertiary and then the primary. However, the tertiary industry rapidly grew (from 41.13% to 45.81%), and the predominant position of the secondary industry gradually weakened. The proportion of the industry out of GDP decreased from 55.54% in 2006 to 48.99% in 2010. This change made the industry structure effect (s-effect-Production) the most important contributing factor to keeping the rapid growth in energy consumption within certain limits during this period.
In this stage, computers, steel, textiles, electrical machinery, chemicals, and general equipment became the six leading industries in Suzhou. The service industry focused on the development of modern logistics, finance, business services, tourism and exhibitions, and others. The energy consumption intensity of the industry decreased from 0.1406 tce/thousand yuan in 2006 to 0.1349 tce/thousand yuan in 2010. Additionally, the energy consumption intensity of the service industry decreased from 0.0259 tce/thousand yuan in 2006 to 0.0178 tce/thousand yuan in 2010. Then, the energy consumption intensity effect of the industry (e-effect-Production) and the energy consumption intensity effect of the service industry (e-effect-Service), respectively, became the second and third leading contributors keeping the growth of energy consumption within their limits.
The second stage (2010–2013): After the financial crisis, advantage, emerging, and high-tech industries became the dominant force driving Suzhou’s industrial economy out of its low valley. The economic scale of Suzhou continued to grow. The GDP rapidly increased from 936.65 billion yuan in 2010 to 1319.13 billion yuan in 2013, with an average annual growth rate of 10.56%. Then, the per capita GDP rapidly increased from 78,494.37 yuan in 2010 to 104,954.93 yuan in 2013, with an average annual growth rate of 10.17%, which made the economic output effect the main contributing factor to the growth in energy consumption during this period.
Since 2010, the growth rate of investment in industrial fixed assets slipped downward, and power conversion was relatively lagging. Furthermore, the average annual growth rate of the output value in the high-energy-consumption steel, textile, and chemical fiber industries fell. However, the equipment manufacturing industry, representing the future direction and overall strength of advanced manufacturing, replaced the steel industry as the second-largest industry in Suzhou. Suzhou vigorously developed new, high-technology industries and continued to change its mode of industrial growth. Additionally, the city actively used new and advanced applied technologies to transform the traditionally advantaged ones.
The energy consumption intensity of the industry decreased from 0.1349 tce/thousand yuan in 2010 to 0.1216 tce/thousand yuan in 2013. The total energy consumption decreased by the energy consumption intensity effect of the industry (e-effect-Production) was 6.54 Mtce. Additionally, Suzhou actively constructed a modern industrial system that was adapted for the development of a modern metropolis. The proportion of the industrial added value out of the GDP decreased from 53.75% in 2010 to 48.99% in 2013, and the total energy consumption decrease by the industry structure effect of industry (s-effect-Production) was 5.83 Mtce. The energy consumption intensity effect of the industry and the industry structure effect of the industry became the main contributing factors that limited the growth of energy consumption in this stage.
The third stage (2013–2016): From 2013 to 2016, the increase in energy consumption in Suzhou was significantly lower than that from 2010 to 2013. During this period, Suzhou’s economic development grew steadily, where the per capita GDP increased from 104,954.93 yuan in 2010 to 130,507.95 yuan in 2016, with an average annual growth rate of 7.53%. The economic output effect was still the main contributing factor to the growth of energy consumption, but its rate of contribution significantly decreased from the previous stage. Suzhou’s economy had entered a new normal. That is, the emerging kinetic energy continued to grow, and the proportion of tertiary industry rapidly increased from 45.81% in 2013 to 51.21% in 2016. The industry structure of Suzhou continued to be optimized and was entering a critical transition period of high-quality development. High-energy-consumption industries were effectively suppressed, electrical machinery had replaced steel to become the second-largest leading industry, and textiles had fallen from the list of the six largest industries. The total energy consumption decrease by the industry structure effect of the service industry was 7.57 Mtce, and the total energy consumption decrease by the energy consumption intensity effect of the industry was 5.42 Mtce. Moreover, the industry structure effect of the service industry and the energy consumption intensity effect of the industry became essential contributors to limiting the growth of energy consumption in this stage.
The percentage of energy consumption accounted for by Suzhou residents remains comparatively small presently. However, its growth rate is comparatively fast, specifically that of urban residents, which should be a key facet worthy of attention in the efforts to make Suzhou into a low-carbon energy-conservation city. Changes in the energy consumption of the residential sector of Suzhou and their influencing factors were analyzed according to three stages (Figure 7).
The first stage (2006–2010): The energy consumption by Suzhou residents increased from 2.65 Mtce in 2006 to 3.41 Mtce in 2010, and 78.35% of the growth in energy consumption by residents came from consumption by urban residents. In the process of rapid population growth and continued advancement of urbanization, several nonnative personnel and rural residents moved into the city. This event leads to continued growth in the consumption demand and consumption level of residents, which had a significant effect on the increase in energy consumption. As the level of urbanization in Suzhou continued to advance, the per capita disposable income of urban residents increased from 18,532 yuan in 2006 to 29,219 yuan in 2010. The population size effect (p-effect) and the income effect of urban residents (g-effect-AUI) became the main contributing factors to the growth in energy consumption in this stage. Total energy consumption by urban residents increased from 1.53 Mtce in 2006 to 2.13 Mtce in 2010. However, the energy consumption intensity decreased from 0.0156 tce/thousand yuan in 2006 to 0.0099 tce/thousand yuan in 2010. This case made the energy consumption intensity effect of urban residents (e-effect-U) the main factor limiting the growth of energy consumption.
The second stage (2010–2013): Energy consumption by Suzhou residents rapidly increased from 3.41 Mtce in 2010 to 4.93 Mtce in 2013, and 61.33% of which came from consumption by urban residents. The per capita disposable income of urban residents increased from 29,219 yuan in 2010 to 41,143 yuan in 2013, and the per capita disposable income of rural residents increased from 14,657 yuan in 2010 to 21,578 yuan in 2013. Moreover, the income effects of urban residents (g-effect-AUI) and rural residents (g-effect-ARI) became the main contributing factors to the growth in energy consumption in this stage. The energy consumption intensity of urban residents slowly decreased from 0.0099 tce/thousand yuan in 2010 to 0.0096 tce/thousand yuan in 2013. The rapid increase in the income level of residents and the slow decline in the energy consumption intensity of residents were the key reasons why the increase in energy consumption in this stage was significantly higher than that in the previous stage.
The third stage (2013–2016): Energy consumption by Suzhou residents increased from 4.93 Mtce in 2013 to 5.73 Mtce in 2016, and 87.19% of which growth came from consumption by urban residents. The per capita disposable income of urban residents increased from 41,143 yuan in 2013 to 54,341 yuan in 2016. Such a rapid increase made the income effect of urban residents (g-effect-AUI) the main contributing factor to the growth in energy consumption in this stage, and its rate of contribution was far higher than that of the previous two stages. During this period, the energy consumption intensity of Suzhou residents continued to decrease. That is, the energy consumption intensity of urban residents decreased from 0.0096 tce/thousand yuan in 2013 to 0.0086 tce/thousand yuan in 2016. Then, the energy consumption intensity of rural residents decreased from 0.0305 tce/thousand yuan in 2013 to 0.0273 tce/thousand yuan in 2016. Finally, the total energy consumption decrease from the energy consumption intensity effect of urban residents (e-effect-U) and the energy consumption intensity effect of rural residents (e-effect-R) was 0.37 and 0.21 Mtce, respectively.

4. Discussion and Conclusions

4.1. Discussion

Our study mainly contributes by providing an in-depth analysis of energy consumption at the city level in regional China. Compared with previous studies, we develop the LMDI method that focuses on the scale, structural, and technological factors to systematically identify the key factors driving energy consumption. We also provide temporal variations in the influence factors of energy consumption in regional China over a long period. In the evolutionary process of energy consumption in Suzhou, the scale-related factors have dominated changes in energy consumption. Additionally, the impacts and influences of structural and technological factors performed significant differences in various development periods and policy environments. Compared with previous studies, the present study also found that energy consumption mainly exists in industrial sectors in Beijing, Shanghai, Tianjin, and Chongqing, and economic activities drove the growth [57]. Then, energy fuels were also mainly burning in industrial sectors in Nanjing [71], and the affluence effect was also the main driver for energy consumption in Guangzhou in southern China [23]. However, transportation was the biggest energy consumer in Macao in southern China [72], because its industrial structure was dominated by the tertiary industry. Additionally, structural and technological factors played different effects on energy consumption in varying cities. Moreover, industrial structure, energy structure, and energy intensity performed positive or negative effects during the different periods in a particular city [42,57]. Therefore, city-level energy conservation strategies should focus on the optimization of structural factors (energy structure, industrial structure, etc.) and the improvement of technological factors (energy intensity, etc.), specifically in the developing countries. From the current energy balance table statistics, the energy consumption sector is only divided into agriculture, manufacturing industry, construction, transportation, wholesale and retails, and urban and rural sectors. In the future, industrial and energy structure adjustment and energy intensity improvement at the detailed industrial sectors should receive more attention for these indicators to have more negative effects on energy consumption.
The local conventional primary energy on which Suzhou City relies is extremely scarce, and the endowment of renewable resources is limited. The characteristics of energy resource endowment are very similar to those of first-tier cities, such as Beijing, Shanghai, Guangzhou, and Shenzhen. Based on the case analysis of Suzhou City, the gradual improvement of clean energy supply and application should be one of the main directions of Suzhou’s energy system reform in the future. Therefore, when Chinese cities solve the problem of excessive coal consumption, they can consider increasing the capacity of external clean energy consumption, particularly the relatively abundant clean energy, such as hydropower and photovoltaic power in the western region, while increasing the proportion of local renewable energy (e.g., photovoltaic power).
Additionally, the import and export trades are driving economic growth. Its energy-intensive mode of processing imported materials and exporting products for trade is the main influencing factor of the increase in energy consumption in Suzhou. The export-oriented economy and rapid industrialization of Suzhou have led to a high proportion of energy consumption by energy-intensive industries. Presently, Suzhou is in a critical period of industrial structure transformation jointly led by tertiary and secondary industries. Mechanical, electrical, and high- and new-technology products account for a very large proportion of total import and export trade. However, the proportion of high-energy-consumption products represented by textiles, chemicals, and paper among total import and export trade has increased from 11.29% in 2008 to 12.29% in 2017. Suzhou should actively adjust the production and trade structures of high-energy-consumption industries and high-energy-consumption products. Then, the city should urge industrial producers to gradually move upstream in the entire industry chain, increase their added value, and reduce their energy consumption. Therefore, when Chinese cities are adjusting their industrial structure and cultivating leading industries, they should pay additional attention to the position of industrial products in the entire supply chain and increase the high added value of products, thereby reducing industrial energy consumption and comprehensively improving energy efficiency.

4.2. Conclusions

In this study, the energy balance table was initially utilized to calculate the total energy consumption on a city scale. Then, the study used the classic IDA theory and the LMDI model that was expanded and optimized from the Kaya identity equation to conduct decomposition analysis on multiple elements to characterize changes in total energy consumption on a city scale. Taking Suzhou as an example, time series analysis was conducted on the main driving factors of its energy consumption in the two sectors of industrial activities and consumption by residents from 2006 to 2016. The roles of various influencing factors in the three different development stages, namely, 2006–2010, 2010–2013, and 2013–2016, were quantified. The main conclusions drawn from this work are as follows:
(1)
The total energy consumption of Suzhou presented an overall increasing trend, with 2006–2012 as a rapid growth stage and 2013–2016 as a moderate growth stage. The energy structure of Suzhou consistently had mainly coal-based properties, with diversification and mutual supplementation by natural gas, petroleum, electricity, and others. Moreover, the effect of outsourced electricity on the optimization of the energy consumption structure in Suzhou was significant.
(2)
The energy consumption in Suzhou was mainly focused on the industry, but the proportion of energy consumption by the industry decreased to 80.57% in 2016. The proportion of energy consumption by the industry in Suzhou was comparatively high mainly because its industrial structure has been upgraded relatively slowly. Energy consumption by residents accounted for a comparatively small proportion in the study period but presented a comparatively rapid increasing trend with the increase of urbanization.
(3)
The study finds significant differences in the effects of different influencing factors on energy consumption under certain developmental measures and policy environments in different stages of development. Scale-related factors have dominated changes in energy consumption, and structural and technological factors have had profound effects on energy consumption in different development periods. Population size and economic output were the main drivers for increments in industrial energy consumption, whereas energy intensity and economic structure performed the important curbing effects. The income effect of urban residents was the biggest driver behind the increase in residential energy consumption, whereas energy intensity was the main limiter.
This work is a systematic analysis of the multivariable driver model and multiperiod mechanism of action of the total energy consumption in Suzhou. Our findings provide a scientific basis for an in-depth understanding of the determinants of the evolution of urban energy consumption in Suzhou. Our findings also provide a basis for developing precise scenarios in prediction analyses of total energy consumption in Suzhou. Finally, our findings provide a reference for decision making in the systematic formulation of policies and measures for the energy structure transition and industrial structure optimization in Suzhou, including similar cities or urban areas in the developing world.

Author Contributions

Conceptualization, C.W.; methodology, C.W., F.W., X.L.; formal analysis, C.W., G.H., Y.Y., X.Z., and Z.Z.; original draft preparation, C.W., F.W., and Y.W.; review and editing, C.W.; All authors have read and agreed to the published version of the manuscript.

Funding

This work was supported by the GDAS Special Project of Science and Technology Development (2020GDASYL-20200301003, 2020GDASYL-20200102002), the National Natural Science Foundation of China (41501144), the GDAS’ Project of Science and Technology Development (2016GDASRC-0101, 2017GDASCX-0101, 2018GDASCX-0101, 2018GDASCX-0403, 2019GDASYL-0302001).

Institutional Review Board Statement

Not applicable.

Informed Consent Statement

Not applicable.

Data Availability Statement

The websites for these Statistical Yearbook are “http://tjj.suzhou.gov.cn/sztjj/tjsj/tjsj.shtml”, “http://tj.jiangsu.gov.cn/col/col76362/index.html” and “http://www.stats.gov.cn/tjsj/ndsj/”, respectively.

Conflicts of Interest

The authors declare no conflict of interest.

References

  1. Nerini, F.F.; Tomei, J.; To, L.S.; Bisaga, I.; Parikh, P.; Black, M.; Borrion, A.; Spataru, C.; Broto, V.C.; Anandarajah, G.; et al. Mapping synergies and trade-offs between energy and the Sustainable Development Goals. Nat. Energy 2018, 3, 10–15. [Google Scholar] [CrossRef] [Green Version]
  2. Wang, C.; Wang, F.; Du, H.; Zhang, X. Is China really ready for shale gas revolution—Re-evaluating shale gas challenges. Environ. Sci. Policy 2014, 39, 49–55. [Google Scholar] [CrossRef]
  3. Chu, S.; Majumdar, A. Opportunities and challenges for a sustainable energy future. Nat. Cell Biol. 2012, 488, 294–303. [Google Scholar] [CrossRef] [PubMed]
  4. Wang, C.; Wang, F.; Li, L.; Zhang, X. Wake-up Call for China to Re-Evaluate Its Shale-Gas Ambition. Environ. Sci. Technol. 2013, 47, 11920–11921. [Google Scholar] [CrossRef]
  5. Zeng, N.; Ding, Y.; Pan, J.; Wang, H.; Gregg, J. Climate change—The Chinese challenge. Science 2008, 319, 730–731. [Google Scholar] [CrossRef]
  6. BP, Statistical Review of World Energy. 2019. Available online: https://www.bp.com/en/global/corporate/energy-economics/statistical-review-of-world-energy.html (accessed on 14 November 2020).
  7. Liu, J.; Diamond, J. China’s environment in a globalizing world. Nature 2005, 435, 1179–1186. [Google Scholar] [CrossRef]
  8. Fu, B.; Zhuang, X.-L.; Jiang, G.-B.; Shi, J.-B.; Lu, A.Y.-H. FEATURE: Environmental Problems and Challenges in China. Environ. Sci. Technol. 2007, 41, 7597–7602. [Google Scholar] [CrossRef] [PubMed] [Green Version]
  9. Yalew, S.; Van Vliet, M.T.H.; Gernaat, D.E.H.J.; Ludwig, F.; Miara, A.; Park, C.; Byers, E.; De Cian, E.; Piontek, F.; Iyer, G.C.; et al. Impacts of climate change on energy systems in global and regional scenarios. Nat. Energy 2020, 5, 1–9. [Google Scholar] [CrossRef]
  10. Lee, J.; Yang, J.-S. Global energy transitions and political systems. Renew. Sustain. Energy Rev. 2019, 115, 109370. [Google Scholar] [CrossRef]
  11. Wei, Y.; Zhang, X.; Shi, Y.; Xia, L.; Pan, S.; Wu, J.; Han, M.; Zhao, X. A review of data-driven approaches for prediction and classification of building energy consumption. Renew. Sustain. Energy Rev. 2018, 82, 1027–1047. [Google Scholar] [CrossRef]
  12. Zhang, X.; Zhao, X.; Smith, S.; Xu, J.; Yu, X. Review of R&D progress and practical application of the solar photovoltaic/thermal (PV/T) technologies. Renew. Sustain. Energy Rev. 2012, 16, 599–617. [Google Scholar] [CrossRef]
  13. Wang, C.; Wang, F. China can lead on climate change. Science 2017, 357, 764. [Google Scholar] [CrossRef]
  14. Wang, C.; Wang, F. Structural Decomposition Analysis of Carbon Emissions and Policy Recommendations for Energy Sustainability in Xinjiang. Sustainability 2015, 7, 7548–7567. [Google Scholar] [CrossRef] [Green Version]
  15. Wang, C.; Zhang, H.; Wang, F.; Ye, Y.; Wu, Q.; Huang, G. Slash local emissions to protect Tibetan plateau. Nat. Cell Biol. 2019, 566, 455. [Google Scholar] [CrossRef] [Green Version]
  16. Keeler, B.; Hamel, P.; McPhearson, T.; Hamann, M.H.; Donahue, M.L.; Prado, K.A.M.; Arkema, K.K.; Bratman, G.N.; Brauman, K.A.; Finlay, J.C.; et al. Social-ecological and technological factors moderate the value of urban nature. Nat. Sustain. 2019, 2, 29–38. [Google Scholar] [CrossRef]
  17. Kennedy, C.; Steinberger, J.; Gasson, B.; Hansen, Y.; Hillman, T.; Havranek, M.; Pataki, D.; Phdungsilp, A.; Ramaswami, A.; Villalba Mendez, G. Greenhouse Gas Emissions from Global Cities. Environ. Sci. Technol. 2009, 43, 7297–7302. [Google Scholar] [CrossRef]
  18. Wang, S.; Shi, C.; Fang, C.; Feng, K. Examining the spatial variations of determinants of energy-related CO2 emissions in China at the city level using Geographically Weighted Regression Model. Appl. Energy 2019, 235, 95–105. [Google Scholar] [CrossRef]
  19. Wang, S.; Liu, X.; Zhou, C.; Hu, J.; Ou, J. Examining the impacts of socioeconomic factors, urban form, and transportation networks on CO2 emissions in China’s megacities. Appl. Energy 2017, 185, 189–200. [Google Scholar] [CrossRef]
  20. Xu, Q.; Dong, Y.; Yang, R.; Zhang, H.; Wang, C.-J.; Du, Z.-W. Temporal and spatial differences in carbon emissions in the Pearl River Delta based on multi-resolution emission inventory modeling. J. Clean. Prod. 2019, 214, 615–622. [Google Scholar] [CrossRef]
  21. Shan, Y.; Guan, D.; Hubacek, K.; Zheng, B.; Davis, S.J.; Jia, L.; Liu, J.; Liu, Z.; Fromer, N.; Mi, Z.; et al. City-level climate change mitigation in China. Sci. Adv. 2018, 4, eaaq0390. [Google Scholar] [CrossRef] [Green Version]
  22. Liu, Z.; Feng, K.; Hubacek, K.; Liang, S.; Anadon, L.D.; Zhang, C.; Guan, D. Four system boundaries for carbon accounts. Ecol. Model. 2015, 318, 118–125. [Google Scholar] [CrossRef] [Green Version]
  23. Wang, C.; Wu, K.; Zhang, X.; Wang, F.; Zhang, H.; Ye, Y.; Wu, Q.; Huang, G.; Wang, Y.; Wen, B. Features and drivers for energy-related carbon emissions in mega city: The case of Guangzhou, China based on an extended LMDI model. PLoS ONE 2019, 14, e0210430. [Google Scholar] [CrossRef] [Green Version]
  24. Shan, Y.; Liu, J.; Liu, Z.; Shao, S.; Guan, D. An emissions-socioeconomic inventory of Chinese cities. Sci. Data 2019, 6, 190027. [Google Scholar] [CrossRef] [Green Version]
  25. Liang, S.; Wang, C.; Zhang, T. An improved input–output model for energy analysis: A case study of Suzhou. Ecol. Econ. 2010, 69, 1805–1813. [Google Scholar] [CrossRef]
  26. Lin, J.; Liu, Y.; Meng, F.; Cui, S.; Xu, L. Using hybrid method to evaluate carbon footprint of Xiamen City, China. Energy Policy 2013, 58, 220–227. [Google Scholar] [CrossRef]
  27. Kayaçetin, N.; Tanyer, A.M. Embodied carbon assessment of residential housing at urban scale. Renew. Sustain. Energy Rev. 2020, 117, 109470. [Google Scholar] [CrossRef]
  28. Su, Y.; Chen, X.; Li, Y.; Liao, J.; Ye, Y.; Zhang, H.; Huang, N.; Kuang, Y. China’s 19-year city-level carbon emissions of energy consumptions, driving forces and regionalized mitigation guidelines. Renew. Sustain. Energy Rev. 2014, 35, 231–243. [Google Scholar] [CrossRef]
  29. Wang, C.; Wang, F.; Zhang, H.; Ye, Y.; Wu, Q.; Su, Y. Carbon Emissions Decomposition and Environmental Mitigation Policy Recommendations for Sustainable Development in Shandong Province. Sustainability 2014, 6, 8164–8179. [Google Scholar] [CrossRef] [Green Version]
  30. Wang, F.; Wang, C.; Su, Y.; Jin, L.; Wang, Y.; Zhang, X. Decomposition Analysis of Carbon Emission Factors from Energy Consumption in Guangdong Province from 1990 to 2014. Sustainability 2017, 9, 274. [Google Scholar] [CrossRef] [Green Version]
  31. Zhang, X.; Zhao, Y.; Sun, Q.; Wang, C. Decomposition and Attribution Analysis of Industrial Carbon Intensity Changes in Xinjiang, China. Sustainability 2017, 9, 459. [Google Scholar] [CrossRef] [Green Version]
  32. Jin, T.; Choi, B. Sectoral Decomposition of Korea’s Energy Consumption by Global Value Chain Dimensions. Sustainability 2020, 12, 8483. [Google Scholar] [CrossRef]
  33. Taka, G.N.; Huong, T.T.; Shah, I.H.; Park, H.S. Determinants of Energy-Based CO2 Emissions in Ethiopia: A Decomposition Analysis from 1990 to 2017. Sustainability 2020, 12, 4175. [Google Scholar] [CrossRef]
  34. González, P.F. Exploring energy efficiency in several European countries. An attribution analysis of the Divisia structural change index. Appl. Energy 2015, 137, 364–374. [Google Scholar] [CrossRef]
  35. Jung, S.; An, K.-J.; Dodbiba, G.; Fujita, T. Regional energy-related carbon emission characteristics and potential mitigation in eco-industrial parks in South Korea: Logarithmic mean Divisia index analysis based on the Kaya identity. Energy 2012, 46, 231–241. [Google Scholar] [CrossRef]
  36. Cansino, J.M.; Sánchez-Braza, A.; Rodríguez-Arévalo, M.L. How can Chile move away from a high carbon economy? Energy Econ. 2018, 69, 350–366. [Google Scholar] [CrossRef]
  37. Wang, W.; Liu, X.; Zhang, M.; Song, X. Using a new generalized LMDI (logarithmic mean Divisia index) method to analyze China’s energy consumption. Energy 2014, 67, 617–622. [Google Scholar] [CrossRef]
  38. Ma, M.; Cai, W.; Cai, W.; Dong, L. Whether carbon intensity in the commercial building sector decouples from economic development in the service industry? Empirical evidence from the top five urban agglomerations in China. J. Clean. Prod. 2019, 222, 193–205. [Google Scholar] [CrossRef]
  39. Chen, B.; Li, J.S.; Zhou, S.L.; Yang, Q.; Chen, G.Q. GHG emissions embodied in Macao’s internal energy consumption and external trade: Driving forces via decomposition analysis. Renew. Sustain. Energy Rev. 2018, 82, 4100–4106. [Google Scholar] [CrossRef]
  40. Chong, C.; Liu, P.; Ma, L.; Li, Z.; Ni, W.; Li, X.; Song, S. LMDI decomposition of energy consumption in Guangdong Province, China, based on an energy allocation diagram. Energy 2017, 133, 525–544. [Google Scholar] [CrossRef]
  41. Gu, S.; Fu, B.; Thriveni, T.; Fujita, T.; Ahn, J.-W. Coupled LMDI and system dynamics model for estimating urban CO2 emission mitigation potential in Shanghai, China. J. Clean. Prod. 2019, 240, 118034. [Google Scholar] [CrossRef]
  42. Shao, S.; Yang, L.; Gan, C.; Cao, J.; Geng, Y.; Guan, D. Using an extended LMDI model to explore techno-economic drivers of energy-related industrial CO2 emission changes: A case study for Shanghai (China). Renew. Sustain. Energy Rev. 2016, 55, 516–536. [Google Scholar] [CrossRef] [Green Version]
  43. Ang, B.W.; Lee, S.Y. Decomposition of industrial energy consumption: Some methodological and application issues. Energy Econ. 1994, 16, 83–92. [Google Scholar] [CrossRef]
  44. Ang, B. The LMDI approach to decomposition analysis: A practical guide. Energy Policy 2005, 33, 867–871. [Google Scholar] [CrossRef]
  45. Ang, B.; Liu, N. Energy decomposition analysis: IEA model versus other methods. Energy Policy 2007, 35, 1426–1432. [Google Scholar] [CrossRef]
  46. Choi, K.-H.; Ang, B. Attribution of changes in Divisia real energy intensity index—An extension to index decomposition analysis. Energy Econ. 2012, 34, 171–176. [Google Scholar] [CrossRef]
  47. Xu, X.; Ang, B. Analysing residential energy consumption using index decomposition analysis. Appl. Energy 2014, 113, 342–351. [Google Scholar] [CrossRef]
  48. Chung, W.; Kam, M.; Ip, C. A study of residential energy use in Hong Kong by decomposition analysis, 1990–2007. Appl. Energy 2011, 88, 5180–5187. [Google Scholar] [CrossRef]
  49. Achão, C.; Schaeffer, R. Decomposition analysis of the variations in residential electricity consumption in Brazil for the 1980–2007 period: Measuring the activity, intensity and structure effects. Energy Policy 2009, 37, 5208–5220. [Google Scholar] [CrossRef]
  50. Hasanbeigi, A.; Can, S.D.L.R.D.; Sathaye, J. Analysis and decomposition of the energy intensity of California industries. Energy Policy 2012, 46, 234–245. [Google Scholar] [CrossRef]
  51. Baležentis, A.; Baležentis, T.; Streimikiene, D. The energy intensity in Lithuania during 1995–2009: A LMDI approach. Energy Policy 2011, 39, 7322–7334. [Google Scholar] [CrossRef]
  52. Chontanawat, J.; Wiboonchutikula, P.; Buddhivanich, A. Decomposition analysis of the change of energy intensity of manufacturing industries in Thailand. Energy 2014, 77, 171–182. [Google Scholar] [CrossRef]
  53. Wang, Z.; Yang, Y. Features and influencing factors of carbon emissions indicators in the perspective of residential consumption: Evidence from Beijing, China. Ecol. Indic. 2016, 61, 634–645. [Google Scholar] [CrossRef]
  54. Zhao, M.; Tan, L.; Zhang, W.; Ji, M.; Liu, Y.; Yu, L. Decomposing the influencing factors of industrial carbon emissions in Shanghai using the LMDI method. Energy 2010, 35, 2505–2510. [Google Scholar] [CrossRef]
  55. Kang, J.; Zhao, T.; Liu, N.; Zhang, X.; Xu, X.; Lin, T. A multi-sectoral decomposition analysis of city-level greenhouse gas emissions: Case study of Tianjin, China. Energy 2014, 68, 562–571. [Google Scholar] [CrossRef]
  56. Tan, X.; Dong, L.; Chen, D.; Gu, B.; Zeng, Y. China’s regional CO2 emissions reduction potential: A study of Chongqing city. Appl. Energy 2016, 162, 1345–1354. [Google Scholar] [CrossRef]
  57. Liu, Z.; Liang, S.; Geng, Y.; Xue, B.; Xi, F.; Pan, Y.; Zhang, T.; Fujita, T. Features, trajectories and driving forces for energy-related GHG emissions from Chinese mega cites: The case of Beijing, Tianjin, Shanghai and Chongqing. Energy 2012, 37, 245–254. [Google Scholar] [CrossRef]
  58. Shao, L.; Guan, D.; Zhang, N.; Shan, Y.; Chen, G.Q. Carbon emissions from fossil fuel consumption of Beijing in 2012. Environ. Res. Lett. 2016, 11, 114028. [Google Scholar] [CrossRef] [Green Version]
  59. Ru, M.; Tao, S.; Smith, K.; Shen, G.; Shen, H.; Huang, Y.; Chen, H.; Chen, Y.; Chen, X.; Liu, J.; et al. Direct Energy Consumption Associated Emissions by Rural-to-Urban Migrants in Beijing. Environ. Sci. Technol. 2015, 49, 13708–13715. [Google Scholar] [CrossRef]
  60. Li, J.; Chen, G.; Hayat, T.; Alsaedi, A. Mercury emissions by Beijing#x2019;s fossil energy consumption: Based on environmentally extended input–output analysis. Renew. Sustain. Energy Rev. 2015, 41, 1167–1175. [Google Scholar] [CrossRef]
  61. Shan, Y.; Huang, Q.; Guan, D.; Hubacek, K. China CO2 emission accounts 2016–2017. Sci. Data 2020, 7, 54. [Google Scholar] [CrossRef] [Green Version]
  62. Guan, D.; Liu, Z.; Geng, Y.; Lindner, S.; Hubacek, K. The gigatonne gap in China’s carbon dioxide inventories. Nat. Clim. Chang. 2012, 2, 672–675. [Google Scholar] [CrossRef]
  63. Siegel, I.H. The Generalized “Ideal” Index-Number Formula. J. Am. Stat. Assoc. 2006, 40, 520. [Google Scholar] [CrossRef]
  64. Wang, H.; Ang, B.; Su, B. Assessing drivers of economy-wide energy use and emissions: IDA versus SDA. Energy Policy 2017, 107, 585–599. [Google Scholar] [CrossRef]
  65. Ang, B.W. Decomposition analysis for policymaking in energy: Which is the preferred method? Energy Policy 2004, 32, 1131–1139. [Google Scholar] [CrossRef]
  66. Ang, B. LMDI decomposition approach: A guide for implementation. Energy Policy 2015, 86, 233–238. [Google Scholar] [CrossRef]
  67. Ang, B.; Zhang, F. A survey of index decomposition analysis in energy and environmental studies. Energy 2000, 25, 1149–1176. [Google Scholar] [CrossRef]
  68. Peters, G.P.; Andrew, R.M.; Canadell, J.G.; Fuss, S.; Jackson, R.B.; Korsbakken, J.I.; Le Quéré, C.; Nakicenovic, N. Key indicators to track current progress and future ambition of the Paris Agreement. Nat. Clim. Chang. 2017, 7, 118–122. [Google Scholar] [CrossRef]
  69. Wang, F.; Wang, C.; Chen, J.; Li, Z.; Li, L. Examining the determinants of energy-related carbon emissions in Central Asia: Country-level LMDI and EKC analysis during different phases. Environ. Dev. Sustain. 2020, 22, 7743–7769. [Google Scholar] [CrossRef]
  70. Su, Y.; Wang, Y.; Zheng, B.; Ciais, P.; Wu, J.; Chen, X.; Wang, Y.; Wang, C.; Ye, Y.; Li, Q.; et al. Retrospect driving forces and forecasting reduction potentials of energy-related industrial carbon emissions from China’s manufacturing at city level. Environ. Res. Lett. 2020, 15, 074020. [Google Scholar] [CrossRef] [Green Version]
  71. Bi, J.; Zhang, R.; Wang, H.; Liu, M.; Wu, Y. The benchmarks of carbon emissions and policy implications for China’s cities: Case of Nanjing. Energy Policy 2011, 39, 4785–4794. [Google Scholar] [CrossRef]
  72. Li, J.; Chen, G. Energy and greenhouse gas emissions review for Macao. Renew. Sustain. Energy Rev. 2013, 22, 23–32. [Google Scholar] [CrossRef]
Figure 1. Total electricity consumption in megacities in China.
Sustainability 13 00764 g001
Figure 2. Economic growth in Suzhou.
Sustainability 13 00764 g002
Figure 3. Total energy consumption by different types in Suzhou from 2006 to 2016.
Sustainability 13 00764 g003
Figure 4. Total energy consumption by different sectors in Suzhou from 2006 to 2016.
Sustainability 13 00764 g004
Figure 5. Contributions of driving forces of energy consumption changes in Suzhou in 2006–2016.
Sustainability 13 00764 g005
Figure 6. Contributions of each factor and the energy consumption change in the industrial sector of Suzhou in 2006–2016.
Sustainability 13 00764 g006
Figure 7. Contributions of each factor and energy consumption change in the residential sector of Suzhou in 2006–2016.
Sustainability 13 00764 g007
Table 1. Summary of selected logarithmic mean Divisia index (LMDI)’s application in urban energy consumption or carbon emissions studies.
AuthorsTime PeriodIndicatorCities or Countries
Ang et al. [43]1974–1990Industrial energy consumptionSingapore
Ang et al. [44]1990–2000Industrial energy consumptionCanada
Ang et al. [45]1985–2000Industrial energy consumptionUnited States
Choi et al. [46]1987–2004Energy intensityUnited States
Xu et al. [47]2000–2010Residential energy consumptionSingapore
Chung et al. [48]1990–2007Residential energy consumptionHong Kong
Achão et al. [49]1980–2007Residential energy consumptionBrazil
Ali et al. [50]1997–2008Industrial energy intensityCalifornia
Balezˇentis et al. [51]1995–2009Energy intensityLithuania
Chontanawat et al. [52]1991–2011Industrial energy intensity Thailand
Fernández González et al. [34]1995–2010Energy intensityEuropean countries
Jung et al. [35]2002–2009Energy-related carbon emissionSouth Korea
Cansino et al. [36]1991–2013Energy-related carbon emissionChile
Chen et al. [39]2000–2011Energy-related carbon emissionMacao
Wang et al. [53]2000–2010Residential carbon emissionsBeijing
Zhao et al. [54]1996–2007Energy-related carbon emissionShanghai
Shao et al. [42]1994–2011Energy-related carbon emissionShanghai
Kang et al. [55]2001–2009Energy-related carbon emissionTianjin
Tan et al. [56]2000–2012Energy-related carbon emissionChongqing
Liu et al. [57]1995–2009Energy-related carbon emissionBeijing, Shanghai, Tianjin, and Chongqing
Table 2. Decomposition of energy consumption change in Suzhou.
ΔE (Mtce)p-Effectg-Effecte-Effect
2006–20077.33674.58863.4257−0.6776
2007–20081.85101.98535.2503−5.3846
2008–20091.83181.58194.9711−4.7212
2009–20108.55517.22740.92710.4006
2010–20117.16570.36777.9280−1.1299
2011–20122.74170.22577.2990−4.7830
2012–20130.75630.22407.1057−6.5735
2013–20140.40370.19246.2295−6.0182
2014–20151.11990.09205.7878−4.7599
2015–20162.85990.24605.7772−3.1633
Table 3. Decomposition of energy consumption change in the industrial and residential sectors of Suzhou in 2006–2016.
2006–20072007–20082008–20092009–20102010–20112011–20122012–20132013–20142014–20152015–20162006–2016
Economic activitiesp-effect4.37191.89071.51286.92820.34780.21190.21020.18090.08620.229416.9164
g-effect3.26395.00024.75400.88877.50056.85266.66585.85615.42305.387346.9213
e-effect-Agriculture−0.05900.0094−0.08750.03980.02480.0067−0.0774−0.01340.0207−0.0121−0.1677
e-effect-Production2.3221−4.86150.25640.04140.0814−4.4646−2.4262−2.3636−3.35800.4059−12.2806
e-effect-Construction−0.10690.0506−0.21990.08490.1126−0.0093−0.05090.0039−0.0986−0.1331−0.3602
e-effect-Service−0.96430.3908−1.89580.8064−0.57101.1781−1.2623−0.5526−0.0002−1.0069−4.1845
s-effect-Agriculture−0.0207−0.0141−0.0075−0.0222−0.0049−0.00780.0045−0.00170.0009−0.0139−0.1039
s-effect-Production−1.4518−1.6514−1.5455−1.8655−1.6286−1.7354−2.6293−2.8910−2.0085−2.5707−18.0533
s-effect-Construction−0.02910.00390.02980.00110.0112−0.00500.01010.0127−0.0080−0.02110.0117
s-effect-Service0.28640.26010.17570.24510.19480.24650.35980.37190.27960.37682.8411
E-Economy7.61251.07862.97247.14816.06892.27360.80420.60320.33722.641831.5405
Residential consumptionp-effect0.12600.05550.04110.18580.01220.00840.00860.00730.00370.01080.6775
g-effect-AUI0.20240.18870.15300.17540.31230.35430.28310.38490.25190.27572.6636
g-effect-ARI0.12500.13030.09210.11780.24390.21530.19920.15590.14930.15581.6456
e-effect-U−0.44510.1854−0.76180.37070.2489−0.0399−0.3776−0.43680.2108−0.1139−1.4818
e-effect-R−0.36850.1775−0.68890.47190.2940−0.0511−0.1450−0.29440.1903−0.0977−0.6696
Urbanization-effect0.01170.00870.00710.09320.04380.04140.03480.03320.04200.02910.3677
E-Resident−0.27580.7724−1.14061.40701.09680.4681−0.0480−0.19940.78270.21813.0814
Publisher’s Note: MDPI stays neutral with regard to jurisdictional claims in published maps and institutional affiliations.

