Post-Occupancy Evaluation of Indoor Air Quality and Thermal Performance in a Zero Carbon Building


1
Department of Architecture and Built Environment, University of Nottingham Ningbo China, Ningbo 315100, China
2
Network for Education and Research on Peace and Sustainability (NERPS), Hiroshima University, Hiroshima 739-8530, Japan
3
School of Architecture, Building and Civil Engineering, Loughborough University, Loughborough LE11 3TU, UK
*
Author to whom correspondence should be addressed.
Sustainability 2021, 13(2), 667; https://doi.org/10.3390/su13020667
Submission received: 11 December 2020
/
Revised: 4 January 2021
/
Accepted: 6 January 2021
/
Published: 12 January 2021
(This article belongs to the Section Environmental Sustainability and Applications)
Abstract
:Maintaining a comfortable indoor environment throughout the year makes up the main part of energy consumption caused by people’s use of buildings. In recent years, China has started to integrate sustainable technologies into green building design and construction. However, some post-occupancy reports on certified buildings revealed that such integration has been perceived to prioritize energy savings over comfort. This paper aims to investigate the ability of the first Chinese zero carbon building to maintain comfortable and healthy indoor conditions in the summer season. The research implements a combination of occupant survey and on-site measurements to evaluate the occupants’ perception of the indoor environment quality (IEQ) and benchmark the measurements against relevant standards. The results from this study show that the mean summer indoor temperature was 0.9 °C above the standard limit, while on average, occupants gave a positive score to the indoor thermal environment. High contentment with the building acoustics was reported by users and supported by sensors measurements meeting the standard values. The illuminance levels were mainly maintained high with the exception of the light in one of the studied zones. Analyzing the data on occupants experiencing sick building syndromes revealed that 45.8% of respondents experienced at least one of the symptoms.
1. Introduction
Buildings account for almost a third of total world energy consumption [1] and thus are the major source of carbon dioxide gas emissions. Sustaining a comfortable indoor environment with outside temperatures varying throughout the year makes up the main part of energy consumption caused by people’s use of buildings [2]. To minimize energy usage in buildings, the Paris Agreement [3] sets the goal for achieving energy efficiency, sustainability, and carbon neutrality for the architecture, engineering, and construction (AEC) industry as well as all other industries [4,5,6]. Achieving this aim requires common application of sustainable strategies for green building design and construction [7].
The World Green Building Council defines green buildings as an attempt to increase all the positive and decrease all the negative impacts of buildings on the natural environment [8]. They extensively practice energy and water-saving techniques, apply on-site renewable energy generation, and use sustainable and non-toxic materials that can later be reused or recycled [8]. An even more advanced version of green buildings is known as zero energy buildings (ZEB), which can be defined differently based on the boundary and metrics used for the evaluation. These definitions can be found in works done by Kurnitski et al. [9], Peterson et al. [10], and Torcellini et al. [11]. Zero carbon buildings (ZCB) belong to this group of highly energy-efficient buildings and they have a definition of “buildings that are highly energy-efficient and produce onsite or procure carbon-free renewable energy in an amount sufficient to offset the annual carbon emissions associated with operations” [12]. This definition can further be attributed to building operational energy (annual operational consumption is covered by green energy production) or also by construction—when the amount of carbon generated during the building’s products and construction stages is included in the final carbon balance calculations [13]. The Centre for Sustainable Energy Technologies (CSET) at the University of Nottingham Ningbo China (UNNC), used as a case study in this research, was the first ZCB built in China [14].
Even though ZCBs are designed to be extremely sustainable and energy self-sustaining, they should also provide a comfortable and healthy working environment for the users. According to McMullan [15], users’ indoor environment quality (IEQ) satisfaction greatly affects overall productivity; therefore it is essential to sustain a comfortable environment indoors. However, it was found that, in some cases, sustainability has been achieved at the expense of human comfort [16,17]. Previously, a large amount of research has been carried out on “green” certified buildings to compare them with conventional buildings in terms of thermal comfort, air quality, lighting, glare, noise, privacy, personal control, health, productivity, aesthetics, job satisfaction, mental wellbeing, and other factors [18,19,20,21,22,23,24,25,26,27]. The most commonly studied buildings in post-occupancy evaluation (POE) research are Leadership in Energy and Environmental Design (LEED)- and Building Research Establishment Environmental Assessment Method (BREEAM)-certified buildings as these two certification systems are accepted and implemented in many countries. Some research [19,20,24,26] found that green buildings are perceived to be less thermally comfortable by their users, while other case studies [21,23,25] found that LEED-certified buildings tend to score better than non-green buildings for their overall thermal environment. Despite these controversial results on temperature perception, all LEED buildings are reported to provide better air quality according to Khoshbakht et al. [22], who did a systematic review on global evidence of satisfaction with green buildings. Altomonte et al. [18] pointed out that unlike LEED buildings, BREEAM-certified buildings perform worse than non-certified buildings in terms of air quality, which can be attributed to the fact that the BREEAM certification system does not have compulsory credits for indoor air quality. The Green Star certified buildings investigated by Thatcher and Milner [27] showed the same variety of thermal comfort and great satisfaction with air quality as in LEED buildings, however, one of the case studies reported insufficient illumination levels.
Gou et al. [28] studied a high-standard Green Building Label (GBL)-certified building in Shenzhen China using an occupants survey and physical measurements. They found that while in summer, the majority of users were satisfied with indoor environment temperatures, in winter, 20% felt too cold, which was supported by physical measurements showing temperature dropping below 15 °C. The authors attributed this to the fact that in hot summer warm winter (HSWW) and in hot summer cold winter (HSCW) Chinese climate zones, the cold winter temperature outside is neglected during design. However, a comparison of GBL-certified buildings with non-certified buildings done by Gou et al., Pei et al., and Lin et al. [29,30,31] revealed a greater satisfaction with the thermal comfort in the green buildings as well as with the air quality. Moreover, Pei et al. [31] showed higher satisfaction with acoustic and lighting design, while Gou et al. [29] stated that users of green buildings reported insufficient illumination and acoustic insulation. Additionally, Gou et al. [29] observed a “forgiveness” phenomenon where green building users were willing to extend their comfort zone and forgive some of the inadequacies of IEQ for the purpose of saving energy.
People’s perception of the thermal environment is highly subjective and can be biased as it depends on many personal factors such as gender, complexion, age, culture, etc. [32]. Worldwide researchers and government authorities investigate the appropriate comfort zone physical parameters for indoor environment [33,34,35,36,37,38]. There are international institutions and organizations such as the American Society of Heating, Refrigerating and Air-Conditioning Engineers (ASHRAE) [33], International Standards Organization (ISO) [39], and Chartered Institution of Building Services Engineers (CIBSE) [40], as well as national ministries, e.g., Ministry of Housing and Urban-Rural Development in China [41]. The standards developed by these institutions provide guidelines and benchmarks for the physical parameters affecting user comfort perception, such as temperature, humidity, illumination, fresh air flow rate, etc. Although there are constant debates regarding the most appropriate comfort parameters [42], these benchmarks can be used to evaluate the as-built thermal performance of a building.
In addition to the thermal comfort, it is highly important to evaluate the indoor air quality (IAQ) of any building as it is often associated with sick building syndrome (SBS) phenomena, which is described by Environmental Protection Agency (EPA) as “situations in which building occupants experience acute health and comfort effects that appear to be linked to time spent in a building, but no specific illness or cause can be identified”. When the symptoms describe a diagnosable illness that can be attributed to a particular airborne contaminant, the term “building-related illness (BRI)” is used [43]. According to Mendes and Teixeira [44], all indoor pollutants can be divided into two groups: biological (fungi, mold, spores, bacteria, etc.) and chemical (CO, CO2, H2S, formaldehyde, etc.). The first group of pollutants mostly causes long-term respiratory symptoms, allergies, and asthma. Chemical pollutants affect occupants in the short-term as well as long-term [45,46,47]. Thus, a high concentration of HCHO in the air can lead to fatigue and drowsiness as well as eyes and throat discomfort; in a long period of exposure it was proven to be carcinogenic [48]. High levels of CO in the air causes building users to experience fatigue, dizziness, headache, and nausea; H2S gas is associated with dizziness and headache as well [44,49]. According to Jaffari et al. [50], exposure to high CO2 levels leads to nausea, headache, nose, and throat irritation, while Mendes and Teixeira [44] state that carbon dioxide is not the primal reason of SBS, but an indication of insufficient ventilation resulting in a build-up of other indoor pollutants. Some of the SBS can be caused by non-pollution reasons; thus, high indoor noise levels can potentially cause dizziness and headaches [50,51], and poor lighting conditions may result in malaise, headache, decreased productivity, and depression [50,52]. Low relative humidity (RH) levels (30–40% and less) also cause nose discomfort and dry throat as well as eye irritation. Very high humidity (more than 80% RH), in contrast, is a cause of thermal discomfort, since it prevents natural evaporation and cooling from the human skin; additionally, it can result in a spreading of respiratory diseases [53]. Thus, the IAQ can influence both the occupants’ productivity and health.
Based on the literature review, it can be stated that there is an insufficient amount of practical research on green buildings’ thermal and air quality investigation in China, in particular on ZCBs. Therefore, this research raises a question: does the first Chinese ZCB offer comfortable conditions to its users? This paper offers the novelty of providing IEQ evaluation of a Chinese ZCB using well-established methods, expanding the international knowledge on green buildings’ comfort. The post-occupancy evaluation is performed via user questionnaire and real-time sensors. The aim of this investigation is to determine if the building is perceived to be comfortable by its users and if the building meets requirements specified in relevant Chinese standards. The focus of the research is given to hot summer months when the passive cooling systems need to cope with both outside high temperatures and the internal heat gains from people and equipment during times of high building occupancy.
2. Method
2.1. Case Study Introduction: CSET Building, China
The CSET building was officially opened in September 2008 at the University of Nottingham Ningbo China. It is the first zero carbon building in China demonstrating state-of-the-art sustainable techniques and a successful way to integrate different energy-saving technologies within one building [14]. The building consists of two main parts: the basement and the tower (Figure 1). The basement initially had a sustainable technology laboratory and a reception area which was used for demonstration and exhibition purposes. The tower includes five floors: the first floor is the exhibition hall, the second floor functions as a computer laboratory and seminar room, the third floor is used as PhD offices, the fourth floor is the teachers’ office (up to four office spaces), and the fifth floor is a meeting room. Ten years after the construction of the building, the laboratory in the basement was refurbished into an architectural design studio, which has been used by architecture students as the main study area as well as for lectures. Thus, the initial design of the building was for a lower occupancy than currently, which can potentially influence the building’s IEQ. These days, most users either stay in the studio or in the laboratory on the second floor; therefore, the most representable data were collected from these two zones.
The building has a well-insulated double skin façade with glass cover on the west side and a light well on the east side increasing the natural light penetration. Its heat transfer coefficient of the translucent wall is 0.24 W/m2 K, the underground exterior wall is 0.25 W/m2 K, the roof is 0.20 W/m2 K, the windows is 1.2 W/m2 K, and the underground floor is 0.38 W/m2 K. The ventilation in the building is performed via a combination of passive and active technologies to provide energy savings. Thus, the nearby grounds have photovoltaic (PV) panels and solar collectors that provide the building with electricity and hot water which is used for solar absorption air conditioning. In winter and summer, the conditioned air is centrally supplied to the basement at a rate of 1200 m3/h and to the tower at a rate of 2000 m3/h via the underfloor ventilation. In spring and autumn, the pre-cooling and pre-heating provided by the earth tubes and heat pump is enough to bring the temperature of the incoming fresh air to a comfortable range. The difference between light well and outside skin temperatures creates a natural air circulation that distributes the fresh air everywhere in the building. One of the drawbacks of this technology is that the occupants have no control over the temperature or the ventilation volume flow rate of the supplied air. A green roof above the basement acts both as insulation and as a rainwater collector for improved stormwater management. The wind turbine on top of the tower alongside the PV panels on the ground charge the underground batteries to provide the electricity for the whole building.
2.2. IEQ Parameters
The broad territories of China are divided into five climate zones by the MoHURD [41] building design standard, namely “severe cold” (SC), “cold” (C), “hot summer cold winter” (HSCW), “hot summer warm winter” (HSWW), and “mild” (M). The assessed building is located in the Ningbo Zhejiang province, which belongs to the HSCW zone. It has a humid subtropical climate with hot rainy summers from June to September and cool cloudy winters from December to February with hottest month average temperature being 30 °C, and the coldest month average temperature being around 5 °C.
Table 1 summarizes the physical parameters that have to be maintained in order to provide adequate IEQ based on building design standard [41], the standard for lighting design [54], sound insulation design code for civil buildings [55], and indoor air quality standard [56]. One of the objectives of this research is to determine if these specifications are met in the case study building.
According to ASHRAE [57] “thermal comfort is that condition of mind which expresses satisfaction with the thermal environment”. This defines a connection between the thermal environment and the psychological response of people. Significant research on the connection between physical parameters and people’s perception of thermal comfort was done by Fanger [58]. His model, called Predicted Mean Vote (PMV), is based on an energy balance of a human body being represented as a thermodynamic system that exchanges heat with the outside environment. This rate of exchange and the internal heat production of a human body is dependent on a combination of six factors: four environmental factors being air temperature, radiant temperature, humidity, and air velocity, and two personal factors being the amount of clothing and activity performed. For any combination of these parameters the amount of people that find these conditions dissatisfying can be estimated using Predicted Percentage Dissatisfied (PPD). In a building environment, occupants can perform different adjustments (such as put on more/fewer clothes, open a window, change posture, move to another side of the room, etc.) in order to maintain thermal comfort; therefore, to take into account those dynamic changes, the adaptive model was developed by de Dear et al. [59]. Today, the majority of the standards dealing with ergonomics and thermal comfort implement their assumptions based on Fanger’s PMV and PPD models and the adaptive model [60,61].
3. Data Collection
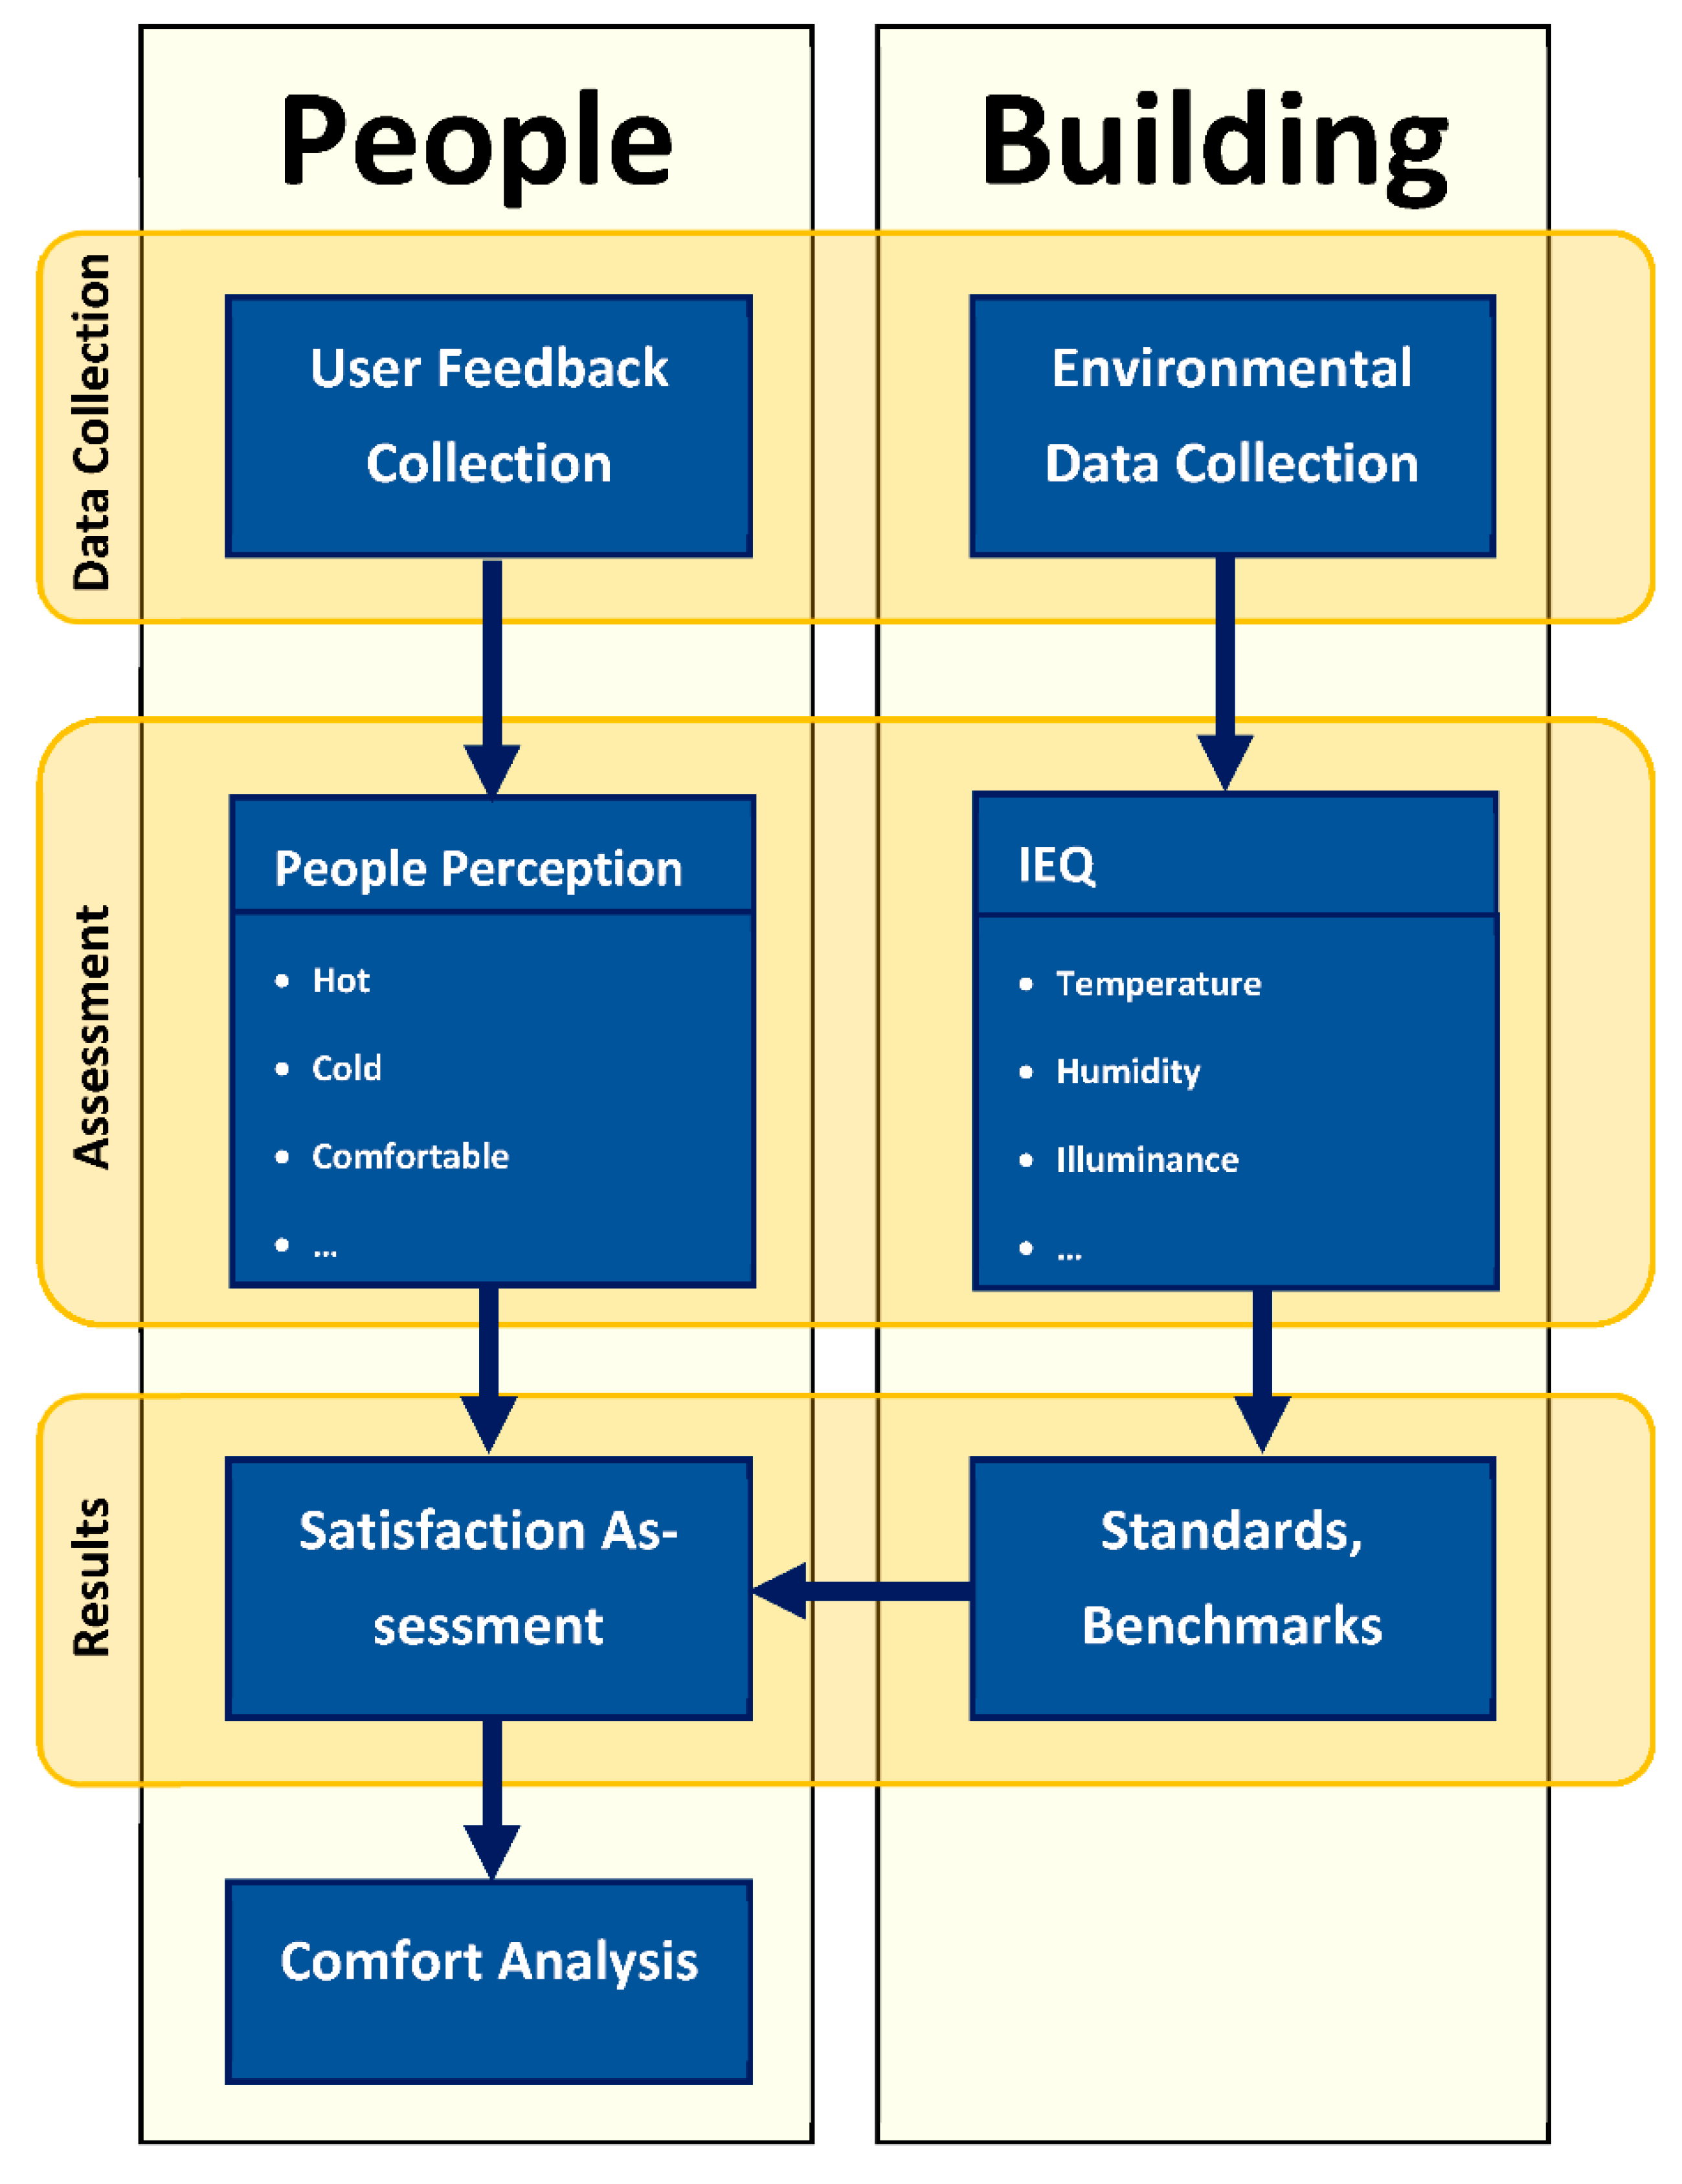
The data were collected and analyzed in this research using the methodology presented in Figure 2. There were two essential parts of this methodology: one concerning people’s perception of the building and the other evaluating the building itself. For each of these two parts, there were three steps in the process: user feedback collection and environmental data collection, assessment of the collected answers on people perception as well as measured IEQ parameters and establishing the results of occupants’ satisfaction levels along with comparison between measured parameters and benchmarks.
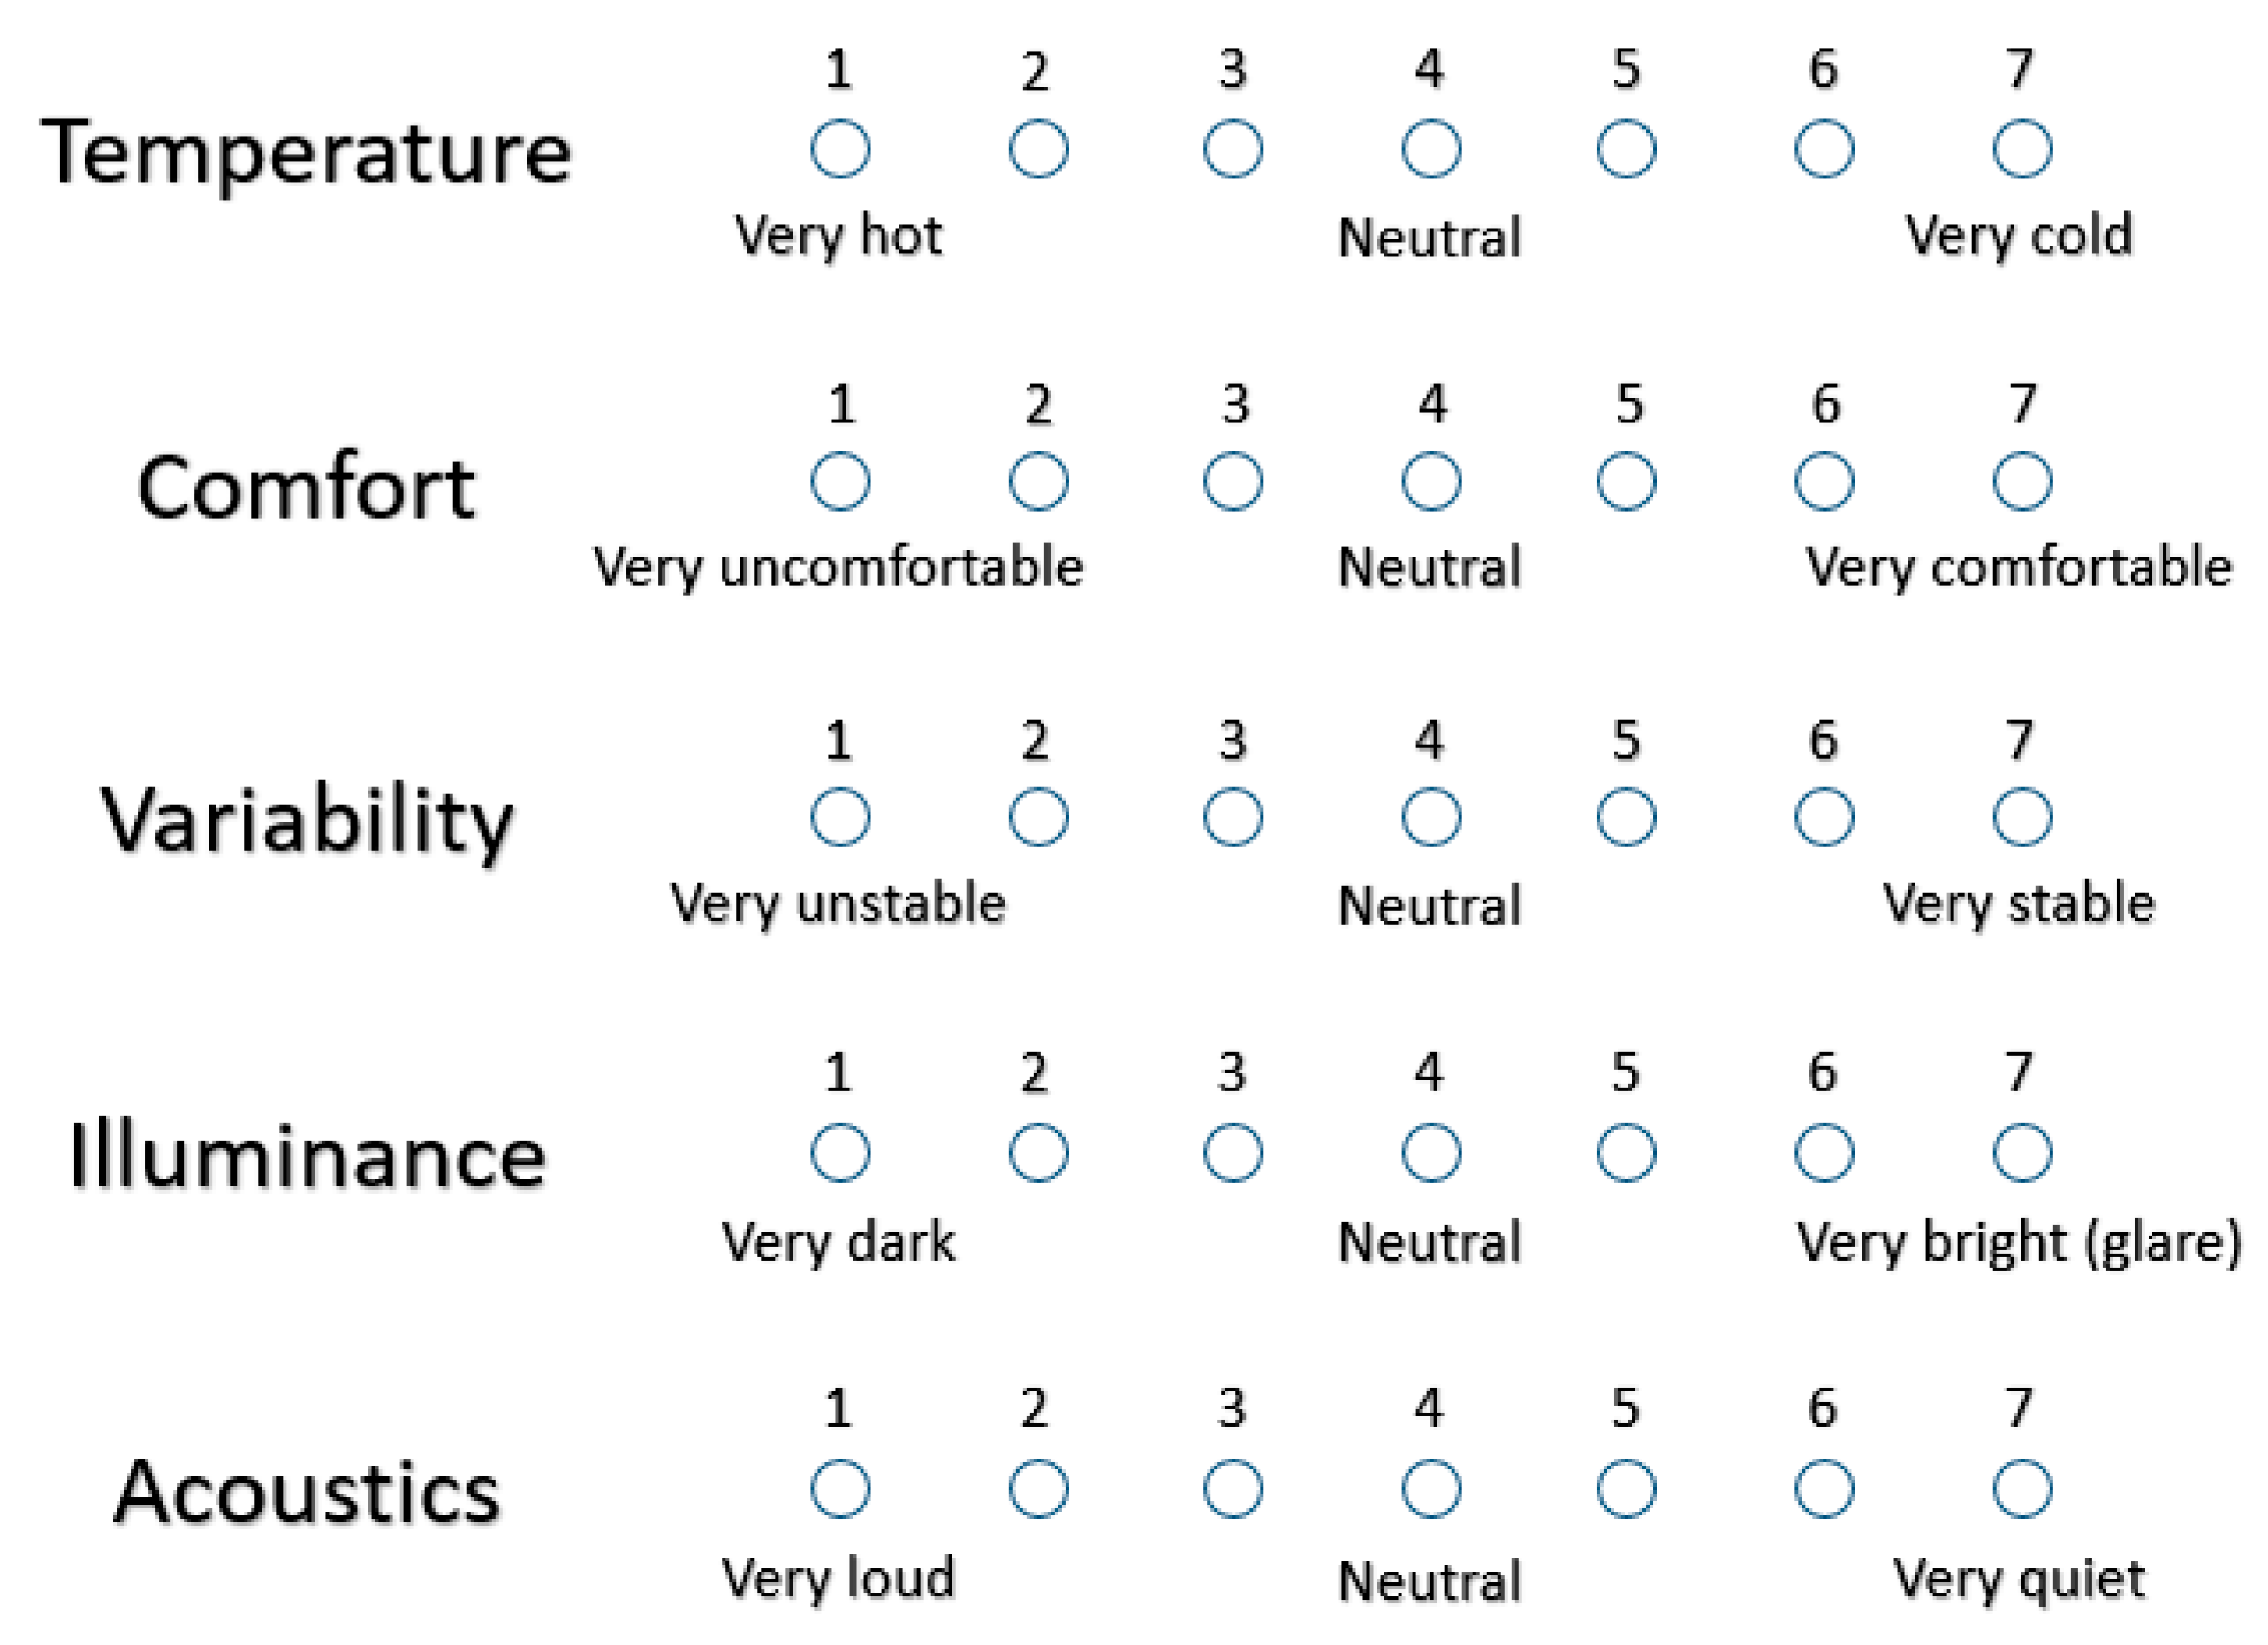
The occupant survey questions (available in Supplementary Materials) were developed based on the Building Use Studies (BUS) reporting format [62]. The study was conducted according to the guidelines of Economic and Social Research Council (2012) Framework for Research Ethics and approved by the Institutional Research Ethics Panel of the University of Nottingham Ningbo China (24 April 2018). The data collection was performed in the second half of May at the end of the second academic semester to ensure that all participants had been using the building for longer than 6 months as suggested by the BUS method. Paper questionnaires were distributed by hand personally to all the occupants present in the building as suggested by Gou et al. [29] for higher answering rates. Around 65% of occupants (48 subjects in total) agreed to participate in the study and all of them gave their informed consent for inclusion prior to participation. The majority of the building’s users were located in the teaching areas of Zone 1 and Zone 2 (Figure 1b). The first set of questions enquired about participants’ personal details such as: gender, age, time spent in the building, and which floor they usually use. Several studies [18,63,64,65,66] state that females tend to report lower satisfaction with IEQ than males since they tend to be more sensitive to temperature changes. Other studies [58,67,68,69,70] report that men prefer lower temperatures compared to women. Breslin [71] and Webb and Parsons [72] specify that the gender difference in satisfaction was primarily observed in colder conditions while neutral or slightly warmer than neutral the thermal perception of these target groups was similar. Therefore, one of the objectives of this research was to determine if the gender influence on the IEQ satisfaction level can be observed in analyzed data. Furthermore, according to Fanger’s thermal comfort formula, the participants’ metabolism rate, which is dependent on age, is one of the influencing factors affecting the occupants thermal comfort perception [58]. Thus, the collected data coming mainly from university students might be only representative for the young adult age group. In the second set of questions, building users were required to rate in general summer temperature, its comfortableness, and variability, as well as indoor illuminance and acoustics using a 7-point Likert scale as shown in Figure 3. For all the variables, number 4 represented the neutral reply, while all other numbers represented different categories of the variable (e.g., 1 = very uncomfortable, 2 = uncomfortable, 3 = slightly uncomfortable, 5 = slightly comfortable, 6 = comfortable, 7 = very comfortable). Thus, for each variable except for temperature, the highest rating represents the most satisfaction. It should be noted that the occupants could neither adjust the thermal environment nor the illuminance to their specific preferences, but they could freely relocate to a more comfortable (in their view) place in the room. The third set of questions indirectly evaluated indoor air quality parameters such as CO2, humidity, particulate matter, formaldehyde, and other chemicals that cannot be detected by humans, through a question “Do you experience any of these symptoms after spending more than two hours in the building?” The respondents needed to mark every suitable option: fatigue and drowsiness, nausea and dizziness, eyes irritation, sore throat, nose discomfort, headache; there was also a “None” option. The two-hour threshold for the question was decided based on the longest classes time period, after which the occupants can mobilize and leave the building. These parameters were adopted from SBS phenomena.
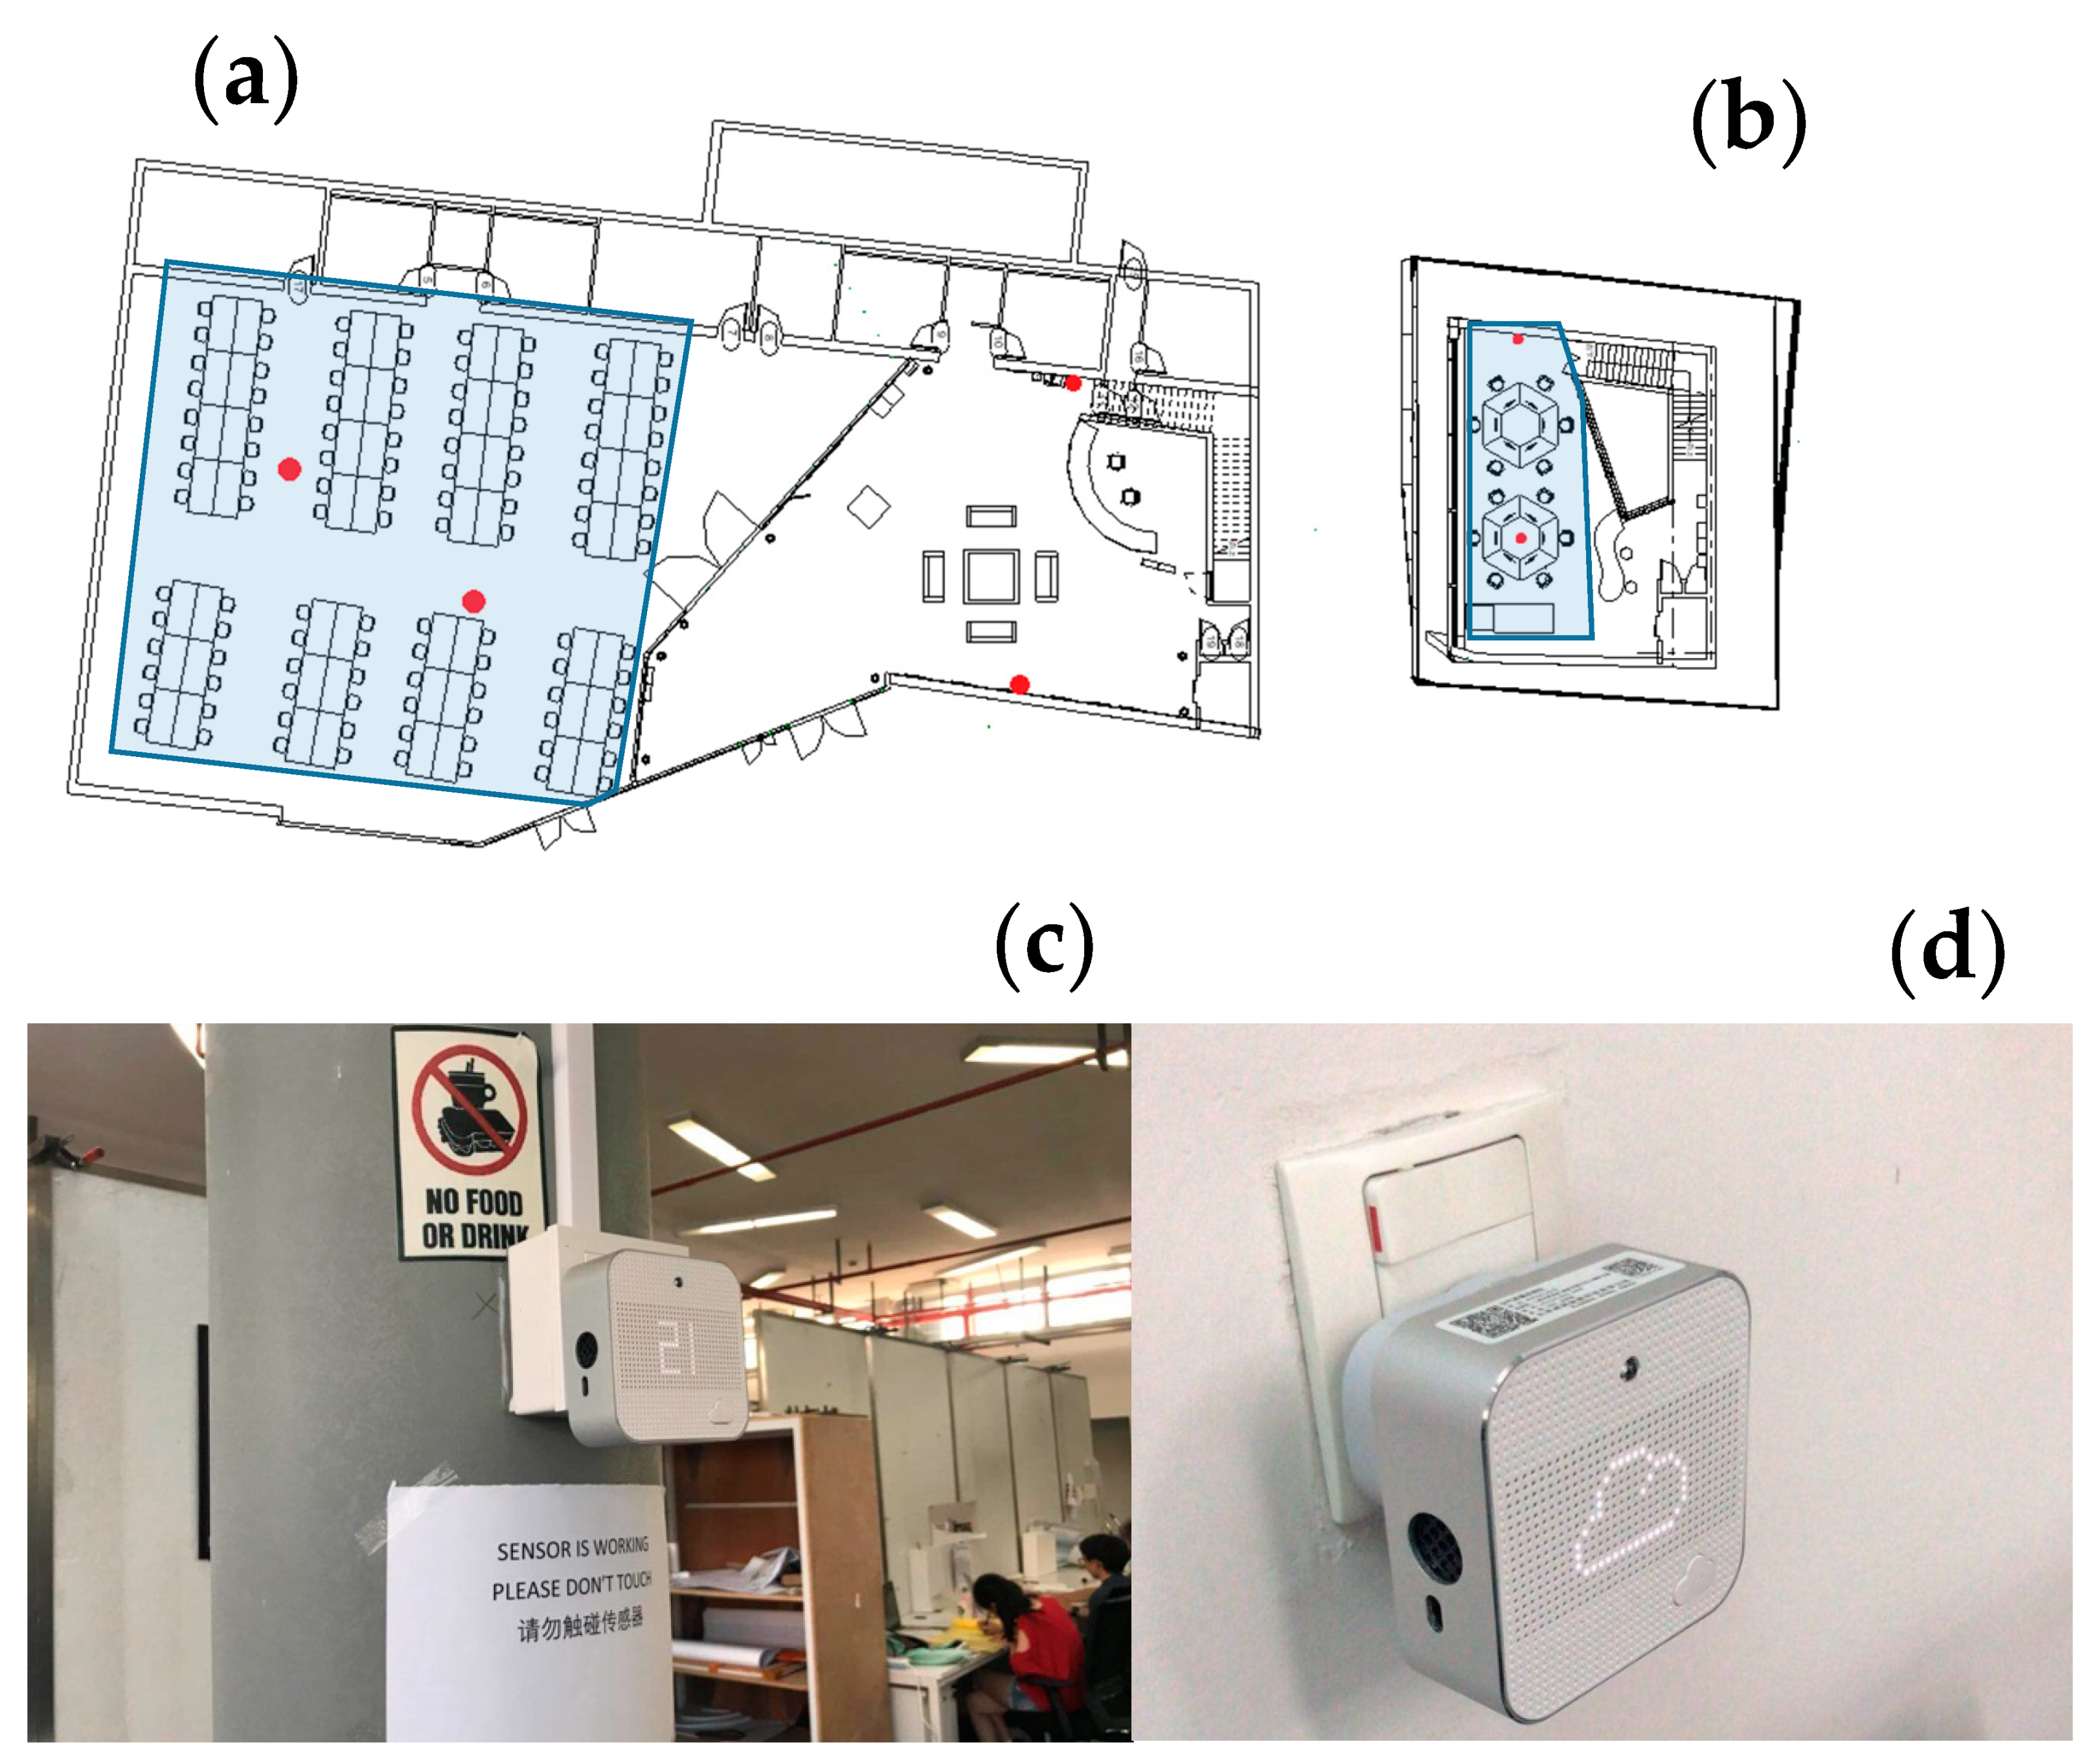
To measure the physical parameters of indoor spaces, real-time sensors were installed. Chinese manufactured AirRadio 2 sensors were chosen due to ease of use and installation and ability to measure temperature, humidity, sound levels, illuminance, CO2, and PM2.5. The sensor, presented in Figure 4, shows real-time measurement on its display, providing sensitive groups of users with immediate air quality levels check-ups, as well as sending the measurements to the system once every fifteen minutes. Table 2 presents the range, accuracy, and resolution of every sensor device in AirRadio 2.
Overall, six human comfort sensors were installed in the building: four in Zone 1 and two in Zone 2 (Figure 4). It was decided to have more sensors in the basement as its overall area is more than two times bigger than that of the computer laboratory. The main considerations during these data loggers’ installations were to place them at a height of 0.7–1.2 m above the floor, without exposure to the direct sunlight or heat source to ensure accurate measurement. One sensor was located in the middle of the room and the other on the side for greater covering range.
4. Results
Data from Survey and Analysis
The total number of building users participating in this questionnaire was 48. With the design occupancy rate in Zone 1 being 90 people and in Zone 2 being 18 people, the answering rate was 44%. The majority of respondents were between 20 and 28 years old. There were 47% of females and 53% of males. Seventy percent of respondents indicated that they usually worked in the Zone 1, 29% of respondents marked that they usually stayed in the Zone 2.
To evaluate the average opinion regarding IEQ parameters, the mean number for every option was calculated. For a better comparison between different target groups (based on gender and location), a separate calculation was done for males and females and Zones 1 and 2, as well as for the total number of answers. An independent-samples t-test with two-tailed distribution and two-sample equal variance was implemented via Excel spreadsheets to evaluate the statistical significance of differences between the target group responses. The results are presented in Table 3.
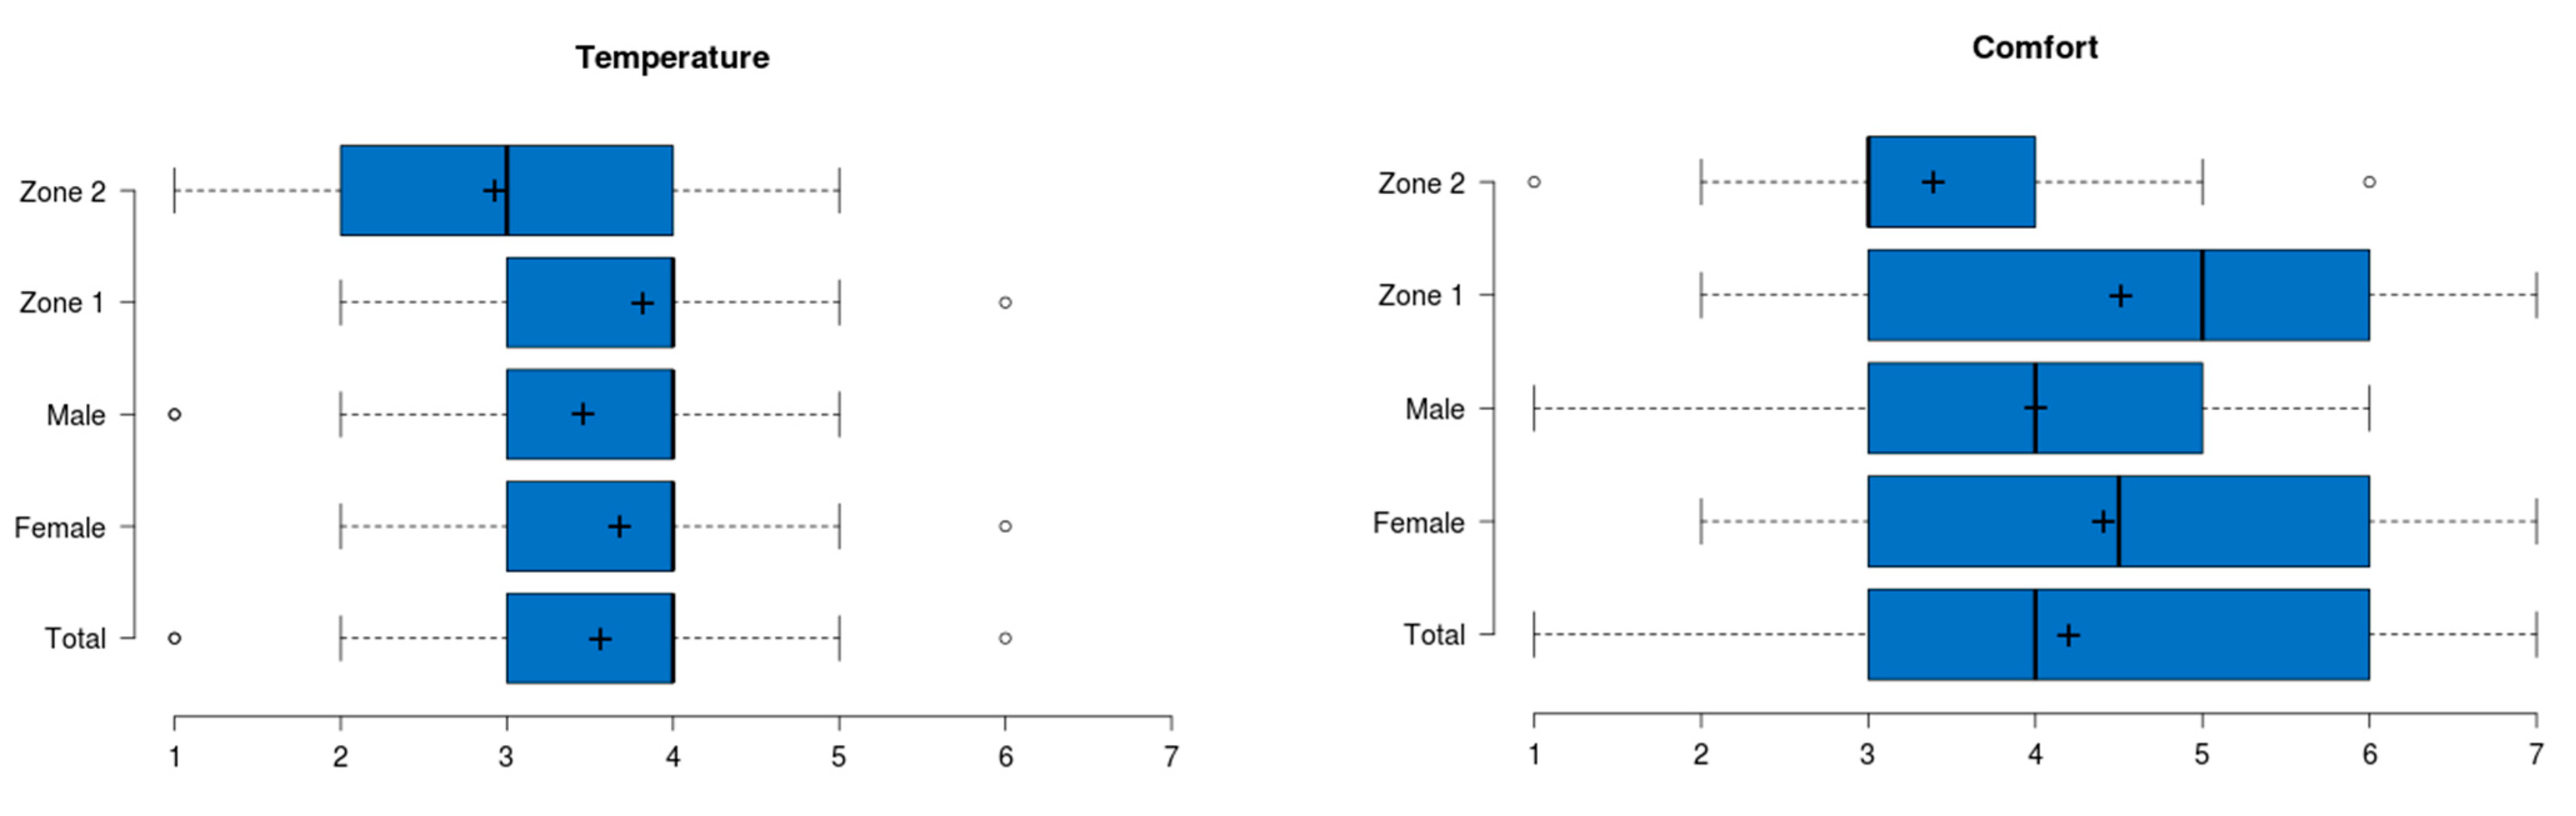
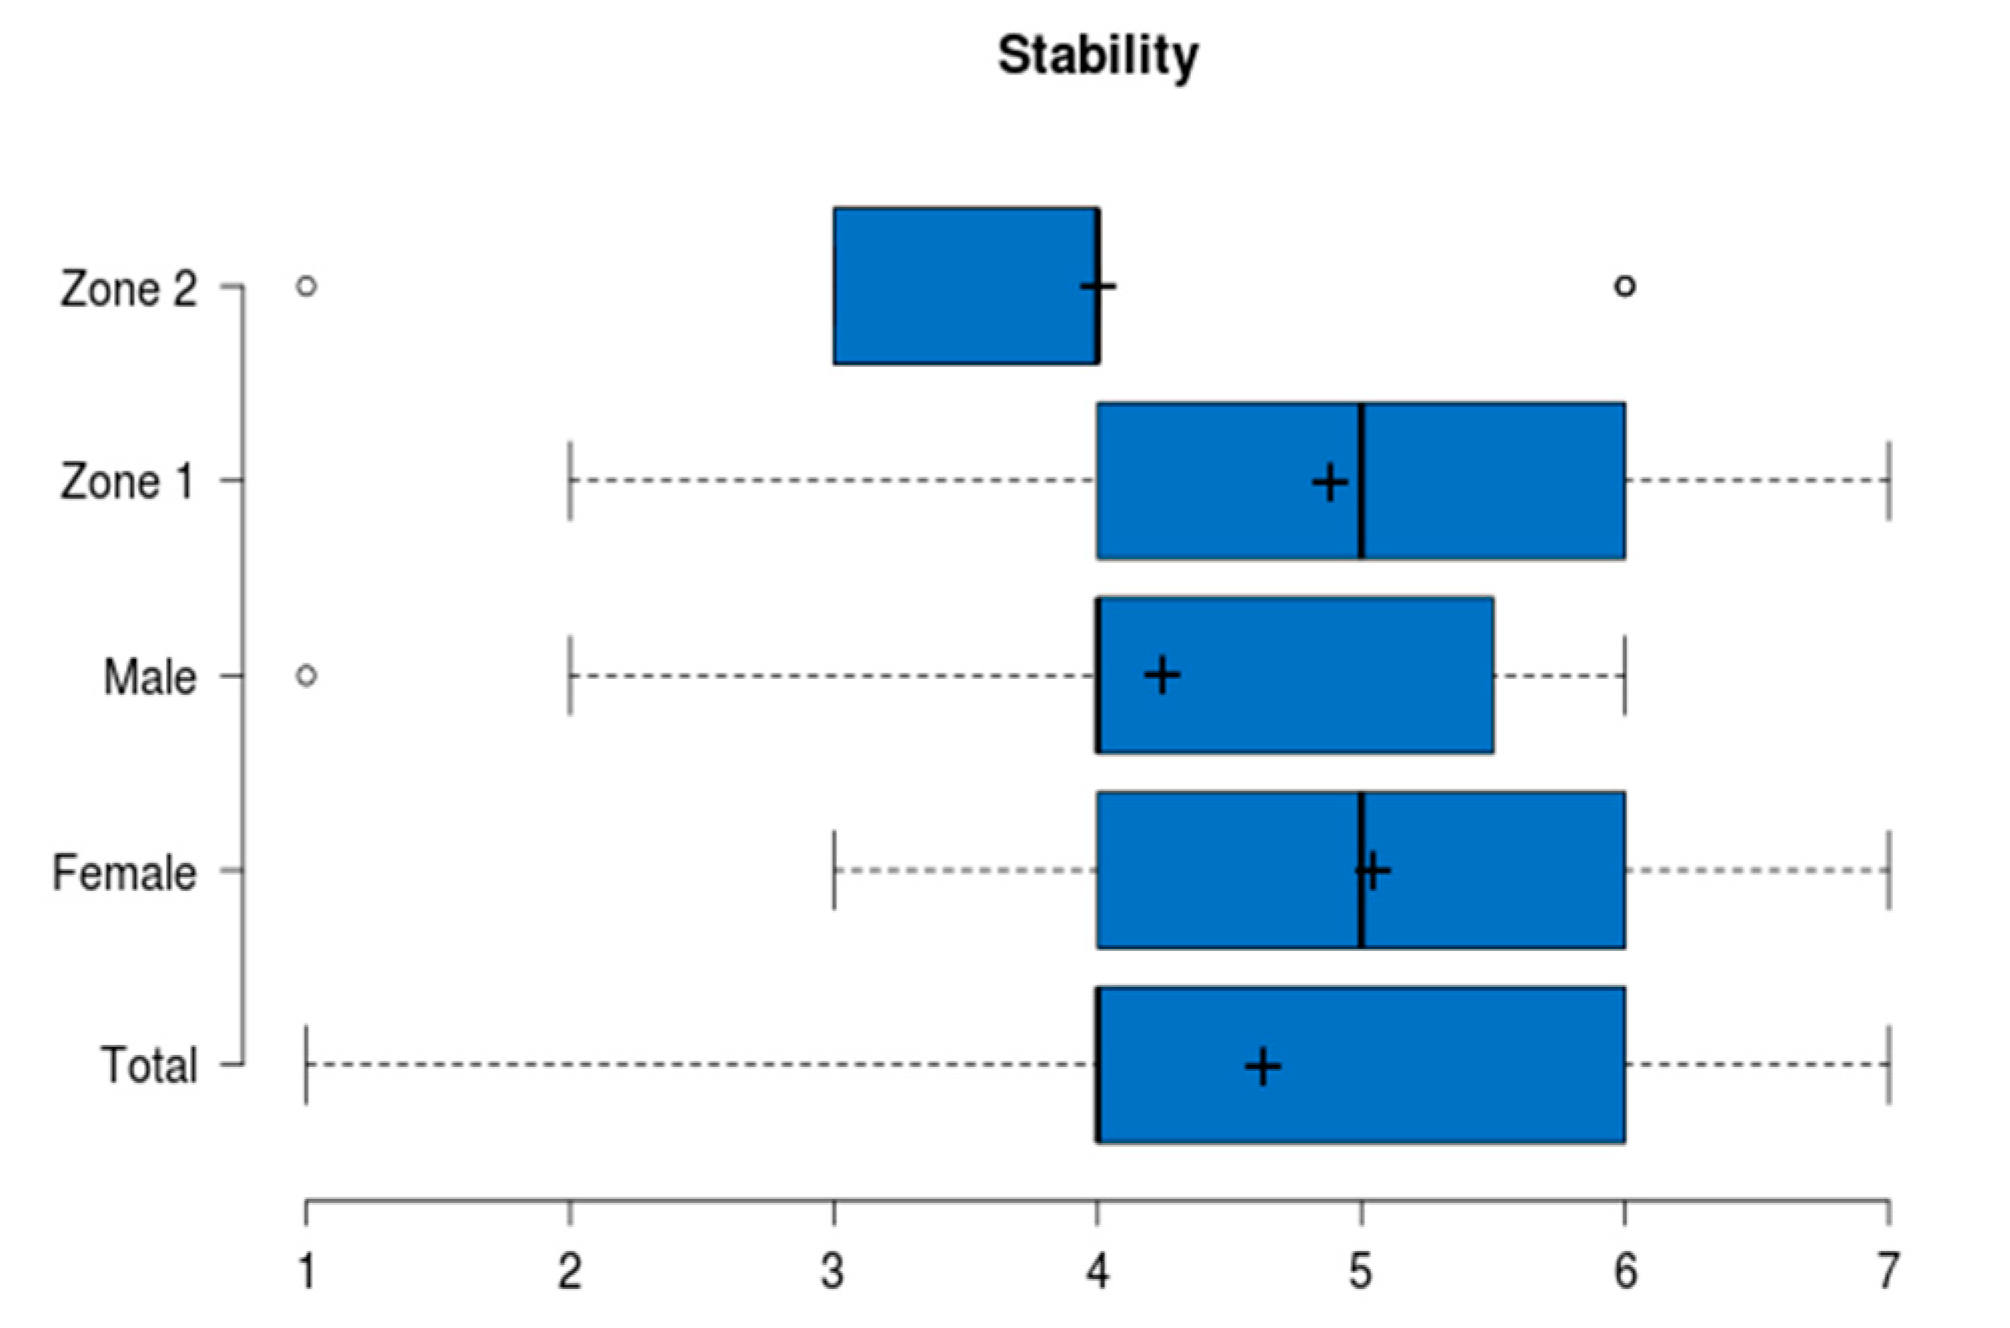
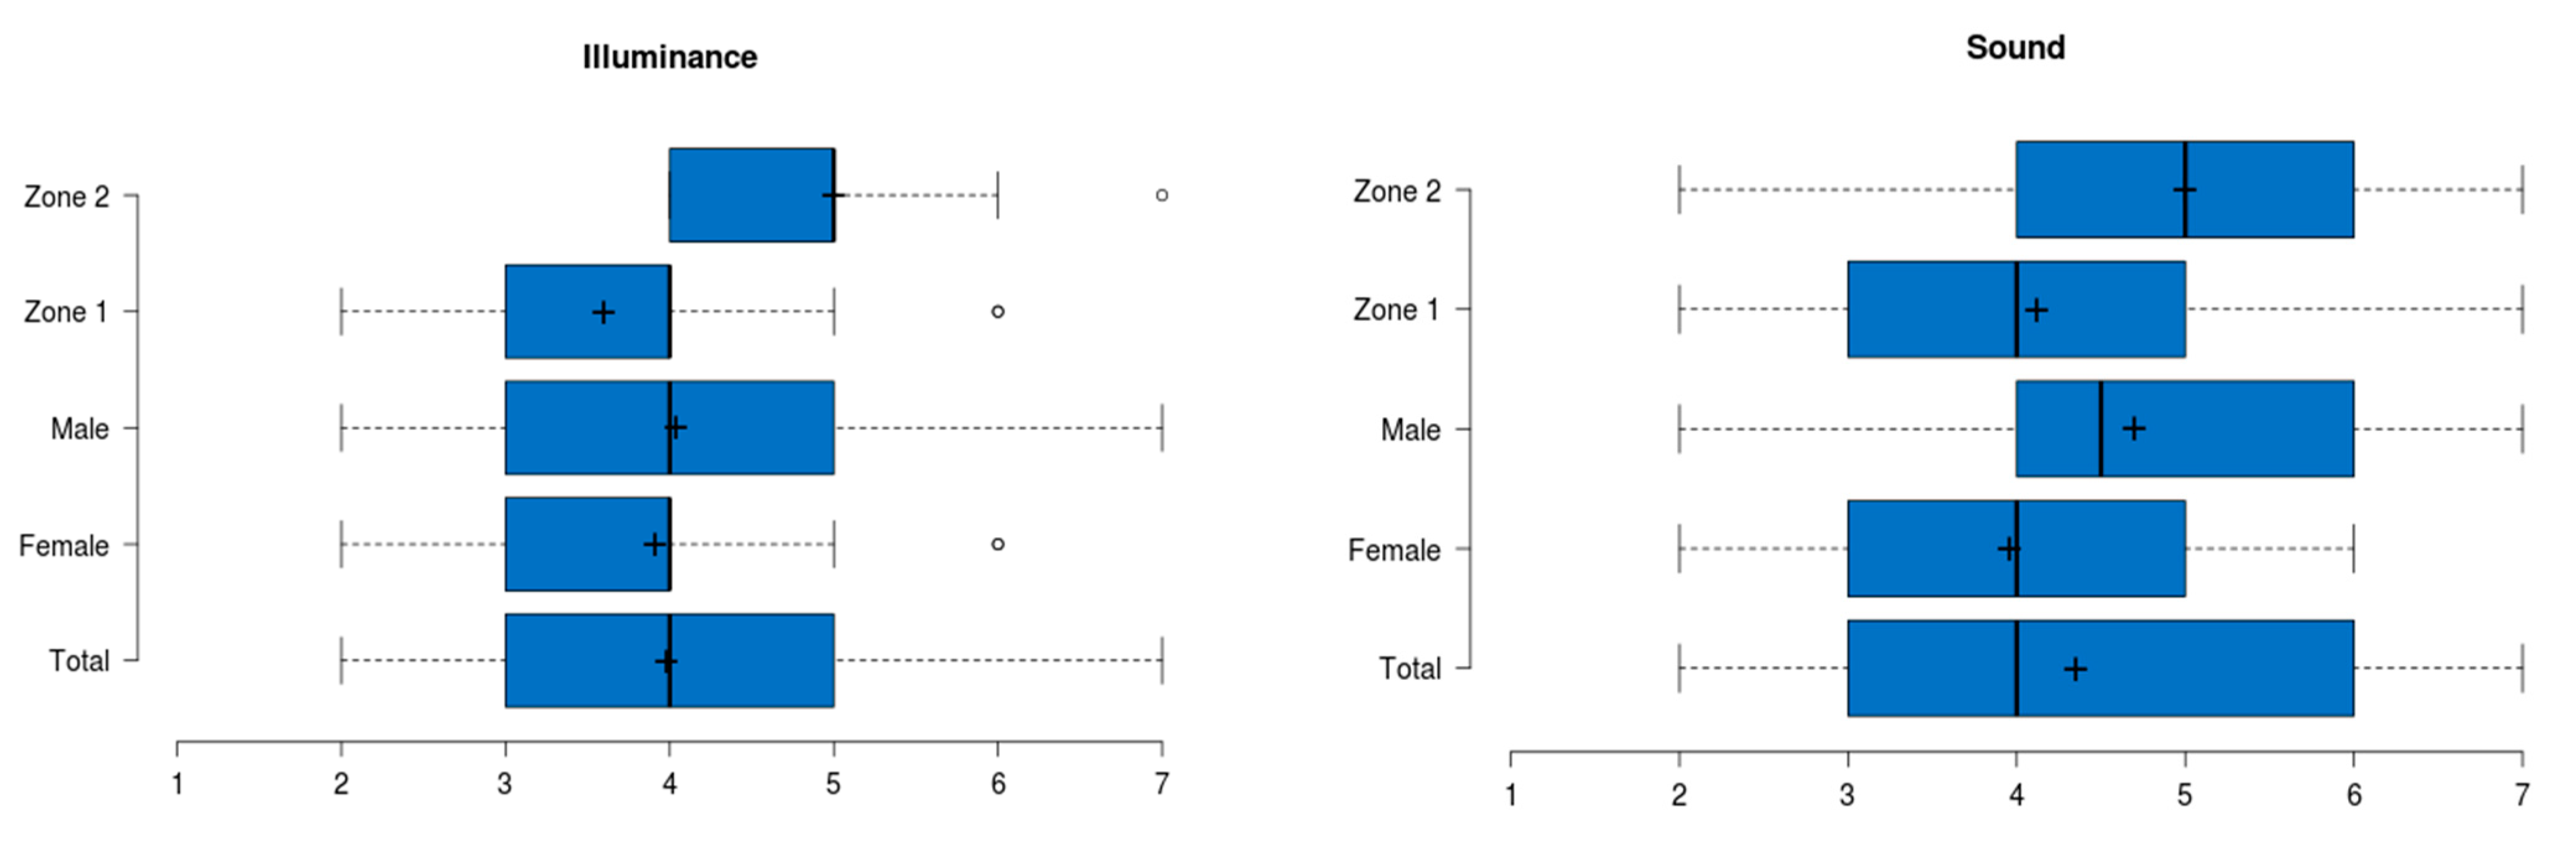
The average score for temperature in summer was 3.57 with 45% of users indicating being satisfied with temperature. The overall thermal environment in summer received a neutral rating with the score being 4.20. Illuminance and sound levels were evaluated to be normal—3.98 and 4.35, respectively (55% of participants giving positive marks of 4 and 5 for light, and 69% selecting 4, 5, and 6 for sound). Figure 5 and Figure 6 provide a better visual representation of the scoring.
Comparing female and male responses, no statistically significant difference between these target groups was found on any of the evaluated parameters. Both of the groups reported being slightly hot but within a comfortable extent, and both of the groups were on average satisfied with illuminance and acoustic environment.
Dividing the total amount of answers into location target groups (Zone 1 and Zone 2) revealed significantly greater satisfaction with thermal conditions in Zone 1. Thus, in that zone, 55% of occupants reported a satisfactory comfort mark, while in Zone 2, 69% of users stated the temperature was higher than the neutral level. However, light levels were perceived to be better in Zone 2: illuminance in Zone 2 was given a score of 5.00, while in Zone 1 it was 3.60, with the p-value being equal to 0.0002. The acoustic environment in Zone 2 was evaluated slightly higher as well, but these results had little statistical significance (p value equal to 0.0541).
Table 4 lists the sick building syndromes reported by the CSET users. The most common criterion is eye discomfort being experienced by 20.8% of occupants. It was almost equally reported by males (23.1%) and females (18.2%), but in Zone 1 it was reported to be experienced more often than in Zone 2. The second most widespread syndrome is headache, also mostly reported by the Zone 1 users (20% occupants in Zone 1 and 7.7% in Zone 2). Determining the percentage of participants experiencing at least one of the syndromes gives 42% for the Zone 1 and 17% for the Zone 2.
5. Data from Sensors and Analysis
The data from sensors were collected from the middle of May until the middle of September to evaluate if the indoor environment was comfortable and healthy for the occupants. One of the main targets was to determine if the building’s passive and active cooling systems are capable of maintaining adequate indoor temperatures during the hottest months of the year in the presence of occupants and electrical equipment (lighting, computers), both of which release considerable amounts of heat. It was also decided to perform all the analyses for the time period from 9 a.m. until 9 p.m., which covers typical class hours as well as after-class self-study hours, when, as the data show, the occupants were often present. All the measured data were compared to local Chinese standards that provide the benchmarks for the majority of parameters investigated in this study. It was decided to not implement the adaptive model benchmarking, since according to Fanger and Toftum [73], it is most suitable for non-air-conditioned buildings while CSET uses both passive and active technologies to maintain its indoor temperatures.
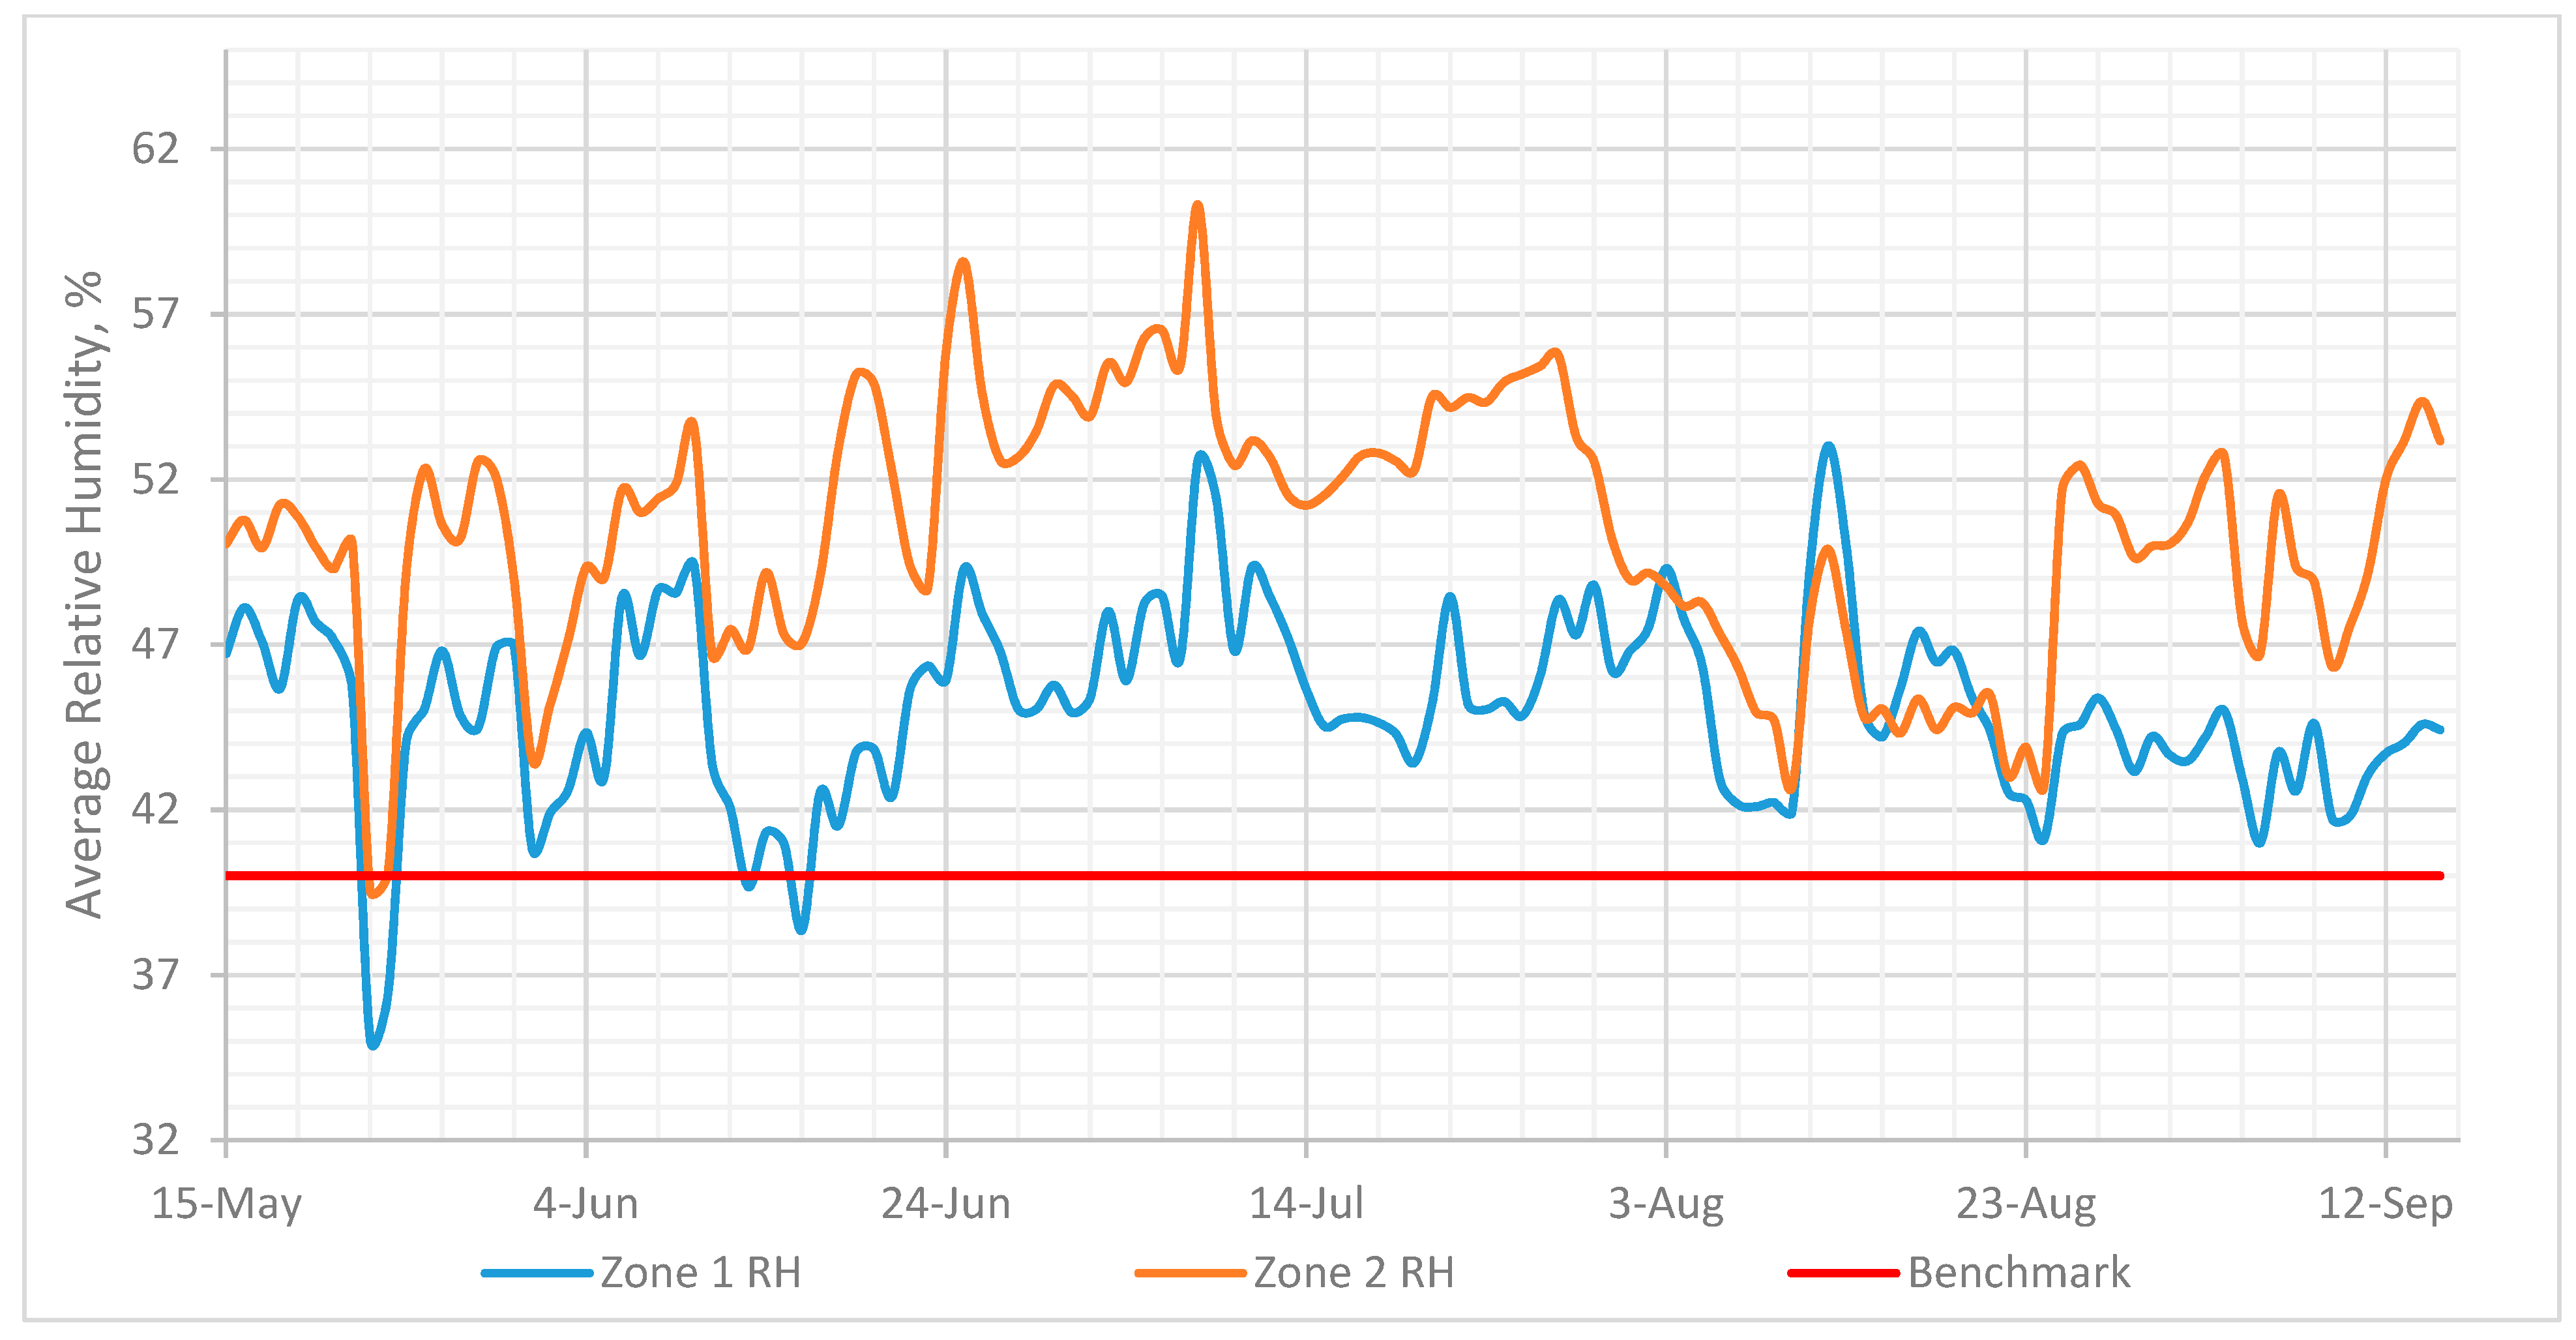
The air temperature profiles as well as the relative humidity data were analyzed using the daily average from several sensors in the same room (4 in Zone 1 and 2 in Zone 2). According to CIBSE guide A [40], “in well insulated rooms and away from direct radiation from the sun or from other high temperature radiant sources, the difference between air and the mean radiant temperatures (and hence between the air and operative temperatures) is small”. The on-site measurements, done by Dawe et al. [74] and Walikewitz et al. [75], also show that in the absence of a radiative heat source or sink (e.g., radiative heating or cooling system, windows facing south-east and south-west), the air temperature can be used as an estimation of radiant and consequently operative temperature as the difference is around 0.4–0.5 K. Based on that, it can be assumed that the operative temperatures in the CSET building are in proximity to the measured air temperatures. The results are summarized in Figure 7. The horizontal benchmark line represents the maximum summer indoor temperature limit established by the Chinese standard [41]. Starting from the beginning of summer the average temperatures in both zones met the requirements of the standard up until the 8th of July, when Zone 1’s temperatures gradually increased above 26 °C, followed by Zone 2’s ambient air temperature rising on 28 July. While in Zone 1 the indoor environment consistently stayed uncomfortably hot throughout the rest of the summer, average temperatures in the Zone 2 fell below the higher limit on the 25 of August and remained comfortable for the rest of the measurements. It can also be seen from the graph that Zone 1 mostly had higher temperatures than Zone 2, with the longest exception starting from 5 August and ending on 22 August. Additionally, the Zone 1 thermal environment maintained relatively stable temperatures, while in Zone 2, the graph has more peaks and spikes. The relative humidity levels presented in Figure 8 mostly stayed in the comfortable range specified by the design standards with the tendency to be closer to the lower limit. Overall, the environment was drier in Zone 2 with two days average RH dropping below specified 40%—23 May and 16 June.
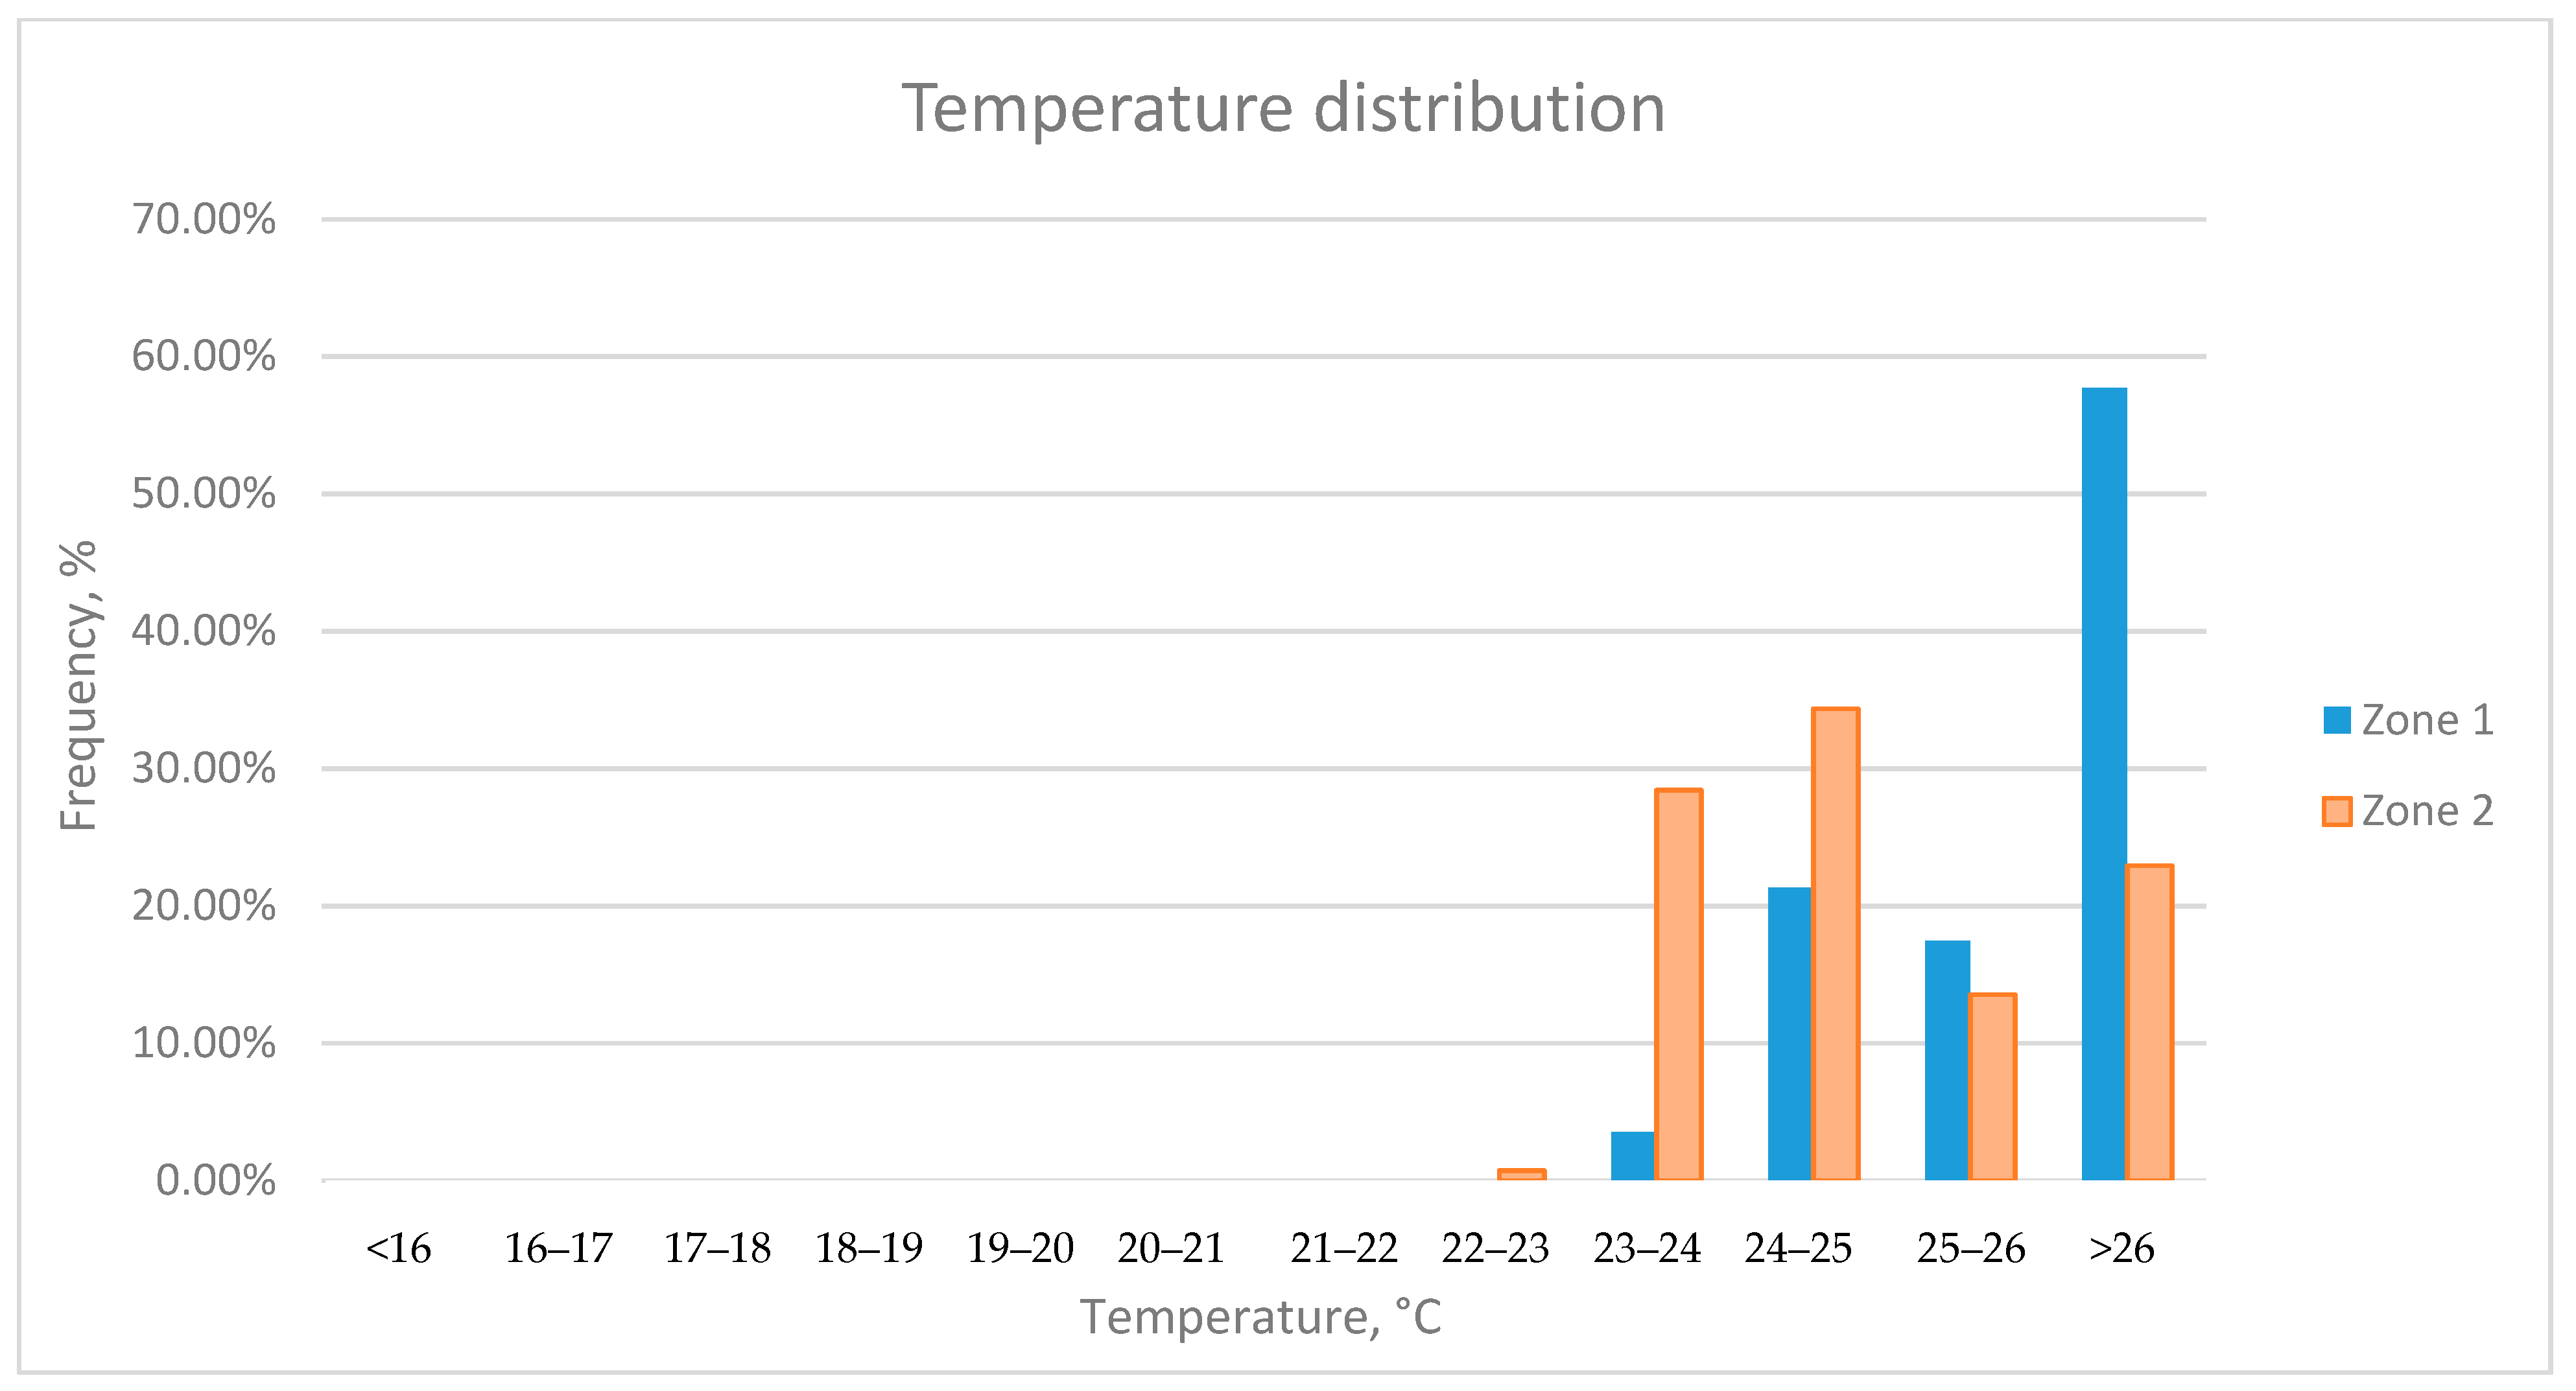
In addition to the average profile, a frequency analysis, shown in Figure 9, was done for the temperatures lower than 20 °C, higher than 26 °C, and every degree in between. On the graph, it can be seen that for each zone there are two high frequency temperature peaks: at 24–25 °C denoting night and above 26 °C indicating day temperature. In Zone 1, the temperature is above the limit of 26 °C for 57.7% of the time, while in Zone 2, the temperature is within the comfortable range of 23–25 °C during 62.8% of the summer period, indicating a more comfortable thermal environment.
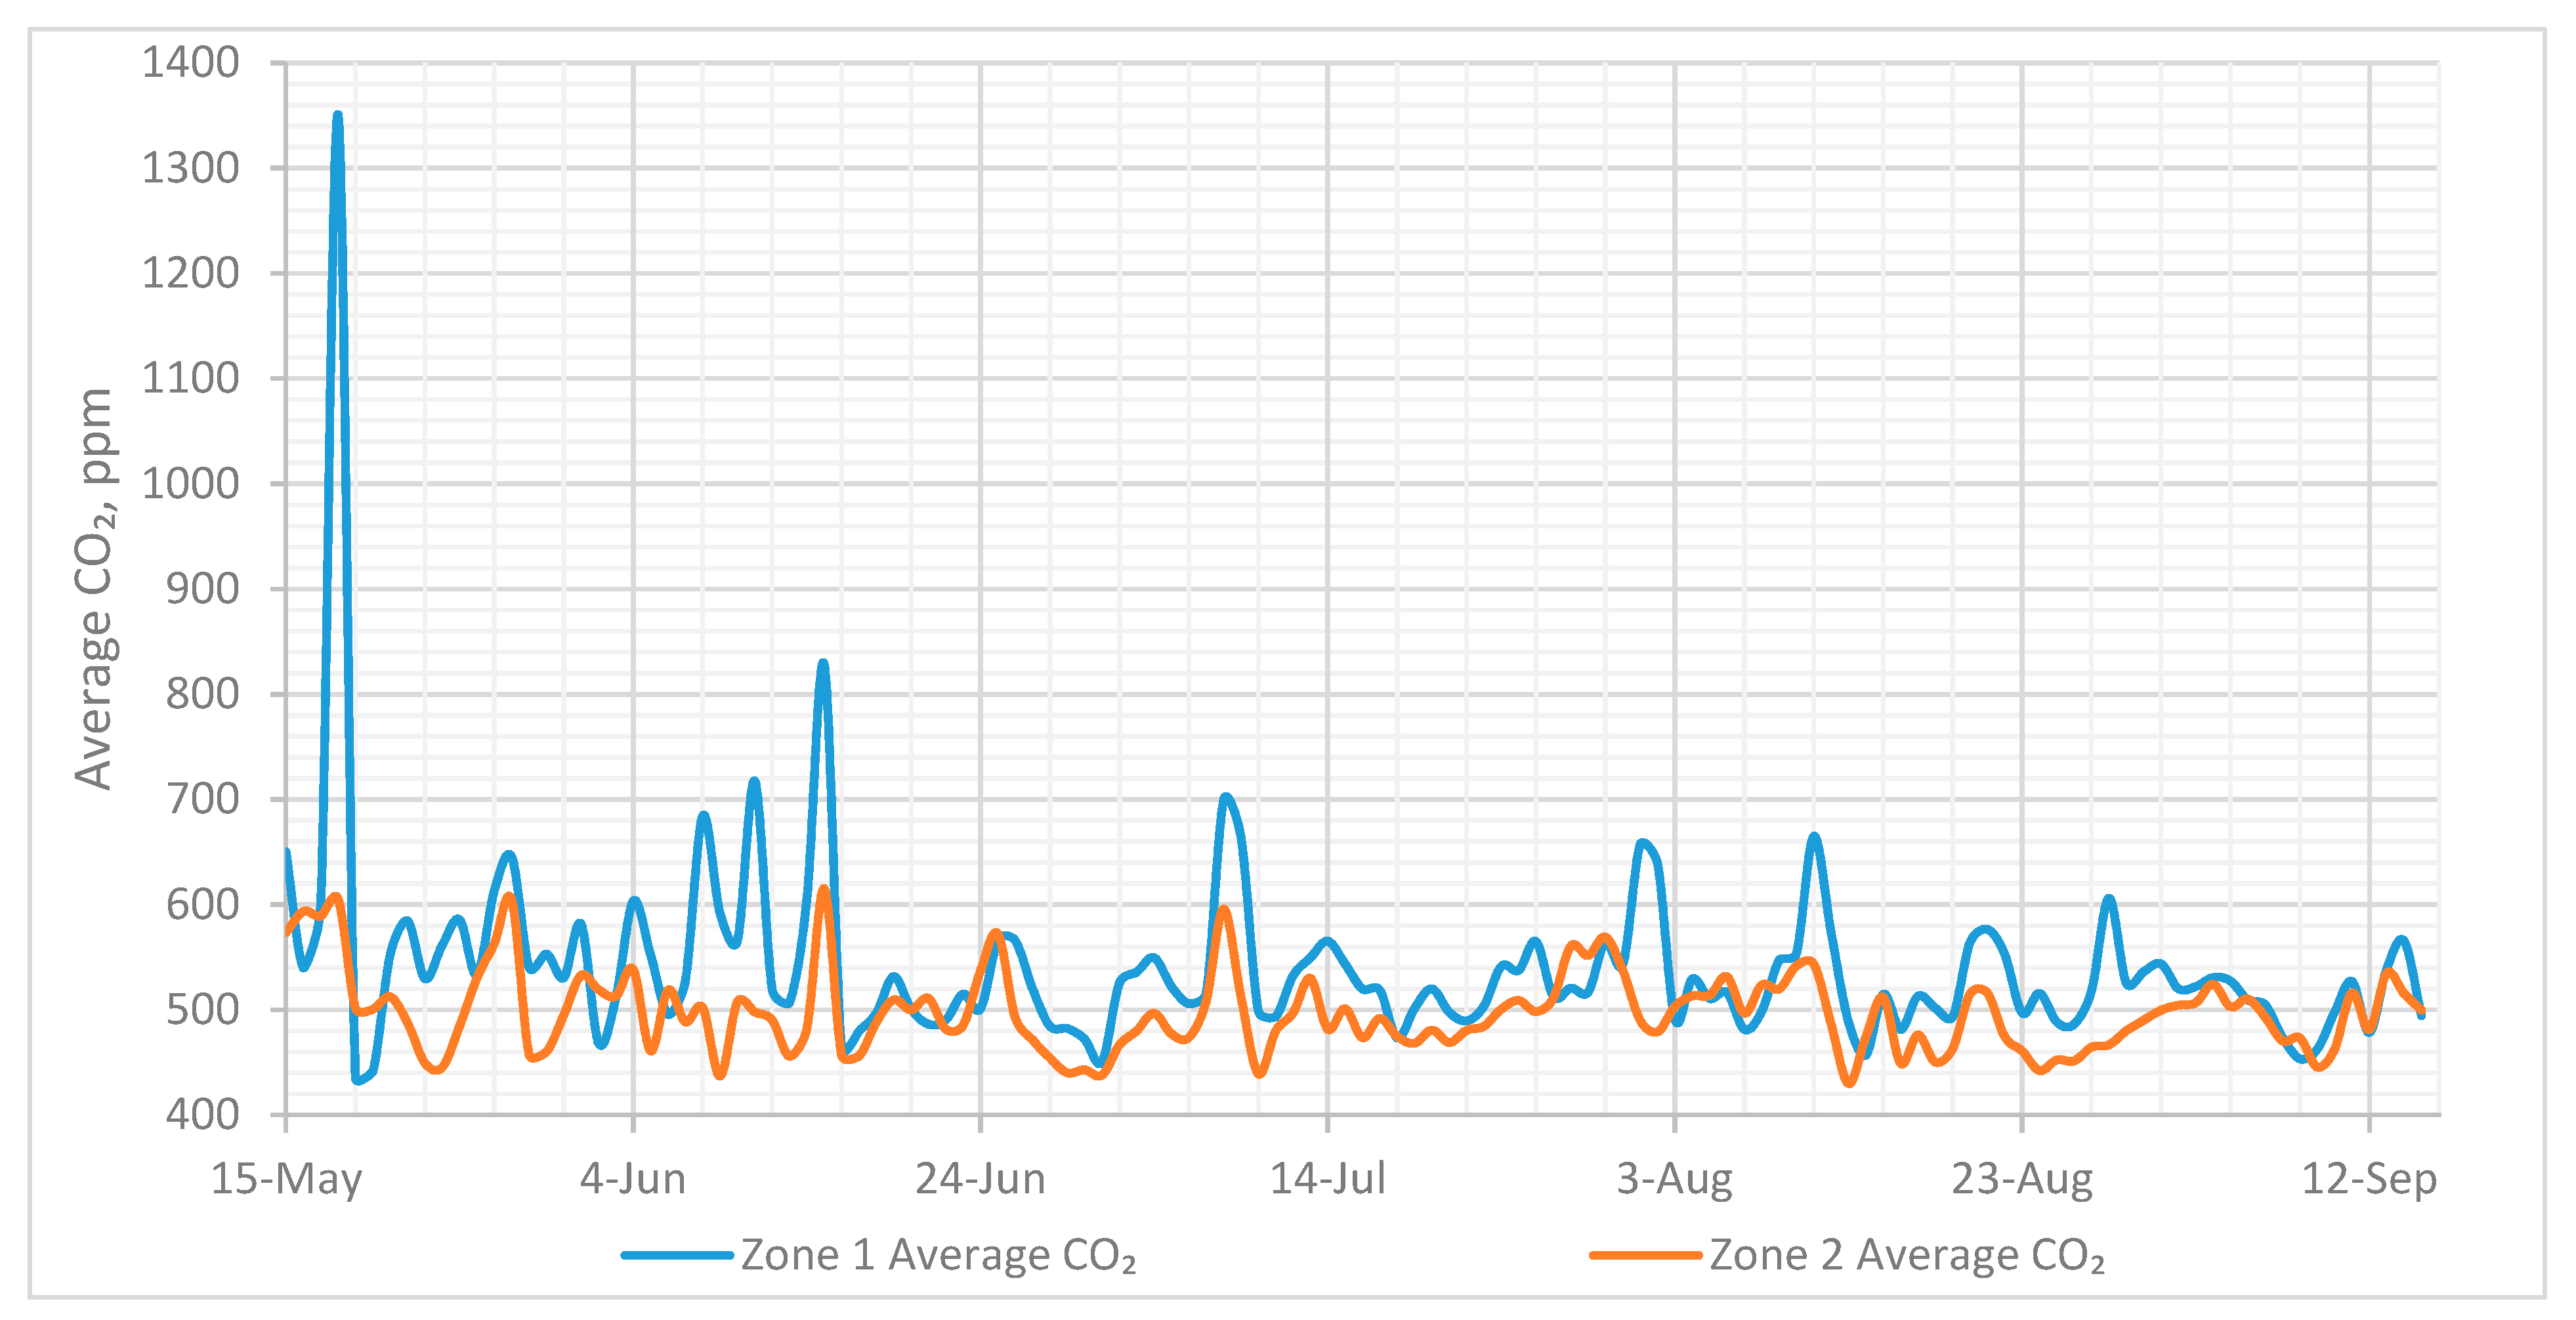
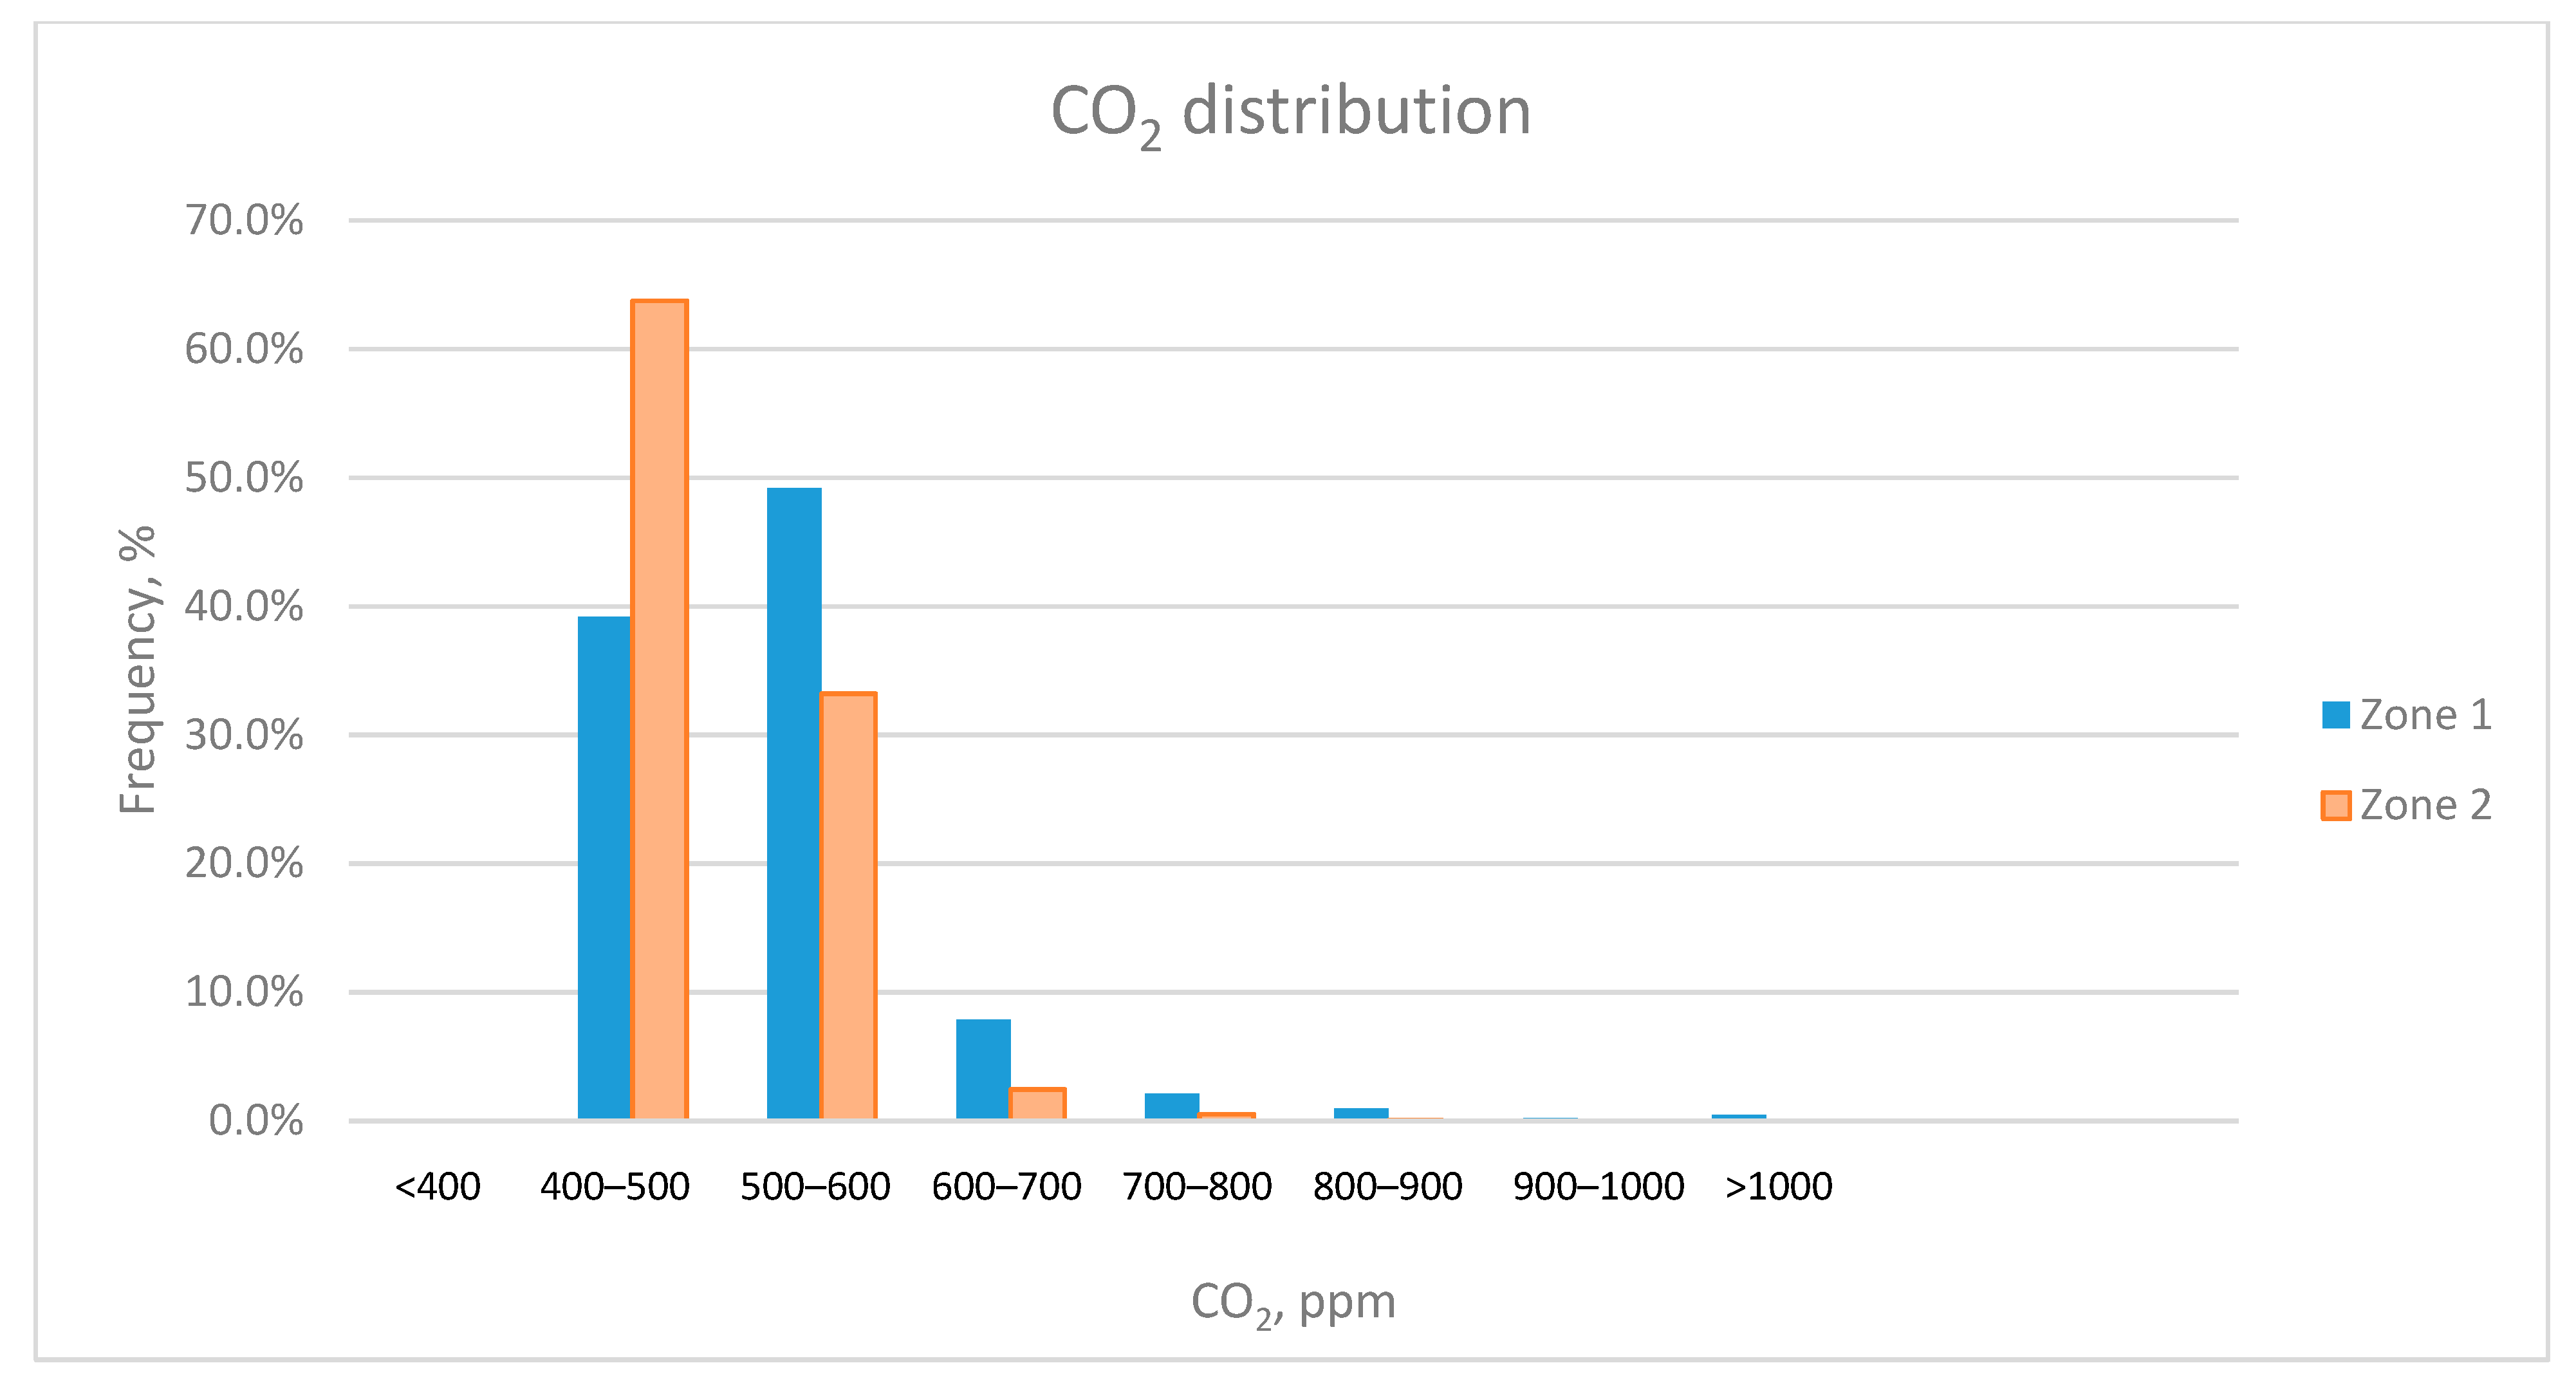
Similarly to the temperature analysis, the daily average (shown in Figure 10) and frequency distribution graph for CO2 gas concentration levels lower than 400 ppm, higher than 1000 ppm, and every 100 ppm in between (shown in Figure 11) were developed. From these graphs, it can be said that Zone 1 CO2 levels tended to be higher than in Zone 2, with the majority of daily average points being located within the range of 500–600 ppm, some surpassing 600 ppm and one, on the 18th of May, exceeding the half a day limit established by the standards—1000 ppm. This peak was theorized to be attributed to the open-door day when meetings with outside visitors were held. Based on the frequency distribution graph for Zone 2, the most common readings were in a range between 400 and 500 ppm.
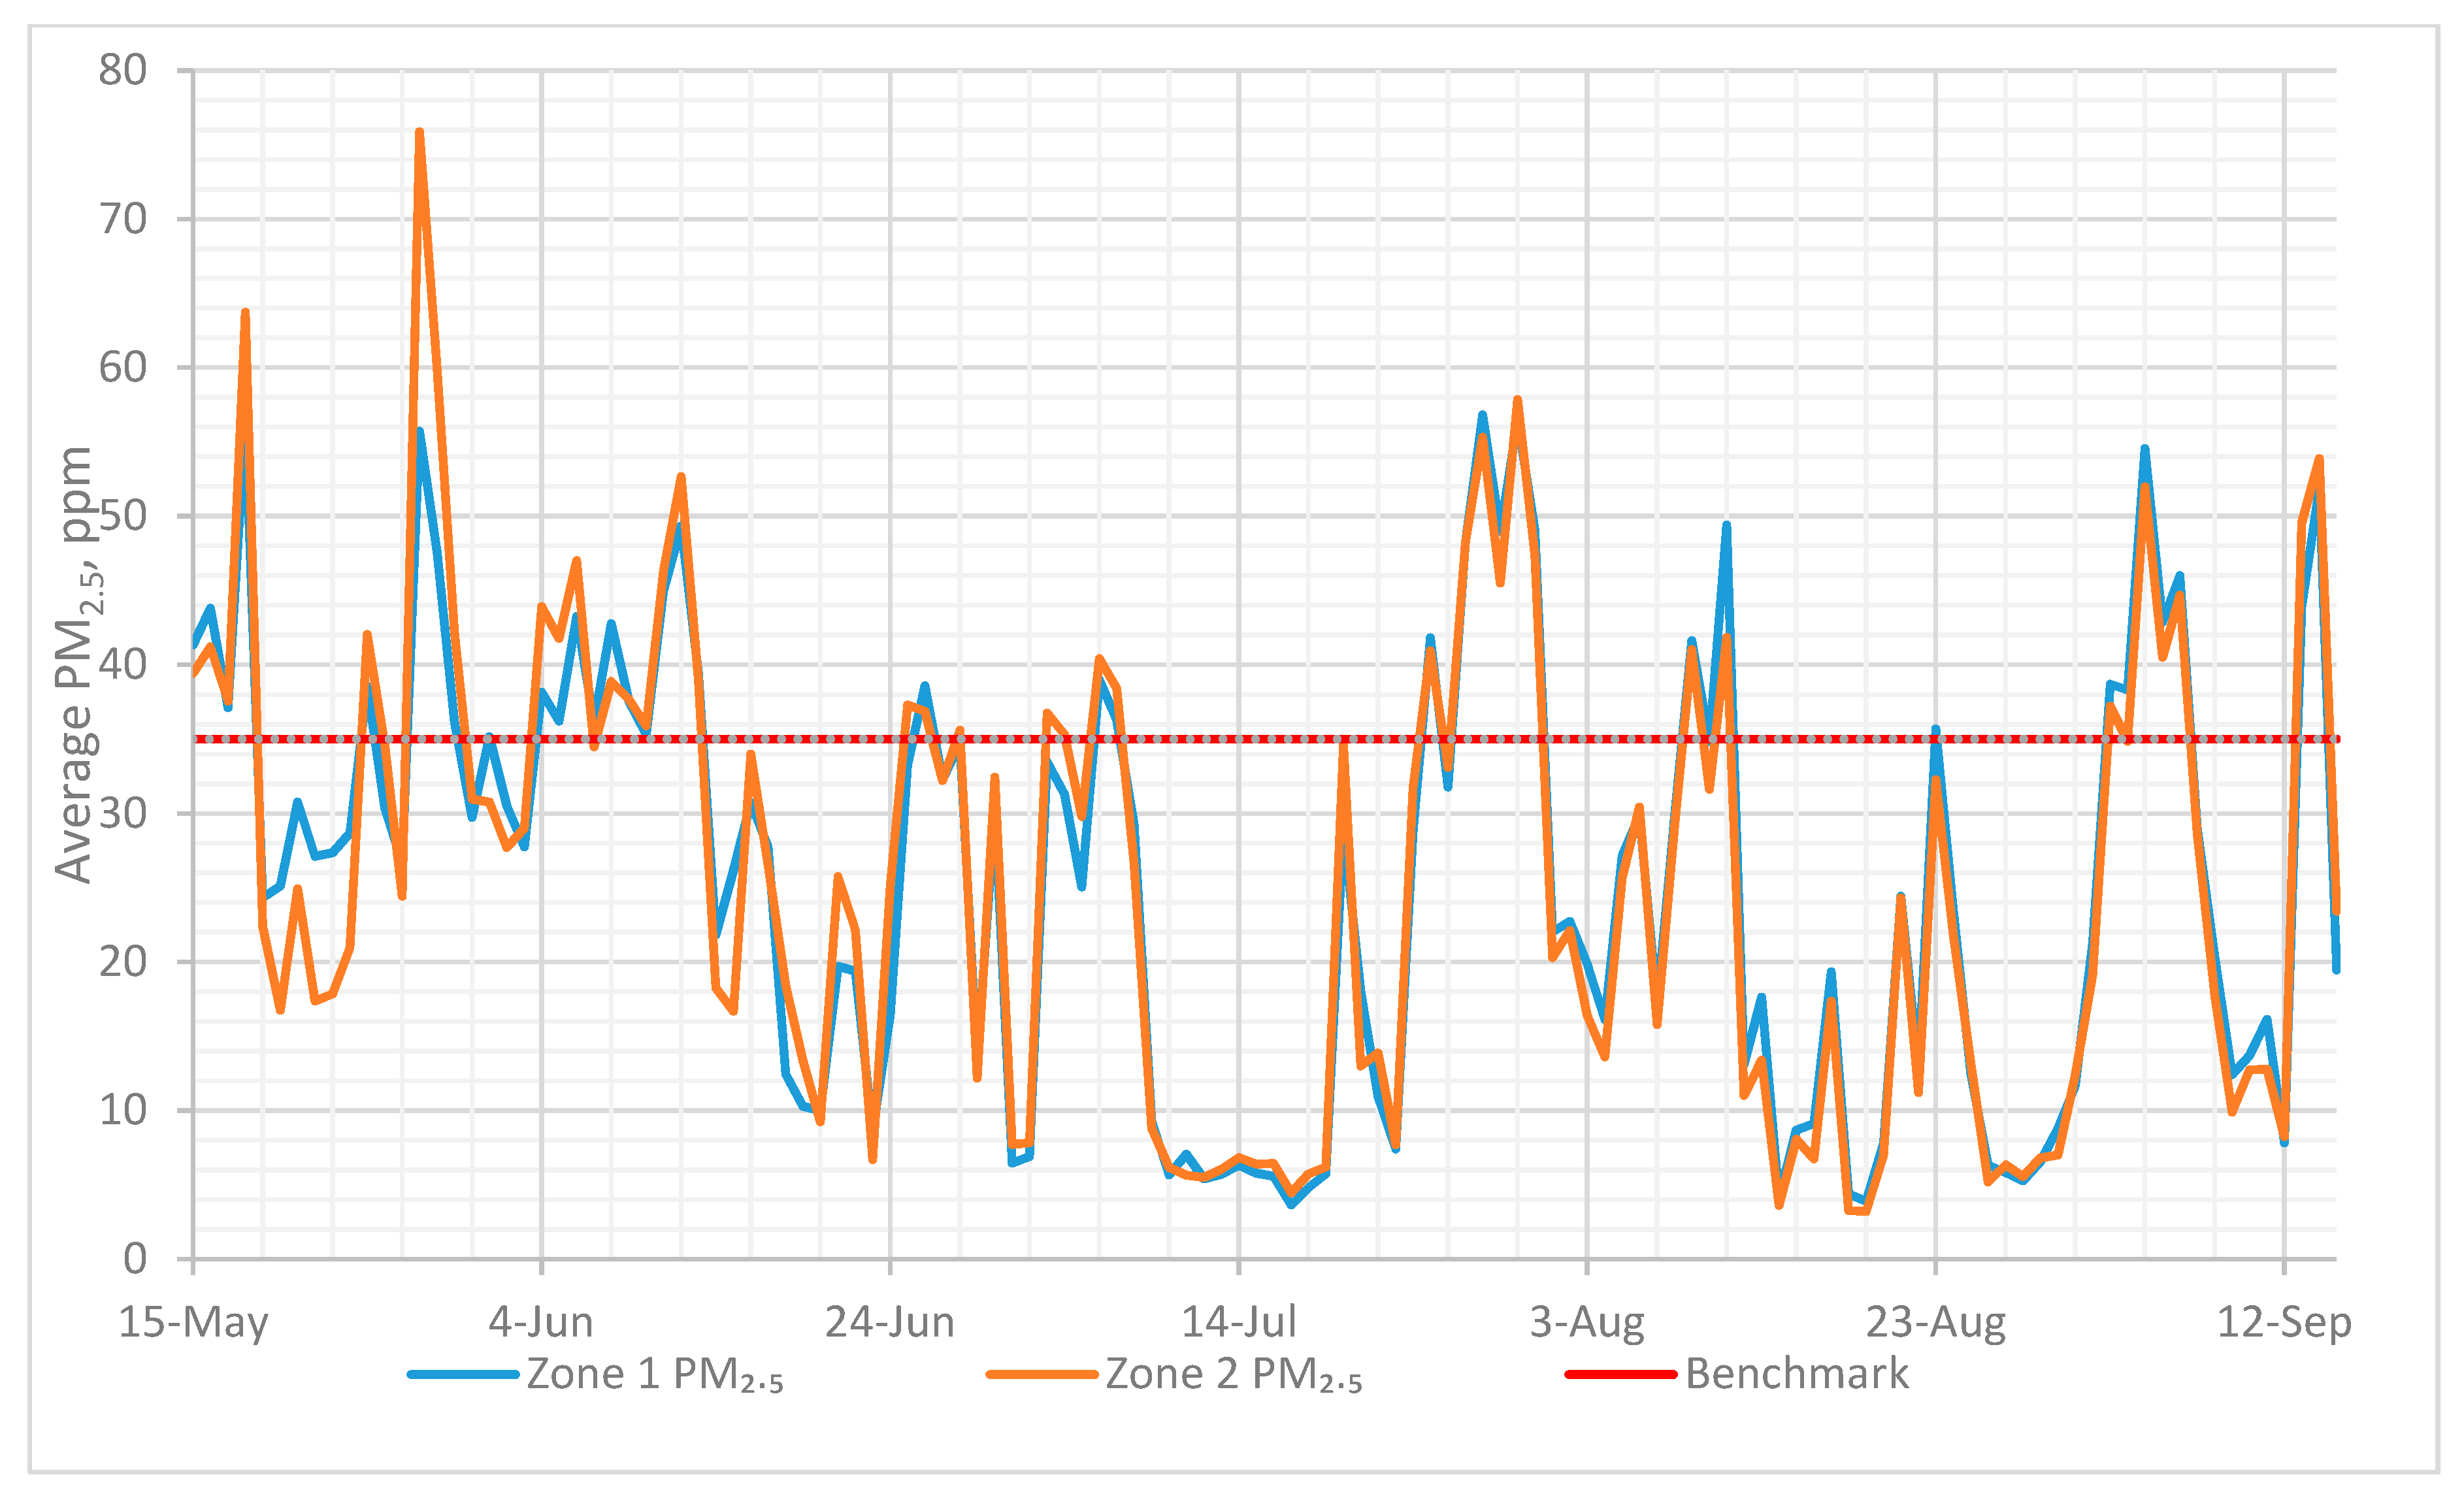
Figure 12 describes PM2.5 concentration levels averaged for a day in Zone 1 and Zone 2. Jantunen et al. [76] state that the main sources of fine PM indoors are outdoor air and indoor combustion of solid fuels for heating and cooking. The graph shows high homogeneity of the points for each location indicating that the levels of this specific contaminant are dependent on the outdoor air. The Chinese standard for indoor air quality [56] does not specify any limits for PM2.5, therefore the ambient air standard [77] was used to evaluate the indoor PM2.5 levels. Overall, PM2.5 concentrations usually were slightly higher in Zone 2 than in Zone 1, with the majority of measured points being below the established limit of 35 ppm. However, on some days, PM2.5 levels went above 50 ppm. Comparing Figure 10 and Figure 12, it can be seen that the highest peak values for CO2 and PM2.5 were in different days, which can be explained by different sources of these contaminants. Considering the currently used fresh air supply system in CSET, the indoor air quality (judging only by these two contaminants) can only be as good as the outdoor air is. Thus, in order to improve the current and future indoor air quality, air filters are suggested to be installed.
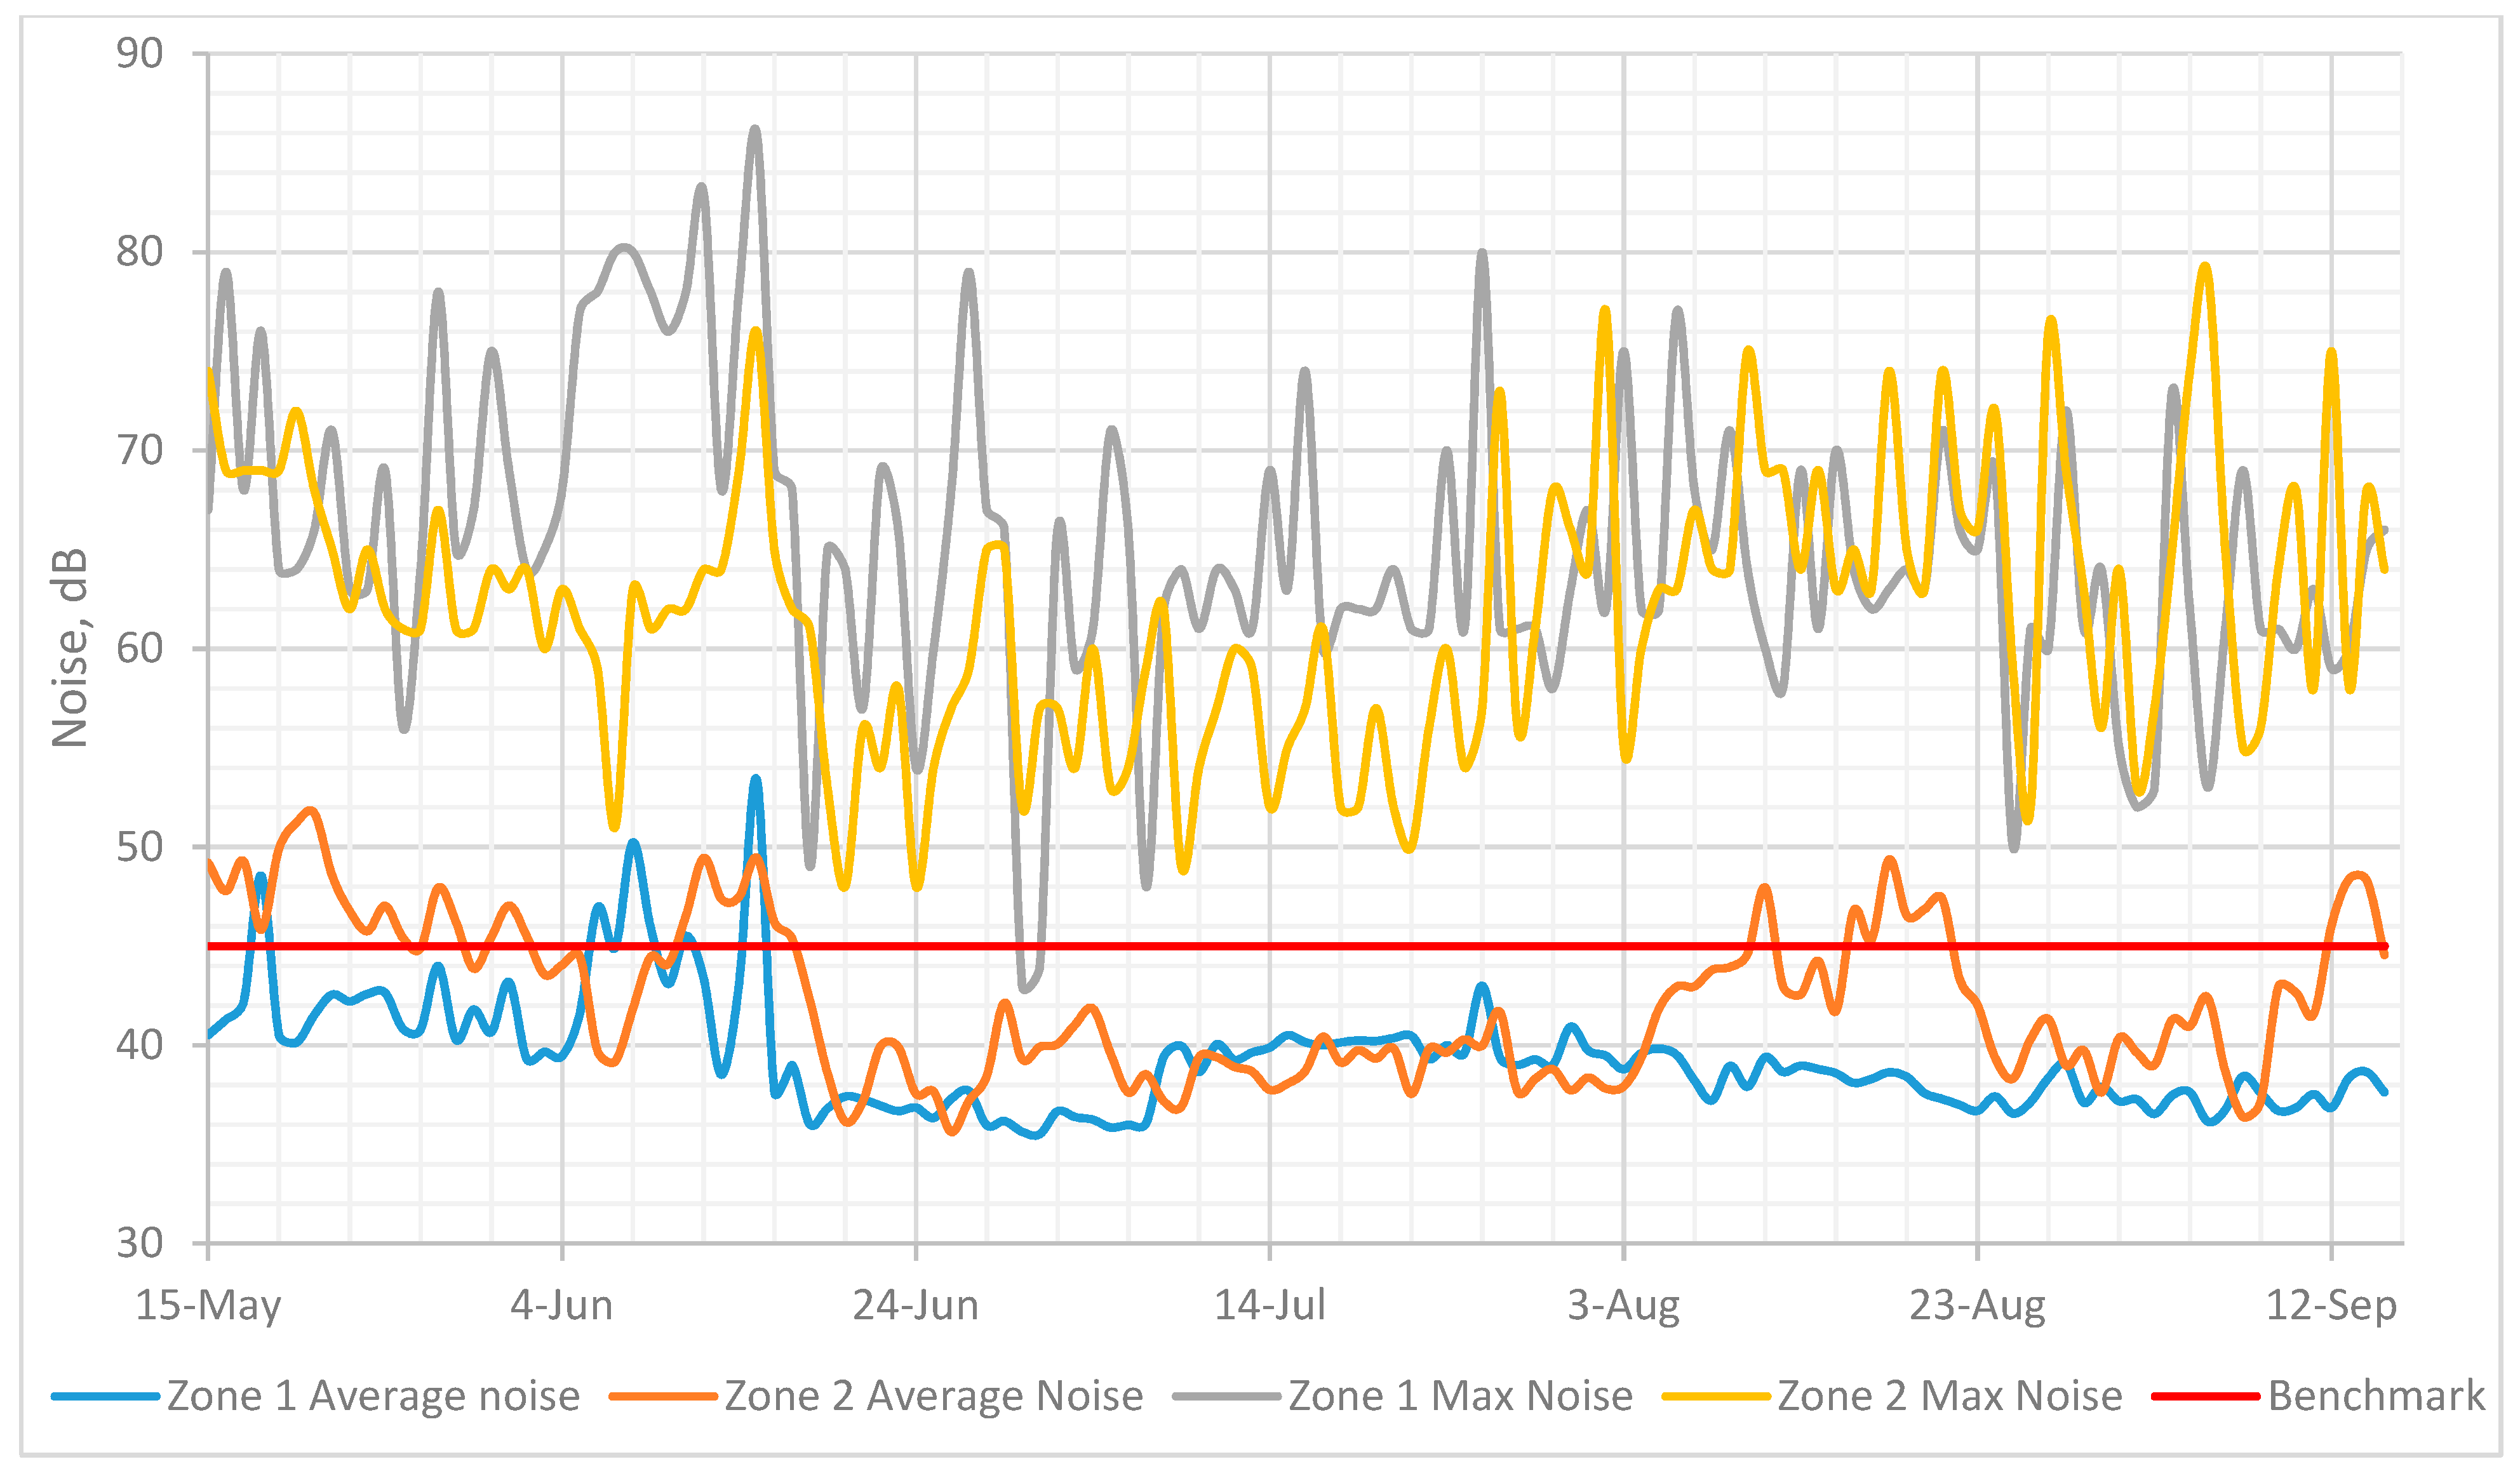
For the indoor noise levels, the Chinese code for design of sound insulation of civil buildings specifies that the allowed sound level in a common teaching room and a computer room should be equal to or less than 45 dB (the benchmark in Figure 13). Overall, the daily average noise levels in Zones 1 and 2, presented in Figure 12, varied between 35 and 52 dB, with Zone 1 sound levels being considerably lower than in Zone 2 for around half of the data. The sound environment in Zone 1 met the requirements outlined in the Chinese code [55] almost throughout the measurement periods. Zone 2 noise levels exceeded the 45 dB limit in May, for 5 days in the middle of June, occasionally in August, and starting from the 13th of September. As for the maximum sound levels, they greatly surpassed the established limit with the majority of the Zone 2 points being below the Zone 1 ones. While these maximum noise level points were affected by occasional events such as a rapidly closed door or a ringing phone, they do not represent the typical sound environment in the building. However, it is important to notice that the maximum peaks for Zone 1 are different than those of Zone 2, which means that the noises in one room did not affect the indoor environment of the other.
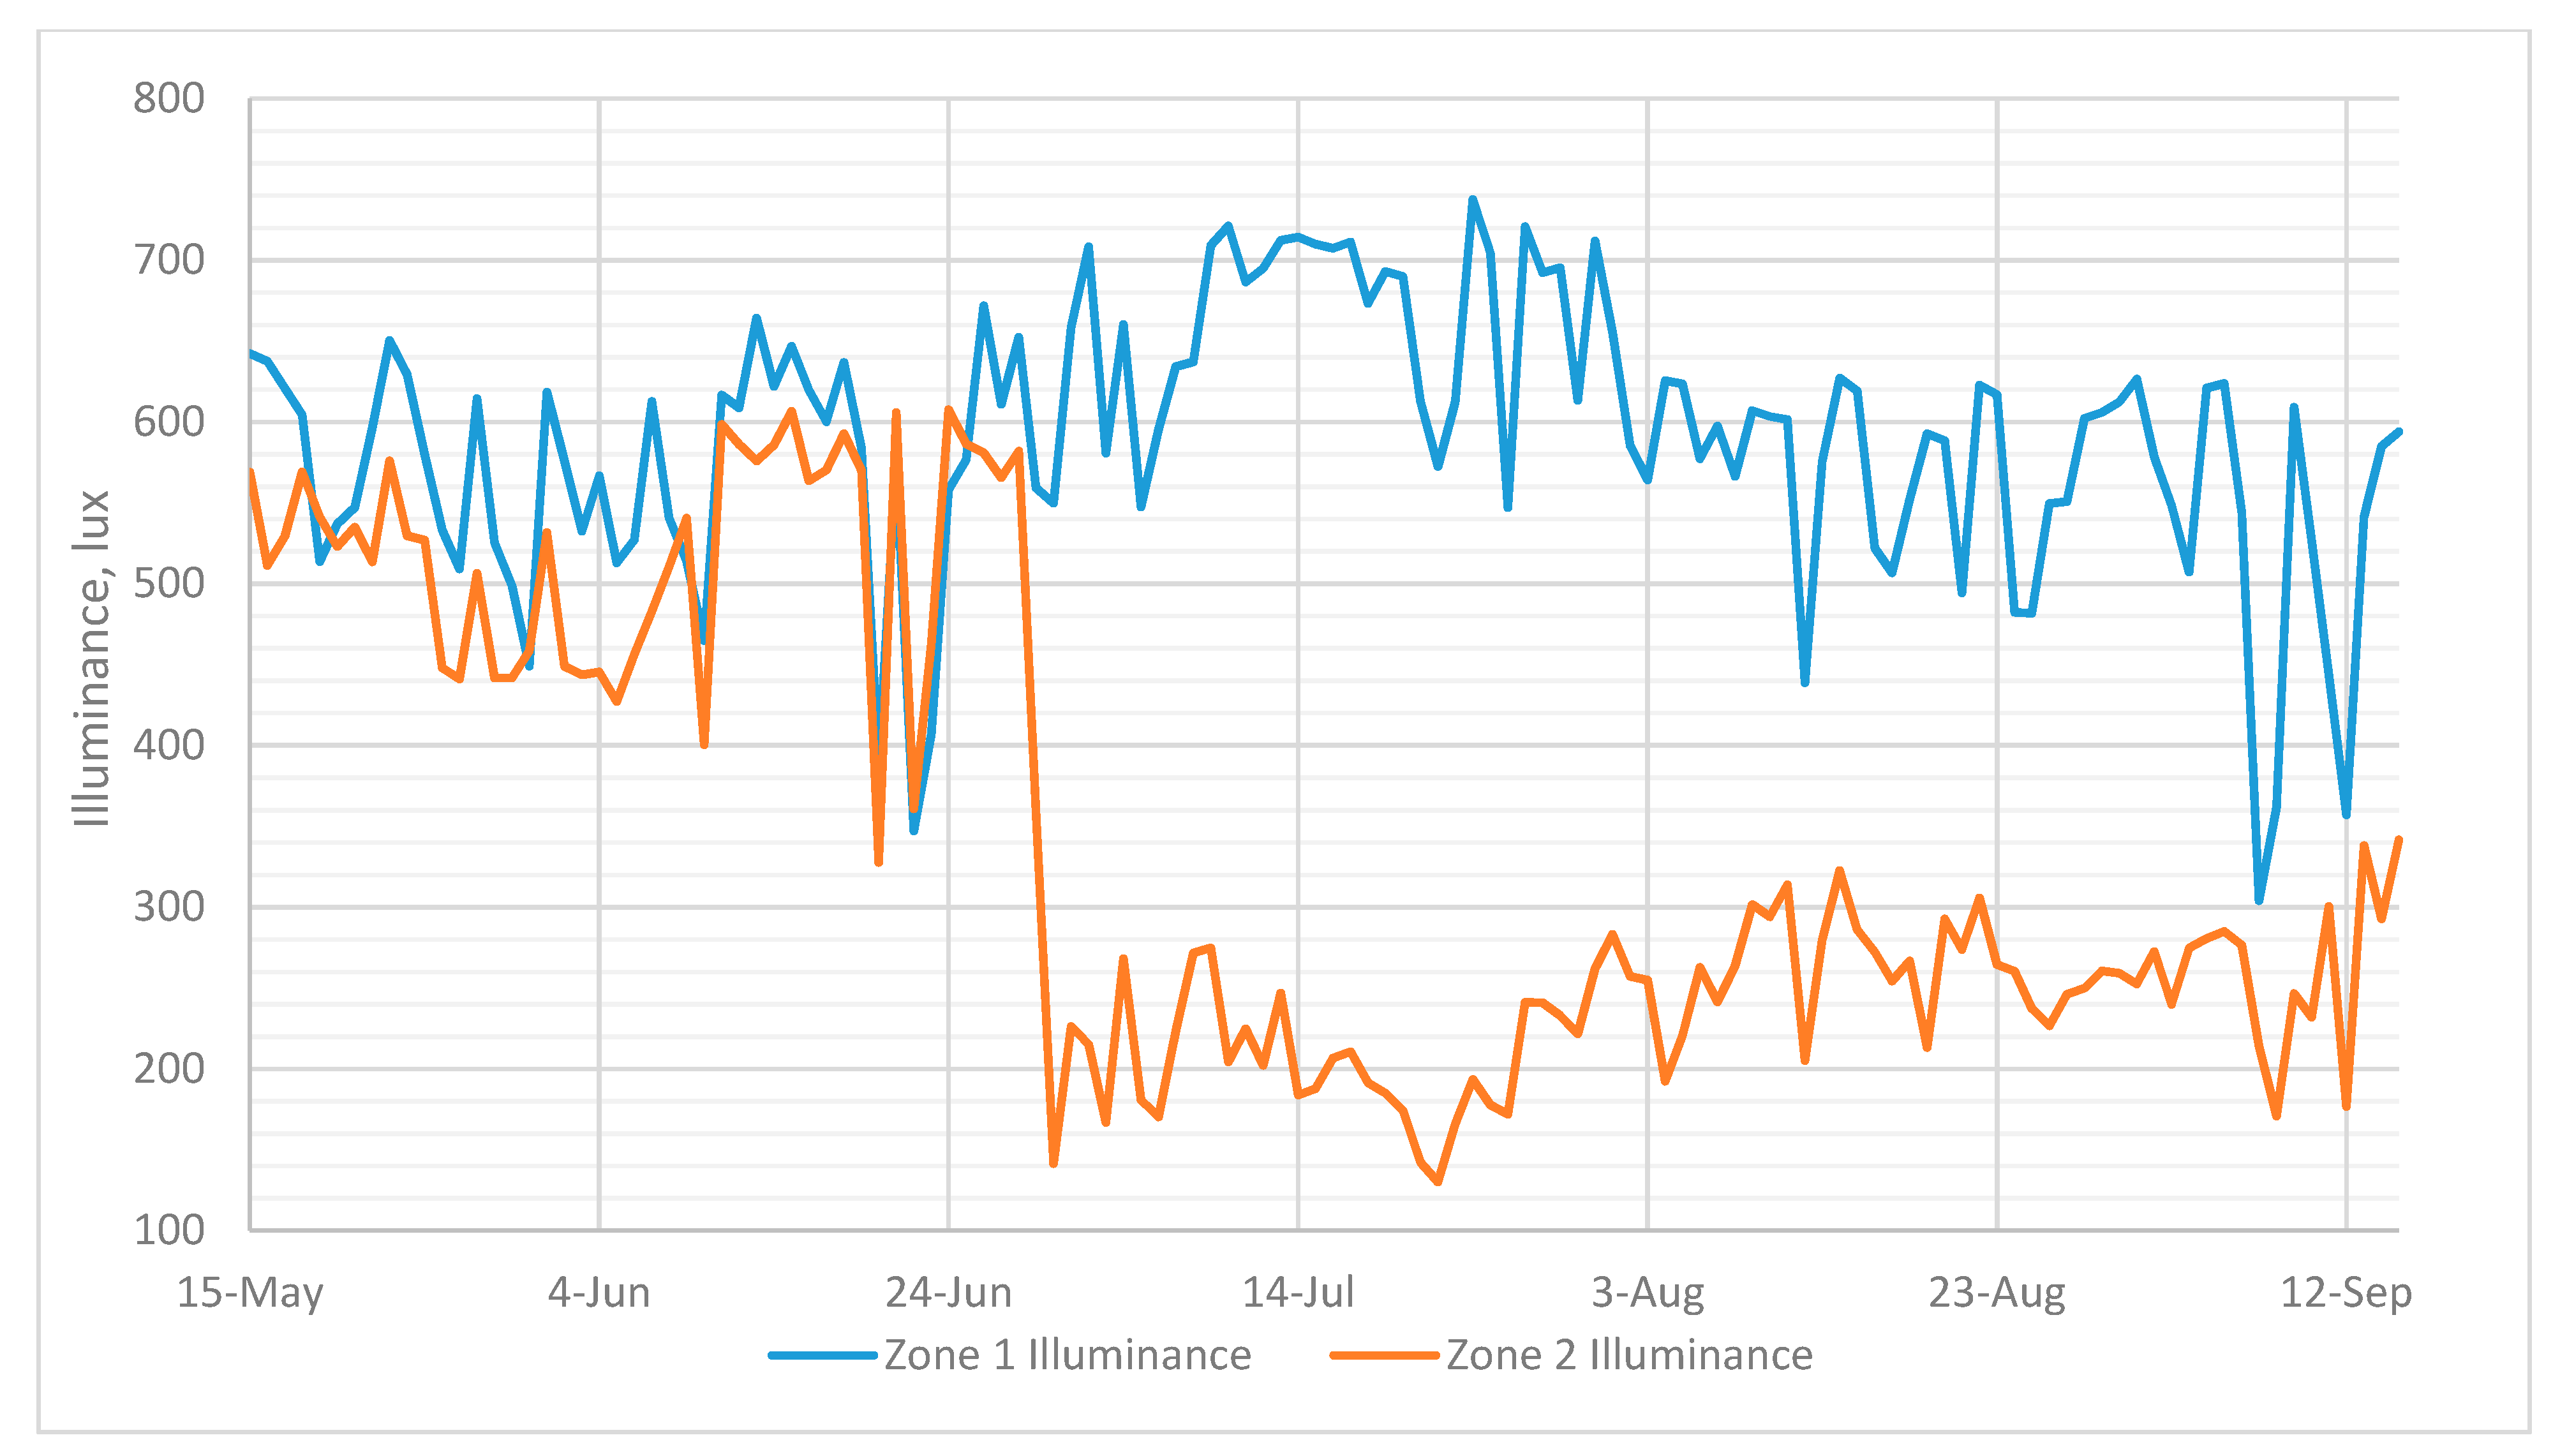
In order to analyze the illuminance levels in the building, an average for the teaching hours from 9 a.m. until 9 p.m. was taken for each day. This method allows to evaluate the natural light penetration into the building and artificial lighting levels in hours close to and after sunset. All the data below 250 lux after 5pm were excluded from the analysis to prevent the measurements during hours when the building was unoccupied and lights were turned off from influencing the results. As it is shown in Figure 14, the illumination levels near the sensors located in Zone 1 were well above 500 lux—the drawing room standard limit for almost all summer days indicating very high incoming natural lighting. In Zone 2, however, the sensors consistently detected lower illuminance levels with a sharp drop on the 29th of June followed by illuminance levels being in a range of 100–300 lux until the 13th of September. This drop was theorized to be caused by the occupants’ choice to close the curtains in order to prevent the direct sunlight and glare in the zone.
6. Discussion
The analysis of data gathered in this research reveals moderate occupant satisfaction with the CSET building in its summer thermal environment and temperature stability. Although the majority of questionnaire participants gave positive marks on the building’s general comfort, the calculated mean number shows that respondents feel slightly hot in the summer. These findings are similar to those observed in Gou et al. [28]. The fact that while feeling slightly hot during summer the building users reported relatively high overall satisfaction can be attributed to the “forgiving” phenomenon in green buildings discussed by Gou et al. [29]. The results from the sensors revealed temperatures slightly above the established limit during half of the summer season, supporting the participants’ questionnaire answers.
The gender differences in IEQ satisfaction were found to be statistically insignificant in this research. Some options (illuminance and acoustics) received slightly higher marks from males while others (hot/cold, overall temperature, and stability) were rated marginally higher by females. This goes against previous research [18,63,65,66] which reported women expressing higher dissatisfaction with the thermal environment than men under the same conditions. However, the presence of other research [58,67,68,69,70] specifying that women tend to prefer higher temperatures and the fact that the measured indoor summer temperatures varied (from 23 °C to 30 °C) around the highest limit specified in the standards (26 °C) could explain higher tolerance of warm temperatures reported by female users. A bigger sample data collection is proposed to be done in future research in order to observe gender difference.
The location was found to significantly influence CSET users’ experience. The thermal environment comfort and stability were perceived to be better in Zone 1 than in Zone 2, contradicting the results of sensor temperature data analysis. The theorized reasons for that are detected lower relative humidity in the Zone 1 or additional air movement coming from the opened doors, both of which could allow the occupants to tolerate higher temperatures. Another reason could be lower radiant temperature (compared to the air) of the soil surrounding the Zone 1, which was not measured in this investigation.
Data collected from the questionnaire on the illuminance and sound perception levels revealed high satisfaction with these factors among the occupants, which supports the previously reported results of studies by Pei et al. [31] and contradicts the results of Gou et al. [29]. The satisfaction with illuminance was reported to be higher in Zone 2 with no negative responses related to that area. Zone 2 has one side made fully of a glass wall and on the other side there is a light well, while the main source of natural light in the Zone 1 is the skylight. Additionally, Zone 2 users have more control over the amount of direct natural light as there are curtains covering all of the glass wall side and in Zone 1, the occupants have no control over incoming light. It should also be noted that the requirements for lighting levels in Zone 1 are much higher than in Zone 2 since the users perform highly light-demanding activities there (drawing, making models). The measured illuminance levels during daytime in Zone 1 met the minimal requirement and they were consistently higher than that in Zone 2, which contradicts the questionnaire answers provided by the building users. These negative responses, however, could be explained by the measurements collected close to and after sunset (after 5 p.m.), when artificial lighting levels were around 330–350 lux, which is not high enough for the activities performed in the zone.
Since occupants stated high satisfaction with the sound environment and the majority of measured points in both rooms were below or varying around the required maximum daily noise level, the acoustics environment in the building is acceptable. Similar to the illuminance, the sound environment was stated by the occupants to be more comfortable on average in Zone 2, which can be supported by higher maximum noise levels detected in Zone 1. This might be explained by a greater number of Zone 1 users all located in one open-plan office, where loud noises can be echoing through the space. However, statistical analysis using t-test revealed that this difference in the response was not significant.
In terms of sick building syndrome, 54.2% of participants reported experiencing at least one symptom after staying in the building longer than 2 h. The most common one was “eyes irritation”, which could be caused by low humidity levels or formaldehyde contamination [44,47,50]. It could also be caused by NO2 or SO2 gasses [47,78], however, since they usually are released during combustion and CSET building does not have any heating or cooking equipment, nitrogen and sulphur dioxides are unlikely to be the reason for dry eyes. The second most common complaint, “headache”, could be a result of occupants’ exposure to many indoor contaminants, such as CO, CO2, H2S, formaldehyde, and loud noises [44,47,49,50,79]. Carbon monoxide contamination is improbable for the same reason as sulphur dioxide, being the absence of combustion appliances in the building. Hydrogen sulphide is a sewer gas with the smell of rotten eggs sourcing from drain line or sewer pipe leaks, septic system failing, plumbing vent system defects, etc. Considering that its smell was not detected and that headache was reported in Zone 2, located two floors above the toilet, H2S should not be the reason for the complaints, leaving CO2, formaldehyde, and noise as the main probable reasons. The sound levels received a relatively high grade of 4.35 based on the questionnaire and the measured average sound levels were those of a quiet office ranging between 35 dB and 50 dB on a daily average; therefore, it is unlikely that noise caused the building users’ headaches. The third most widespread illness was reported to be sore throat, the reasons for which could be very low humidity or high formaldehyde level. The analyzed data collected in Zone 1 revealed a higher percentage of users (42%) experiencing at least one of the SBS there than in Zone 2 (17%) with some participants adding “stuffiness” and “insufficient ventilation” as additional comments. As mentioned before, the initial design of CSET building had a sustainable technology laboratory in Zone 1, which was recently refurbished into an architecture studio resulting in higher occupancy than what was initially anticipated. The measured daily average concentration levels of CO2 gas combined together with the questionnaire reports on indoor air quality suggest that the ventilation system installed during the construction of the building is not capable of coping with increased occupancy during the busiest days, such as the 18th of May, when meetings with outside visitors were held. Additionally, considering the average time spent by the participants in the building (Zone 2—around 4 h, Zone 1—around 7 h per day), one more reason for Zone 1 users to experience SBS can possibly be listed. Rohles et al. [80] stated that indoor wellbeing is related to the time spent in that building. Since respondents in Zone 1 stay indoors longer and perform tasks that require higher concentration, they are more susceptible to the SBS. A further investigation on formaldehyde levels is suggested to be performed.
Overall, the user survey and field study mostly support each other providing meaningful points of consideration for future investigation wherever the results contradict. CSET occupants perceive the building to be a comfortable working and studying space, indicating that Zone 1 has a better thermal environment while Zone 2 has better acoustics and illumination. The sensor results together with the occupants’ SBS answers revealed that sustainable passive cooling and ventilation systems do not meet the standard requirements in the hottest summer period and during peak time. Building users’ health complaints indicate high levels of CO2 gas presence (supported by on-site measurements) as well as possible formaldehyde contamination.
This research offers a case study building’s indoor environment quality (IEQ) evaluation that expands the understanding of green buildings’ thermal, illuminance, acoustic, and air quality environment. By providing an overview of a ZCB that is being used for study purposes and was constructed in China, this study enriches the available information about Chinese and international green buildings as well as different usage types of buildings. The main limitation of this study was reviewing one ZCB without benchmarking it to a typical non-green building of the same function and configuration. Another limitation comes from the average age group of the building occupants being mostly between 20 and 28 years old, which could influence the thermal perception of comfort. Additionally, this study does not cover all of the chemicals involved in the SBS propagation. Based on that, for future research it is suggested to perform POEs on other case study projects in one locale and compare the results to the building studied in this paper. Furthermore, it would be helpful to complete the list by evaluating radon, asbestos, and formaldehyde levels, which requires more advanced air sampling equipment. In order to meet the current comfort requirements and mitigate future climate change effects on the building, it is also suggested to upgrade or amend the existing cooling and ventilation systems and install PM2.5 filters to prevent high indoor particulate matter peaks detected by the sensors.
7. Conclusions
This research investigated the ability of the first built zero carbon building (ZCB) in China (CSET) located in the HSCW Chinese climate zone and used for study purposes to provide a comfortable and healthy indoor environment. For this, two types of data were collected and analyzed, namely an occupants’ comfort evaluation survey and on-site measurement (i.e., temperature, humidity, sound, illuminance, CO2, PM2.5).
Based on the questionnaire designed based on the BUS survey technique, it was found that the majority of building users were satisfied with the overall thermal environment and its stability with 18.75% of occupants reporting the temperature to be slightly higher than neutral. Data collected by sensors supported the occupants’ reports as the internal temperature stayed within the comfortable range specified in the relevant standards, however, the cooling and ventilation system could not maintain comfort level during the hottest days exceeding the established limit by 3 °C. The relative humidity levels (which is another contributor to the perception of the thermal environment) were maintained at a comfortable range of 40–60%.
In addition to the thermal environment, the acoustics and lighting environment were evaluated. The occupants reported high contentment with the acoustics in the whole building. These observations were supported by the measured data with the daily average acoustic levels varying mostly within the standard range for teaching areas. The illuminance levels, however, were measured to drop below the minimum requirements stated by Chinese standards after sunset or during very cloudy days.
Furthermore, the effect of indoor air quality on the occupants’ health was evaluated in this research. The survey analysis revealed that 45.8% of users experienced at least one of the sick building syndromes after staying longer than two hours in the building. First, the current occupancy in the building is much higher than what the initial design of the ventilation system was planned for. Second, other air contaminants could be present in the building, which were not investigated in this study. Further research on measuring indoor air chemical composition can be done to determine the specifics.
This study provides a solid base for future investigations with larger and more varied samples and other variations of building usage types. In doing so, this research paper mainly investigates one zero energy building (as a sample case) and analyzes its IEQ and thermal comfort satisfaction of users. Other environmental parameters, such as volatile organic compounds, may be involved in future evaluation or research studies. A combination of numerous substantial studies on sustainable buildings’ IEQ could help to detect and prevent the most common inadequacies as well as provide a framework to efficiently maintain and retrofit these buildings. It is important to notice, that this research was conducted on a ZCB that has undergone refurbishment. Therefore, it is unknown what indoor conditions were maintained before the retrofit. This shows the importance of post-occupancy evaluation to analyze the performance of green buildings before and after implementing any modifications.
Several factors can be mentioned as limitations of this study. First, the field measurements are only as accurate as the used sensors are; therefore, if more precise data are required, more accurate equipment should be used. Second, the indoor lighting conditions were only evaluated based on the illuminance levels at the locations of sensors, which did not give a full picture of visual comfort. Third, the occupants belonged to one specific age group of young adults, which makes the results applicable only to that age group. Lastly, the methods used in the research are not novel and it does not fully follow the BUS method due to high mobility of occupants, which consequently made it impractical to register the precise location of each occupant required for full BUS method implementation.
Supplementary Materials
The following are available online at https://www.mdpi.com/2071-1050/13/2/667/s1, Questionnaire sample.
Author Contributions
Conceptualization, P.T. and A.C.; Investigation, W.D.; Methodology, P.T.; Supervision, A.C., W.D. and C.H.; Validation, P.T. and C.H.; Visualization, P.T.; Writing—original draft, P.T.; Writing—review & editing, A.C., W.D. and C.H. All authors have read and agreed to the published version of the manuscript.
Funding
The research is sponsored by the National Natural Science Foundation of China (NSFC), for funding project number 71950410760. We also thank the Ningbo Natural Science Funding Scheme (Project code: 2019A610393).
Institutional Review Board Statement
The study was conducted according to the guidelines of Economic and Social Research Council (2012) Framework for Research Ethics and approved by the Institutional Research Ethics Panel of the University of Nottingham Ningbo China (24 April 2018).
Informed Consent Statement
Informed consent was obtained from all subjects involved in the study.
Data Availability Statement
The data presented in this study are available on request from the corresponding author. The data are not publicly available due to ethical reasons.
Conflicts of Interest
The authors declare no conflict of interest.
References
- IEA. World Energy Balances: Overview. 2017. Available online: http://www.iea.org/publications/freepublications/publication/WorldEnergyBalances2017Overview.pdf (accessed on 26 September 2019).
- McMullan, R. Environmental Science in Building, 7th ed.; Palgrave Macmillan: Basingstoke, UK, 2014. [Google Scholar]
- United Nations Framework Convention on Climate Change. Adoption of the Paris Agreement; United Nations: New York, NY, USA, 2015.
- Foley, A.; Smyth, B.M.; Pukšec, T.; Markovska, N.; Duić, N. A review of developments in technologies and research that have had a direct measurable impact on sustainability considering the Paris agreement on climate change. Renew. Sustain. Energy Rev. 2017, 68, 835–839. [Google Scholar] [CrossRef] [Green Version]
- International Energy Agency and the United Nations Environment Programme. 2018 Global Status Report: Towards a Zero-Emission, Efficient and Resilient Buildings and Construction Sector; IEA: Paris, France, 2018. [Google Scholar]
- United Nations Environment Programme. A Guide for Incorporating Buildings Aactions in NDCs; United Nations Environment Programme: Nairobi, Kenya, 2018. [Google Scholar]
- Musolino, M.; Malerba, A.; Paola, P.; Musarella, C. Building efficiency adopting ecological materials and bio architecture techniques. ArcHistoR 2019, 6, 10. [Google Scholar]
- World Green Building Council. About Green Building. 2019. Available online: http://www.worldgbc.org/what-green-building (accessed on 26 September 2019).
- Kurnitski, J.; Allard, F.; Braham, D.; Goeders, G.; Heiselberg, P.; Jagemar, L. How to define nearly net zero energy buildings nZEB. Rehva J. 2011, 3, 6–12. [Google Scholar]
- Peterson, K.; Torcellini, P.; Grant, R. A Common Definition for Zero Energy Buildings; The National Institute of Building Sciences: Washington, DC, USA, 2015. [Google Scholar]
- Torcellini, P.; Pless, S.; Deru, M.; Crawley, D. Zero Energy Buildings: A Critical Look at the Definition. 2006 ACEEE Summer Study on Energy Efficiency in Buildings; National Renewable Energy Laboratory (U.S.): Pacific Grove, CA, USA, 2006.
- Canada Green Building Council. Zero Carbon Building Standard; CaGBC: Ottawa, ON, Canada, 2017. [Google Scholar]
- Twinn, R.; Desai, K.; Box, P. Net Zero Carbon Buildings: A Framework Definition; The Building Centre; UK Green Building Council: London, UK, 2019. [Google Scholar]
- Deng, W.; Cheshmehzangi, A. Eco-Development in China: Cities, Communities and Buildings; Cheshmehzangi, A., Ed.; Palgrave Macmillan: Singapore, 2018. [Google Scholar]
- McMullan, R. Environmental Science in Building, 8th ed.; Palgrave Macmillan: Hampshire, UK, 2017. [Google Scholar]
- Leaman, A.; Thomas, L.E.; Vandenberg, M. ‘Green’ buildings: What Australian users are saying. Ecolibrium(R) 2007, 6, 22–30. [Google Scholar]
- Liang, H.-H.; Chen, C.-P.; Hwang, R.-L.; Shih, W.-M.; Lo, S.-C.; Liao, H.-Y. Satisfaction of occupants toward indoor environment quality of certified green office buildings in Taiwan. Build. Environ. 2014, 72, 232–242. [Google Scholar]
- Altomonte, S.; Saadouni, S.; Schiavon, S. Occupant Satisfaction in LEED and BREEAM-Certified Office Buildings. In Proceedings of the 36th International Conference on Passive and Low Energy Architecture, Los Angeles, CA, USA, 1 July 2016. [Google Scholar]
- Collinge, W.O.; Landis, A.E.; Jones, A.K.; Schaefer, L.A.; Bilec, M.M. Productivity metrics in dynamic LCA for whole buildings: Using a post-occupancy evaluation of energy and indoor environmental quality tradeoffs. Build. Environ. 2014, 82, 339–348. [Google Scholar] [CrossRef]
- Hua, Y.; Göçer, Ö.; Göçer, K. Spatial mapping of occupant satisfaction and indoor environment quality in a LEED platinum campus building. Build. Environ. 2014, 79, 124–137. [Google Scholar]
- Issa, M.H.; Rankin, J.H.; Attalla, M.; Christian, A.J. Absenteeism, Performance and Occupant Satisfaction with the Indoor Environment of Green Toronto Schools. Indoor Built Environ. 2011, 20, 511–523. [Google Scholar] [CrossRef]
- Khoshbakht, M.; Gou, Z.; Lu, Y.; Xie, X.; Zhang, J. Are green buildings more satisfactory? A review of global evidence. Habitat Int. 2018, 74, 57–65. [Google Scholar]
- Kim, S.K.; Hwang, Y.; Lee, Y.S.; Corser, W. Occupant comfort and satisfaction in green healthcare environments: A survey study focusing on healthcare staff. J. Sustain. Dev. 2015, 8, 156–173. [Google Scholar]
- Mahbub, R.; Kent, S. Green buildings, environmental awareness, and organizational image. J. Corp. Real Estate 2012, 14, 21–49. [Google Scholar]
- Newsham, G.R.; Birt, B.J.; Arsenault, C.; Thompson, A.J.L.; Veitch, J.A.; Mancini, S. Do ‘green’ buildings have better indoor environments? New evidence. Build. Res. Inf. 2013, 41, 415–434. [Google Scholar]
- Ravindu, S.; Rameezdeen, R.; Zuo, J.; Zhou, Z.; Chandratilake, R. Indoor environment quality of green buildings: Case study of an LEED platinum certified factory in a warm humid tropical climate. Build. Environ. 2015, 84, 105–113. [Google Scholar] [CrossRef]
- Thatcher, A.; Milner, K. Is a green building really better for building occupants? A longitudinal evaluation. Build. Environ. 2016, 108, 194–206. [Google Scholar] [CrossRef]
- Gou, Z.; Siu, Y.; Lau, S. Post-occupancy evaluation of the thermal environment in a green building. Facilities 2013, 31, 357–371. [Google Scholar] [CrossRef]
- Gou, Z.; Prasad, D.; Siu, Y.; Lau, S. Are green buildings more satisfactory and comfortable? Habitat Int. 2013, 39, 156–161. [Google Scholar] [CrossRef]
- Lin, B.; Liu, Y.; Wang, Z.; Pei, Z.; Davies, M. Measured energy use and indoor environment quality in green office buildings in China. Energy Build. 2016, 129, 9–18. [Google Scholar] [CrossRef]
- Pei, Z.; Lin, B.; Liu, Y.; Zhu, Y. Comparative study on the indoor environment quality of green office buildings in China with a long-term field measurement and investigation. Build. Environ. 2015, 84, 80–88. [Google Scholar] [CrossRef]
- Schweiker, M.; Huebner, G.M.; Kingma, B.R.M.; Kramer, R.; Pallubinsky, H. Drivers of diversity in human thermal perception—A review for holistic comfort models. Temperature 2018, 5, 308–342. [Google Scholar]
- Standard, A. Standard 55-2010, Thermal Environmental Conditions for Human Occupancy; American Society of Heating, Refrigerating and Air Conditioning Engineers: Atlanta, GA, USA, 2010. [Google Scholar]
- De Dear, R.J. A global database of thermal comfort field experiments. Ashrae Trans. 1998, 104, 1141. [Google Scholar]
- McCartney, K.J.; Nicol, J.F. Developing an adaptive control algorithm for Europe. Energy Build. 2002, 34, 623–635. [Google Scholar] [CrossRef]
- Nicol, J.F.; Humphreys, M.A. Adaptive thermal comfort and sustainable thermal standards for buildings. Energy Build. 2002, 34, 563–572. [Google Scholar]
- Nicol, F. Adaptive thermal comfort standards in the hot–humid tropics. Energy Build. 2004, 36, 628–637. [Google Scholar] [CrossRef]
- Nguyen, A.T.; Singh, M.K.; Reiter, S. An adaptive thermal comfort model for hot humid South-East Asia. Build. Environ. 2012, 56, 291–300. [Google Scholar] [CrossRef] [Green Version]
- Standard, B. BS EN ISO 7730: 2005. Ergonomics of the Thermal Environment; ISO: Geneva, Switzerland, 2005. [Google Scholar]
- Chartered Institution of Building Services Engineers. Guide A: Environmental Design; CIBSE: London, UK, 2015. [Google Scholar]
- MoHURD. GB50189-2015 Design Standard for Energy Efficiency of Public Buildings (Chinese); China Architecture and Building Press: Beijing, China, 2015. [Google Scholar]
- Frontczak, M.; Wargocki, P. Literature survey on how different factors influence human comfort in indoor environments. Build. Environ. 2011, 46, 922–937. [Google Scholar]
- EPA. Indoor Air Facts No. 4 Sick Building Syndrome; United States Environmental Protection Agency: Washington, DC, USA, 1991.
- Mendes, A.; Teixeira, J.P. Sick building syndrome. In Encyclopedia of Toxicology, 3rd ed.; Wexler, P., Ed.; Academic Press: Oxford, UK, 2014; pp. 256–260. [Google Scholar]
- Berglund, B.; Brunekreef, B.; Knöppe, H.; Lindvall, T.; Maroni, M.; Mølhave, L. Effects of Indoor Air Pollution on Human Health. Indoor Air 1992, 2, 2–25. [Google Scholar]
- Tsakas, M.P.; Siskos, A.P.; Siskos, P. Indoor Air Pollutants and the Impact on Human Health. In Chemistry, Emission Control, Radioactive Pollution and Indoor Air Quality; Mazzeo, N., Ed.; IntechOpen: London, UK, 2011. [Google Scholar]
- World Health Organisation. WHO Guidelines for Indoor Air Quality: Selected Pollutants; WHO: Geneva, Switzerland, 2010. [Google Scholar]
- Abdollahi, M.; Hosseini, A. Formaldehyde A2—Wexler, Philip. Encyclopedia of Toxicology, 3rd ed.; Academic Press: Oxford, UK, 2014; pp. 653–656. [Google Scholar]
- Sliwinska-Kowalska, M. Combined exposures to noise and chemicals at work. In Encyclopedia of Environmental Health; Nriagu, J.O., Ed.; Elsevier: Amsterdam, The Netherlands, 2011; pp. 755–763. [Google Scholar]
- Jafari, M.J.; Khajevandi, A.A.; Mousavi Najarkola, S.A.; Yekaninejad, M.S.; Pourhoseingholi, M.A.; Omidi, L. Association of Sick Building Syndrome with Indoor Air Parameters. Tanaffos 2015, 14, 55–62. [Google Scholar]
- Pathak, V.; Tripathi, B.D.; Mishra, V.K. Evaluation of traffic noise pollution and attitudes of exposed individuals in working place. Atmos. Environ. 2008, 42, 3892–3898. [Google Scholar]
- Boubekri, M.; Cheung, I.N.; Reid, K.J.; Wang, C.-H.; Zee, P.C. Impact of windows and daylight exposure on overall health and sleep quality of office workers: A case-control pilot study. J. Clin. Sleep Med. 2014, 10, 603–611. [Google Scholar] [CrossRef]
- Arundel, A.V.; Sterling, E.M.; Biggin, J.H.; Sterling, T.D. Indirect health effects of relative humidity in indoor environments. Environ. Health Perspect. 1986, 65, 351–361. [Google Scholar]
- MoHURD. GB50034-2013 Standard for Lighting Design of Buildings (Chinese); China Architecture and Building Press: Beijing, China, 2013. [Google Scholar]
- MoHURD. GB 50118-2010 Code for Design of Sound Insulation of Civil Buildings; China Architecture and Building Press: Beijing, China, 2010. [Google Scholar]
- MoHURD. GB 18883-2002 Indoor Air Quality Standard (Chinese); China Architecture and Building Press: Beijing, China, 2002. [Google Scholar]
- ASHRAE. Thermal Comfort Conditions, ASHRAE Standard 55.66; ASHRAE: New York, NY, USA, 1966. [Google Scholar]
- Fanger, P.O. Thermal Comfort; Danish Technical Press: Copenhagen, Denmark, 1970. [Google Scholar]
- de Dear, R.; Brager, G.; Cooper, D. Developing an Adaptive Model of Thermal Comfort and Preference. Final Report on ASHRAE RP-884; ASHRAE: Sydney, Australia, 1997. [Google Scholar]
- Hall, M.R. Materials for Energy Efficiency and Thermal Comfort in Buildings/Edited by Matthew R. Hall; CRC Press: Boca Raton, FL, USA, 2010. [Google Scholar]
- Nico, M.A.; Liuzzi, S.; Stefanizzi, P. Evaluation of thermal comfort in university classrooms through objective approach and subjective preference analysis. Appl. Ergon. 2015, 48, 111–120. [Google Scholar] [CrossRef] [PubMed]
- BUS Methodology. Occupant Satisfaction Evaluation. 2017. Available online: https://busmethodology.org.uk/ (accessed on 20 May 2020).
- Choi, J.; Aziz, A.; Loftness, V. Investigation on the impacts of different genders and ages on satisfaction with thermal environments in office buildings. Build. Environ. 2010, 45, 1529–1535. [Google Scholar] [CrossRef]
- de Dear, R.; Fountain, M.E. Field experiments on occupant comfort and office thermal environment in a hot-humid climate. ASHRAE Trans. 1994, 100, 457–475. [Google Scholar]
- Kim, J.; de Dear, R.; Cândido, C.; Zhang, H.; Arens, E. Gender differences in office occupant perception of indoor environmental quality (IEQ). Build. Environ. 2013, 70, 245–256. [Google Scholar] [CrossRef] [Green Version]
- Schiavon, S.; Altomonte, S. Influence of factors unrelated to environmental quality on occupant satisfaction in LEED and non-LEED certified buildings. Build. Environ. 2014, 77, 148–159. [Google Scholar] [CrossRef]
- Indraganti, M.; Ooka, R.; Rijal, H.B. Thermal comfort in offices in India: Behavioral adaptation and the effect of age and gender. Energy Build. 2015, 103, 284–295. [Google Scholar] [CrossRef]
- Lan, L.; Lian, Z.; Liu, W.; Liu, Y. Investigation of gender difference in thermal comfort for Chinese people. Eur. J. Appl. Physiol. 2008, 102, 471–480. [Google Scholar]
- Maykot, J.K.; Rupp, R.F.; Ghisi, E. A field study about gender and thermal comfort temperatures in office buildings. Energy Build. 2018, 178, 254–264. [Google Scholar] [CrossRef]
- Lu, S.; Pang, B.; Qi, Y.; Fang, K. Field study of thermal comfort in non-air-conditioned buildings in a tropical island climate. Appl. Ergon. 2018, 66, 89–97. [Google Scholar]
- Breslin, R. Gender Differences and Thermal Comfort Requirements; Final Year Undergraduate Report; Loughborough University: Loughborough, UK, 1996. [Google Scholar]
- Webb, L.H.; Parsons, K.C. Thermal comfort requirements for people with physical disabilities. Sustain. Build. 2000, 44, 114–121. [Google Scholar]
- Ole Fanger, P.; Toftum, J. Extension of the PMV model to non-air-conditioned buildings in warm climates. Energy Build. 2002, 34, 533–536. [Google Scholar] [CrossRef]
- Dawe, M.; Raftery, P.; Woolley, J.; Schiavon, S.; Bauman, F. Comparison of mean radiant and air temperatures in mechanically-conditioned commercial buildings from over 200,000 field and laboratory measurements. Energy Build. 2020, 206, 109582. [Google Scholar] [CrossRef]
- Walikewitz, N.; Jänicke, B.; Langner, M.; Meier, F.; Endlicher, W. The difference between the mean radiant temperature and the air temperature within indoor environments: A case study during summer conditions. Build. Environ. 2015, 84, 151–161. [Google Scholar] [CrossRef]
- Jantunen, M.; Oliveira Fernandes, E.; Carrer, P.; Kephalopoulos, S. Promoting Actions for Healthy Indoor Air (IAIAQ); European Commission Directorate General for Health and Consumers: Luxembourg, 2011. [Google Scholar]
- MoHURD. GB 3095-2012 Ambient Air Quality Standards; China Architecture and Building Press: Beijing, China, 2012. [Google Scholar]
- Rall, D.P. Review of the health effects of sulfur oxides. Environ. Health Perspect. 1974, 8, 97–121. [Google Scholar] [CrossRef]
- Chou, C.H.S.J. Hydrogen Sulfide: Human Health Aspects; WHO: Geneva, Switzerland, 2003. [Google Scholar]
- Indoor Environment Acceptability: The Development of a Rating Scale; Rohles, F.; Woods, J.; Morey, P. (Eds.) ASHRAE: Chicago, IL, USA, 1989. [Google Scholar]
Figure 1.
The Centre for Sustainable Energy Technologies (CSET) building model from Revit 2018. (a) Outside view, (b) section view with the indication of studied zones.
Figure 1.
The Centre for Sustainable Energy Technologies (CSET) building model from Revit 2018. (a) Outside view, (b) section view with the indication of studied zones.

Figure 2.
Research methodology.

Figure 3.
Indoor environment quality (IEQ) evaluation questionnaire rating scale.

Figure 4.
Teaching areas represented by blue polygons and the location of sensors represented by red dots (a) on Zone 1 plan view in Revit; (b) in Zone 2 plan view in Revit; (c) in Zone 1 at the middle of the teaching area; (d) in Zone 2 near the wall.
Figure 4.
Teaching areas represented by blue polygons and the location of sensors represented by red dots (a) on Zone 1 plan view in Revit; (b) in Zone 2 plan view in Revit; (c) in Zone 1 at the middle of the teaching area; (d) in Zone 2 near the wall.

Figure 5.
Total and target groups’ satisfaction levels with thermal environment of the building.


Figure 6.
Total and target groups’ satisfaction levels with illuminance and sound in the building.

Figure 7.
Working day average temperature with standard deviation in two studied zones.

Figure 8.
Working day average relative humidity in two studied zones.

Figure 9.
Temperature frequency distribution for two studied zones.

Figure 10.
Working day average carbon dioxide levels in two studied zones.

Figure 11.
Carbon dioxide levels frequency distribution for two studied zones.

Figure 12.
Working day average PM2.5 levels.

Figure 13.
Working day average and daily maximum sound levels in two studied zones.

Figure 14.
Working day average illuminance levels in two studied zones.


Table 1.
Indoor physical parameters requirements from standards.
| Physical Parameter | Location | Amount | Time |
|---|---|---|---|
| Temperature | Study space | ≤26 °C | Summer |
| ≥20 °C | Winter | ||
| Humidity | Study space | 40–80% | Summer |
| 30–60% | Winter | ||
| Lighting | Computer room | ≥500 lm | - |
| Studio (drawing room) | ≥500 lm | - | |
| Chemicals in air | CO2 | 1000 ppm | 12 h |
| PM2.5 | 35 μg/m3 | 24 h | |
| Sound | Common teaching room | ≤45 dB | - |
| Computer room | ≤45 dB | - |
Table 2.
Sensor characteristics.
| IEQ Factors | Range | Accuracy | Resolution |
|---|---|---|---|
| Air Temperature | −40 °C–120 °C | ±1 °C | 0.1 °C |
| Humidity | 0% RH–100% RH | ±3% RH | 1% RH |
| Illuminance | 0 lux–9999 lux | ±5% | 1 lux |
| Sound | 30 dB–110 dB | ±5% | 1 dB |
| CO2 | 0 ppm–5000 ppm | ±5% | 1 ppm |
| PM2.5 | 0 μg/m3–1000 μg/m3 | ±10% | 1 μg/m3 |
Table 3.
Average results of questionnaire responses.
| Summer Temperature | Illuminance | Sound | |||
|---|---|---|---|---|---|
| Hot/Cold | Comfort | Stability | |||
| TOTAL | 3.57 | 4.2 | 4.63 | 3.98 | 4.35 |
| Female | 3.78 | 4.35 | 5.09 | 3.91 | 4.41 |
| Male | 3.46 | 4 | 4.25 | 4.04 | 4.69 |
| p value | 0.4928 | 0.3413 | 0.0596 | 0.7205 | 0.0728 |
| Zone 1 | 3.82 | 4.52 | 4.88 | 3.6 | 4.11 |
| Zone 2 | 2.92 | 3.38 | 4 | 5 | 5 |
| p value | 0.0103 | 0.0147 | 0.0607 | 0.0002 | 0.0541 |
Table 4.
Frequency of experienced sick building syndromes.
| Fatigue/Drowsiness | Nausea/Dizziness | Eye Irritation | Sore Throat | Dry Nose | Headache | |
|---|---|---|---|---|---|---|
| Total | 8.3% | 8.3% | 20.8% | 12.5% | 6.25% | 16.7% |
| Total F | 18.2% | 13.6% | 18.2% | 9.1% | 9.1% | 18.2% |
| Total M | 0 | 3.8% | 23.1% | 15.4% | 3.8% | 15.4% |
| Total Zone 1 | 11.4% | 8.6% | 22.9% | 14.3% | 5.7% | 20% |
| Total Zone 2 | 0 | 7.7% | 15.4% | 7.7% | 7.7% | 7.7% |
Publisher’s Note: MDPI stays neutral with regard to jurisdictional claims in published maps and institutional affiliations. |
© 2021 by the authors. Licensee MDPI, Basel, Switzerland. This article is an open access article distributed under the terms and conditions of the Creative Commons Attribution (CC BY) license (http://creativecommons.org/licenses/by/4.0/).
Share and Cite
MDPI and ACS Style
Trofimova, P.; Cheshmehzangi, A.; Deng, W.; Hancock, C. Post-Occupancy Evaluation of Indoor Air Quality and Thermal Performance in a Zero Carbon Building. Sustainability 2021, 13, 667. https://doi.org/10.3390/su13020667
AMA Style
Trofimova P, Cheshmehzangi A, Deng W, Hancock C. Post-Occupancy Evaluation of Indoor Air Quality and Thermal Performance in a Zero Carbon Building. Sustainability. 2021; 13(2):667. https://doi.org/10.3390/su13020667
Chicago/Turabian StyleTrofimova, Polina, Ali Cheshmehzangi, Wu Deng, and Craig Hancock. 2021. "Post-Occupancy Evaluation of Indoor Air Quality and Thermal Performance in a Zero Carbon Building" Sustainability 13, no. 2: 667. https://doi.org/10.3390/su13020667
Note that from the first issue of 2016, this journal uses article numbers instead of page numbers. See further details here.