1. Introduction
Human activities tend to introduce changes in the pattern of land use and occupation, which lead to a series of processes that modify the quality of the natural and built environment [
1,
2]. Throughout history, these changes have often resulted in a degradation vector. This work examined the relationship between land use and its interaction with the river systems, more specifically focusing on city spaces and urban rivers, mainly considering urban flooding, river degradation, and the interactions with the urban space itself.
One reason to move forward in this discussion is based on environmental concepts, such as the conservation of nature and biodiversity [
3]. Another reason is based on the search for a better quality of life in cities, considering aspects such as recreation, landscaping, and sociocultural dimensions of the relationship between man, water, and cultural heritage. At last, the socioeconomic dimension points to the likelihood that natural ecosystems can provide a fundamental basis for productive economic activities such as fishing and ecotourism, as well as good quality water with low needs of treatment, among other possibilities. Rivers in good condition, closer to the natural status, tend to minimize or avoid maintenance costs. On a spatial scale, rivers can be considered as the synthesis of the territory [
4] and actions that are taken in the watershed define the river corridor. In practice, there are very few rivers in natural conditions [
5] and many cases worldwide show rivers with fixed banks, rectified channels, and floodplains protected by dikes and disconnected from the fluvial processes. In the classic approach that assigns characteristics of stable channels to rivers, introducing flood defenses proved to be inefficient over time in most cases. These changes in the fluvial system tend to transfer floods downstream and, in general, deeply modify morphological balance. Losses are increasing and huge amounts of money are spent each year to repair damages and to make new hydraulic works, in an endless spiral of rising costs, as reported in works developed in European countries [
6], Bangladesh [
7], USA [
8], and Brazil [
9]. Many of these cases are fostered by the need to reduce hydraulic risks, where floods play an important role in the degradation process, both in the vicinities of the river and in the river itself. The loss of naturalness tends to weaken the system, increase risks and losses, and damage the environment.
In the cities, the intense land use process tends to aggravate the relationship with the degradation of natural resources. The urbanization process greatly alters the urban water cycle and the river systems’ responses to the built environment [
10]. The vegetation removal, the consequent increase in impervious surfaces, the surface regularization, the disconnection of rivers and floodplains [
11], and the introduction of artificial drainage systems significantly alter the flow regime, producing larger and faster runoff responses and fewer opportunities for infiltration, resulting in increasing peak flows, reduction of base flows, and losses in the river ecosystems [
1].
The worsening of the flooding problem usually causes damages to buildings and urban equipment, depreciates areas subject to flooding, generates losses associated with the interruption of business and services, disrupts mobility, increases water-borne diseases, and affects sanitation, among other problems [
12]. This situation is strongly associated with land-use issues [
2,
13] and typical urban planning flaws, such as the housing deficit. The recognition of how much engineering works altered rivers without offering sustainable solutions over time contributed to the increase of river restoration concepts around the world [
14]. River preservation and/or restoration has been considered a possible way to address the growing risk of floods and morphological imbalances [
15]. The river restoration approach includes the search for a more consistent balance between human needs and the natural dynamics, offering effective and more sustainable opportunities to address the problem of the hydraulic risks [
4]. In this sense, river managers can explore options to restore the river channel and floodplain morphology to modify flood peaks to benefit downstream communities [
16]. For Perini and Sabbion [
17] river restoration ‘
comprises biodiversity conservation (supporting); sustainable flood management (regulating); physical habitat quality restoration (regulating); fisheries enhancement (cultural/provisioning); pollution control (regulating); and also cultural awareness (recreation and amenity)’. Park and Lee [
18] emphasized that the first step towards restoration is to recognize and stop the causes of damage to the structure and to the ecosystem functions, and to recognize and treat the factors that prevent the system from recovering to a sustainable condition. Urban river restoration, however, is a more difficult matter due to the large land-use changes in the watershed scale, but it also can bring opportunities to revitalize the built environment, in a complementary benefit, reconnecting the river to the city, although not necessarily being able to recover the fluvial natural patterns and/or ecosystems [
19]. Urban environments accumulate several constraints to natural dynamics over time, mainly in regards to vegetation removal, excess of imperviousness, river canalization, flood plains disconnection, lack of open spaces, uncontrolled wastewaters disposal, housing deficit, and irregular occupation of river banks, resulting in social pressures and low quality of life, among other problems that act as barriers in the way of urban river restoration processes. The Laojie River restoration, in Taiwan, is an example. According to Chou [
19], due to issues related to water quality, biodiversity, and project maintenance, it can be said that the Laojie River Restoration was only partially successful. Specifically, regarding water quality, although the project predicted the treatment system and sewage-intercepting facilities implementation along the river, the lack of pre-existing supporting sanitary sewer infrastructure in the watershed continued to affect the water quality downstream [
19].
Gusmaroli et al. [
20], alerted that urban river restoration has to consider an urban ecosystem approach, which should not be confused with the concept of waterfront design. Although urban demands can be added to a river restoration project, the waterfront design mainly aims to recover social relations and urban function between the river and the city in their interface line of contact. In fact, therefore, there is an opportunity to step further and to use the river restoration approach to improve not only the fluvial environment but also the city, considering the city as an adapting organism in constant transformation and capable of embracing both demands (natural and urban), while involving the population in the process [
21]. In this way, it is desirable to search for ways to rethink the relation between rivers and cities, supporting urban river restoration in a comprehensive way, with multiple benefits.
The sustainable perspective opens a diversified set of opportunities to explore integrated solutions for urban development, in a multidisciplinary way [
10], in the fields of hydraulic and environmental engineering, architecture, urbanism, city planning, and social–economic disciplines. In urban drainage, sustainability, in practical terms, can be measured by urban flooding not being transferred in space or time [
12]. However, in a broad sense, urban drainage systems should be integrated with urban land use planning and urban landscape design [
22,
23], using open spaces as a valuable resource. On the other hand, the urbanization process should minimize negative impacts on the natural water cycle.
The sustainable urban drainage systems (SUDS) emerged as an alternative to end-of-pipe solutions that could transfer floods downstream [
10]. The existing drainage infrastructure became overloaded with the runoff resulting from the urbanization process and it was perceived that adapting the system every time the city expands is not sustainable. New trends on urban drainage have focused on source control measures, acting on the causes of flooding by increasing retention and infiltration opportunities [
23,
24,
25]. Sustainable urban drainage measures introduce opportunities for multifunctionality in the urban environment, providing not only the support to avoid undesired floods, but also fostering ecosystem benefits, such as microclimate regulation, leisure, erosion control, and habitat provision [
26].
Joining these two concepts—urban river restoration and sustainable urban drainage—can provide a consistent path towards a more sustainable solution for urban floods, with additional benefits. Urban river restoration, although usually limited by the heavy modifications introduced in the urban watershed, has the potential to improve the environmental quality of the river and provide opportunities for urban revitalization [
19,
21]. However, it is necessary to integrate this approach with distributed actions in the watershed to recover hydrological functions that were modified by the urbanization process itself [
27]. This combination offers integration of measures on the watershed scale and the local fluvial space scale, reducing the risk of flooding and probably increasing the resilience of the city [
28]. Storage volumes distributed on the watershed can reorganize runoff patterns and consequently decrease the drainage network demand in terms of discharge capacity [
23]. This result favors river restoration by recovering the functional effects of the original pre-urban hydrology that used to give support to the original fluvial processes. The use of the city’s open spaces can also be the catalyst for this integration between sustainable urban drainage and river restoration [
27]. These spaces can be used in multifunctional landscape arrangements, acting in the urban revitalization and providing urban and ecosystem services, while also controlling the potential of degradation previously introduced by recurrent floods [
27]. Besides that, open spaces are related to the construction of resilient cities, providing benefits for urban performance, not only under normal conditions but also in disaster events [
29], such as floods.
In this context, this paper stated the hypothesis that the watershed, considered as the basic element of planning and design, should receive compensation actions for the urbanization effects on the water cycle so that they can sustain the proposed river restoration in a near-natural hydrological condition. Thus, the concept of urban river restoration needs to expand to a broader concept of urban watershed restoration to be more effective in city environments. This statement suggests a systemic approach, where not only the urban rivers but the entire watershed should be considered in an integrated manner in an urban water restoration process.
Therefore, it is possible to integrate sustainable urban drainage measures with urban design, working in landscape compositions that respect the historical and cultural vocations of a watershed, to produce a low-impact urban development, with participation and acceptance of city communities [
26], capable of generating appropriate conditions for sustaining river restoration measures associated with a river corridor, which, in turn, appears as an alternative to recover the river–city relationship [
21] and a practical and effective solution for the critical problems of urban floods.
To fulfill the aim of joining concepts of sustainable urban drainage and river restoration as a combined complementary approach, this work will define basic guidelines for conceiving a project in this context. Besides this, a set of mathematical supporting tools will be proposed to measure the extent of the results that can be obtained in this way of action. A case study was developed to illustrate this discussion, using an urban watershed in the Rio de Janeiro metropolitan area, Brazil.
2. Materials and Methods
The methodological procedures involve two different, but correlated steps. Considering the initial discussion and supported by the literature review, the first step tries to interpret the conceptual basis, to define general guidelines to support the design of flood control systems, combining sustainable urban drainage and river restoration approaches. Then, in the second methodological step, an assessment framework is proposed to quantitatively evaluate the proposed design behavior.
2.1. Framework for Designing Sustainable Drainage Systems Integrating Landscaping and River Restoration for Flood Risk Mitigation and Enhancement of Urban Spaces
The methodological approach proposed in this first step considers three focal points as supporting pillars:
- ▪
River restoration brings important elements for managing urban rivers, in search of more sustainable solutions from the environmental, social, and economic standpoints, since it aims to valorize the natural behavior, within the limits imposed by nature, while avoiding artificial solutions that usually demand greater investments and maintenance costs.
- ▪
The changes introduced by the growth of cities in watersheds disturb the water balance in the watershed scale. In this context, the sustainable urban drainage approach brings the possibility of reorganizing the urban water cycle functions, bringing them as nearly as possible to the original natural cycle. The distributed actions over the watershed support river restoration in complementary form.
- ▪
The combination of the previous steps opens real possibilities for valorization and revitalization of the urban space, with gains for the city that go beyond flood control, fostering a sustainable overall framework. The final result of this combination can minimize flood risks and increase the city’s resilience to flooding, reestablishing environmental values and enhancing the urban areas in the river vicinity.
In this composition, it is important to reorganize flows, improve water infiltration and storage, create recreation and leisure areas, integrate these areas with opportunities to appreciate natural landscapes, and reduce the occupation of high-risk areas by creating feasible and sustainable housing alternatives. On the other side, the use of these concepts and the range of their effects should be measured to allow a proper assessment of different design alternatives.
This work, in particular, relied on the use of MODCEL [
30,
31], a hydrodynamic mathematical model designed to support the diagnosis and forecast urban floods. The use of this model was a matter of choice. Other computational hydrodynamic models could have been used with similar results. However, a set of specific multicriteria tools was developed, departing from the perspective of risk, including socioeconomic aspects. This composition involved adapting the Flood Risk Index (FRI) proposed by Zonsenein et al. [
32], a multicriteria approach that identifies the characteristics of the flood event, to conjugate flood depths, flow speeds, and permanence times with socioeconomic indicators related to the affected structures, material losses, degradation of living conditions, and public health and traffic restrictions. Besides that, the environmental state of the urban rivers, modified and usually degraded by inadequate interactions between land use and water dynamics, should also be assessed. To measure this effect, river restoration concepts may be used to build a multicriteria index. The results obtained by considering river restoration concepts in the design decision are expected to define projects that are more resilient, less expensive, and easier to maintain. Therefore, the framework developed here includes evaluating the effectiveness of the proposed measures, concerning the environmental and functional improvement of the fluvial system, by using the Urban River Restoration Index (URRIx) [
33]. As defined by the three conceptual pillar at the beginning of this section, the concepts of river restoration should be complemented by the use of sustainable urban drainage concepts, to control runoff generation and to reestablish (at least partially) the natural infiltration and retention characteristics that have been lost due to watershed urbanization.
At last, in this framework composition, the flood resilience component of a project is assessed by the Modified Flood Resilience Index (m-FResI) [
34], which involves comparing risks in the projected situation and in a situation of possible loss of efficiency in the proposed design alternative when an unexpected event surpasses the design reference. The situation that represents future stresses can vary, depending on the threats considered, ranging from climate changes to uncontrolled urbanization in an informal city growth path.
The general procedure proposed is composed of the following steps:
Initial Diagnosis—a detailed diagnosis of the watershed entails multidisciplinary aspects of urbanism, landscaping, and engineering, involving the following steps:
- -
The watershed is taken as the territorial planning and design unit; therefore, local solutions are not recommended, since they have the potential to transfer flood problems;
- -
Physical and environmental aspects are characterized, highlighting the vegetation cover, terrain slopes, climate variables, and fluvial network;
- -
Socioenvironmental and urban expansion aspects are also characterized: land use and occupation, consolidated urban area and future urban expansion areas, occupation of critical areas and informal settlements, open spaces, existing infrastructure, and deficits in providing public services;
- -
The evolution of urbanization in the watershed is mapped and its relationship with the degradation of the built environment is established;
- -
Past flood events are introduced in the analysis to shed light on cause–effect relations.
- -
Hydrodynamic mathematical modeling is used to represent current flooding drivers and patterns as identified in the conceptual relations established;
- -
Calculation of the FRI to quantify the damages generated by floods in the current situation, taken as reference for evaluating different design alternatives;
- -
Calculation of the current river environmental state by application of the URRIx, also as an initial reference value.
Establishment of the main conceptual/design guidelines for proposing more sustainable alternatives to manage the urban watershed and avoid floods—these guidelines should orient the various design actions.
Table 1 summarizes these guidelines.
In general, the project proposals should: (a) have a broad spectrum, respecting the proposed guidelines, encompassing environmental and urban aspects in the solution of flooding problems, based on a diagnosis to identify problems, conflicts, and potentials; (b) integrate with the urban project, creating an opportunity for urban revitalization and insertion of environmental values in the city, making use of the concepts of river restoration and sustainable urban drainage; (c) use measures distributed throughout the watershed; and (d) take full advantage of the system of open spaces in multifunctional layouts.
Assessment of design alternatives for flood control—basically, in this step, quantitative measures will be applied to find the most appropriate design arrangement:
- -
Generation of flood control alternatives;
- -
Recalculation of the FRI to evaluate the efficacy of the proposed controls;
- -
Recalculation of the URRIx to evaluate the improvement in the river functional state;
- -
Evaluation of the proposed solution in terms of resilience, by calculating the m-FResI;
- -
Adjustment of project variables until it satisfactorily responds to flood risk reduction, resilience increase, and river system improvement in an interactive process.
These three steps represent a general methodological contribution to evaluate different design alternatives for urban flood control, introducing flood risk and resilience concerns, as well as urban environmental elements.
However, to verify the behavior of the proposed method, this manuscript adopted a comparison approach, involving a case study analysis. After assessing flooding in the current situation, two different projects, with two particular and opposing concepts, were defined and tested using the proposed methods. The first approach solved the problem using a usual drainage design alternative, which encompassed minor drainage implementation, channel modifications, and an upstream dam. The second approach combined river restoration + sustainable urban drainage alternative, following the guidelines proposed in our work. Both projects were designed to completely solve urban floods in the current situation. Then, a future situation was introduced, where urban planning failed and an uncontrolled urban growth occurred. This future situation intended to stress the system and test the resilience of both design approaches. Therefore, the current situation, the usual drainage design alternative, and the river restoration + sustainable urban drainage alternative had their behaviors verified in this future scenario.
This methodological construction, therefore, assessed the behavior of both design concepts against environmental and resilience responses, surpassing the simple objective of controlling floods in the present and focusing only on hydraulic responses.
The case study chosen refers to an urban watershed in the metropolitan area of Rio de Janeiro, Brazil, in the city of Mesquita.
2.2. Supporting Tools
The set of procedures presented here depends, by definition, on the specific tools used in this work. The hydrodynamic modeling, risk calculation, and improvement in river quality and resilience do not exhaust all suggestions. These tools can be adapted or substituted by others. There is no impediment, for example, for the MODCEL model to be replaced by another computational tool, such as a 2D model. Below we present the tools used in this work.
2.2.1. MODCEL
MODCEL [
30,
31] is an urban flood model that integrates a hydrologic model, applied to each cell in the modeled area, with a hydrodynamic looped model, in a spatial representation that links surface flow, channel flow, and underground pipe flow.
MODCEL represents the watershed space, considering two-dimensional characteristics but using 1D equations. The representation of the watershed uses the concept of flow cells [
42], acting as homogeneous storage compartments, hydrologically transforming rainfall into runoff, and composing a calculation mesh that integrates the whole watershed area. This concept was initially developed to overcome computational limitations when simulating large flood plains. However, due to a modular construction, this concept can be very useful, even nowadays, to simulate complex systems where natural topography patterns, urban landscape, and hydraulic structures merge in a complex setting. MODCEL can describe elements of the natural landscape together with elements of the urban fabric (streets, squares, buildings, etc.), as well as storm drains and channels. Hydraulic structures like pumps, weirs, orifices, and flap gates are also represented. Each pair of cells is linked by different hydraulic relations (like the Saint Venant dynamic equation, and classic equations of weirs and orifices, for example). Thus, cells and links are the basic computational elements of MODCEL. Topographic and hydraulic representations of the physical reality are two core processes in MODCEL, and an interpretative preliminary phase determines how these elements are interrelated. As a result, the model offers water depths, discharges, flow velocities, and flood maps.
MODCEL uses the conservation of mass law and hydraulic relations as its main components. A detailed explanation of flow equations can be found in Cunge et al. [
43]. The water level variation in cell
i, at a time interval
t, is given by the continuity equation applied to that cell.
2.2.2. Flood Risk Index (FRI)
The FRI is a quantitative multicriteria index, combining subindices related to flood properties (hazard characteristics) and vulnerability (representing socioeconomic characteristics), as presented by Zonensein et al. [
32]. This construction tries to capture the main aspects of flood risks, combining flooding and its consequences. As an index, FRI does not represent deterministic relations regarding technical and socioeconomic aspects. Indirect relations are built to quantitatively measure the level of risk, summing up different aspects, initially considered in different scales, using different units. Therefore, before calculating FRI, its indicators are normalized, resulting in a value between 0 and 1. For example, the losses associated with damages to dwelling contents and structure are estimated to be proportional to the family income, in an indirect relation built that considers that amount of losses are proportional to the dwelling wealth. Health problems arising from waterborne diseases are considered to be related to improper sanitation conditions, which in turn, are related to lack of sewer systems or solid waste collection and disposal. The dwelling density is associated with the number of affected people, and so on.
The FRI is applied in a distributed way over the urban watershed, which is divided into small areas to adequately capture socioeconomic aspects and flood properties. This particular demand meets the cell concept, where the modeled watershed is divided into small compartments. However, the spatialized FRI values may be integrated to produce a single number.
The indicators used to reflect flood properties and vulnerability are presented and defined in
Table 2, jointly with the assumed weights. These weights were obtained by consultations with researchers of the Federal University of Rio de Janeiro. Weights are also an object of discussion and this aspect introduces subjectivity to the results of any multicriteria index. However, although this can be seen as a weak point of this type of method, if this aspect is known and adequately considered, this point can be transformed into an opportunity to reflect the decision-makers’ perceptions. In this work, we did not explore different weight possibilities or sensitivity. The main objective was to validate the general discussion and the research hypothesis formulated, using a wide framework whose results will be assessed in relative terms.
The final formulation of the FRI is shown in Equation (1), combining a weighted product of weighted sums. In this formulation, the risk is null only if one of the subindices (FP, regarding flooded properties; or C, regarding consequences to the city) is zero.
where:
- FRI:
Flood Risk Index (ranging from 0% to 100%);
- FP:
flooded properties subindex, representing hazard (ranging from 0 to 1);
- C:
consequences subindex, jointly representing exposure and vulnerability (ranging from 0 to 1);
- qi:
weight of subindex i (0–1), with i = FP or C.
- Ij:
indicator j (ranging from 0 to 1), where j responds to D = depth; DF = duration factor; DD = dwelling density; In = income per capita; IS = inadequate sanitation;
- pj:
weight of each indicator j (also ranging from 0 to 1).
2.2.3. Urban River Restoration Index—URRIx
This manuscript used an adapted version of the original methodology of URRIX, presented in detail in Veról et al. [
33]. The URRIx offers a quantitative measure for comparison of possible interventions, to evaluate and internalize in the design process the (possible) environmental improvement of urban watersheds in the design process related to interventions in the fluvial system. It considers the concepts of the river restoration approach in its composition.
Urban rivers are not frequently discussed in terms of possible river restoration. However, it is important to highlight and value actions that intend to improve the fluvial systems’ quality and the relation between the natural and the built environment, even if the results are limited. This is where URRIx can act, introducing an environmental concern when projecting actions affecting urban fluvial systems. The items that compose the URRIx formulation intend to assess: (1) the general state of the watershed, focusing on impervious rates, sanitation conditions affecting water quality, and possible urban occupations; (2) the fluvial connectivities; and (3) flooding. This approach includes urban interactions that are usually not considered in general river restoration assessment and also applies to the possibility of improving the procedure of choosing among different flood control alternatives.
Its formulation utilizes a weighted sum that considers the combination of effects, without permitting the absence of one of the indicators to invalidate the result of the index. The result ranges from 0 to 1 (the more critical areas are associated with lower values, while more preserved regions refer to the highest values). Indicators of distinct natures and units are normalized into a percentage scale, allowing operating them in a single formula.
The URRIx considers three subindices: general state of the watershed (GSW), connectivity (C), and hydraulic risk reduction (HRR). The general state of the watershed (GSW) encompasses indicators of permeability (), to evaluate the soil conditions regarding water infiltration; sanitation conditions (), which evaluates the collection and treatment of sewage and trash; and urban occupation of riverbanks (), related to the degree of occupation of riverbanks by structures. Connectivity (C) analyzes the ecological state of fluvial systems, considering the indicators transversal connectivity (), denoting the extension of the course able to freely overflow its banks; longitudinal connectivity (), associated with the capacity for continual downstream flow; and vertical connectivity (), related to the length of the river with the ability for water exchange with the soil (through the riverbed). Finally, the hydraulic risk reduction (HRR) subindex is coincident with its indicator (), which seeks to reflect the hazard component present in the hydraulic risk, i.e., it refers to the flood events that occur in urban areas, without directly or particularly assessing the consequences. The main objective is to evaluate the gravity of floods in an urbanized area resulting from any source, including minor drainage failure and excess surface runoff. As a support tool for mathematical modeling of flooding, we used the MODCEL software, mentioned before (item 2.2.1).
The URRIx is calculated by the weighted sum of the subindices, as presented in equation 2. Each of the factors considered has a weight, which is determined on a case-by-case basis.
where:
URRIx: Urban River Restoration Index (0 to 1);
GSW: general state of the watershed subindex;
C: connectivity subindex;
HRR: hydraulic risk subindex;
: weight attributed to the general state of the watershed subindex;
: weight attributed to the connectivity subindex; and
: weight attributed to the hydraulic risk reduction subindex.
2.2.4. Modified Flood Resilience Index (m-FResI)
The original FResI [
34] was designed to measure the behavior of a city area in terms of flood resilience by maintaining flood risks under control over time, evolving to a future reference setup where the current situation and the designed project are stressed by an unexpected event. In this way, the FResI intends to report a resilience value integrated on the watershed scale, comparing flood risk values in the future with their values in the present. Resilience, in this approach, will be the measure obtained by the capacity of the city to maintain controlled flood risks. The integrated values of FRI (discussed in the previous section) are taken as the basic input to calculate the proposed FResI values. The combination of inundation (representing hazard) with dwelling density and income per capita (representing values exposed) gives a measure of the resistance of the city to floods. The resistance maintained during a certain horizon of time gives a measure of the resilience of the system. Besides that, the combination of the inundation permanence (given by the duration factor of FRI) can measure resilience in regards to the capacity of the drainage system to recover its normal functions (effectively draining the city as soon as possible, after the rainfall event ends). This characteristic also relates to the interplay among flood control, public health, and good environmental conditions.
Resilience is tested when the system faces an uncommon and unpredicted adverse future situation, which was not taken into account in the design process. In this study, it was not expected that absolute values of flood resilience would be found.
Departing from these ideas, the original work of Miguez and Veról [
34] was adapted to a modified form, which is being proposed here. The main purpose of this modified index is to give a relative measure that compares the design alternative risk behavior in the future, when submitted to a stressing condition, with the risk behavior of the same design alternative as defined by the design reference condition. The difference between these two set-ups (project behavior in the future and project behavior in the present) is then compared with the evolution of the current situation to a future situation where no project was implemented (as if nothing was done to mitigate floods). The first difference refers to a new (and partial) increase of the risk in the future, after the implementation of the project. The greater this number, the less the resilience. So, to measure resilience, this number is taken as the complement to unity. Then, when dividing this number by the risk in the future if nothing is done, the importance of the risk mitigation (even when losing efficiency) is measured. Therefore, the m-FResI is presented in Equation (3).
where:
m-FResI: Modified Flood Resilience Index (ranging from 0 to 100%);
: Flood Risk Index considering the project in a future condition (ranging from 0 to 1);
: Flood Risk Index considering the project in the present condition (ranging from 0 to 1);
: Flood Risk Index considering ‘doing nothing’ in a future condition (ranging from 0 to 1).
The result obtained is between 0 and 1 and is presented as a percentage, between 0% and 100%, consistent with the FRI values. The higher the result, the better it is, which is equivalent to saying there is less loss of efficiency with the best absolute results.
3. Dona Eugênia Watershed: An Emblematic Case in the Metropolitan Region of Rio de Janeiro, Brazil
Late industrialization in Brazil led to a rapid growth of the urban population in an unplanned way, inducing the development of informal settlements with subhabitations and inadequate infrastructure. In many cases, the urbanization occupied areas that were naturally subject to floods. The lowland region of Baixada Fluminense, in the metropolitan area of Rio de Janeiro, is representative of this situation. One of its most important watersheds is the Iguaçu-Sarapuí, with approximately 726 km
2 [
44]. Originally, this watershed was occupied by agricultural activities and a system of dikes was implemented to reclaim wet areas. Later, after the expansion of the railroad system, several cities appeared near each station to support economic activities in the city of Rio de Janeiro. Mesquita is one example of these cities linked to railway expansion.
Mesquita has approximately 170,000 inhabitants, according to the 2010 Brazilian Census [
45]. The Human Development Index calculated for the city and reported by the United Nations Development Program in 2010 was 0.737, which placed Mesquita as the 850th on the list of Brazilian municipalities. It is a relatively low result, especially considering that the city lies in the second most important metropolitan area of the country. The main problems of the city can be summarized as: intense and irregular informal settlements on riverine areas; lack of vegetation in the urban reaches of the river; urban settlements in risk areas, including on river banks; parts of the main river run canalized underground; sedimentation occurs at various river stretches; discharge of sewage and solid waste into the river, with visible environmental degradation and health hazards; scarce infrastructure and degradation of the urban environment, contrasting with the preserved upstream areas. Due to the lack of adequate housing programs, there are many hill slopes occupied by low-income families in a disorderly way, without taking into consideration environmental risk factors.
Dona Eugênia Watershed has a drainage area of 18 km
2 [
44], and is presented in
Figure 1. Dona Eugênia River is about 10 km long—the first 4 km are located inside an environmental protection area called Gericinó/Mendanha, in the city of Nova Iguaçu, and the subsequent 6 km are in the city of Mesquita, where it crosses the urban area until its outfall, on Sarapuí River. Inside the environmental protection area, there is a park named Nova Iguaçu Natural Municipal Park, an area of 11 km
2, with an altitude between 150 m and 956 m, which is an important representative of the Atlantic Forest, with several examples of natural local flora and fauna. The population of Mesquita uses the area for leisure, enjoying the river and the fluvial ecosystem as a whole. Inside the park, there is a dam called Epaminondas Ramos (“A” in
Figure 1), used as a water supply in the past. Now it is deactivated because of the irregular discharge of sewage from illegal sites.
Regarding the use of the river by inhabitants, it is important to highlight that if, on one hand, we note the willingness of residents to have an environment with higher quality, on the other hand, the misinformation factor is evident, which does not allow them to realize that the river in a degraded state (and they also contribute to further degradation) is the same one in good condition in the environmental protection area that they enjoy for leisure on weekends.
To face flood problems in this watershed, the Water Resources Master Plan of the Iguaçu-Sarapuí Watersheds, in 1996 [
46], put major efforts into the adaptation of the channel network. Safe terrain quotas were defined for new urban developments and some areas were destined for reforestation actions, aiming to support the proposed interventions [
46]. In 2009, a complete revision of the plan [
44] introduced the concept of sustainable urban drainage, and considered a set of integrated actions focusing on the watershed environmental (partial) restoration. Nevertheless, the solution for the Dona Eugênia River in Mesquita still pointed to a laminating dam (“B” in
Figure 1), as proposed in the first study from 1996. This designed dam has a contributing watershed of 12.2 km
2, a crest at the 125 m elevation, and a discharge hole at the 105 m elevation with a diameter of 0.85 m. The available storage volume is approximately 150,000 m
3. This choice was a consequence of the dense urbanization of Mesquita city and the difficulty to act without affecting the already installed urbanization. This fact shows how an uncontrolled process of urbanization, without proper environmental concerns, can be harmful to the city life and can generate a heritage of flooding problems and consequent degradation that is difficult to reverse.
Finally, it should be noted in
Figure 1 that the Dona Eugênia Watershed has been divided into three cumulative reaches to allow evaluating river system changes along its course, mainly considering the URRIx application (see item 5). The division considers:
- ▪
Reach 1—the upper area of the watershed, near the environmental protection area and consisting primarily of natural forest areas;
- ▪
Reach 2—incrementally includes part of the older original urban area, including the city center;
- ▪
Reach 3—the whole watershed, adding the new urban developments at downstream areas and including a wetland near the river mouth.
4. The River Restoration Project
The river restoration project considered the reduction of the hydraulic risk, restoration of the hydrological and morphological characteristics (as much as possible), and improvement of water quality, also with actions in the urban area and urban–natural interface. So, the proposal would result in the improvement of the river ecosystem and the built environment. In particular, the focus of this project was flow control and spatial reorganization, recovery of riverbanks and reconnection with floodplains, maintenance of permeable areas, and composition of green corridors along the river, combining, whenever possible, a mosaic with the remaining natural landscape. Water quality was not treated directly. However, with the removal of direct sewage discharges into urban watercourses in some river reaches, the proposal also covers this item to some extent, although certainly not to the extent of the need for the watershed.
The project’s solutions were developed jointly by the authors.
Table 3 presents a framework for approaching urban flood and city restoration in Dona Eugênia Watershed and
Figure 2 presents the master plan, with the main project propositions. The study area was divided into six landscape design units with specific characteristics, for systematic integration of the watershed. This division was based on the different aspects of each reach, such as demographic density, land use, or natural environment, among others.
4.1. Border Park/Transition Park
The first landscape design unit is near the area of Nova Iguaçu Municipal Park. The proposed interventions would connect the city to the upstream EPA, in gradual form, through a fluvial corridor, called Transition Park. This area is a transition between the native green area and the low-density inhabited zone. The plan is to remove the dwellings in the first block along the river, which is marked by precarious occupation with little infrastructure. The residents would be relocated to nearby areas. The remaining occupation would become denser farther from the river. The implementation of a fluvial corridor would connect the two areas and provide a gradual transition between the green and urban areas. This would facilitate contact of the residents with the river, diminish the risk of risky riverside occupation, and reduce the discharge of wastes directly into the river, also creating space for leisure activities.
The solution would be complemented with a Border Park around the entire unoccupied area in the upstream region. This main objective of this park is to preserve the EPA and the upstream area of the Dona Eugênia River and prevent the spread of urban sprawl toward the Gericinó-Mendanha Massif. It is also envisioned to provide food for consumption and sale by the population from the planting of fruit-bearing species.
Figure 3 presents this solution.
4.2. Urban Open Spaces
As things stand now, the watershed has almost no open spaces for preservation measures. Thus, the combination of the hydraulic solution with landscaping elements, to configure multifunctional landscapes [
22], is an attractive solution. Along this landscape design unit, three places were identified that can act as detention reservoirs to buffer flows from the river during the high water season. They are a soccer field, an existing public plaza (
Brazil Plaza), and an abandoned area. All three of these areas are located upstream from the commuter rail line and are identified in
Figure 4.
4.2.1. Soccer Field
The proposal calls for lowering the soccer field by 1.86 m in relation to its original level, so it can function as a detention reservoir in high water periods. The water would exit the reservoir through a large pipe connected to the downstream reach. The river would be widened in this segment to handle the water from the reservoir in case of upstream overflow. The
depth x area x volume curve of this reservoir is presented in
Table 4, where the functional strip of the reservoir is indicated (in bold).
4.2.2. Brazil Plaza (or, in Portuguese, Praça Brasil)
The project also envisions the implementation of another detention reservoir, through lowering an existing public plaza called Brazil Plaza. It would not fill with water during light precipitation, would start to be flooded during stronger and/or more prolonged rainfall, and would fill almost totally during heavy rainstorms (design precipitation).
This configuration facilitates the multifunctionality of the plaza, which would be unaffected by rain most of the time, providing a landscaped space for leisure, so that it would only require cleanup after sporadic events with large magnitude. The
depth x area x volume curve data of this reservoir are presented in
Table 5, with a highlight on the functional strip of the reservoir (in bold).
4.2.3. Municipal Government Complex
The region where the buildings of the Mesquita Municipal Government are located, in the downtown region, would be beautified through landscaping in the front areas, which would also increase infiltration. The reach of the river in this region, which is now channeled, would be opened to allow it to overflow on the left bank, where there is uninhabited land. The final
depth x area x volume curve data are reported in
Table 6, where the functional strip of the reservoir is highlighted (in bold).
4.3. Mesquita City Center
The river segment that traverses the downtown region, with the oldest urbanization, is the most critical, since there are many houses in irregular and risky situations that together act to channel the river, besides discharging sewage and trash into it. The project envisions the widening of this river segment, with the removal of the irregular dwellings and relocation of the people to smaller nearby areas through verticalization. The cleared riverbank area would act as a fluvial park, with temporary storage capacity. The park, at the lowest level, would be integrated with the urban landscape, acting as a floodplain of the Dona Eugênia River and sharing space with the new residential buildings. The total storage volume would be 35,466 m
3, with a surface area of 14,082 m
2 at the new depths and an area of 46,827 m
2 at the upper limit before overflowing to the street.
Figure 5 presents an image of the region today and the proposal for river widening, with relocation of residents.
4.4. A New Perspective for the Fluvial System
The proposal in this landscape design unit is for the removal of irregular dwellings that exist along the river (
Figure 6a). It was not necessary to introduce modifications in the model since the low density does not provoke obstruction of flow and by the fact that no lowering would be introduced in this segment.
4.5. Wetland
The establishment of a wetland area is proposed for the last landscape design unit, near the confluence with the Sarapuí River, taking advantage of the lower levels in the area. The total storage volume in the range that accompanies the river corresponds to 56,390 m
3, referring to storage covering an area of 27,472 m
2 at the depths indicated in
Figure 6b. The total area of the park would be approximately 148,544 m
2 (as detailed in
Table 7). The
depth x area x volume curve data of the reservoir proposed for the mouth opening into the Sarapuí River are presented in
Table 7, with a highlight on the functional strip (in bold).
A summary of the whole river restoration proposal, also available as
Supplementary Materials, can be described as follows, in a few steps:
Diagnosis of the watershed in terms of urban growth, flooding, and environmental degradation.
Study of the different landscape design units of the river, to understand the needs and challenges of each one (the river crosses three areas with very different characteristics: the transition from a natural to a sparsely settled urban area; the central part of the city, with old urban development; and a new part of the city, with contrasting structures—formal and informal settlements.
Proposal of solutions that aggregate aspects of urban design and enhancement of the urban environment supported by river restoration and sustainable urban water design.
Creation of a fluvial corridor connecting the first to the second part of the watershed, approximating the EPA to the first urbanized reach.
Proposals for the reorganization of the urban space, using the river as a design reference, defining riverine protection areas, reconnecting the river to its floodplains, alternating the use of urban fluvial parks with more natural areas, and also acting with distributed sustainable urban drainage actions to minimize the impact of urban runoff.
4.6. Sustainable Urban Drainage Actions Distributed in the Watershed
To complement the set of measures specifically proposed, it is also important to control the flows generated in the watershed in order to reorder the hydrological functioning to guarantee truly sustainable conditions over the long run. We, therefore, suggest, to complement the measures proposed, the introduction of controls on imperviousness and land use, by preparing a master plan with the definition of minimum values of permeable areas to be maintained. Therefore, action at the lot level can maintain minimum green areas, reduce soil imperviousness, favor infiltration and water retention, and even allow the disconnection of some of the impervious lot areas from the drainage system, so that the property owners have to deal with at least part of the runoff flow generated. Among the possibilities for action in this context, the following techniques were chosen and simulated:
Green roofs: the application of green roofs was specified on all structures where this is possible—houses that have slab roofs or other easily adapted roofing material (excluding clay tiles).
Pervious pavements: to increase permeability, the application of pervious pavements was proposed along all the sidewalks throughout the watershed, but excluding streets, even those with light traffic, to avoid problems of insufficient support capacity.
Microreservoirs: to enable storage of part of the rainfall volume in the Dona Eugênia Watershed, the installation of a microreservoir with a volume of 2 m3 in each lot of the watershed.
The mathematical modeling was developed based on the current situation, with the introduction of the pertinent modifications to simulate the proposed techniques:
To consider the implementation of permeable pavements and green roofs, a reduced runoff coefficient was applied;
To consider the implementation of microreservoirs, a reduction of the design precipitation was applied.
5. Results
The results are presented in the following items, first considering each alternative in the present, then presenting a flood resilience assessment for a future stress situation. The complete set of results is extensive, but this broad picture intends to show, first, how different design approaches can solve flooding problems in the present, and second, how the same approaches can respond to future challenges in regards to flood resilience.
The current situation is presented as reference. The design alternatives are then separately shown, solving the current flooding problem (flood levels + flood risks), already presenting the environmental gains using the URRIx. At last, the behavior of the same alternatives is tested in a hypothetical future, where urban saturation occurs, stressing the design premises and allowing the calculation of resilience responses. This construction was intended to verify the postulated research hypothesis.
5.1. Current Situation (CS)
The current situation (CS) represents the flood behavior in the watershed as it happens today when submitted to a rainfall event with a 25-year return period (RP). This situation was taken as a reference for comparisons with the proposed design alternatives. The diagnosis process was supported by hydrodynamic modeling, using MODCEL. The calibration process is the first step to guarantee the confidence of the model and it considered the available information, referring to discharges at two control points [
44], as presented in
Table 8, and a spatial representation of the most significant flooding points built with information given by residents. The critical points are the city center, where the city hall is located; and the areas along and upstream of the railway and at the river mouth (see
Figure 1).
The flood map obtained for the current situation is presented in
Figure 7a. According to the results, flooding in the municipality of Mesquita is critical in several areas, coinciding with observed records of frequent floods. Two complementary processes were found: both the major and the minor drainage systems fail. The mathematical model results showed areas with water levels that reach more than 1.00 m in some places. The city center is heavily affected. Other critical points are associated with areas along the Dona Eugênia River channel, mainly near the city hall; areas upstream of the railway, where it acts as an obstacle to surface runoff; and the vicinity of Via Light Highway. A short movie showing the flooding event mapped by the hydrodynamic mathematical modelling is available as
Supplementary Materials.
The FRI was applied to the Dona Eugênia urban watershed, using socioeconomic information from the last census, carried out in 2010 [
45], and flood characteristics mapped with MODCEL. The unoccupied upper parts of the watershed did not enter the calculation since there is no exposure there.
The subindices of flood properties (FP) and consequences (C) received equal weights (0.50 each) because they were considered to have the same importance in the risk composition. However, the weights attributed to each indicator of the subindices considered the degree of importance of each one, according to our interpretation. It is important to stress that weights can be defined differently, according to the decision-maker’s interpretation. However, discussing the weights in detail was not the objective of this work. Given a particular set of weights, all the discussion will progress according to this particular interpretation, but the relative values among the different alternatives will help build our arguments to support the research hypothesis, indicating that sustainable urban drainage and river restoration approaches can combine synergistically, as well as showing the potential of this assessment framework. All the weights are presented in
Table 9.
In the subindex FP, the maximum water depth reached by the flood was considered more important than the duration factor by a ratio of 2 (0.67) to 1 (0.33). Concerning the subindex C, the residential density, which indicates the number of people and real estate at risk, was taken as the main factor for assessing this risk. The income per capita, which indirectly attributes an economic value to the losses, was adopted as the second most important factor. Finally, the condition of inadequate sanitation, which is related to public health, received a much lower weight, almost as merely a fine adjustment, considering the apparent fragility of the IBGE data to characterize this condition. Sanitation conditions can assume a critical role in public health problems, but the census information seems to be only barely representative of reality (census data show a much better situation than reality mapped by field visits). For example, houses located on the riverbanks that empty sewage directly into the river were considered by the census as presenting adequate sanitation, just because sewage was removed from homes. In the IBGE variables, it is not possible to distinguish between the discharge of sewage in an appropriate network or a stormwater system. Thus, only the most critical cases of sanitation are identifiable. Therefore, this observation led to a sharp reduction in the weight of this indicator, so as not to distort the index. The FRI results are presented in the map of
Figure 7b, where the following risk classification was adopted: high (81–100%), medium–high (61–80%), medium (41–60%), medium–low (21–40%), and low (0–20%). It is important to say that this set of weights is maintained consistently throughout this work.
It is clear from the map that most of the watershed presents a relatively low risk (what is expected, due to higher or green areas that compose the whole landscape), in contrast to the central area of the city and its surroundings, which presents a tendency of higher risks. In the city center, the risk is mainly classified from medium–low to medium–high and high. This is the urban region that concentrates the highest flood depths, as already verified. Besides, it is also the region with the highest residential density and consequent exposure. There are also some areas in the urban watershed where FRI values are classified as medium–high, medium, and medium–low risk. These values are influenced, in general, by the water levels resulting from failures in the minor drainage system. On the east side of the railway, the income per capita indicator also influences the FRI upward. This area has the highest per capita income in the watershed. According to the FRI structure, those who have more income have assets with greater value subject to lose. The average value for FRI in the current situation shows a result of 15.5% for the urban watershed and 30.4% for the city center. In short, average FRI values are not that high, but locally some areas are very critical in the city center and its vicinity, especially upstream of the railway line.
The URRIx, constructed to indicate the environmental state of the urban river system, has an integrating character (representing the watershed upstream of the reference point considered) and does not allow the construction of maps. The weight distribution assumed equal values of 0.33 for each of the three subindices in this study. Regarding the sanitation conditions indicator, the worst situation was always considered (between inadequate sewage and waste conditions), so there was no double counting of these items. All the weights of any of the proposed indices, as previously said in the risk discussion, can be modified by the decision maker, but we are not exploring this discussion in this work.
Considering that the Environmental Protection Area corresponds to almost 50% of the total area of the watershed, the URRIx indicators in the first reach are very close to 1, consistently showing its the near-natural conditions. Since the reaches are cumulative, the weight of the Environmental Protection Area in the final value of the URRIx has a large impact, demonstrating an average value of the river that does not match reality in the urban areas of Mesquita. In this context, for a better representation of the urban reach,
Figure 8 presents two graphs: (c) one with the results for the entire watershed, as defined by the original URRIx formulation, and (d) another with the results corresponding to the urban area of the watershed (reaches 2 and 3), discounting upstream positive effects. In the current situation, the whole watershed presents a result equal to 0.64, while the result in the urban center is equal to 0.46. The individual results of each subindex decreased from reach 1 to reach 3, indicating that the introduction of urban areas in the calculation generally produces a significant negative impact on the index as a whole. When considering only the urban reaches (2 and 3) of the watershed, the GSW subindex presents very close results (reach 2 equal to 0.44 and reach 3 equal to 0.43). The C subindex presents an increase from reach 2 to 3 (varying from 0.31 to 0.39), because the downstream reach of the river still preserves some natural characteristics (near its mouth), different from reach 2, where the river is mainly canalized., and the HRR subindex decreases from reach 2 to 3 (from 0.74 to 0.56).
5.2. Design Alternatives to Mitigate Current Floods
In this section, the obtained results are presented for two design alternatives intending to face flooding: the usual drainage design (Alt.UDD) and the river restoration + sustainable urban drainage (Alt.RR+SUDS). Both conceptions were developed to solve the problems of the current situation from the hydraulic point of view. However, risk assessment and a measure of environmental benefits for the urban river system and for the city itself were added to the design discussion, thus, creating two other evaluation parameters.
5.2.1. Usual Drainage Design Alternative (Alt.UDD)
The usual drainage design alternative (Alt.UDD) considers the construction of an upstream dam to control floods downstream in the city of Mesquita. Minor drainage problems were also corrected.
Figure 8a presents the flood map and
Figure 8b presents the FRI map obtained for this alternative.
Figure 8c,d present the URRIx graphs.
This alternative adequately controls the river flow, keeping it inside its channel. Consequently, minor drainage can work properly and positive results also appear outside the main channel. The critical flooding area problems are solved. In general, the result is effective, leaving very few flooding points in the watershed as a result of excess of runoff in places where minor drainage still fails locally.
Consequently, the FRI map shows that the dam project fulfills its function of controlling floods and avoiding risks since there is almost no city exposure to the hazard. In terms of flood risk representation, the risk goes from high and medium–high to low (in fact it goes almost to zero). The values associated with the subindex FP reduced in response to the dam effects, influencing the change in the risk classes, and practically eliminating the hazard. FRI is equal to 0.7% in the urban watershed and 0.4% in the city center. These results show that the risk is controlled and reduced to nonsignificant levels.
Regarding the URRIx results, it is possible to note that the dam, since it acts only to cushion river flows, fails to score positively in several indicators. Considering the capacity to recover the river quality, the dam would only be competitive in the final value of URRIx if flooding were the main problem of a watershed already in good condition.
In this alternative, URRIX presents a general result equal to 0.77, and specifically in the urban center, equal to 0.59. The individual results of each subindex decrease from reach 1 to reach 3, similar to what happened in the current situation. When considering only the urban center, the GSW subindex presents very close results (with reach 2 equal to 0.44 and reach 3 equal to 0.43); the C subindex presents an increase from one reach to the other (from 0.29 in reach 2 to 0.38 in reach 3), and the HRR subindex decreases from reach 2 to reach 3 (from 0.98 to 0.96). The improvement of the URRIx integrated value is due to the hydraulic risk reduction. In environmental terms, the connectivity is worse and the general watershed state is the same. Therefore, the dam is a hydraulic work with only partial action over the general problems of the watershed, but efficient to control floods.
5.2.2. River Restoration + Sustainable Urban Drainage Alternative (Alt.RR+SUDS)
The combination of river restoration and sustainable urban drainage measures (Alt.RR+SUDS) configures the approach proposed as the main conceptual contribution of this work. Sustainable urban drainage measures are intended to recover the characteristics of the natural water cycle, reorganizing the surface runoff in the watershed scale, while river restoration measures seek to recover the relationship between the river and the city while controlling floods associated with major drainage failures.
Figure 9a,b present, respectively, the flood map and the FRI map for this alternative.
Figure 9c,d present the URRIx graphs. The flood map indicates almost no flooding, showing that both approaches, Alt.UDD and Alt.RR+SUDS, are equivalent in terms of flood control.
Consequently, because of the hazard elimination and similarly to the previous alternative, FRI presents values near zero (FRI = 0.4% in the urban watershed and FRI = 0.1% in the city center). Due to the possibility of opening space for temporary storage while reconnecting the river to its floodplains, the minor drainage problems of the surrounding areas would also be solved, while new green areas could be established. By making room for the river through removing irregular structures located along the riverbanks and in the nearby floodplains, the irregular sewage connections, which exist in the current situation, could also be reduced. Thus, there is an improvement in the sanitation conditions of this reach, and unlike the previous alternative, there are several side benefits.
Figure 9c,d show the consolidated final values of URRIx for both the whole watershed and the urban watershed in Alt.RR+SUDS. This is the alternative that provides the best results both for the river and the watershed.
As expected, the URRIx, which was built to measure the river restoration actions as a way of measuring the improvement of the fluvial environment itself, provides higher (and better) values for this alternative. In this comparison, the dam is not able to fulfill environmental or other wide urban demands. Sustainable urban drainage measures, aiming to reorganize the urban water cycle, score positively in reducing the imperviousness of the watershed and in the flood control indicator, in a distributed manner. Besides, this kind of measure can improve livability locally, with rain gardens, green roofs, and other actions that can positively impact the built environment. The URRIX presents a result of 0.76 in the third reach of the urban watershed, in contrast to 0.46 for the CS and 0.59 for Alt.UDD. All URRIx subindices improve in this alternative. Regarding the indicators, the only one that does not change is the longitudinal connectivity (LC).
Another positive point that can be highlighted in favor of this alternative refers to the spatialized distribution of storage volumes, in different scales, to control floods. Distributed actions over the watershed tend to introduce a higher resilience to the system, providing a certain level of redundancy when compared to a single and greater structure, as it was the case of the dam. This expectation will be explored in the next alternatives, regarding flood resilience assessment.
5.3. Flood Resilience Assessment (FRA)
As a way of assessing the flood resilience of the project, an adverse future situation, capable of upsetting the proposed solution and different from the design references, was introduced to map the response of the proposal to this new unforeseen condition. In the context of this work, a hypothetical situation of urban saturation was considered in the urban area of the Dona Eugênia Watershed. In this situation, the imperviousness rates are assumed to grow significantly. The situation of urban saturation was chosen because this watershed has a history of spontaneous (and, many times, irregular/informal) urban growth. Therefore, the resilience scale was proposed to compare the results given by the project alternatives submitted to urban saturation. This procedure completes the general framework conceived to show the potential of combining river restoration and sustainable urban drainage concepts.
5.3.1. Current Situation Evolving to Urban Saturation (FRA_US)
To simulate the hypothetical situation of urban saturation, in which the imperviousness grows significantly in the urban area of the watershed, we adopted a runoff coefficient equal to 0.90 for all areas that are already urbanized in the current situation.
Figure 10a presents the flood map,
Figure 10b presents the FRI map, and
Figure 10c,d present the URRIx graphs for the current situation evolving to urban saturation.
This alternative presents flooding in some new places in addition to those indicated in the current situation. The city center continues to be the most critical area, with water levels reaching more than 1.50 m in some places. There is spreading of flooding to the more downstream region, after the railway line, which was expected considering this is an area with more controlled urbanization in the current situation and is the one that suffered the greatest impact of the increase in runoff in the uncontrolled urbanization simulation. A short movie showing the flooding event mapped by MODCEL is available as
Supplementary Materials. The FRI values are also higher in this area, for the same reasons. In general, the results obtained range from low to high, with the latter only found in the city center. The value of the integrated FRI for the urban watershed is equal to 20.7%, and for the city center it is 37.6%, confirming worse results in comparison with those found in the CS (15.5% and 30.4%, respectively).
Regarding the results obtained for the URRIx, the most significant changes occur in the GSW subindex, which reflects the permeability of the watershed (and is measured in function of runoff), and the HRR, whose value increases due to the increased flooding in the watershed. The values obtained to the subindex GSW decrease in relation to the CS, mainly due to the indicators of permeability and sanitation conditions. In the evaluation of the urban watershed, the GSW decreases in reach 3, from 0.43 to 0.32. The values obtained for HRR also decline in the urban watershed, from 0.56 to 0.45 in reach 3. Finally, the value of URRIx falls from 0.46 to 0.39 in reach 3, indicating an additional loss of environmental quality in a situation of uncontrolled urbanization. The reach 1 would not change, since it flows through an environmentally protected area of the watershed, so no modifications were considered in terms of expansion of urbanization and subsequent saturation. Once again, this scenario is the basic reference for comparisons (in what regards design alternatives behavior) and shows the evolutionary trend of the current situation if nothing is done.
5.3.2. Usual Drainage Design Alternative under Urban Saturation (FRA_Alt.UDDUS)
The usual drainage design alternative under urban saturation (FRA_Alt.UDD
US) considered the construction of the dam, exactly as presented in Alt.UDD, but jointly with the hypothetical and unforeseen situation of urban saturation. The results are presented in
Figure 11.
In this alternative, the dam construction is no longer effective in correcting the current situation, but the results are still better than that observed in the evolution to urban saturation when no measures are taken to correct inundations. Flooding now occurs in the city center and the downstream region of the watershed due to overflows of the river, with average water levels up to 0.50 m (in the affected reaches), and more than 1.50 m in some downstream points. The response of the FRI for this alternative also indicates aggravation in these same reaches, with the return of flooding, with values ranging from medium–low to high, with the preponderance of medium. The FRI value is 5.8% for the urban watershed and 11.1% for the city center, indicating significant worsening compared to the current situation (0.7% and 0.4%, respectively), but still much better than in the do-nothing alternative (Alt.US).
The URRIx shows the worsening of this alternative in relation to Alt.UDD, with the URRIx declining from 0.59 to 0.52 in reach 3 of the urban area. This is mainly explained by the reduction of the indicators of permeability, sanitation conditions, and HRR, whose values are intrinsically related to runoff.
5.3.3. River Restoration + Sustainable Urban Drainage Alternative under Urban Saturation (FRA_Alt.RR+SUDSUS)
In the river restoration + sustainable urban drainage alternative under urban saturation (FRA_Alt.RR+SUDS
US), the level of imperviousness also would increase, but the sustainable drainage measures (permeable pavements, green roofs, and microreservoirs), acting on the source, help to avoid the excess runoff generation.
Figure 12 presents the results.
In terms of flooding, even in an uncontrolled urbanization scenario, the solutions adopted would have a positive effect, keeping the watershed practically free from flooding. In the risk evaluation, the combination of the measures for river restoration and sustainable drainage present the best results, maintaining the results of the FRI at levels practically equal to zero (FRI = 0.9%), including in the most critical region of the watershed (central area, FRI = 0.8%). The proposed project would be able to continue keeping the river within the channel.
According to the URRIx analysis, this alternative produces a result of 0.71 in the third reach of the river, the same value for the same reach in the Alt.RR+SUDS scenario, i.e., without losing value. A comparison of this result with that of Alt.US (URRIx = 0.39) shows that the project would be effective to improve the watershed.
Table 10 summarizes the FRI results for all the alternatives, both for the urban watershed and the city center, while
Table 11 presents the URRIx results, considering both the Dona Eugênia Watershed and the urban watershed of Mesquita. All the calculations for FRI, URRIx and m-FResI can be seen in the excel files available as
Supplementary Materials.
Using FRI results, it is possible to build the m-FResI and observe how the different alternatives perform in terms of flood resilience in a future scenario stressed by urban saturation.
Table 12 summarizes the results obtained for FRI and m-FREsI in the urban watershed and also the city center, considering all the alternatives. The FRI results for the future condition of urban saturation are superior to those of the present situation in all alternatives, as expected. The Alt.RR+SUDS is the best alternative to adapt and respond to future challenges, so it is the most resilient. This result is closely related to the combination of positive effects distributed in the watershed, which come from sustainable urban drainage, and those acting in the river corridor, which also allow for an increase in storage capacity along the river course and control of land use in the river vicinity.
5.4. Results Summary
In this section the results obtained from the application of the proposed framework are summarized, intending to highlight and interpret the main results.
Table 13 shows the results of FRI and URRIx obtained for the current situation and the design alternatives considered, as well as the FRI, URRIx, and m-FResI results in urban saturation, referring to the urban watershed. The city center results are not brought to this table, because it reproduces the same results, although they are relatively worse when compared to the urban watershed. It is possible to note that both alternatives can solve the flood problem in a controlled urban situation, but the Alt.RR+SUDS brings wide benefits, improving urban and environmental conditions synergically. When looking for a resilient solution, the potential of combining RR+SUDS shows a great advantage, facing future challenges almost without losing functionality.
6. Discussion
Two different design concepts were developed to control flooding and compared with each other by applying the method proposed in this study. One alternative considers the usual drainage design (Alt.UDD) and the other relies on concepts of river restoration and sustainable urban drainage (Alt.RR+SUDS). For correction of the current situation, both solutions were designed to resolve the problems completely, leading to virtually zero flooding and consequent risks. However, Alt.UDD focuses only on the hydraulic results, while Alt.RR+SUDS would bring environmental benefits to the river and city, as mapped for the URRIx. Then, the application of the m-FResI confirmed the superiority of the Alt.RR+SUDS, which would lead to greater resilience, maintaining positive results for a longer period, even when subject to a situation of urban saturation stress.
The Alt.RR+SUDS, thus, would be effective not only in reducing the flooded areas; it would also restore the natural characteristics of the fluvial system, with benefits to the river system and the city itself. The measures introduced would deal with the problem through an integrated approach, focusing on distributed actions to restore, as much as possible, the capacity of infiltration and storage of the watershed, as well as the hydraulic functions of the river and the storage areas of its floodplains. The results found here allow suggesting that urban development should be carried out by considering the introduction of measures to reduce hydrological impacts and require orderly land use in order to minimize degradation of the watershed as a whole, including the perspective of sustainably growing over time.
An interesting observation is that the results obtained for the scenario of future saturated urbanization, without any flood control intervention (FRA_US), are near the ones of the current situation (CS), reflecting the watershed’s history of disorderly growth and low investment in sanitation infrastructure.
In conceiving projects for flood control, engineers, architects, urban planners, and landscape designers need to interact and pay heed to quantitative evaluation, which can support the final definition of the most suitable design for each area, combining sustainable flood control, river restoration, and urban revitalization to achieve greater urban resilience.
7. Conclusions
There are several possibilities to design an effective flood control project facing a predefined situation (usually reversing a negative present condition related to a design reference event). However, flood control is not an isolated problem—it is usually related with degraded urban rivers and urban areas with low quality of life. Besides that, flood control over time may include future challenges, like uncontrolled urbanization trends and urban sprawl, possible climate changes, and so on. This fact implies that flood risk and resilience should be assessed and integrated into the design process. In this context, we established the hypothesis that a combination of measures related to sustainable urban drainage systems and the river restoration approach could act in a synergic way, efficiently solving urban flooding, but also restoring river environmental values and retrofitting urban areas. Sustainable urban drainage measures can reorganize the generation of flows in the watershed, which has already been severely modified by urbanization, and create opportunities for infiltration and spaces for the temporary runoff storage, giving support to river restoration actions in the fluvial corridor. On the other side, these river restoration actions can offer storage volumes to the drainage system, by reconnecting rivers to their floodplains.
To verify this hypothesis, this study also presented a methodological framework to evaluate interventions for urban flood control, seeking to expand the traditional evaluation of projects. This expanded analysis considers not only reducing flood levels but, in an integrated way, it considers the flood risk, the possibility of urban river restoration, and the seeking of increased resilience, offering a more complete method for deciding between design alternatives, where the solutions necessarily integrate demands for preservation of the natural environment with improvements in the built environment.
This framework is composed of a hydrodynamic mathematical model and three multicriteria indices: the Flood Risk Index (FRI), to consider socioeconomic aspects; the Urban River Restoration Index (URRIx), to assess improvements in the fluvial environment and its interaction with the urban environment; and the Modified Flood Resilience Index (m-FResI), to evaluate the resilience of the proposed solution in response to future stressors. We believe the proposed method, by addressing facets of the natural and built environments at the same time, provides better quantitative indicators to guide project designs and decisions. It is also an adequate structure to verify the proposed hypothesis.
This method was applied to the Dona Eugênia Watershed, in the metropolitan region of Rio de Janeiro, Brazil. Under the current conditions, the problem of flooding in the watershed affects important parts of the city of Mesquita. The mathematical modeling indicated flood depths between 0.50 m and 1.50 m, considering a return period of 25 years, and confirming reports of residents.
The most suitable design alternative will probably be composed of a set of interventions, combined to achieve a series of technical, economic, social, and political objectives, while respecting the particular restrictions based on the local characteristics as well as budget constraints. However, to advance in the discussion proposed in this research, two project alternative conceptions were presented in this work. The first alternative developed considered the usual drainage design (Alt.UDD), focusing on the establishment of a large upstream dam and corrections of channeling, while the second alternative combined the concepts of river restoration with sustainable urban drainage (Alt.RR+SUDS), as suggested by the formulated research hypothesis. While Alt.UDD concentrated only on the hydraulic result, the Alt.RR+SUDS also brought environmental benefits to the river and city. The evaluation of these two alternatives, using the new framework also introduced in this work, showed that the Alt.RR+SUDS would be better at controlling future risks, by enhancing resilience and offering collateral benefits to the fluvial and urban settings, confirming the research hypothesis.
Additionally, as a side contribution to the conceptual analysis, the proposed framework was found to be an efficient method to rank design alternatives and it can be replicated in similar cases of urban flooding. In the practical case of the Dona Eugênia River, it is likely the dam will be built, since it is included in the flood control plan developed by the state government. However, this does not invalidate the need for river restoration actions, which can be used together with housing policies for the relocation of the people living along the riverbanks to nearby areas and creation of new open spaces, such as urban or natural parks, connected with the existing upstream protection area and shaping an integrated environmental network. Additionally, the foreseen actions to improve the microdrainage system would be fundamental to deal with the excess surface runoff, but this would also discharge more water in the river, which needs to be prepared to receive the added volume. In this context, measures to locally control runoff generation, which are typical elements of the concept of sustainable urban drainage, would be very useful and effective. It would be utopian, however, to expect an immediate large-scale public project or to imagine massive voluntary adhesion of the house owners to these ideas. This would require long legal battles for the exercise of eminent domain and payment of compensations. However, it would be workable to introduce legal controls on future structures and zoning laws to order future developments, and possibly to establish tax benefits for the residents of existing structures to adapt them. This would be a long-range structuring project. All the actions would also be limited by budgetary constraints, so they would have to be spread out in time so as not to upset the public-sector financial balance.
This integrated project needs to be discussed in a multidisciplinary process, with the participation of engineers, architects, urban planners, and landscape designers, to recognize the city’s needs and the historic process of its development, evaluate questions of orderly land use, and incorporate proposed solutions for housing problems, considering the cultural aspects of the communities that coexist with the river, so that the final project can be appropriate for these communities. Other experts, such as biologists, chemists, social scientists, educators, and communication specialists, among others, would add valuable input to these discussions, with specific roles. This is a frequent premise in proposals for sustainable urban drainage and river restoration. This collaboration would aim to generate public acceptance of the proposed measures, to integrate the city with the river and its watershed to achieve a sustainable solution.
However, all these possibilities are possible only if they are accepted as a viable and useful way, which is the main intention of this research work. The confirmation of the research hypothesis helps to bring urban river restoration into the practical discussion in the municipalities’ agenda. Moreover, the proposed framework can give quantitative contours to this discussion.
At last, some recommendations are suggested for the continuity of this work. Three multicriteria indices were used to support the analysis, and all of them used weights. An important step to consolidate the use of these indices refers to a critical evaluation of the weights chosen and the sensitivity analysis of these weights, to verify the robustness and coherence of the proposal.
Another recommendation to attain a more comprehensive framework is to apply the hydrodynamic simulation to a shorter return period (5 or 10 years), which would be more compatible with the functioning of the watershed at the microdrainage level. The use of a 25-year return period as the benchmark would mean penalizing the microdrainage systems. This complementary simulation would be useful to plan local interventions to correct the also local minor drainage flaws. Additionally, it would be important to improve the method by incorporating an economic analysis of the proposed alternatives. In this case, longer return periods could also be evaluated to estimate the probabilities associated with the losses caused by extreme events with heavier rainfall, introducing the analysis of residual risks in this framework.

 ,
, 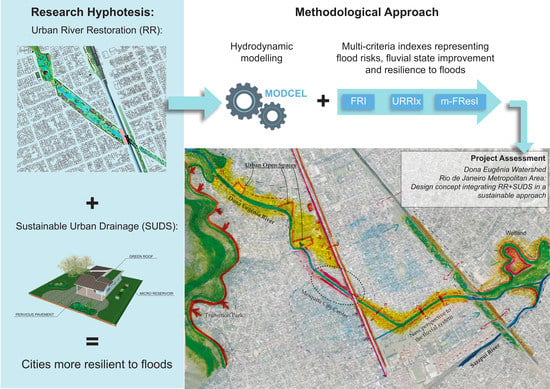


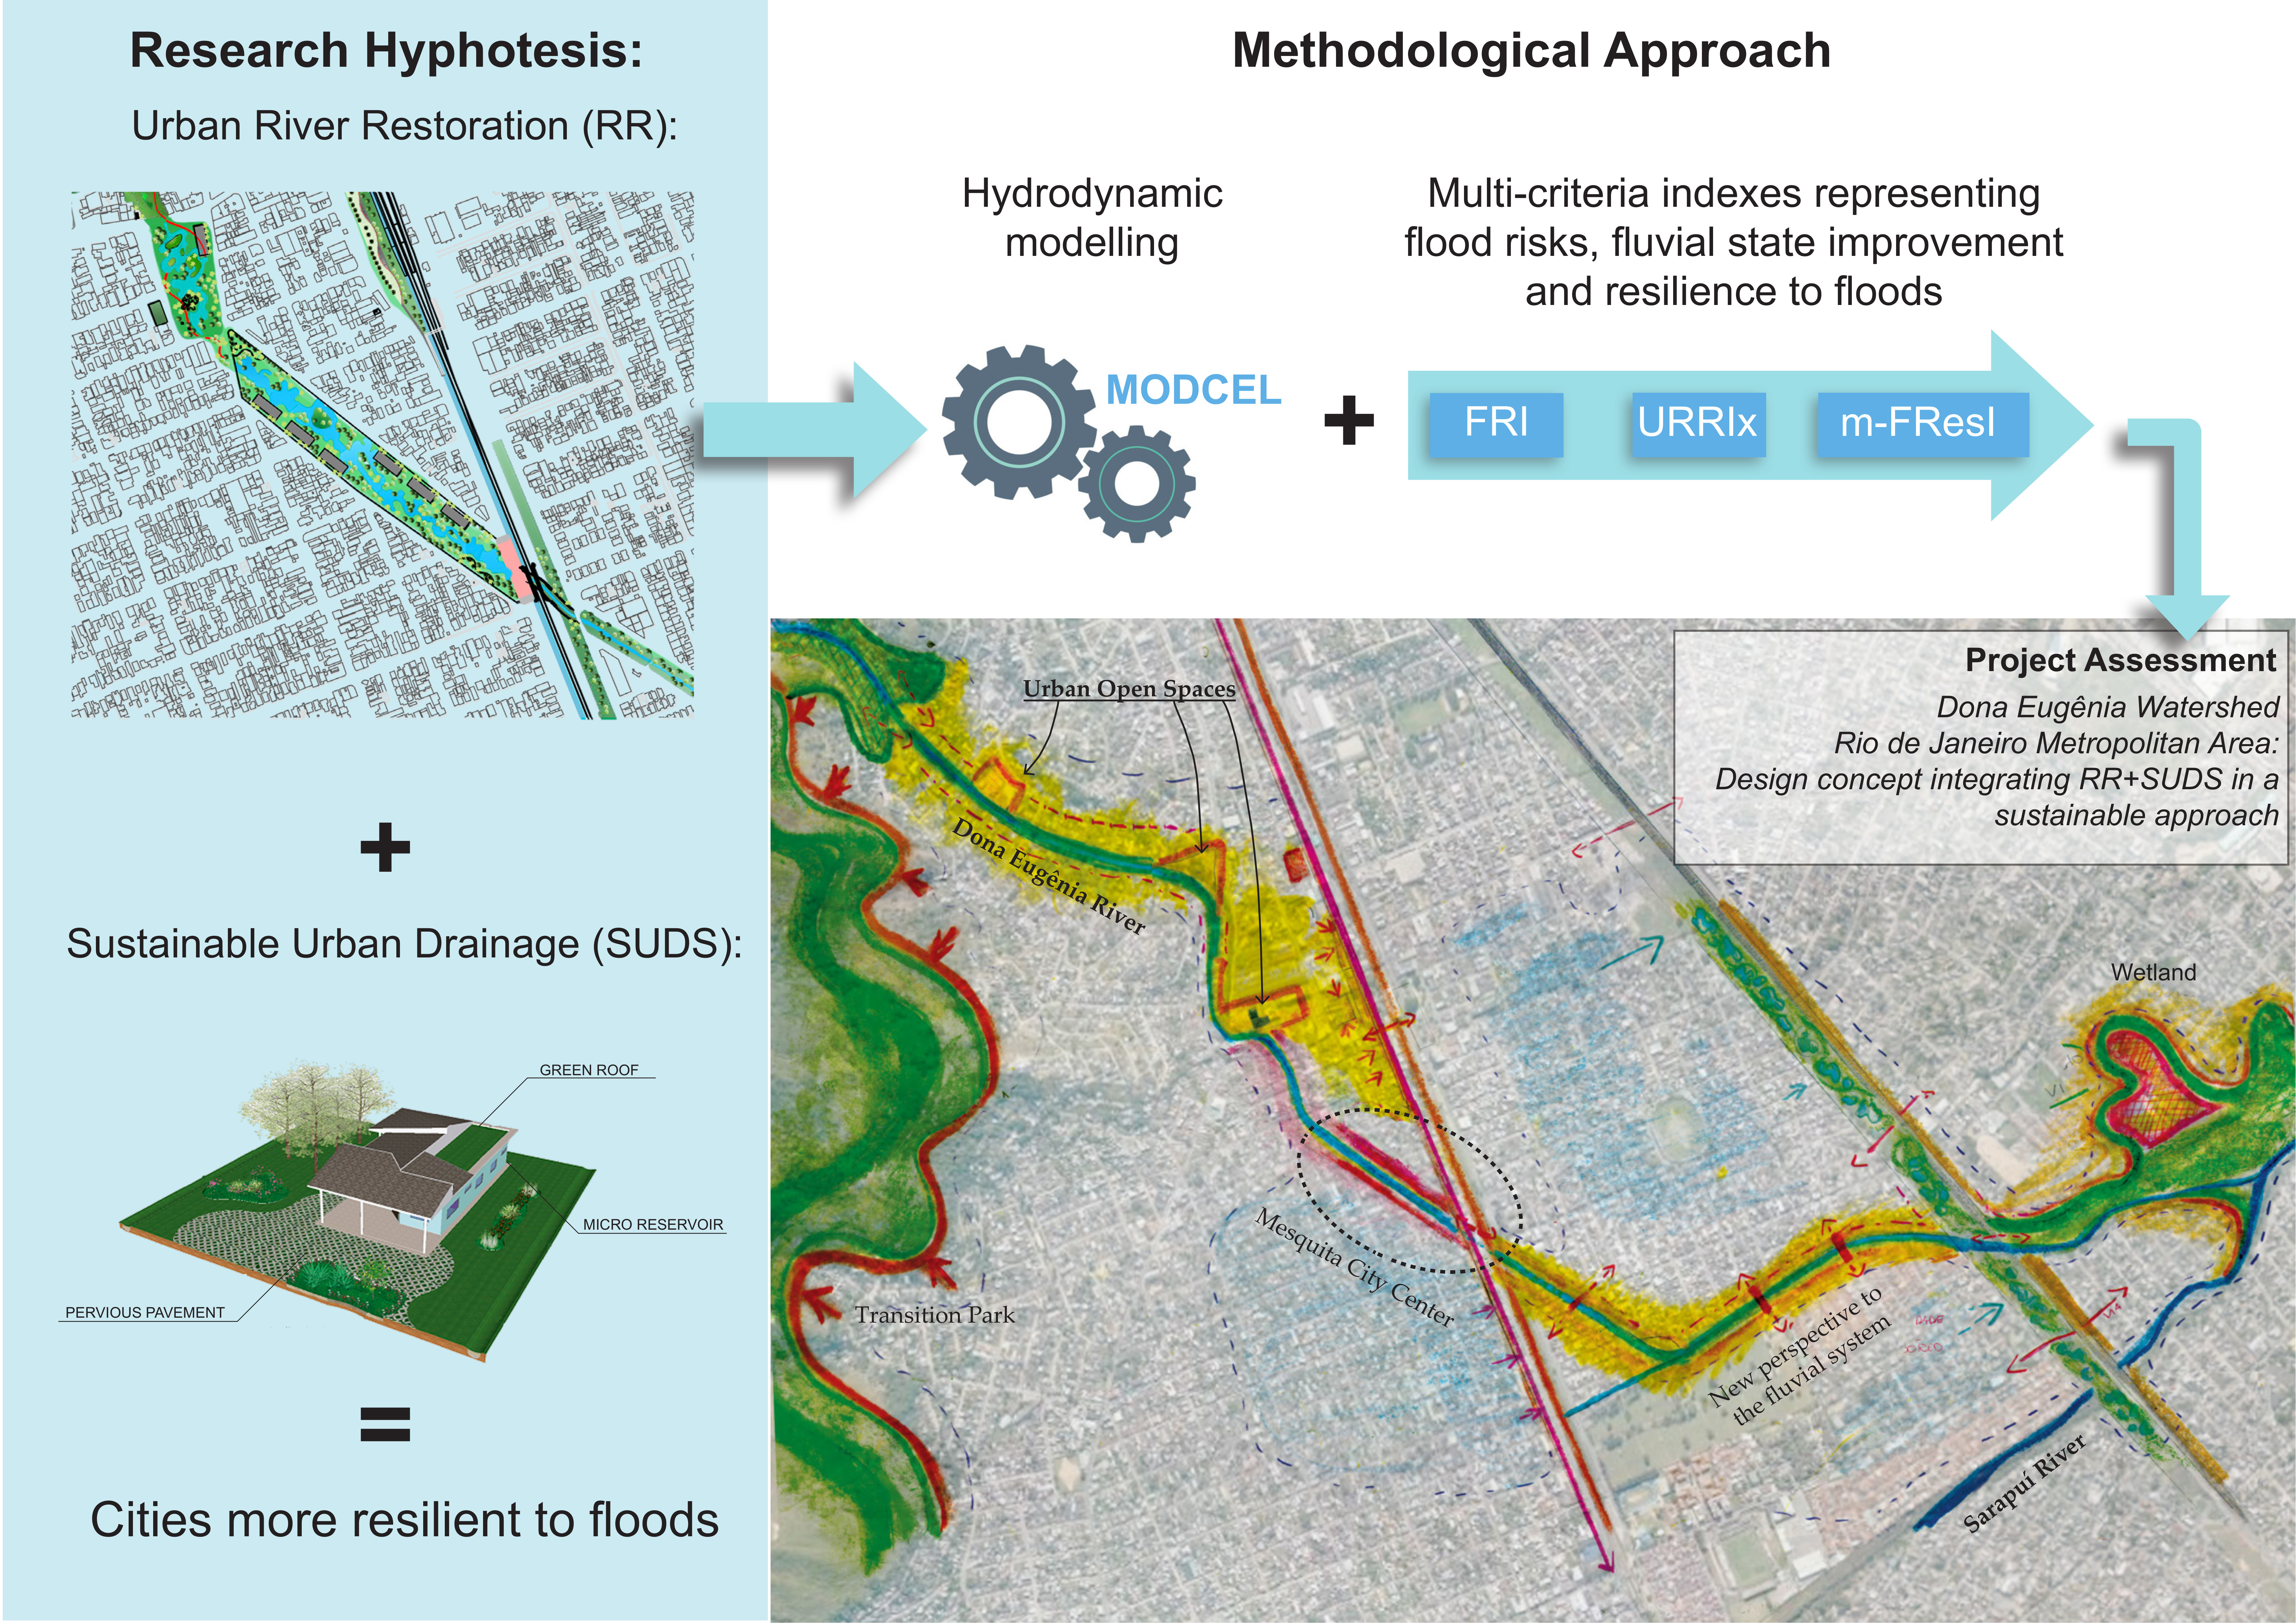
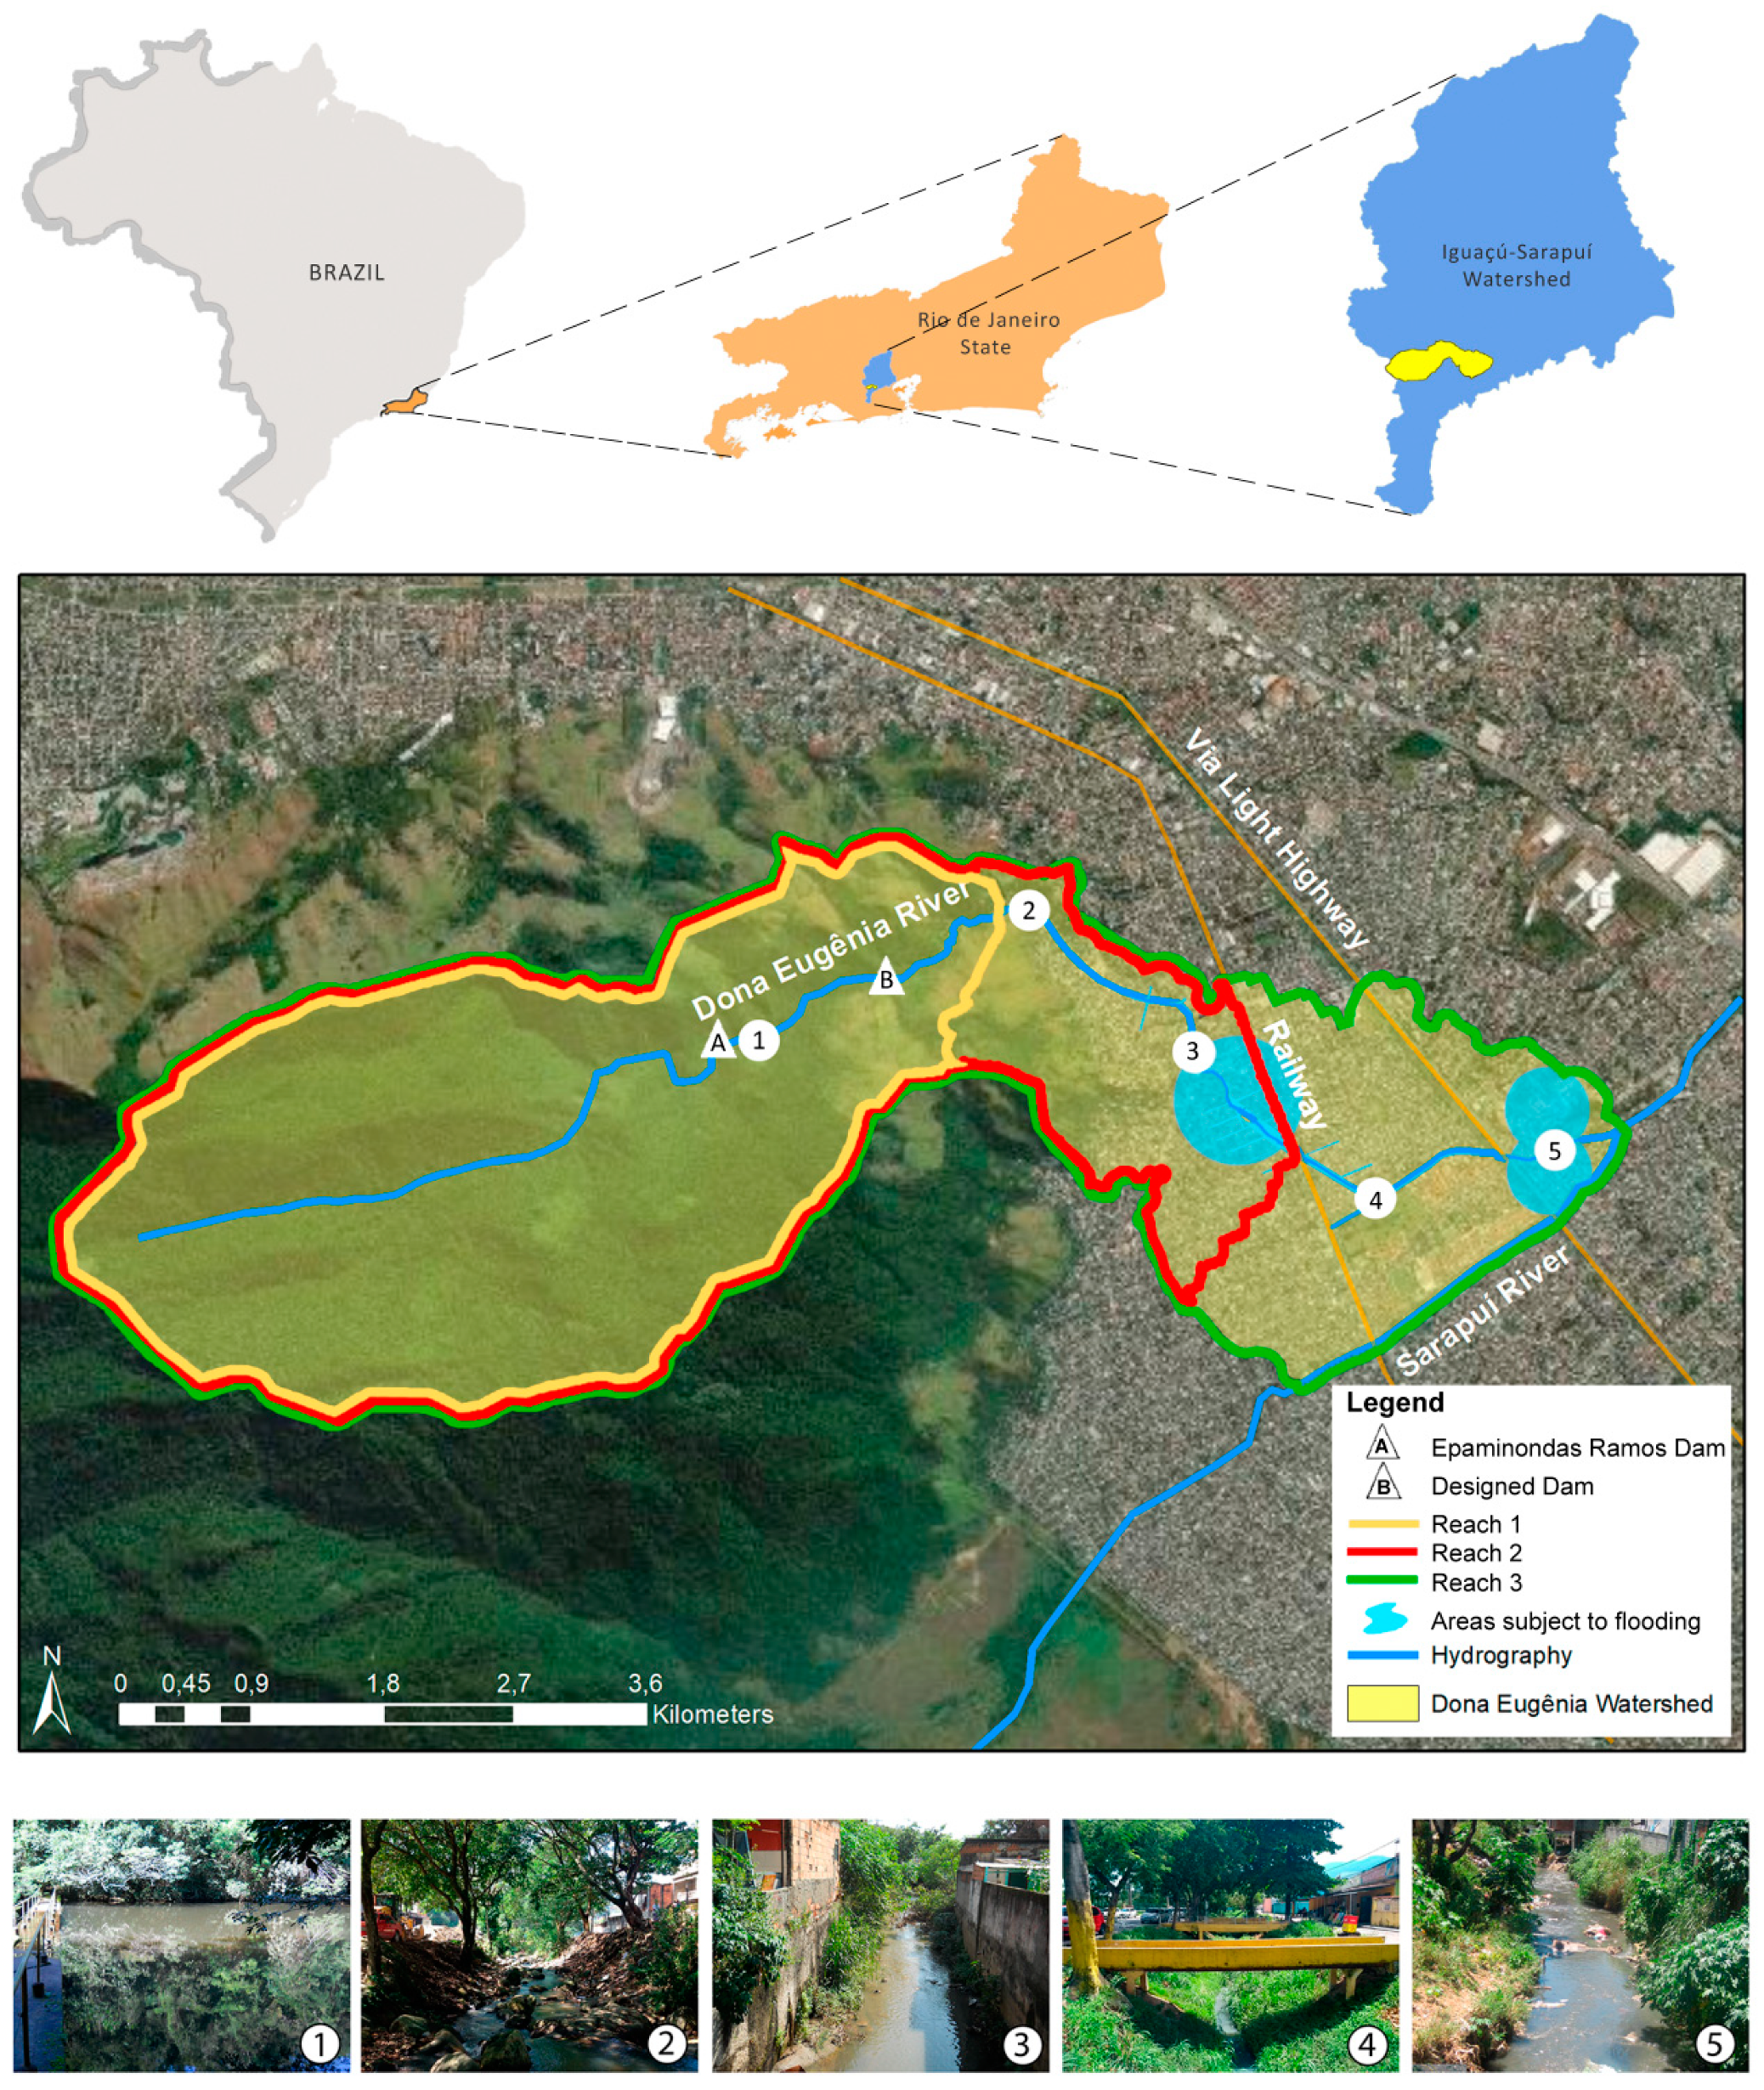
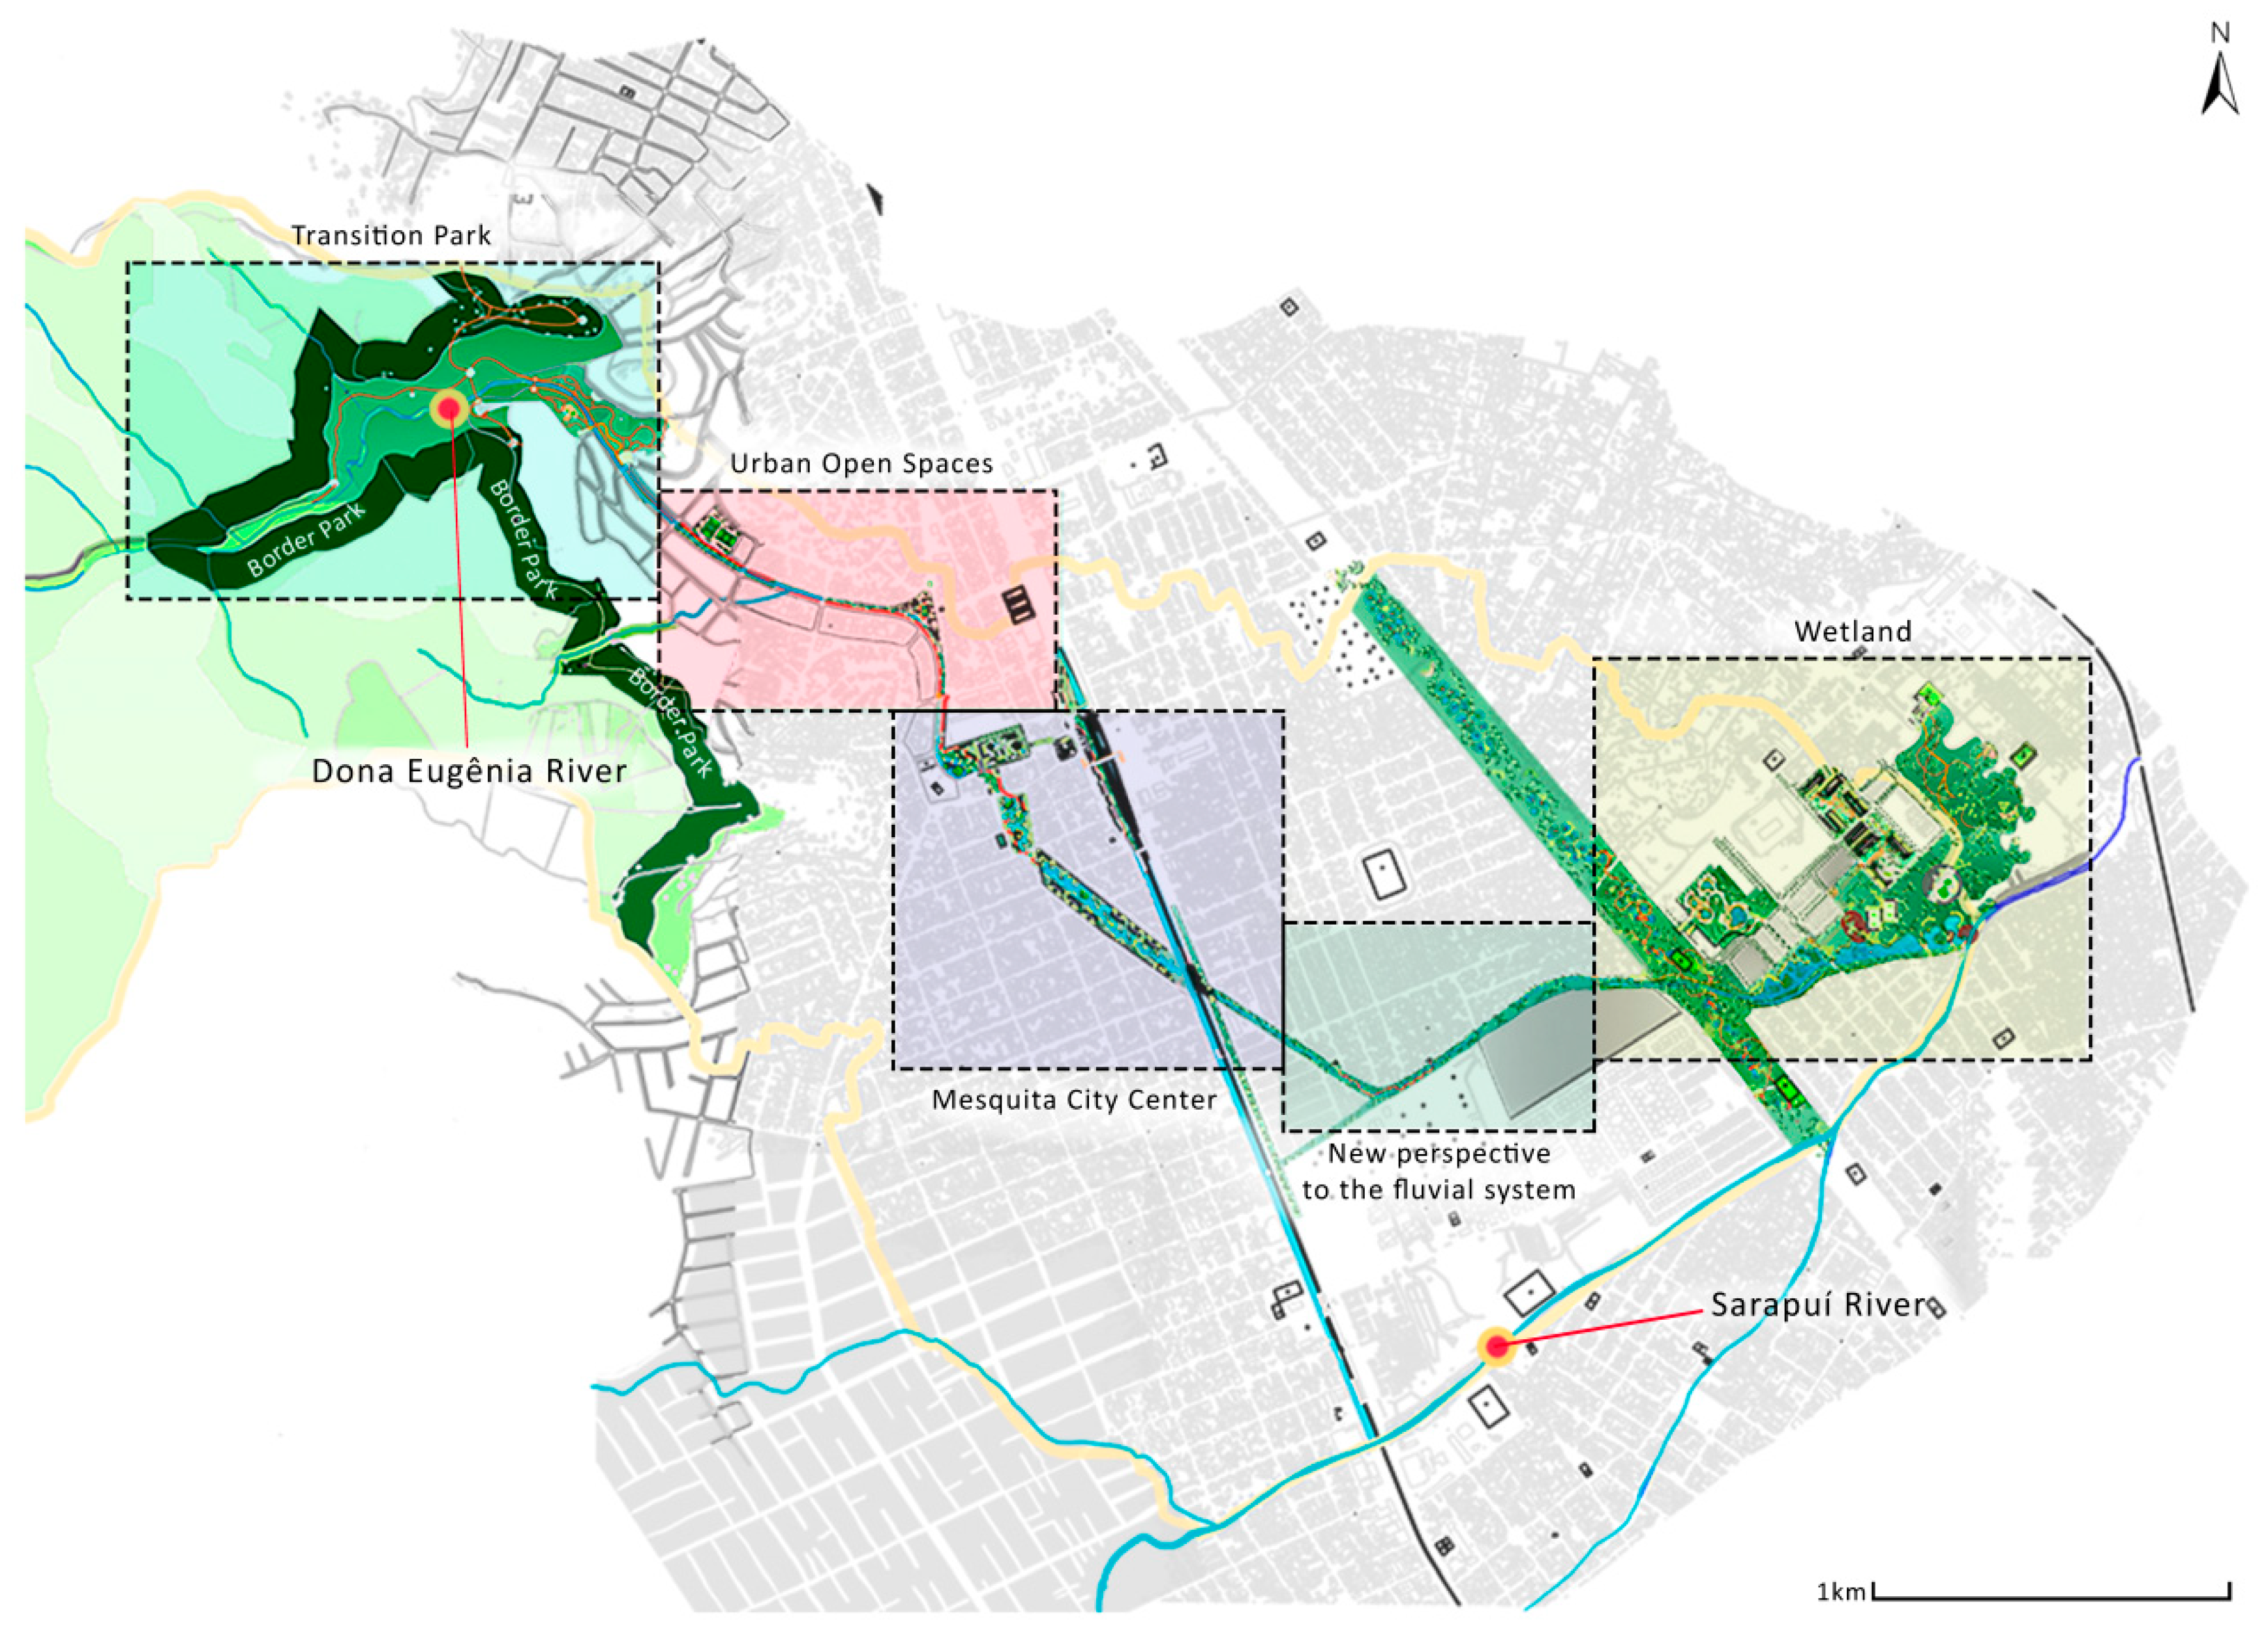
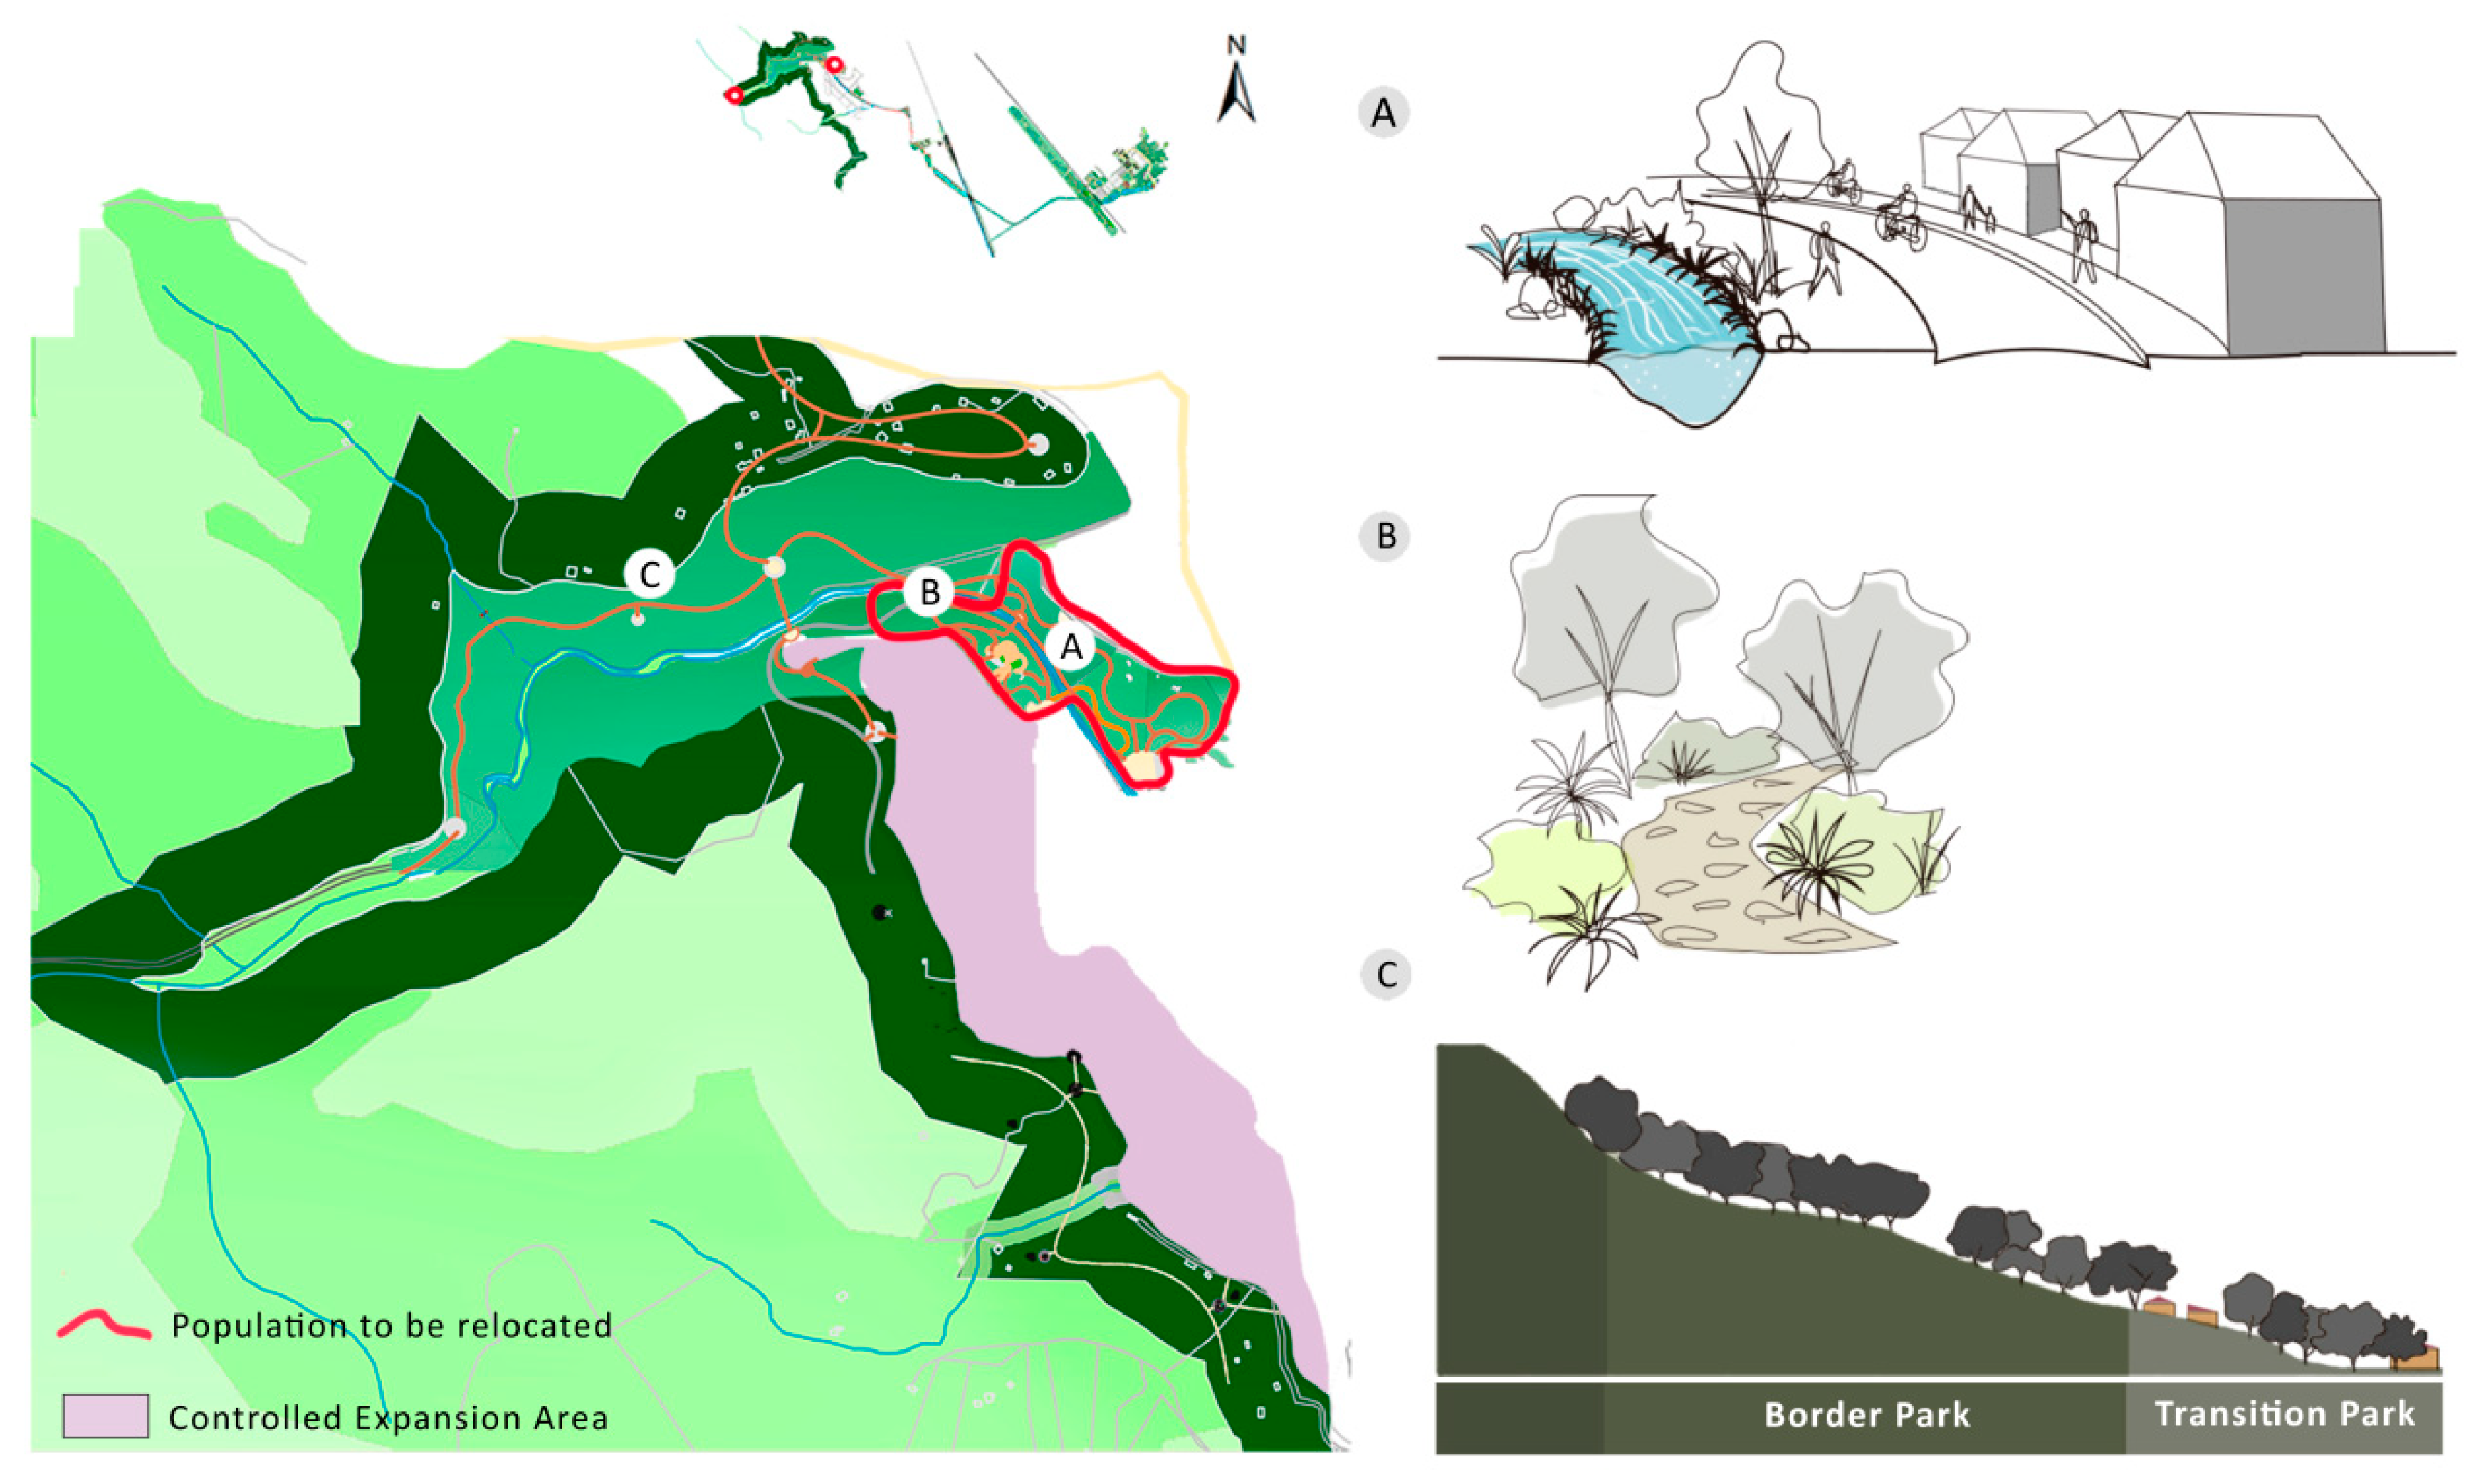
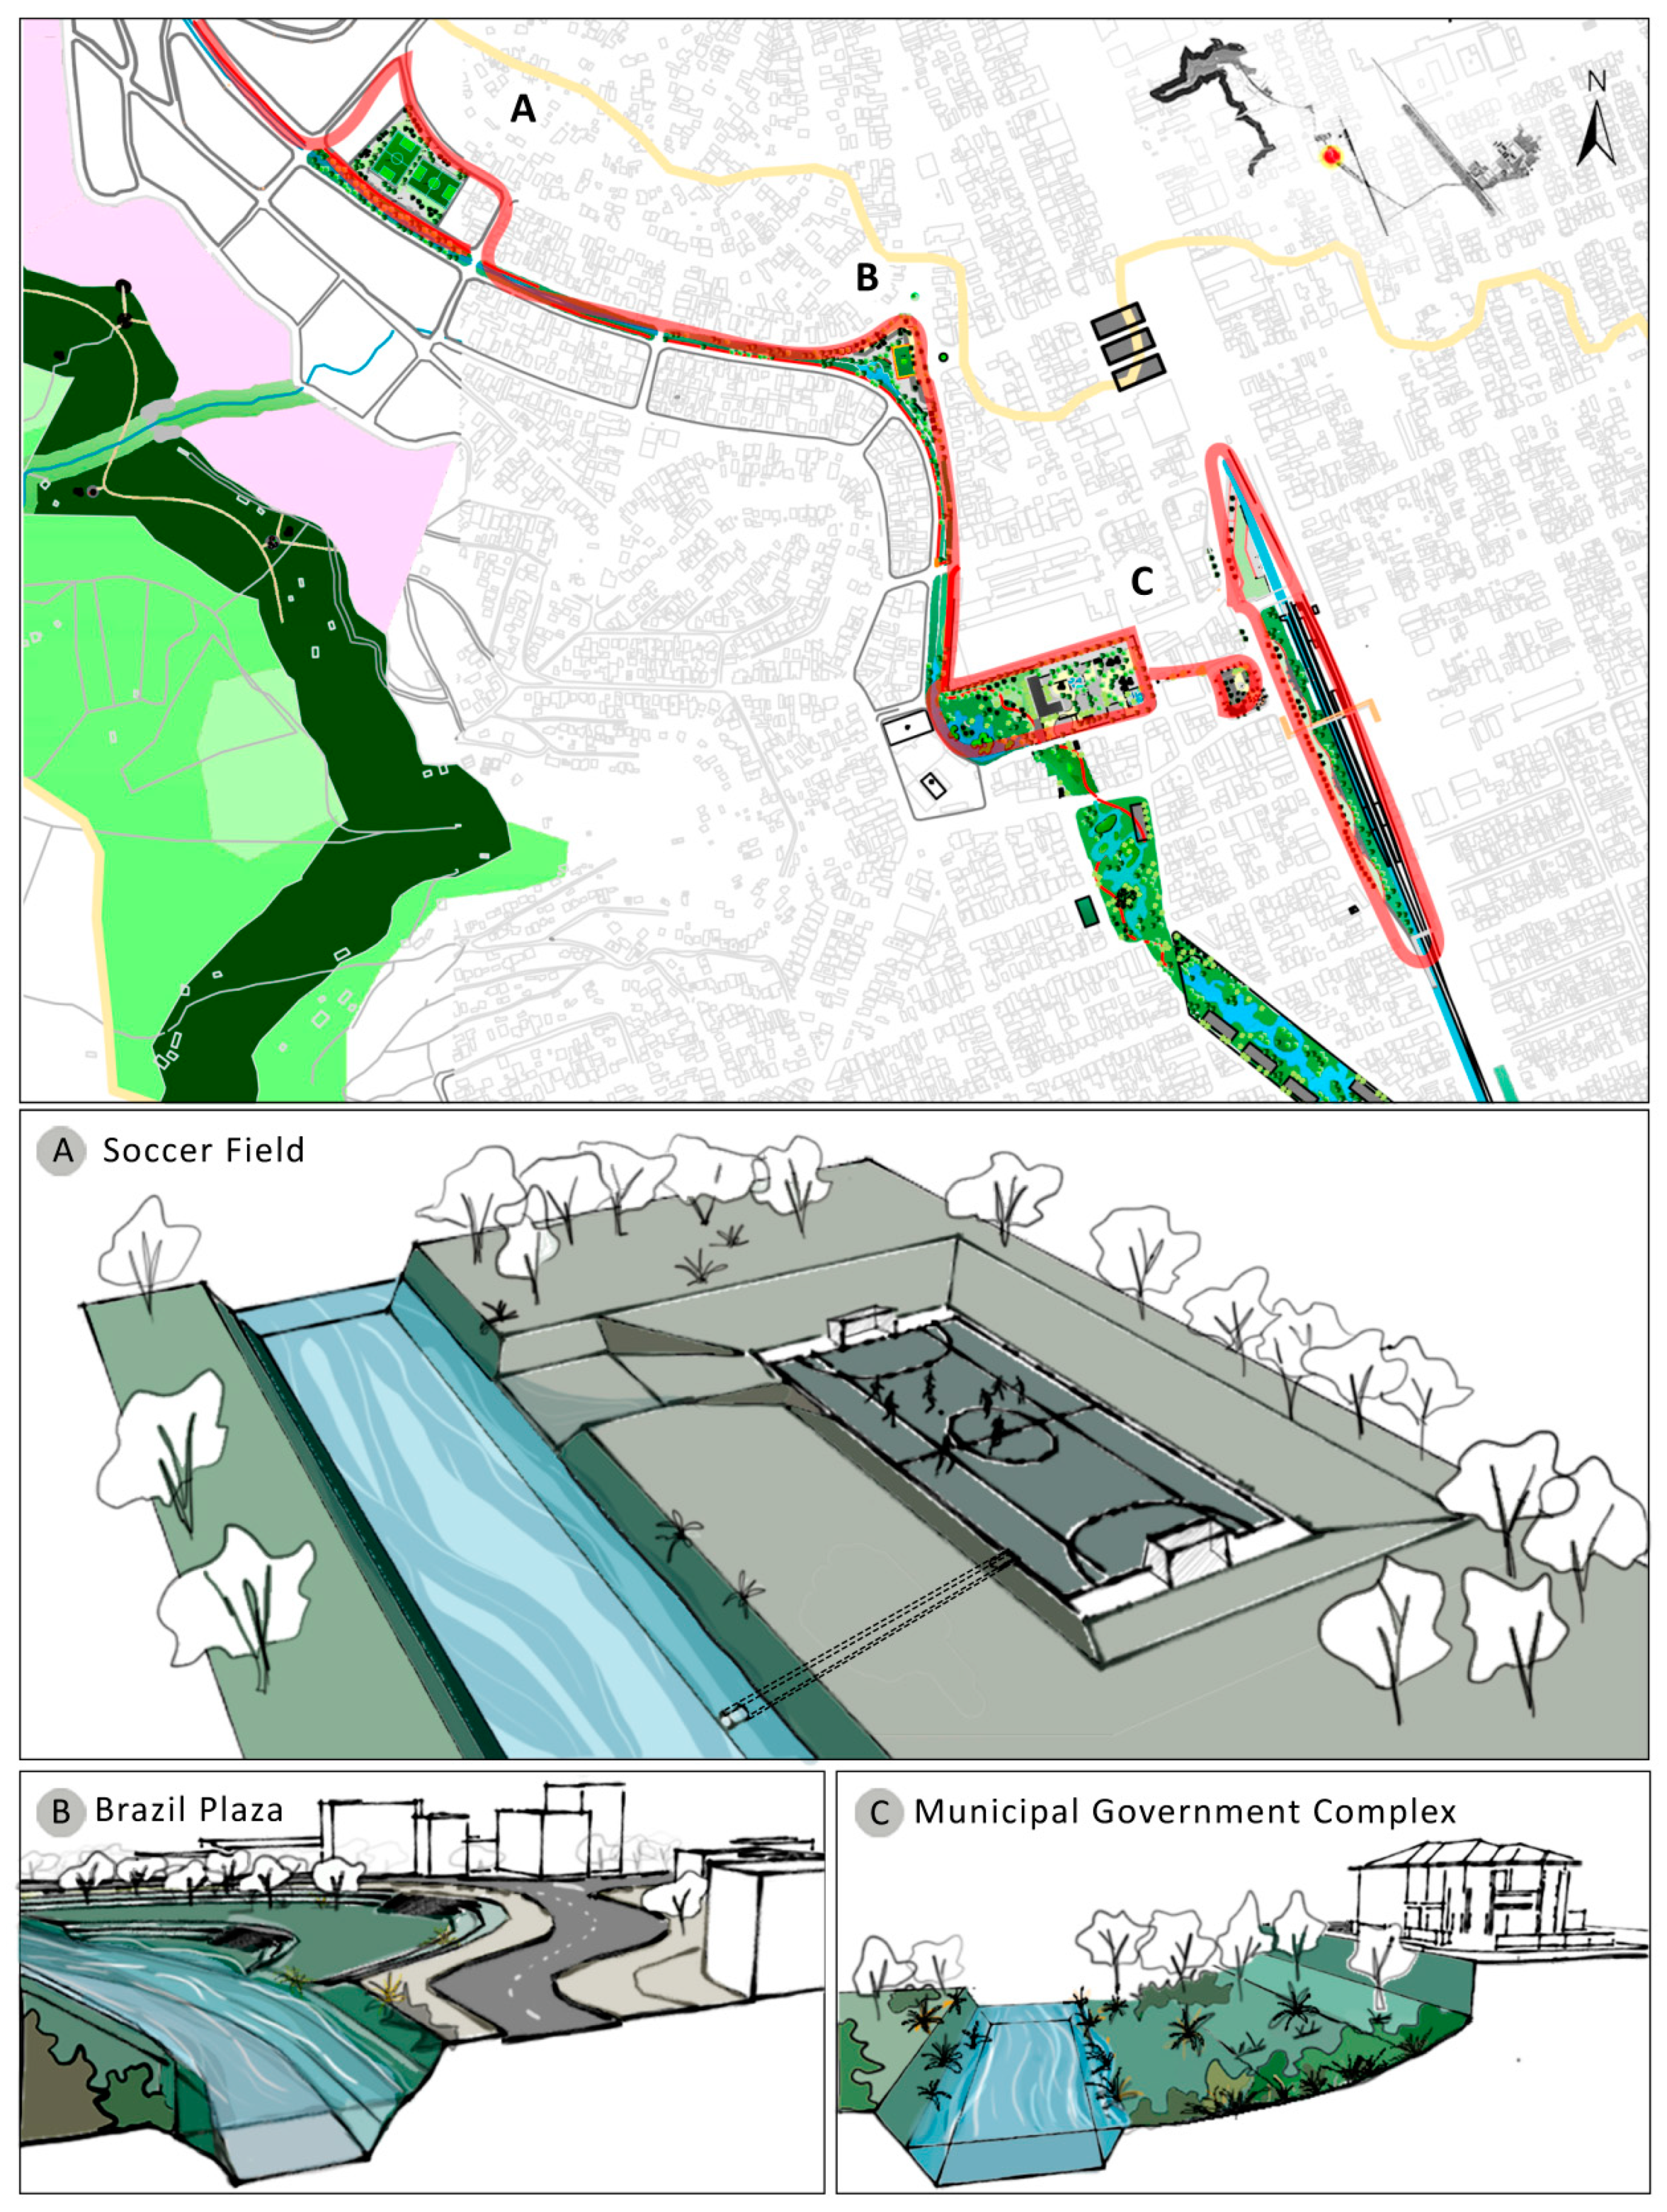
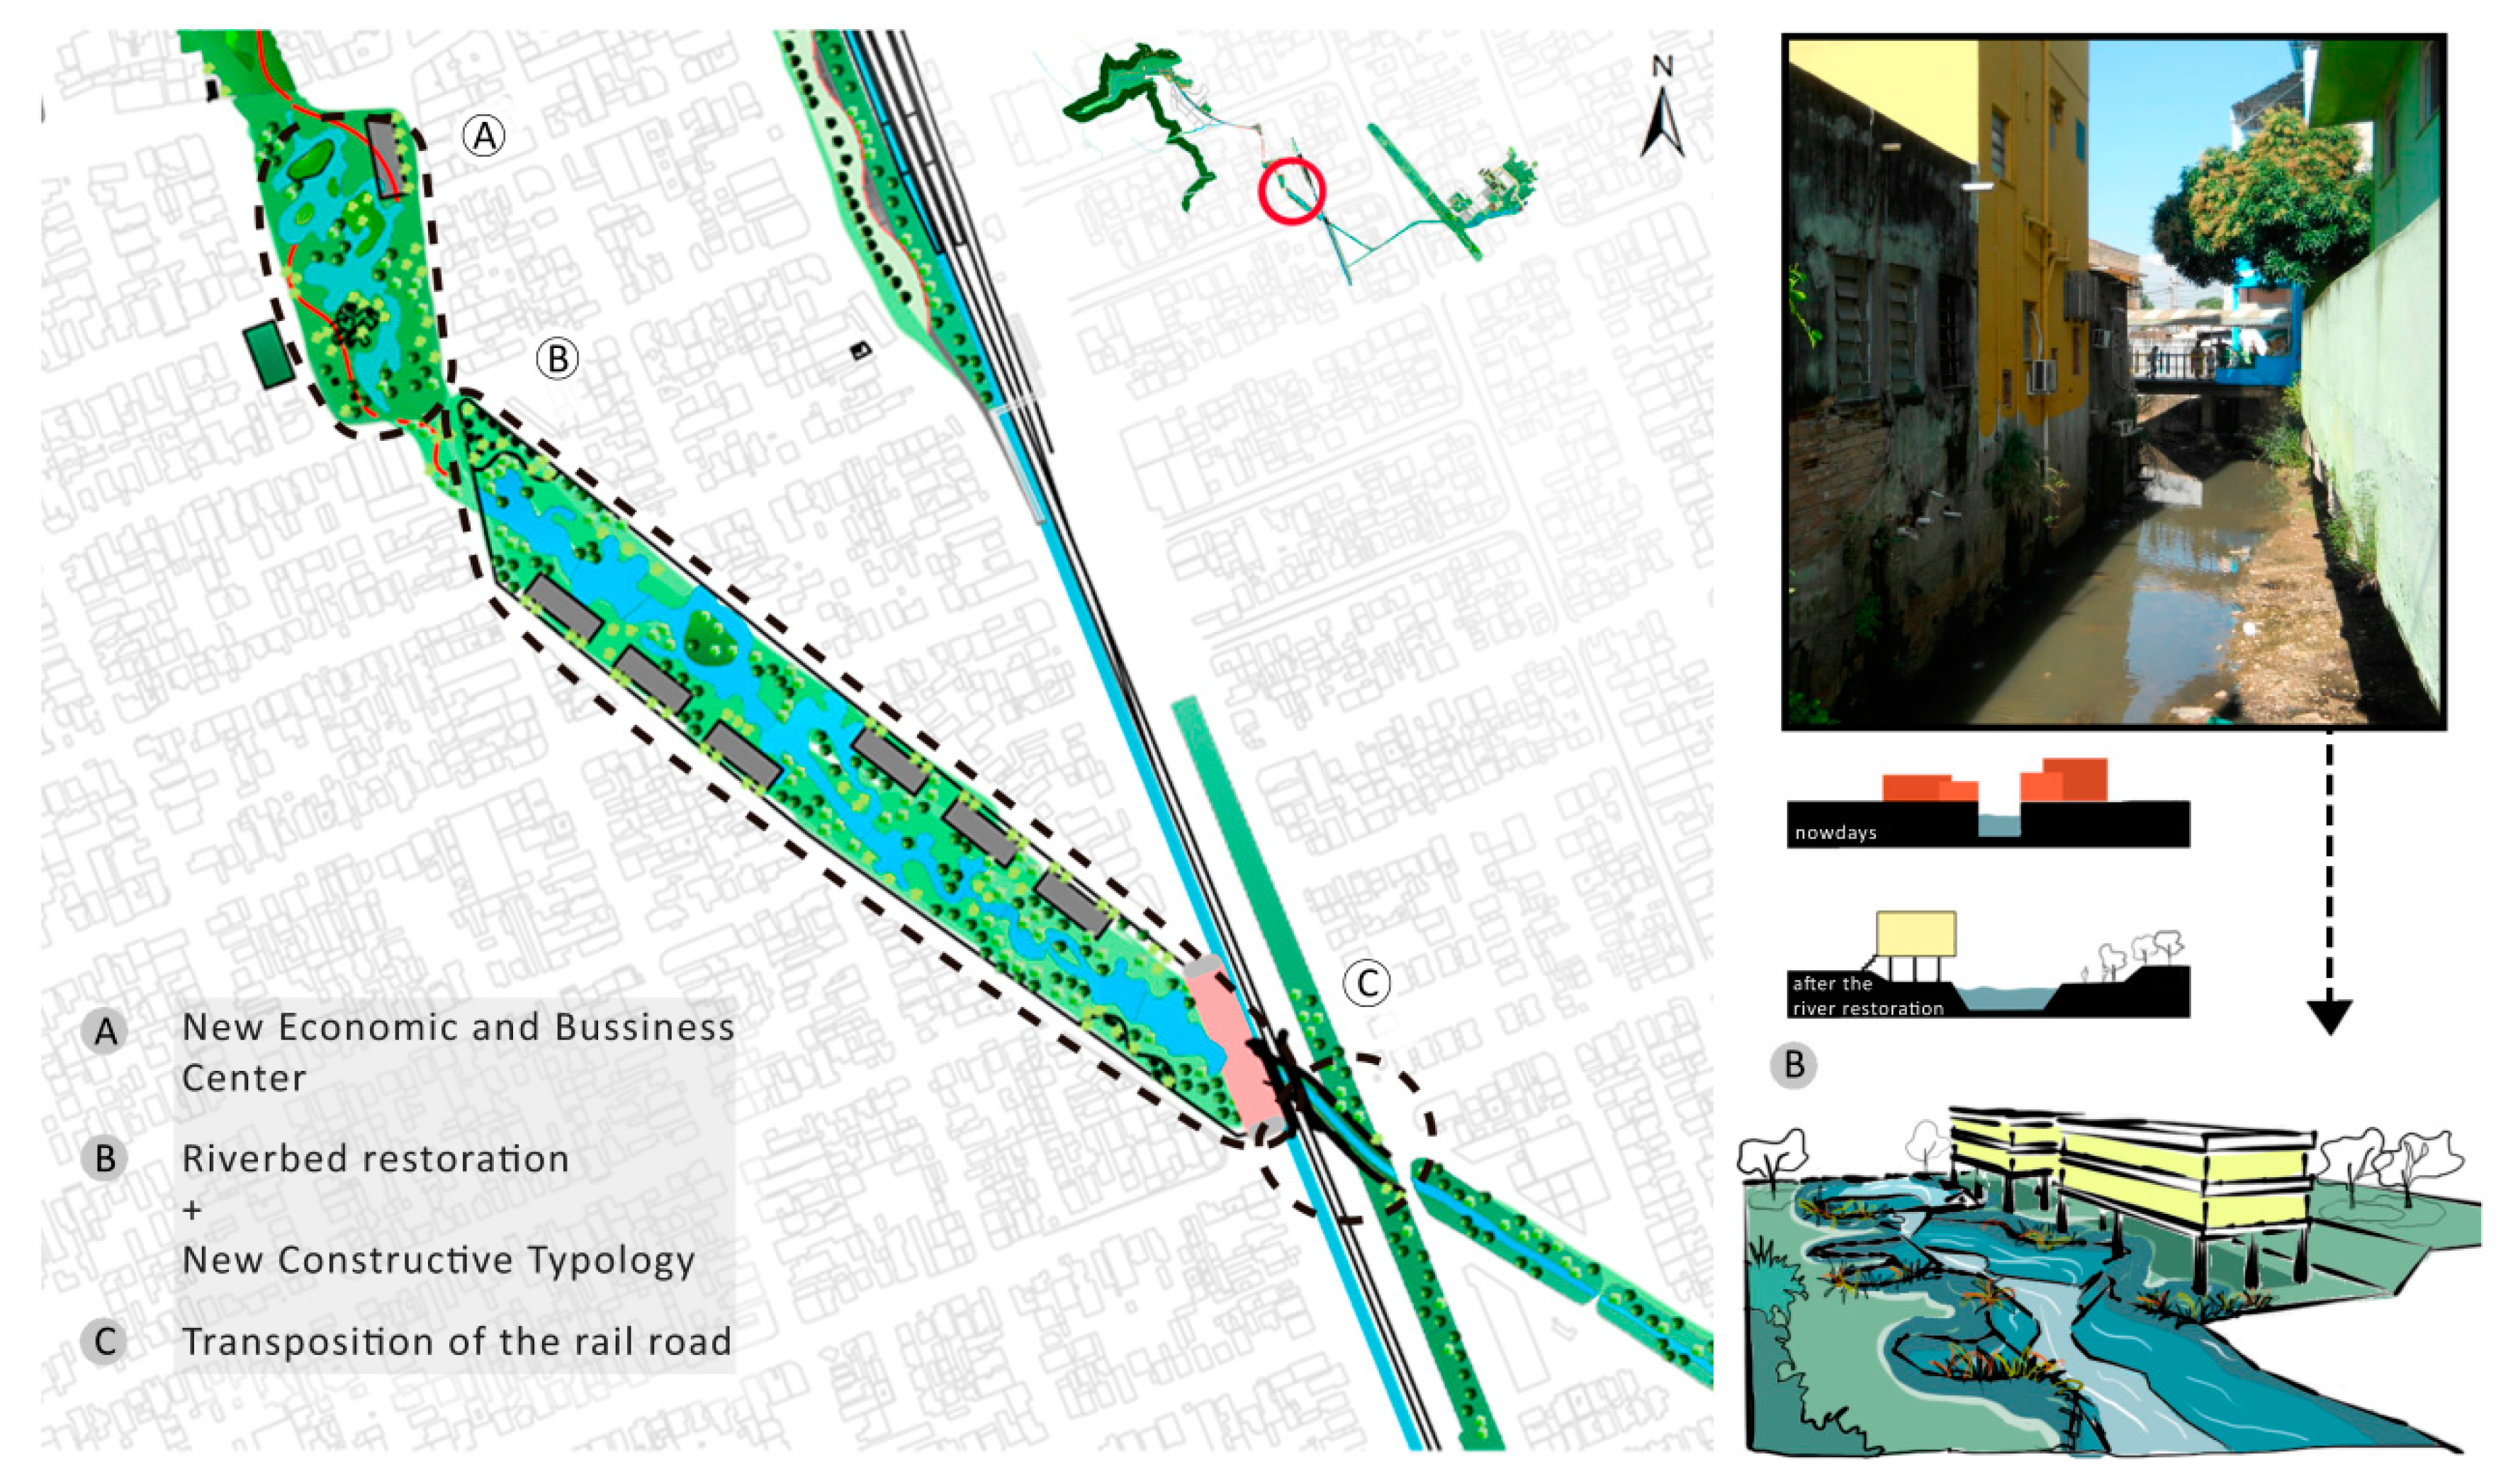
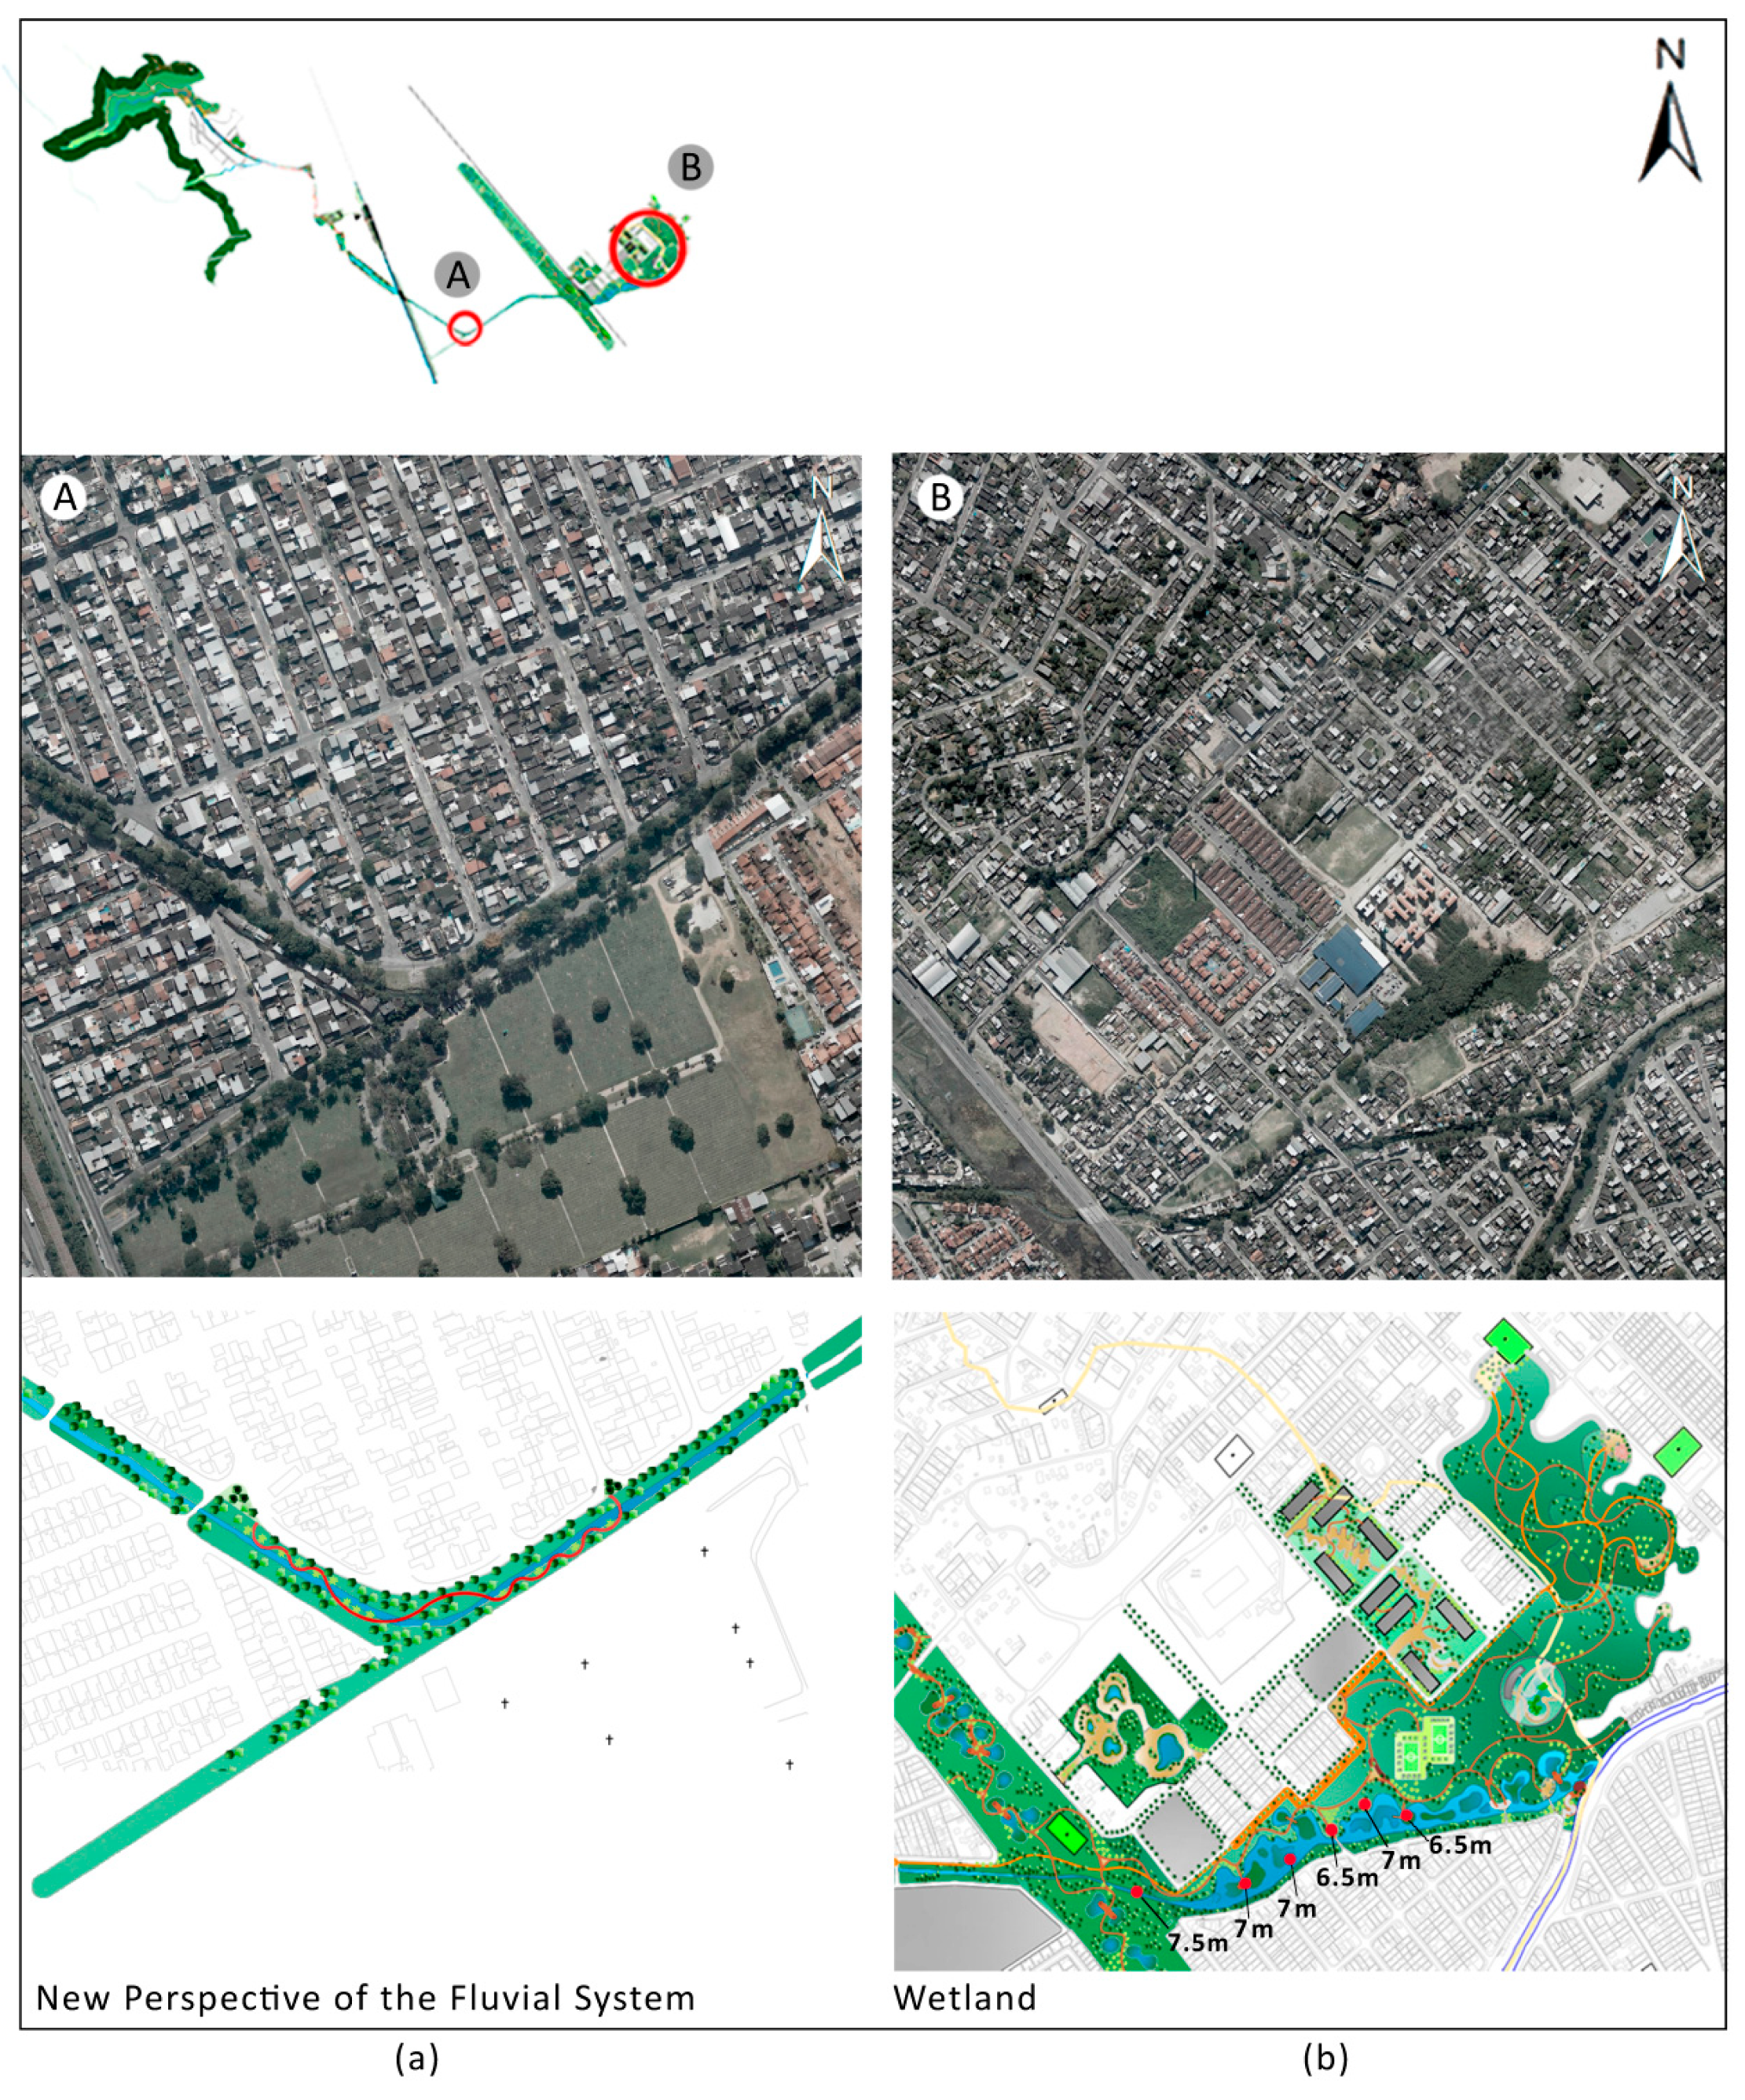
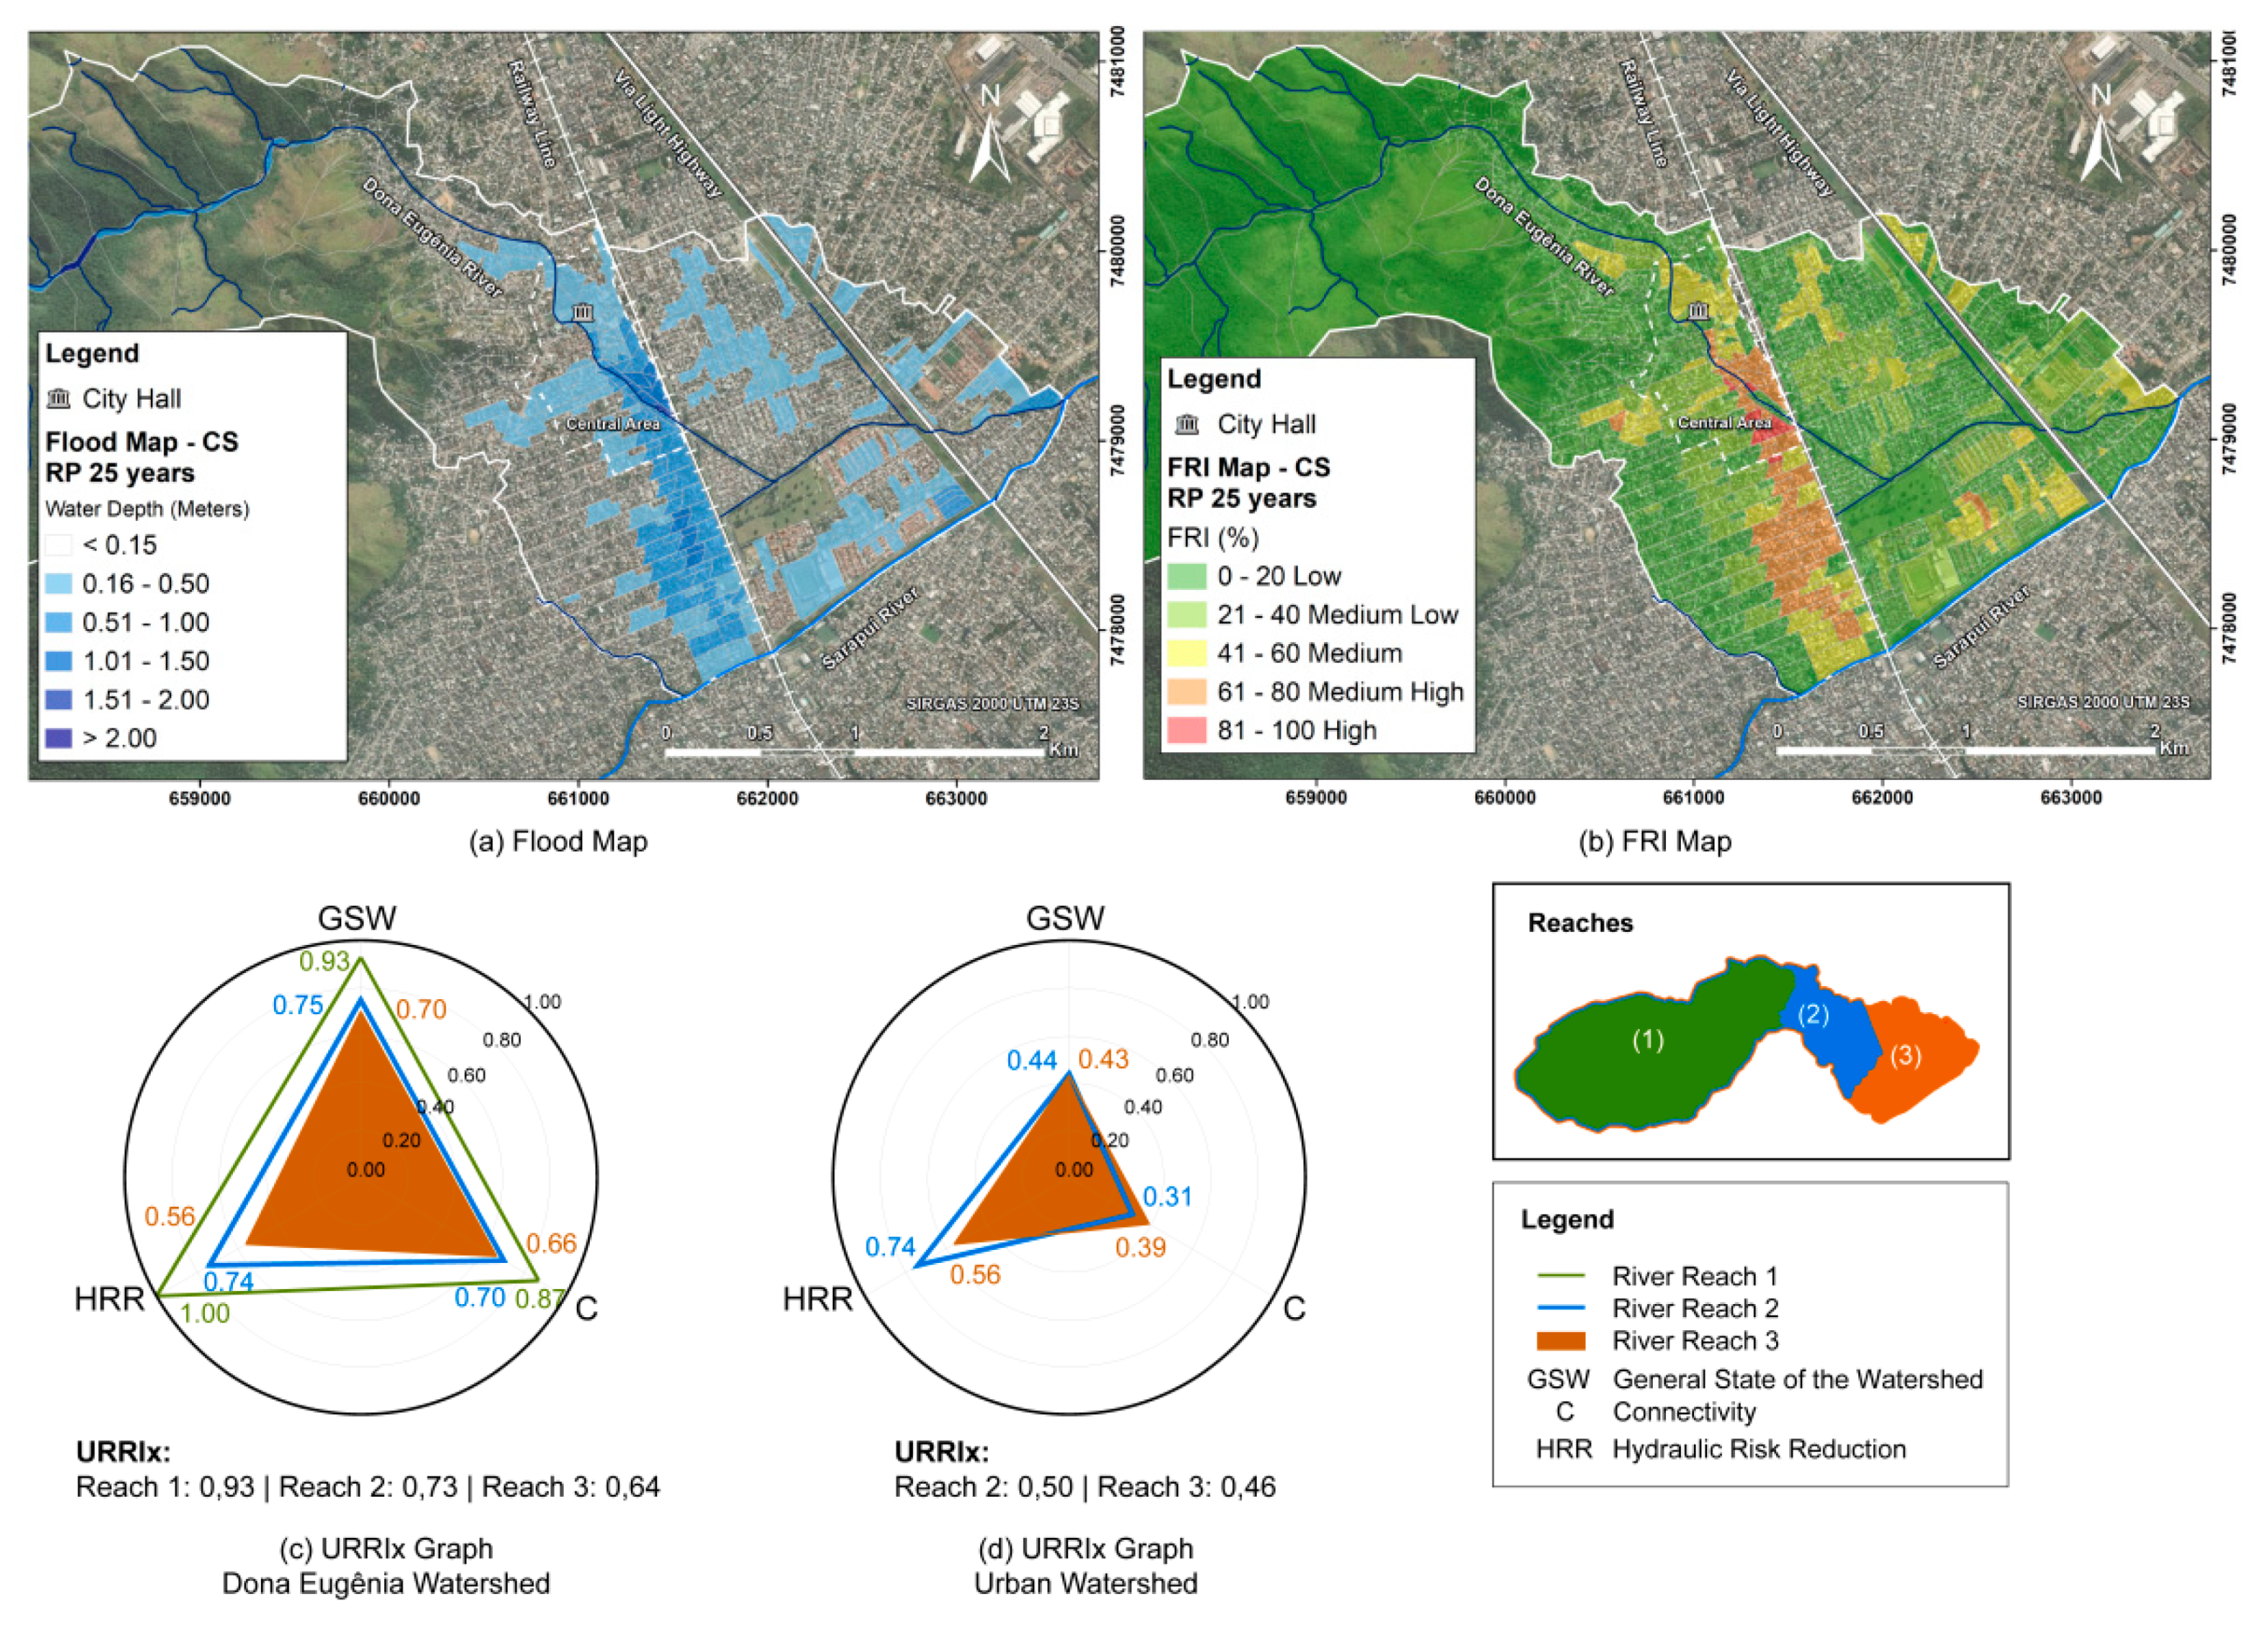
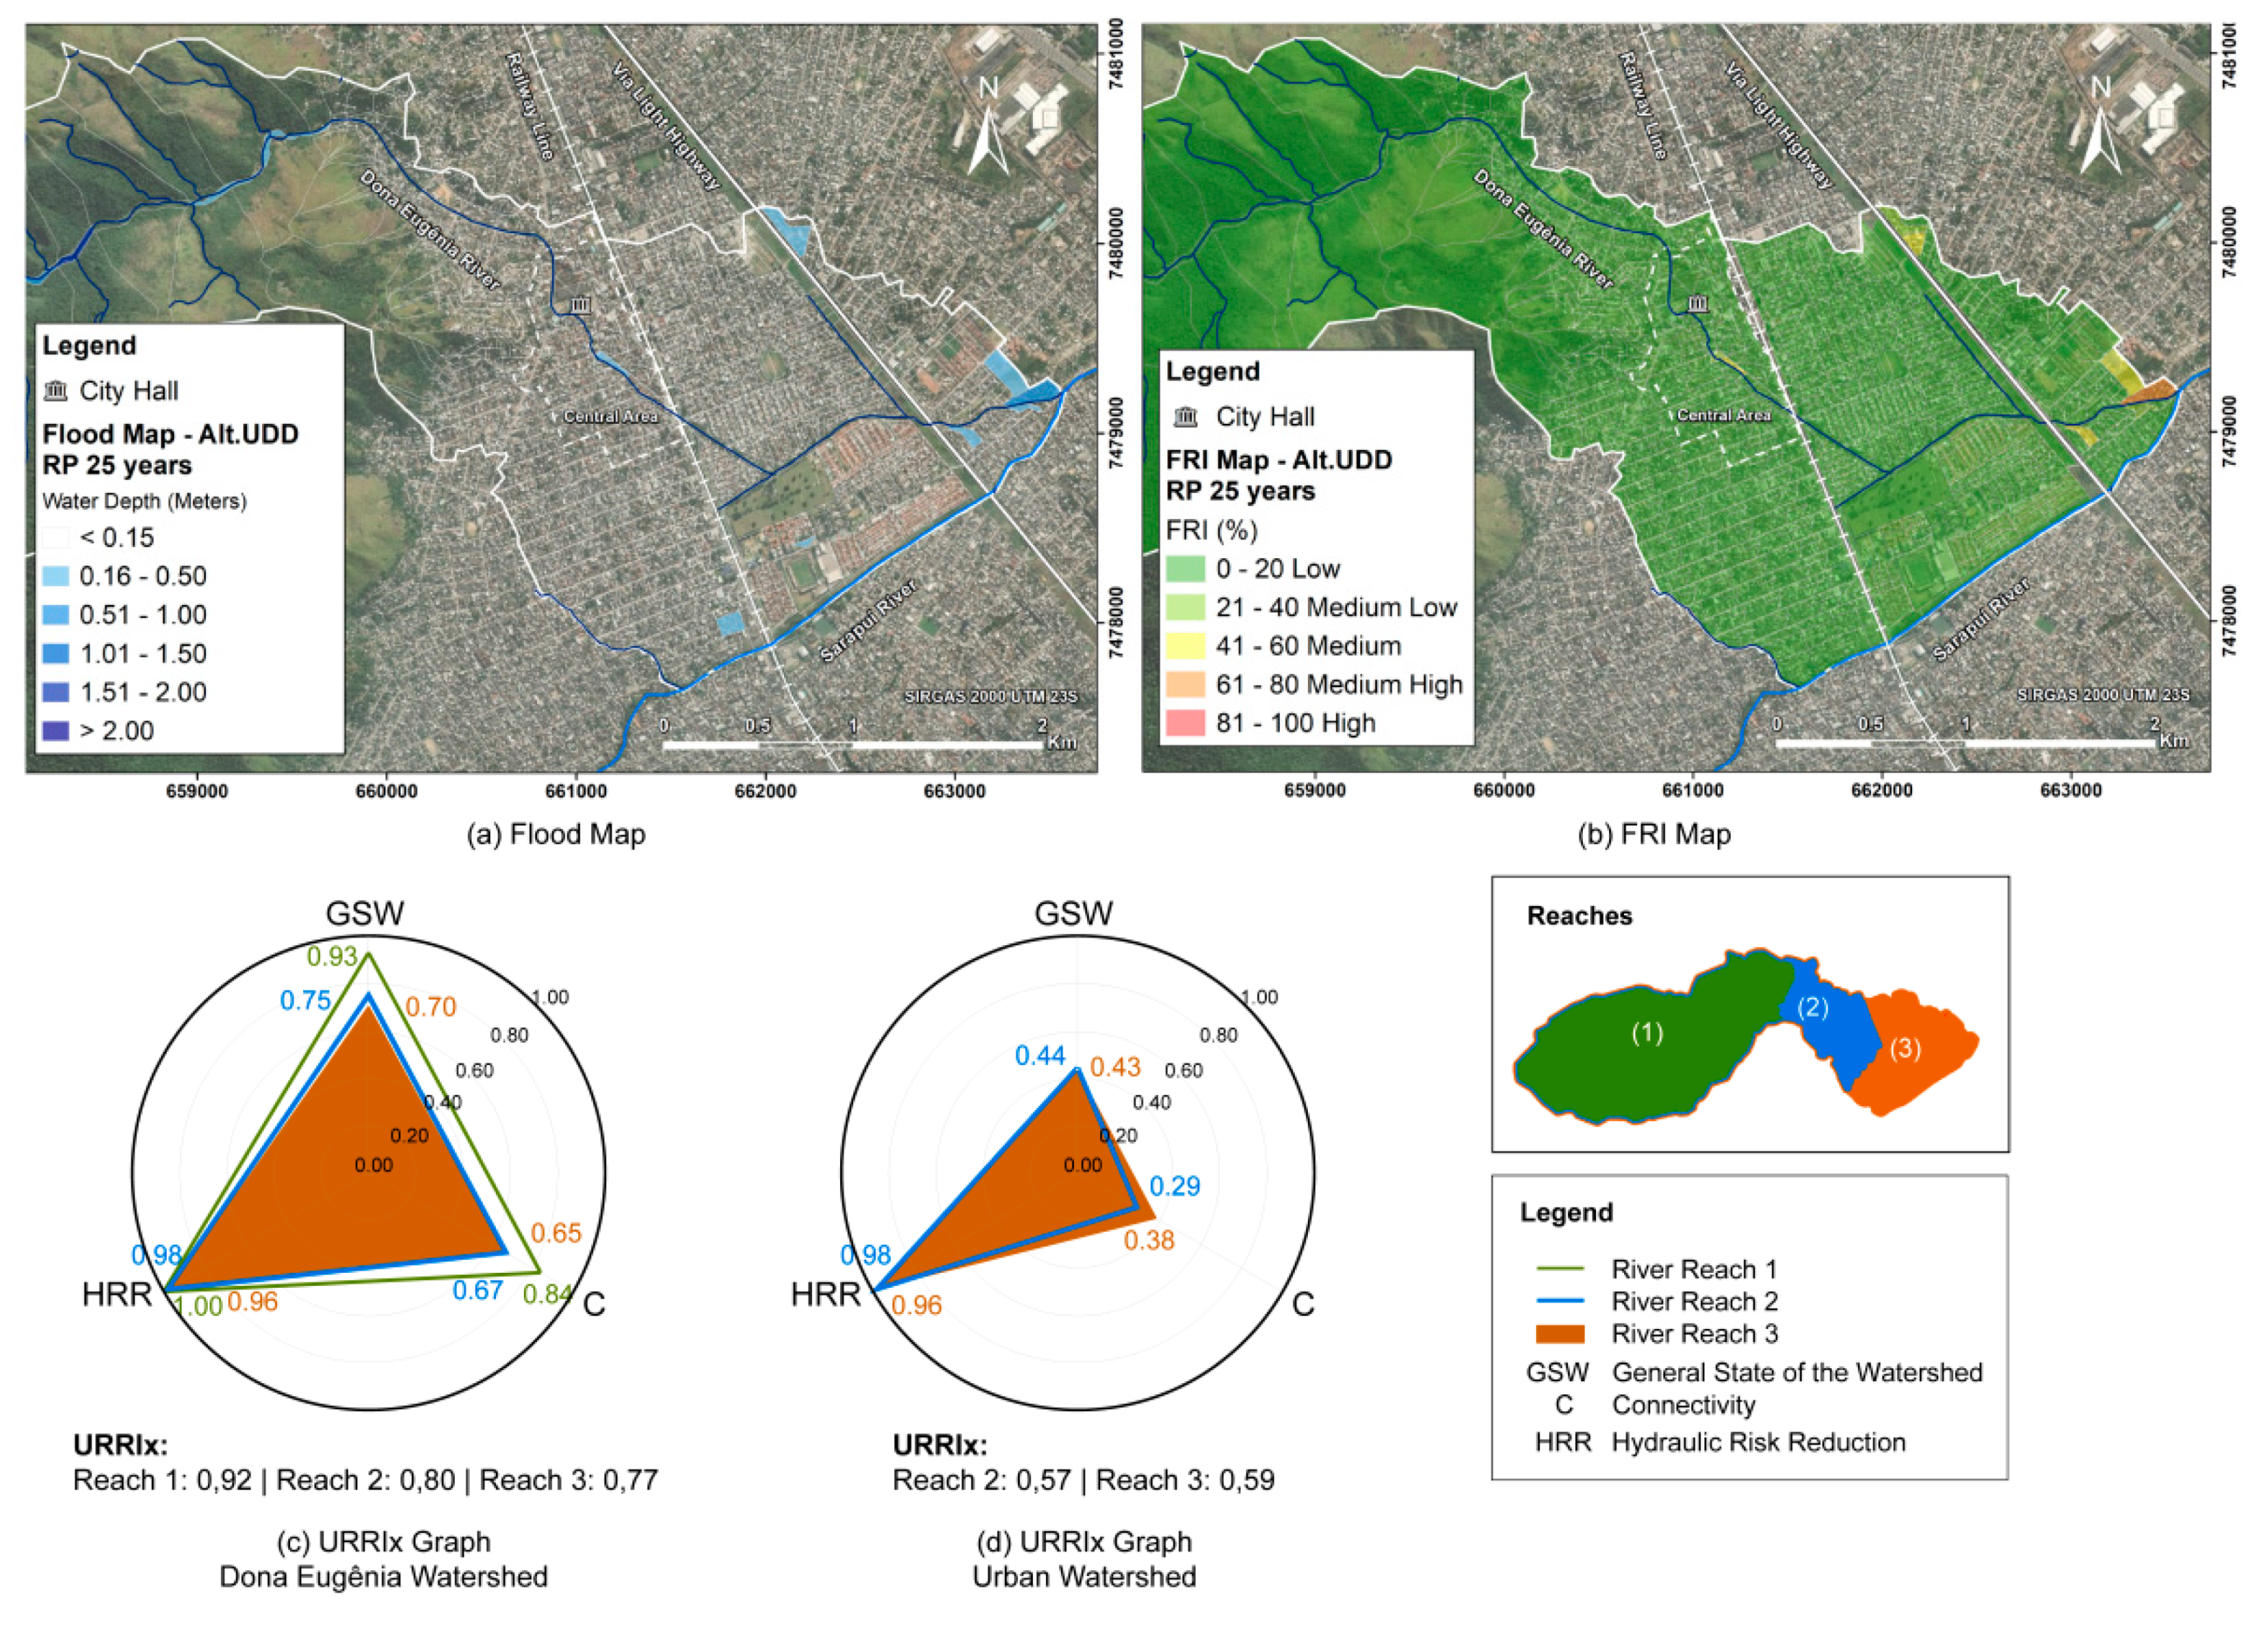
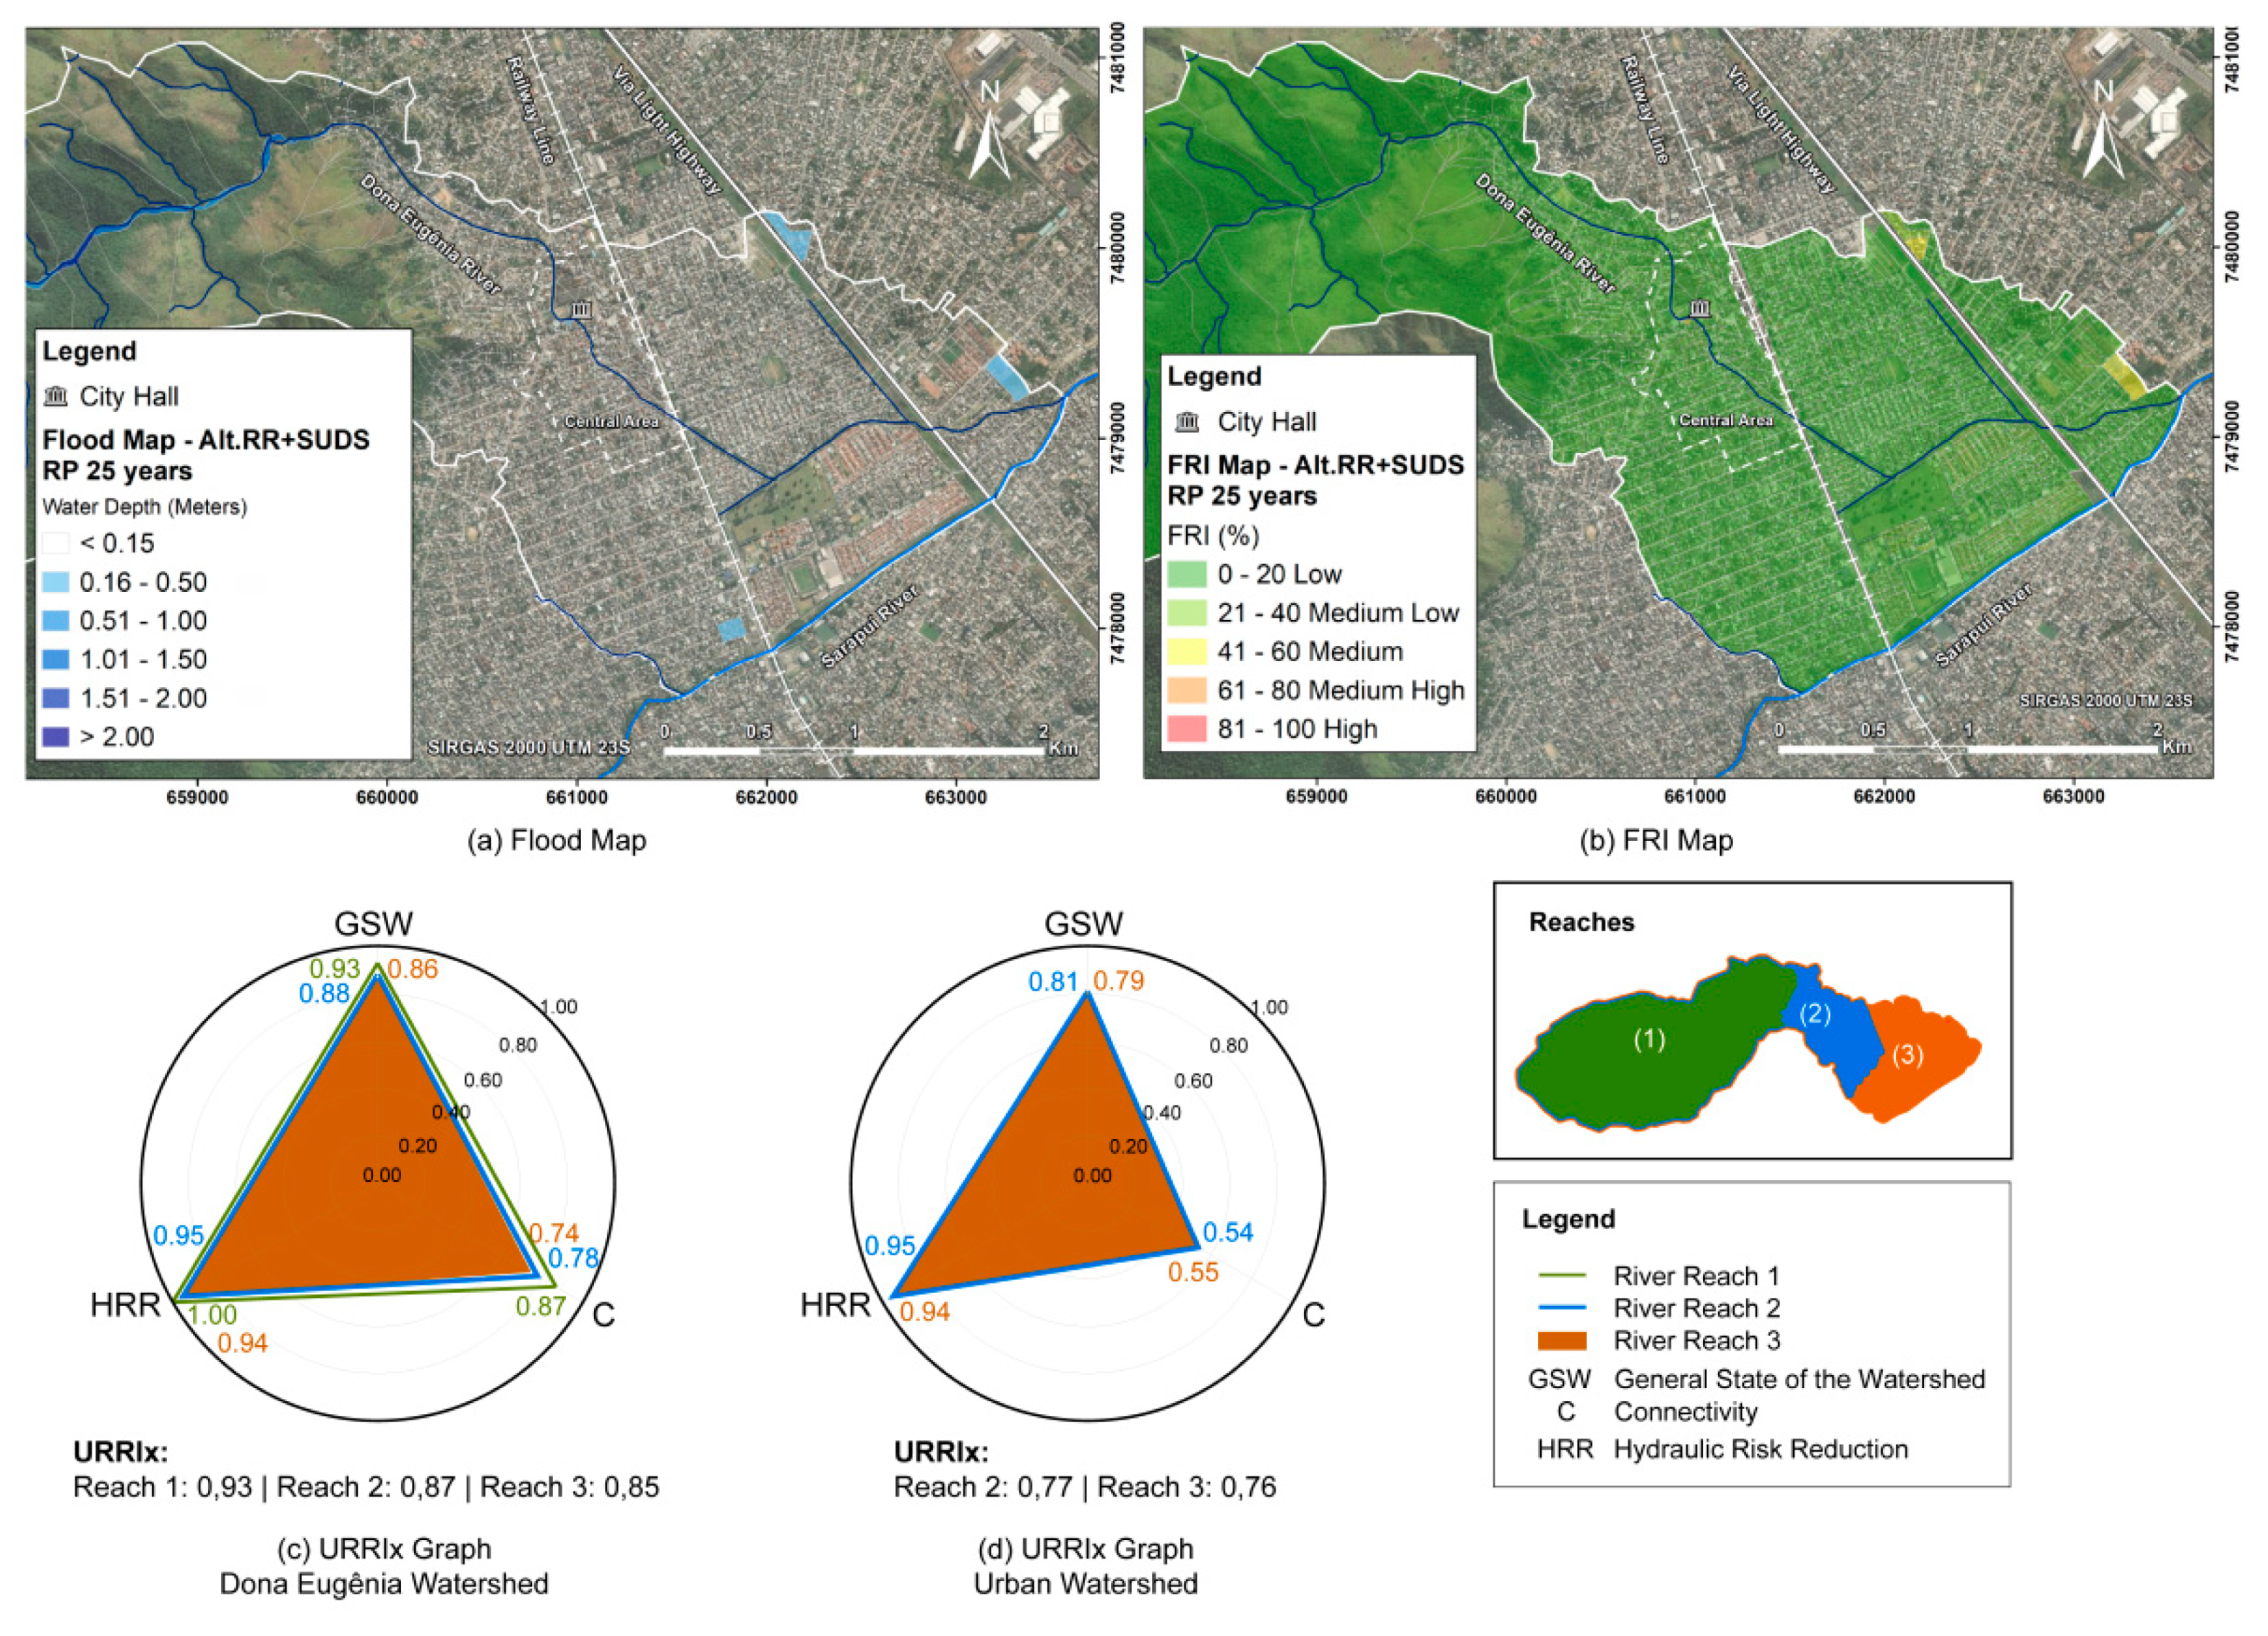
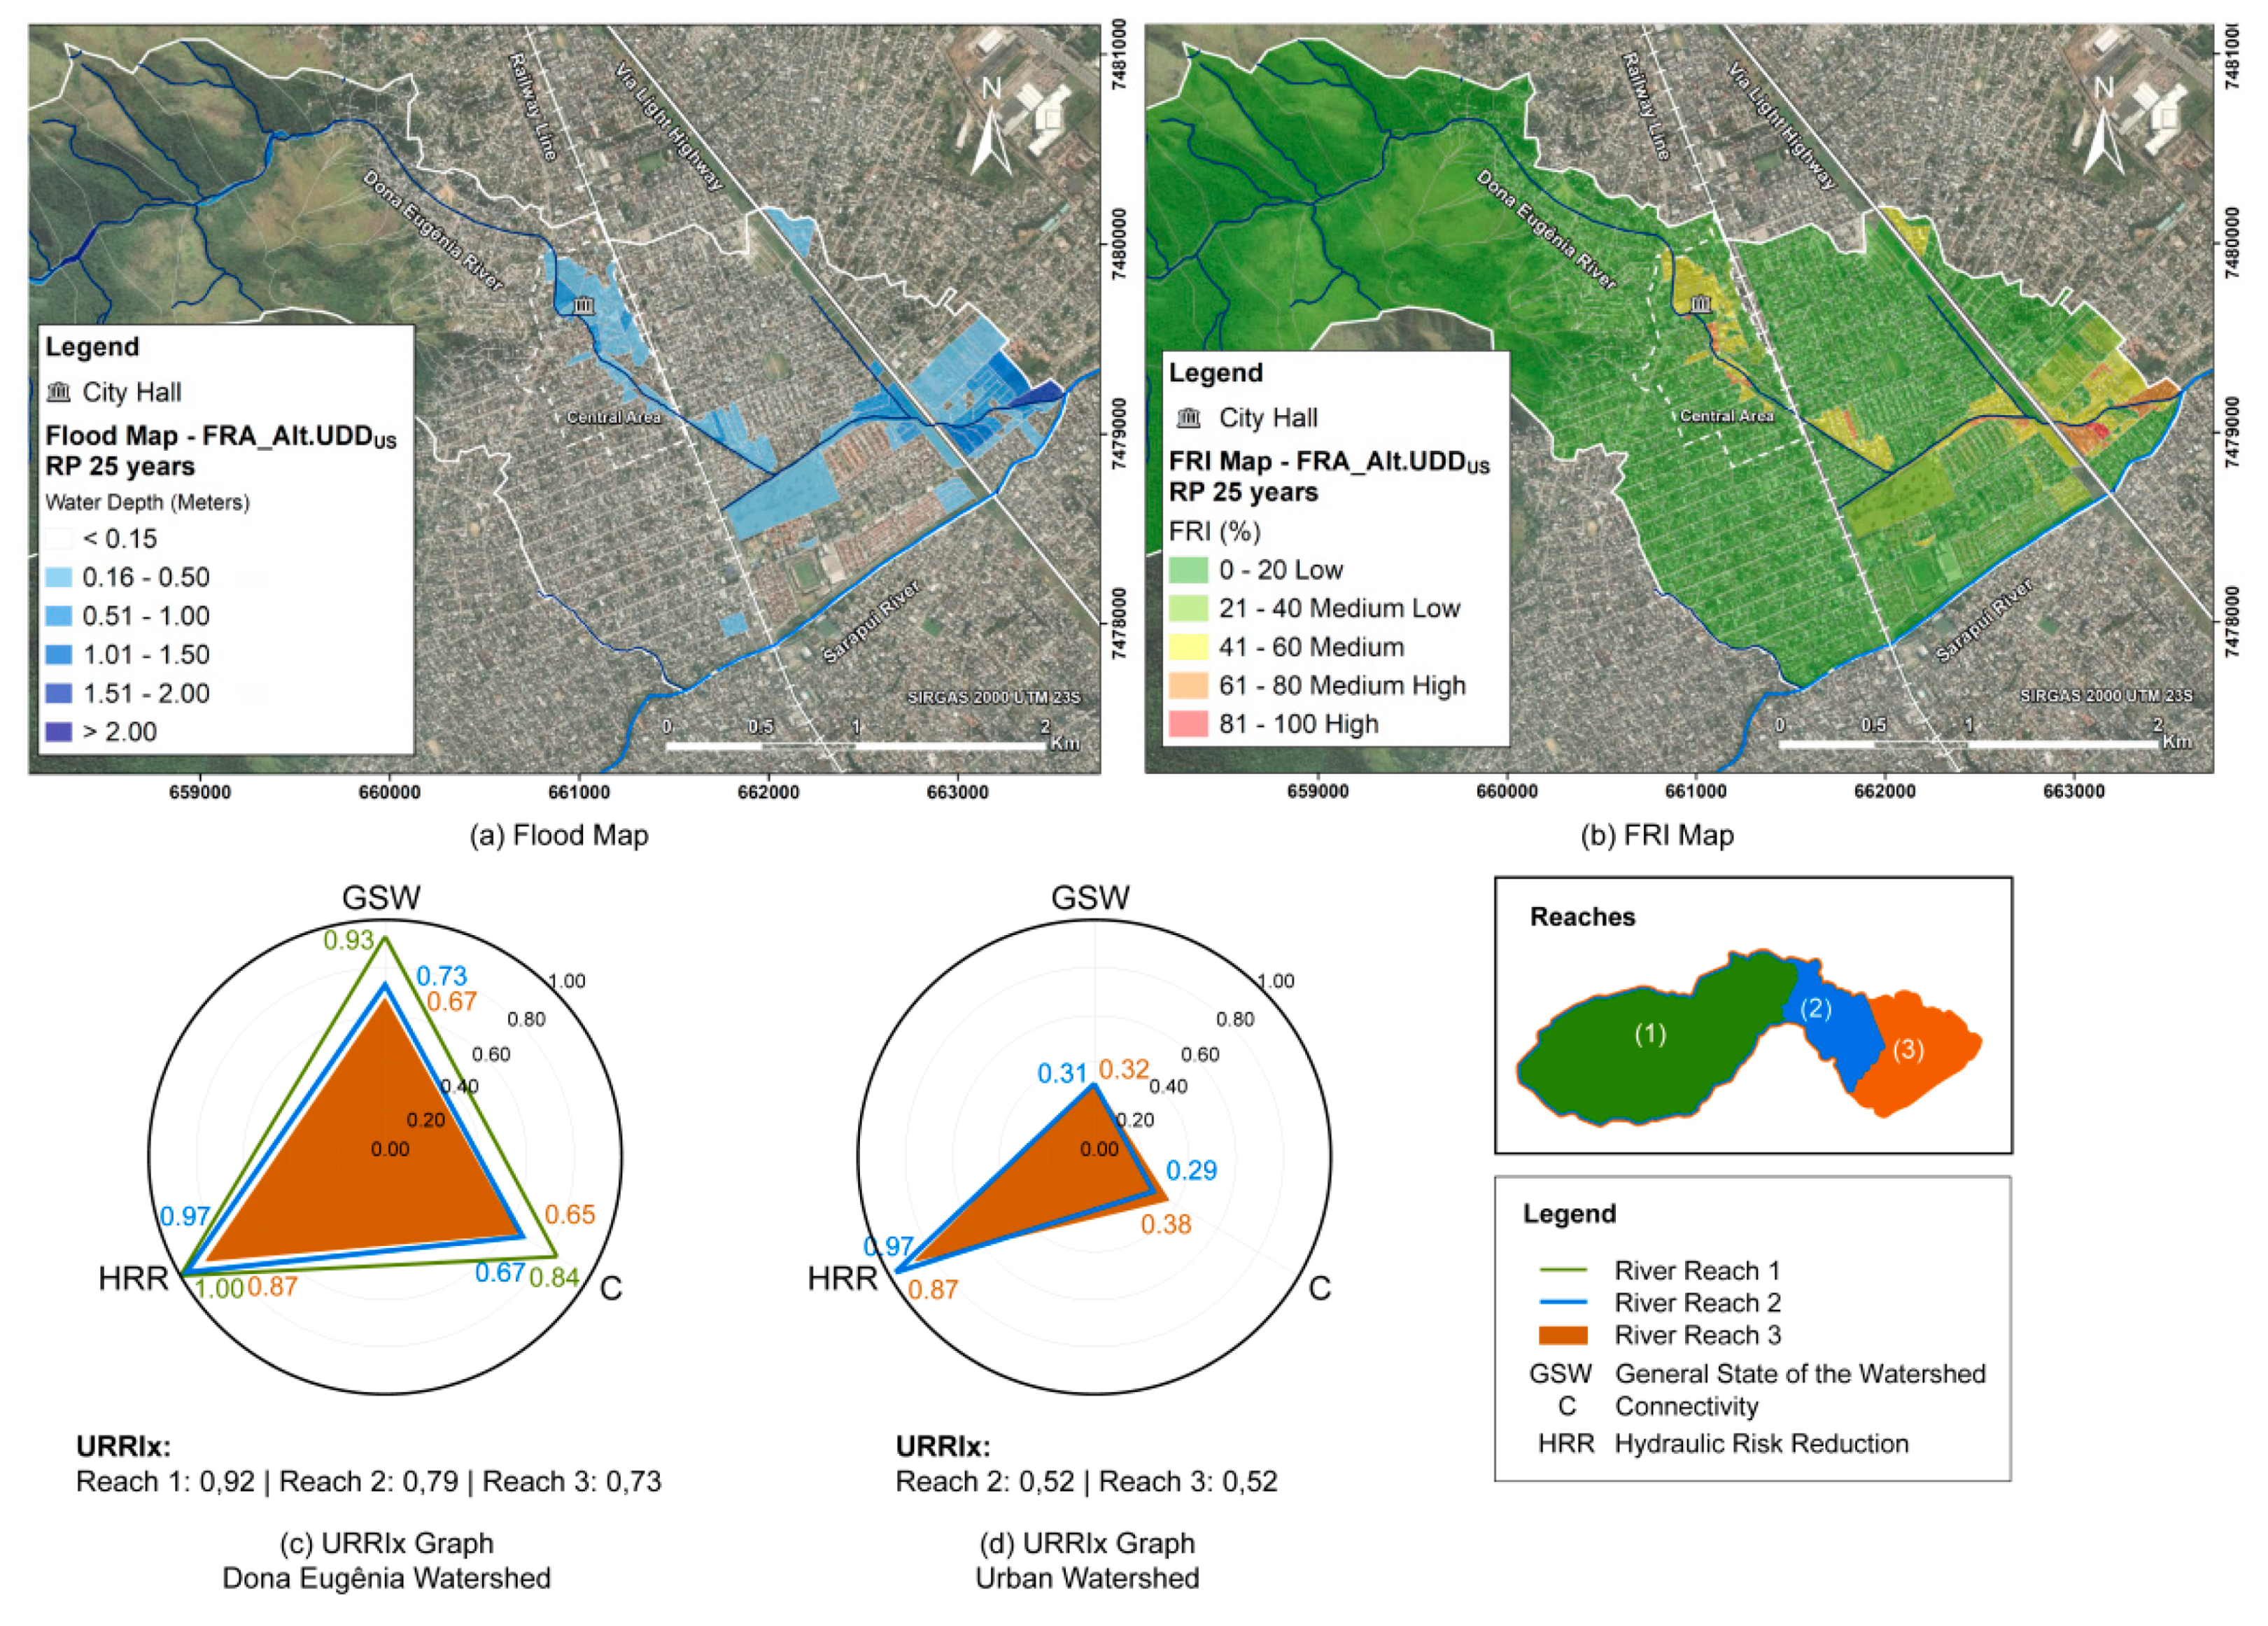
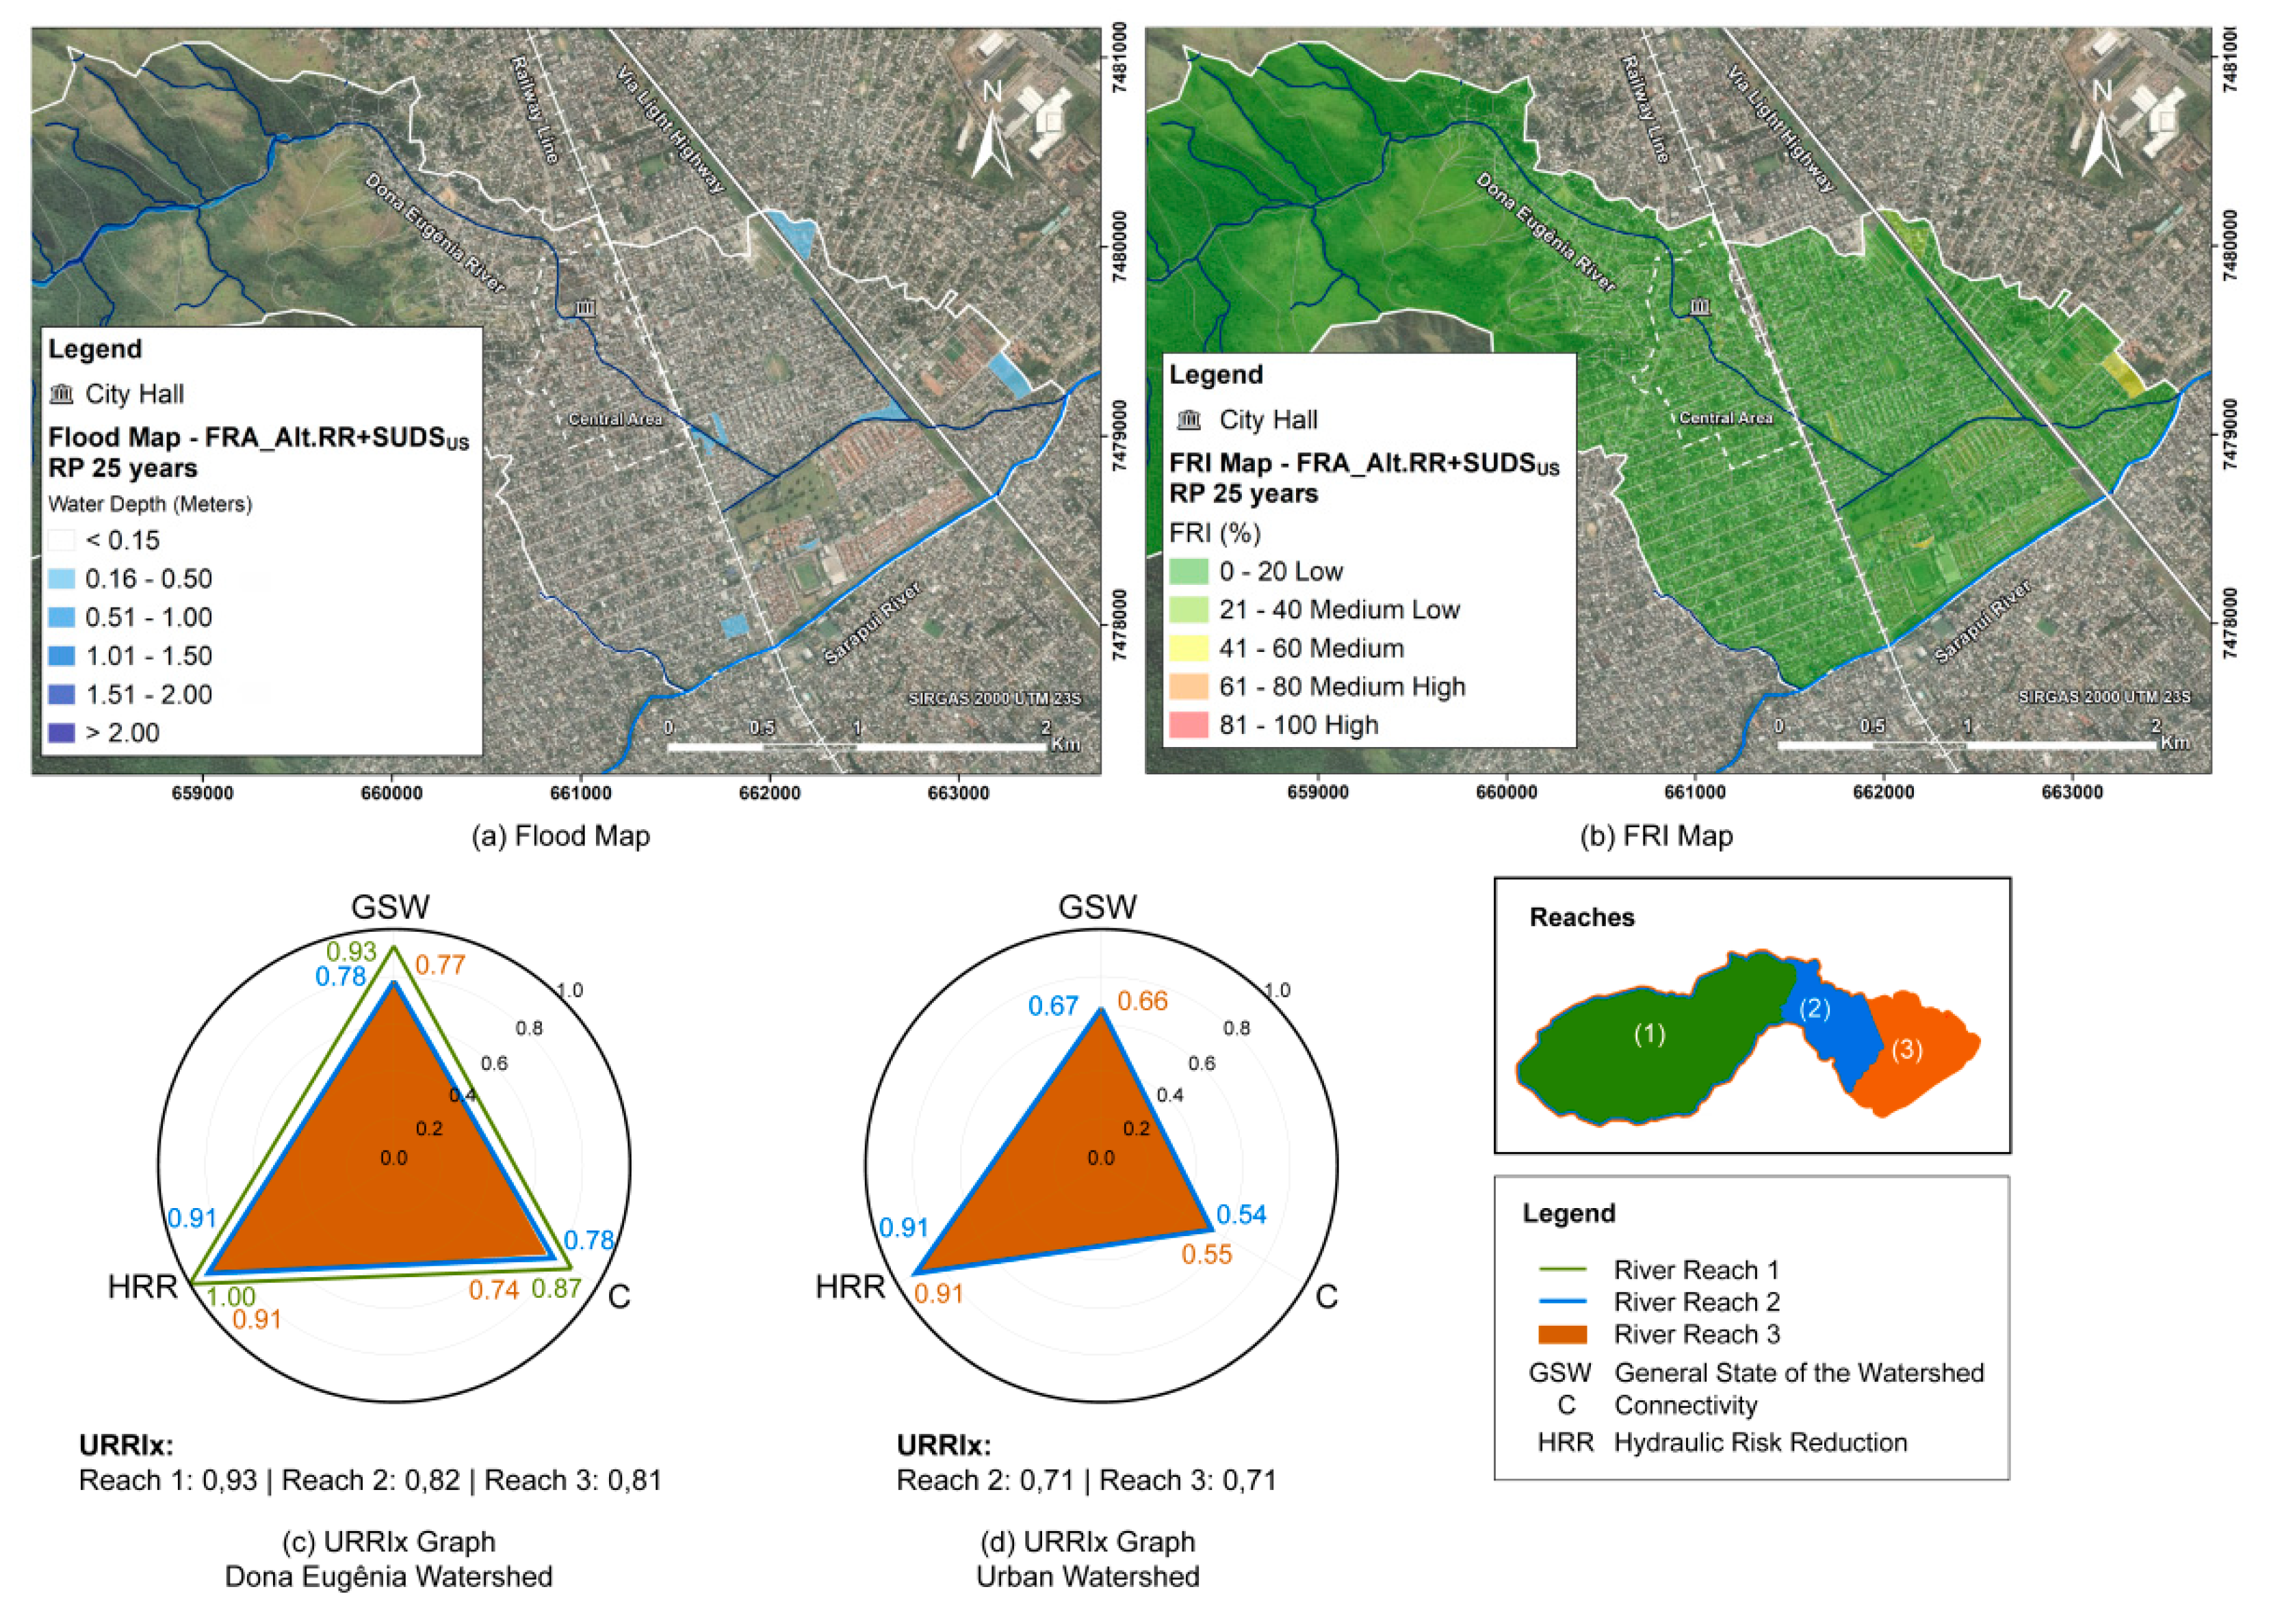