Classifying Aged Li-Ion Cells from Notebook Batteries


Chair of Electrical Energy Storage Technology, Technical University of Berlin, 10587 Berlin, Germany
*
Author to whom correspondence should be addressed.
Sustainability 2020, 12(9), 3620; https://doi.org/10.3390/su12093620
Submission received: 19 March 2020
/
Revised: 14 April 2020
/
Accepted: 28 April 2020
/
Published: 30 April 2020
Abstract
:A dataset consisting of 90 lithium-ion cells obtained from old notebook batteries containing their response to 100 charge–discharge cycles is presented. The resulting degradation patterns are assigned to four clusters and related to possible aging mechanisms. The records in the battery management system (BMS) of each battery are analyzed to understand the influence of first life conditions in the measured degradation patterns. The analysis reveals that a cluster of cells which experienced mostly calendar aging in 7–13 years hold ~90% of the rated capacity, and exhibit at 0.4 C discharge a linear capacity degradation throughout cycling comparable to new cells. In contrast, a cluster of cells that experienced extensive calendar and cyclic aging can lose ~50% capacity at 0.4 C discharge in a few cycles after reutilization. A model based on a boosted decision tree is applied to forecast the cluster of each cell, using as features the capacity measured in the first cycle, and the records obtained from the BMS. The highest accuracy (83%) is obtained through capacity, where misclassification arises from two clusters containing highly degraded cells with similar initial capacities, but divergent degradation patterns.
1. Introduction
The electrification of transport systems and the massive production of handheld devices contributes to the sustained growth of electronic waste, by generating tons of lithium-ion (Li-ion) batteries that will be discarded after their intended use [1]. A second life for discarded batteries could transfer their remaining capacity to stationary energy storage [2] and would reduce the pressure imposed on recycling. Examples of this rising interest in a circular economy for Li-ion batteries include 45 MWh of batteries retired from test electric vehicles (EV) installed as bulk storage to provide grid services in Germany [3,4,5,6,7], and the study of handheld devices for reuse [8,9].
To date, there has been extensive research on the concept of a second life [2], but documented experiments are limited to the work of Schuster, Martinez, and Tong [10,11,12]. Two gaps arise from this situation. First, the batteries used in demonstrative projects (e.g., [3,4,5,6,7]) are artificially homogeneous, because they experienced a comparable and brief use in a fleet meant for the demonstration of an EV model. Outside this controlled environment, second life projects will work with batteries that experienced different first life conditions, which will foster particular degradation modes after extensive aging [10]. Second, limited data is available to understand the complex interaction between the first life use conditions and the degradation patterns expected for second life batteries. This publication contributes to reduce both gaps by providing an open database containing the capacity decay of “real” second life batteries (for further information, please check Supplementary Materials).
One misconception that can appear from a homogeneous database is the definition of the state of health (SOH). In the case of Li-ion batteries, the remaining discharge capacity is often defined as the SOH, because of its correlation to the degradation rate measured under controlled conditions [13]. Moreover, this definition is considered a benchmark in the study of other methods to sort second life batteries [14,15,16]. However, sorting batteries using capacity as the SOH will yield errors, due to the absence of the first life conditions that distinguish the degradation mode behind the capacity loss. Barai et al. summarizes the need of additional information in the fact that “Different degradation mechanisms can lead to the same apparent capacity loss, and degradation can also occur without capacity loss” [17]. For this reason, a forecast usually needs a degradation history to predict an accurate trend [18,19,20], which in the case of second life batteries could be obtained from the battery management system (BMS) [21].
The BMS is a fundamental part of Li-ion batteries and performs mainly supervision and control tasks [22]. In the context of this research, the focus is placed on its memory function. A standard BMS records the conditions inside a battery using metrics such as the cycle count, temperature profiles, state of charge (SOC), and log of events, among others [21,22,23]. The content of these variables will be unique to each battery and represent only a fraction of the first life. On one side, there is a limit of memory space, which will result in the compression to single values (e.g., average, last measurement), a loss of information that will increase for handheld devices. On the other side, the BMS has a limited amount of sensors, which will make untraceable the individual experience of a cell, related to a heterogeneous degradation rate originating from inconsistent quality in the production process [24], and unequal connection resistances and temperature distribution inside a battery [25].
In a second life economy, a specialized company will analyze if a discarded battery can be reutilized [21]. In a process using the actual definition of SOH, the data recorded in the BMS could be applied to estimate the discharge capacity. Previous research demonstrated correlations between variables recorded by the BMS like the cycle count, charge throughput, and mean temperature, and the actual discharge capacity for a wide range of appliances, including EVs, electric bikes, and notebook batteries [9,14,23,26]. The main advantage of using the information in the BMS is that the charge and discharge process lasts hours when applying currents below the rated value (0.2–1 C), which is a common practice to measure capacity [12,14,15]. In contrast, the data from the BMS can be obtained faster, at the location of the battery, or remotely, if the device allows wireless communication. In the case of EVs, there may be significant advantages on following this approach, given their weight (>100 kg) and energy/power (kWh/kW), which increase the cost of measuring capacity. Besides, the BMS and the on-board computer of the vehicle may provide a large set of features correlated to capacity for each battery.
Retrieving data from the BMS requires a close collaboration between the companies handling aged batteries. For example, BMSs in electric vehicles use a CAN (controller area network) protocol, but the definition of the messages to retrieve specific information changes among EV manufacturers [27]. A similar problem appears for notebook batteries, where using the common protocol limits the query to a handful of variables [28]. Therefore, the support of the company involved in the program of the BMS is required. Other practical problems include cases when the BMS is removed from the battery, either by EV manufacturers during the transition (e.g., to protect sensitive data [21]) or by the second life enterprise to suit the second life application [21,29]. Last, a database will be necessary to train a model that relates data from the BMS to the performance in a second life. This database should at least contain the variables read from the BMS, test results obtained during the transition to a second life, and the degradation rate during reutilization, which may involve different companies in each item.
In cases where the data obtained from the BMS is insufficient to replace capacity as the SOH, or when this data loses representativity after the disassembly to modules or individual cells, it may be necessary to measure the discharge capacity. Yet, the records in the BMS may contain conditions related to use correlated to anomalous degradation rates present in a dataset, thus enhancing the information that can be derived from a single capacity measurement. In the following paragraphs are described variables useful to distinguish batteries exhibiting momentarily similar capacities, but for which different degradation rates are expected. The examples include the depth of discharge (DOD), SOC, charge rate, and temperature, which are present even in simple BMS designs [30]. In each case, the results are related to changes in the degradation modes. The reader should notice that there are several degradation mechanisms which can arise from situations beyond the ones described, which may be traced by other variables. For a deeper understanding of Li-ion degradation the reader is referred to [31,32].
Existing research shows that different capacity degradation rates should be expected for cells that experienced different DOD during their first life [10]. In this study, two cells were cycled at 0.94 and 1.2 V-DOD (the difference between the lower and upper cut-off voltage during cycling) until reaching 85% capacity each. The cell cycled at higher DOD revealed a slightly larger capacity degradation rate after both cells were reused applying identical conditions. In this case, a higher DOD implies additional phase transitions in both electrodes [13], and particularly, a larger fluctuation of the volume of the anode, given the higher relative volume increase of graphite during the lithiation process. The latter can result in additional wear to the already formed solid electrolyte interface (SEI, often signalized as one of the main degradation modes in Li-ion batteries [31]). This situation promotes further growth of the SEI and can also induce the particles of the active material to break [33], resulting in a larger capacity degradation rate due to the loss of lithium inventory trapped by the SEI, as well as capacity loss due to the damage of the active material in the anode.
The influence of the first life SOC can be inferred from [10]. In this study, new cells were stored for 84 weeks at 0–100% (the lower and upper cut-off voltage defined in the datasheet) and afterwards cycled applying identical conditions. After reaching 90% capacity, the cells stored at the highest SOC lost 0.5% capacity per equivalent cycle, whereas those stored at the lowest SOC lost 0.03% capacity/cycle. The lower degradation rate for cells stored at lower SOC may be related to a retarded growth of the SEI layer [13,34], allowed by the reduced electrochemical reactions between the delithiated anode with the electrolyte. However, cells that experience an extremely low SOC (overdischarge) may experience a higher degradation due to the appearance of a different reaction. Overdischarge can occur if batteries are left unattended for a long period, because of self-discharge or the parasite consumption of the BMS. This condition can result in the dissolution of copper particles present in the composite electrode of the anode, which can form dendrites, pierce the separator, and produce a short-circuit [35,36]. This degradation mode depends on the time spent at an overdischarge voltage [35], the overdischarge voltage [35,36], and when comparing cells using the same anode, the composition of the positive electrode [37], because it determines the apparent voltage measured from the cell terminals [38]. In this case, relying on capacity measurements can be misleading, because overdischarged cells can still provide in one cycle elevated discharge capacities [39]. Unfortunately, recording a low voltage state may be difficult because the BMS itself is powered from the battery, and will shut down under a certain voltage threshold.
Besides variables such as the DOD or SOC, keeping track of the charge rate and temperature may provide a correlation to batteries that experienced Li plating. An increasing amount of evidence shows that this degradation mechanism occurs after long-term cycling at normal temperatures such as 20–25 °C and charge rates of 1 C [40,41], and will be probably observed in batteries evaluated for a second life. The definition of plating stands for Li ions, that under high charge rates, low temperature, and/or extensive aging conditions, instead of producing the desired intercalation reaction into the anode, join an electron on the surface of graphite. The electrodeposition of Li starts a chain reaction that accelerates capacity degradation by increasing the contact of Li metal particles with the electrolyte, which in turn promotes further SEI growth, and by removing Li ions from the conduction matrix when this plated Li loses contact with graphite [32,42]. It has been shown that for aged batteries, cycling at higher charge currents and larger DOD foster this transition [42,43], correcting a common misconception about this degradation mode, previously thought to appear for cells reaching ~80% capacity. On the contrary, Li plating after extensive aging depends on the history of charge current and its interaction with ambient temperature [44], explaining that cells operated at low charge currents (0.2 C) at moderate temperatures can still maintain a linear capacity degradation reaching values below 60% [10]. The latter combined with the existence of reversible Li plating pose an interesting paradox for the SOH based exclusively on capacity. Batteries retired from an application will be at rest for several days before an evaluation. Part of plated Li is reversible, and thus can intercalate into the anode during a rest period after charge. During long rest periods, it has been measured that batteries can experience a capacity recovery of 6% after five days, regarding the last measured capacity [45]. Moreover, the magnitude of the recovery increases for cells that experienced extensive cycling, because more Li has been plated. Therefore, it may occur the paradox that batteries with higher capacities but with the conditions for Li plating show a higher SOH, over batteries with a reduced capacity but without this degradation mode. In this particular case, a history of charge rate coupled with temperature may even provide more consistent information than capacity for the SOH.
Regarding temperature as a variable, it provides a distinctive measure of degradation modes given its strong influence on the degradation reactions [31]. Extreme temperatures will be of particular interest, as high temperatures are related to the degradation of the electrolyte and the structure of the cathode, which may not be detected in a capacity measurement at low discharge rates [46], and low temperatures during charge, and its relation to Li plating [32].
2. Materials and Methods
2.1. Batteries
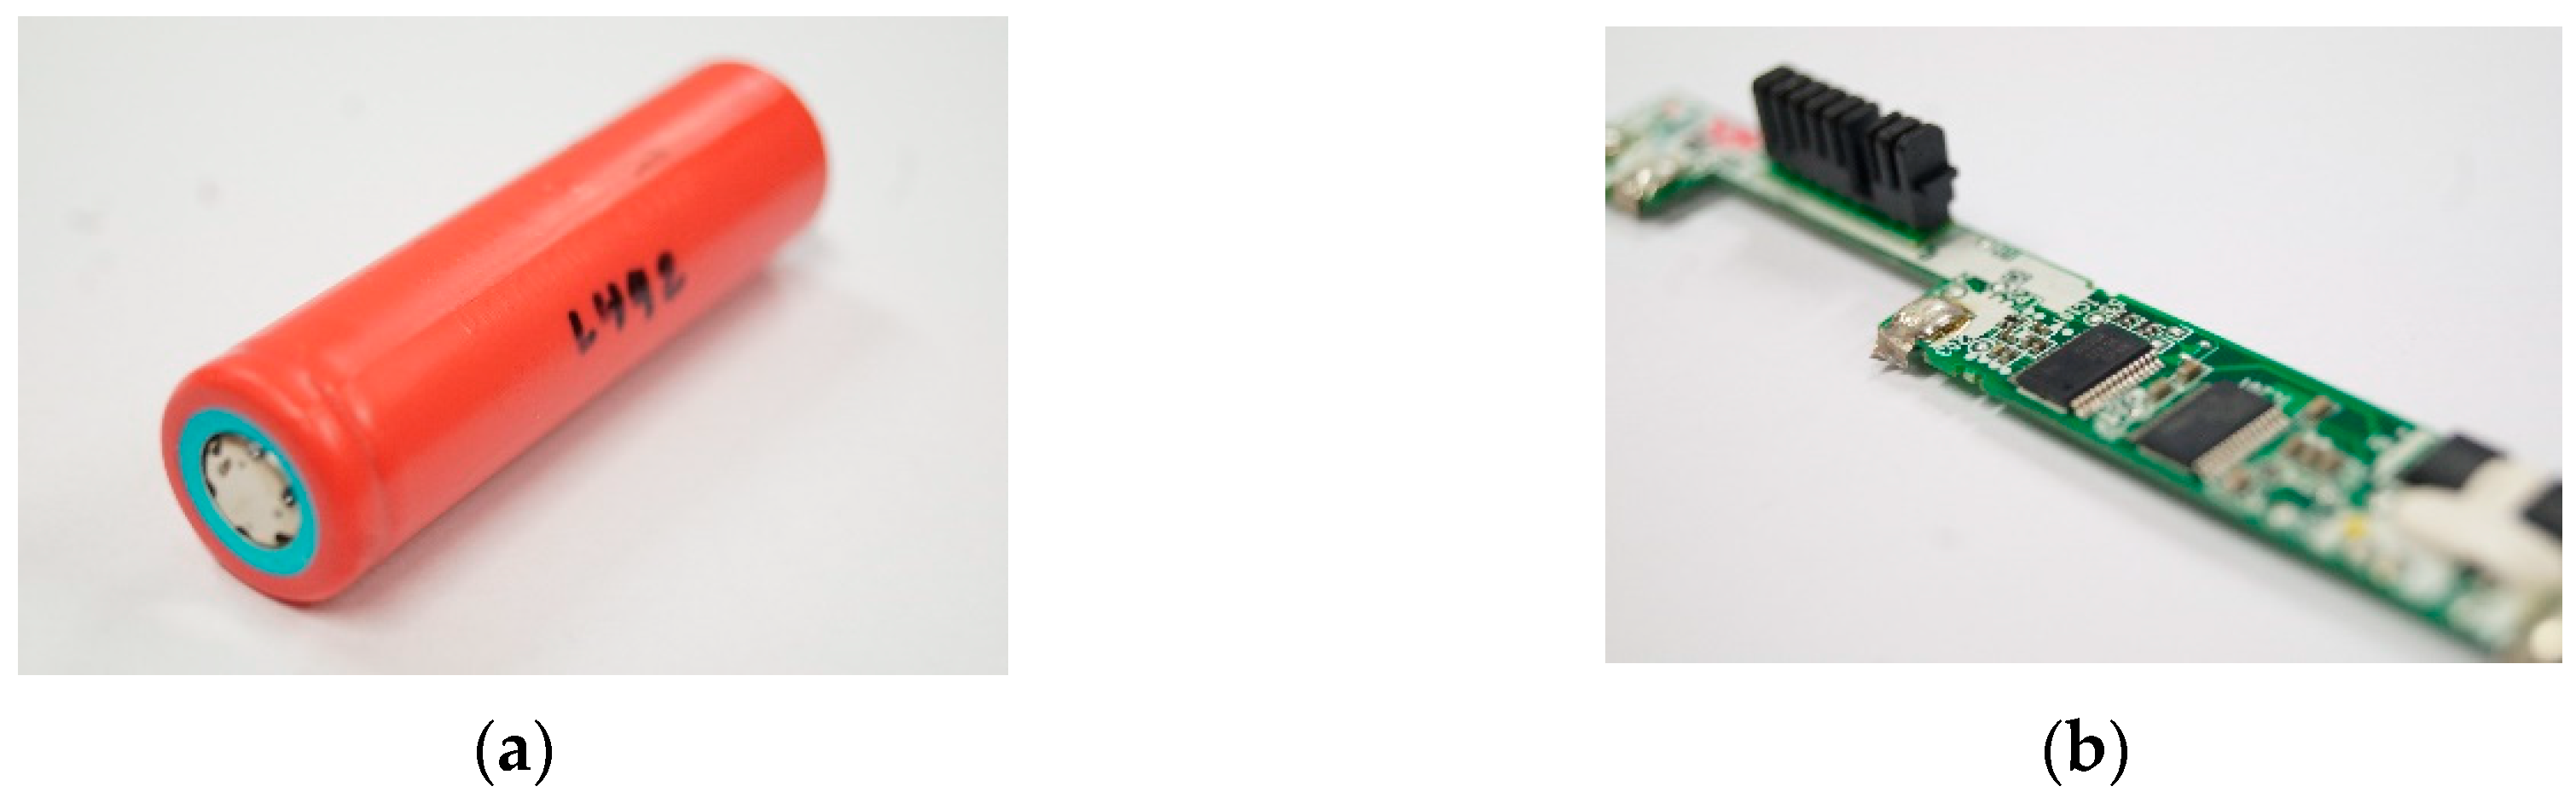
Twelve used Lenovo batteries, obtained from an open collection at the Technical University of Berlin, were disassembled to obtain 90 Sanyo UR18650FM cells, as shown in Figure 1a. Each battery contained 3 cells connected in series, and depending on the model, 2 or 3 in parallel. The rated capacity of each battery is defined as , where n is the number of parallel cells, and = 2.48 Ah is the discharge capacity of new cells [47]. All cells inside one battery have the same code printed on their surface, which represents their date of production and defines a batch. However, each battery in the dataset was built with cells produced in a specific batch. The weight () of each cell was provided in this dataset to track the consistency among batches.
Variables stored in the BMS were obtained using a custom device built based on [48] (the data obtained was later corroborated for certain batteries with the analyzer EV2300 from Texas Instruments, which is a device designed for the same purpose). This information in the Lenovo batteries is stored in the integrated circuit bq8030, as shown in Figure 1b, manufactured by Texas Instruments. Then, for each battery is obtained the manufacture date (day-month-year), the full charge capacity (Ah), the design capacity (Ah), and cycle count . Considering the definitions of these variables in the common protocol for notebook batteries [28], the following variables are defined (Equations (1)–(3)):
where is in years, is a proportion, and an integer, the two latter divided by a coefficient to compare capacities and cycles of batteries with different design capacities recorded in the BMS. Notice that contains a sub-index related to the date of the test for each cell i tested in Section 2.2, whereas and are equal for cells obtained from the same battery. Variables 1 and 3 are normalized, dividing all values by the maximum value in each column of the dataset.
The voltage of each cell was measured after disassembly with a multimeter. Notice that similar information may be retrieved from the BMS, if the address where this variable is stored is provided by the company involved in the program of the BMS. Unfortunately, this was not possible in our case. A variable representing overdischarge is calculated considering the cut-off voltage for this cell type = 2.8 V [47] (Equation (4)):
2.2. Cycling
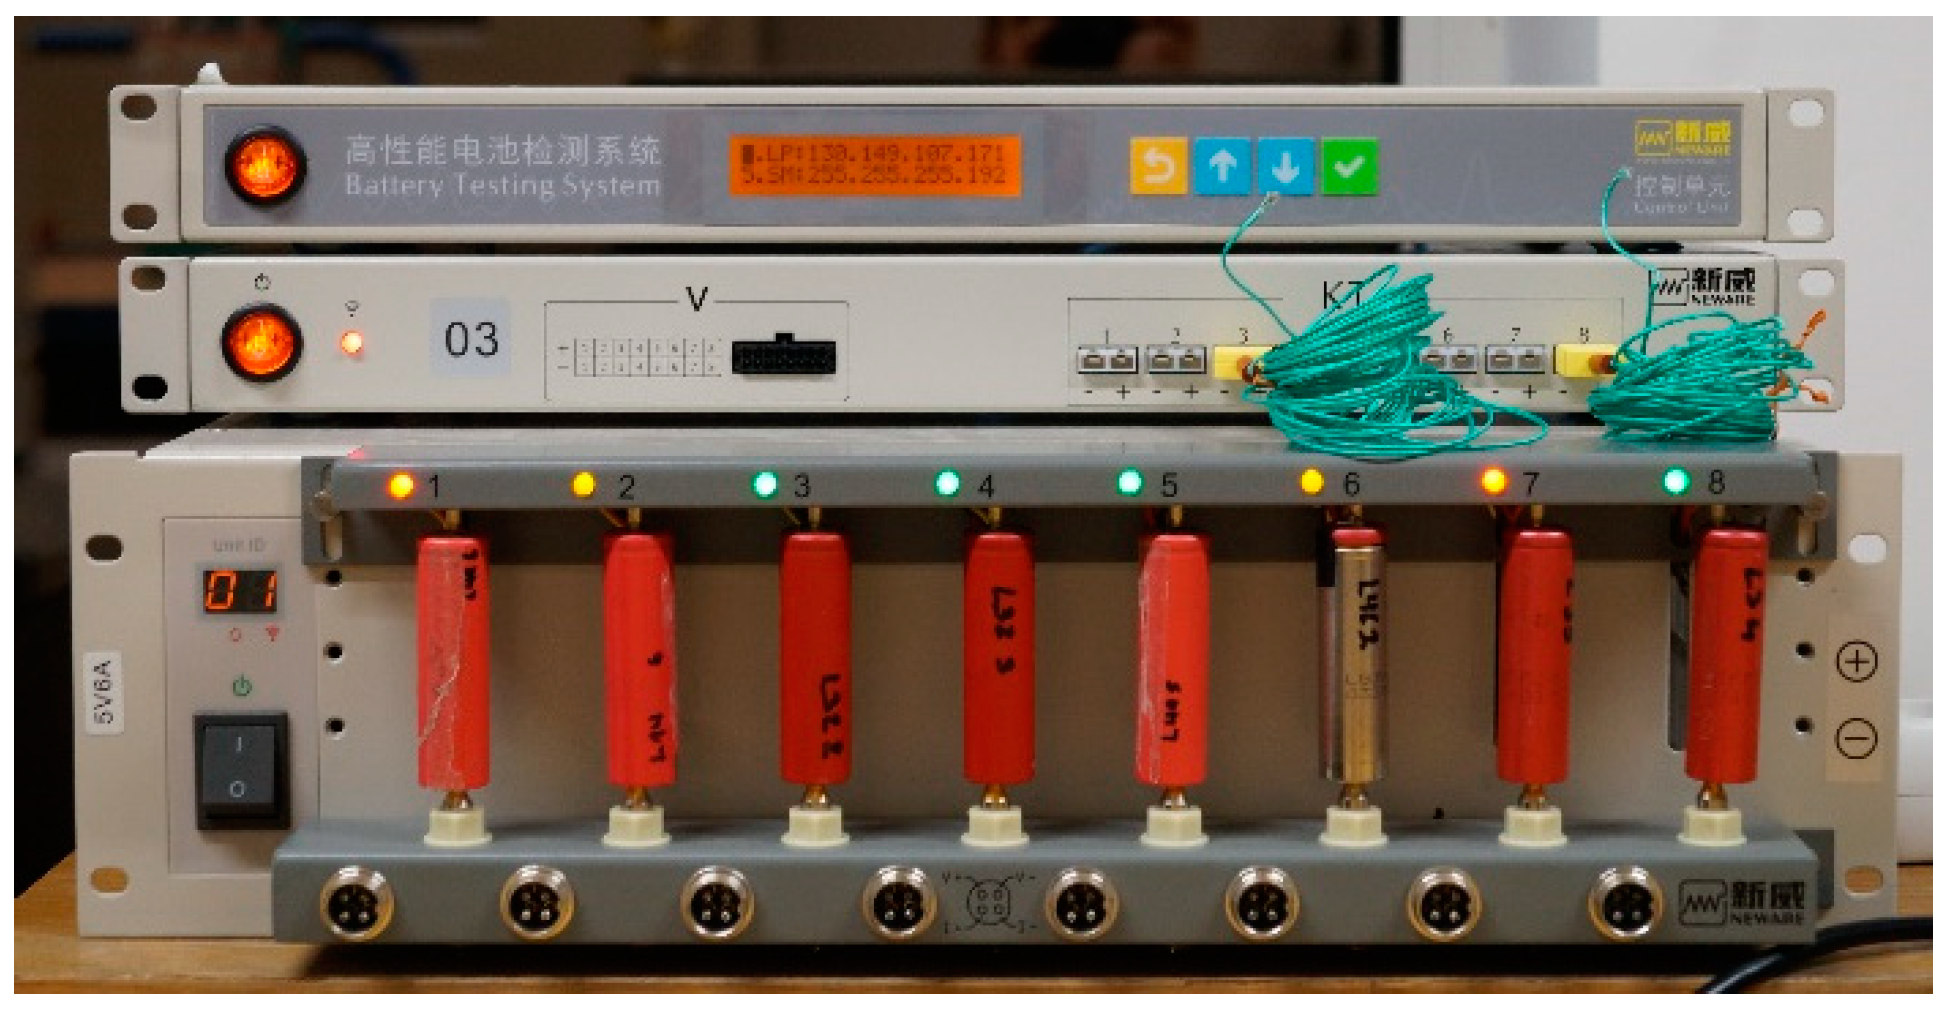
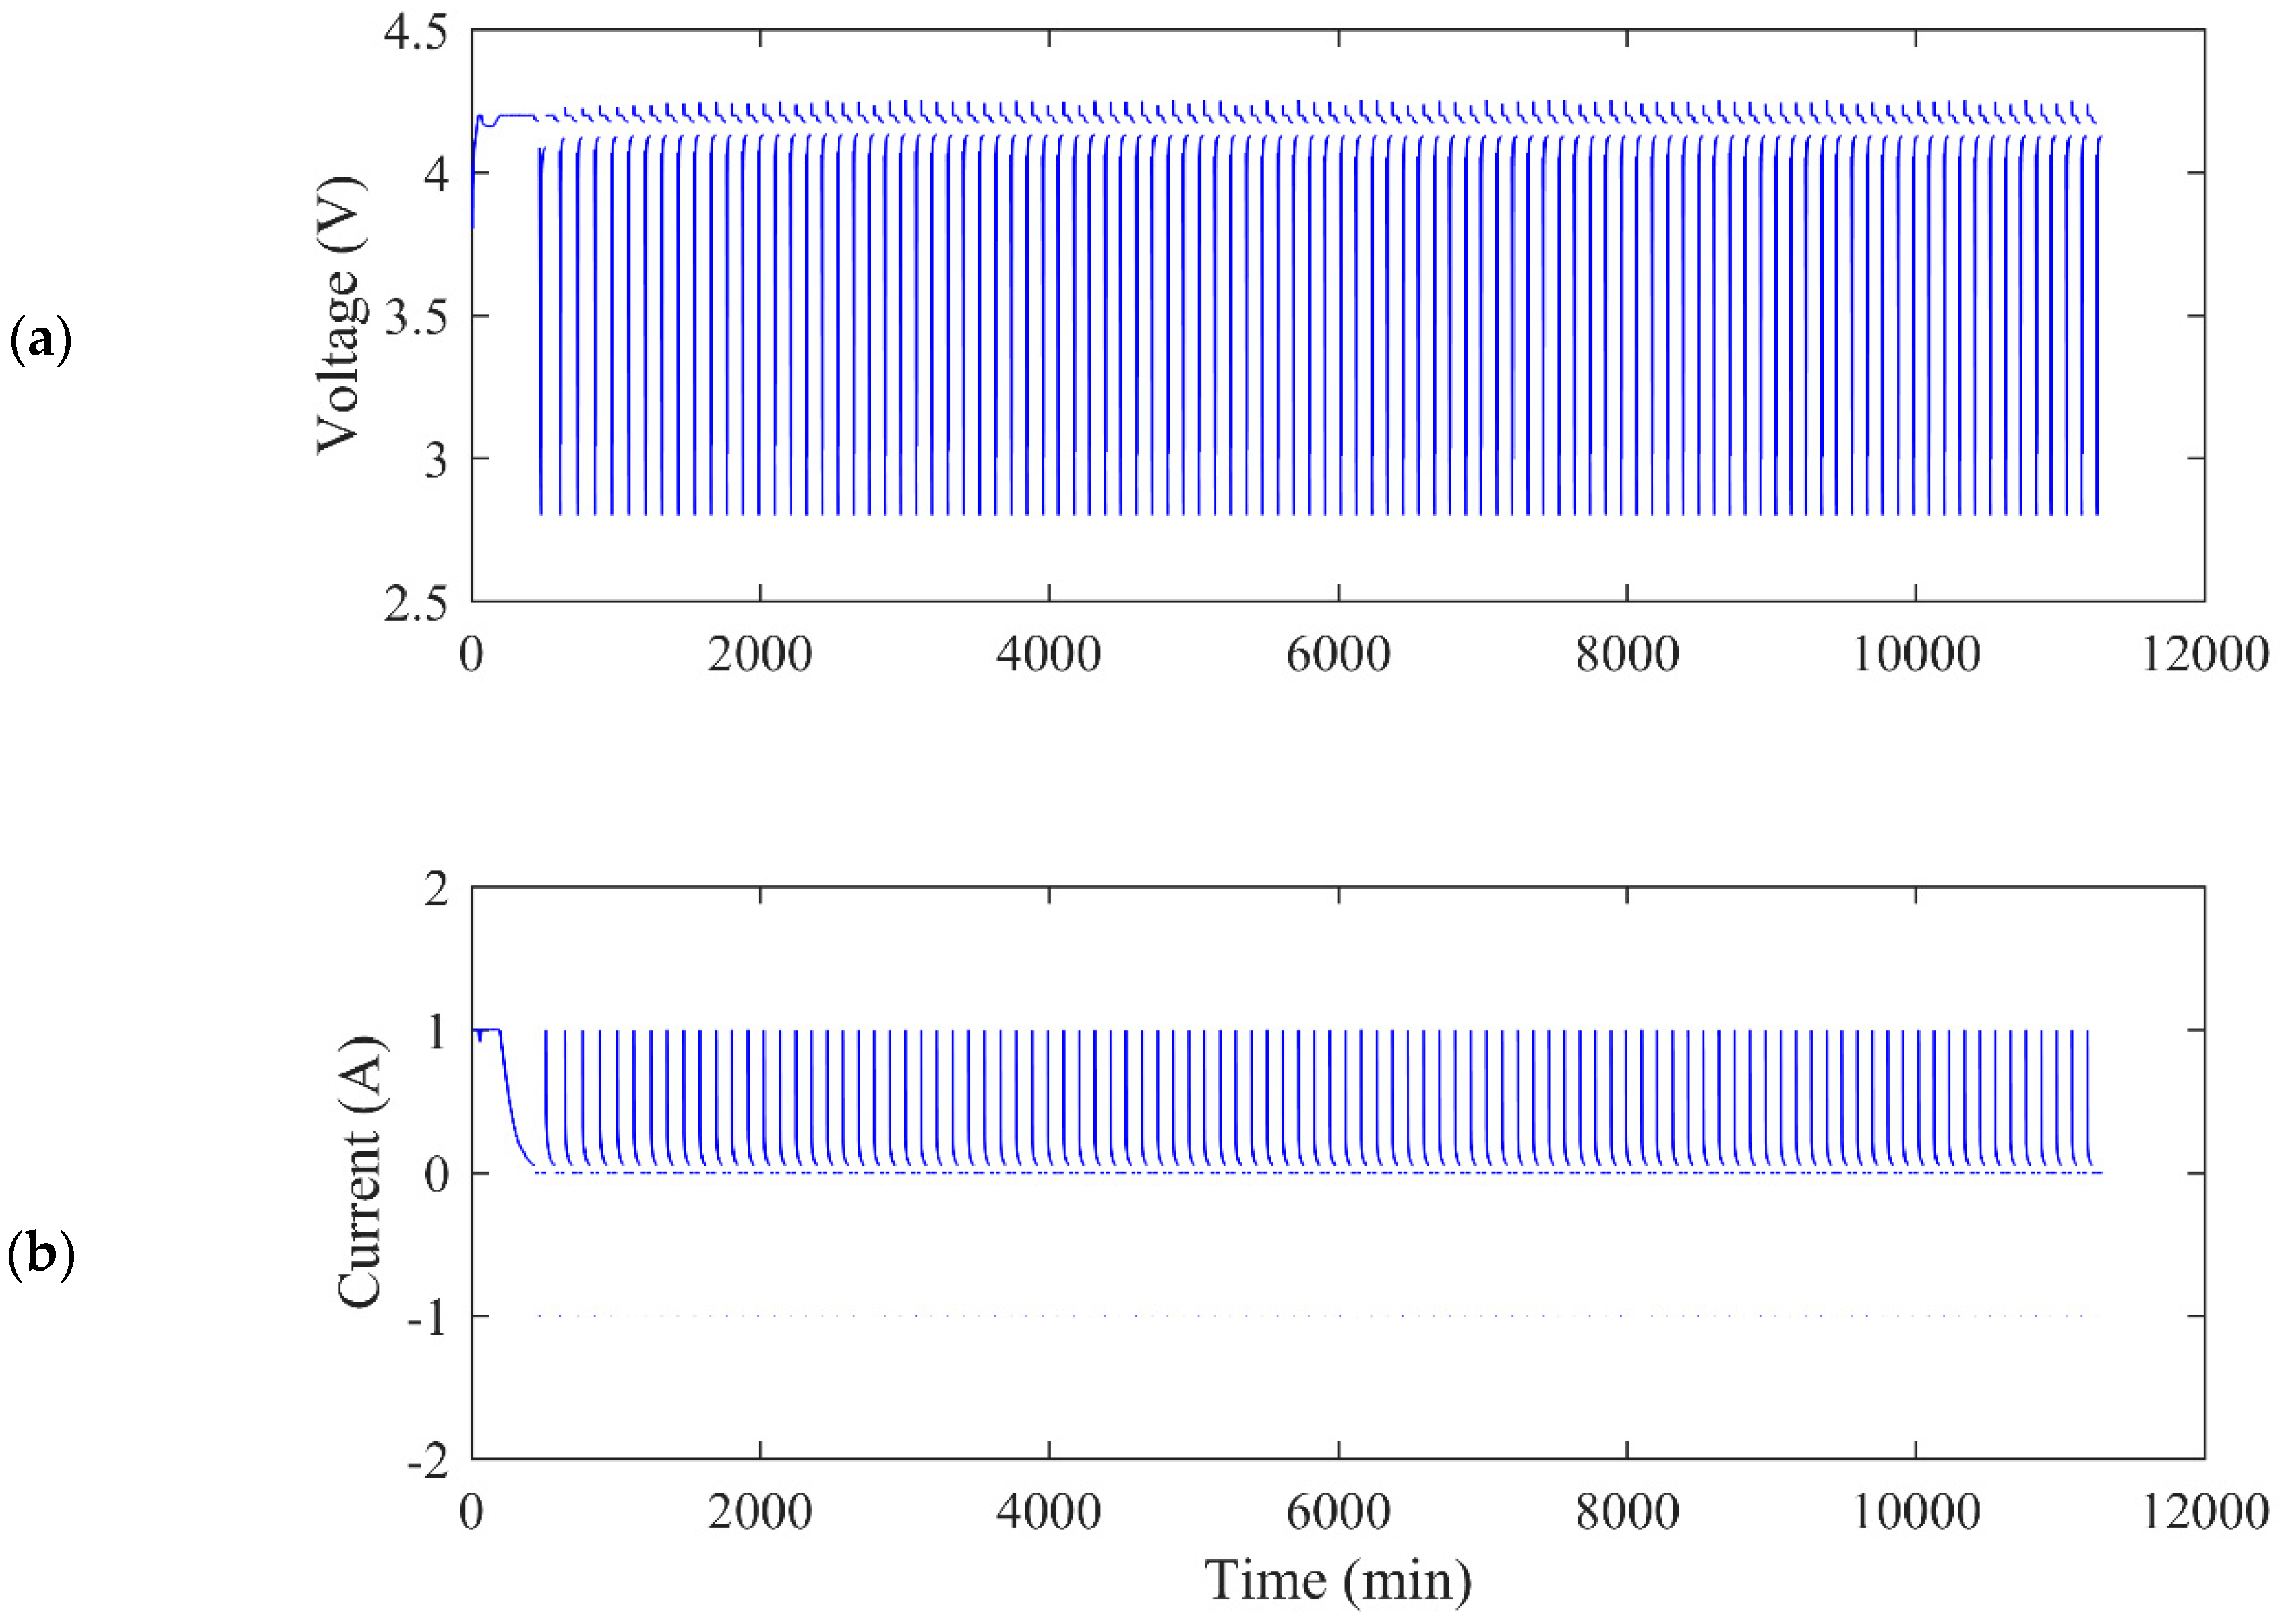
All cells were cycled using a Neware CT-4008 [49] following the steps described in Table 1 (Test steps are based on [47]). Figure 2 shows the setup, located in a room where temperature was controlled by an air conditioner set to 25 °C. The conditions of this test, i.e., charge discharge at 0.4 C, 100% DOD, and ~25 °C, can be considered a normal test for Li-ion batteries [17]. Current, voltage, and ambient temperature were measured at 1 sample/min. To reduce correlations between cells obtained from the same battery and a particular ambient temperature profile, cells from different batteries were preferred for parallel tests using the 8 channels of the cycling equipment. From the test is obtained (Equations (5)–(7)):
where is the capacity measured at cycle in proportion to the rated value , and temperature is the ambient temperature averaged between the beginning and end of each discharge cycle. Rows in and correspond to the measurements for a specific cell, and each column represents a cycle.
In the short term, temperature fluctuations in this test produced proportional changes on the discharge capacity. This occurs because the exchange current densities, the solid and electrolyte phase diffusion coefficients, and the electrolyte phase conductivity depend on temperature [50]. Therefore, a capacity–temperature dependence was calculated to remove part of the fluctuations induced by temperature. Two matrices comprising the differences and were obtained, with 99 columns each. For each row, data pairs where simultaneously > 0 and < 0 were filtered, because it was presumed in this case to have a permanent capacity loss. Then, a linear regression between the filtered arrays and provides a slope for each cell, and the row vector contains this short-term capacity–temperature dependence. Finally, the capacity of each cycle and cell was corrected to = 25 °C, applying Equation (8):
The validity of the proposed temperature correction is described in Appendix A, and examples portraited in Figure A1 and Figure A2.
2.3. Classification
The matrix is clustered running -means algorithm [51]. The algorithm works as follows. To start, observations are drawn from the rows in and chosen as a “centroid”. Then, the Euclidean distance from each centroid to all other rows is calculated. Each row in is assigned to the nearest centroid, defining a cluster. A new set of centroids is calculated from the average of the rows in each cluster, and the distance of each row in is updated using the new centroids, and again, each row is assigned to the cluster according to the shortest distance to the new centroids. The process is repeated until cluster assignments are maintained, or the algorithm reaches the maximum number of iterations.
The result of -means depend on the initialization seeds that lead to choose the rows to start the algorithm. The latter implies an unstable assignment for cells that show degradation patterns at the borders of each cluster. Therefore, the smallest number of clusters with a stable classification after repeated runs was chosen (k = 4), that simultaneously was not trivially distinguishable, only by the capacity at the beginning of cycling, due to the reduced sample of cells in certain capacity ranges. Each cell was then assigned a cluster = {A, B, C, D} ordered from the lowest to the highest degradation pattern. Afterwards, the degradation rate at 10th and 100th cycles were calculated, and analyzed to recommend a possible second life (Equation (9)):
A boosted decision tree was programmed in python using the libraries provided by XGBoost (Chen and Guestrin), to compare the relative value of measuring the discharge capacity and the information available in the BMS to estimate the cluster of each cell. Boosted decision trees correspond to a category of algorithms designed to reduce the overfitting produced by simple decision trees, providing an ensemble of trees for which the final decision is taken on a weighted sum of the individuals. In the case of boosted trees, they are built sequentially using the results provided by previous trees. A detailed explanation can be found in the following reference [52]. The hyperparameters were tuned by trial and error with the focus to increase the accuracy score while maintaining a low complexity (for example, reducing the number of nodes), a common practice for this type of algorithm. The following feature matrix and objective were used to train and test the classification model (Equation (10)):
where = represents the capacity that would be measured at the transition to a second life, and the clusters represent the destination for these cells. The relative contribution of each variable was obtained by creating models with combinations of the features in .
The algorithm was applied using a k-fold cross validation (k = 12). During cross validation, the dataset is typically divided into equal number of observations and a fixed percentage assigned to a training dataset (e.g., 11/12, ~91%) and a test dataset (~9%). This assignment changes each round until all data points have been part of the training dataset 11 times, and 1 time in the test dataset. We applied an unconventional approach, grouping the observations obtained from each battery, which leads to a changing relative size of the training and test dataset at each round, because of the total amount of cells in each battery (the size of the test dataset can change between 6% to 10%). This means that during each rotation of the dataset, the information provided by 11 batteries was used to classify a 12th battery, which is the case when batteries are not disassembled to a cell level.
3. Results
Table 2 contains statistics of the dataset, for which the distribution of calendar aging starts at 7.2 and ends at 12.9 years, the last capacity measured by the BMS is in the range 7–98%, the cycle count is in the range 7–490 cycles, overdischarge is found between 0–100% (normal/overdischarged), and the initial capacity measured during cycling is in the range 0–93%. Regarding the consistency of the cells in the dataset, Table 2 shows a difference of 1.42 g between the lightest and heaviest cell. Inspecting these values reveals a small bias among batteries, which may be related to changes in the processing line between the date of production [53]. Nevertheless, the mean 45.46 g is comparable to the mean obtained in another study for this cell type (45.62 g [47]), and the extreme values 44.8 and 46.2 g are clearly distinguishable from other cells of different brands in the 18650 format (e.g., 32.2, 37.9, 44.6, 46.7 g [47]).
Outliers are explained in this paragraph. The minimum capacity = 0 corresponds to cell i = 72 obtained from battery #10. This cell was found overdischarged ( = 99%), and after two charge cycles in our previous study [39], showed an abnormally high self-discharge rate during rest periods. This cell was assigned a row of “0” capacity in the matrix . However, battery #10 contained cells with average capacities = 40–78% and cycle count = 162, highlighting the relevance of cell-to-cell heterogeneity of second life batteries. Other anomalies are related to the interruption of the cycling equipment. Fifteen cells experienced a rest of 2/3 days between certain cycles, a rest that produces spikes on capacity measurements unrelated to temperature fluctuations. Last, for seven cells the cycling tests were interrupted, due to the shutdown of the Technical University of Berlin after the outbreak of the corona virus in Germany (identical reason for cells with undocumented weight).
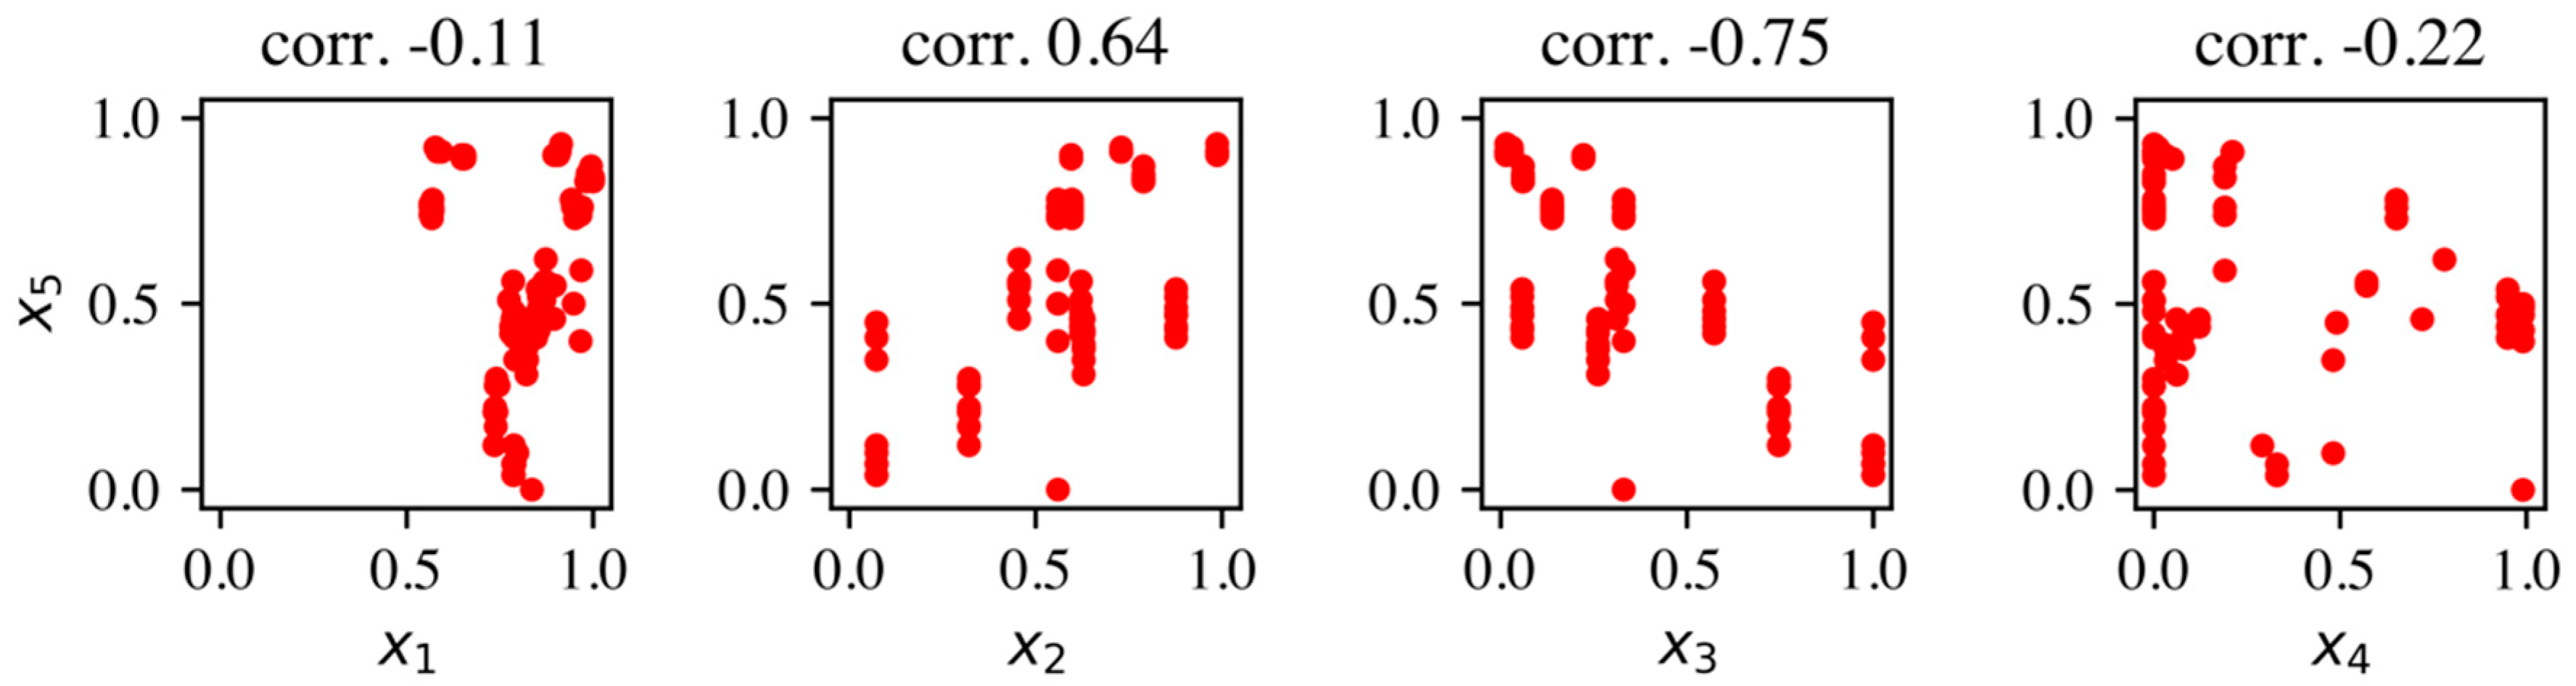
Figure 3 shows correlation plots of variables to and the first discharge cycle . On average, higher capacities were measured for cells with lower calendar time, number of cycles, and overdischarge; and higher capacity recorded by the BMS. However, the dispersion of the data will lead to a strong influence of cross validation on the conclusions that can be derived from this dataset. The high correlation calculated between and the capacity (−0.75) suggests that the cycle count may provide the most consistent information in the BMS to estimate the capacity and will be analyzed in detail in Section 4.
Table 3 contains the Pearson correlation coefficients between the features in , from which outstands the correlation between and (−0.91)—higher cycles are correlated to lower capacity measurements in the BMS, a fact depicted by Figure 3b,c, which appears as similar scatter plots reflected from the vertical axis. This may occur because one of these variables is calculated using information from the other. Given that the cycle count is defined as the sum of charge throughput, which can be obtained directly from the current sensor, and that the last read capacity lacks a definition in the dictionary of these variables [28], is discarded on the basis that it provides redundant information for the analysis.
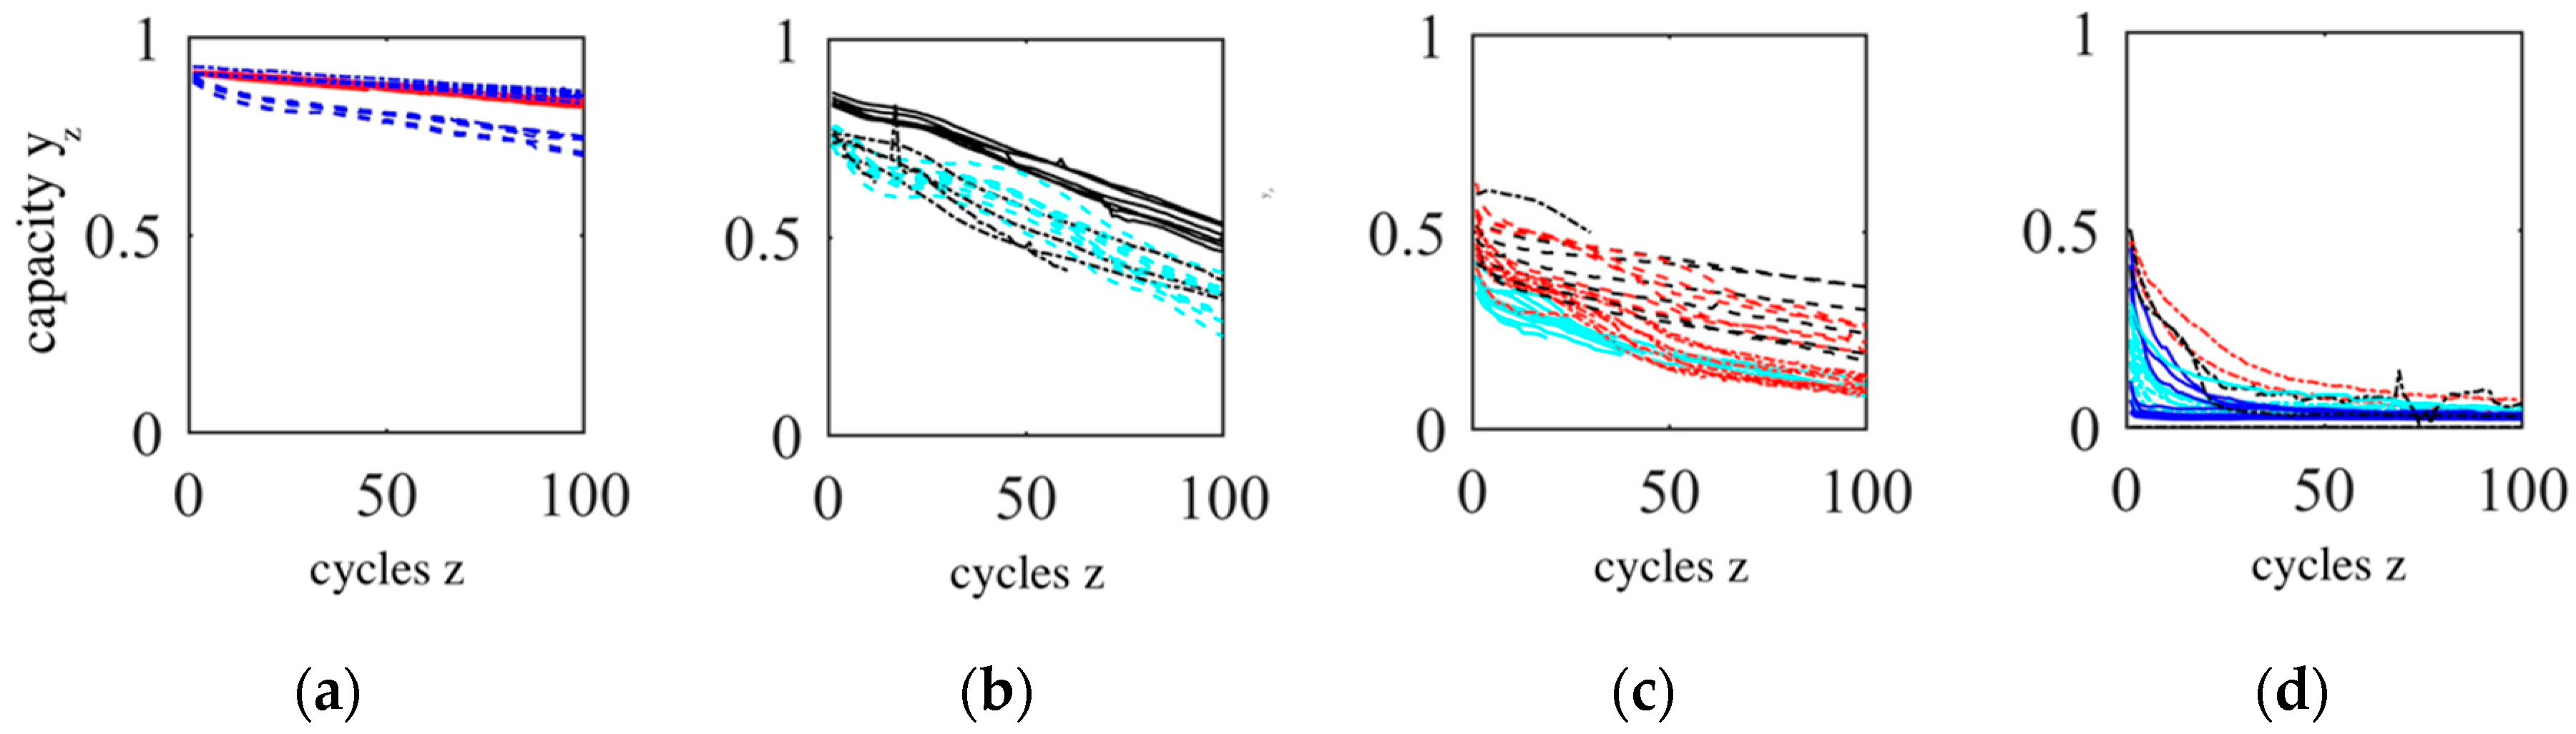
Figure 4a–d shows clusters A, B, C, and D assigned through k-means. Cells obtained from the same battery are plotted with the same color and line style, and the legend is found in the description of the figure. Figure 4a provides an example of the different degradation rates exhibited by cells which momentarily hold a similar initial capacity of ~90%. In this case, cluster A contains cells where the degradation pattern is correlated to the battery of origin, and therefore, to their first life use. Overall, the four plots in Figure 4 illustrate an expected degradation trajectory for second life batteries of this cell type. Under the conditions of this test, a battery aged for 7–13 years will probably lose 90% capacity after 300 cycles.
Table 4 demonstrates that the most relevant feature of each group is the capacity . Indeed, clusters A and B are separated by the initial capacity, observed in the range of capacity 89–93% and 73–87%, respectively. In the case of clusters C and D, there is an overlap in the ranges 35–62% and 0–50%, respectively. In comparison, variables like are less correlated with each degradation pattern. For example, cluster A shows a range of 7–109 cycles against cluster D with 28–490 cycles. The overlap of the cycle count will make difficult the task of a classification algorithm based on this feature, because highly degraded cells were also obtained from batteries with a low cycle count. In the case of variable , overdischarged cells are more frequently found in clusters C and D, but cells found at normal voltages ( = 0) are present in all clusters, which will also derive in a lower contribution of this feature for classification. Unfortunately, the calendar time does not distinguish these clusters, even when some cells show differences of 5 years, which should yield a certain difference in their SOH.
4. Discussion
The cells in cluster A show a linear capacity degradation throughout cycling, which may be related to a steady growth of the SEI [13]. These cells start cycling with capacities = 89–93% after a calendar aging of 7.5–11.8 years. Such a low degradation during this time would only be possible if they experienced mostly calendar aging, which is correlated to the data obtained from the BMS. The cells with the lowest degradation rate = 0.04–0.09%/cycle were obtained from batteries #3 and #9, which exhibit the lowest cycle count in the database, = 15 and 7, respectively. In contrast, the cells that exhibit the highest degradation rate in this cluster = 0.19%/cycle were obtained from battery #12 with a larger cycle count, = 109. The cells may be used in a similar environment than the one for which they were designed (reutilization), given that their degradation rate at similar conditions is comparable to new cells ~0.05%/cycle [47]. However, this should be done acknowledging that aged cells may enter a stage of accelerated degradation before the one expected for new cells, and that they probably show a reduced power capability that is not registered by the discharge rate used in this test (0.4 C), due to a higher impedance derived from calendar aging. A more conservative approach would imply redefining the conditions for a second use (repurposing), for example, by operating them at lower charge/discharge currents [10].
The capacity of cells in cluster B show in the long run a linear degradation rate, with marked oscillations in between that are independent from temperature fluctuations during the test. Moreover, a clear correlation between the oscillation patterns is observed for cells obtained from battery #11 in Figure 4b, demonstrating the relation between first life conditions, and the degradation patterns that will be observed during a second life. The cluster is characterized by capacities in the range = 73–87% and a cycle count in the range = 29–162. Considering that the cells in this cluster show on average a degradation rate = 0.32–0.49%/cycle, ~ 10 times larger than a new cell, this cluster is recommended for repurposing.
The cells in cluster C are characterized by capacities = 35–62%, a cycle count = 28–281, and degradation patterns that show erratic behavior. On one side, the patterns of cells obtained from battery #7 reveal that some cells maintain a linear capacity degradation rate, although their initial capacity is in the range = 42–56%. This supports the conclusions obtained by Schuster [10] that specific use conditions can allow an extension of the linear degradation phase beyond the commonly addressed limit of ~80% capacity. Unfortunately, the records from the BMS are insufficient for an explanation of the conditions that allowed the extension of the linear phase. Moreover, this is a rare case in this cluster, where most cells exhibit an exponential degradation in the first cycles, and notorious oscillations in the complete cycling length. The cells in cluster C would be recommended for repurposing in low power devices like the ones proposed by Schneider et al. in [8], given that the large differences in the degradation rate = 0.16–0.45%/cycle increase the uncertainty on the performance in a second life. Additionally, their substantially reduced capacity implies the cells will have to be replaced frequently.
The cells in cluster D show an exponential capacity decay that starts from = 5–50% (exempting an outlier explained in Section 3) and ends around 3%, with a rate in the first ten cycles between = 0.15–3.02%. The overall range = 28–490 overlaps with the other clusters and is the reason that will lead to the lower relative accuracy of a classification model based on the cycle count, in relation to capacity. This group also warns that capacity can provide inaccurate information to classify second life batteries—cells for which capacity is found in the range ~40–50% can exhibit a pseudo-linear degradation of capacity and be assigned to cluster C, or an exponential degradation of capacity and be assigned to cluster D. Regarding the exponential decay depicted in Figure 4d, we think that this degradation mode may be related to the results documented by Epding et al. [45], where cells experienced extensive cycling with intermittent rest periods. In the referenced experiment, there was a sudden capacity recovery measured after pauses that “vanished” exponentially within the first cycles during operation. The reason for this degradation pattern was related to reversible plated Li, that during the rest period reintercalated into the anode. This occurs because once cycling is resumed under the same conditions of charge, the degraded structure of the cell drives the remaining Li ions to plate, explaining the exponential decay.
An unusual situation was observed for five cells in cluster D, and one cell in cluster C. Three cells exhibited an abnormal current increment in the CV phase during the first cycle (example in Figure 5), and three other cells showed an abnormal diminution of voltage during the CC charge phase. Four cells were obtained from battery #6, which has the highest cycle count in the database = 490. A plausible explanation of this behavior is the fracture of the SEI layer, occurring due to the increase of volume below the layer forced by Li plating. Li plating is related to first life use conditions under extensive cycling [10] and would explain that most cells that experience the abnormal behavior were obtained from a specific battery, which according to the BMS experienced the highest cycle count. Second, this abnormal situation occurred during the first charge cycle after a long rest period, in line with the effect of reversible plating described in [45]. Third, Li plating on the surface of graphite will force the SEI to expand, eventually breaking the layer, and would momentarily allow contact of graphite with the electrolyte. The latter would produce a brief reduction of impedance, which would explain the voltage decrease during CC charge, or a current up-rise during CV. Last, we measured in our previous experiment [39] that surface temperature rises more than 20 °C above ambient temperature during this odd current increase for several types of cells (though it was not reported in this article because temperature was measured for a fraction of the sample). Then, a mechanism besides joule losses due to impedance must explain the fast heating of the cell surface, which may be related to thermal reactions of Li metal with the electrolyte [54]. Notice that a common signal for Li plating like a voltage plateau during rest [55] is not visible in Figure 5, probably because this plated Li becomes irreversible and does not strip afterwards. In spite of these arguments, a detailed study is necessary to cover this issue.
Figure 4d shows that the capacity of cells in cluster D reach a final degradation stage around 74 mAh (3% capacity). If a cell is depleted of Li-ions for intercalation, or the host volume of the active volume is degraded, a voltage applied between the electrodes will force the conduction of electrons between the metal electrodes (typically, an aluminum–copper pair), turning these cells into capacitors. A value in the same order of magnitude (14 mAh) can be calculated for the geometry of an 18650 cell, using the parameters listed in Table 5 and the capacitance formula for two parallel plates . For this calculation, it was assumed that cells are built using one positive electrode surrounded by two negative electrodes (they can be represented by two parallel capacitors), and were built with ethylene carbonate (EC), which is a common solvent used for electrolytes and its permittivity obtained as a relative value to the permittivity of the void = 8.854 × 10⁻¹², is the electrode area, and the separator thickness. The repurposing of cells in cluster D as capacitors is not considered an option because it would increase the risk of fire in a circuit. Cells undergoing Li plating pose an increased risk of short-circuiting due to dendrite formation [34], a risk that increases for cells enduring extensive degradation, and the organic electrolytes (e.g., EC) used in commercial Li-ion cells are flammable. Due to their large degradation rate, ~100 times when compared to new cells in ten cycles (~3%/cycle), and their depleted capacity, the cells in this cluster are recommended for recycling.
Table 6 contains the accuracy of classification models resulting for each cross validation round, where the number of the round represents the battery positioned in the test dataset. Each tree is programmed with the same hyperparameters (see attached code). The combination of features presented in Table 6 for represent the three highest accuracy scores obtained. The mean accuracy presented at the bottom of the table shows that the best model is obtained using the initial capacity as a feature (83%). As described in the paragraphs related to clusters C and D, the main misclassification problem, related to rounds 2, 4, 6, and 10, arises because cells with close initial capacities in the range 40–50% show different degradation patterns. In the specific case of round 1, the error arises from the high capacity of cells in battery #1, which when taken out of the training dataset lead the model to classify four cells to cluster A instead of B. To raise the accuracy of this model, one could argue that clusters C and D should be merged into a single cluster meant for recycling, and thus the mean accuracy would achieve 96%. However, we think that a larger database would reveal similar cases for the clusters recommended for repurposing, given that the main degradation modes are not completely represented by the actual capacity of a cell [17]. Moreover, in a second life project, the capacity measured during a test, and the degradation expected in a second life, will be distanced by the time it takes to select batteries and the construction of the second life project. Thus, the capacity obtained during a test will lose with time its representativity, regarding the capacity that was used in this experiment as a feature, which will lead to similar misclassification problems.
One hypothesis presented in the introduction was that the records in the BMS may provide additional information to classify cells exhibiting similar capacities, but for which different degradation rates are expected. This case is found in cross validation #2, when using the cycle count and overdischarge variables as features, the cycle count helps to correct the classification of cells to cluster C instead of D. Yet, the hypothesis is discarded for this dataset—the cycle count and overdischarge variables reduce the mean classification accuracy to 60% when coupled with capacity in the model. Acquiring more information from the BMS would likely lead to a better representation of this hypothesis. In other integrated circuits of the same brand (“bq” series) there are slots reserved for variables including the maximum/minimum temperature, maximum/minimum battery cell voltage, and maximum/minimum charge/discharge current [30], which as explained in the introduction, may provide additional information on the main degradation mode present in a battery.
The accuracy of a model based on the cycle count and overdischarge achieves a mean accuracy of 34%, less than half of the accuracy of the model using capacity as a feature, and only a modest increase regarding a random classification (~25%). To illustrate the reason for this low accuracy regarding the results obtained when using the capacity as a feature, a support vector regression was applied to estimate from the information derived from the cycle count and overdischarge . The regression achieves a mean absolute error of ~16% capacity, which is higher than the distance between clusters (4–17% capacity, see Table 4). However, if the company that programmed the BMS is involved in the second life project, obtaining variables from the BMS is a simple task, and might be more cost-effective than measuring the discharge capacity to define the SOH. In this context, a compromise between effort and accuracy appears.
5. Conclusions
Reutilization, repurposing, and recycling were presented as a classification problem and applied to a dataset of Li-ion cells generated in this research, containing the response to 100 charge–discharge cycles of 90 cells obtained from old notebook batteries. The resulting degradation patterns were assigned to four clusters applying a k-means algorithm. The first cluster involved cells with an initial capacity ~90% and a linear capacity degradation rate comparable to new cells, recommended for reutilization or repurposing. The last cluster involved cells which lost during their first life more than 50% capacity, where capacity exhibited an exponential decay with a rate ~100 times larger than new cells, recommended for recycling. Possible degradation mechanisms present in each cluster were discussed.
A classification model based on a boosted decision tree revealed that the capacity obtained in the first cycle achieved 83% accuracy to estimate each cluster. Misclassification arises from a group of cells retaining similar initial capacities (40–50%), which show divergent degradation patterns. This confirms the need to enhance the information that can be derived from capacity. The battery management system (BMS) was analyzed as a source of cost-effective information, from which the cycle count was found as the variable with the best correlation to each cluster, but achieving a lower accuracy than a model using capacity as a feature.
Supplementary Materials
The following are available online at https://www.mdpi.com/2071-1050/12/9/3620/s1, Data.xlsx: contains four spreadsheets, which provide information about each battery in the dataset (sheet 1: Battery), each cell (sheet 2: Cell), each degradation pattern (sheet 3: Y_star), and the data that is used exported to the file Data.csv (Data XG). XGClass: contains a python script based on Data.csv \, and obtains main statistics of the dataset, defines the cross validation rounds, and performs the classification based on XGBoost. It also provides the example mentioning a support vector regression.
Author Contributions
Conceptualization, F.S.; methodology, F.S.; software, F.S.; validation, F.S.; formal analysis, F.S.; investigation, F.S.; resources, F.S.; data curation, F.S.; writing—original draft preparation, F.S.; writing—review and editing, F.S. and J.K.; visualization, F.S.; supervision, J.K.; project administration, F.S.; funding acquisition, F.S. All authors have read and agreed to the published version of the manuscript.
Funding
This research was funded by CONICYT PFCHA/DOCTORADO BECAS CHILE CON ACUERDO BILATERAL EN EL EXTRANJERO DAAD/2017 grant number 62160016.
Acknowledgments
Josefa Ibaceta, Department of High-Frequency and Semiconductor System Technologies, TU Berlin, for the measurements of the weight of these cells; Mahdi Esmailoghli, Institute of Software Engineering and Theoretical Computer Science at TU Berlin, for the recommendation of XGBoost libraries for this problem.
Conflicts of Interest
The authors declare no conflict of interest.
Appendix A
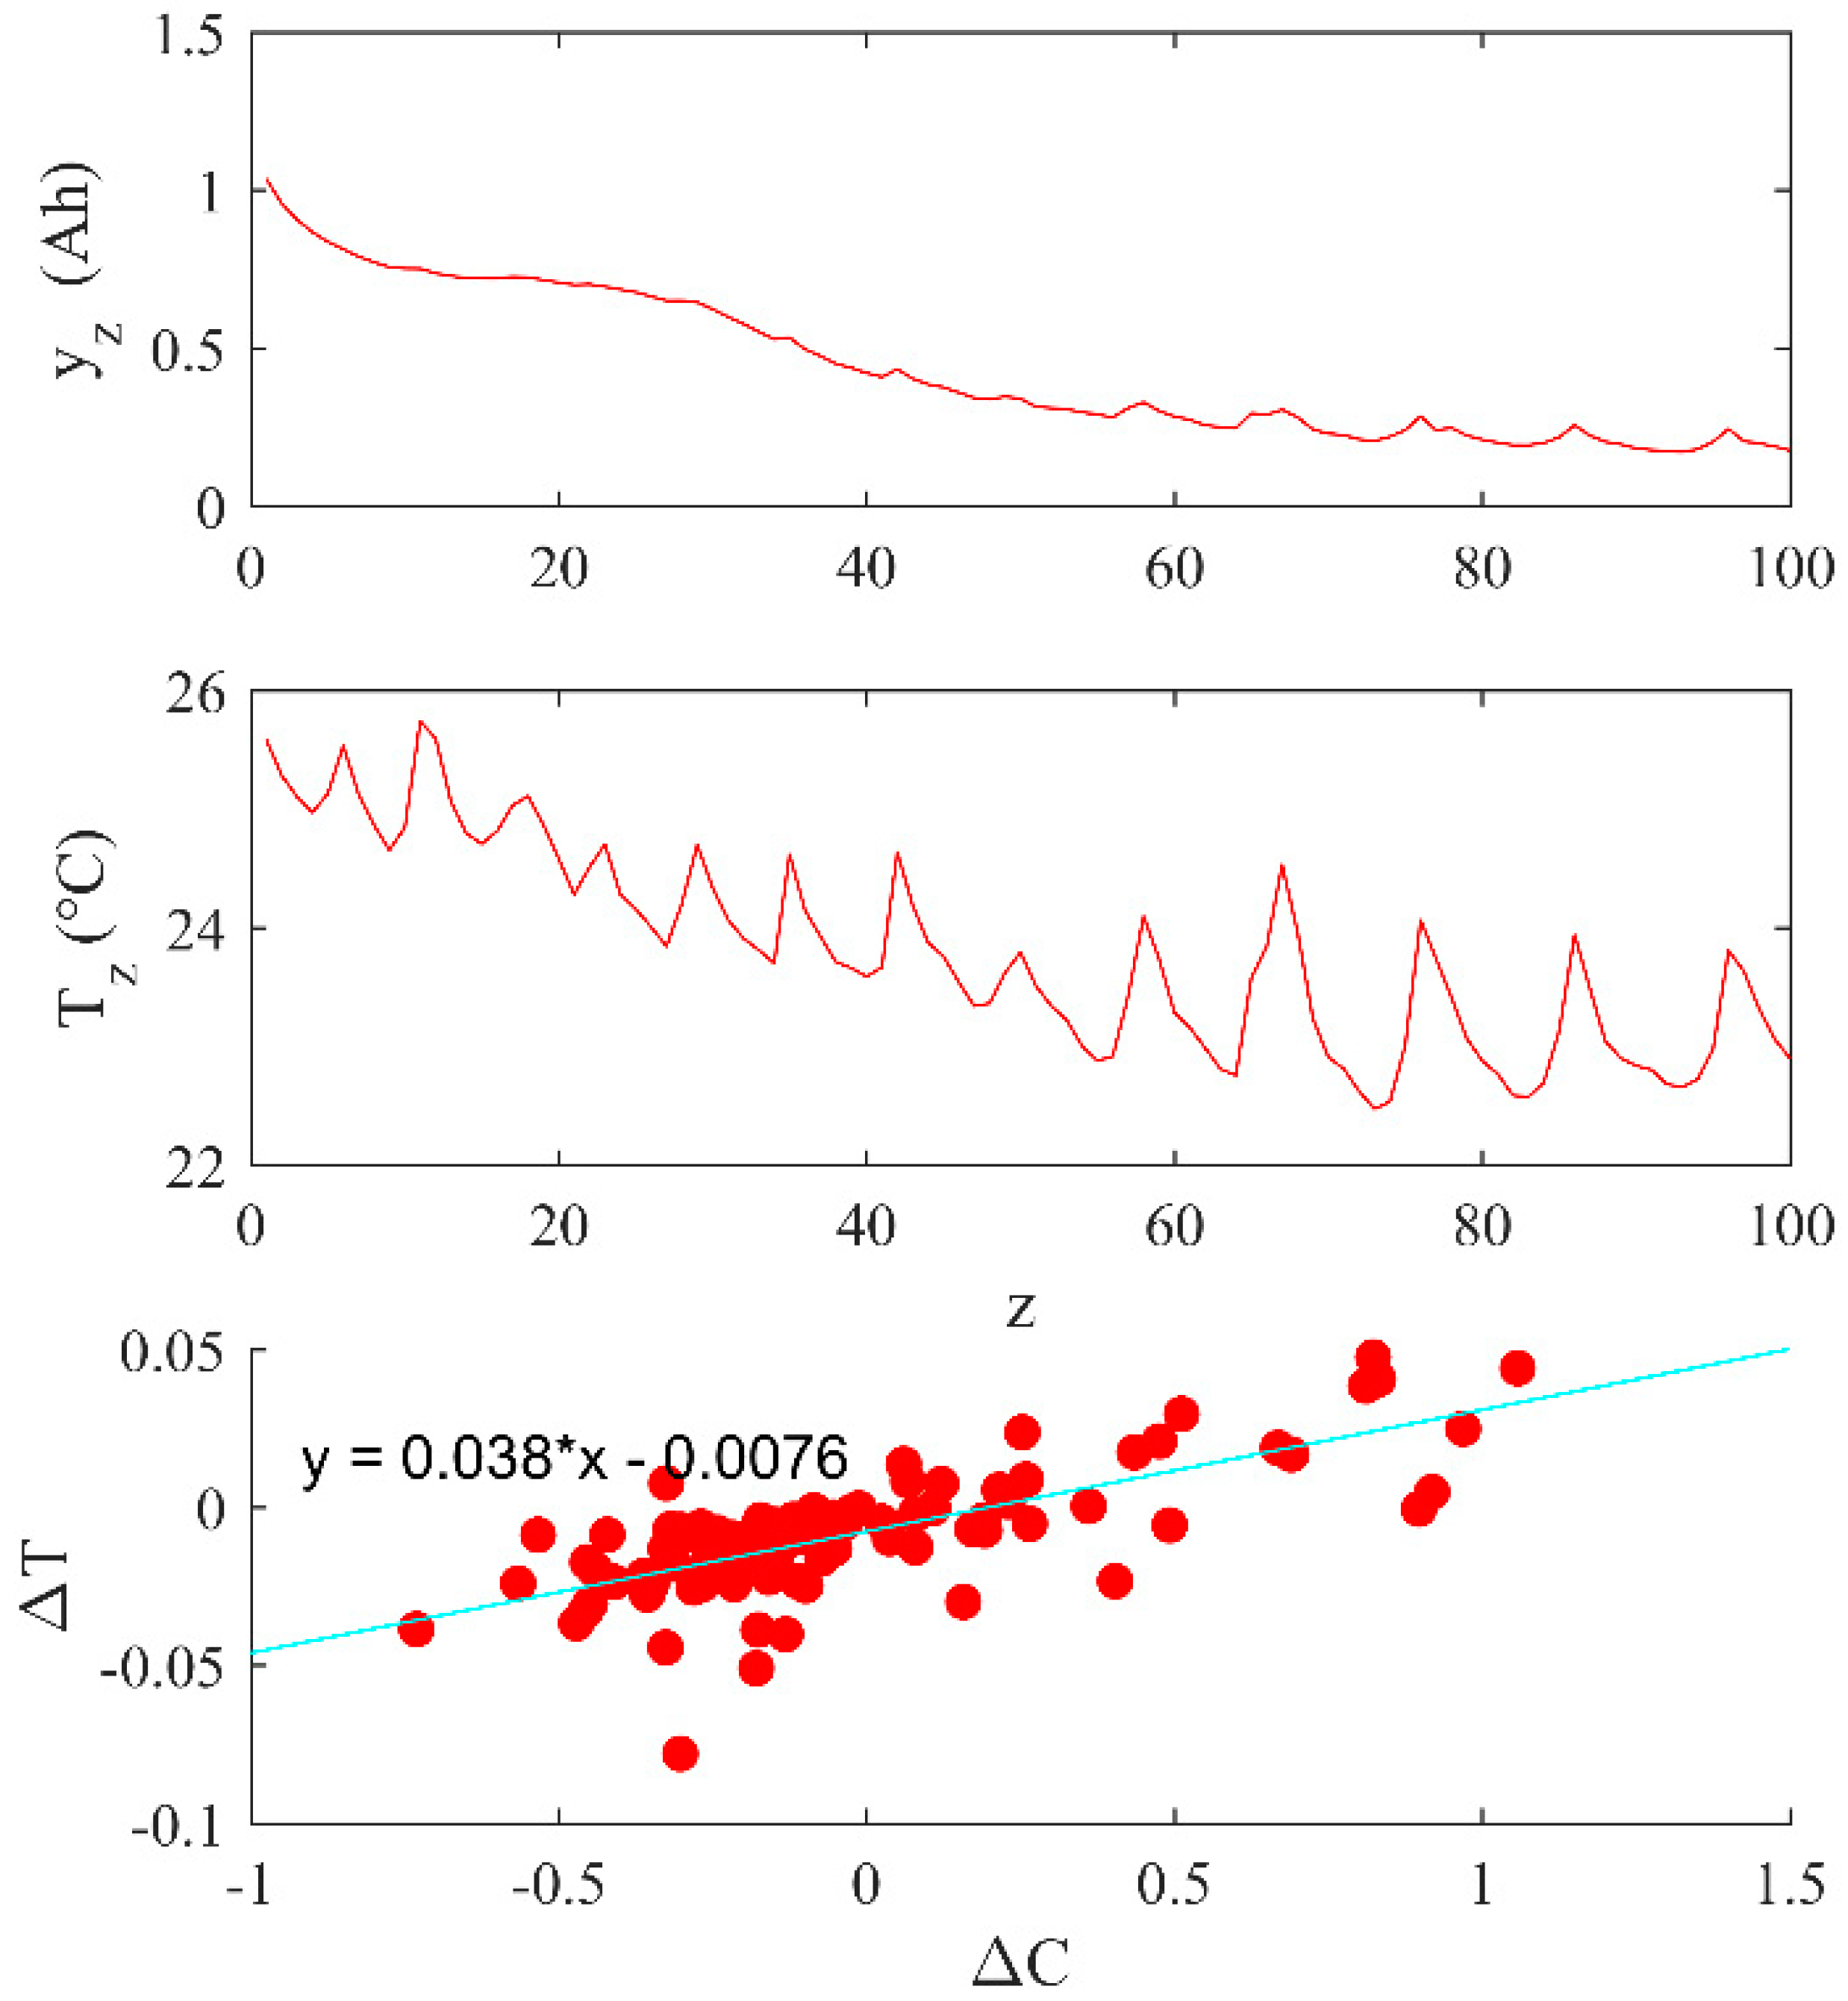
Figure A1 presents an example of the temperature correction method, showing the correlation between the fluctuations of temperature and discharge capacity. The calculated vector for the short-term temperature dependency contains values between 0.07–2.2%/°C, and given the temperature fluctuations, its application removes ripples from capacity trajectories.
Figure A1.
Temperature-capacity dependence.

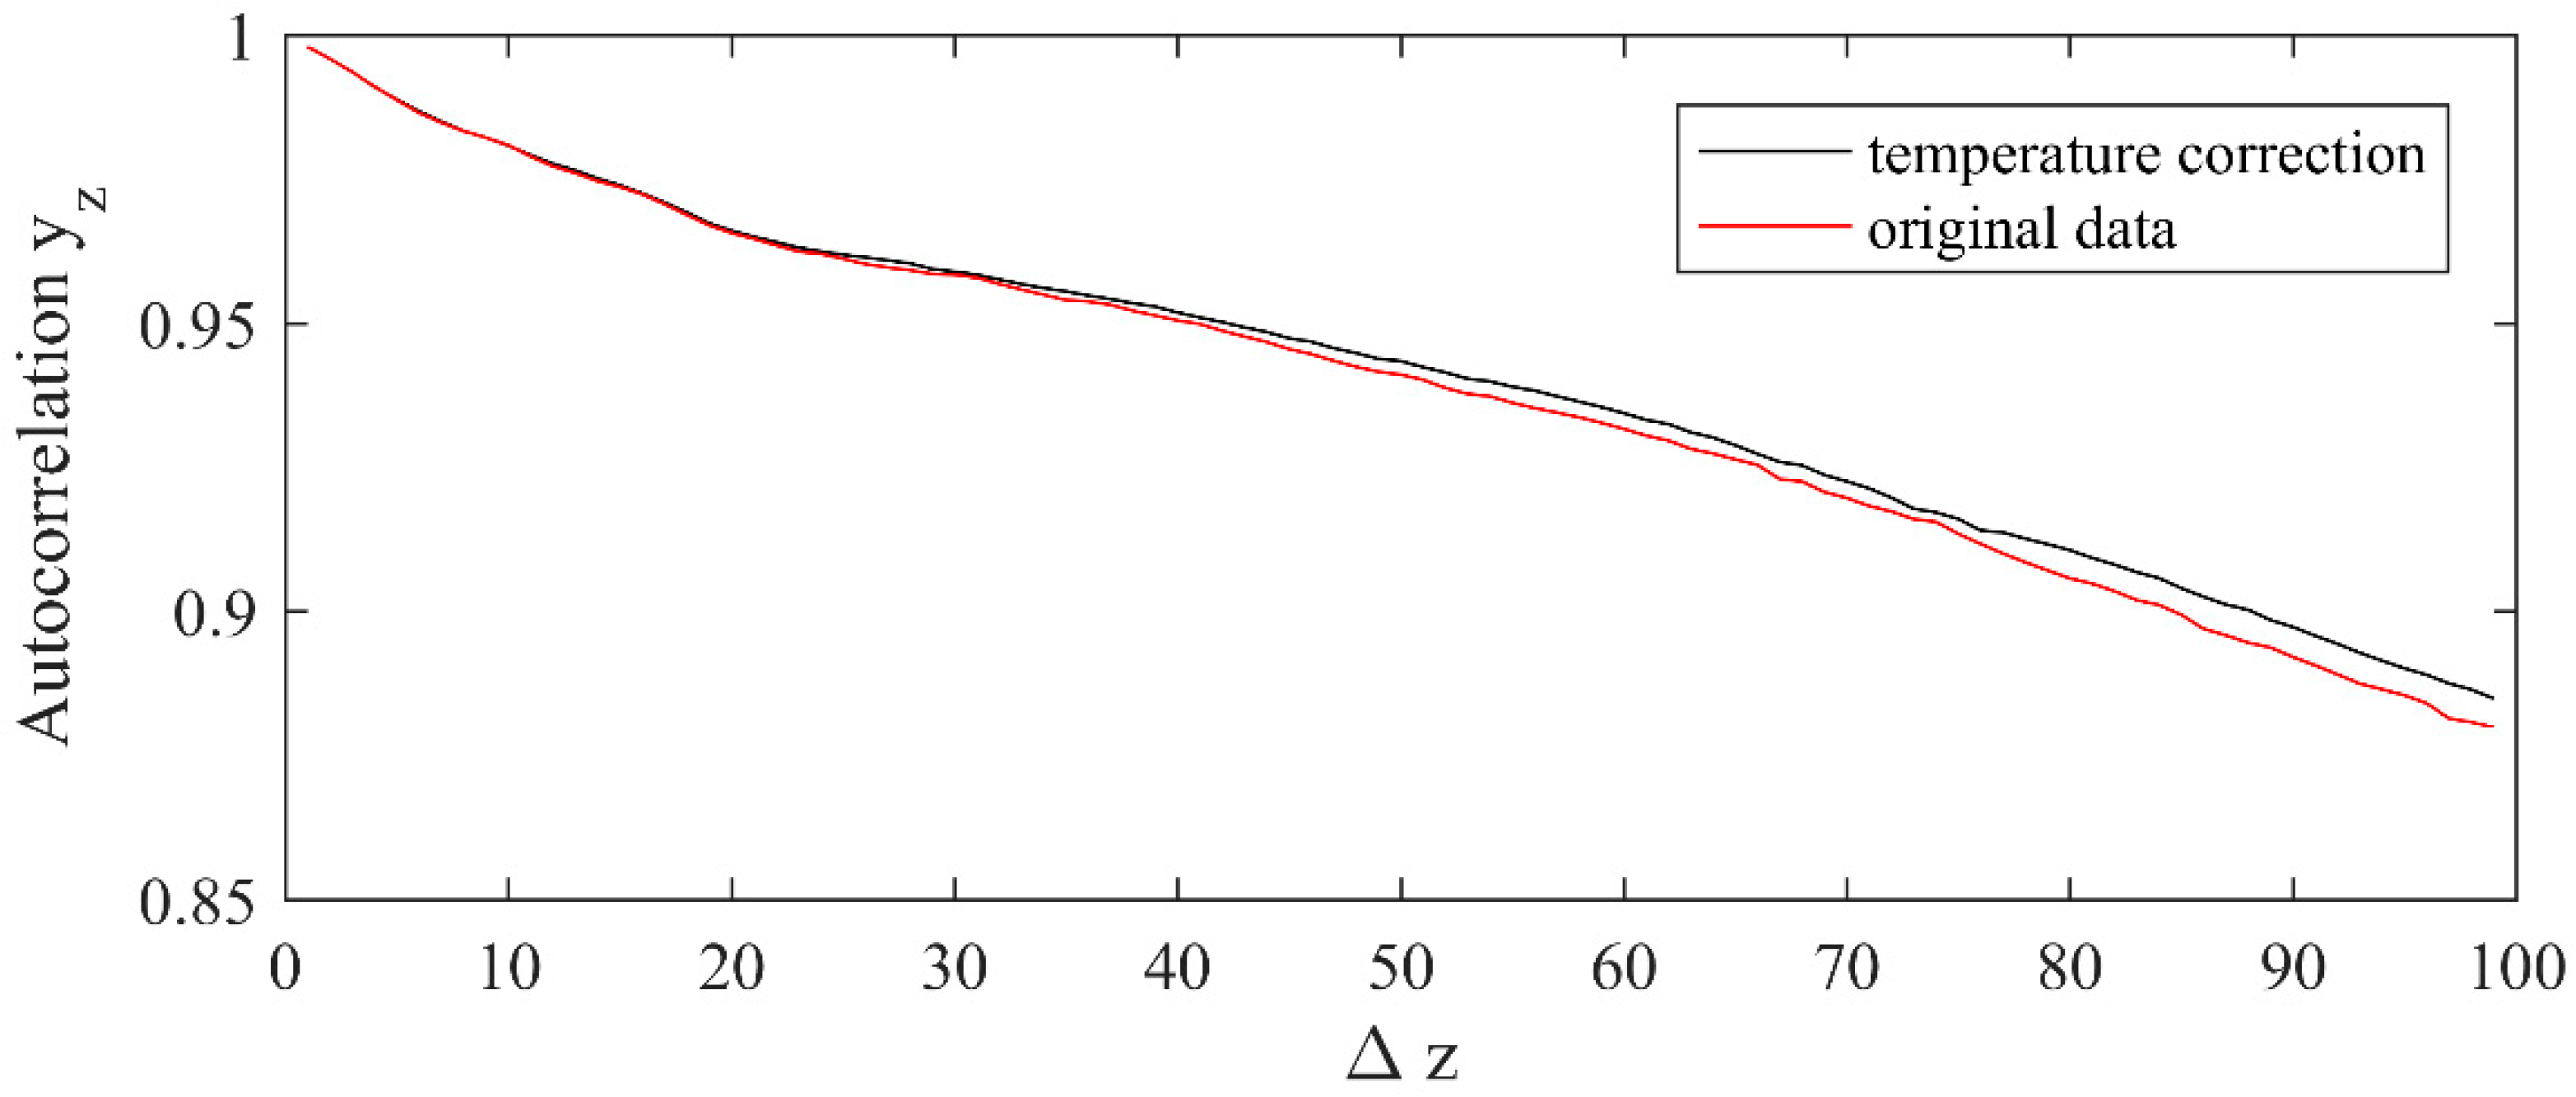
Figure A2 shows the effect of temperature correction on the dataset, exemplified by the increase of the autocorrelation function of capacity. This increase becomes notorious as cycling progresses, because it reduced the cumulative effect of temperature fluctuations.
Figure A2.
Autocorrelation of capacity and influence of temperature correction.

In this work, was analyzed instead of , noticing its influence in the results of k-means, which become more stable, and that the classification model is slightly more accurate when using capacity as a feature. Average temperature experienced by each cell during the test ranges 22.5–26.2 °C, which should produce in the long term a small bias in capacity degradation.
References
- Boyden, A.; Soo, V.; Doolan, M. The Environmental Impacts of Recycling Portable Lithium-Ion Batteries. Procedia CIRP 2016, 48, 188–193. [Google Scholar] [CrossRef] [Green Version]
- Martinez-Laserna, E.; Gandiaga, I.; Sarasketa-Zabala, E.; Badeda, J.; Stroe, D.-I.; Swierczynski, M.; Goikoetxea, A. Battery Second Life: Hype, Hope or Reality? A Critical Review of the State of the Art. Renew. Sustain. Energy Rev. 2018, 93, 701–718. [Google Scholar] [CrossRef]
- A Second Life for Used Batteries. Available online: https://www.bosch-presse.de/pressportal/de/en/a-second-life-for-used-batteries-64192.html (accessed on 23 August 2019).
- World’s Largest 2nd-Use Battery Storage is Starting Up. Available online: https://media.daimler.com/marsMediaSite/en/instance/ko/Worlds-largest-2nd-use-battery-storage-is-starting-up.xhtml?oid=13634457 (accessed on 23 August 2019).
- Daimler. Available online: https://www.daimler.com/nachhaltigkeit/fahrzeuge/ressourcen/dritter-batteriespeicher.html; https://www.daimler.com/sustainability/vehicles/resources/battery-storage-daimler-and-enercity.html (accessed on 23 August 2019).
- BMW. Available online: https://www.press.bmwgroup.com/global/article/detail/T0275547EN/bmw-group-underlines-leading-role-in-electro-mobility?language=en (accessed on 23 August 2019).
- Audi. Available online: https://www.audi-mediacenter.com/de/pressemitteilungen/audi-eroeffnet-batteriespeicher-auf-berliner-euref-campus-11681 (accessed on 23 August 2019).
- Schneider, E.; Oliveira, C.; Brito, R.; Malfatti, C. Classification of Discarded NiMH and Li-Ion Batteries and Reuse of the Cells Still in Operational Conditions in Prototypes. J. Power Sources 2014, 262, 1–9. [Google Scholar] [CrossRef]
- Sabbaghi, M.; Esmaeilian, B.; Mashhadi, A.; Cade, W.; Behdad, S. Reusability Assessment of Lithium-Ion Laptop Batteries Based on Consumers Actual Usage Behavior. J. Mech. Des. 2015, 137, 124501. [Google Scholar] [CrossRef]
- Schuster, S.F. Reuse of Automotive Lithium-ion Batteries, an Assessment from the Cell Ageing Perspective. Ph.D. Thesis, Technical University of Munich, Munich, Germany, 2016. [Google Scholar]
- Martinez, E. Methodology for the Techno-Economic Assessment of Second Life Lithium-ion Batteries. Ph.D. Thesis, Mondragon University, Mondragón, Spain, 2017. [Google Scholar]
- Tong, S.; Same, A.; Kootstra, M.; Park, J. Off-grid photovoltaic vehicle charge using second life lithium batteries: An experimental and numerical investigation. Appl. Energy 2013, 104, 740–750. [Google Scholar] [CrossRef]
- Ecker, M.; Nieto, N.; Käbitz, S.; Schmalstieg, J.; Blanke, H.; Warnecke, A.; Sauer, D. Calendar and Cycle Life Study of Li(NiMnCo)O2-based 18650 Lithium-ion Batteries. J. Power Sources 2014, 248, 839–851. [Google Scholar] [CrossRef]
- Schuster, S.; Brand, M.; Campestrini, C.; Gleissenberger, M.; Jossen, A. Correlation between capacity and impedance of lithium-ion cells during calendar and cycle life. J. Power Sources 2016, 305, 191–199. [Google Scholar] [CrossRef]
- Quinard, H.; Redondo-Iglesias, E.; Pelissier, S.; Venet, P. Fast electrical characterizations of high-energy second life Lithium-ion batteries for embedded and stationary applications. Batteries 2019, 5, 33. [Google Scholar] [CrossRef] [Green Version]
- Chen, H.; Shen, J. A Degradation-based Sorting Method for Lithium-ion Battery Reuse. PLoS ONE 2017, 12, e0185922. [Google Scholar] [CrossRef]
- Barai, A.; Uddin, K.; Dubarry, M.; Somerville, L.; McGordon, A.; Jennings, P.; Bloom, I. A comparison of methodologies for the non-invasive characterization of commercial Li-ion cells. Prog. Energy Combust. Sci. 2019, 72, 1–31. [Google Scholar] [CrossRef]
- Ma, G.; Zhang, Y.; Cheng, C.; Zhou, B.; Hu, P.; Yuan, Y. Remaining useful life prediction of lithium-ion batteries based on false nearest neighbors and a hybrid neural network. Appl. Energy 2019, 253, 113626. [Google Scholar] [CrossRef]
- Pang, X.; Huang, R.; Wen, J.; Shi, Y.; Jia, J.; Zeng, J. A Lithium-ion Battery RUL Prediction Method Considering the Capacity Regeneration Phenomenon. Energies 2019, 12, 2247. [Google Scholar] [CrossRef] [Green Version]
- Wu, Y.; Li, W.; Wang, Y.; Zhang, K. Remaining Useful Life Prediction of Lithium-Ion Batteries Using Neural Network and Bat-Based Particle Filter. IEEE Access 2019, 7, 54843–54854. [Google Scholar] [CrossRef]
- Bräuer, S.; Plenter, F.; Klo, B.; Monhof, M.; Beverungen, D.; Becker, J. Transactions for trading used electric vehicle batteries: Theoretical underpinning and information systems design principles. Bus. Res. 2019. [Google Scholar] [CrossRef] [Green Version]
- Hauser, A.; Kuhn, R. High-voltage battery management systems (BMS) for electric vehicles. In Advances in Battery Technologies for Electric Vehicles; Woodhead publishing: Cambridge, UK, 2015; pp. 265–282. [Google Scholar]
- Neubauer, J.; Wood, E.; Pesaran, A. Second Life for Electric Vehicle Batteries: Answering Questions on Battery Degradation and Value. In Proceedings of the SAE 2015 World Congress & Exhibition, Detroit, MI, USA, 21–23 April 2015. [Google Scholar] [CrossRef] [Green Version]
- Rohr, S.; Müller, S.; Baumann, M.; Kerler, M.; Ebert, F.; Kaden, D.; Lienkamp, M. Quantifying uncertainties in reusing Lithium-ion batteries from electric vehicles. Procedia Manuf. 2017, 8, 603–610. [Google Scholar] [CrossRef]
- Baumann, M.; Wildfeuer, L.; Rohr, S.; Lienkamp, M. Parameter variations within Li-ion battery packs—Theoretical investigations and experimental quantification. J. Energy Storage 2018, 18, 295–307. [Google Scholar] [CrossRef]
- Oeser, D.; Ziegler, A.; Ackva, A. Single cell analysis of lithium-ion e-bike batteries aged under various conditions. J. Power Sources 2018, 397, 25–31. [Google Scholar] [CrossRef]
- Canals, L.; Amante, B. Assessing electric vehicles battery second life remanufacture and management. J. Green Eng. 2016, 6, 77–98. [Google Scholar] [CrossRef] [Green Version]
- Smart Battery Data Specification Revision 1.1. Available online: http://sbs-forum.org/specs/sbdat110.pdf (accessed on 23 August 2019).
- Olsson, L.; Fallahi, S.; Schnurr, M.; Diener, D.; van Loon, P. Circular business models for extended EV battery life. Batteries 2018, 4, 57. [Google Scholar] [CrossRef] [Green Version]
- SBS 1.1-Compliant Gas Gauge Enabled with Impedance Track Technology for Use with the bq29312A. Available online: http://www.ti.com/lit/ds/slus681b/slus681b.pdf?ts=1588229532321 (accessed on 23 August 2019).
- Vetter, J.; Novák, P.; Wagner, M.; Veit, C.; Möller, K.; Winter, J.B.M.; Wohlfahrt-Mehrens, M.; Vogler, C.; Hammouche, A. Ageing Mechanisms in Lithium-ion Batteries. J. Power Sources 2005, 147, 269–281. [Google Scholar] [CrossRef]
- Waldmann, T.; Hogg, B.; Wohlfahrt-Mehrens, M. Li plating as unwanted side reaction in commercial Li-ion cells—A review. J. Power Sources 2018, 384, 107–124. [Google Scholar] [CrossRef]
- Laresgoiti, I.; Käbitz, S.; Ecker, M.; Sauer, D. Modeling mechanical degradation in lithium ion batteries during cycling: Solid electrolyte interphase fracture. J. Power Sources 2015, 300, 112–122. [Google Scholar] [CrossRef]
- Keil, P.; Schuster, S.; Wilhelm, J.; Travi, J.; Hauser, A.; Karl, R.; Jossen, A. Calendar Aging of Lithium-Ion Batteries I. Impact of the Graphite Anode on Capacity Fade. J. Electrochem. Soc. 2016, 163, A1872–A1880. [Google Scholar] [CrossRef]
- Maleki, H.; Howard, J. Effects of Overdischarge on Performance and Thermal Stability of a Li-ion Cell. J. Power Sources 2006, 160, 1395–1402. [Google Scholar] [CrossRef]
- Guo, R.; Lu, L.; Ouyang, M.; Feng, X. Mechanism of the entire overdischarge process and overdischarge-induced internal short circuit in lithium-ion batteries. Nat. Sci. Rep. 2016, 5, 30248. [Google Scholar] [CrossRef] [Green Version]
- Li, H.; Gao, J.; Zhang, S. Effect of Overdischarge on Swelling and Recharge Performance of Lithium Ion Cells. Chin. J. Chem. 2008, 26, 1585–1588. [Google Scholar] [CrossRef]
- Zhao, M. Electrochemical Studies of Lithium-ion Battery Anode Materials in Lithium-ion Battery Electrolytes. Ph.D. Thesis, Ohio University, Athens, OH, USA, 2001. [Google Scholar]
- Salinas, F.; Krüger, L.; Neupert, S.; Kowal, J. A second life for Li-ion cells rescued from notebook batteries. J. Energy Storage 2019, 24, 100747. [Google Scholar] [CrossRef]
- Yang, X.; Leng, Y.; Zhang, G.; Ge, S.; Wang, C. Modelling of Lithium Plating Induced Ageing of Lithium-ion Batteries, Transition from Linear to Nonlinear Aging. J. Power Sources 2017, 360, 28–40. [Google Scholar] [CrossRef]
- Börner, M.; Friesen, A.; Grützke, M.; Stenzel, Y.; Brunklaus, G.; Haetge, J.; Nowak, S.; Schappacher, F.; Winter, M. Correlation of aging and thermal stability of commercial 18650-type lithium ion batteries. J. Power Sources 2017, 342, 382–392. [Google Scholar] [CrossRef]
- Schuster, S.; Bach, T.; Fleder, E.; Müller, J.; Brand, M.; Sextl, G.; Jossen, A. Nonlinear Ageing Characteristics of Lithium-ion Cells Under Different Operational Conditions. J. Energy Storage 2015, 1, 44–53. [Google Scholar] [CrossRef]
- Bach, T.; Schuster, S.; Fleder, E.; Müller, J.; Brand, M.; Lorrmann, H.; Jossen, A.; Sextl, G. Nonlinear aging of cylindrical lithium-ion cells linked to heterogeneous compression. J. Energy Storage 2016, 5, 212–223. [Google Scholar] [CrossRef]
- Yang, X.; Wang, C. Understanding the trilemma of fast charging, energy density and cycle life of lithium-ion batteries. J. Power Sources 2018, 402, 489–498. [Google Scholar] [CrossRef]
- Epding, B.; Rumberg, B.; Jahnke, H.; Stradtmann, I.; Kwade, A. Investigation of significant capacity recovery effects due to long rest periods during high current cyclic aging tests in automotive lithium ion cells and their influence on lifetime. J. Energy Storage 2019, 22, 249–256. [Google Scholar] [CrossRef]
- Matsuda, I.; Ando, K.; Myojin, M.; Matsumoto, M.; Sanada, T.; Takao, N.; Imai, H.; Imamura, D. Investigation of the influence of temperature on the degradation mechanism of commercial nickel manganese cobalt oxide-type lithium-ion cells during long-term cycle tests. J. Energy Storage 2019, 21, 665–671. [Google Scholar] [CrossRef]
- Muenzel, V.; Hollenkamp, A.; Bhatt, A.; Hoog, J.; Brazil, M.; Thomas, D.; Mareels, I. A comparative testing study of commercial 18650-format Lithium-ion battery cells. J. Electrochem. Soc. 2015, 162, A1592–A1600. [Google Scholar] [CrossRef] [Green Version]
- Recharging and Reusing Acer Laptop Batteries on DIY Projects with Arduino. Available online: http://linuxehacking.blogspot.com/2014/03/recharging-and-reusing-acer-laptop.html (accessed on 23 August 2019).
- Neware CT4008. Available online: http://www.neware-testing.com/10-neware-hotsale-product/11-ct-4008-5v6a-s1 (accessed on 31 October 2019).
- Ashwin, T.; McGordon, A.; Widanage, W.; Jennings, P. Modified electrochemical parameter estimation of NCR18650BD battery using implicit finite volume method. J. Power Sources 2017, 341, 387–395. [Google Scholar] [CrossRef]
- K-Means Clustering. Available online: https://de.mathworks.com/help/stats/kmeans.html#buefthh-3 (accessed on 19 March 2020).
- Chen, T.; Guestrin, C. XGBoost: A Scalable Tree Boosting System; Cornell University: New York, NY, USA, 2016. [Google Scholar]
- Is Battery Consistency the Key to Mass e-Mobility Success? Available online: https://networkingdays2019.buhlergroup.com/fileadmin/uploads/buhler/Networking_Days/2019/Whitepapers/Whitepaper_Battery_NWD19.pdf (accessed on 13 December 2019).
- Waldmann, T.; Quinn, J.; Richter, K.; Kasper, M.; Tost, A.; Klein, A.; Wohlfahrt-Mehrens, M. Electrochemical, Post-Mortem, and ARC Analysis of Li-ion Cell Safety in Second-Life Applications. J. Electrochem. Soc. 2017, 164, A3154–A3162. [Google Scholar] [CrossRef] [Green Version]
- Yang, X.; Ge, S.; Liu, T.; Leng, Y.; Wang, C. A look into the voltage plateau signal for detection and quantification of lithium plating in lithium-ion cells. J. Power Sources 2018, 395, 251–261. [Google Scholar] [CrossRef]
- Hall, S.; Self, J.; Dahn, J. Dielectric Constants for Quantum Chemistry and Li-Ion Batteries: Solvent Blends of Ethylene Carbonate and Ethyl Methyl Carbonate. J. Phys. Chem. C 2015. [Google Scholar] [CrossRef]
- Pfrang, A.; Kersys, A.; Kriston, A.; Sauer, D.; Rahed, C.; Käbitz, S.; Figgemeier, E. Long-term cycling induced jelly roll deformation in commercial 18650 cells. J. Power Sources 2018, 392, 168–175. [Google Scholar] [CrossRef]
- Orendorff, C. The role of separators in Lithium-ion batteries. Electrochem. Soc. Interface 2012, 21, 61. [Google Scholar] [CrossRef]
Figure 1.
(a) Sanyo UR18650FM; (b) battery management system (BMS) based on bq8030.

Figure 2.
Cycling.

Figure 3.
Linear regression between test capacity and (a) time; (b) BMS capacity; (c) cycles; (d) overdischarge.
Figure 3.
Linear regression between test capacity and (a) time; (b) BMS capacity; (c) cycles; (d) overdischarge.

Figure 4.
Clusters (a) A: #3 (red), #9 (blue, semi-dashed), and #12 (blue, dashed); (b) B: batteries #1 (black), #10 (black, semi-dashed), #11 (cyan, dashed); (c) C: #2 (cyan), #4 (red, semi-dashed), #7 (black, dashed), #8 (red, dashed), #10 (black, semi-dashed); (d) D: #2 (cyan), #4 (red, semi-dashed), #5 (cyan, dashed), #6 (blue), #10 (black, semi-dashed).

Figure 5.
Abnormal charge condition plotted for cell i = 32. (a) Voltage reduction; (b) current rise.
Figure 5.
Abnormal charge condition plotted for cell i = 32. (a) Voltage reduction; (b) current rise.


Table 1.
Cycling using constant current (CC) and constant voltage (CV) phases.
| Step | Phase | Parameters | End | Variable |
|---|---|---|---|---|
| 1. Charge | CC, CV | 1 A, 4.2 V | 0.05 A | |
| 2. Rest | 30 min | |||
| 3. Discharge | CC | −1 A | 2.8 V | |
| 4. Rest | 30 min | |||
| Repeat | 1–4 | = 100 times |
Table 2.
Statistics.
| Metric | Time years | BMS cap. % | Cycles count | Dis. % | Test cap. % | Weight g |
|---|---|---|---|---|---|---|
| min. | 7.2 | 7 | 7 | 0 | 0 | 44.80 |
| mean | 10.2 | 58 | 163 | 23 | 56 | 45.46 |
| max. | 12.9 | 98 | 490 | 99 | 93 | 46.22 |
| std. | 1.6 | 24 | 152 | 34 | 26 | 0.29 |
Table 3.
X correlations.
| Pair | |||||
|---|---|---|---|---|---|
| 0.18 | −0.02 | 0.38 | −0.11 | ||
| −0.91 | 0.13 | 0.64 | |||
| −0.11 | −0.75 | ||||
| −0.22 |
Table 4.
Cluster description.
| Feature | ||||
|---|---|---|---|---|
| # cells | 18 | 20 | 28 | 24 |
| # batteries | 3 | 3 | 5 | 5 |
| (years) | 7.5–11.8 | 7.3–12.9 | 10–12.5 | 9.5–12.5 |
| (count) | 7–109 | 29–162 | 28–281 | 28–490 |
| (%) | 0–21 | 0–65 | 0–99 | 0–99 |
| (%) | 89–93 | 73–87 | 35–62 | 0–50 |
| (%/cycle) | 0.02–0.45 | 0.2–1.04 | 0.03–1.58 | 0.15–3.02 |
| (%/cycle) | 0.04–0.19 | 0.32–0.49 | 0.16–0.45 | - |
Table 6.
Classification accuracy.
| Cross Value | |||
|---|---|---|---|
| 1 | 0.33 | 0.33 | 0 |
| 2 | 0.44 | 0.88 | 0 |
| 3 | 1 | 1 | 1 |
| 4 | 0.77 | 0.44 | 0 |
| 5 | 1 | 0 | 0 |
| 6 | 0.66 | 0.66 | 1 |
| 7 | 1 | 0.16 | 0 |
| 8 | 1 | 1 | 0 |
| 9 | 1 | 1 | 1 |
| 10 | 0.77 | 0.77 | 0.11 |
| 11 | 1 | 1 | 1 |
| 12 | 1 | 0 | 0 |
| mean | 0.83 | 0.60 | 0.34 |
© 2020 by the authors. Licensee MDPI, Basel, Switzerland. This article is an open access article distributed under the terms and conditions of the Creative Commons Attribution (CC BY) license (http://creativecommons.org/licenses/by/4.0/).
Share and Cite
MDPI and ACS Style
Salinas, F.; Kowal, J. Classifying Aged Li-Ion Cells from Notebook Batteries. Sustainability 2020, 12, 3620. https://doi.org/10.3390/su12093620
AMA Style
Salinas F, Kowal J. Classifying Aged Li-Ion Cells from Notebook Batteries. Sustainability. 2020; 12(9):3620. https://doi.org/10.3390/su12093620
Chicago/Turabian StyleSalinas, Felipe, and Julia Kowal. 2020. "Classifying Aged Li-Ion Cells from Notebook Batteries" Sustainability 12, no. 9: 3620. https://doi.org/10.3390/su12093620
Note that from the first issue of 2016, this journal uses article numbers instead of page numbers. See further details here.