Compounded Heat and Fire Risk for Future U.S. Populations

USDA Forest Service, Rocky Mountain Research Station, Rapid City, SD 57702, USA
Sustainability 2020, 12(8), 3277; https://doi.org/10.3390/su12083277
Submission received: 22 March 2020
/
Revised: 10 April 2020
/
Accepted: 15 April 2020
/
Published: 17 April 2020
(This article belongs to the Special Issue Implications of Climate Change for Ecosystems and Society)
Abstract
:Climate change is increasing the risk of extreme events, resulting in social and economic challenges. I examined recent past (1971–2000), current and near future (2010–2039), and future (2040–2069) fire and heat hazard combined with population growth by different regions and residential densities (i.e., exurban low and high densities, suburban, and urban low and high densities). Regional values for extreme fire weather days varied greatly. Temperature and number of extreme fire weather days increased over time for all residential density categories, with the greatest increases in the exurban low-density category. The urban high-density category was about 0.8 to 1 °C cooler than the urban low-density category. The areas of the urban and suburban density categories increased relative to the exurban low-density category. Holding climate change constant at 1970–2000 resulted in a temperature increase of 0.4 to 0.8 °C by 2060, indicating future population increases in warmer areas. Overall, U.S. residents will experience greater exposure to fire hazard and heat over time due to climate change, and compound risk emerges because fire weather and heat are coupled and have effects across sectors. Movement to urban centers will help offset exposure to fire but not heat, because urban areas are heat islands; however, urban high-density areas had lower base temperatures, likely due to city locations along coastlines. This analysis provides a timely look at potential trends in fire and heat risk by residential density classes due to the expansion and migration of US populations.
Keywords:
climate change; compound risk; implications; land use; socioeconomic; wildland-urban interface; WUI1. Introduction
Climate change has far-reaching implications for economic and social stability, including loss of services and security, affecting quality and quantity of lives. Climate change is expected to increase severe weather events, including heat waves, fire, flooding, hurricanes, and drought. At recent temperatures, Oppenheimer et al. [1] assigned moderate risk from extreme weather events, high level of risk beginning below 1 °C of warming, and severe and widespread impacts during the next few decades. Indeed, climate change may have already been increasing the number and severity of natural disasters during past decades. During the 1980s, 2.8 events occurred per year that each cost at least a billion dollars, for a total of $127.7B [2]. During the 1990s, 5.2 billion dollar events occurred per year, for a total of $456.7B. During the 2000s, 5.9 billion dollar events occurred per year, for a total of $510.3B. During the 2010s, 11.9 billion dollar events occurred per year, for a total of $802.2B. Additionally, the budget for fire suppression has increased during the past decades to billions of dollars [3].
Climate change is expected to cause migration from coastal areas of inundation and heat [4,5]. This would reverse migration during the past 50 or more years, after air conditioning became available, of movement by households and firms to locations that will experience seawater rise and heat waves (e.g., Florida and southern coastal locations; 5). However, not all 13.1 million people at risk of 1.8 m inundation [4] may be likely to migrate beyond a short distance within a county. Migration decisions based on climate amenities may have a lesser influence than jobs, housing costs, and family, perhaps resulting in climate change migration for no more than 5% of regional populations [6]. For residents, having access to the best available information about risk of extreme events will help inform decisions about migration, real estate purchases, and mitigation of risk to people and property. Many residents in the United States are unaware of natural disaster risks to property, livelihood, safety, and overall well-being due to inadequate information or inaccessible disclosure of exposure, despite billions of dollars invested in risk determination [7,8].
Warming in hot locations in the United States is expected to increase annual national mortality rates at 5.4 (±0.5) deaths per 100,000 per °C in warming, after offsetting mortality reductions in cool regions [9]. Projected heat index increases for both US and global populations recently have been coordinated with population scenarios at 1 km resolution and prior to these studies, at least 28 studies estimated future heat-related mortality for at least one US city [10,11,12]. Morefield et al. [13] applied EPA’s Integrated Climate and Land Use Scenarios at 90 m ([6]; developed in part by Morefield) and the Benefits Mapping and Analysis Program to comprehensively model heat risk, determining that future changes in climate may cause about 3000 to 16,000 heat-related deaths annually.
Few models exist of future fire risk for the United States, or they are in development due to the complexity involved (e.g., [14] ). Wildfire potential, without accounting for population change, was assessed by Liu et al. [15], using a drought index (Keetch–Byram Drought Index) based on previous generation climate projections of the Coupled Model Intercomparison Project Phase 3. While fire models based on climate projections are realizable, challenges to simulating full fire risk nation-wide require accounting for numerous factors, such as land use, non-native species, vegetation type, fuel availability and properties, fuel breaks, human-caused ignitions, past fires, and fire suppression. Fire typically requires moisture to grow vegetation that acts as fuel, followed by drier weather that allows ignitions. Human-caused fires have expanded the fire season, to triple the length of lightning-caused fire season, and account for 84% of all wildfires and 44% of total area burned [16]. Intermixing of wildlands and housing at the wildland–urban interface (WUI) increases likelihood of fire, fire suppression, build-up of fuel (i.e., vegetation), and fire severity, when fire eventually occurs. Total WUI area in the United States has increased since 1970 so that now the WUI contains about 10% of the land area occupied by housing and about 33% of all housing units in the continental United States [17].
Although definitions vary, risk has components of hazard (e.g., summer heat or dangerous fire weather), exposure (e.g., location by region), and vulnerability (e.g., residential densities, where exurban residents are more vulnerable to fire due to proximity to vegetation or fuels than suburban or urban residents). To provide an indication of current risk and future risk as temperatures warm and populations grow and migrate, I present fire risk based on fire weather and also summer heat risk during the recent past (1971–2000), present and near future (2010–2039), and the medium-range future (2040–2069) by dynamic residential densities and stable ecological regions for the continental United States. For fire risk, I selected an indicator of extreme fire weather, days below the third percentile of 100-h fuel moisture [18,19], and to supply a measure of heat, I selected summer maximum temperature that translates easily as a “climate amenity”. I applied Integrated Climate and Land Use Scenarios (ICLUS; [20]), which project residential density classes. With the models, I was able to answer whether US residents will move from areas with heat risk into areas with fire risk and whether some residential densities are more at risk. While this is not the first analysis of fire risk for the continental US, I supply updates and refinements, which could prove useful, given that there appear to be both limited model sources and summaries. These types of assessments are critical to inform public awareness of natural hazards and climate change, a first step to safer communities and reductions in loss of life, injury, and economic costs. Moreover, fire weather and heat are inextricably linked, resulting in compound risk, with implications for society and ecosystems.
2. Methods
For ecoregions, I used ecological divisions, slightly modified by merging any spatially disjunct features into the surrounding region ([21]; Figure 1). Although it is possible to adjust the ‘eco’ component of the ecoregion based on climate change projections [22], the regions are recognizable and cultural, for example, ‘the South’. Therefore, I held the region boundaries constant in time, and then converted the shapefile to a raster with characteristics that matched the Integrated Climate and Land Use Scenarios file (e.g., 90 m resolution; ESRI, Redlands, CA, ArcMap v. 10.5.1).
I selected a mean ensemble general circulation model and two general circulation models of HadGEM2-ES365, to match one of the general circulation models applied in Integrated Climate and Land Use Scenarios (ICLUS; see below) and MIROC-ESM-CHEM, which also was selected by Morefield et al. [13]. In general, no model is better or worse at representing observed spatial patterns of basic climate and hydrological variables, despite variability across most regions and seasons [23]. I additionally focused on the representative concentration pathway of RCP8.5, which best corresponds with current carbon dioxide concentration trends. If mitigation occurs, RCP8.5 may represent climate of a later interval. Nonetheless, I analyzed RCP4.5 for comparison purposes.
Integrated Climate and Land Use Scenarios (ICLUS; [20]) v2.1.1 land use projections provide population growth every 10 years by residential densities (Figure 1). The ICLUS v2.0 documentation describes the incorporation of climate change into the migration model, although models are available without climate change. Updates to ICLUS v2.1 include a switch to more recent demographic components of change (i.e., rates of fertility and mortality). Additionally, the amenity value of local climate (average precipitation and temperature for summer and winter) was permitted to influence migration patterns. I selected the RCP8.5 representative concentration pathways, which is the best match for current concentration trends. This narrative results in a U.S. population that exceeds 730 million by 2100 [6]. Hadley GEM2-ES and GISS-E2-R general circulation model options were available, but only the Hadley GEM2-ES matched as general circulation model available for fuel moisture data.
In ICLUS, urban residential densities are defined as at least 4 (3.95) housing units per hectare based on the U.S. Census Bureau definition of urban population of 1000 people per square mile. The urban high category at a threshold of at least 25 (24.7) units per hectare is based on typical densities for public transportation, whereas the suburban areas have a 1 unit per hectare threshold, which is the density for municipal sewer and water supply services. For what may be considered the wildland–urban interface, the exurban high category threshold is 0.25 units per hectare and the exurban low category threshold is 0.05 units per hectare.
Maximum temperature during summer (June, July, August) and extreme fire weather days during summer (days with 100-hour fuel moisture below the 3rd percentile) were based on downscaling of general circulation model outputs via the Multivariate Adaptive Constructed Analogs (MACA) method to 4-km resolution [18,19]. The ensemble mean consisted of 18 (extreme fire weather) or 20 (temperature) general circulation models for the recent past (1971–2000), present and near future (2010–2039), and the medium-range future (2040–2069).
I projected fuel moisture and temperature .tif files (comprised of summer fuel moisture and maximum temperature variables for two general circulation models and one ensemble of general circulation models for three climate intervals) to match details of the ICLUS data, including the Albers projection. I then applied zonal statistics (ESRI, ArcMap v. 10.5.1; I corroborated test results with R Core Team zonal statistics, R Foundation for Statistical Computing, Vienna, Austria) to determine mean values for ecoregions and residential densities. I matched ICLUS at 2000 with fuel moisture and temperature at 1971–2000, ICLUS at 2030 with fuel moisture and temperature at 2010-2039, and ICLUS at 2060 with fuel moisture and temperature at 2040–2069. Additionally, I repeated this for residential densities within each ecoregion. To isolate changes in fuel moisture and temperature from changes in population, I held one layer constant in time at either 2000 (ICLUS) or 1971–2000 (fuel moisture and temperature), while varying the other layer to 2060 or 2040–2069, and also compared 1971–2000 and 2040–2069 variables with 2060 land use without climate change.
3. Results
By region, temperature differences were generally consistent by latitude among general circulation models. From 1971–2000 to 2010–2039, the ensemble model increased slightly less than 2 °C, the MIROC model increased about 2 °C, and the Hadley model increased almost 2.5 °C (Table 1). Likewise, from 2010–2039 to 2040–2069, the ensemble model increased about 2 °C, the MIROC model increased about 2.5 °C, and the Hadley model increased almost 3 °C. Fire weather based on 100-hour fuel moisture below the third percentile was extremely variable among general circulation models (Table 1; Figure 2). The intermountain region overall had the greatest number of extreme fire weather days, ranging from 19 to 25 days by 2040–2069, but the Hadley model projected the most extreme fire weather days of >25 days in the southern US, particularly for the southeast and east regions. The RCP4.5 values for 2040–2069 were intermediate between RCP8.5 values for 2010–2039 and 2040–2069.
By residential density categories (Table 2; Figure 3), heat increased over time by about 3.5 °C to 6.5 °C by model, with greatest increases in the exurban low-density class. Approximately a 1 °C difference existed between the coolest residential density category of urban high-density and the warmest residential density category of urban low-density, which increased slightly over time from 0.8 to 1 °C. The urban high-density also had the least number of extreme fire weather days, although wildfires are not likely to occur in urban areas, which do not have continuous vegetation cover to spread fire. The exurban low-density category had the greatest number of extreme fire weather days by 2040–2069, but the differences among residential densities were slight except in the Hadley model, which projected 25 days for exurban low-density, 22 days for exurban high-density, and 20 days for suburban. Extreme fire weather days increased over time from about three days during 1971–2000 to four or five days during 2010–2039 to seven or eight days during 2040–2069 for the ensemble and MIROC models and from about 3.5 days to 8 days to 20 days for the Hadley model. The RCP4.5 values for 2040–2069 were intermediate between RCP8.5 values for 2010-2039 and 2040-2069. Results were extremely variable by region (Supplementary Table S1).
While holding land use constant at 2000 in combination with 2049–2060 climate change, temperature increased by 3.3 to 6 °C, depending on general circulation model and residential densities. Similarly, the number of extreme fire weather days increased by 3.5 to 20 days, depending on general circulation model and residential densities. While holding climate change constant at 1970–2000 in combination with 2060 land use, number of extreme fire weather days overall was similar, but temperature increased by 0.4 to 0.8 °C, indicating movement to warmer areas (Table 2). Similarly, 2049-2060 values were greater for 2060 land use than 2000 land use. The 2060 land use model was similar with and without the incorporation of climate change.
For area of residential categories, all areas increased over time (Table 2). Nonetheless, the percentage of total area (i.e., sum of the five categories) that each category represented over time changed, with high-density urban increasing from about 0.5% to 1.2%, low-density urban increasing from about 8% to 10.4%, suburban increasing from about 9.2% to 10.7%, high-density exurban held steady at about 27%, and high-density exurban decreasing from about 55% to 50.5%. The area of exurban residential density represents the wildland–urban interface, which has greater potential of wildfire. Results varied greatly by region (Supplementary Table S1).
4. Discussion
4.1. Will United States Residents Move from Areas with Heat Risk into Areas with Fire Risk and are Some Residential Densities More at Risk?
Both climate change and socioeconomic factors, which drive population growth and distributions and land use, are important determinants of risks [1]. Climate change greatly increased temperature (+3.3 to 6 °C) and number of extreme fire weather days (+3.5 to 20 days), but adaptive response by migration was small, in this model (6; Table 2). Indeed, modeled movement and population growth alone without climate change increased population exposure to heat slightly (+0.4 to 0.8 °C). The relative influence of heat and number of extreme fire weather days was much greater than population dynamics. Climate change risks also varied across regions (Supplementary Table S1).
Nonetheless, continued movement to and growth in urban centers will reduce wildfire exposure. The exurban low-density category had the greatest number of extreme fire weather days by 2040–2069, albeit the difference among residential density categories may be minor depending on the general circulation model. Even though number of extreme fire weather days is based on weather alone, residential categories impart another measure of fire risk. Despite exceptions, the exurban low- and high-density residential classes (i.e., WUI) are most at risk of fire due to the presence of continuous vegetation, which spreads fire, and human-caused ignitions (due to equipment use, smoking, campfires, railroads, arson, debris burning, children, fireworks, and power lines; [16]). Area of exurban low-density decreased over time (55% to 50.5%), as urbanization occurred. Regional variation in area of the exurban low-density category was great (Supplementary Table S1).
Urban areas have their own, warmer climate than surrounding areas, owing to absorption and release of heat by buildings, heat from energy use, and lack of surface moisture [12]. Due to the urban heat island effect, future population growth in urban centers will increase heat risk. The urban high-density residential category by location is coolest, probably because megacities tend to be located along coastlines or rivers, which moderate temperature (Table 2; Figure 3). Therefore, heat-related mortality may be greatest in the urban low-density residential category, which already is 0.8 °C warmer than the urban high-density residential category. However, it may be that densely populated cities make up for the difference in temperature due to a greater heat island effect.
Uncertainty in estimates originates from many sources, including climate general circulation models and concentration projections, downscaling, and future changes in population and land use in response to climate change. Great spatial heterogeneity occurs in projections (Figure 2), reducing the certainty of conclusions. Fire risk is likely to increase due to extreme fire weather alone, but fire risk is moderated by many factors. Models will improve with continued development.
4.2. Adaptation
Risk entails hazard (e.g., weather events), exposure to hazard, and vulnerability to harm from hazards. Risk perception is critical for the realization of vulnerabilities and development of adaptive actions to reduce the negative effects of climate change and help transition ecosystems and society to changing conditions [1]. For example, risk in the distant future may not prevail over immediate concerns or motivate outlays of resources to prepare for future risk, particularly when residents doubt both risk and effectiveness of mitigation actions [24]. Both failure to recognize change and deferral of action are able to occur because climate change is slow to develop. Early warning signs include extreme weather events, flooding, drought, wildfires, and record hottest years. However, shifting baselines in the perception of normal conditions may cause tolerance for progressive escalation of event intensity. Moreover, slow development of climate change allows deferral of action to pass to other generations. It is hoped that technology will avert climate change, but so far that is not in evidence.
Adaptation strategies can reduce vulnerability. For example, U.S. residents have been able to adapt well to heat due to air conditioning units, which, paradoxically, promote increased climate warming [25]. Planted trees and other vegetation can likewise help cool cities. Furthermore, switching to a more sedentary and indoor lifestyle prevents heat-related mortality. Crop workers, who are active during the summer and typically not U.S. citizens, are particularly vulnerable to heat stroke [26]. Heat contributes to mortality for people with cardiovascular and respiratory illnesses and the elderly, who are less able to respond physiologically to heat [27].
Residents and communities have been slower to employ less gratifying and more active adaptation and mitigation strategies to reduce vulnerability to fire and climate change. Many exurban residents, who live at the wildland–urban interface with exposure at the intersection of human-caused ignitions with vegetation, do not take actions to create defensible space on their land by reducing flammable vegetation and armoring houses against fire [28]. Trees are valuable features in moderation, but high densities around houses will encourage fires. Wildfire damage to most homes and structures is due to ignition after wind-borne embers land on a roof or wooden deck or blow in through vents [29]. Instead, homeowners rely on neighboring public or private landowners for fuel treatment [30], government emergency services to suppress wildfire, and insurance or federal disaster assistance to cover any property losses [31]. Programs such as Firewise, Wildfire Risk to Communities, and Ready, Set, Go! educate and encourage communities to maintain defensible space, develop wildfire plans, and prepare for evacuation.
Vulnerability to climate change can be exacerbated by increased population and land uses, whereas sustainable development may reduce vulnerability to climate change [1]. Planning guidelines that constrain wildland–urban interface sprawl will result in easier wildfire defense and evacuation of people from WUI communities. Disclosure of wildfire risk may reduce building and movement into fire-prone areas, affecting the spread of future housing development in high-risk locations [32].
4.3. Compound Risk
Climate change is affecting ecosystems and society in numerous ways, including increased extreme weather events. Hot temperatures may compromise health and outside activities of both work and leisure, such as farming or gardening and summer sports. Fire may cause road closures, breakdown of infrastructure networks such as electricity, water supply, and health and emergency services, disruption of livelihoods, injury, ill-health, or even mortality. Fire may lead to post-fire flooding and debris flow due to loss of vegetation and soil erosion, intensifying vulnerability. On top of heat, fire, and post-fire events, climate change will increase the likelihood of heavy precipitation and flooding, resulting in a cascade in which greater temperatures will produce more fires that will interact with floods. Urbanization in coastal or riverine cities will additionally increase flood exposure. Extreme events often interact because they are spatially and temporally dependent, leading to underestimation of risk [33,34].
Compound risk occurs due to synergistic interactions among hazards, resulting in greater risk than simple summation of independent events, particularly across sectors. For example, heat-related mortality may be partially related to effects of air quality on respiratory diseases [1]. Hotter weather contributes to greater ground level ozone (smog) in polluted areas, wildfire smoke, and production of pollen, exacerbating respiratory problems [1]. Indeed, Mora et al. [35] documented 467 pathways by which climate hazards such as warming, heatwaves, precipitation, drought, floods, fires, storms, sea-level rise, and changes in natural land cover and ocean chemistry affected human health, water, food, economy, infrastructure, and security.
5. Conclusions
Climate change will greatly increase temperature and number of extreme fire weather days by 2040-2069. The exurban density classes are most vulnerable to wildfire, due to the intersection of human-caused ignitions and vegetation, and the urban density classes are most vulnerable to heat, due to the urban heat island effect. Population movement and growth to urban centers will reduce the percentage area of exurban density classes, reducing exposure to wildfire, but movement and growth will increase exposure to heat, based on these models. Adaptation strategies can reduce risk. Risk is compounded by interactions among climate change effects, which may impact health, livelihoods, assets and homes, well-being and sense of place, and other sectors such as crop yields, food security, and water resources.
Supplementary Materials
The following are available online at https://www.mdpi.com/2071-1050/12/8/3277/s1, Table S1: Mean Values of Maximum Summer Temperature (°C) and Number of Summer Days with 100-Hour Fuels Below the Third Percentile for the Ensemble General Circulation Model (GCM), MIROC-ESM-CHEM (MIR), and HadGEM2-ES365 (Had) by Region and Land Use, with Land Use Area (Square Kilometers for 2000, 2030, and 2060), for Different Climate Years.
Author Contributions
B.B.H. completed all authorship tasks. All authors have read and agreed to the published version of the manuscript.
Funding
This research received no external funding.
Acknowledgments
I thank the researchers and institutions for uploading models for open access. I acknowledge the World Climate Research Programme, which, through its Working Group on Coupled Modelling, coordinated and promoted CMIP5. I thank the climate modeling groups for producing and making available their model output and multiple funding agencies who supported CMIP5.
Conflicts of Interest
The author declare no conflict of interest.
References
- Oppenheimer, M.; Campos, M.; Warren, R.; Birkmann, J.; Luber, G.; O’Neill, B.; Takahashi, K. Emergent risks and key vulnerabilities. In Climate Change 2014: Impacts, Adaptation, and Vulnerability. Part A: Global and Sectoral Aspects. Contribution of Working Group II to the Fifth Assessment Report of the Intergovernmental Panel on Climate Change; Field, C.B., Barros, V.R., Dokken, D.J., Mach, K.J., Mastrandrea, M.D., Bilir, T.E., Chatterjee, M., Ebi, K.L., Estrada, Y.O., Genova, R.C., et al., Eds.; Cambridge University Press: New York, NY, USA, 2014; pp. 1039–1099. [Google Scholar]
- NOAA National Centers for Environmental Information (NCEI) U.S. Billion-Dollar Weather and Climate Disasters. Available online: https://www.ncdc.noaa.gov/billions/ (accessed on 25 February 2020).
- Congressional Research Service (CRS). Wildfire Management Funding: Background, Issues, and FY2018 Appropriations. Available online: https://fas.org/sgp/crs/misc/R45005.pdf (accessed on 25 February 2020).
- Hauer, M.E.; Evans, J.M.; Mishra, D.R. Millions projected to be at risk from sea-level rise in the continental United States. Nat. Clim. Chang. 2016, 6, 691–695. [Google Scholar] [CrossRef]
- Partridge, M.D.; Feng, B.; Rembert, M. Improving climate-change modeling of US migration. Am. Econ. Rev. 2017, 107, 451–455. [Google Scholar] [CrossRef] [Green Version]
- U.S. Environmental Protection Agency (EPA). Updates to the Demographic and Spatial Allocation Models to Produce Integrated Climate and Land Use Scenarios (ICLUS) Version 2; EPA/600/R-16/366F; National Center for Environmental Assessment: Washington, DC, USA, 2017. Available online: https://edg.epa.gov/metadata/catalog/main/home.page (accessed on 25 February 2020).
- NRDC. How States Stack up on Flood Disclosure. 2020. Available online: https://www.nrdc.org/flood-disclosure-map (accessed on 25 February 2020).
- U.S. Government Accountability Office (GAO). FEMA Flood Maps: Some Standards and Processes in Place to Promote Map Accuracy and Outreach, But Opportunities Exist to Address Implementation Challenges. Available online: https://www.gao.gov/products/gao-11-17 (accessed on 25 February 2020).
- Hsiang, S.; Kopp, R.; Jina, A.; Rising, J.; Delgado, M.; Mohan, S.; Rasmussen, D.J.; Muir-Wood, R.; Wilson, P.; Oppenheimer, M.; et al. Estimating economic damage from climate change in the United States. Science 2017, 356, 1362–1369. [Google Scholar] [CrossRef] [Green Version]
- Jones, B.; Tebaldi, C.; O’Neill, B.C.; Oleson, K.; Gao, J. Avoiding population exposure to heat-related extremes: Demographic change vs. climate change. Clim. Chang. 2018, 146, 423–437. [Google Scholar] [CrossRef]
- Dahl, K.; Licker, R.; Abatzoglou, J.T.; Declet-Barreto, J. Increased frequency of and population exposure to extreme heat index days in the United States during the 21st century. Environ. Res. Commun. 2019, 1, 075002. [Google Scholar] [CrossRef]
- Sanderson, M.; Arbuthnott, K.; Kovats, S.; Hajat, S.; Falloon, P. The use of climate information to estimate future mortality from high ambient temperature: A systematic literature review. PLoS ONE 2017, 12, e0180369. [Google Scholar] [CrossRef] [PubMed] [Green Version]
- Morefield, P.E.; Fann, N.; Grambsch, A.; Raich, W.; Weaver, C.P. Heat-related health impacts under scenarios of climate and population change. Int. J. Environ. Res. Public Health 2018, 15, 2438. [Google Scholar] [CrossRef] [PubMed] [Green Version]
- Bachelet, D.; Sheehan, T.; Ferschweiler, K.; Abatzoglou, J. Simulating vegetation change, carbon cycling, and fire over the western United States using CMIP5 climate projections. Nat. Hazard Uncertain. Assess. 2017, 257–275. [Google Scholar] [CrossRef]
- Liu, Y.; Goodrick, S.L.; Stanturf, J.A. Future US wildfire potential trends projected using a dynamically downscaled climate change scenario. For. Ecol. Manag. 2013, 294, 120–135. [Google Scholar] [CrossRef]
- Balch, J.K.; Bradley, B.A.; Abatzoglou, J.T.; Nagy, R.C.; Fusco, E.J.; Mahood, A.L. Human-started wildfires expand the fire niche across the United States. Proc. Natl. Acad. Sci. USA 2017, 114, 2946–2951. [Google Scholar] [CrossRef] [Green Version]
- Radeloff, V.C.; Helmers, D.P.; Kramer, H.A.; Mockrin, M.H.; Alexandre, P.M.; Bar-Massada, A.; Butsic, V.; Hawbaker, T.J.; Martinuzzi, S.; Syphard, A.D.; et al. Rapid growth of the US wildland-urban interface raises wildfire risk. Proc. Natl. Acad. Sci. USA 2018, 115, 3314–3319. [Google Scholar] [CrossRef] [PubMed] [Green Version]
- Abatzoglou, J.T. Development of gridded surface meteorological data for ecological applications and modelling. Int. J. Climatol. 2013, 33, 121–131. [Google Scholar] [CrossRef]
- Abatzoglou, J.T.; Brown, T.J. A comparison of statistical downscaling methods suited for wildfire applications. Int. J. Climatol. 2012, 32, 772–778. [Google Scholar] [CrossRef]
- U.S. Environmental Protection Agency (EPA). Updates to the Demographic and Spatial Allocation Models to Produce Integrated Climate and Land Use Scenarios (ICLUS) Version 2.1.1; EPA/600/R-16/366F; National Center for Environmental Assessment: Washington, DC, USA, 2018. Available online: https://edg.epa.gov/metadata/catalog/main/home.page (accessed on 25 February 2020).
- Ecomap. National Hierarchical Framework of Ecological Units; USDA Forest Service: Washington, DC, USA, 2007.
- Hanberry, B.B.; Fraser, J.S. Visualizing current and future climate boundaries of the conterminous United States: Implications for forests. Forests 2019, 10, 280. [Google Scholar] [CrossRef] [Green Version]
- Sheffield, J.; Barrett, A.; Colle, B.; Fernando, D.N. North American climate in CMIP5 experiments. Part I: Evaluation of historical simulations of continental and regional climatology. J. Clim. 2013, 26, 9209–9245. [Google Scholar] [CrossRef] [Green Version]
- McCaffrey, S. Crucial factors influencing public acceptance of fuels treatments. Fire Manag. Today 2009, 69, 9–12. [Google Scholar]
- Barreca, A.; Clay, K.; Deschenes, O.; Greenstone, M.; Shapiro, J.S. Adapting to climate change: The remarkable decline in the US temperature-mortality relationship over the twentieth century. J. Political Econ. 2016, 124, 105–159. [Google Scholar] [CrossRef] [Green Version]
- Taylor, E.V.; Vaidyanathan, A.; Flanders, W.D.; Murphy, M.; Spencer, M.; Noe, R.S. Differences in heat-related mortality by citizenship status: United States, 2005–2014. Am. J. Public Health 2018, 108, S131–S136. [Google Scholar] [CrossRef] [Green Version]
- Cui, J.; Sinoway, L.I. Cardiovascular responses to heat stress in chronic heart failure. Curr. Heart Fail. Rep. 2014, 11, 139–145. [Google Scholar] [CrossRef]
- Brenkert-Smith, H.B.; Champ, P.A.; Flores, N. Insights into wildfire mitigation decisions among wildland-urban interface residents. Soc. Nat. Resour. 2006, 19, 759–768. [Google Scholar] [CrossRef]
- Cohen, J.D. Preventing disaster: Home ignitability in the wildland-urban interface. J. For. 2000, 98, 15–21. [Google Scholar]
- Ayres, A.; Degolia, A.; Fienup, M.; Kim, Y.; Sainz, J.; Urbisci, L.; Viana, D.; Wesolowski, G.; Plantinga, A.J.; Tague, C. Social science/natural science perspectives on wildfire and climate change. Geogr. Compass 2016, 10, 67–86. [Google Scholar] [CrossRef]
- U.S. Office of Inspector General (OIG). Audit Report: Forest Service Large Fire Suppression Costs. Rep. 08601-44-SF. Available online: http://www.usda.gov/oig/webdocs/08601-44-SF.pdf (accessed on 25 February 2020).
- Donovan, G.H.; Champ, P.A.; Butry, D.T. Wildfire risk and housing prices: A case study from Colorado Springs. Land Econ. 2007, 83, 217–233. [Google Scholar] [CrossRef]
- Leonard, M.; Westra, S.; Phatak, A.; Lambert, M.; van den Hurk, B.; McInnes, K.; Risbey, J.; Schuster, S.; Jakob, D.; Stafford-Smith, M. A compound event framework for understanding extreme impacts. Wiley Interdiscip. Rev. Clim. Chang. 2014, 5, 113–128. [Google Scholar] [CrossRef]
- Zscheischler, J.; Westra, S.; Van Den Hurk, B.J.; Seneviratne, S.I.; Ward, P.J.; Pitman, A.; AghaKouchak, A.; Bresch, D.N.; Leonard, M.; Wahl, T.; et al. Future climate risk from compound events. Nat. Clim. Chang. 2018, 8, 469–477. [Google Scholar] [CrossRef]
- Mora, C.; Spirandelli, D.; Franklin, E.C.; Lynham, J.; Kantar, M.B.; Miles, W.; Smith, C.Z.; Freel, K.; Moy, J.; Louis, L.V.; et al. Broad threat to humanity from cumulative climate hazards intensified by greenhouse gas emissions. Nat. Clim. Chang. 2018, 8, 1062–1071. [Google Scholar] [CrossRef]
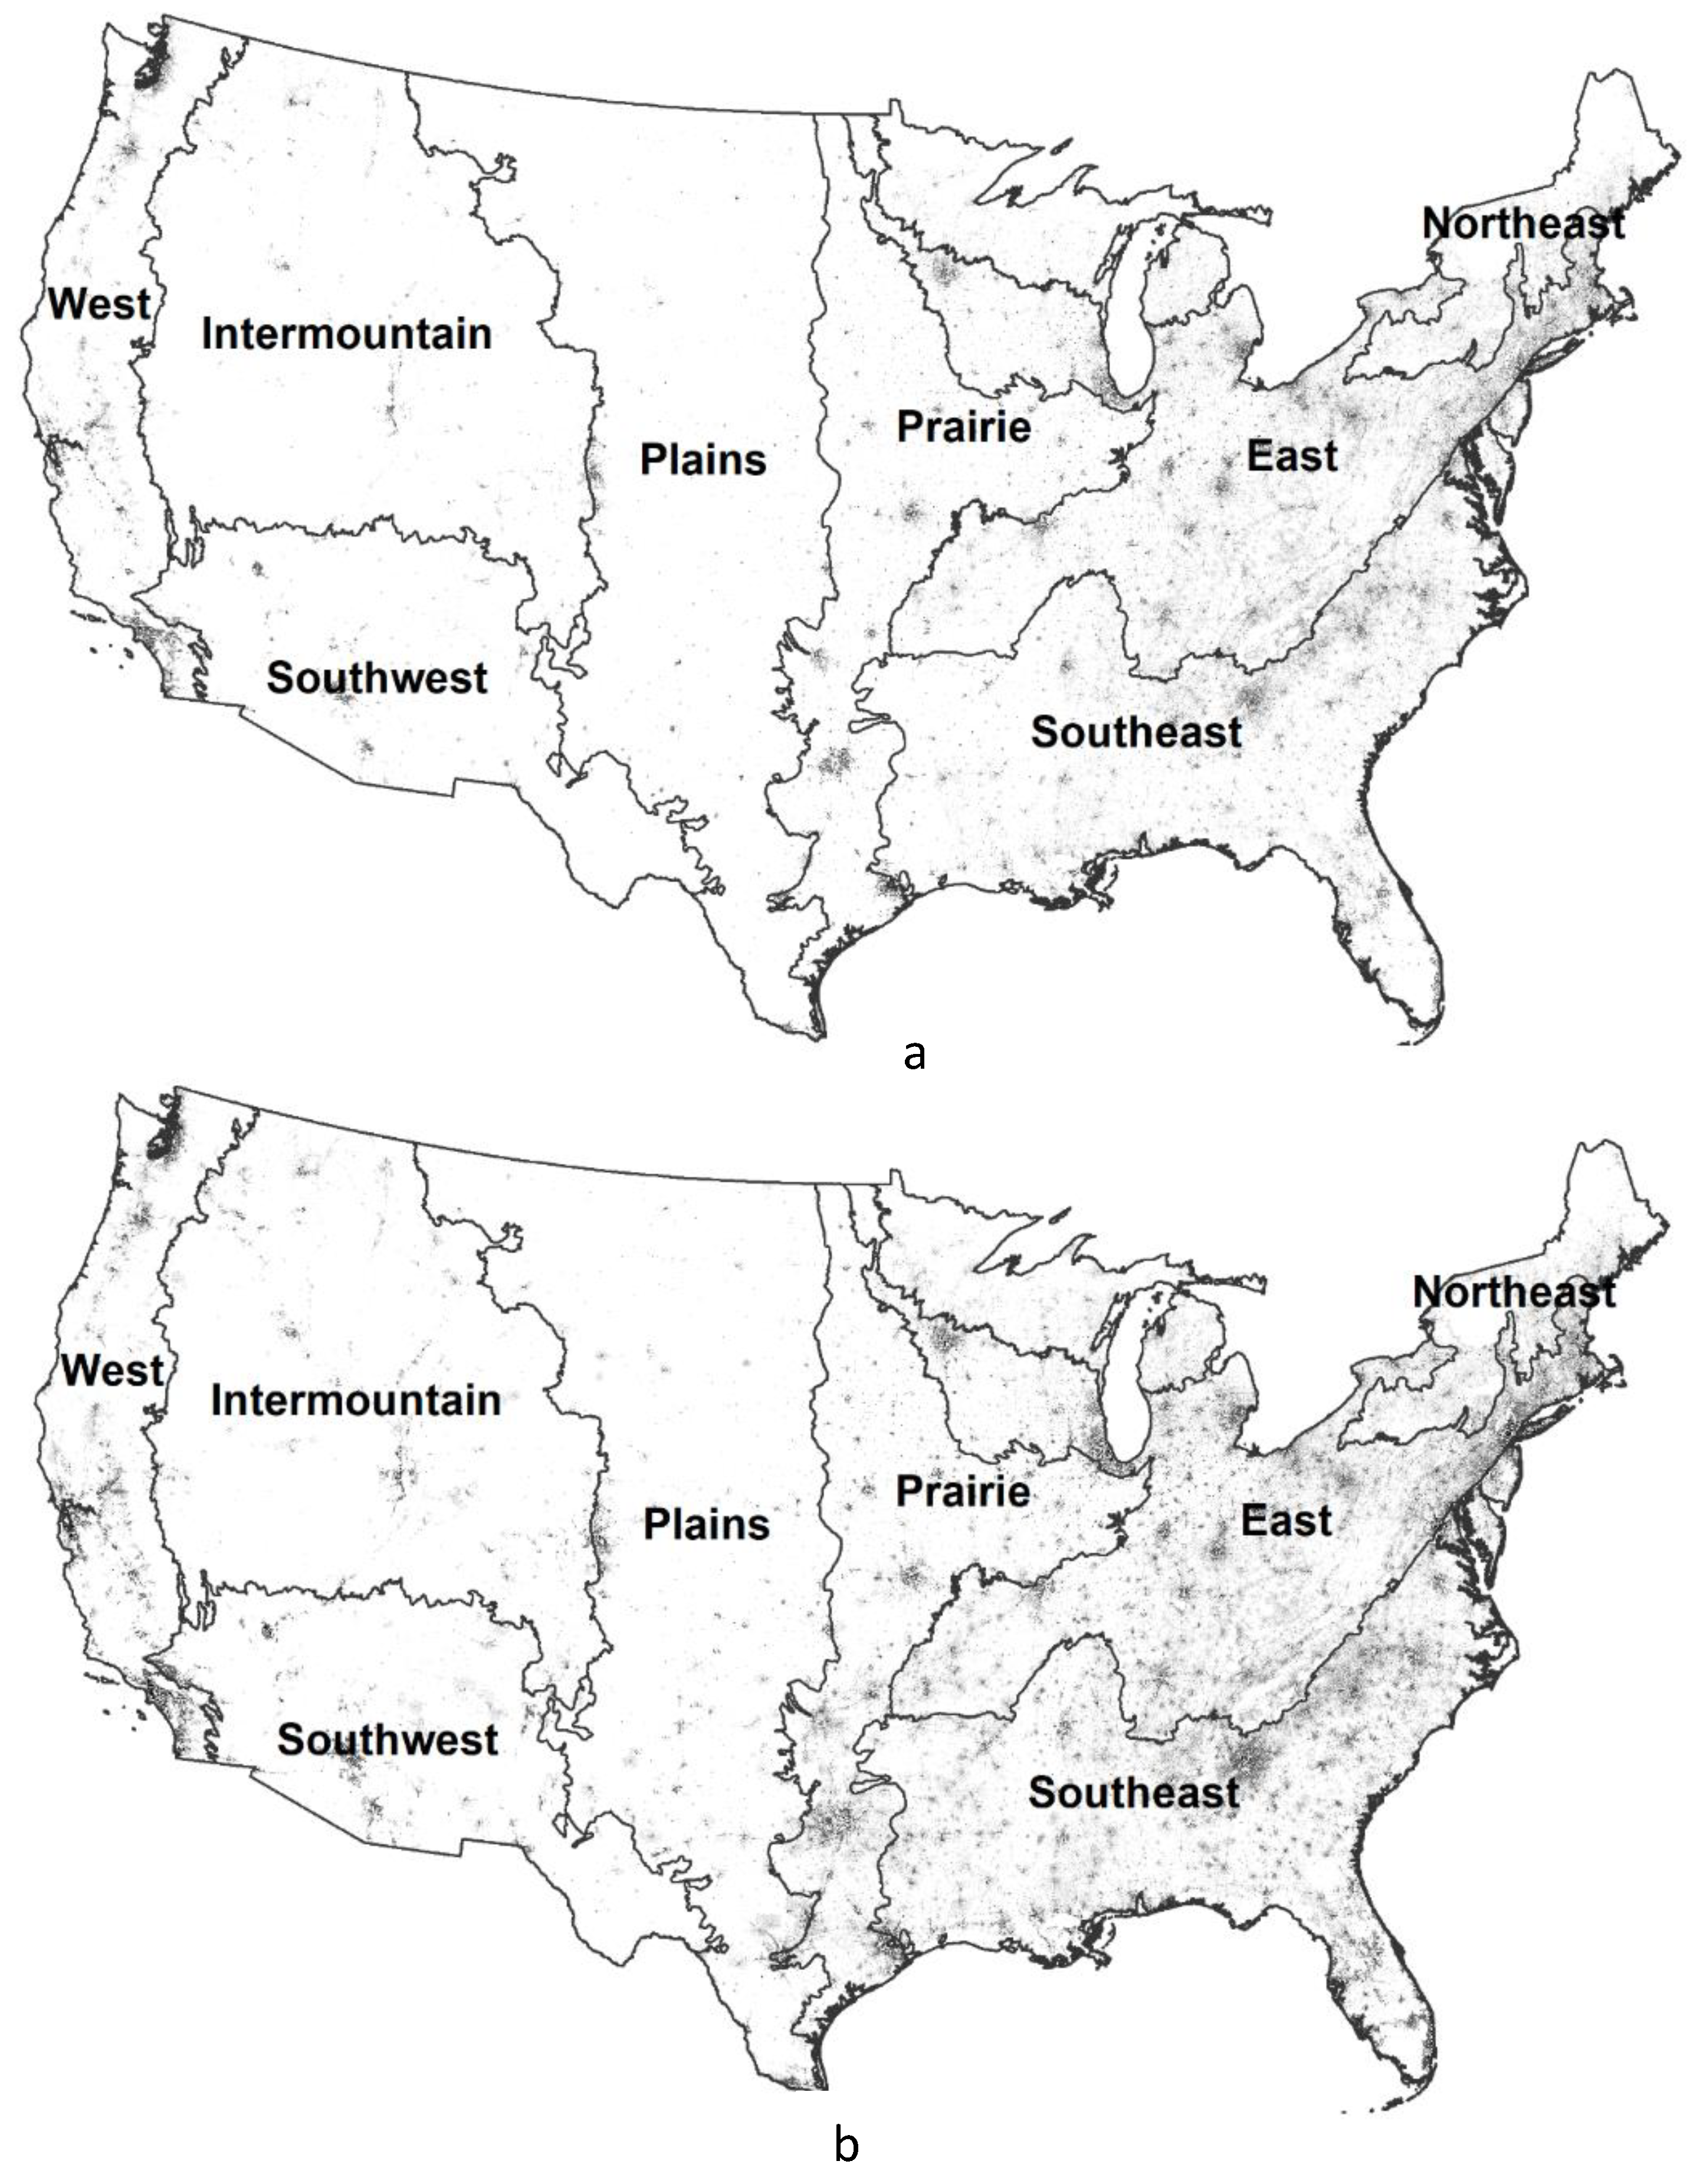
Figure 1.
Regions of the continental United States, and residential density categories (gray shades) during 2000 (a) and 2060 (b). Residential density categories are based on a minimum of 0.05 housing units per hectare.
Figure 1.
Regions of the continental United States, and residential density categories (gray shades) during 2000 (a) and 2060 (b). Residential density categories are based on a minimum of 0.05 housing units per hectare.

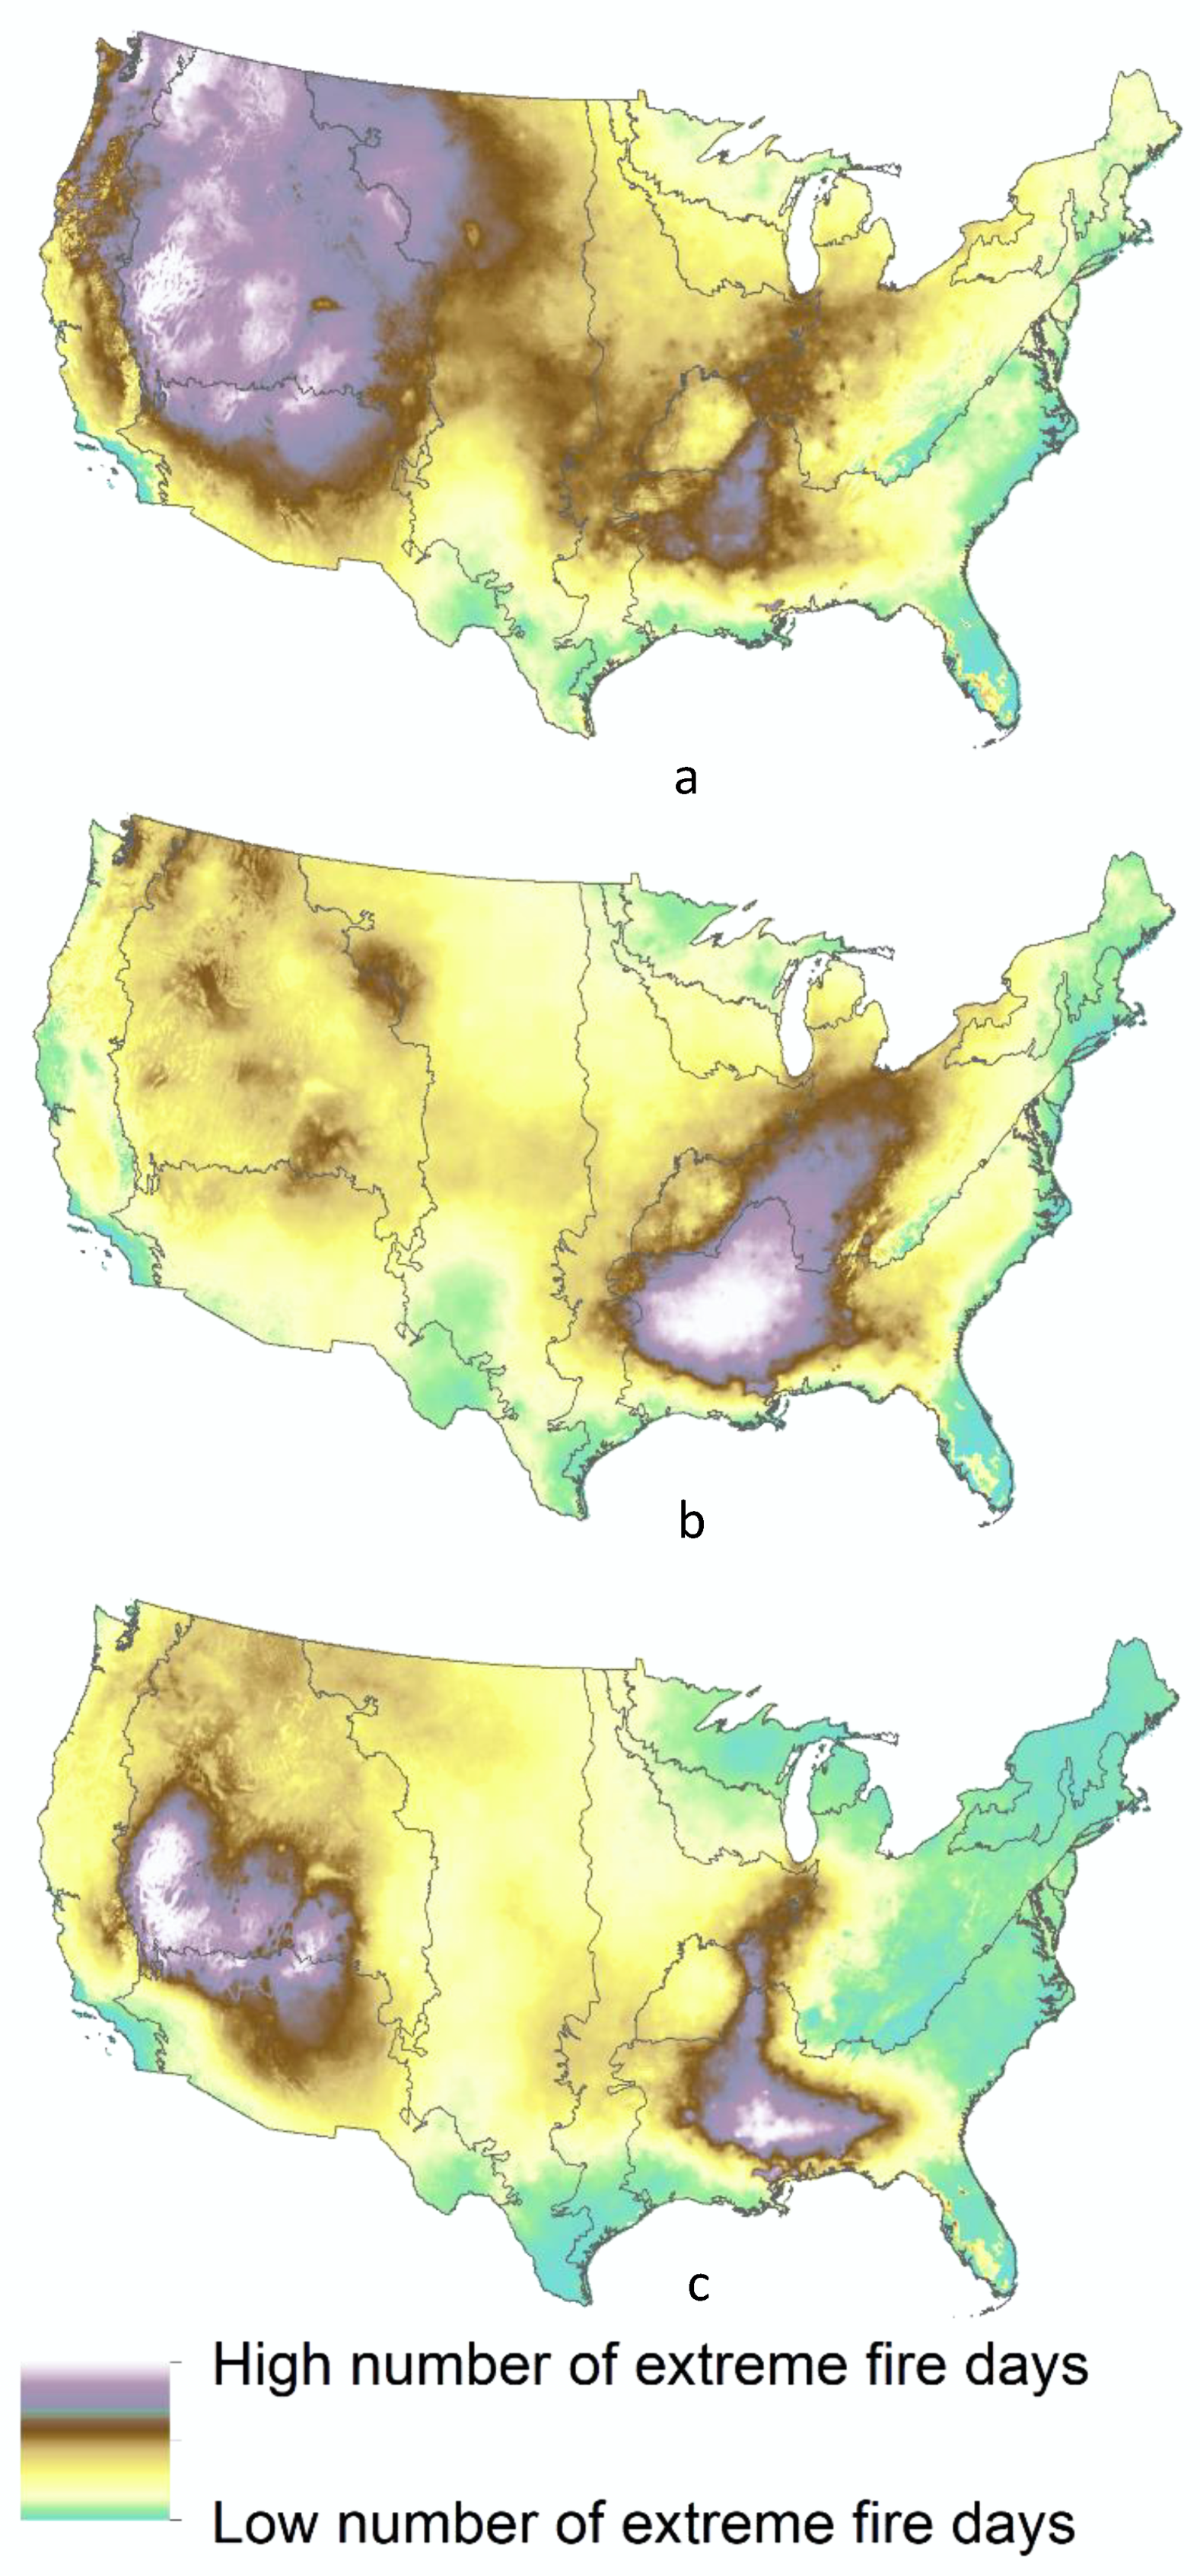
Figure 2.
Number of summer days below the third percentile of 100-h fuel moisture for the ensemble general circulation model (a), HadGEM2-ES365 (b), and MIROC-ESM-CHEM (c) during 2039–2060.
Figure 2.
Number of summer days below the third percentile of 100-h fuel moisture for the ensemble general circulation model (a), HadGEM2-ES365 (b), and MIROC-ESM-CHEM (c) during 2039–2060.

Figure 3.
Box plots of temperature (°C) and number of extreme fire weather days for means of the ensemble general circulation model, HadGEM2-ES365, and MIROC-ESM-CHEM during 1971–2000 (RCP8.5), 2010–2039 (RCP8.5), 2040–2069 (RCP8.5), and 2040–2069 (RCP4.5) by residential density categories of exurban low (white) and high (gray) densities, suburban (yellow), and urban low (pink) and high (purple) densities.


Table 1.
Mean values of maximum summer temperature (°C) and number of summer days with 100-hour fuels below the third percentile by region for the ensemble general circulation model (GCM), MIROC-ESM-CHEM (MIR), and HadGEM2-ES365 (Had) and RCP8.5 for different climate years and RCP4.5 for 2040–2069.
Table 1.
Mean values of maximum summer temperature (°C) and number of summer days with 100-hour fuels below the third percentile by region for the ensemble general circulation model (GCM), MIROC-ESM-CHEM (MIR), and HadGEM2-ES365 (Had) and RCP8.5 for different climate years and RCP4.5 for 2040–2069.
| Region | GCM | Had | MIR | GCM | Had | MIR |
|---|---|---|---|---|---|---|
| 1971–2000 | ||||||
| East | 28.6 | 28.6 | 28.5 | 2.3 | 3.4 | 2.2 |
| Northeast | 24.8 | 25.0 | 24.7 | 1.9 | 1.9 | 1.6 |
| Plains | 30.7 | 30.6 | 30.8 | 5.3 | 5.6 | 6.0 |
| Prairie | 30.8 | 30.8 | 30.9 | 3.8 | 4.7 | 4.4 |
| Intermountain | 26.3 | 26.2 | 26.2 | 9.4 | 9.3 | 9.6 |
| Southeast | 32.5 | 32.5 | 32.5 | 1.6 | 2.7 | 2.2 |
| Southwest | 33.7 | 33.6 | 33.6 | 7.0 | 6.8 | 6.8 |
| West | 26.7 | 26.5 | 26.6 | 7.2 | 7.1 | 7.4 |
| 2010–2039 RCP8.5 | ||||||
| East | 30.3 | 31.4 | 30.5 | 4.8 | 11.3 | 3.8 |
| Northeast | 26.5 | 27.0 | 26.6 | 3.2 | 3.3 | 2.4 |
| Plains | 32.5 | 33.0 | 32.8 | 7.5 | 7.8 | 5.9 |
| Prairie | 32.6 | 33.4 | 32.9 | 6.5 | 9.5 | 6.5 |
| Intermountain | 28.2 | 28.7 | 28.6 | 13.0 | 12.4 | 11.5 |
| Southeast | 34.0 | 34.9 | 34.4 | 3.8 | 11.7 | 4.8 |
| Southwest | 35.4 | 36.1 | 35.9 | 9.2 | 11.8 | 12.7 |
| West | 28.4 | 28.7 | 28.7 | 9.5 | 8.6 | 7.8 |
| 2040–2069 RCP8.5 | ||||||
| East | 32.4 | 35.1 | 33.2 | 7.5 | 26.6 | 7.0 |
| Northeast | 28.5 | 29.6 | 29.2 | 4.5 | 9.9 | 2.3 |
| Plains | 34.5 | 35.7 | 35.6 | 11.0 | 17.0 | 11.4 |
| Prairie | 34.6 | 36.4 | 36.0 | 9.4 | 20.6 | 11.1 |
| Intermountain | 30.3 | 31.7 | 31.5 | 18.7 | 25.4 | 23.6 |
| Southeast | 35.7 | 38.4 | 37.1 | 6.9 | 30.1 | 14.6 |
| Southwest | 37.1 | 37.8 | 38.2 | 11.8 | 15.2 | 18.6 |
| West | 30.1 | 30.8 | 30.9 | 12.4 | 14.6 | 12.7 |
| 2040–2069 RCP4.5 | ||||||
| East | 31.3 | 33.1 | 32.0 | 4.8 | 13.3 | 5.9 |
| Northeast | 27.5 | 28.6 | 28.0 | 3.4 | 7.7 | 2.3 |
| Plains | 33.5 | 34.3 | 34.6 | 9.8 | 13.3 | 13.1 |
| Prairie | 33.7 | 34.8 | 35.4 | 7.8 | 11.6 | 13.4 |
| Intermountain | 29.2 | 30.4 | 29.9 | 16.0 | 19.7 | 16.8 |
| Southeast | 34.9 | 36.4 | 35.5 | 4.3 | 13.3 | 8.1 |
| Southwest | 36.3 | 36.7 | 37.6 | 10.7 | 9.9 | 17.4 |
| West | 29.3 | 30.0 | 30.0 | 11.1 | 11.6 | 11.4 |
Table 2.
Mean values of maximum summer temperature (°C) and number of summer days with 100-hour fuels below the third percentile by land use and year, with land use area (square kilometers), for the ensemble general circulation model (GCM), MIROC-ESM-CHEM (MIR), and HadGEM2-ES365 (Had) and RCP8.5 for different climate intervals and RCP4.5 for 2040–2069. The 2060 land use model without climate change (no cc), 2000 land use with 2040–2069 variable values, and 2060 land use with 1971–2000 values allow isolation of different effects.
| Land Use | Area | GCM | Had | MIR | GCM | Had | MIR | Land Use | GCM | Had | MIR | GCM | Had | MIR |
|---|---|---|---|---|---|---|---|---|---|---|---|---|---|---|
| 2000 | 1971–2000 | 2060 no cc | 1971–2000 | |||||||||||
| Exurban, low-density | 362,732 | 29.1 | 29.2 | 29.1 | 2.3 | 3.2 | 2.4 | 29.9 | 29.9 | 29.8 | 2.6 | 3.5 | 2.7 | |
| Exurban, high-density | 179,933 | 29.6 | 29.6 | 29.6 | 2.7 | 3.5 | 2.9 | 30.1 | 30.1 | 30.0 | 2.8 | 3.6 | 3.0 | |
| Suburban | 61,137 | 30.1 | 30.1 | 30.0 | 2.9 | 3.6 | 3.0 | 30.5 | 30.5 | 30.4 | 2.8 | 3.6 | 3.0 | |
| Urban, low-density | 52,935 | 30.2 | 30.2 | 30.1 | 3.4 | 4.1 | 3.4 | 30.7 | 30.6 | 30.6 | 3.4 | 4.1 | 3.5 | |
| Urban, high-density | 2986 | 29.4 | 29.4 | 29.3 | 2.7 | 3.4 | 2.7 | 29.9 | 29.9 | 29.8 | 2.8 | 3.4 | 2.9 | |
| 2030 | 2010–2039 RCP8.5 | 2060 | 2040–2069 RCP4.5 | |||||||||||
| Exurban, low-density | 515,820 | 31.5 | 32.3 | 31.6 | 4.7 | 9.9 | 3.9 | 32.5 | 34.0 | 33.1 | 5.2 | 12.3 | 6.7 | |
| Exurban, high-density | 261,415 | 31.6 | 32.4 | 31.8 | 4.8 | 8.8 | 4.2 | 32.6 | 34.0 | 33.3 | 5.4 | 11.6 | 7.1 | |
| Suburban | 95,177 | 31.9 | 32.6 | 32.1 | 4.7 | 8.1 | 4.1 | 32.9 | 34.3 | 33.6 | 5.3 | 10.8 | 7.2 | |
| Urban, low-density | 83,283 | 32.1 | 32.7 | 32.3 | 5.3 | 8.3 | 5.0 | 33.1 | 34.3 | 34.0 | 6.0 | 11.0 | 8.2 | |
| Urban, high-density | 7200 | 31.2 | 31.7 | 31.5 | 4.4 | 6.1 | 4.1 | 32.3 | 33.2 | 33.1 | 4.8 | 8.4 | 6.6 | |
| 2060 | 2040–2069 RCP8.5 | 2060 no cc | 2040–2069 RCP8.5 | |||||||||||
| Exurban, low-density | 565,298 | 33.4 | 35.8 | 34.2 | 7.5 | 24.8 | 8.8 | 33.3 | 35.7 | 34.1 | 7.3 | 24.5 | 8.4 | |
| Exurban, high-density | 300,486 | 33.5 | 35.7 | 34.3 | 7.4 | 22.2 | 8.7 | 33.4 | 35.5 | 34.2 | 7.3 | 21.8 | 8.4 | |
| Suburban | 120,101 | 33.8 | 35.8 | 34.6 | 7.1 | 20.2 | 8.4 | 33.6 | 35.6 | 34.5 | 7.0 | 20.0 | 8.3 | |
| Urban, low-density | 116,687 | 33.9 | 35.6 | 34.7 | 7.7 | 18.8 | 9.0 | 33.7 | 35.4 | 34.6 | 7.7 | 18.8 | 8.9 | |
| Urban, high-density | 14,022 | 32.9 | 34.2 | 33.7 | 6.2 | 13.7 | 7.1 | 32.7 | 34.1 | 33.6 | 6.4 | 14.2 | 7.1 | |
| 2000 | 2040–2069 RCP8.5 | 2060 | 1971–2000 | |||||||||||
| Exurban, low-density | 362,732 | 32.7 | 35.1 | 33.4 | 6.8 | 23.1 | 7.2 | 479,043 | 29.9 | 29.9 | 29.9 | 2.7 | 3.6 | 2.9 |
| Exurban, high-density | 179,933 | 33.1 | 35.2 | 33.9 | 7.2 | 21.0 | 8.2 | 236,722 | 30.1 | 30.1 | 30.1 | 2.8 | 3.6 | 3.0 |
| Suburban | 61,137 | 33.5 | 35.4 | 34.4 | 7.2 | 19.8 | 8.4 | 81,926 | 30.5 | 30.5 | 30.4 | 2.8 | 3.6 | 3.0 |
| Urban, low-density | 52,935 | 33.6 | 35.3 | 34.5 | 7.8 | 18.7 | 8.9 | 66,789 | 30.7 | 30.7 | 30.6 | 3.4 | 4.1 | 3.6 |
| Urban, high-density | 2986 | 32.7 | 34.0 | 33.5 | 6.2 | 13.8 | 6.9 | 4620 | 29.9 | 29.9 | 29.8 | 2.7 | 3.3 | 2.8 |
© 2020 by the author. Licensee MDPI, Basel, Switzerland. This article is an open access article distributed under the terms and conditions of the Creative Commons Attribution (CC BY) license (http://creativecommons.org/licenses/by/4.0/).
Share and Cite
MDPI and ACS Style
Hanberry, B.B. Compounded Heat and Fire Risk for Future U.S. Populations. Sustainability 2020, 12, 3277. https://doi.org/10.3390/su12083277
AMA Style
Hanberry BB. Compounded Heat and Fire Risk for Future U.S. Populations. Sustainability. 2020; 12(8):3277. https://doi.org/10.3390/su12083277
Chicago/Turabian StyleHanberry, Brice B. 2020. "Compounded Heat and Fire Risk for Future U.S. Populations" Sustainability 12, no. 8: 3277. https://doi.org/10.3390/su12083277
Note that from the first issue of 2016, this journal uses article numbers instead of page numbers. See further details here.