Self-Organizing Map Network-Based Soil and Water Conservation Partitioning for Small Watersheds: Case Study Conducted in Xiaoyang Watershed, China

Abstract
:1. Introduction
2. Methods
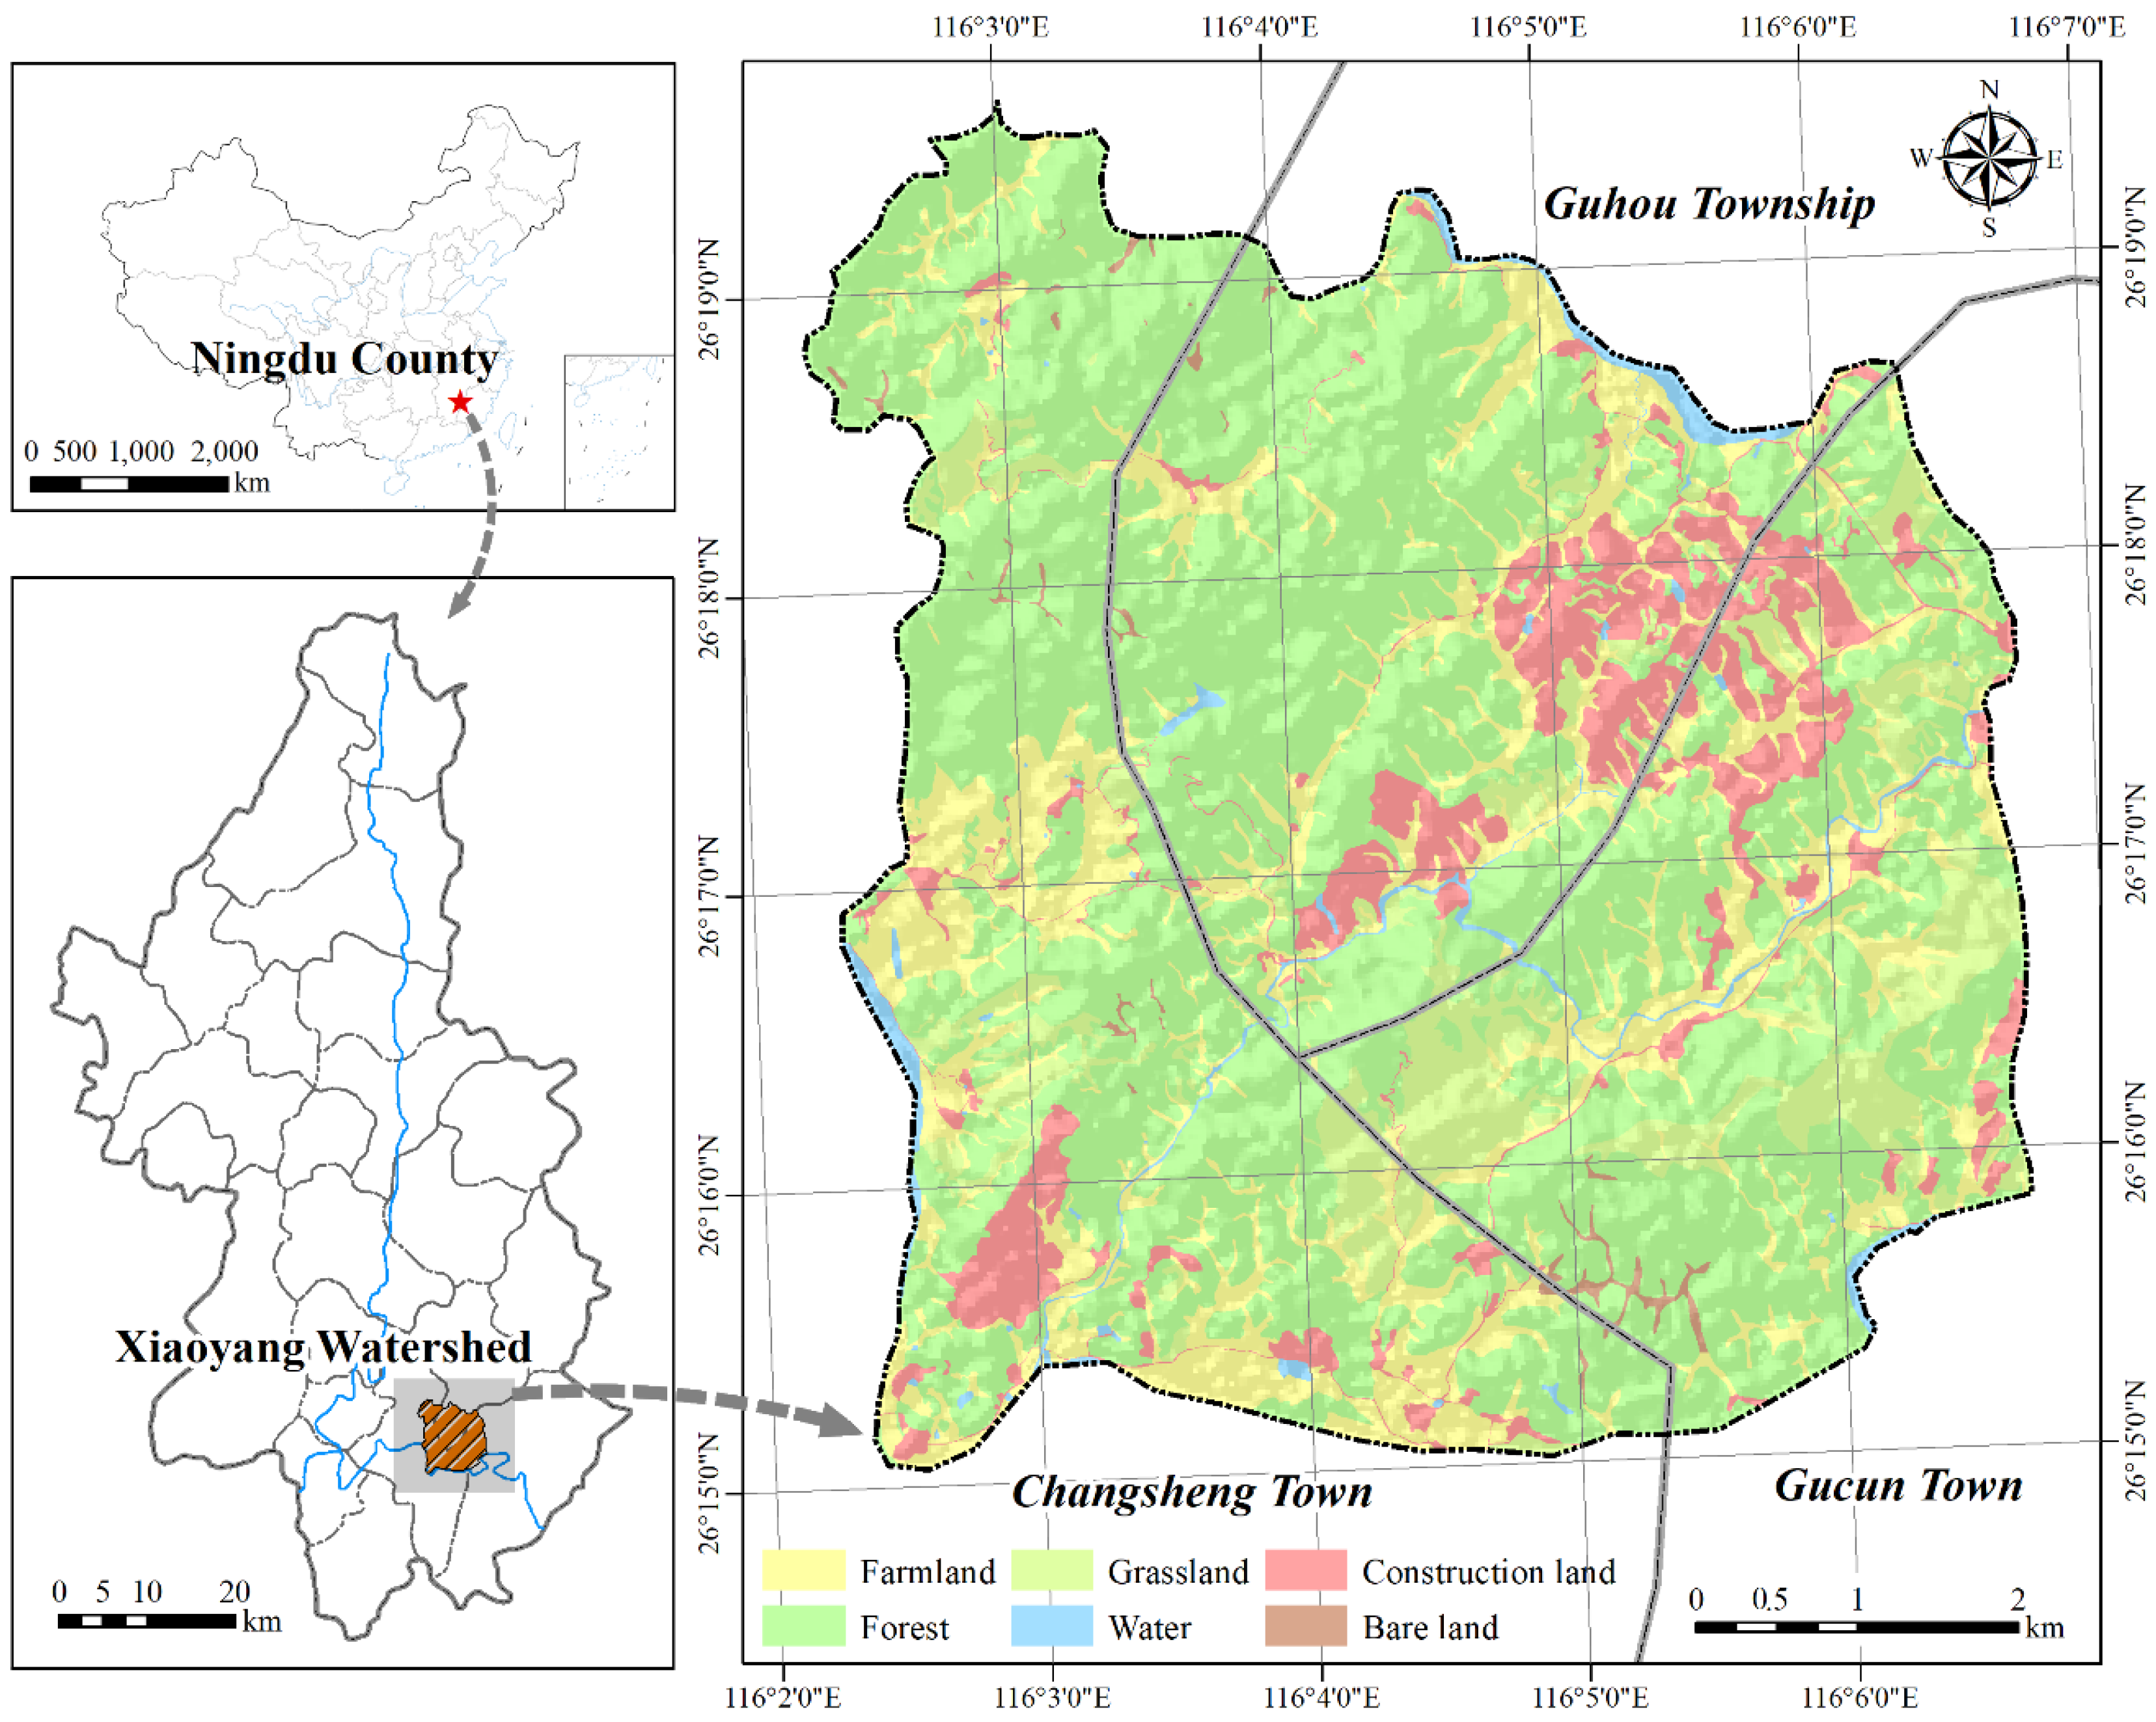
2.1. Study Area
2.2. Indicator System
2.2.1. Pressure Dimension
2.2.2. State Dimension
2.2.3. Response Dimension
2.3. Self-Organizing Map Methodology
3. Results
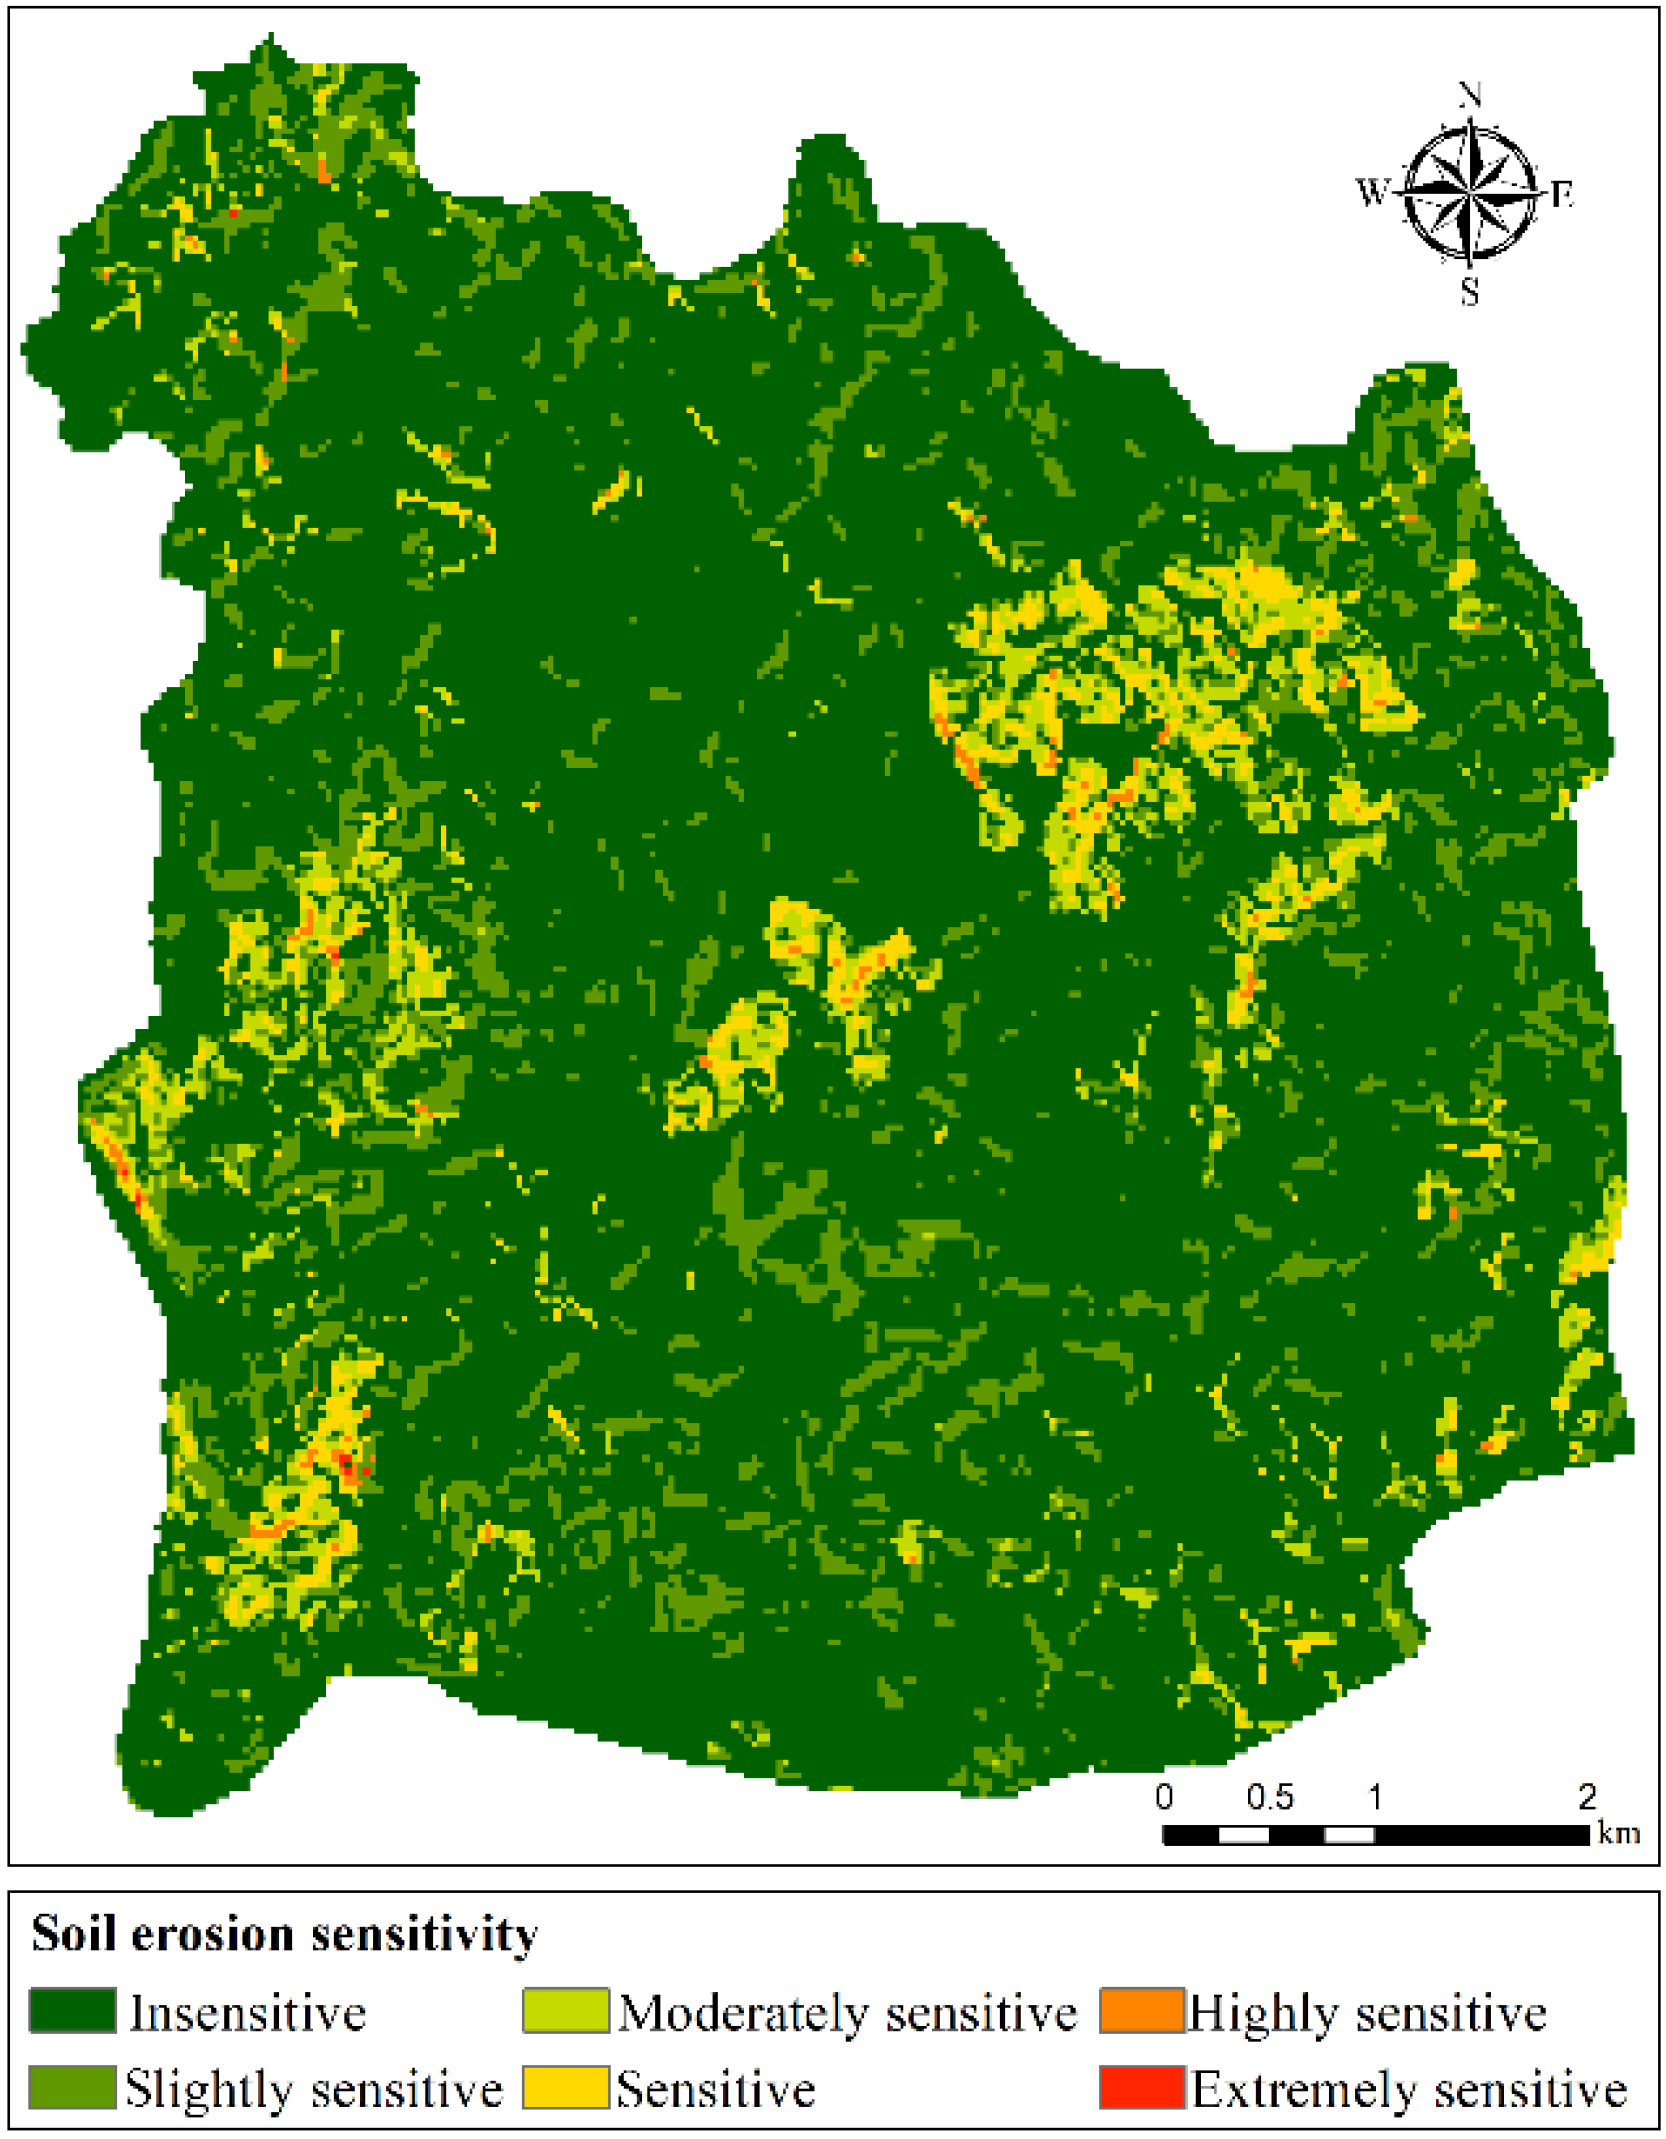
3.1. Soil Erosion Sensitivity
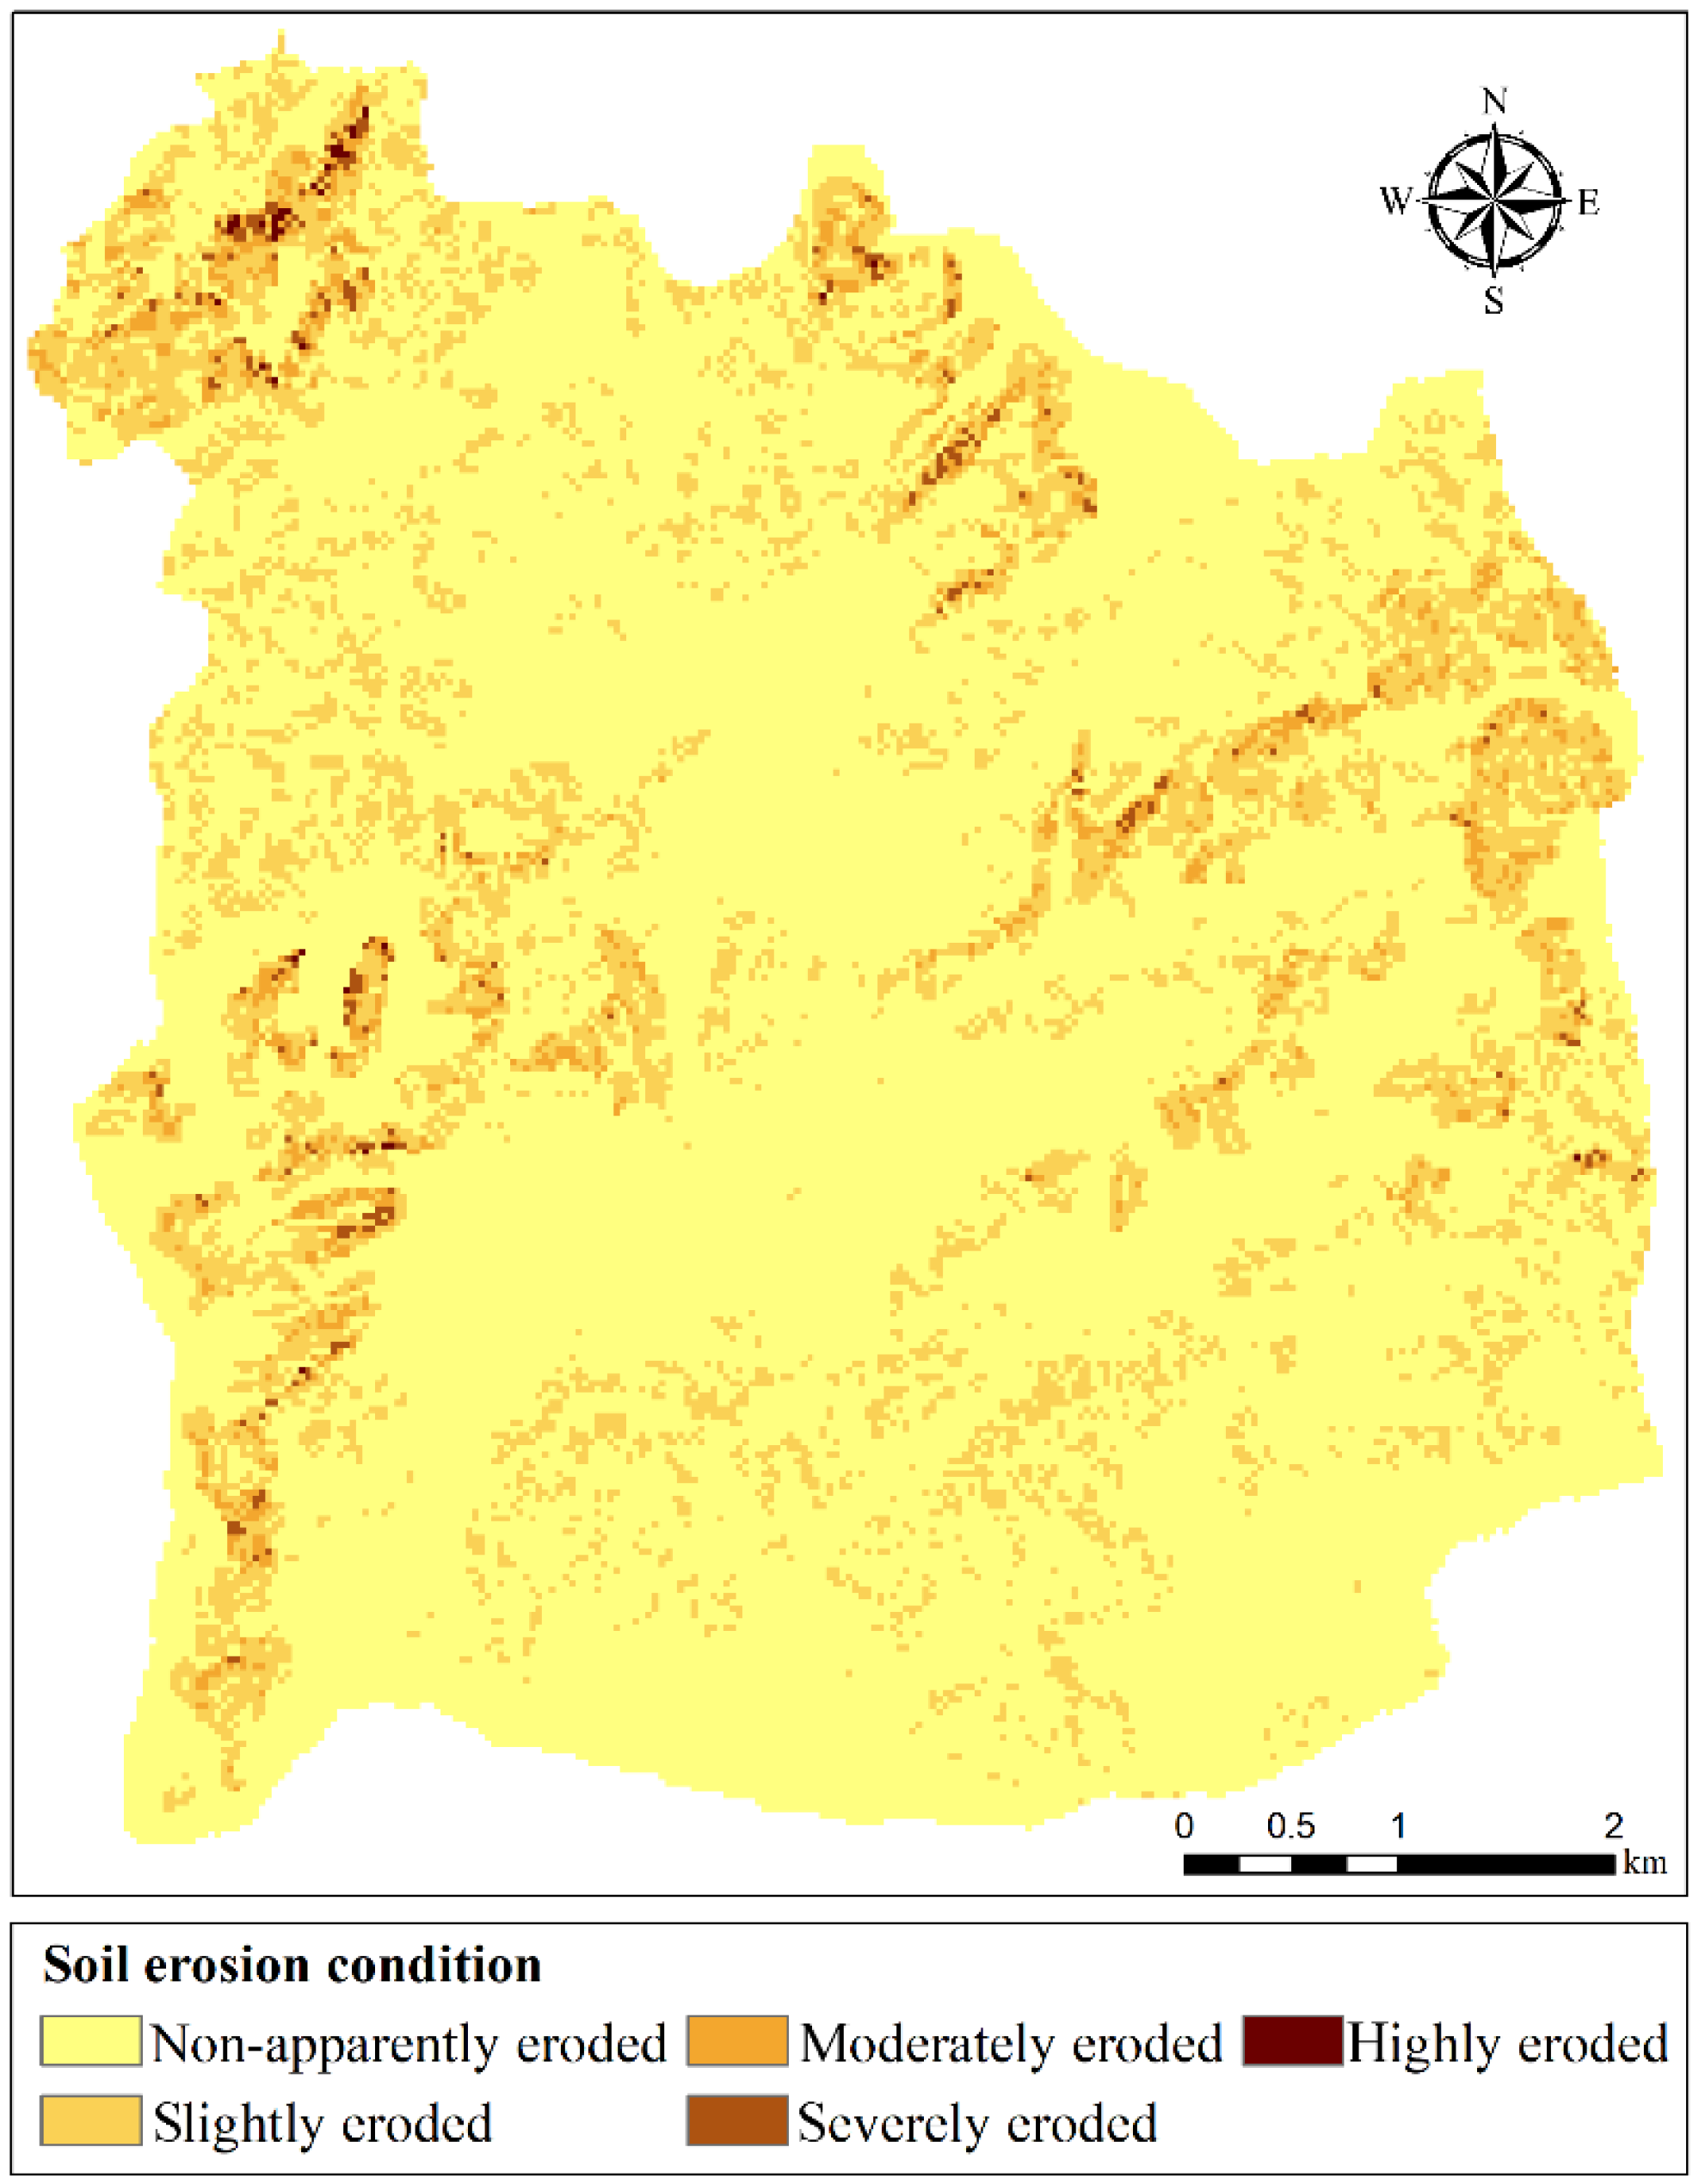
3.2. Soil Erosion Condition
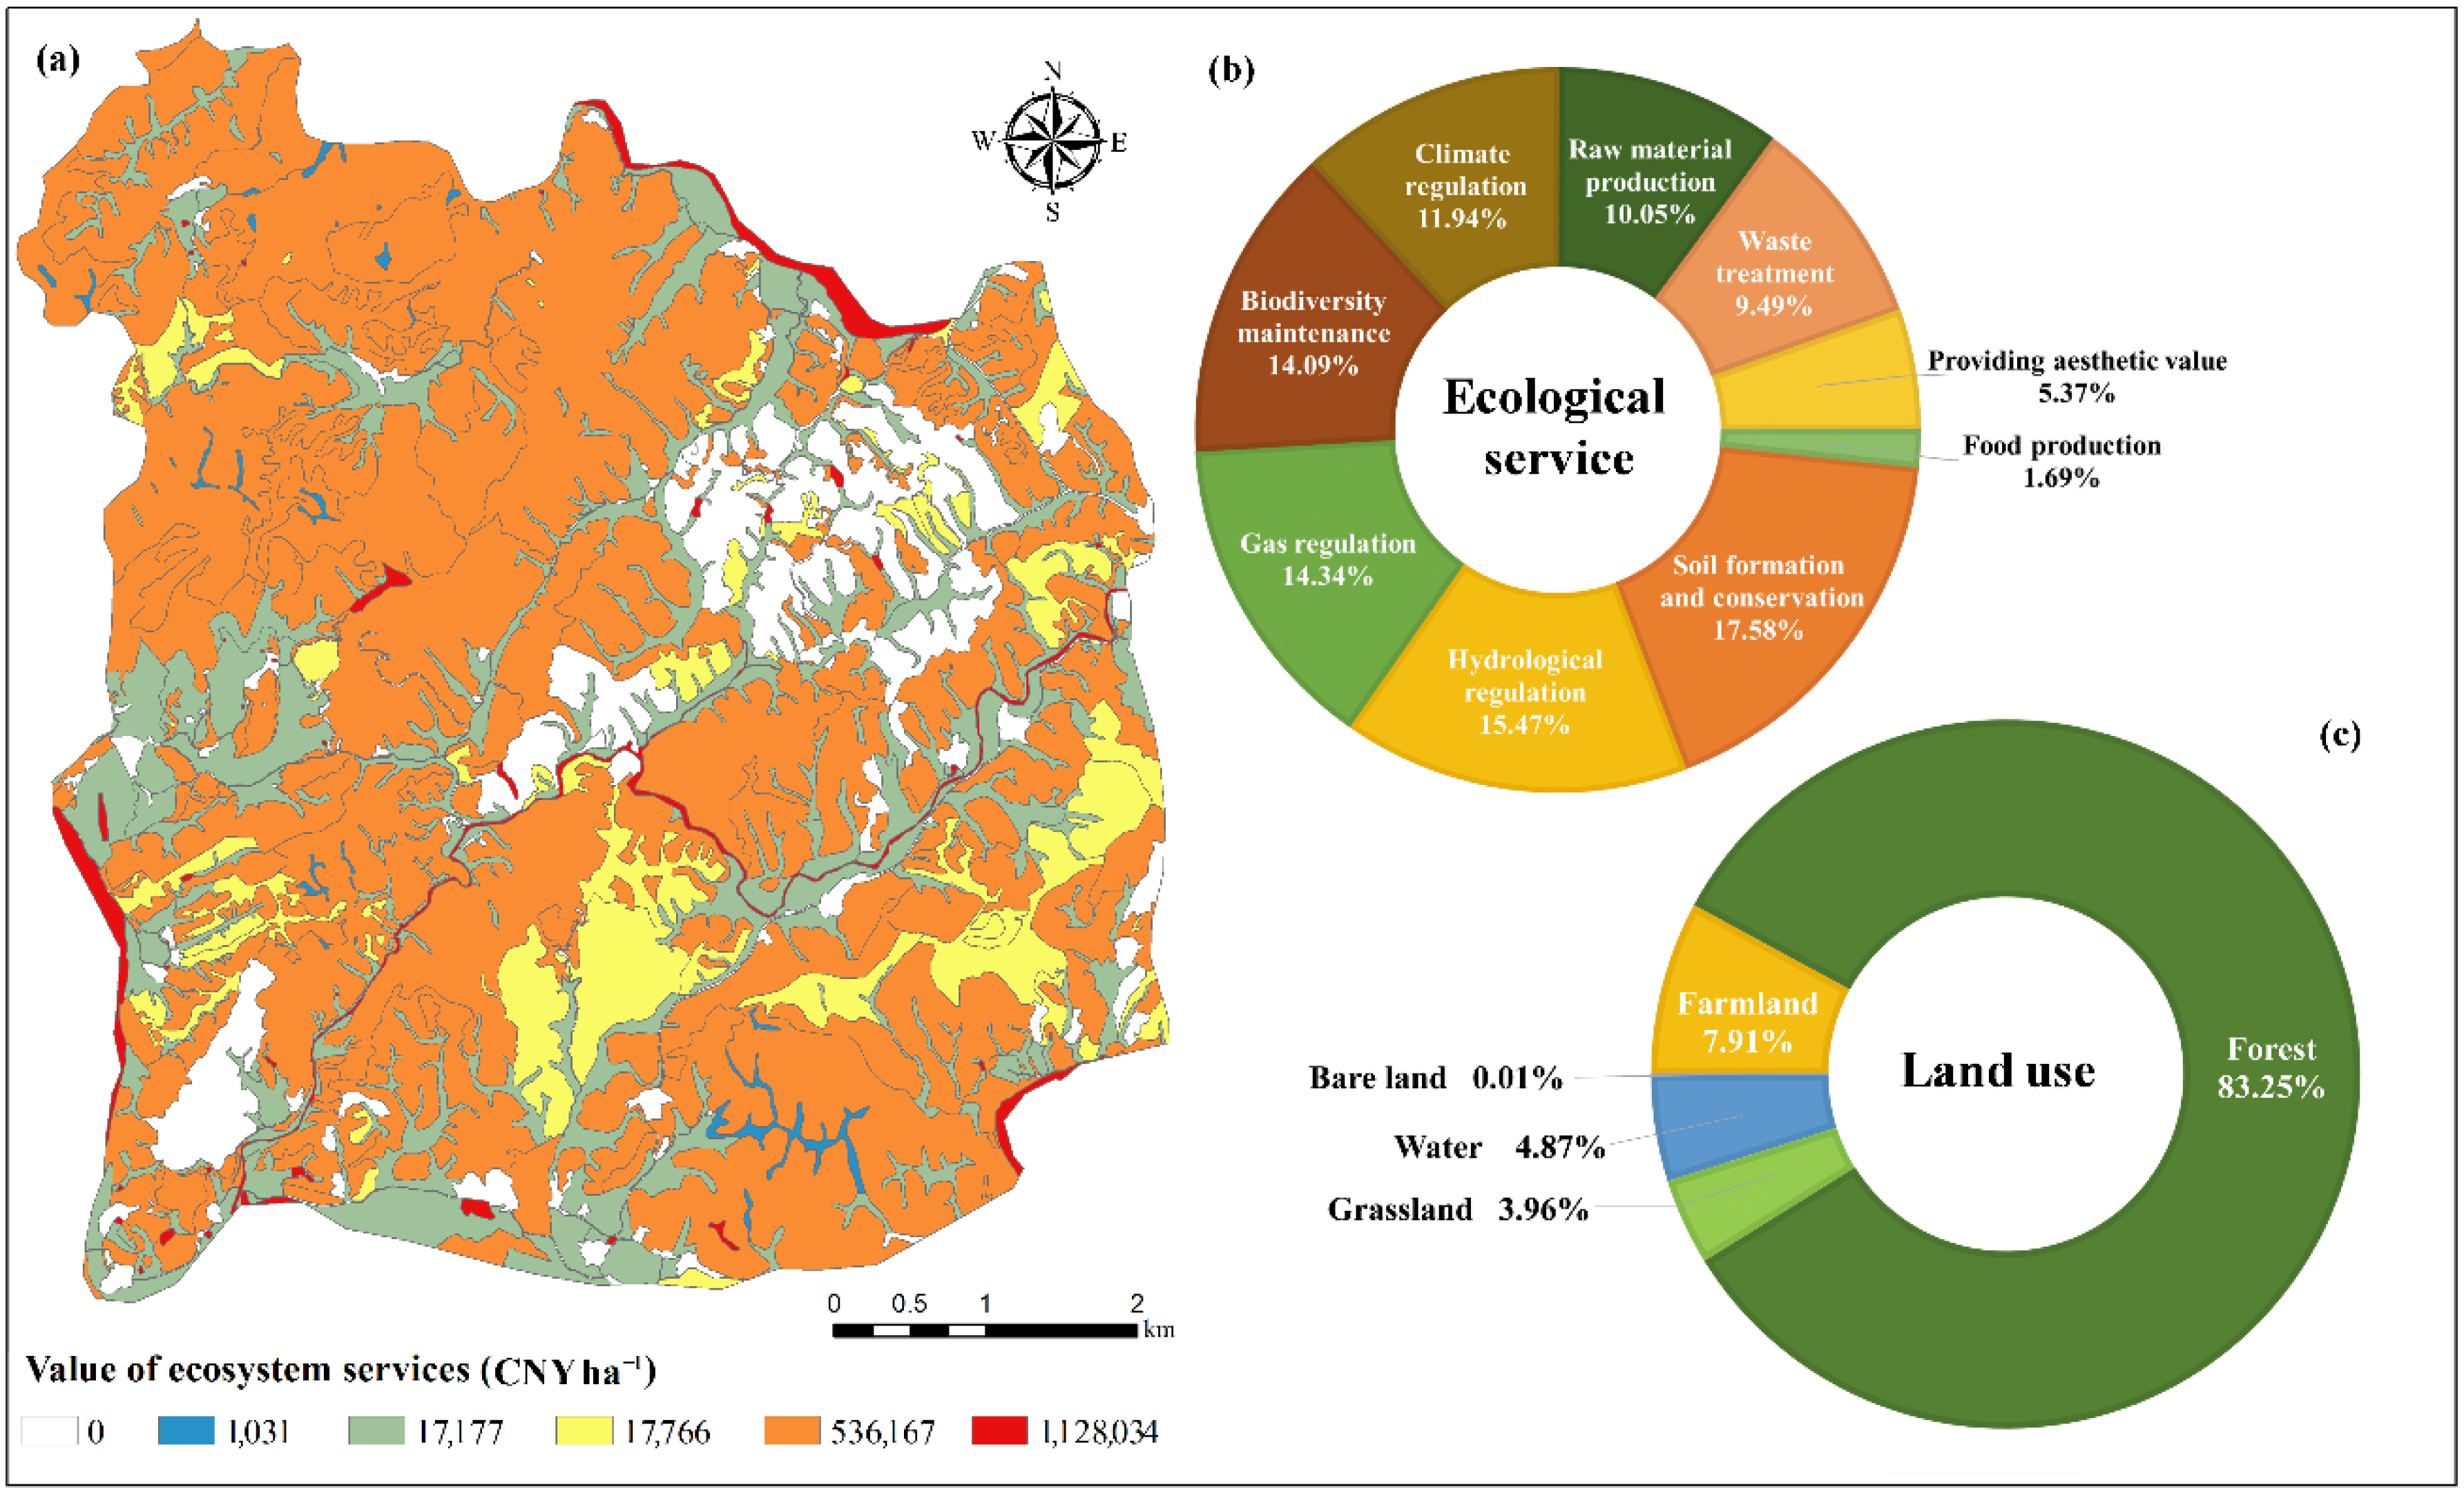
3.3. Value of Ecosystem Services
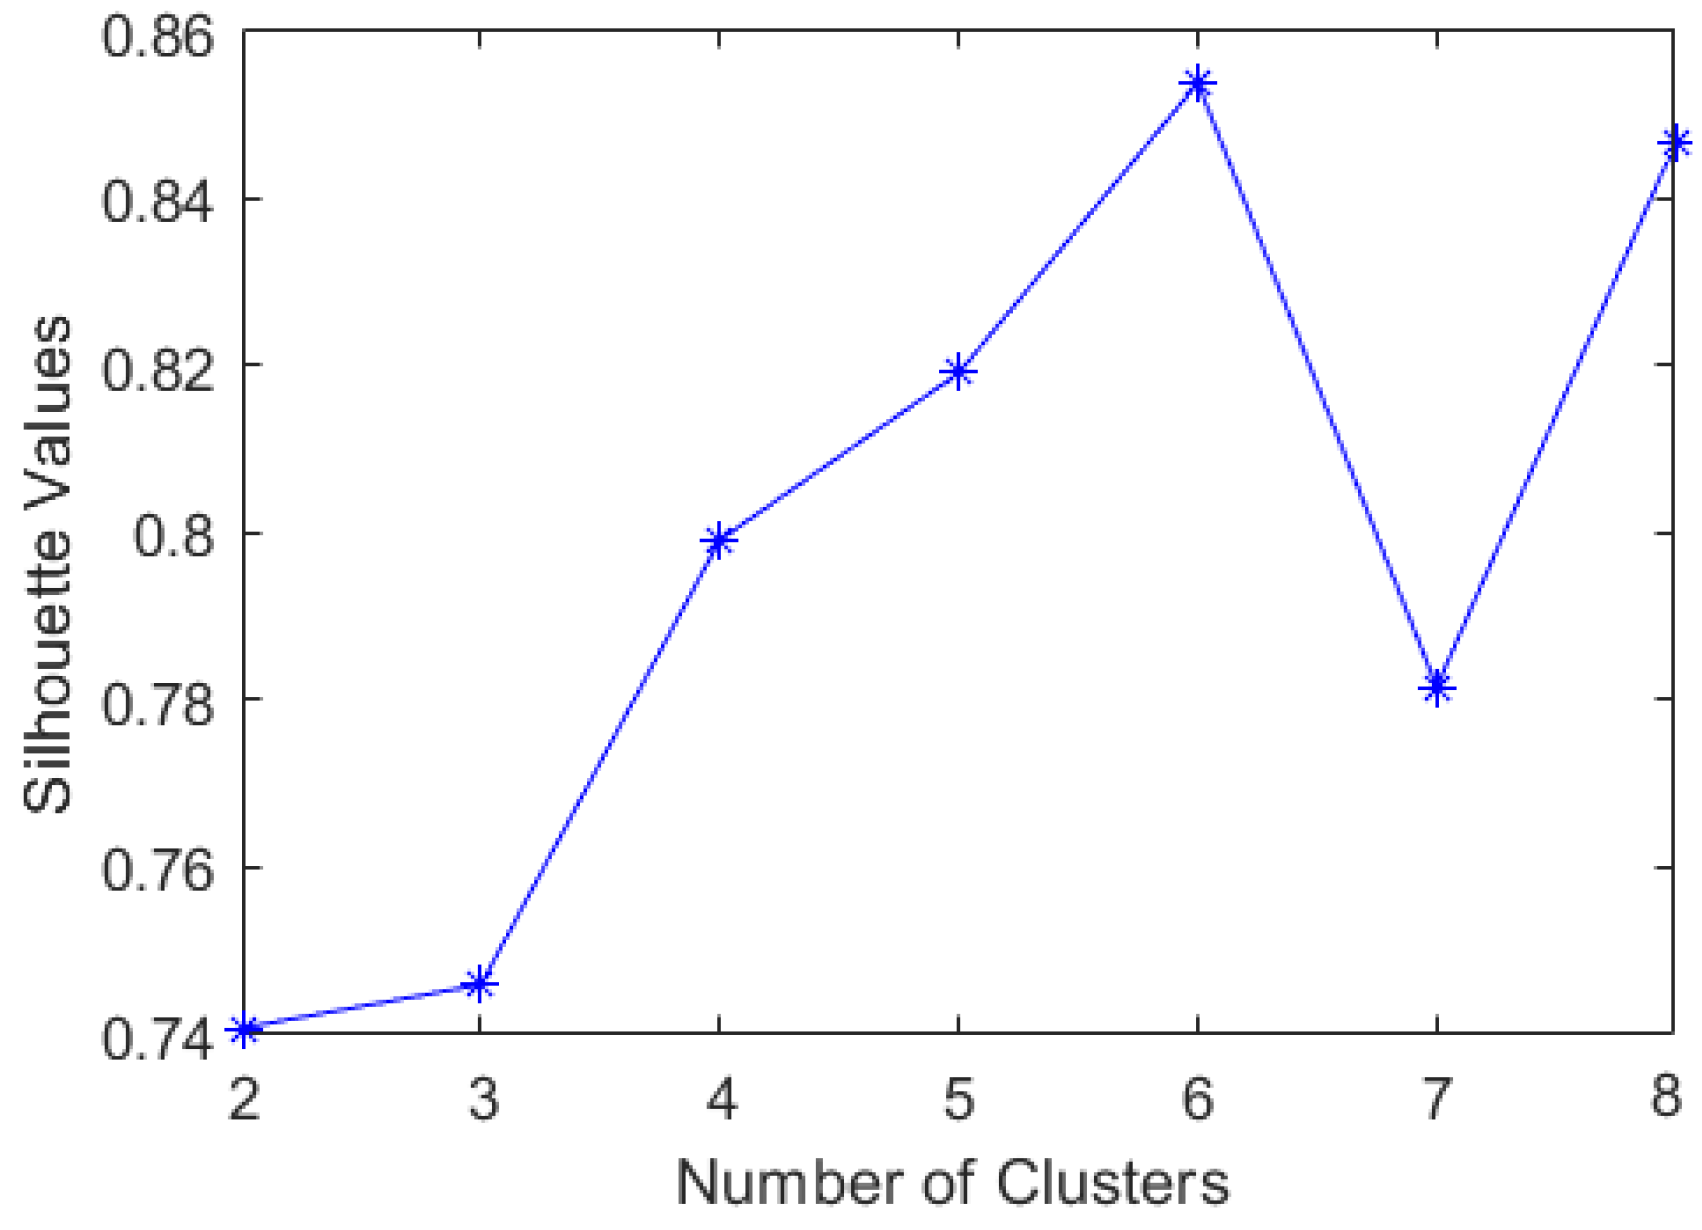
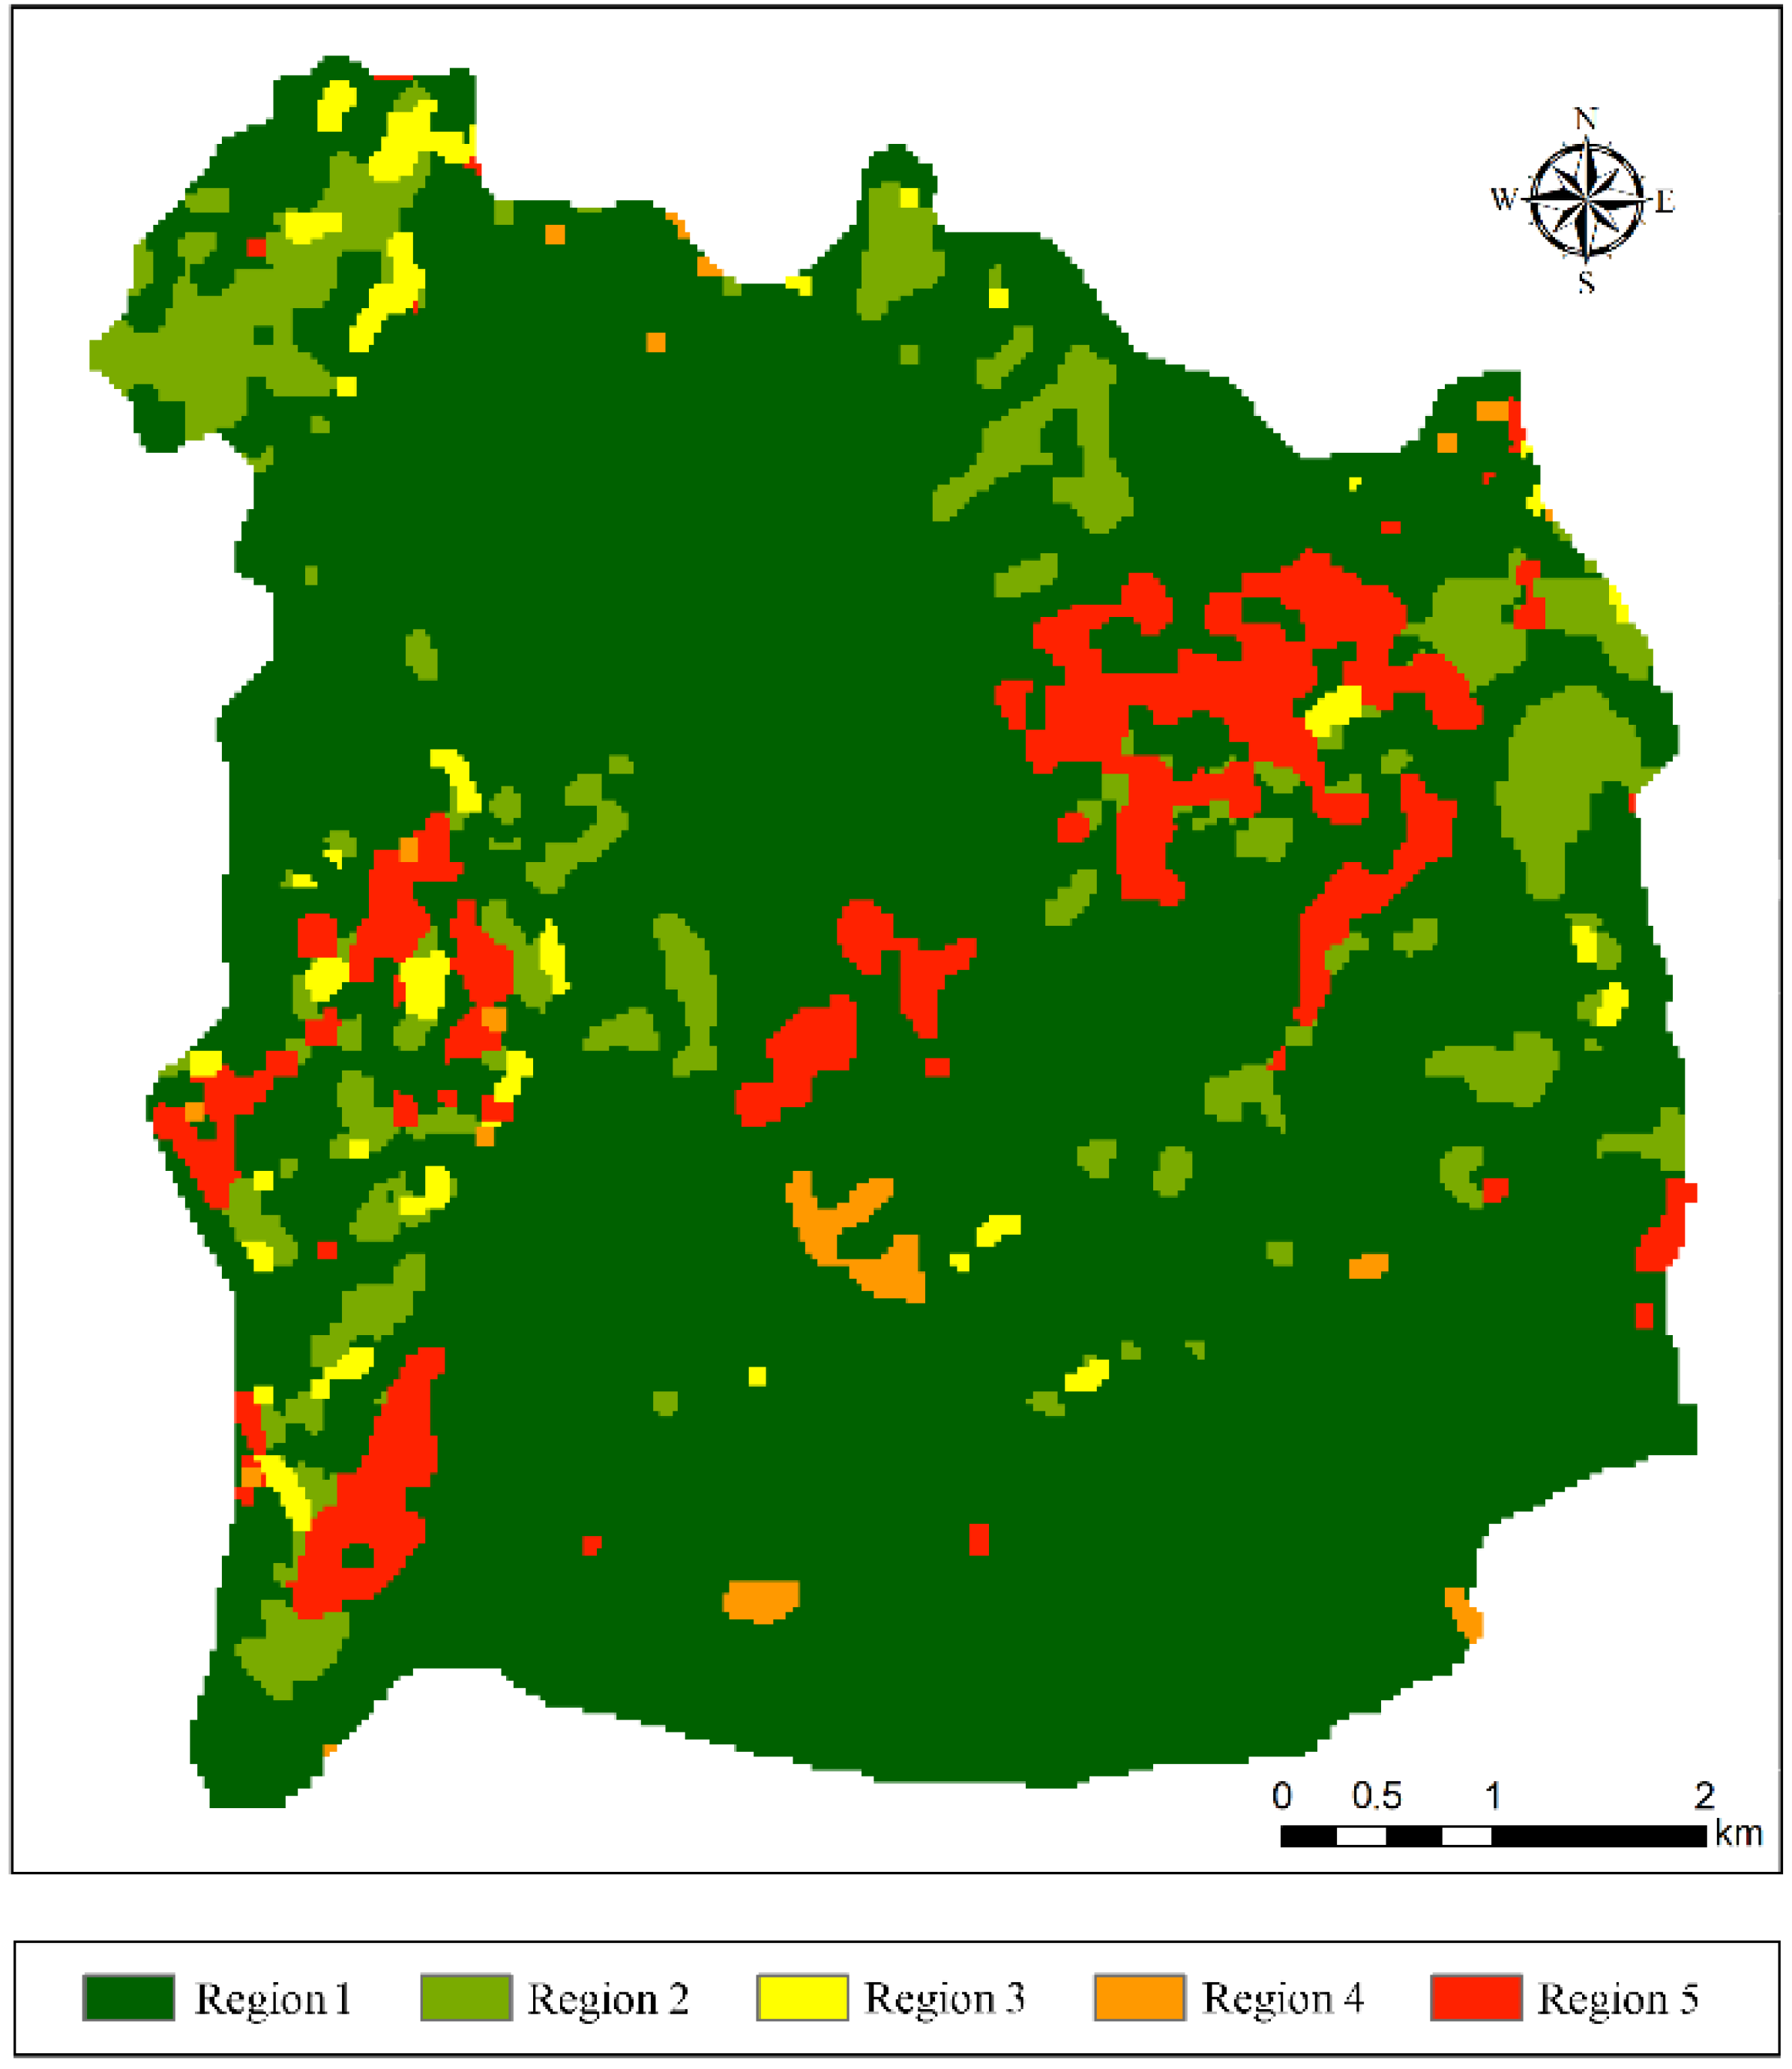
3.4. Soil and Water Conservation Partitioning
4. Discussion
4.1. Selection of the Partitioning Method
4.2. Suggested Mitigation Measures Based on SWCP
5. Conclusions
Author Contributions
Funding
Acknowledgments
Conflicts of Interest
References
- Prosdocimi, M.; Tarolli, P.; Cerdà, A. Mulching practices for reducing soil water erosion: A review. Earth Sci. Rev. 2016, 161, 191–203. [Google Scholar] [CrossRef]
- Amundson, R.; Berhe, A.A.; Hopmans, J.W.; Olson, C.; Sztein, A.E.; Sparks, D.L. Soil science. Soil and human security in the 21st century. Science 2015, 348, 1261071. [Google Scholar] [CrossRef] [Green Version]
- Colman, C.B.; Oliveira, P.T.S.; Almagro, A.; Soares-Filho, B.S.; Rodrigues, D.B.B. Effects of Climate and Land-Cover Changes on Soil Erosion in Brazilian Pantanal. Sustainability 2019, 11, 7053. [Google Scholar] [CrossRef] [Green Version]
- Jia, L.; Zhao, W.; Zhai, R.; Liu, Y.; Kang, M.; Zhang, X. Regional differences in the soil and water conservation efficiency of conservation tillage in China. Catena 2019, 175, 18–26. [Google Scholar] [CrossRef]
- Chen, J.; Xiao, H.; Li, Z.; Liu, C.; Wang, D.; Wang, L.; Tang, C. Threshold effects of vegetation coverage on soil erosion control in small watersheds of the red soil hilly region in China. Ecol. Eng. 2019, 132, 109–114. [Google Scholar] [CrossRef]
- Kessler, C.A. Decisive key-factors influencing farm households’ soil and water conservation investments. Appl. Geogr. 2006, 26, 40–60. [Google Scholar] [CrossRef]
- Zhao, G.; Mu, X.; Wen, Z.; Wang, F.; Gao, P. Soil Erosion, Conservation, and Eco-Environment Changes in the Loess Plateau of China. Land Degrad. Dev. 2013, 499–510. [Google Scholar] [CrossRef]
- Liu, Y.; Li, T.; Zhao, W.; Wang, S.; Fu, B. Landscape functional zoning at a county level based on ecosystem services bundle: Methods comparison and management indication. J. Environ. Manag. 2019, 249, 109315. [Google Scholar] [CrossRef]
- Huang, B. A preliminary draft of comprehensive physical regionalization in China. Acta Geogr. Sin. 1958, 24, 348–364. (In Chinese) [Google Scholar]
- Wang, D.; Li, Z.; Zeng, G.; Nie, X.; Liu, C. Evaluation of Regionalization of Soil and Water Conservation in China. Sustainability 2018, 10, 3320. [Google Scholar] [CrossRef] [Green Version]
- Zhao, Y.; Wang, Z.; Sun, B.; Zhang, C.; Ji, Q.; Feng, L.; Shi, M. A study on scheme of soil and water conservation regionalization in China. J. Geogr. Sci. 2013, 23, 721–734. [Google Scholar] [CrossRef]
- Peng, J.; Ma, J.; Yuan, Y.; Wei, H.; Pang, W. Integrated Urban Land-Use Zoning and Associated Spatial Development: Case Study in Shenzhen, China. J. Urban Plan. Dev. 2015, 141. [Google Scholar] [CrossRef]
- Liu, Y.; Guo, S. Present status and characteristics of soil and water conservation of the small watershed management in China. Soil Water Conserv. China 1988, 11, 22–25. (In Chinese) [Google Scholar] [CrossRef]
- Zhang, H.; Zhang, C.; Zhao, Y.; Chang, D.; Cheng, J. Issues and countermeasures in the comprehensive management of small watershed in China. Sci. Soil Water Conserv. 2016, 14, 131–137. (In Chinese) [Google Scholar] [CrossRef]
- Yan, Z. Study on Soil and Water Consrvation Regionalization and Function Orientation. Ph.D. Thesis, Beijing Forestry University, Beijing, China, 2013. (In Chinese). [Google Scholar]
- Lan, W. Function and Value of Soil and Water Conservation Ecololgical Services. Ph.D. Thesis, Beijing Forestry university, Beijing, China, 2007. (In Chinese). [Google Scholar]
- Zheng, H.; Li, Y.; Robinson, B.E.; Liu, G.; Ma, D.; Wang, F.; Lu, F.; Ouyang, Z.; Daily, G.C. Using ecosystem service trade-offs to inform water conservation policies and management practices. Front. Ecol. Environ. 2016, 14, 527–532. [Google Scholar] [CrossRef]
- Zhang, J.; Li, X.; Buyantuev, A.; Bao, T.; Zhang, X. How Do Trade-Offs and Synergies between Ecosystem Services Change in the Long Period? The Case Study of Uxin, Inner Mongolia, China. Sustainability 2019, 11, 6041. [Google Scholar] [CrossRef] [Green Version]
- Carpenter, S.R.; Mooney, H.A.; Agard, J.; Capistrano, D.; DeFries, R.S.; Díaz, S.; Dietz, T.; Duraiappah, A.K.; Oteng-Yeboah, A.; Pereira, H.M. Science for managing ecosystem services: Beyond the Millennium Ecosystem Assessment. Proc. Natl. Acad. Sci. USA 2009, 106, 1305–1312. [Google Scholar] [CrossRef] [Green Version]
- Feng, X.; Fu, B.; Piao, S.; Wang, S.; Ciais, P.; Zeng, Z.; Lü, Y.; Zeng, Y.; Li, Y.; Jiang, X.; et al. Revegetation in China’s Loess Plateau is approaching sustainable water resource limits. Nat. Clim. Chang. 2016, 6, 1019–1022. [Google Scholar] [CrossRef]
- Chen, L.; Wei, W.; Fu, B.; Lü, Y. Soil and water conservation on the Loess Plateau in China: Review and perspective. Prog. Phys. Geogr. Earth Environ. 2016, 31, 389–403. [Google Scholar] [CrossRef]
- Rawat, W.; Wang, Z. Deep Convolutional Neural Networks for Image Classification: A Comprehensive Review. Neural Comput. 2017, 29, 2352–2449. [Google Scholar] [CrossRef]
- Mannan, A.; Chaudhary, S.; Dhanya, C.T.; Swamy, A.K. Regionalization of rainfall characteristics in India incorporating climatic variables and using self-organizing maps. ISH J. Hydraul. Eng. 2017, 24, 147–156. [Google Scholar] [CrossRef]
- Wang, S.; Xu, X.; Tang, Q.; Liu, M.; Yu, J. A Study on Eco-Hydrology Regionalization and Its Application. In Proceedings of the 2010 4th International Conference on Bioinformatics and Biomedical Engineering, Chengdu, China, 18–20 June 2010; pp. 1–6. [Google Scholar]
- Hughey, K.F.; Cullen, R.; Kerr, G.N.; Cook, A.J. Application of the pressure-state-response framework to perceptions reporting of the state of the New Zealand environment. J. Environ. Manag. 2004, 70, 85–93. [Google Scholar] [CrossRef] [PubMed] [Green Version]
- McGeoch, M.A.; Butchart, S.H.M.; Spear, D.; Marais, E.; Kleynhans, E.J.; Symes, A.; Chanson, J.; Hoffmann, M. Global indicators of biological invasion: Species numbers, biodiversity impact and policy responses. Divers. Distrib. 2010, 16, 95–108. [Google Scholar] [CrossRef]
- Li, Y.; Sun, M.; Yuan, G.; Zhou, Q.; Liu, J. Study on Development Sustainability of Atmospheric Environment in Northeast China by Rough Set and Entropy Weight Method. Sustainability 2019, 11, 3793. [Google Scholar] [CrossRef] [Green Version]
- Peng, J.; Wu, W.H.; Liu, Y.X.; Hu, Y. Soil conservation service zoning in the Inner Mongolia Autonomous Region based on PSR framework. Acta Ecol. Sin. 2017, 37, 3849–3861. (In Chinese) [Google Scholar] [CrossRef] [Green Version]
- Sun, X.; Zhou, Z.; Chen, Q.; Chen, J.; Zhang, S. Sensitivity Evaluation and the Spatial Distribution of Soil Erosion Key Ecological Function Areas: A Case of Leishan City of Guizhou. J. Soil Water Conserv. 2016, 30, 73–78. (In Chinese) [Google Scholar] [CrossRef]
- Wischmeier, W.H.; Smith, D.D. Predicting Rainfall Erosion Losses: A Guide to Conservation Planning (No. 537); Department of Agriculture, Science and Education Administration: Beltsville, MD, USA, 1978. [Google Scholar]
- Williams, J.R.; Renard, K.G.; Dyke, P.T. EPIC: A new method for assessing erosion’s effect on soil productivity. J. Soil Water Conserv. 1983, 38, 381–383. [Google Scholar]
- Huang, Y. Study on Soil Erosion and Scenario Analysis of Soil and Water Conservation Based on CSLE Model: A Case Study on the Small Watershed of Xiejia in Ninghua County. Master’s Thesis, Fujian Normal University, Fujian, China, 2017. (In Chinese). [Google Scholar]
- Wang, K.; Xia, Y.; Ma, J.; Qu, C. Quantitative Assessment of Soil Erosion in Gushanchuan Watershed Based on CSLE and High-Resolution Aerial Images. Res. Soil Water Conserv. 2015, 22, 26–32. (In Chinese) [Google Scholar]
- Guo, Q.; Liu, B.; Zhu, S.; Wang, G.; Liu, Y.; Wang, A. Main factors of soil and water conservation tillage measures in China. Soil Water Conserv. China 2013, 22–26. (In Chinese) [Google Scholar] [CrossRef]
- Xie, G.D.; Zhang, C.X.; Zhen, L.; Zhang, L.M. Dynamic changes in the value of China’s ecosystem services. Ecosyst. Serv. 2017, 26, 146–154. [Google Scholar] [CrossRef]
- Xie, G.; Zhen, L.; Lu, C.; Xiao, Y.; Li, W. Applying Value Transfer Medthod for Eco-Service Valuation in China. J. Resour. Ecol. 2010, 1, 51–59. [Google Scholar] [CrossRef]
- Xie, G.; Zhang, C.; Zhang, L.; Chen, W.; LI, S. Improvement of the Evaluation Method for Ecosystem Service Value Based on Per Unit Area. J. Nat. Resour. 2015, 30, 1243–1254. (In Chinese) [Google Scholar] [CrossRef]
- Rousseeuw, P.J. Sillhouettes a graphical aid to the interpretation and validation of cluster analysis. J. Comput. Appl. Math. 1987, 20, 53–65. [Google Scholar] [CrossRef] [Green Version]
- Costanza, R.; d’Arge, R.; de Groot, R.; Farber, S.; Grasso, M.; Hannon, B.; Limburg, K.; Naeem, S.; O’neill, R.V.; Paruelo, J. The value of the world’s ecosystem services and natural capital. Nature 1997, 387, 253. [Google Scholar] [CrossRef]
- Duque, J.C.; Ramos, R.; Suriñach, J. Supervised Regionalization Methods: A Survey. Int. Reg. Sci. Rev. 2016, 30, 195–220. [Google Scholar] [CrossRef] [Green Version]
- Praskievicz, S.; Luo, C. Unsupervised hydrologic classification of rivers: Watershed controls on natural and anthropogenic flow regimes, Alabama, USA. Hydrol. Process. 2019, 33, 1231–1244. [Google Scholar] [CrossRef]
- Nomenclature of Territorial Units for Statistics—NUTS: Statistical Regions of Europe. Available online: https://ec.europa.eu/eurostat/documents/3859598/5883677/KS-BD-04-005-1-EN.PDF/58c27a2d-f60c-4475-9d31-f4dcbf95d6b6?version=1.0 (accessed on 10 January 2020).
- Palmer-Jones, R. Agricultural growth, poverty reduction and agro-ecological zones in India: An ecological fallacy? Food Policy 2003, 28, 423–431. [Google Scholar] [CrossRef]
- Pagliero, L.; Bouraoui, F.; Diels, J.; Willems, P.; McIntyre, N. Investigating regionalization techniques for large-scale hydrological modelling. J. Hydrol. 2019, 570, 220–235. [Google Scholar] [CrossRef]
- Wang, H.; Zhao, Y. Discuss on several problems of the division standard of key prevention and control region for soil and water loss. Soil Water Conserv. China 2015, 61–63. (In Chinese) [Google Scholar] [CrossRef]
- Niesterowicz, J.; Stepinski, T.F.; Jasiewicz, J. Unsupervised regionalization of the United States into landscape pattern types. Int. J. Geogr. Inf. Sci. 2016, 30, 1450–1468. [Google Scholar] [CrossRef]
- Liu, Y. Analysis of Comprehensive Management of Small Watershed. Master’s Thesis, Xihua University, Chengdu, China, 2014. (In Chinese). [Google Scholar]
- Morgan, R.P.C. Soil Erosion and Conservation; Blackwell Publishing Company: Oxford, UK, 2006. [Google Scholar]
- Wang, B.; Wang, Y. Relationships between the characteristics of soil and understory in a Pinus massoniana forest in southern China. Catena 2019, 176, 352–361. [Google Scholar] [CrossRef]


| Dimension | Factor | Indicator |
|---|---|---|
| Pressure | Soil erosion sensitivity | Slope |
| Land use | ||
| Vegetation fractional coverage | ||
| Status | Soil erosion condition | Soil erosion intensity |
| Response | Ecosystem services | Value of ecosystem services |
| Land Use | Slope (°) | ||||||
|---|---|---|---|---|---|---|---|
| 0–5 | 5–8 | 8–15 | 15–25 | 25–35 | >35 | ||
| Percentage of forestry and grass coverage in non-cultivated land (%) | 75–100 | i | i | i | i | i | i |
| 60–75 | i | i | i | i | ii | ii | |
| 45–60 | i | i | i | ii | ii | iii | |
| 30–45 | i | i | ii | ii | iii | vi | |
| 0–30 | i | ii | ii | iii | vi | v | |
| Cultivated slope land | Paddy field | i | i | i | i | i | i |
| Dry field | i | ii | iii | vi | v | vi | |
| Other types of land use | Water area | i | i | i | i | i | i |
| Construction land | i | i | i | i | i | i | |
| Mining land | i | ii | iii | vi | v | vi | |
| Bare land | i | i | ii | iii | vi | v | |
| Factor | Formula | Formula Description | Data Source |
|---|---|---|---|
| Rainfall erosivity factor (R) [30] | Pi is the precipitation per month (mm). | National Meteorological Information Center (http://data.cma.cn). | |
| Soil erodibility factor (K) [31] | SAN, SIL, CLA, and Ct represent the mass fraction of sand grains (0.05–0.25 mm), silt grains (0.002–0.05 mm), clay grains (<0.002 mm), and organic matter, respectively. SN1 = 1 − SAN/100. | Soil Science Database of China (http://vdb3.soil.csdb.cn/). | |
| Topographical factor (LS) [30] | θ is the slope value (°), λ is the slope length (m). | Geospatial Data Cloud (http://www.gscloud.cn/). | |
| Soil and water conservation factor (BET) | The soil and water conservation factors were qualitatively estimated depending on the different land-use types based on the reference value proposed by previous research and the first-ever nationwide water resources survey; it was modified according to vegetation coverage and the data of field investigation units. | The result of biomass-control in water and soil conservation factor is taken from Huang [32]. The result of engineering-control in water and soil conservation factor is taken from Wang et al. [33]. The result of tillage practices in water and soil conservation factor is taken from Guo et al. [34]. | MODIS (http://modis.gsfc.nasa.gov/), Remote Sensing Cloud Mart (http://www.rscloudmart.com/). |
© 2020 by the authors. Licensee MDPI, Basel, Switzerland. This article is an open access article distributed under the terms and conditions of the Creative Commons Attribution (CC BY) license (http://creativecommons.org/licenses/by/4.0/).
Share and Cite
Wang, L.; Li, Z.; Wang, D.; Hu, X.; Ning, K. Self-Organizing Map Network-Based Soil and Water Conservation Partitioning for Small Watersheds: Case Study Conducted in Xiaoyang Watershed, China. Sustainability 2020, 12, 2126. https://doi.org/10.3390/su12052126
Wang L, Li Z, Wang D, Hu X, Ning K. Self-Organizing Map Network-Based Soil and Water Conservation Partitioning for Small Watersheds: Case Study Conducted in Xiaoyang Watershed, China. Sustainability. 2020; 12(5):2126. https://doi.org/10.3390/su12052126
Chicago/Turabian StyleWang, Lingxia, Zhongwu Li, Danyang Wang, Xiaoqian Hu, and Ke Ning. 2020. "Self-Organizing Map Network-Based Soil and Water Conservation Partitioning for Small Watersheds: Case Study Conducted in Xiaoyang Watershed, China" Sustainability 12, no. 5: 2126. https://doi.org/10.3390/su12052126