Exploring Food Security and Household Dietary Diversity in the Eastern Cape Province, South Africa


1
Department of Agricultural Economics and Extension, University of Fort Hare, Alice 5700, South Africa
2
School of Economic and Decision Sciences, North West University, Mafikeng 2790, South Africa
*
Author to whom correspondence should be addressed.
Sustainability 2020, 12(5), 1851; https://doi.org/10.3390/su12051851
Submission received: 23 July 2019
/
Revised: 20 August 2019
/
Accepted: 21 August 2019
/
Published: 1 March 2020
(This article belongs to the Special Issue Systems Approaches to Complex and Sustainable Food Systems)
Abstract
:Food security is one of the most severe challenges facing the majority of African countries. The objective of this study was to explore household food dietary diversity and food security in a rural area in the Eastern Cape Province, South Africa. A total of 296 household heads were randomly sampled to participate in the study. The Household Dietary Diversity Score (HDDS) and Household Food Consumption Score (HFCS) were used to identify the consumption patterns of the households and their food security status. Meanwhile, a binary model was used to identify the variables that had an impact on household food security. Findings from the Household Dietary Diversity Score (HDDS) revealed that 61 percent of the households had lower dietary diversity and were consuming at least three food groups, which mainly include pulses, milk, and cereals. The results from the Household Food Consumption Score (HFCS), however, showed that the majority of the households had adequate levels of food consumption. The binary model revealed that age, household income, access to credit, and gender are statistically significant in influencing household food security status in the study area. It can be concluded that household dietary diversity is not guaranteed by food security, as proven by the regression model. Therefore, the government should consider the impact of low income on food security and it should intensify efforts directed at helping rural households to reduce incidences of food insecurity.
JEL Classifications:
Q1; Q2; Q4; Q51. Introduction
There is an urgent need to address the issue of under-nourished people who are mainly living in rural areas. The World Summit on Food Security in 2009 defined food security as a situation where all people, at all times, have social, physical, and economic access to nutritious and safe food to meet their dietary needs for an active, healthy life. In South Africa, over 13.8 million people are said to have inadequate access to food [1]. Norman, Bradshaw, Steyn, and Gaziano [2] found that, of 18 risk factors for death in South Africa, eight were linked to a lack of critical nutrients. Excess body weight, high cholesterol, being underweight in childhood and maternal age, iron deficiency, vitamin A deficiency, and low fruit intake were identified as the major contributors. In a survey done by Mchiza, Parker, Makoae, Sewpaul, Kupamupindi, and Labadarios [3], it was discovered that, in rural areas in the KwaZulu Natal Province and the Free State Province, there was a large variation in energy and macronutrient intake. The most consumed food groups were maize products, food products containing sugar, beverages, oil, butter, and poultry. These food groups show an unbalanced nutritional intake, especially in rural areas. Yet, there are basic commodities mostly consumed by households falling in the food poverty line. Similarly, Ngema, Sibanda, and Musemwa [4] found evidence that food security was an issue in rural South Africa. It was found that having access to food intervention programs in Maphumulo in KwaZulu Natal does not lead to a high dietary diversity. Meanwhile, Khumalo and Sibanda [5] found that households in eThekwini Municipality were moderately food secure in terms of dietary diversity.
Since achieving democracy, the South African government identified food security as a priority. As a result, it launched the Reconstruction and Development Program (RDP) in 1994. The program was meant to address issues such as poverty, inequality, and economic development in a new democratic South Africa. However, scholars are divided on the impact of the program in terms of meeting its basic socioeconomic objectives such as the provision of basic services and poverty reduction. Inequality measured by a Gini Index has been hovering around 0.60 to 0.65 in the last decade. This is high in comparison with other African countries rated as highly unequal like the Central African Republic (0.54), Botswana (0.58), and Namibia (0.59). In such an unequal state, food security remains a problem for the poor. Numerous reports point out that South Africa is food secure at a national level and produces enough staple foods to meet the basic nutritional need of its population [6]. South Africa committed itself toward addressing food security by 2014. Currently, however, it remains a problem. Aliber and Hart [7] pointed out that South Africa has no specific or accepted food security measures and there are no ways to monitor it. Therefore, this makes it harder for policymakers to address food insecurity. This is made more complex by the fact that policymakers cannot identify interventions appropriate to different scenarios.
Recent studies (Naicker et al. [8], Crush & Caesar [9], and Shisana et al. [10]) show a high prevalence of food insecurity among residents in low-income areas across South Africa. In this study, the focus is on the Oliver Tambo Municipality, which has a high rainfall area in the Eastern Cape Province. The aim is to dismantle household dietary diversity in an area where a number of crops and vegetables are grown. Special focus is given to the impact of income on household dietary and food security. Furthermore, a number of households in the Eastern Cape Province fall in the food poverty line (FPL). This makes the study relevant in identifying the major causes of food insecurity, which is a contributing factor to food poverty.
Empirically, this paper contributes to shed light on possible determinants of food security in poor districts in the rural areas by introducing a previous untested variable, food consumption score. The determinants of food security are estimated using a probit model. There are relatively few studies on food security in rural South Africa, which explicitly focuses on this variable. Numerous studies that have been conducted largely focused on urban areas, with estimates on the farm and demographic variables. A number of South African households rely on the informal food economy for everyday food needs. However, little research has been done in assessing the food security status of the poorest province in South Africa, where there is an informal agricultural economy. Only a few studies (Taruvinga et al. [11]) have been conducted so far to assess the dietary diversity in rural areas in the Eastern Cape Province, where most households depend on government grants for their livelihoods. The available studies on the same topic focus on dry areas, which receive inadequate rainfall (see Taruvinga [11]).
The main aim of this paper is to explore household food dietary diversity and food security in a rural area in South Africa. The emphasis would be to find out how income dynamics drive food security, especially in districts relying on subsistence farming and government grants.
The study would also address the following hypothesis statement:
There is no relationship between food security status and household dietary diversity.
2. Materials and Methods
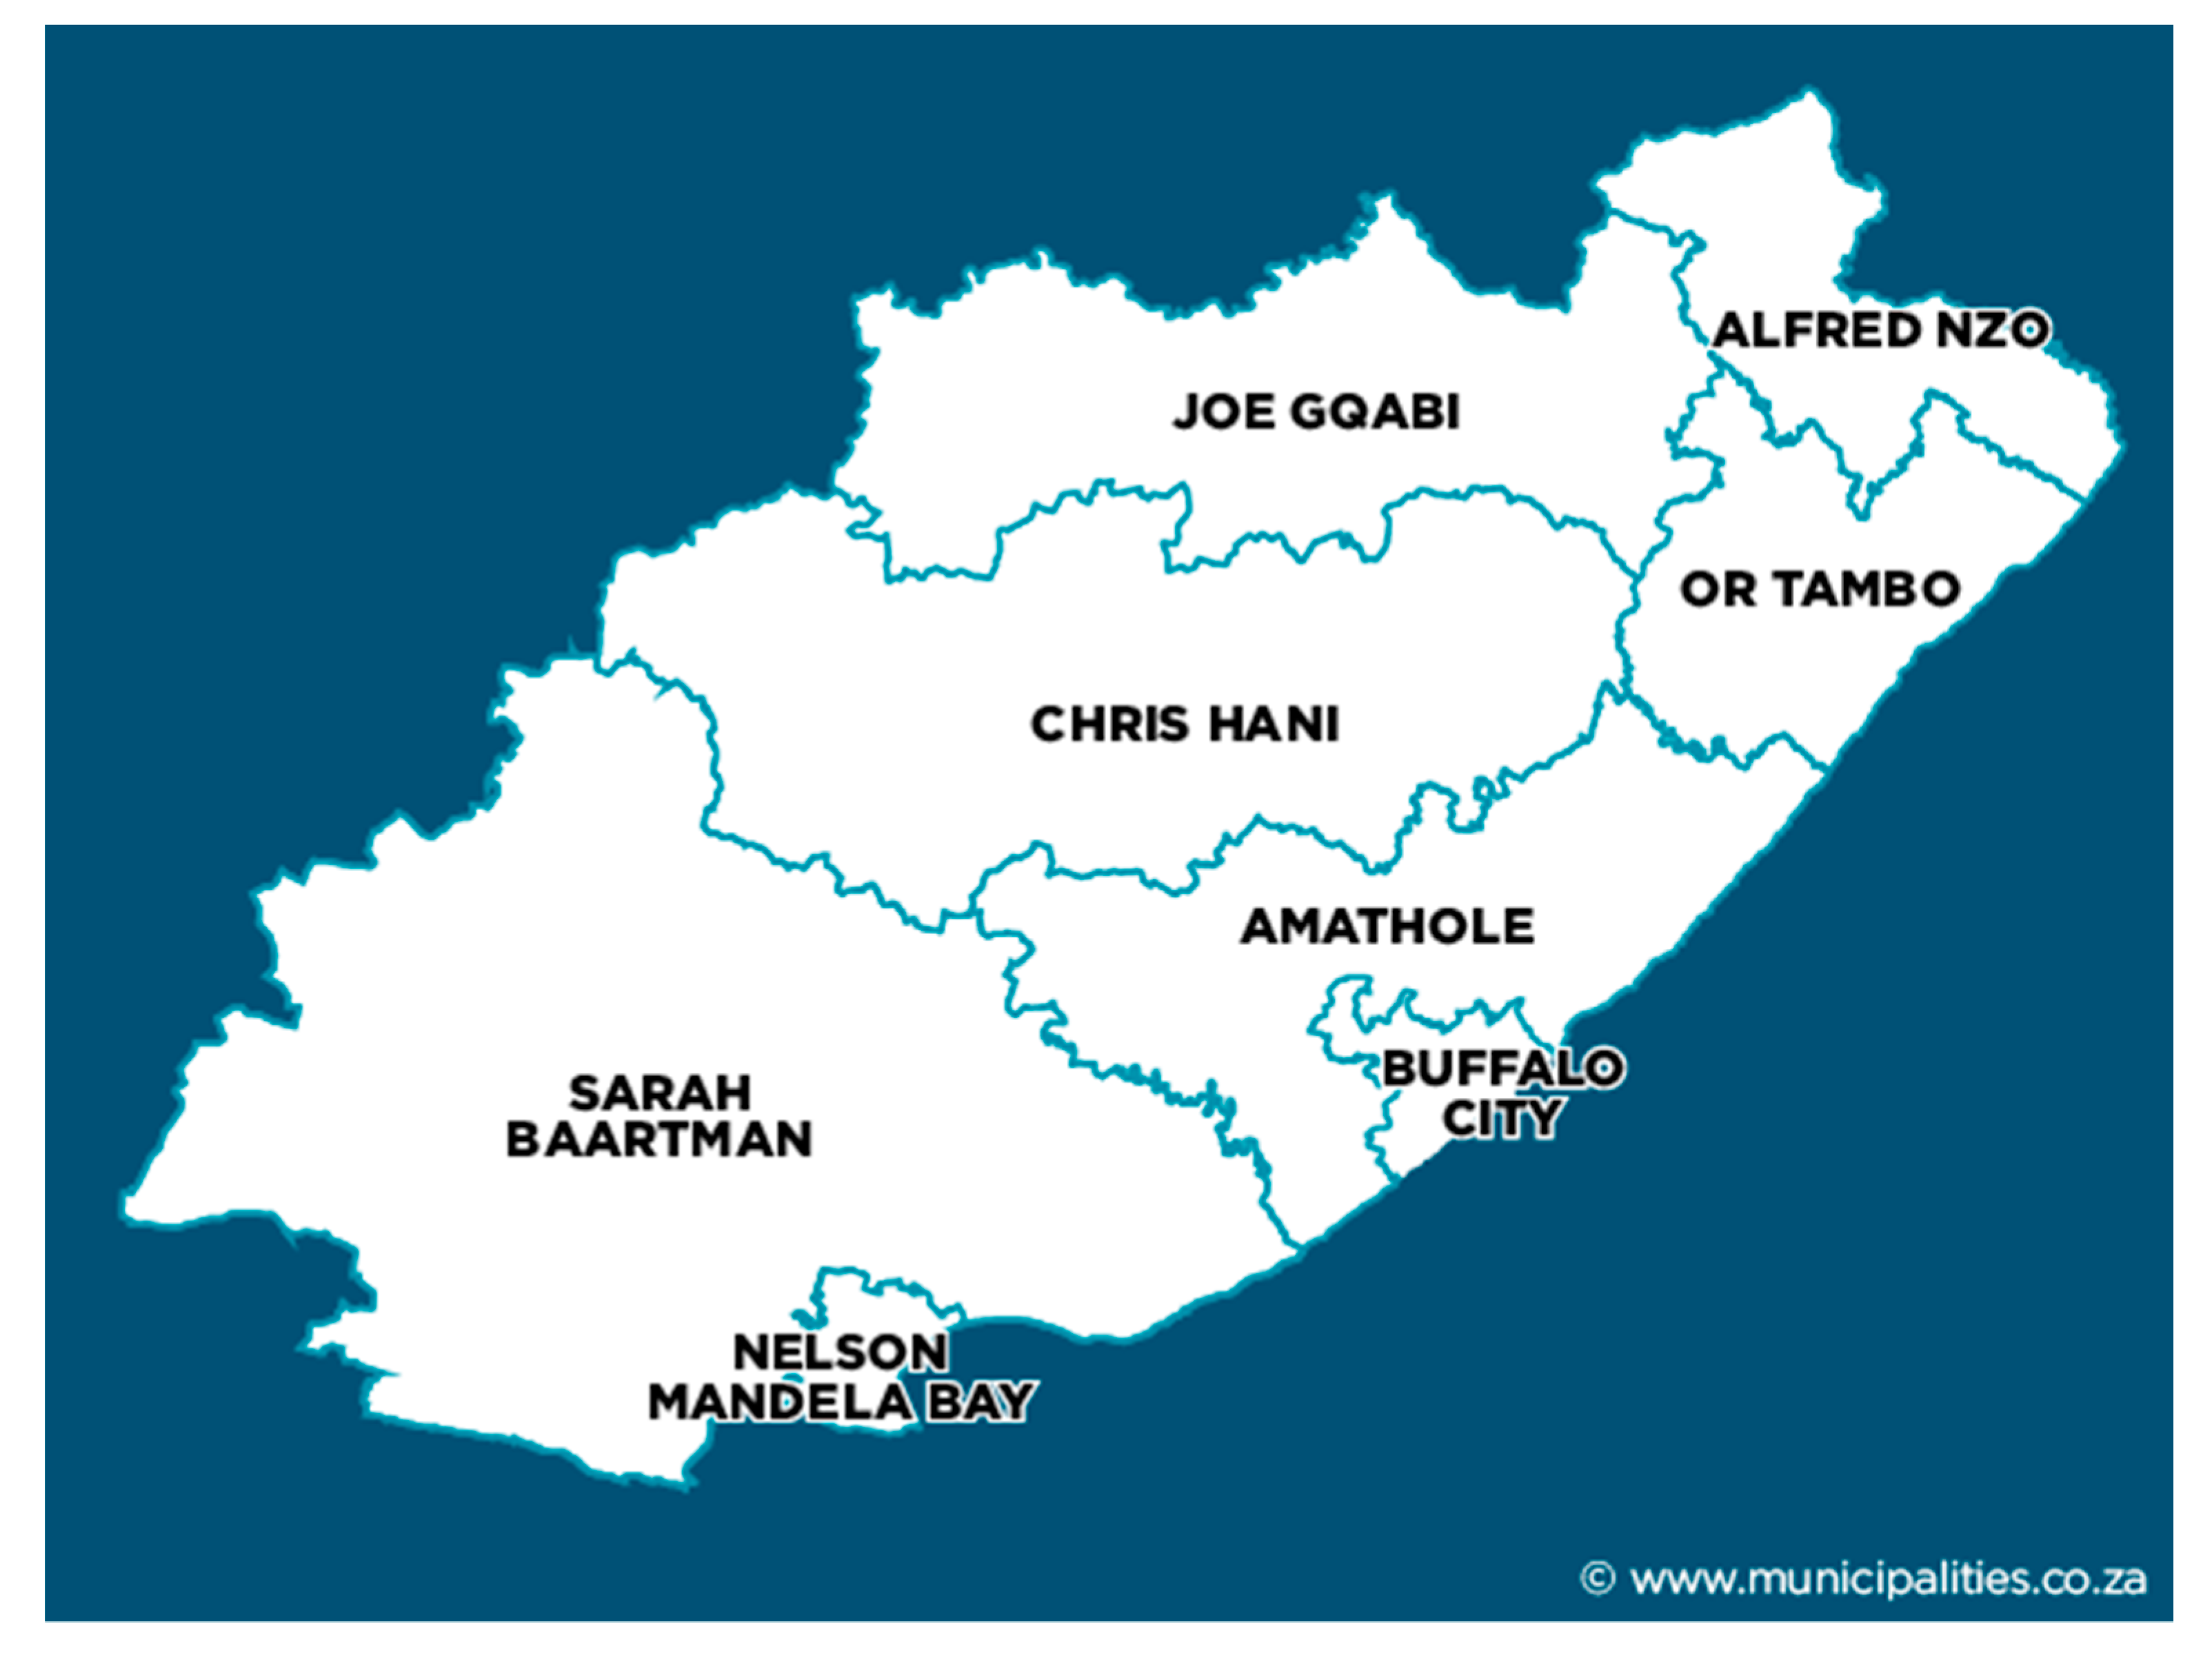
This section provides a description of the study area and the methods of data analysis. This research was done in the Eastern Cape Province of South Africa. The province is shown diagrammatically in Figure 1 with all district municipalities.
2.1. Study Setting
The Eastern Cape Province is the second largest in the country with the third largest population and is one of the two poorest in the country [12]. The unemployment rate is generally high in the whole province, with the manufacturing sector being the dominant employer [12]. The province is divided into six districts and two metropolitan areas, which include the Buffalo City and Nelson Mandela Bay. It has 37 local municipalities, with the majority located in the peri-urban areas.
The O.R Tambo municipality has high rainfall areas with annual rainfall of over 700 mm annually. The municipality is characterized by a range of farming activities from crop production to stock farming. This makes the area ideal for investigating food security. According to the DAFF [8], agriculture is practiced predominately by subsistence farmers residing in rural settlements dominated by communal settlements. Communal grazing and arable land for farming surround the settlements. OR-IDP [12] pointed out that the household income levels are generally low, and the municipality is regarded as the second poorest in the Eastern Cape Province, with more than 88 percent living under the minimum poverty line [1]. In terms of poverty, the municipality has more than 72.2 percent of households living in poverty [13]. At the same time, the Gini coefficient is 0.59, which is slightly lower than the national (0.66). At least 75.1 percent of households depend on government grants, which represent around 20 percent of the Eastern Cape Province income [13]. Thus, this demonstrates that poverty is endemic considering that most households rely on grants, which hardly surpass an equivalent of $200 USD per month. The population density is around 110 people per square kilometre, which is above the national 42.39 persons per square kilometre [13].
2.2. Study Population and Sampling
The study was conducted in 15 villages which fall under rural areas and the population included all the households residing in those villages. A sample size of 320 was targeted, even though only 296 households managed to participate in the study due to circumstances beyond the researcher’s control. All the districts were purposively chosen because of their agricultural potential, geo-climate, and cropping history. This was done specifically to ascertain rich information that would assist the researcher to assess the food security status and dietary diversity in detail. The study employed a cross-sectional design, where data was collected at one point in time. Households were randomly selected to partake in the study. Ethical approval was obtained from the North West University Ethics Committee, and consent was approved by participants who were sampled. A cover letter was distributed and the participants had to voluntary sign it in order to participate in the study.
2.3. Data Collection
Data were collected in 2017 during the months of May and September. A household diversity questionnaire composed of 19 items asked the food eaten or drank during the day and night, and whether it happened at home or outside. This questionnaire was administered to the respondents. The study used a reference period of 3 to 7 days as a benchmark, although the recall period was 24 h, as suggested by Food and Agriculture Organization (FAO) due to a lower recall error. As pointed out by Arimond et al. [14] and Kennedy et al. [15], basing on a 24-h recall period is easier when compared to longer recall periods. In rural areas, it is a common feature for people to consume meals outside the home where sharing is a norm. In terms of consumption patterns, it was necessary to avoid doing the study during holidays because consumption in those periods does not reflect a typical household diet.
Upon finishing the data collection, it was then captured and coded using Microsoft Excel 2016 and later exported to Statistical Package for Social Sciences (SPSS) version 25 (IBM Corporation, Chicago, IL, USA) for analysis. Descriptive statistics was applied on socio-economic characteristics of respondents and a binary regression was done to ascertain the association of variables.
The Household Dietary Diversity Score (HDDS) for each household was calculated by hand and with the help of an Excel Spreadsheet. The HDDS is defined as the number of unique foods consumed by household members over a given period [9]. Scores were summed up by adding the number of food groups consumed by a household or individual respondent over a 24-h recall period [10]. For instance, we assign letters from A to L for each food group (A + B + C + D + E + F + G + H + I + J + K + L). Then we use the average HDDS indicators, as shown in Equation (1).
The dietary diversity score varies across food groups and does not indicate the quantity of food consumed by a household. We then estimate a Household Food Consumption Score (HFCS). According to FANTA [9], the HFCS is a frequency weighted HDDS. Therefore, the HFCS is calculated by using the frequency of consumption of eight food groups consumed, as shown in Equation (2)
FCS = (starches × 2) + (pulses × 3) + vegetables + fruit + (meat × 4) + (dairy × 4) +
(fats × 0.5) + (sugar × 0.5)
(fats × 0.5) + (sugar × 0.5)
In order to get a score, the weighted food groups scores are summed up, and the HFCS variable is recorded from a continuous variable into a categorical variable by using the following threshold: 0–21 (poor), 21.5–35 (borderline) and above 35 (acceptable) [11].
2.4. Binary Logistic Regression Model
A binary logistic model was used to determine the influence of independent variables on dependent variables. Katwijuke [16] noted that it is a statistical tool used to find if the probability of a dichotomous outcome is related to a set of explanatory variables. The model takes the following form.
Prob (Event) = Prob (Y, represents ith household is food secure, and 0 otherwise).
We estimated a binary model and it takes the following specification.
where is the unobservable latent value of a household, and and represent the expected outcomes of food security and non-food security in a certain period. The equation shows that a household would be regarded as food poor when the total income for a month is on the food poverty line or under. The empirical model of household i on period t can be written as follows.
where is the unobservable value of household i in time t, is the observable choice, is the explanatory variables for a household i, is a vector of coefficients for household I, and is a vector of unobservable characteristics related to household i in time t. A number of models can be used to estimate the empirical model. The basic point of departure is to use a probit or logit model to depict the choice of being poor or non-poor. Another approach is to use a multinomial model or a bivariate probit model (Greene [17], Justino & Litchfield [18]). Our empirical strategy is based on the operation that a household status is not a nested problem. Therefore, we have a binary response as follows.
where a binary response , we have = = Pr( = 1) and a generalized intercept model for the dependency probability on is as follows.
where is the link function, which is the inverse cumulative distribution function of a known distribution. In the logit model, , is the log-odds that y = 1. Thus, Equation (8) takes the following form.
Therefore, is the effect of a one-unit change in x on the log odds that y = 1, while holding the household effect constant. Simply put, we are looking at the effect of x on household food security status.
Let Xi represent the set of parameters that influence the food security of the ith household. Zi is a direct utility, which is a linear function of k explanatory variables (X). These are expressed as follows.
where β0 is the intercept, β1, β2, … βi are coefficients associated with the explanatory variables Xi, X2, … Xki. Factors in a vector X explain the probability of the ith household being food secure.
where Pi denotes the probability that the ith household is food secure and (1 − Pi) is the probability that the household is food insecure. The odds (Y = 1 versus Y = 0) to be used is defined as the ratio of the probability that the household is food secure ( to the probability of food insecurity (1 − ) namely odds = Pi/(1 − Pi). By eliminating the natural log, we get the following equation.
where = log of the odds ratio, = probability of being food secure, and (1 − ) = the probability of being food insecure.
The value of Zi is referred to as the log of the odds ratio in support of being food secure and is calculated as follows.
where:
Zi = β0 + β1X1 + β2X2 + β3X3 + …βn + µ
β0 = intercept term.
β1, β2, β3…βn are slopes of the parameters of the model, which measures Li for a unit change in explanatory variables.
X1…Xn are factors that explain factors influencing the food security of a household.
The variables used in this study and the expected signs are shown below in Table 1.
The food security status was measured by recoding the HDDS, where households consuming more than 5 food groups were said to be food secure and assigned a numerical value of 1, and those consuming less than 5 food groups were said to be food insecure and assigned a numerical value of 0.
3. Results and Discussion
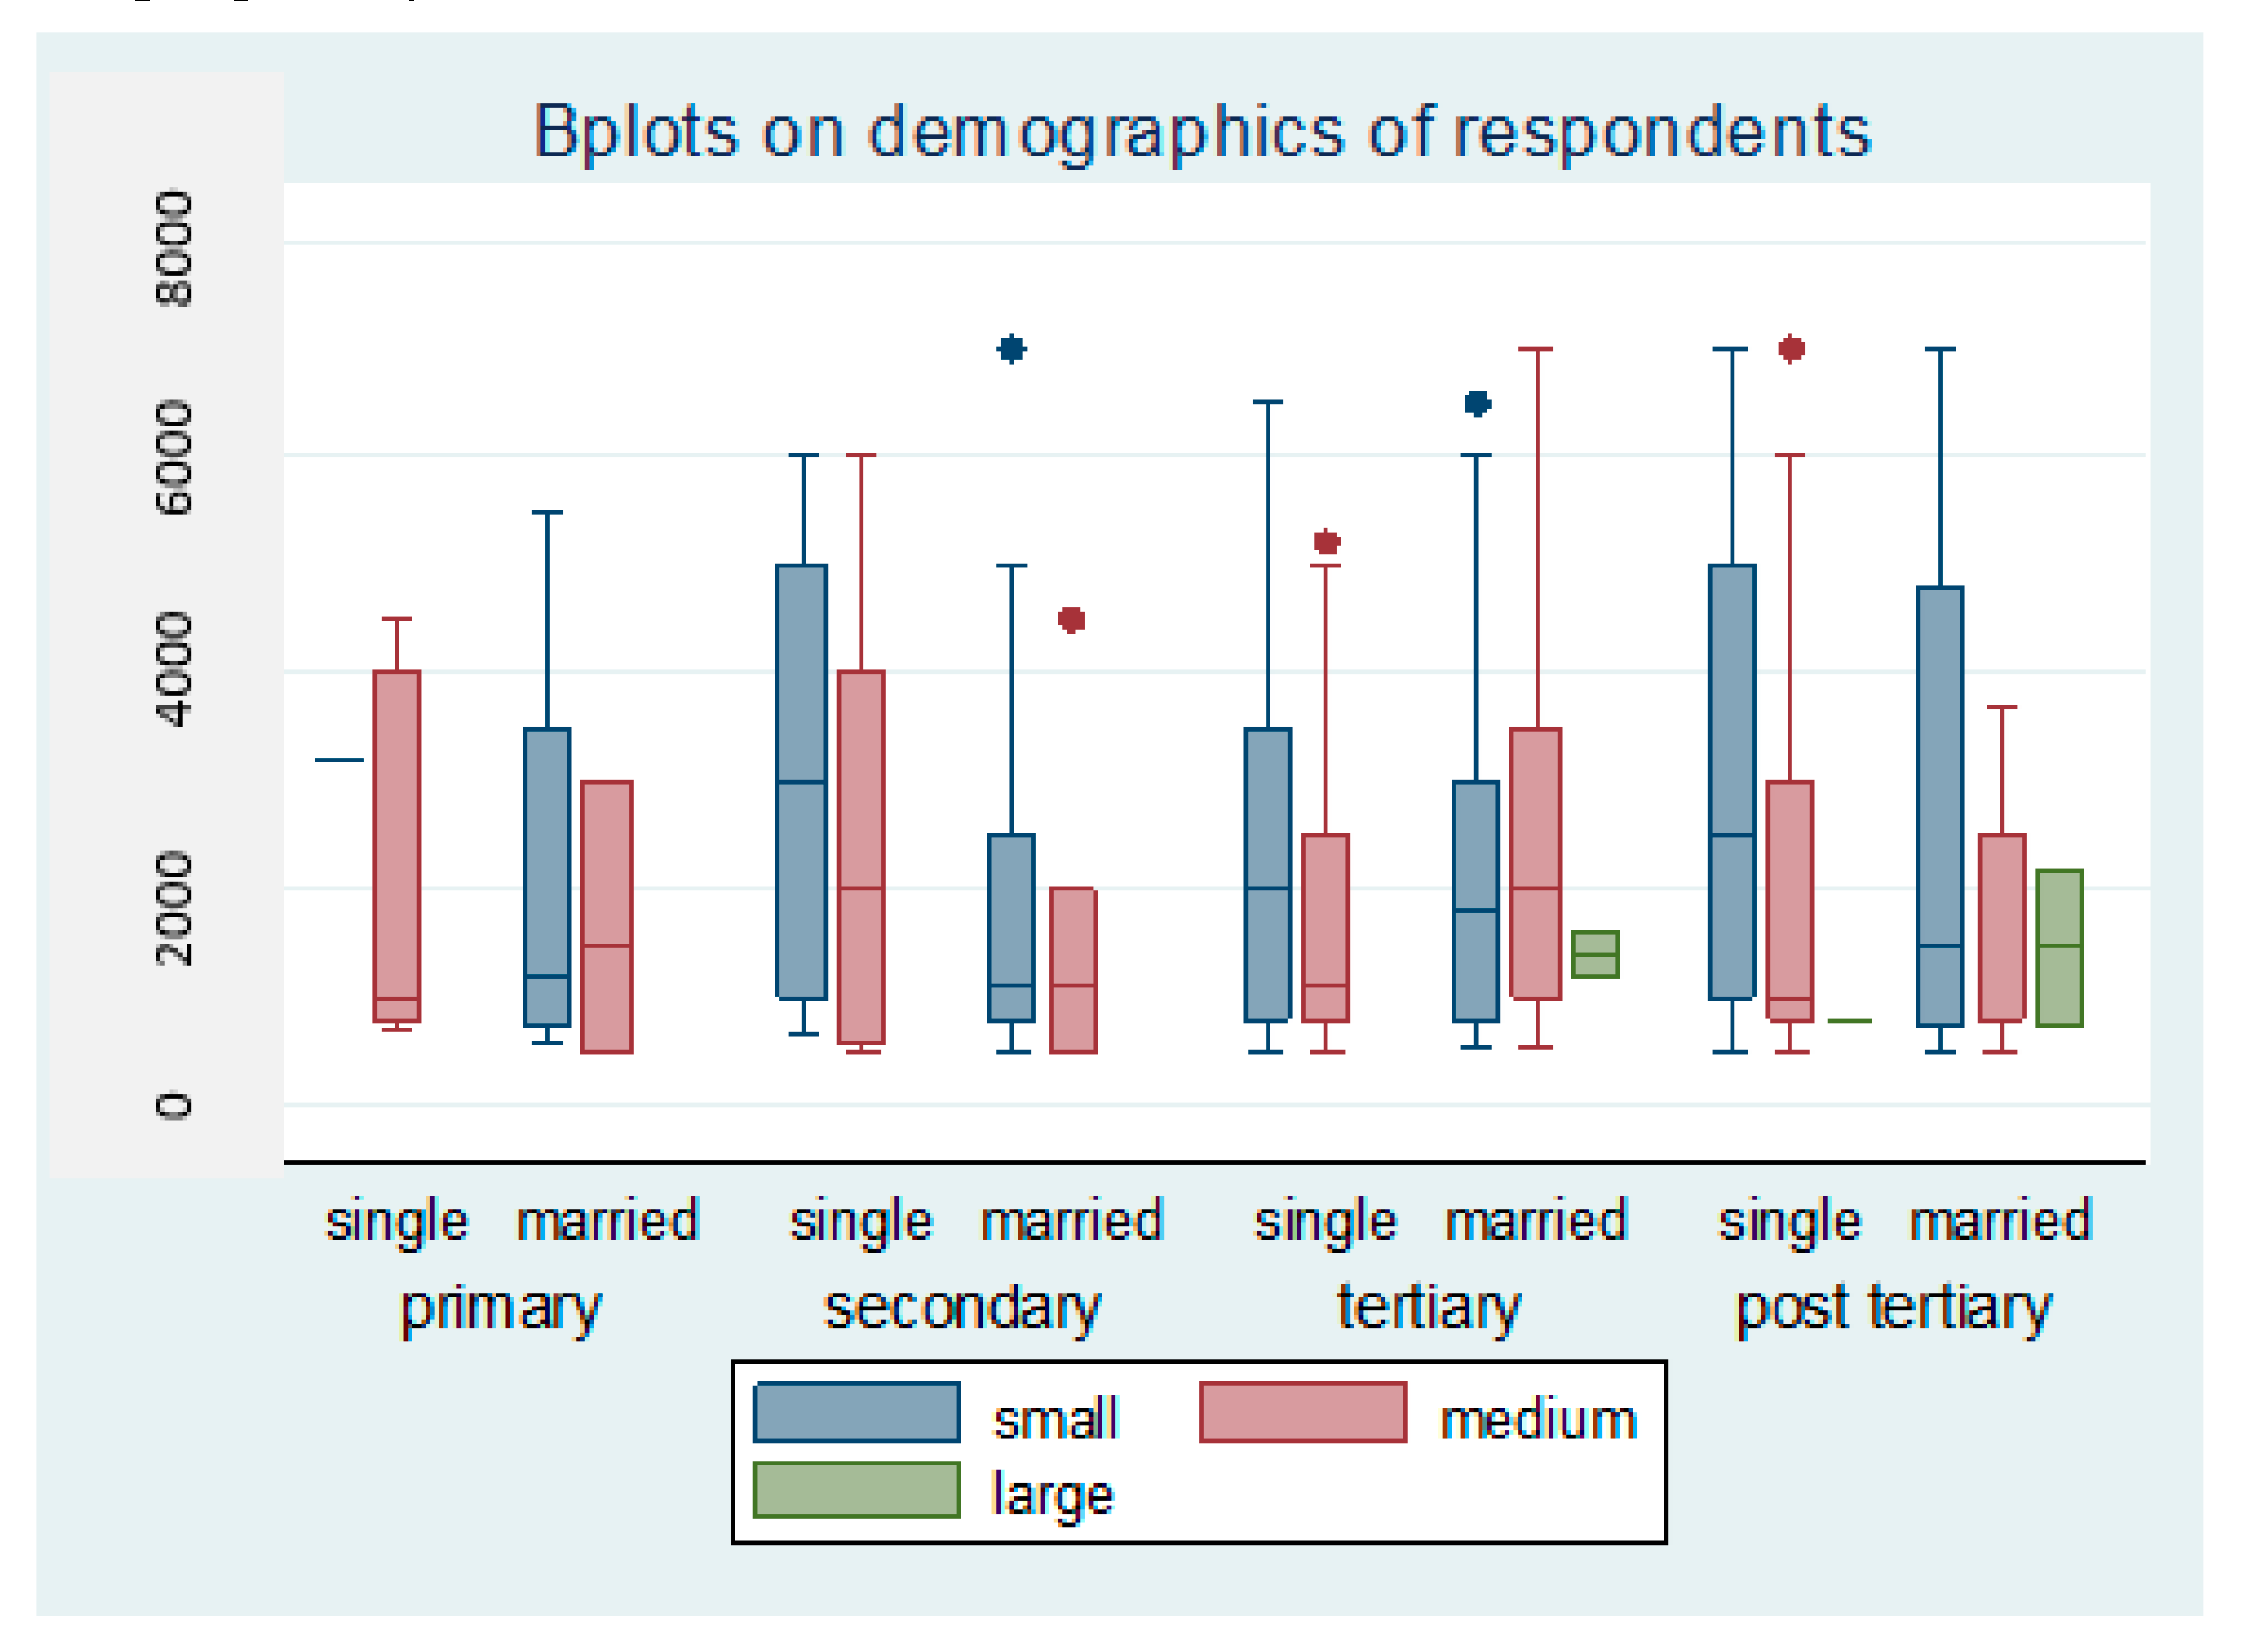
Demographic characteristics in the study area indicate that most households were composed of respondents who were more than 45 years (approximately 70%) of age, and most were female-headed (87%). While the proportion of female and male-headed households is almost equal nationally, this was not the case in the study area. Most males have migrated to work in urban areas, leaving their wives to run the households. In terms of marital status, 51% of the household heads were married, 43% were single, and 4% were divorced. Yet, the majority (35%) of households had around 6–12 family members and 53% possessed secondary level qualification. In terms of credit support, 73% of households were not receiving credit support and 85% had access to agricultural extension services. To illustrate the demographics in a detailed manner, a B plot was done on household size, income, education level, and marital status. This is shown in Figure 2.
According to Figure 2, households with primary education, but with small to medium family size had lower income (ZAR4000 or less, 1ZAR = 0.05USD). Yet, households with secondary education had over ZAR5000–6000 in terms of income level. Although a medium-sized household (single) had a high income (ZAR2000–4000) compared to a small-medium household (married) who had around ZAR2000–2500. On the other hand, households with a tertiary level education had a monthly income below ZAR4000 for both the single and married. Additionally, those with a large married household had the lowest income (less than ZAR2000). Lastly, small households with post-tertiary level education had an income ranging between ZAR4000–6000 monthly. One thing that can be noted is that small sized households had more income and bigger households as well as the lowest income monthly. The major reason for this is that, as the household gets smaller in terms of family size, their propensity to save is greatly enhanced. However, when the household has a large family size, their propensity to consume increases.
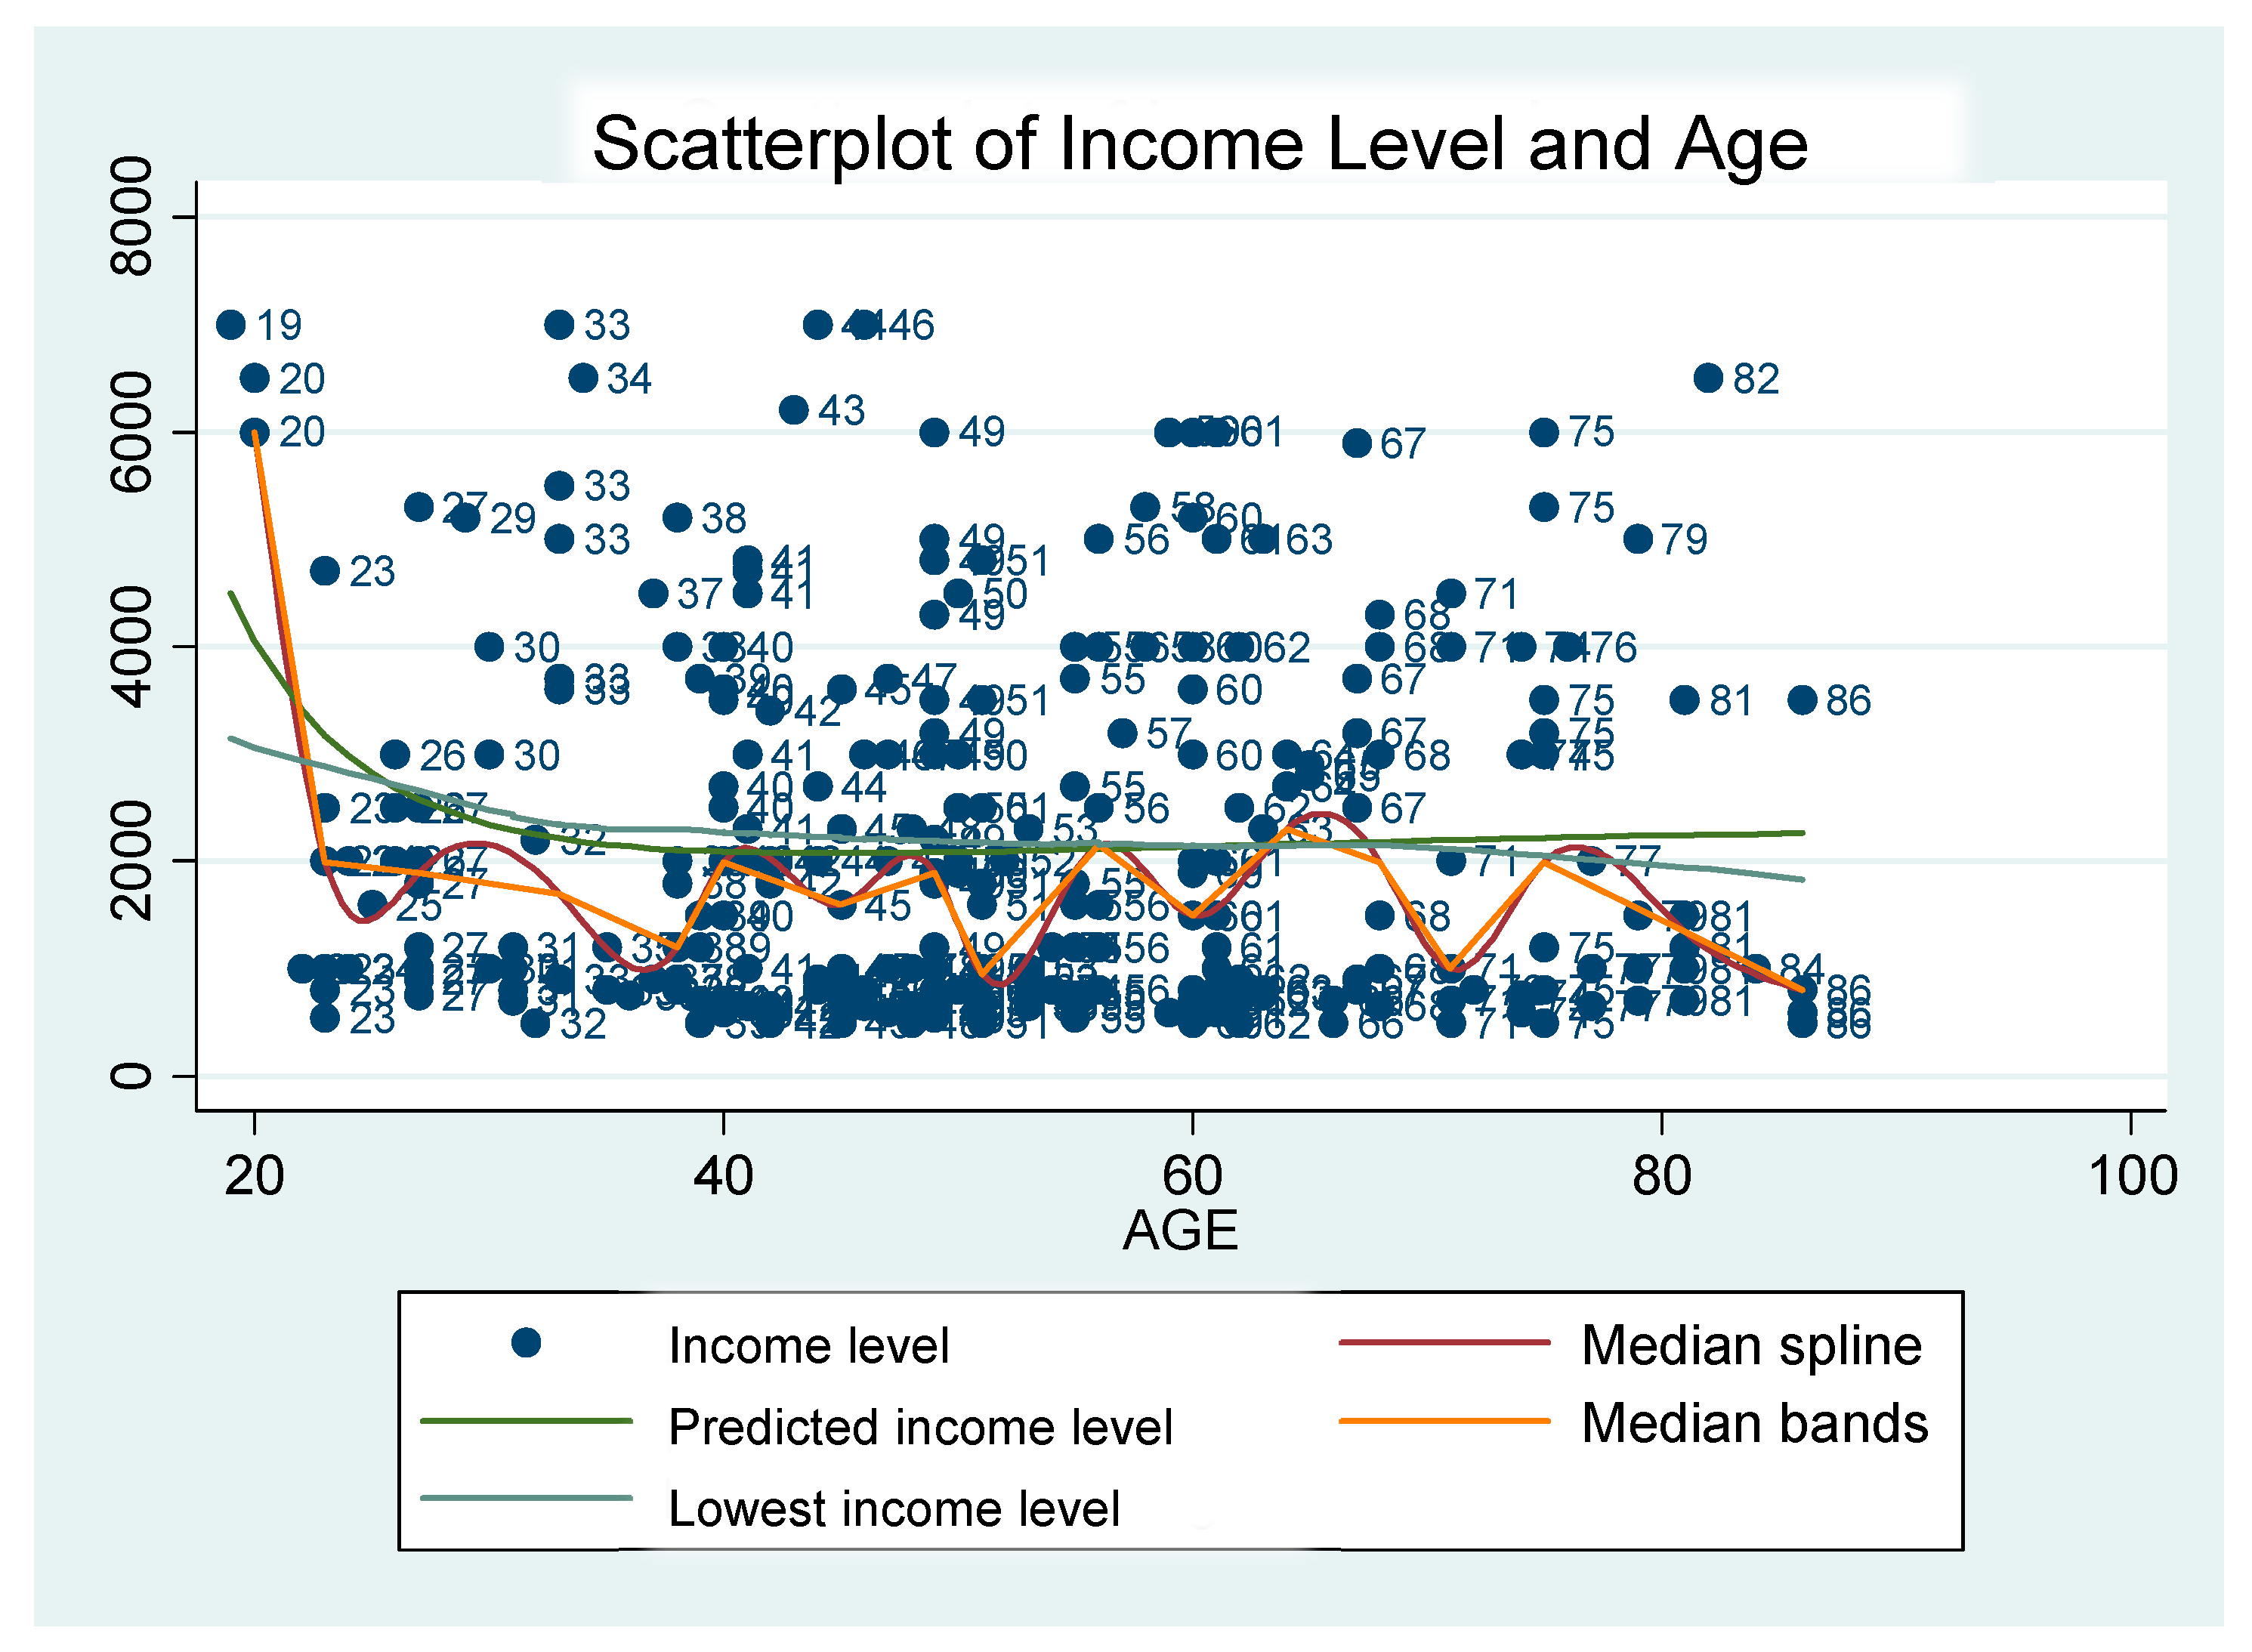
A scatter plot was done on income distribution and age. Figure 3 shows that most households had a monthly income that was less than ZAR2000, even though some had close to ZAR4000. The scatter plot shows that most of the respondents were more than 40 years of age. The income distribution was a reflection of the current situation in a number of rural areas in South Africa where most households rely on government grants. This is the case in South Africa, especially in the Eastern Cape Province, as pointed out by Cheteni et al. [19], Cheteni [20], DAFF [21] and Taruvinga et al. [11] with regard to income dynamics in rural areas.
The predicted income level is almost similar to the lowest income level for all ages. Note that the median band line is hovering around the lowest income, which shows that most households had income levels around ZAR2000.
3.1. Household Food Security Status
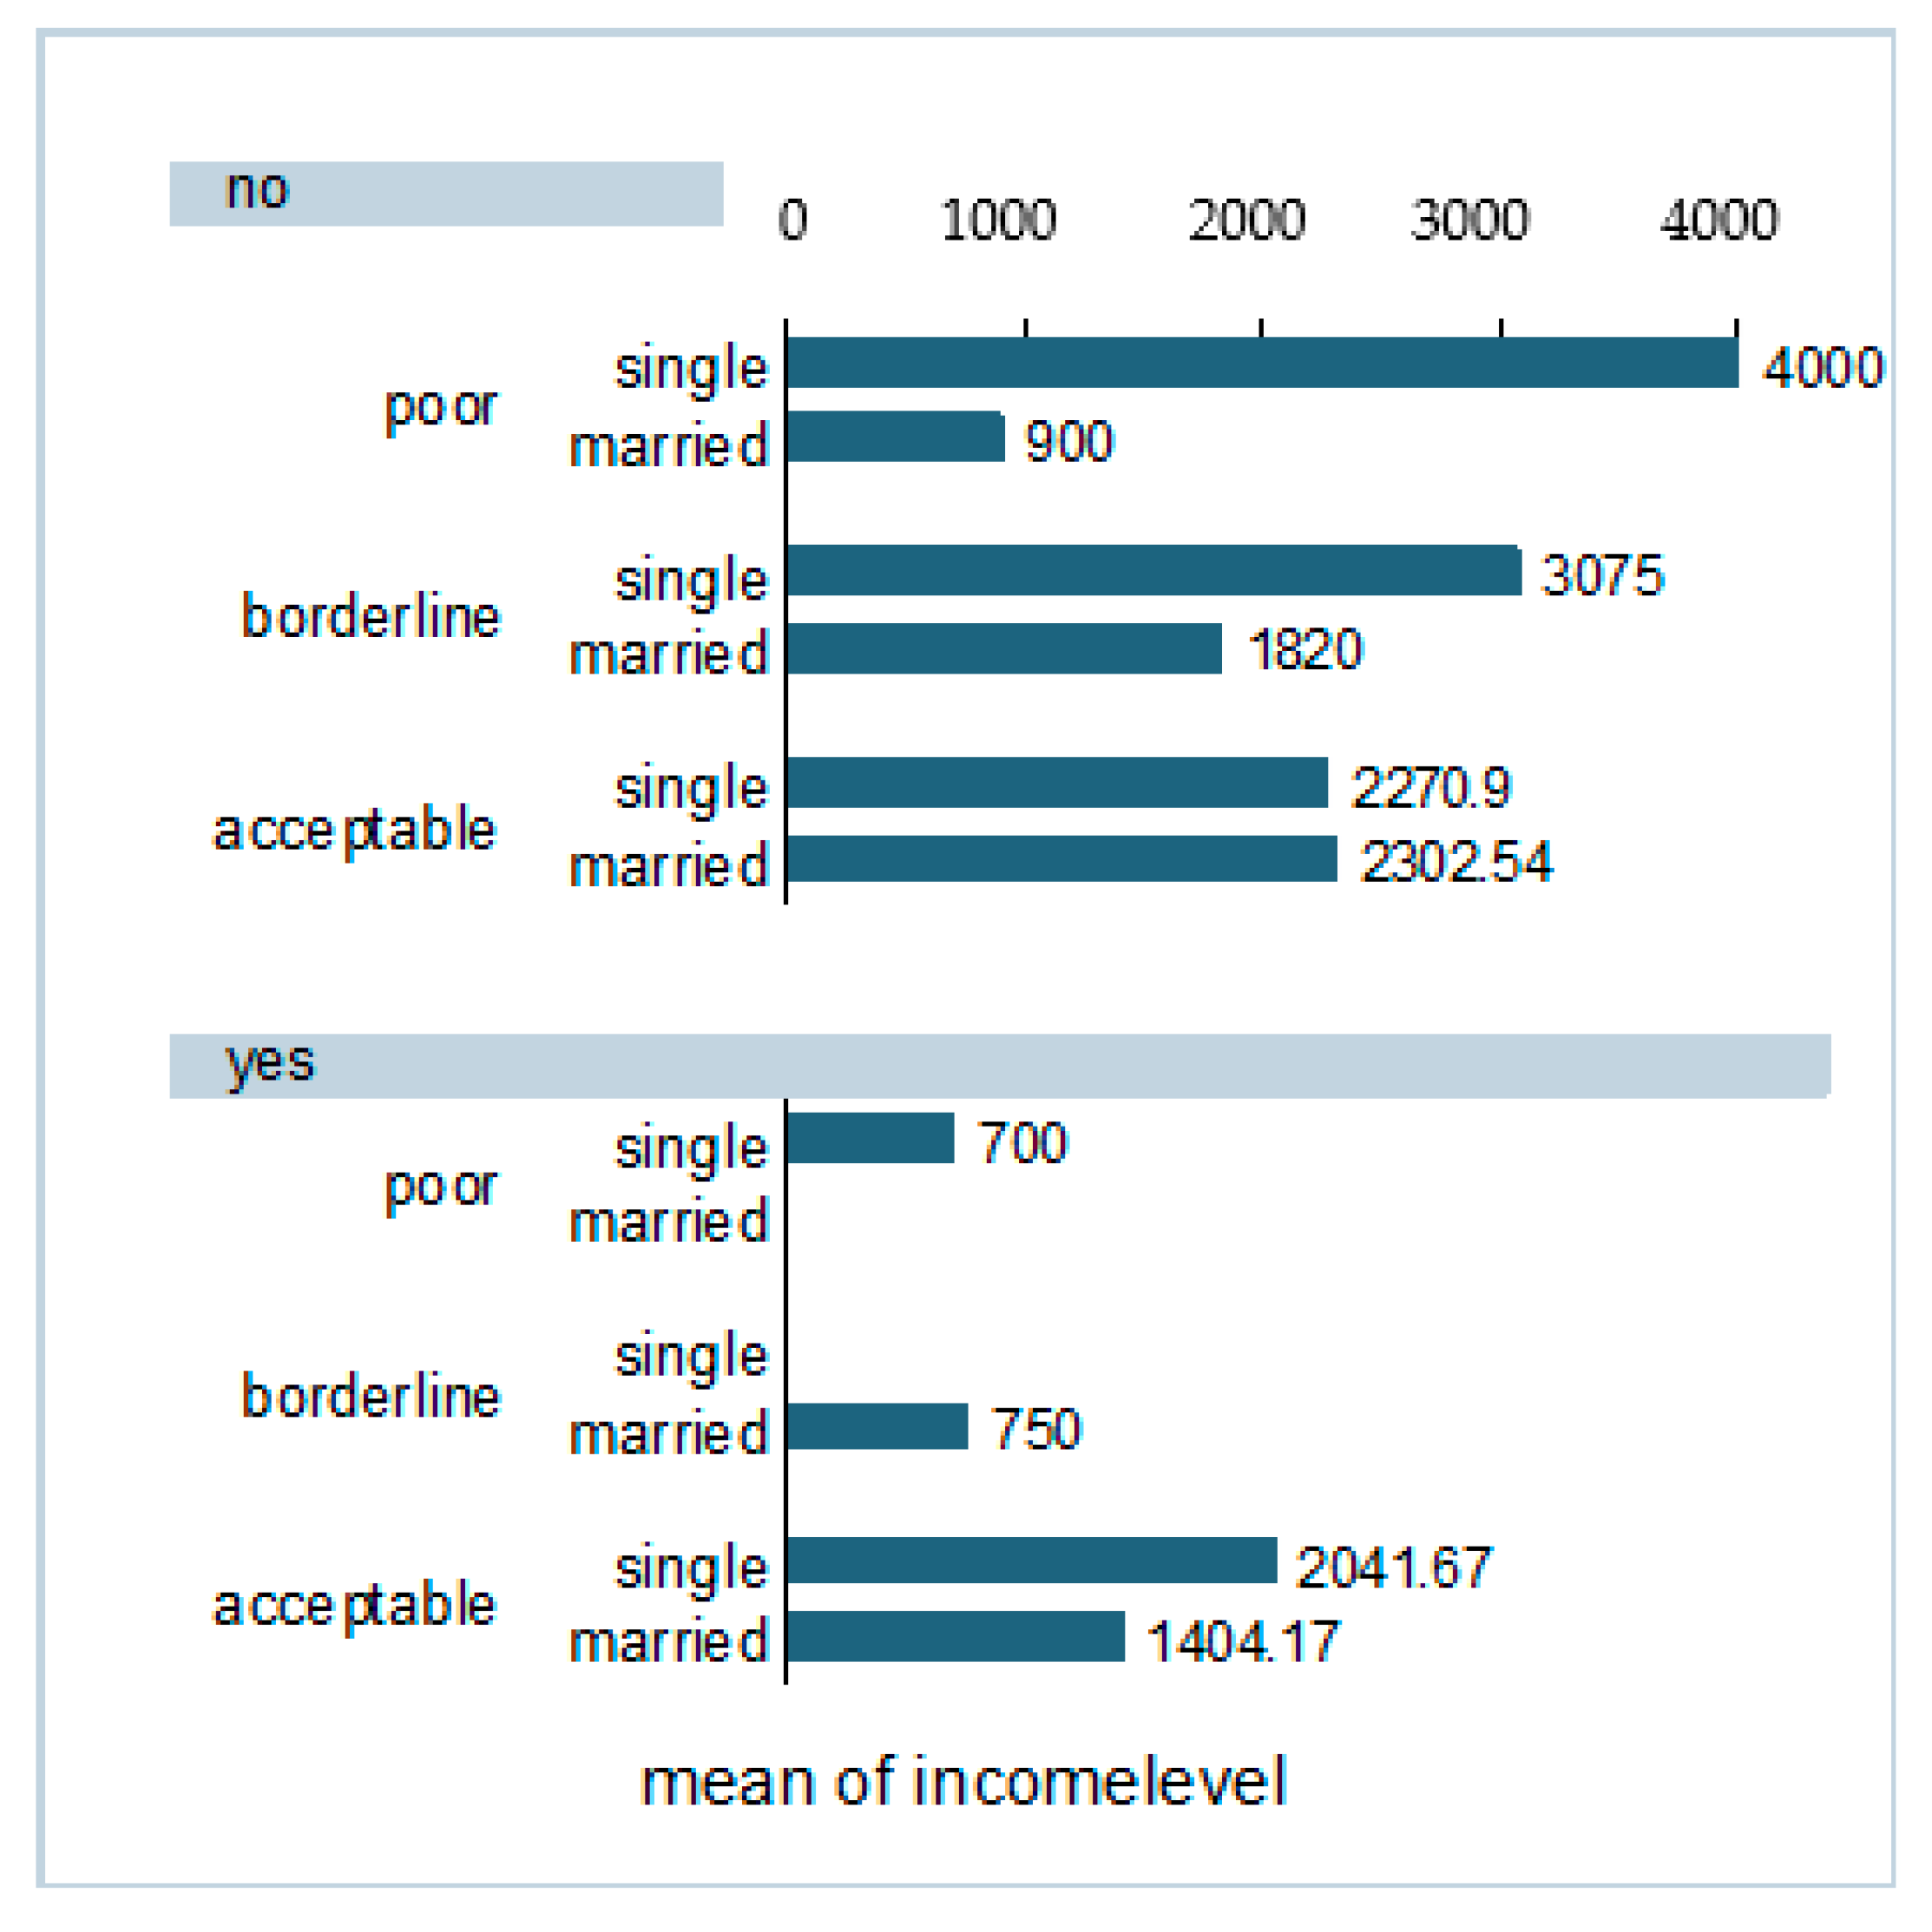
To have a clear picture of the household food security status, demographic characteristics were included, as shown in Figure 4.
According to Figure 4, households were grouped into three classes’ known as poor, borderline, and acceptable based on their Household Food Consumption Score (HFCS). Households classified as ‘no’ were not participating in a government food security program and the ones under ‘yes’ were participating in a government food program. Non-participating households in food security programs regarded as poor (HFCS) and single had the largest income mean of ZAR4000. However, those falling on the borderline (HFCS) and single had ZAR3075 mean income. However, those at the acceptable (HFCS) range were at an income level of about ZAR2270–2302 for both the single and married. Based on this finding, it can be concluded that single households on the poor-borderline (HFCS) bandwidth had more income. As a result, they might not have seen the need to participate in food security programs. On the other hand, households who were participating in food security programs were mostly at acceptable (HFCS) levels in terms of food security, with both single and married people having a mean income of around ZAR1400–2050. Therefore, we can safely conclude that households participating in food security programs ate more food groups compared to the non-participating. However, in terms of income levels, households who were not participating in food security programs had more income.
Single households were the ones who were not participating in food security programs compared to the married households. Therefore, it can be inferred that marital status has an impact on the decision to participate in food security programs, as well as, impact on income dynamics, as shown in Figure 4.
3.2. Household Dietary Diversity Score (HDDS)
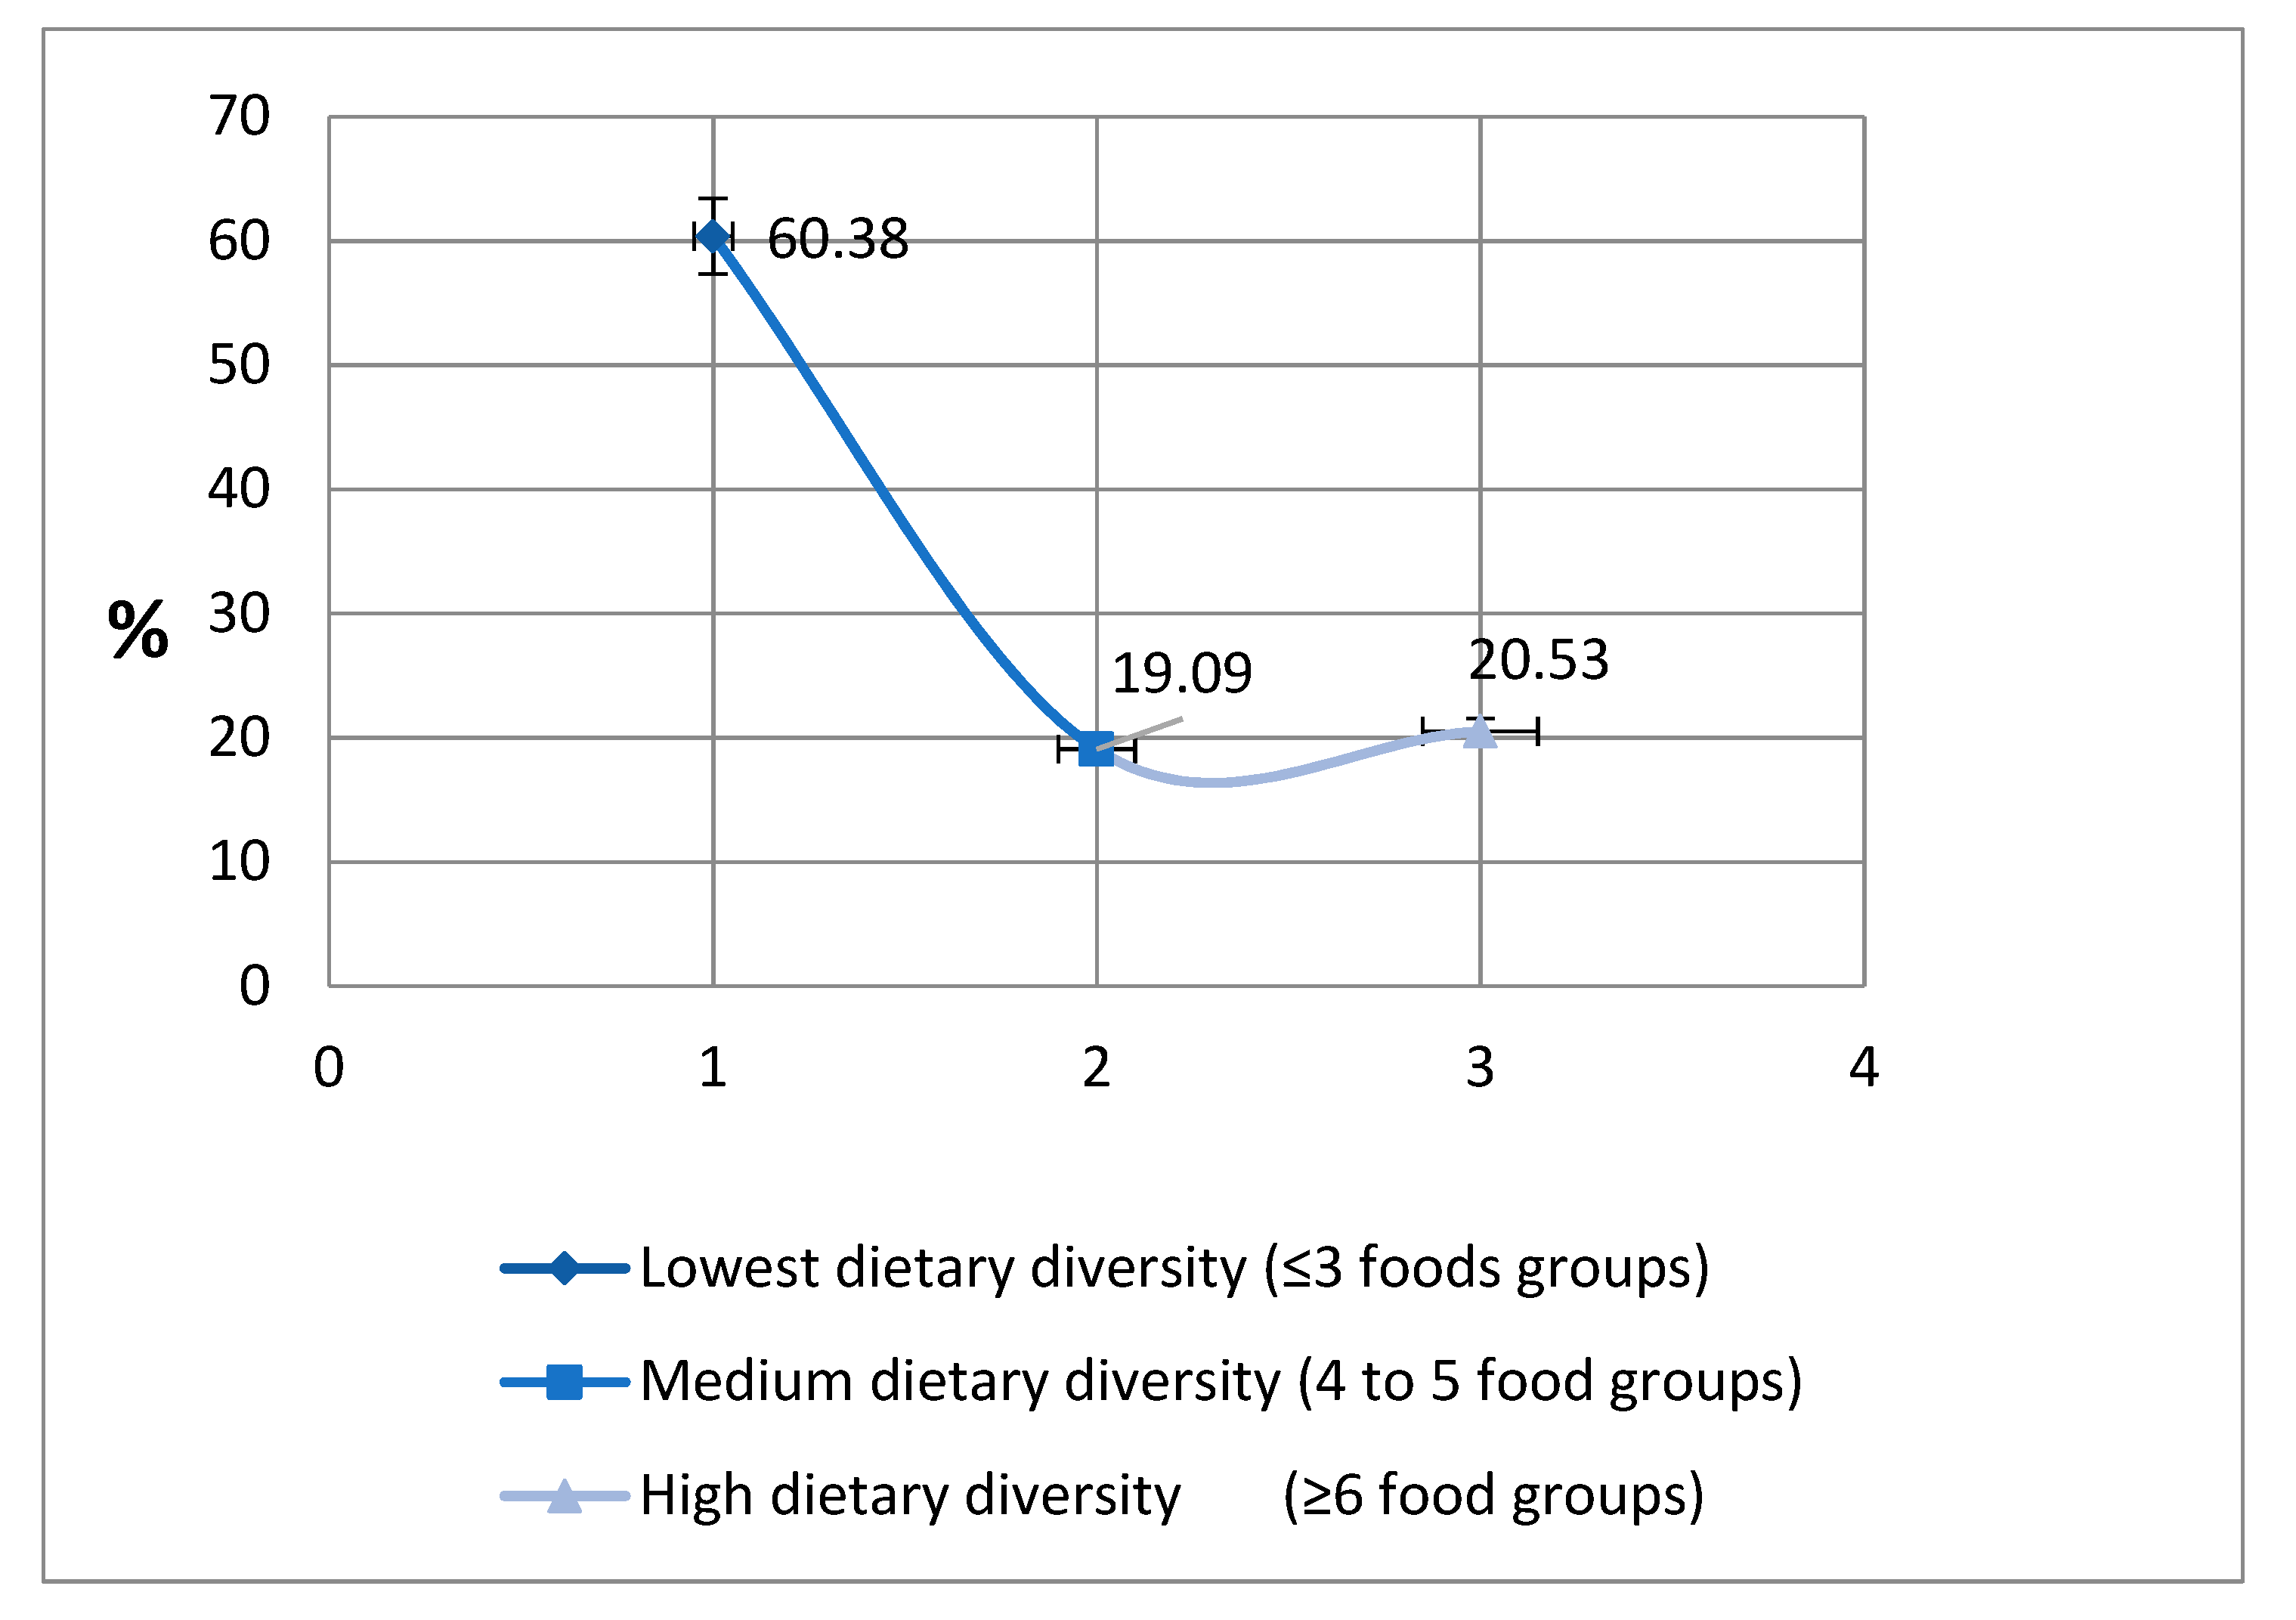
The HDDS was calculated by grouping the following 12 food groups: roots and tubers, cereals, fruits, milk products, sugar and honey, meat, eggs, fish and seafood, poultry and offal, pulses legumes and nuts, and miscellaneous [22]. The HDDS was categorical coded into three dietary classes with the lowest diversity (3 or fewer foods groups), medium diversity (between 4 and 5 food groups), and high diversity (6 or more food groups). Table 2 illustrates the food groups.
According to Table 2, households with a lower dietary diversity consume no more than three food groups, while those with medium dietary diversity households consumed no more than 5 food groups. High dietary households consume at least 6 food groups, as shown in Figure 5.
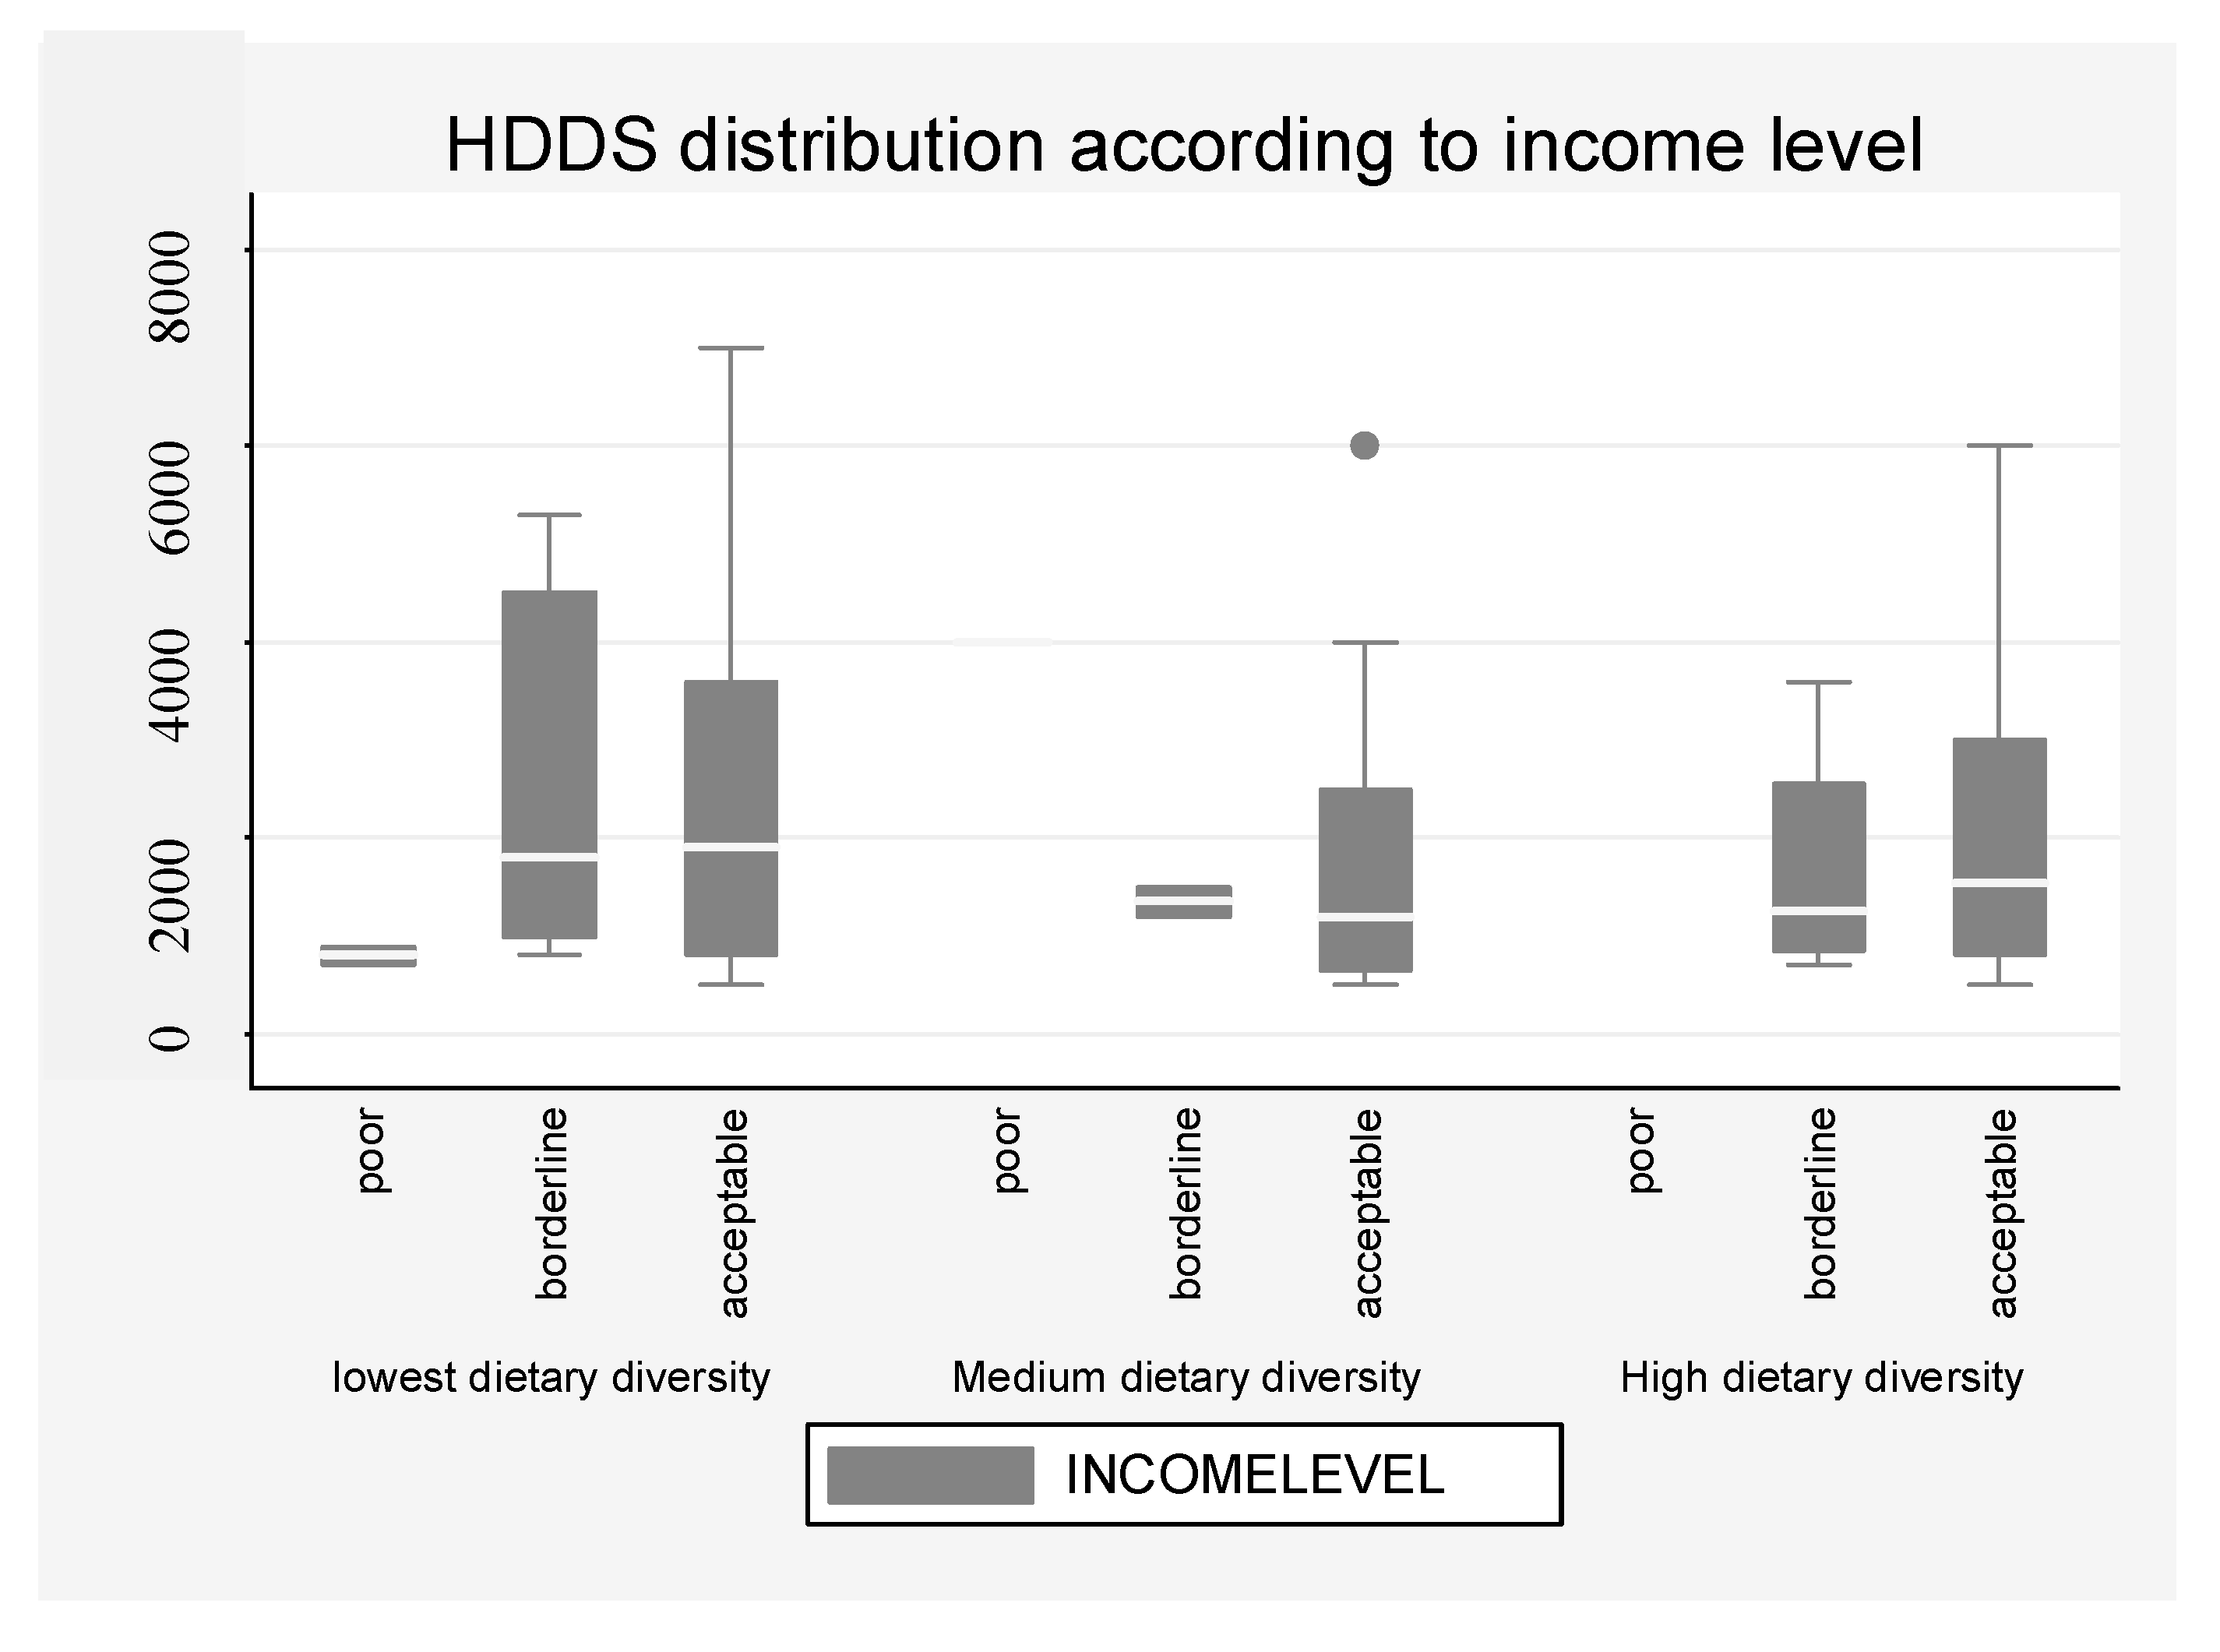
Figure 5 shows that 60 percent of households fell into the lower dietary diversity group, 19 percent are in the medium dietary diversity group, and 21 percent are in the high dietary diversity group. Most households consumed 3 food groups, which include milk, cereals, and pulses. The mean average of the HDDS was 3, which possibly reveals that most households were not consuming many food groups. Lower dietary households consuming 3 food groups were regarded as food insecure, households consuming 3–5 food groups were moderately food secure, and those consuming more than 6 food groups were food secure. The results clearly point out that households in the study area had poor dietary diversity, which is one of the major contributors of stunted growth in children. The USAID [23] points out that the HDDS gives an indication of food groups consumed by households in the last 24 h. As a result, it should not be used as a nutrition indicator but rather an indicator of food access. A study conducted by Taruvinga et al. [11] in the Eastern Cape in two local districts found that food groups such as sugar, condiments, oils, grains, and potatoes were dominant. However, this study finds dissimilar results in different local villages, even though the same conclusion of low dietary diversity by Taruvinga et al. [11] holds in this study. As stated before, this might have been influenced by the geographic location of the households. Areas with inadequate rainfall mainly rely on starch food such as maize, potatoes, and other foods compared to areas with high rainfall, where households can have a variety of food groups. However, this study finds similar results to Taruvinga et al. [11] on low dietary diversity regardless of geographic location. Basically, this shows that geographic location has a minimum impact on influencing household dietary diversity. An HDDS distribution chart, according to income level, was done in order to assess how income affects food security and household dietary diversity.
Figure 6 shows that households with the lowest dietary diversity had a high-income level compared to the high and medium dietary households. In lower dietary diversity households, the majority were borderline in terms of food consumption and the acceptability level. Yet, households with medium dietary diversity had acceptable food consumption level, and high dietary diversity households were both at the borderline level and the acceptable food consumption level. Furthermore, income level has an impact on household food consumption and dietary diversity to a lesser extent. Most households spend their income on food consumption. Therefore, regardless of their dietary diversity, most households were lying on the borderline and acceptable food consumption levels.
3.3. The Seven-Day Food Frequency
Figure 7 illustrates the findings of the seven-day food consumption frequency.
The average HDDS score indicated that, on average, each household consumes three food groups out of the eight food groups available, which signifies a lower dietary diversity in their access to food. Maize was the most consumed food (85%) by households because it is found in mealie meal, porridge, and pap. Secondly, 75 percent of the respondents had consumed beans in the last seven days, as well as rice (71%). Respondents stated that beans are usually eaten as a complementary product with rice or pap, and it is very cheap. As a result, most households usually consume it. Besides the mentioned food, potatoes, fat oil, sugar, milk, and poultry were some of the consumed food items. FAO [24] stated that, in developing countries, low dietary diversity is a norm because of challenges faced by households such as poverty and unemployment. Given that most households surveyed were doing subsistence farming, the FAO [24] observations hold in this case. Nonetheless, households surveyed stated that they usually eat what is available, or anything from their farms or gardens, and anything affordable. Moreover, they pointed out that dietary diversity is not a prime concern when buying food. As a result, obesity is a norm around the study areas due to the food being eaten by households.
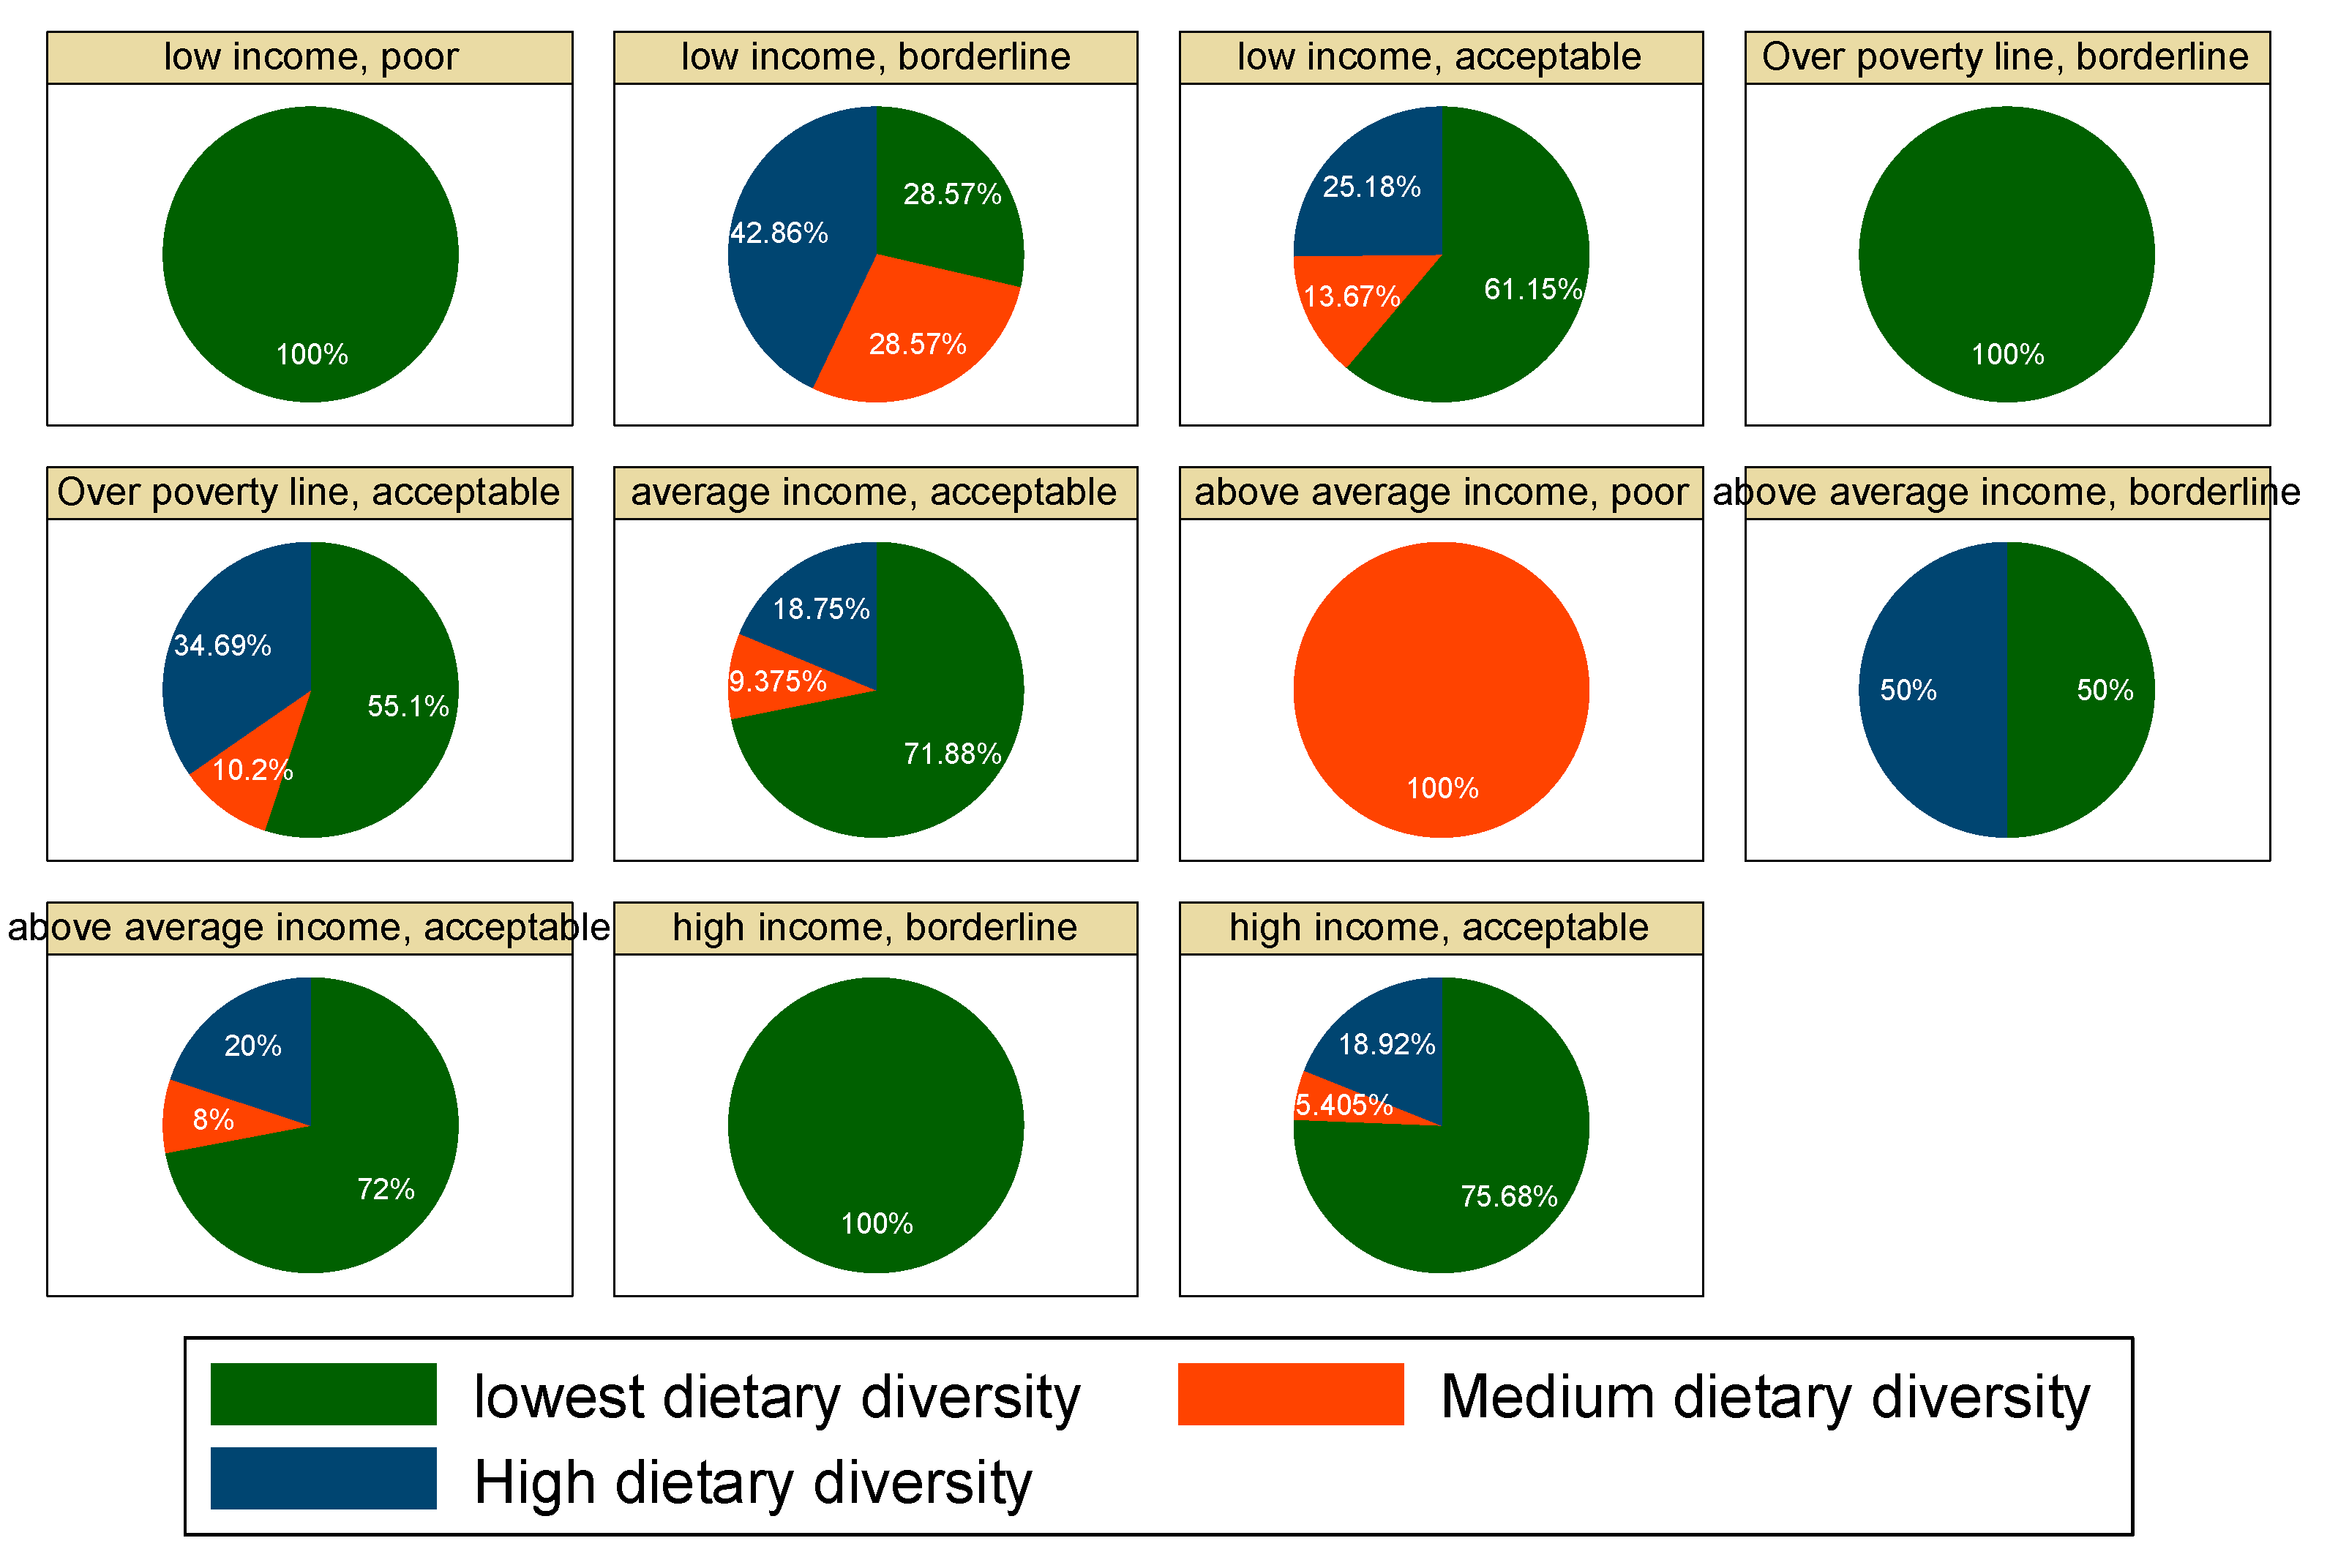
3.4. Households’ Food Consumption
According to Figure 8, low income and higher income households had poor food consumption levels. However, in terms of dietary diversity, the above income households were on the medium dietary level. On the other hand, high income and over the poverty line households were on the borderline level in terms of the food consumption level. Yet, they were regarded as being on the low dietary level. In terms of an acceptable food consumption level, households with above average income had, at most, low dietary diversity. Succinctly, most households had low dietary diversity with the exception of the above average income households who had poor food consumption levels but with medium dietary diversity. It can be concluded that the sampled population had low dietary diversity, even though they had borderline to acceptable food consumption levels regardless of their income.
3.5. Binary Model Results
A binary model was used to determine the factors influencing the food security status in the study areas. First, multicollinearity tests were done on variables, as shown in Table 3.
If the tolerance value is below 0.20 and the Variance Inflation Factor (VIF) is greater than 5, multicollinearity is present. However, it is acceptable for the VIF to lie between 1–10. As shown in Table 3, none of the variables exhibited any multicollinearity. Consequently, the assumptions of non-collinearity was satisfied and the model was then estimated.
The model explained about 65 percent of the variance in household factors contributing to food insecurity and 14 percent of cases were classified correctly. The Hosmer and Lemeshow test revealed a good fit (p value > 0.05), which suggests that there is no difference between the predicted and observed model values of the dependent variable. The summary of the results is shown in Table 4.
Four variables were statistically significant in influencing food security status of households in the study areas. Each variable is explained in detail in the forthcoming session.
The study findings pointed out that the variable age has a negative relationship in influencing household food security status at a 1% significant level (p = 0.011, β = −0.022). This simply means that the younger the household head, they are 0.978 times (Exp (β) = 0.978) likely to be food secure. However, literature is inconclusive with regard to the effect of this variable in influencing food security status. Aidoo, Mensah, and Tuffour [25] found the variable to be insignificant in influencing the food security status of households.
On the other hand, the variable gender has a negative relationship with the food security status of a household. It was statistically significant at a 5% level (p = 0.015) and with a coefficient of −1.172. The odds ratio point out that, when the household head is female, the households are 0.310 times likely to be food secure. Numerous studies found a positive association between female-headed households and food security. Taruvinga et al. [11] found that female-headed households were food secure compared to male-headed households. Rogers [26] pointed out that this is particularly the case because females spend more income on high quality and protein-rich foods because they are involved in food preparation.
Income was found to positively influence household security and is statistically significant at the 1% level (p = 0.063, beta coefficient β = 0.000). The odds ratio (Exp (β) = 1.000) revealed that the higher the income a household has, the more the household is food secure. Gebre [27] found evidence that households with access to employment and income are likely to be food secure and their household food security status is positive. Taruvinga et al. [11] found a positive association between food security status and income in the Eastern Cape Province. Numerous authors (Pollack, ref. [28]) claimed that income leads to a demand for a variety of foods.
Credit access is one of the most important things for smallholder farmers because it helps them purchase farming equipment. We found a positive association between credit access and food security status at a 10% significance level (p = 0.03, β = 0.938). The odds ratio pointed out that a household with credit access was likely to be 2.555 times more food secure. This is particularly the case because the more credit access smallholder farmers have, the better they can purchase inputs, which, in turn, would help them improve their productivity.
4. Conclusions
The study was conducted in the Eastern Cape Province, South Africa, and the aim was to identify factors influencing household food security. The data were gathered through the administration of questionnaires. According to the HDDS, a majority of households (61%) were consuming at most three food groups and lacked dietary diversity. The most consumed food groups were the milk, cereals, and pulses. On the other hand, the HFCS pointed out that most households were at an acceptable level in terms of food security, even though it was in the short term. The empirical model confirmed that age, access to credit, gender, and household income influenced the household food security status and dietary diversity in the study area. The findings clearly demonstrated that income was a huge factor in fighting food insecurity in the study area. There was evidence that household food insecurity was a prominent feature in the sampled areas. A number of households are food secure in the short term. This sends a strong message to policymakers, program designers, and agencies on efforts needed to help those households to be food secure in the long term considering that, in 2015 and 2016, there was drought throughout South Africa. The drought led to a number of rural households losing agricultural yields and livestock, which is the backbone of a rural economy. Therefore, the government should focus on improving rural livelihoods if they want to improve food security.
Policy Implications
The implications of the study findings are that gender, age, access to credit, and income play a statistically significant role in food security in rural areas. Therefore, as the proposed National Development Plan targets poverty, the first step would be to eradicate food poverty that is prevalent in the rural areas. In the 2015 and 2016 period, drought caused considerable losses to livestock in rural areas. The livestock was also used for farming, which suggests that household’s factor inputs have severely declined in a number of rural areas. Consequently, the government needs to focus on initiatives, which drive capital assets to improve the food security in rural areas. This would go a long way toward improving their household income status considering that numerous participants were relying on government grants. Furthermore, the results have huge implications for agro-business development and management in the province because the pattern of food demand will influence the nature of agro-businesses set to serve communities and the extent to which they operate profitably. Consequently, the government may see it fit to offer subsidies to agro-business operating in the province, to cushion them against any losses expected due to the decline in food demand.
Most participants were beyond youth age, which suggests that agriculture is facing problems of less participation by the youths. Subsequently, there is an urgent need for the South African government to find lasting solutions in addressing this problem. Unemployment among the youth has spiked to its highest levels as well.
Another case to make is about women empowerment in agriculture. Numerous studies in rural South Africa found that most households are female-headed. Given that, females have limited options for sourcing income, it would be wise for the government to see that female-led agriculture projects or initiatives need to be supported by the Department of Agriculture. This would, in turn, help fight food poverty.
The study faced a number of limitations, which included access to smallholder farmer database and logistics challenges due to the fact that some households were unreachable. However, some of the minor challenges were easily addressed by the researcher.
Future studies can be directed at accessing the impact of the 2015 and 2016 drought on rural households’ informal economy. Such studies will unmask the likely effects of drought on food security, as well as nutrition in the rural areas. This is because our study was limited to a rural area that was not seriously affected by drought. It would be worthwhile to consider some of the food indicators, which capture calorie intake, crop yields, and household coping strategies.
Author Contributions
P.C. developed the study under the supervision of Y.K. and G.M., P.C. was responsible for the compilation of the draft manuscript. Data analysis and scientific evaluation of the final manuscript is the result of the collaborative effort from all authors. All authors have read and agreed to the published version of the manuscript.
Funding
This research received no external funding.
Acknowledgments
The authors would like to acknowledge the technical and administrative support it received from the North West University staff and ICT.
Conflicts of Interest
The authors declare no conflict of interest.
References
- Department of Agriculture, Forestry and Fisheries (DAFF). Agriculture Statistics 2017; DAFF: Pretoria, South Africa, 2017.
- Norman, R.; Bradshaw, D.; Steyn, K.; Gaziano, T. South African Comparative Risk Assessment Collaborating Group. Estimating the burden of disease attributable to high cholesterol in South Africa in 2000. S. Afr. Med. J. 2007, 97, 708–715. [Google Scholar] [PubMed]
- Mchiza, Z.J.; Parker, W.; Makoae, M.; Sewpaul, R.; Kupamupindi, T.; Labadarios, D. Household income, gender and race are major modifiers for body image in South Africa: SANHANES-1. BMC Public Health 2015, 15. [Google Scholar] [CrossRef] [Green Version]
- Ngema, P.Z.; Sibanda, M.; Musemwa, L. Household Food Security Status and Its Determinants in Maphumulo Local Municipality, South Africa. Sustainability 2018, 10, 3307. [Google Scholar] [CrossRef] [Green Version]
- Khumalo, N.Z.; Sibanda, M. Does Urban and Peri-Urban Agriculture Contribute to Household Food Security? An Assessment of the Food Security Status of Households in Tongaat, eThekwini Municipality. Sustainability 2019, 11, 1082. [Google Scholar] [CrossRef] [Green Version]
- Food and Agriculture Organisation (FAO). Guideline for Measuring Household and Individual Dietary Diversity; FAO: Rome, Italy, 2011. [Google Scholar]
- Aliber, M. Exploring Statistics South Africa’s National Household Surveys as Sources of Information about Food Security and Subsistence Agriculture. In Centre for Poverty Employment and Growth; Human Sciences Research Council: Pretoria, South Africa, 2009; Unpublished Report. [Google Scholar]
- Naicker, N.; Mathee, A.; Teare, J. Food insecurity in households in informal settlements in urban South Africa. S. Afr. Med. J. 2015, 105, 268–270. [Google Scholar] [CrossRef] [PubMed]
- Crush, J.; Caesar, M. City Without Choice: Urban Food Insecurity in Msunduzi, South Africa. Urban Forum 2014, 25, 165–175. [Google Scholar] [CrossRef]
- Shisana, O.; Labadarios, D.; Rehle, T.; Simbayi, L.; Zuma, K.; Dhansay, A.; Reddy, P.; Parker, W.; Hoosain, E.; Naidoo, P.; et al. Sanhanes-1 Team. In South African National Health and Nutrition Examination Survey (SANHANES-1); HSRC Press: Cape Town, South Africa, 2013. [Google Scholar]
- Taruvinga, A.; Muchenje, V.; Mushunje, A. Determinants of rural household dietary diversity: The case of Amatole and Nyandeni districts, South Africa. Int. J. Dev. Sustain. 2013, 2, 2233–2247. [Google Scholar]
- OR-IDP. OR Integrated Development Plan 2016–2021; Government Printers: Pretoria, South Africa, 2016.
- Statistics South Africa (StatsSA). Agricultural Statistics Report 2016; Government Printers: Pretoria, South Africa, 2015.
- Arimond, M.; Wiesmann, D.; Becquey, E.; Carriquiry, A.; Daniels, M.C.; Deitchler, M.; Fanou-Fogny, N.; Joseph, M.L.; Kennedy, G.; Martin-Prével, Y.; et al. Simple Food Group Diversity Indicators Predict Micronutrient Adequacy of Women’s Diets in 5 Diverse, Resource-Poor Settings1234567. J. Nutr. 2010, 140, 2059S–2069S. [Google Scholar] [CrossRef] [PubMed] [Green Version]
- Kennedy, G.L.; Pedro, M.R.; Seghieri, C.; Nantel, G.; Brouwer, I. Dietary diversity score is a useful indicator of micronutrient intake in non-breast-feeding Filipino children. J. Nutr. 2007, 137, 472–477. [Google Scholar] [CrossRef] [PubMed] [Green Version]
- Katwijukye, A.K. Socio-Economic Analysis of Land Resource Use and Conservation in Uganda. In Farming and Rural Systems Economics; Doppler, W., Bauer, S., Eds.; Margraf Verlag: Weikersheim, Germany, 2005; Volume 71. [Google Scholar]
- Greene, W.H. Econometric Analysis, 4th ed.; Prentice Hall: Upper Saddle River, NJ, USA, 2000. [Google Scholar]
- Justino, P.; Litchfield, J. Poverty Dynamics in Rural Vietnam: Winners and Losers during Reform; Poverty Research Unit at Sussex Working Paper no 10; University of Sussex: Brighton, UK, 2003. [Google Scholar]
- Cheteni, P. Barriers and Incentives to Potential Adoption of Biofuel Crops by Smallholder Farmers in Selected Areas in the Chris Hani and O.R Tambo District Municipalities, South Africa. Master’s Thesis, University of Fort Hare, Alice, South Africa, 2014. [Google Scholar]
- Cheteni, P. Youth Participation in Agriculture in the Nkonkobe District Municipality, South Africa. J. Hum. Ecol. 2016, 55, 207–213. [Google Scholar] [CrossRef] [Green Version]
- Department of Agriculture, Forestry and Fisheries (DAFF). National Policy on Food and Nutrition Security; DAFF: Pretoria, South Africa, 2015.
- FANTA. Developing and Validating Simple Indicators of Dietary Quality and Energy Intake of Infants and Young Children in Developing Countries: Summary of Findings from Analysis of 10 Data Sets. In Working Group on Infant and Young Child Feeding Indicators; Food and Nutrition Technical Assistance (FANTA) Project, Academy for Educational Development (AED); USAID: Washington, DC, USA, 2008. [Google Scholar]
- USAID. Baseline Study of the Title II Development Food Assistance Program in Haiti; USAID: Washington, DC, USA; ICF International Inc.: Fairfax, VA, USA, 2015.
- Food and Agriculture Organisation (FAO). A Conceptual Framework for Accelerating Rural Poverty Reduction’, Revised Draft (Strategic Objective: Reduce Rural Poverty, Economic and Social Development Department); Food and Agricultural Organization: Rome, Italy, 2013. [Google Scholar]
- Aidoo, R.; Mensah, J.O.; Tuffour, T. Determinants of Household Food Security in the Sekyere-Afram Plains District of Ghana. Eur. Sci. J. 2013, 3. [Google Scholar] [CrossRef]
- Rogers, E. Diffusion of Innovations, 4th ed.; The Free Press: New York, NY, USA, 1995. [Google Scholar]
- Gebre, G.G. Determinants of Food Insecurity among Households in Addis Ababa City, Ethiopia. Interdiscip. Descr. Complex Syst. 2012, 10, 159–173. [Google Scholar] [CrossRef]
- Pollack, S. Consumer Demand for Fruit and Vegetables: The US Example, Chapter 6. In Changing Structure of Global Food Consumption and Trade; Regmi, A., Ed.; Agricultural and Trade Report; U.S. Department of Agriculture, Economic Research Service: Washington, DC, USA, 2001; p. WRS-01-1. [Google Scholar]
Figure 1.
Eastern Cape Province. Source: (www.municiplaities.co.za).
Figure 1.
Eastern Cape Province. Source: (www.municiplaities.co.za).

Figure 2.
Demographics of respondents. Source: Survey data (2017).

Figure 3.
Scatterplot of income and age. Source: Survey data (2017).

Figure 4.
Household food security status and income. Source: Survey data (2017).

Figure 5.
Household dietary diversity scores. Source: Survey data (2017).

Figure 6.
Households dietary diversity scores. Source: Survey data (2017).

Figure 7.
Seven-day frequency food consumption. Source: Survey data (2017).

Figure 8.
Household food consumption. Source: Survey data (2017).


Table 1.
Binary model variables.
| Variable | Variable Description | Type of Measure | Expected Outcome (+/−) |
|---|---|---|---|
| Dependent Variable | |||
| FOOD SECURE | Whether the household is food secure or not | Dummy (1 = yes, 0 = no) | |
| Explanatory Variables | |||
| FCS | Food consumption score | Actual numbers | |
| AGE | Age of respondent | Actual number of years | +/− |
| GENDER | Gender of respondent | Dummy (0 = female, 1 = male) | +/− |
| EDUCATION | Highest education of the respondent | Categorical | + |
| HHINCOME | Household income | Continuous | + |
| ACCCREDIT | Whether the household has access to credit or not | Dummy (1 = yes, 0 = no) | + |
| HHS | Size of the household | Continuous | + |
| EXTENSION | Whether the household has access to extension services or not | Dummy (1 = yes, 0 = no) | + |
| EMPLOYMENT | Whether the household head is employed | Dummy (1 = yes, 0 = no) | + |
Source: Authors (2017).
Table 2.
HDDS for households.
| Lowest Dietary Diversity (≤3 Food Groups) | Medium Dietary Diversity (4 and 5 Food Groups) | High Dietary Diversity (≥6 Food Groups) |
|---|---|---|
| Cereals, root crops, tubers | Fruit | Fruit |
| Milk | Milk | Milk |
| Pulses | Pulses | Pulses |
| Meat and fish | Meat and fish | |
| Cereals and tubers | Oil | |
| Sugar | ||
| Vegetables | ||
| Cereals and tubers |
Source: Survey data (2017).
Table 3.
Multicollinearity tests.
| Collinearity Statistics | ||
|---|---|---|
| Variables | Tolerance | VIF |
| FCS | 0.773 | 1.294 |
| GENDER | 0.818 | 1.222 |
| AGE | 0.903 | 1.100 |
| EDUCATION | 0.848 | 1.167 |
| EMPLOYMENT | 0.886 | 1.122 |
| HHINCOME | 0.959 | 1.042 |
| ACCCREDIT | 0.820 | 1.220 |
| EXTENSION | 0.577 | 1.732 |
| HHS | 0.669 | 1.495 |
Source: Survey data.
Table 4.
Binary logistic model results.
| Variables | Β | S.E. | WALD | DF | SIG. | EXP (β) |
|---|---|---|---|---|---|---|
| FCS | −0.002 | 0.008 | 0.049 | 1 | 0.825 | 0.998 |
| GENDER | −1.172 | 0.483 | 5.882 | 1 | 0.015 *** | 0.310 |
| AGE | −0.022 | 0.009 | 6.504 | 1 | 0.011 *** | 0.978 |
| EDUCATION | 4.062 | 3 | 0.255 | |||
| EDUCATION (1) | 0.445 | 0.629 | 0.501 | 1 | 0.479 | 1.561 |
| EDUCATION (2) | −0.425 | 0.450 | 0.893 | 1 | 0.345 | 0.654 |
| EDUCATION (3) | 0.326 | 0.304 | 1.146 | 1 | 0.284 | 1.385 |
| EMPLOYMENT | −0.348 | 0.278 | 1.569 | 1 | 0.210 | 0.706 |
| HHINCOME | 0.000 | 0.000 | 3.457 | 1 | 0.063 * | 1.000 |
| ACCCREDIT | 0.938 | 0.318 | 8.721 | 1 | 0.003 *** | 2.555 |
| EXTENSION | −0.242 | 0.370 | 0.429 | 1 | 0.512 | 0.785 |
| HHS | −0.007 | 0.039 | 0.033 | 1 | 0.855 | 0.993 |
| Constant | 0.589 | 0.812 | 0.525 | 1 | 0.469 | 1.801 |
| Number of observations | 296 | |||||
| −2 Log likelihood | 351.230 | |||||
| Cox & Snell R Square | 0.109 | |||||
| Nagelkerke R Square | 0.138 | |||||
| Hosmer and Lemeshow Chi-Square Test | 8.775 (df = 8; p-value = 0.362) | |||||
| Omnibus Tests of Model Coefficients Chi-square | 31.473 (df = 11; p-value = 0.001) | |||||
| Overall model prediction (%) | 65% | |||||
Significant at 10% *, 5% ** and 1% *** significance level. Source: Survey data (2017).
© 2020 by the authors. Licensee MDPI, Basel, Switzerland. This article is an open access article distributed under the terms and conditions of the Creative Commons Attribution (CC BY) license (http://creativecommons.org/licenses/by/4.0/).
Share and Cite
MDPI and ACS Style
Cheteni, P.; Khamfula, Y.; Mah, G. Exploring Food Security and Household Dietary Diversity in the Eastern Cape Province, South Africa. Sustainability 2020, 12, 1851. https://doi.org/10.3390/su12051851
AMA Style
Cheteni P, Khamfula Y, Mah G. Exploring Food Security and Household Dietary Diversity in the Eastern Cape Province, South Africa. Sustainability. 2020; 12(5):1851. https://doi.org/10.3390/su12051851
Chicago/Turabian StyleCheteni, Priviledge, Yohane Khamfula, and Gisele Mah. 2020. "Exploring Food Security and Household Dietary Diversity in the Eastern Cape Province, South Africa" Sustainability 12, no. 5: 1851. https://doi.org/10.3390/su12051851
Note that from the first issue of 2016, this journal uses article numbers instead of page numbers. See further details here.