Measuring Patients’ Perception and Satisfaction with the Romanian Healthcare System
by
 ,
,
Smaranda Adina Cosma
1,*, 
Marius Bota
1,
Cristina Fleșeriu
1,
Claudiu Morgovan
2,
Mădălina Văleanu
3,* and
Dan Cosma
4 1
Department of Hospitality Services, Faculty of Business, Universitatea Babeș-Bolyai, 7 Horea St., 400174 Cluj-Napoca, Romania
2
Preclinical Department, Faculty of Medicine, Lucian Blaga University of Sibiu, 2A L. Rebreanu St., 550169 Sibiu, Romania
3
Department of Medical Education, Medical Informatics and Biostatistics, Faculty of Medicine, Universitatea de Medicina si Farmacie Iuliu Hatieganu din Cluj-Napoca, 4 Louis Pasteur St., 400349 Cluj-Napoca, Romania
4
Department of Surgical Specialties, Orthopedics, traumatology and pediatric orthopedics, Faculty of Medicine, Universitatea de Medicina si Farmacie Iuliu Hatieganu din Cluj-Napoca, 46-50 Viilor St., 400347 Cluj-Napoca, Romania
*
Authors to whom correspondence should be addressed.
Sustainability 2020, 12(4), 1612; https://doi.org/10.3390/su12041612
Submission received: 13 January 2020
/
Revised: 16 February 2020
/
Accepted: 19 February 2020
/
Published: 21 February 2020
(This article belongs to the Special Issue Sustainability of Public Policy and Health Economics)
Abstract
:Measuring patient satisfaction of healthcare service quality represents a significant element of a healthcare’s system (HS) overall evaluation. It is the starting point for creating policies in national healthcare. The purpose of this paper was to evaluate Romanian patients’ perception and satisfaction of the quality of the national HS as a whole and of its components. Exploratory and descriptive research was used. Data were collected through face-to-face interviews with Romanian patients, based on a questionnaire. Out of the 2305 respondents, 83% used the Romanian HS in the past 12 months and 58% of the respondents did not trust the system. The accommodation, food, and other facilities of Romanian hospitals were perceived as being at a low level. One third of the respondents were unsatisfied and very unsatisfied with respect to the overall impression of the Romanian HS. In addition, our research found a statistically significant relationship between confidence in the HS, age, and gender, and also between the overall impression on the HS, age and income.
1. Introduction
Competition at a global level requires the implementation of sustainability, viewed as an important strategy in the service industry. Sustainability-related issues are of paramount importance and consequently the implementation of sustainability in one’s company has become a common desire [1,2]. When defining sustainable development, it is necessary to highlight how to make development meet present needs, while not influencing the capability of future generations to satisfy their own needs [3]. A stronger pressure has been exerted during the last decades upon organizations to focus not only on financial performance, but also on sustainability and accountability in business performance [4]. From this viewpoint, any company aims at focusing on sustainability, from environmental, social and economic performance perspectives [5].
The World Health Organization defined health not just as the absence of disease or infirmity but as being as being a state of well-being from a physical, mental and social point of view. Healthy people have a productive life from a social and economic standpoint [6,7]. Health is a fundamental right of every human being and is considered a value. Health professionals provide proactive services that aim to prevent, cure and rehabilitate one’s health [8].
The healthcare industry embraced sustainability in quite an aggressive manner. ANH Europe defined sustainable healthcare as “a complex system of interacting approaches to the restoration, management and optimization of human health that has an ecological base, that is environmentally, economically and socially viable indefinitely, that functions harmoniously both with the human body and the non-human environment, and which does not result in unfair or disproportionate impacts on any significant contributory element of the healthcare system” [9].
At present, Europe has to face an increase in ageing populations and patient demand, which put enormous pressure on healthcare services and budgets to deliver quality care in both an equitable and efficient manner [10]. Delivering sustainable and cost-effective healthcare has been placed on all EU Member States’ agendas, and in a top position. During the Informal Council in July 2013 in Vilnius, EU Member States agreed that one cannot discuss sustainability in health systems without considering the satisfaction of patients and of society [11].
Related to this aspect, the opinion of the patients with respect to their experiences in using healthcare services has turned into a significant instrument for assessing healthcare service quality and for the access improvement and monitoring [12,13]. The study of patient satisfaction began being interesting to social scientists when medical services became marketable, and concerns about “individual experience” increased [14,15]. The quality of healthcare delivery has the patient’s satisfaction as a key marker. In order for the healthcare system to function smoothly, this factor needs to be extensively studied [16,17]. If structural changes are to be implemented in HS, then satisfaction studies need to be used to provide at least basic information [18]. Among the consequences of patient satisfaction may be increased compliance to treatment and the improvement of patients’ quality of life of, but also the reduction of costs in the HS [19,20].
In recent years the focus on measuring patient satisfaction has increased. Such studies are regarded as valuable, even if they are made by official authorities (recognized international organizations or public institutions at the national level) or made by practitioners and researchers from medical, social, administrative and economic fields.
Satisfaction is mainly determined by patients’ characteristics, expectations and psychosocial features [21,22]. The most commonly chosen criteria for measuring satisfaction with HS are: health condition, hospital environment, service type (state or private), politeness of the staff, age, income, communication, employment status, gender, and education [23]. Research done by Hall and Dornan revealed that white, older male patients that are married and have a higher social status tend to be more satisfied [24]. Moreover, women, less educated people, and unemployed people estimate their own health condition as worse [23]. Healthcare services’ most relevant and desirable outcomes is the patient’s satisfaction [25,26,27]. The patient evaluates both the entire HS process as well as the consultation environment. [28]. Although some studies suggest that there is no statistically significant differences in overall evaluation between patients with different demographics, further research is recommended [28].
On the other hand, satisfied customers seems to build trusting relationship with healthcare providers, developing higher cooperation levels and higher health outcomes [23].
So far, there is a small number of studies evaluating patient satisfaction with the HS in Romania [29]. Both these and the Eurobarometer surveys conducted by EU institutions show that, compared to patients from other EU countries, Romanian patients have a lower level of satisfaction with the overall quality of healthcare [12,30]. According to other studies dedicated to Romanian HS, only a quarter of the Romanians make a positive assessment of the healthcare system [31], and, in general, most Romanians consider that hospital services quality is poor [12]. The main factors that affect patient satisfaction are the waiting time in emergency units; the confidence level in the medical staff and the amount of interaction with the patients; the professionalism of physicians and nurses and their ability to offer solutions for improving patients’ health [32,33] Different authors identified the causes of the low level of satisfaction with Romanian HS as being: the additional costs due to the poor financing of the HS; long waiting times due to the small number of specialists; accommodation facilities and conditions, and the attitude of medical or auxiliary personnel [29,30,34,35,36]. Francu and Francu found that Romanian patients mainly complain about accommodation, lack of medicines in hospitals, and the long waiting time in the ambulatory system [37].
It is generally agreed that measuring patients’ satisfaction represents a support in achieving sustainability of the HS together with other indicators. Most previous researches analyze and measure either patients’ satisfaction or patients’ confidence in the HS. The present study brings together and evaluates simultaneously the assessment of patients’ satisfaction and the confidence in the Romanian HS.
2. Materials and Methods
2.1. Design
The main focus of the current study is to better understand the perceptions and satisfaction of patients with the healthcare system in Romania.
For this study the following research objectives were formulated:
- identifying the patients’ level of confidence in the Romanian healthcare system;
- identifying the appreciation level of the conditions in the hospitals from Romania;
- identifying correlations between the main demographic variables of the respondents (independent variables) and two dependent variables: confidence in the HS and overall impression of the Romanian HS.
Descriptive research is commonly used to identify status, reflect a general overview, characterize and offer information about the actual phenomenon on the market representing a foundation for problem solving [38]. A descriptive cross-sectional study was conducted to identify the factors that influence patients’ satisfaction. The investigation was also used as a research method for data collection, in the form of face to face interviews with Romanian patients. Data were collected between 2017 and 2018.
2.2. Sample and Settings
The healthcare system is free of charge in Romania. Thus, all population can benefit from these services. Given the sensitivity of health data and the main purpose of our research—to evaluate the overall impression and confidence in the HS—our research considers to collect data from patients detached from a particular consultation environment, where the service was provided.
As the aim of a study is mainly exploratory and descriptive, the present research uses the snowball sampling technique [38,39,40]. This sampling technique offers practical advantages such as having the social networks of identified participants that can provide an ever-expanding set of potential contacts [39,40,41]. Sampling continues until data saturation [42]. Snowball sampling is a more formal methodology that allows inferences to be made about a population of individuals who have been difficult to count by descending methods such as household surveys [39,40,41].
Sample calculation using G*Power version 3.1.9.2 [43] for a small correlation (r < 0.1, using the Cohen rules) reveals a minimum sample size of 800 for a power ≥ 0.8 is considered acceptable.
The collection process resulted in a total of 2305 valid questionnaires that constitute the size of our research sample. For a sample size of 2305 respondents, the power is about 0.95.
The questionnaires were voluntarily implemented by second year students from the Faculty of Business, Babeș-Bolyai University, enrolled in a marketing course. They split the questionnaires out into groups of friends and families, considering various categories of respondents’ age and residence, who have accessed health services from different medical specialties [42].
The participation in the interview was voluntary and the perceptions and attitudes recorded during the interviews were used only for the purpose of the present paper. Participants were informed in the questionnaire briefing what are the research objectives and their rights to privacy and confidentiality and protection of personal data. Thus, the participants understood that by filling in the questionnaire they give their written consent to take part in the research and understand their rights. They were given the possibility to withdraw at any time during the filling in of the questionnaire. The present research collected only non-identifiable patient information. All data are anonymized.
2.3. Data Collection
Quality represents the customers’ overall impression of services [44]. Service quality assessment is a cognitive judgement [45]. The quality perception reflects an attitude considering comparison between expectations and received services [46]. Reichheld and Sasser stated that in order to obtain customer satisfaction it is important to fulfil the promise, generating confidence [47].
There is no universal measurement instrument for the overall impression with HS. That is why the satisfaction level with HS is determined indirectly considering its determinants.
An 18 questions questionnaire was designed and administered to get insights on the perceptions and attitudes of Romanian patients about the healthcare system. Structured (multiple choice and scale questions concerning importance) and unstructured questions (for occupation and residence) were used [38,41,48].
The questionnaire had two parts. The first part evaluates the main factors that influence patients’ level of satisfaction with the Romanian healthcare system. It contains the basic information for the research such as: the contact frequencies of the healthcare system, the confidence in the Romanian HS, the overall impression about the HS, the perceived quality of the medical services, the perceived attitude of the medical personnel etc. The second part has six other questions used to create the socio-demographic profile of the respondents (age, gender, education, occupation, monthly average income and residence of the respondents).
The questionnaire was pretested by business administration undergraduates before administering it to a representative sample. The aim was to find out if the questions are clear enough, clearly understood, in the right order and the provided answers are sufficient and detailed enough. The fill in time was also determined. The questionnaires were administered during face-to-face interviews performed by students. Students were trained on how to administer the questionnaire. The 4-h long training tackled aspects of implementation and data collection.
In this marketing research just part of the data collected were used.
Items were scored on a 5-point Likert scale (1—very poor, 5—very good) [38] evaluating the accommodation conditions, food, medical equipment, facilities/equipment, confidence in doctors and nurses, care quality provided and doctors and nurses attitudes. Table 1 contains descriptive statistics of the above scores and also the Cronbach’s Alpha coefficient [41,48].
The reliability analysis was evaluated through Cronbach’s Alpha coefficient [38,41,48]. The obtained values are over 0.8 thus highlighting the used scales had a good internal structure. The positive values point out the agreement of all the items with the scale, while the obtained values suggest a close relation of the items.
The external validity of the questionnaire is based on the analysis of the linear correlation coefficient [38,41,48]. Table 2 shows convergent relations between scales and items.
Correlation coefficients are statistically highly significant, ranging from acceptable to very good.
The question referring to occupation was eliminated from the study because the majority of the respondents confused the occupied position/function with the occupation. Also, with one exception, the respondents have an urban residence.
2.4. Data Analysis
Data was entered and managed with Microsoft Excel (Microsoft, Edmonton, KY, USA, 2010). SPSS (v 15) (IBM Corporation, Armonk, New York, NY, USA, 2006) was used for the statistical analysis. The qualitative data was described by using (absolute and relative) frequencies. The acceptable error threshold was α = 0.05 [38,41,48].
The relationships between qualitative data was evaluated by using the Chi-square test. The Kendall correlation coefficient for the ordinal qualitative variables with more than 25% equal values was calculated. In the case of gender the point biserial correlation coefficient was used. In order to estimate the correlation coefficients (with α = 0.05) significance tests were performed and for the empirical interpretation Colton rules were used [38,41,48].
2.5. Ethics
As this paper represents an evaluation of the perceptions and satisfaction of patients concerning the HS, considering that their participation in the study was entirely voluntary, patient information was not identifiable, and no medical research was conducted, ethical approval was not required.
3. Results
3.1. Background Characteristics
Table 3 presents the classification data of the respondents.
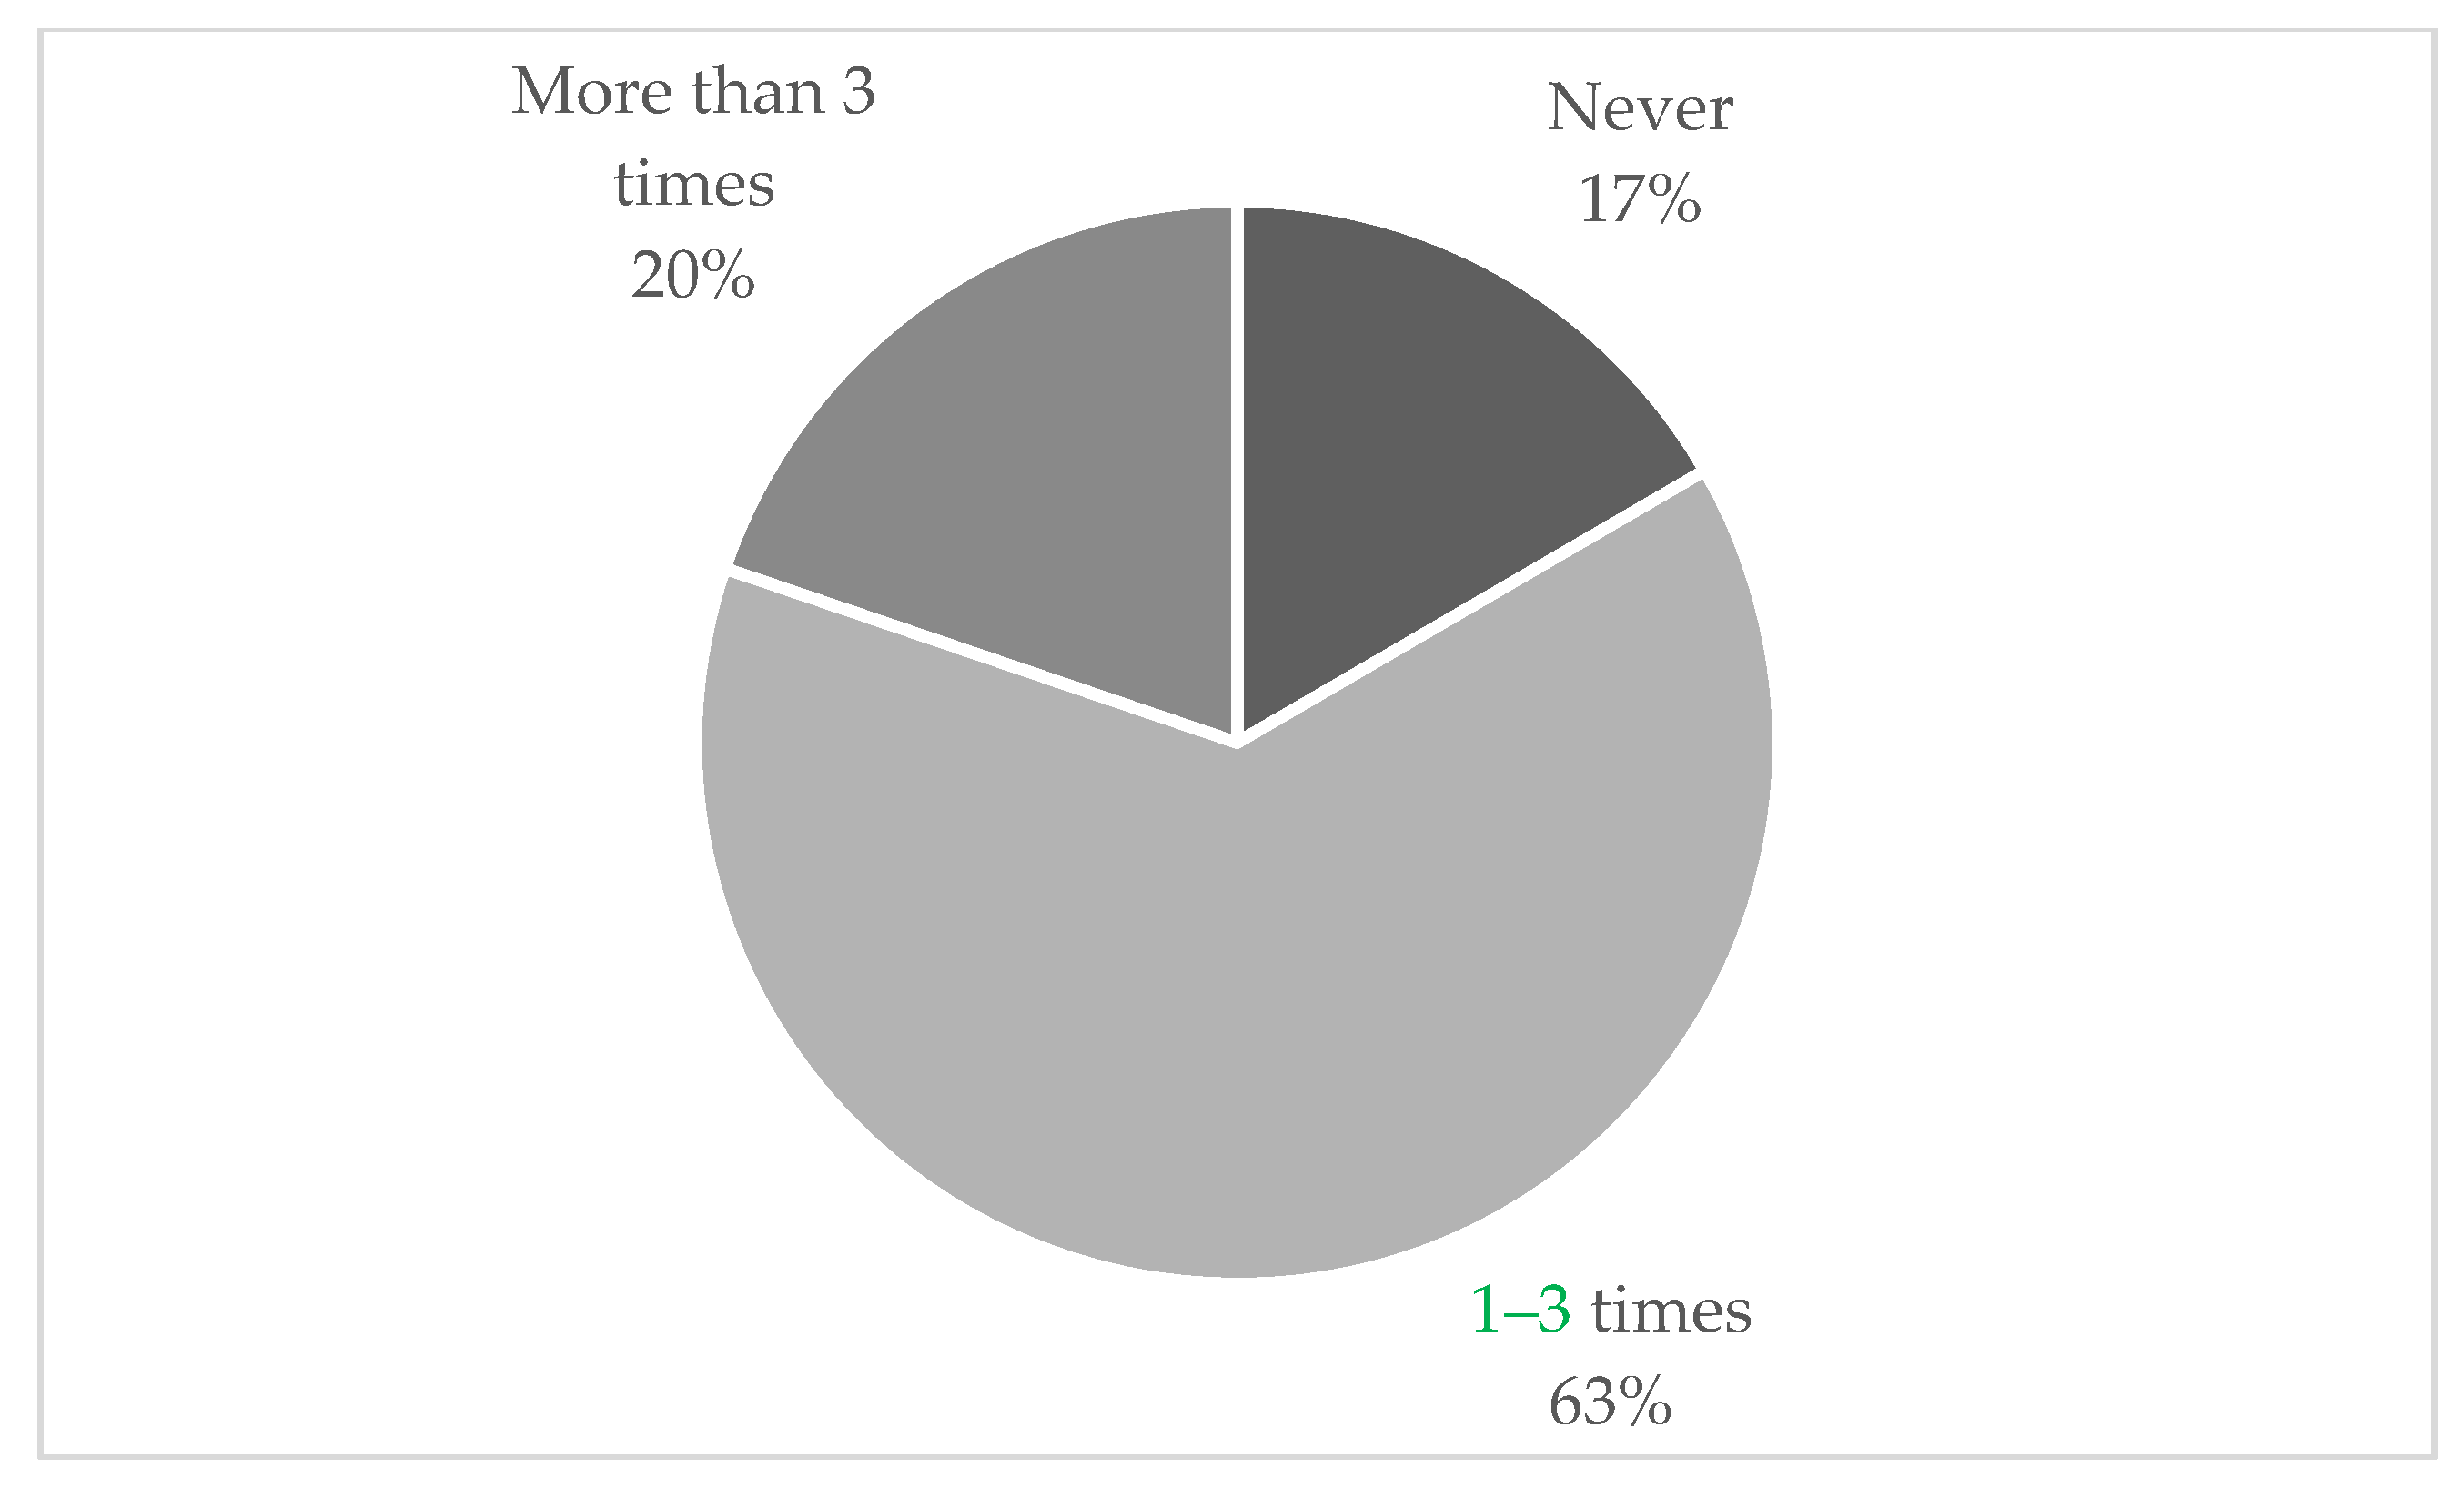
The study investigated how often the patients used the healthcare system. In the last 12 months, 63% of the sample used the Romanian HS 1–3 times and 20% used it more than 3 times. Almost a fifth of respondents did not use the health system in the last year (Figure 1).
3.2. Distribution on Confidence and Impression Regarding Romanian HS
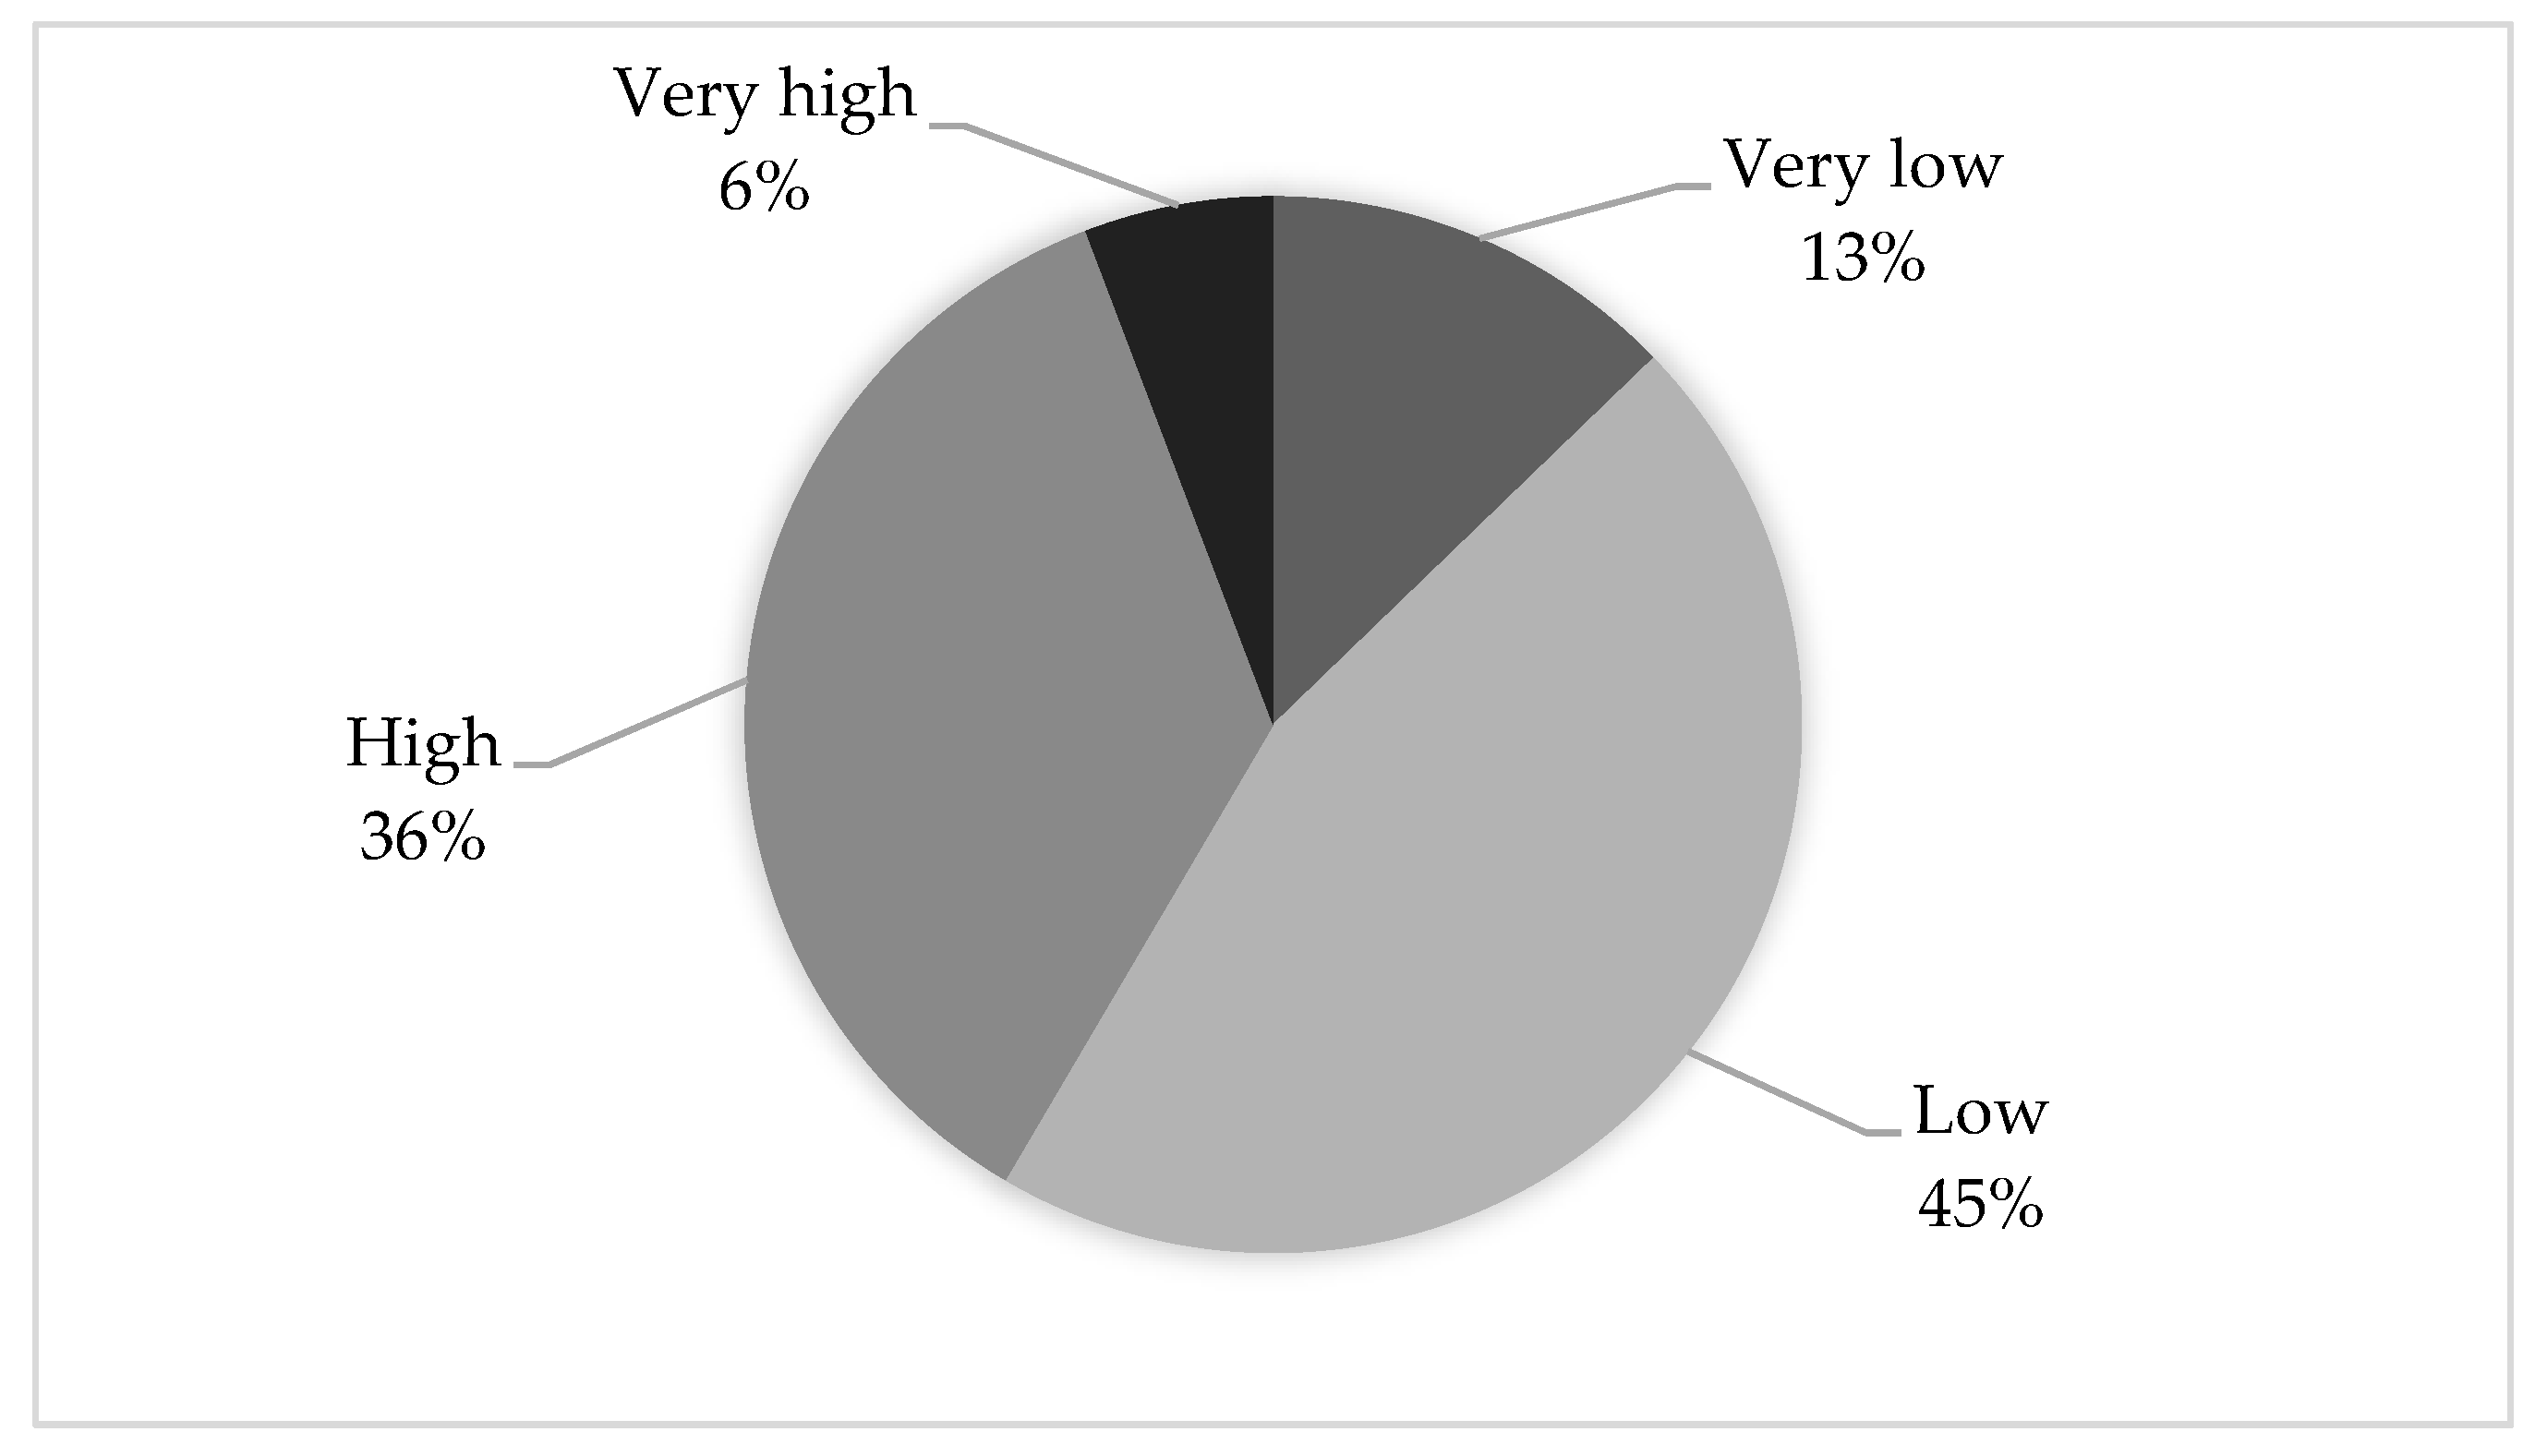
Although 58% of respondents do not trust the Romanian HS, interestingly, 36% have high confidence in it (Figure 2). Even if the percentage of those who trust the HS is lower compared to those who do not, greater attention should be paid to identifying and analyzing the reasons and factors that determine trust or mistrust.
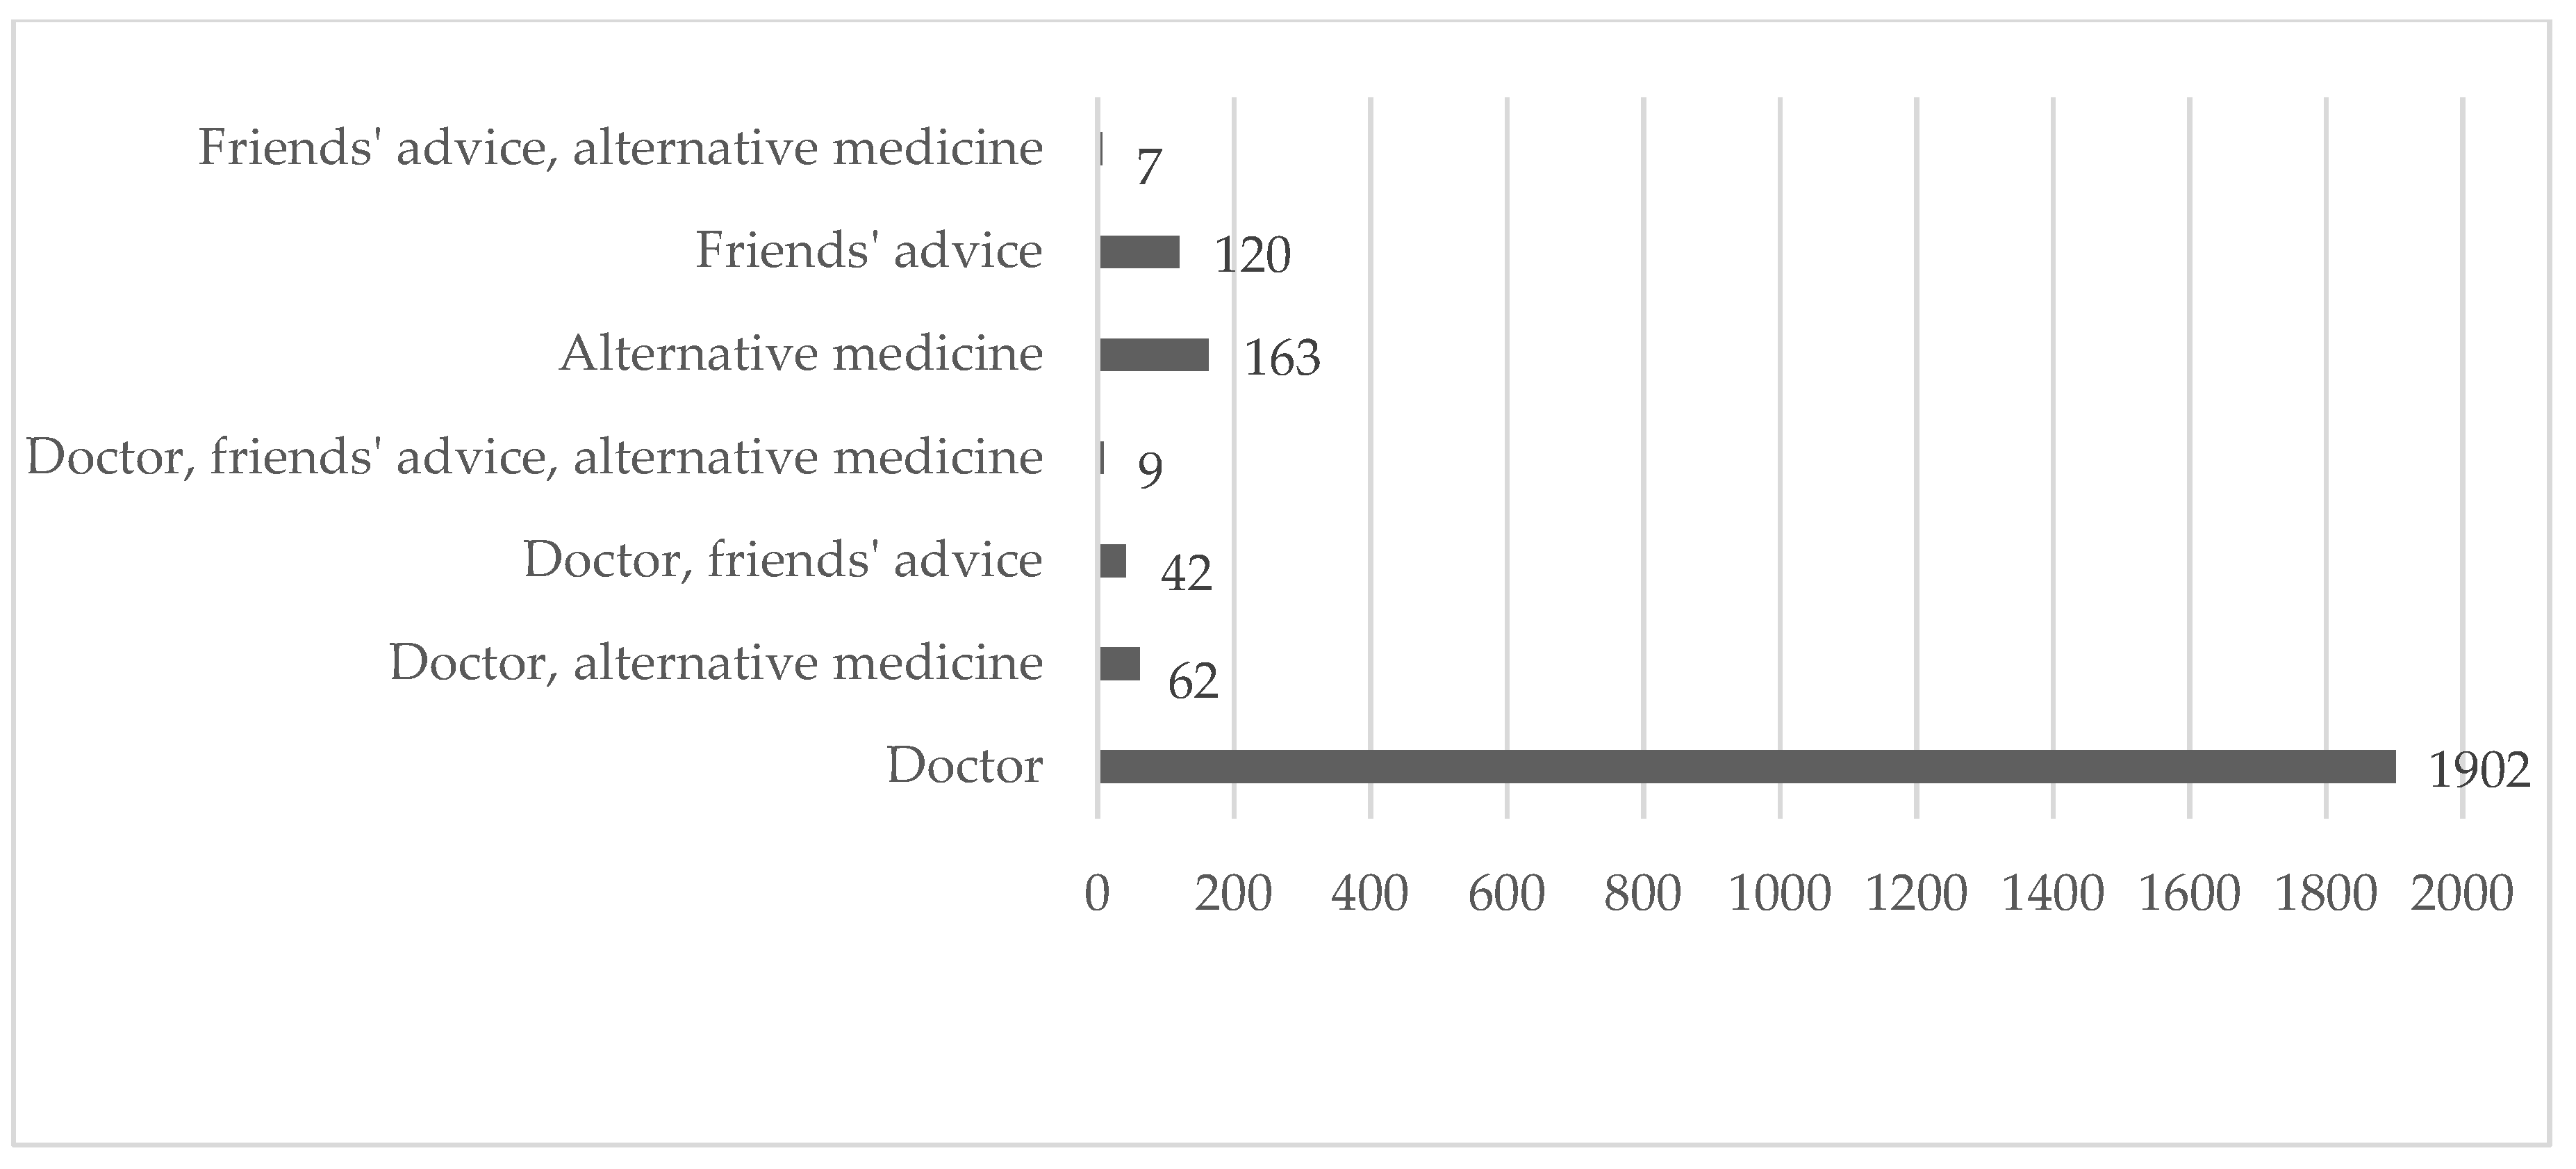
The majority of Romanian patients (82.51%) consider in the case of illness, only the physicians’ opinion. The research shows the importance of specialist opinion compared to other sources of information and influence, such as alternative medicine (7.07%) and friends’ advice (5.2%) (Figure 3). The majority (almost 80%) of respondents that consider opinions other than their doctor’s seem to have a low and very low level of confidence in the Romanian HS.
The majority (almost 80%) of respondents that consider opinions other than their doctor’s seem to have a low and very low level of confidence in the Romanian HS.
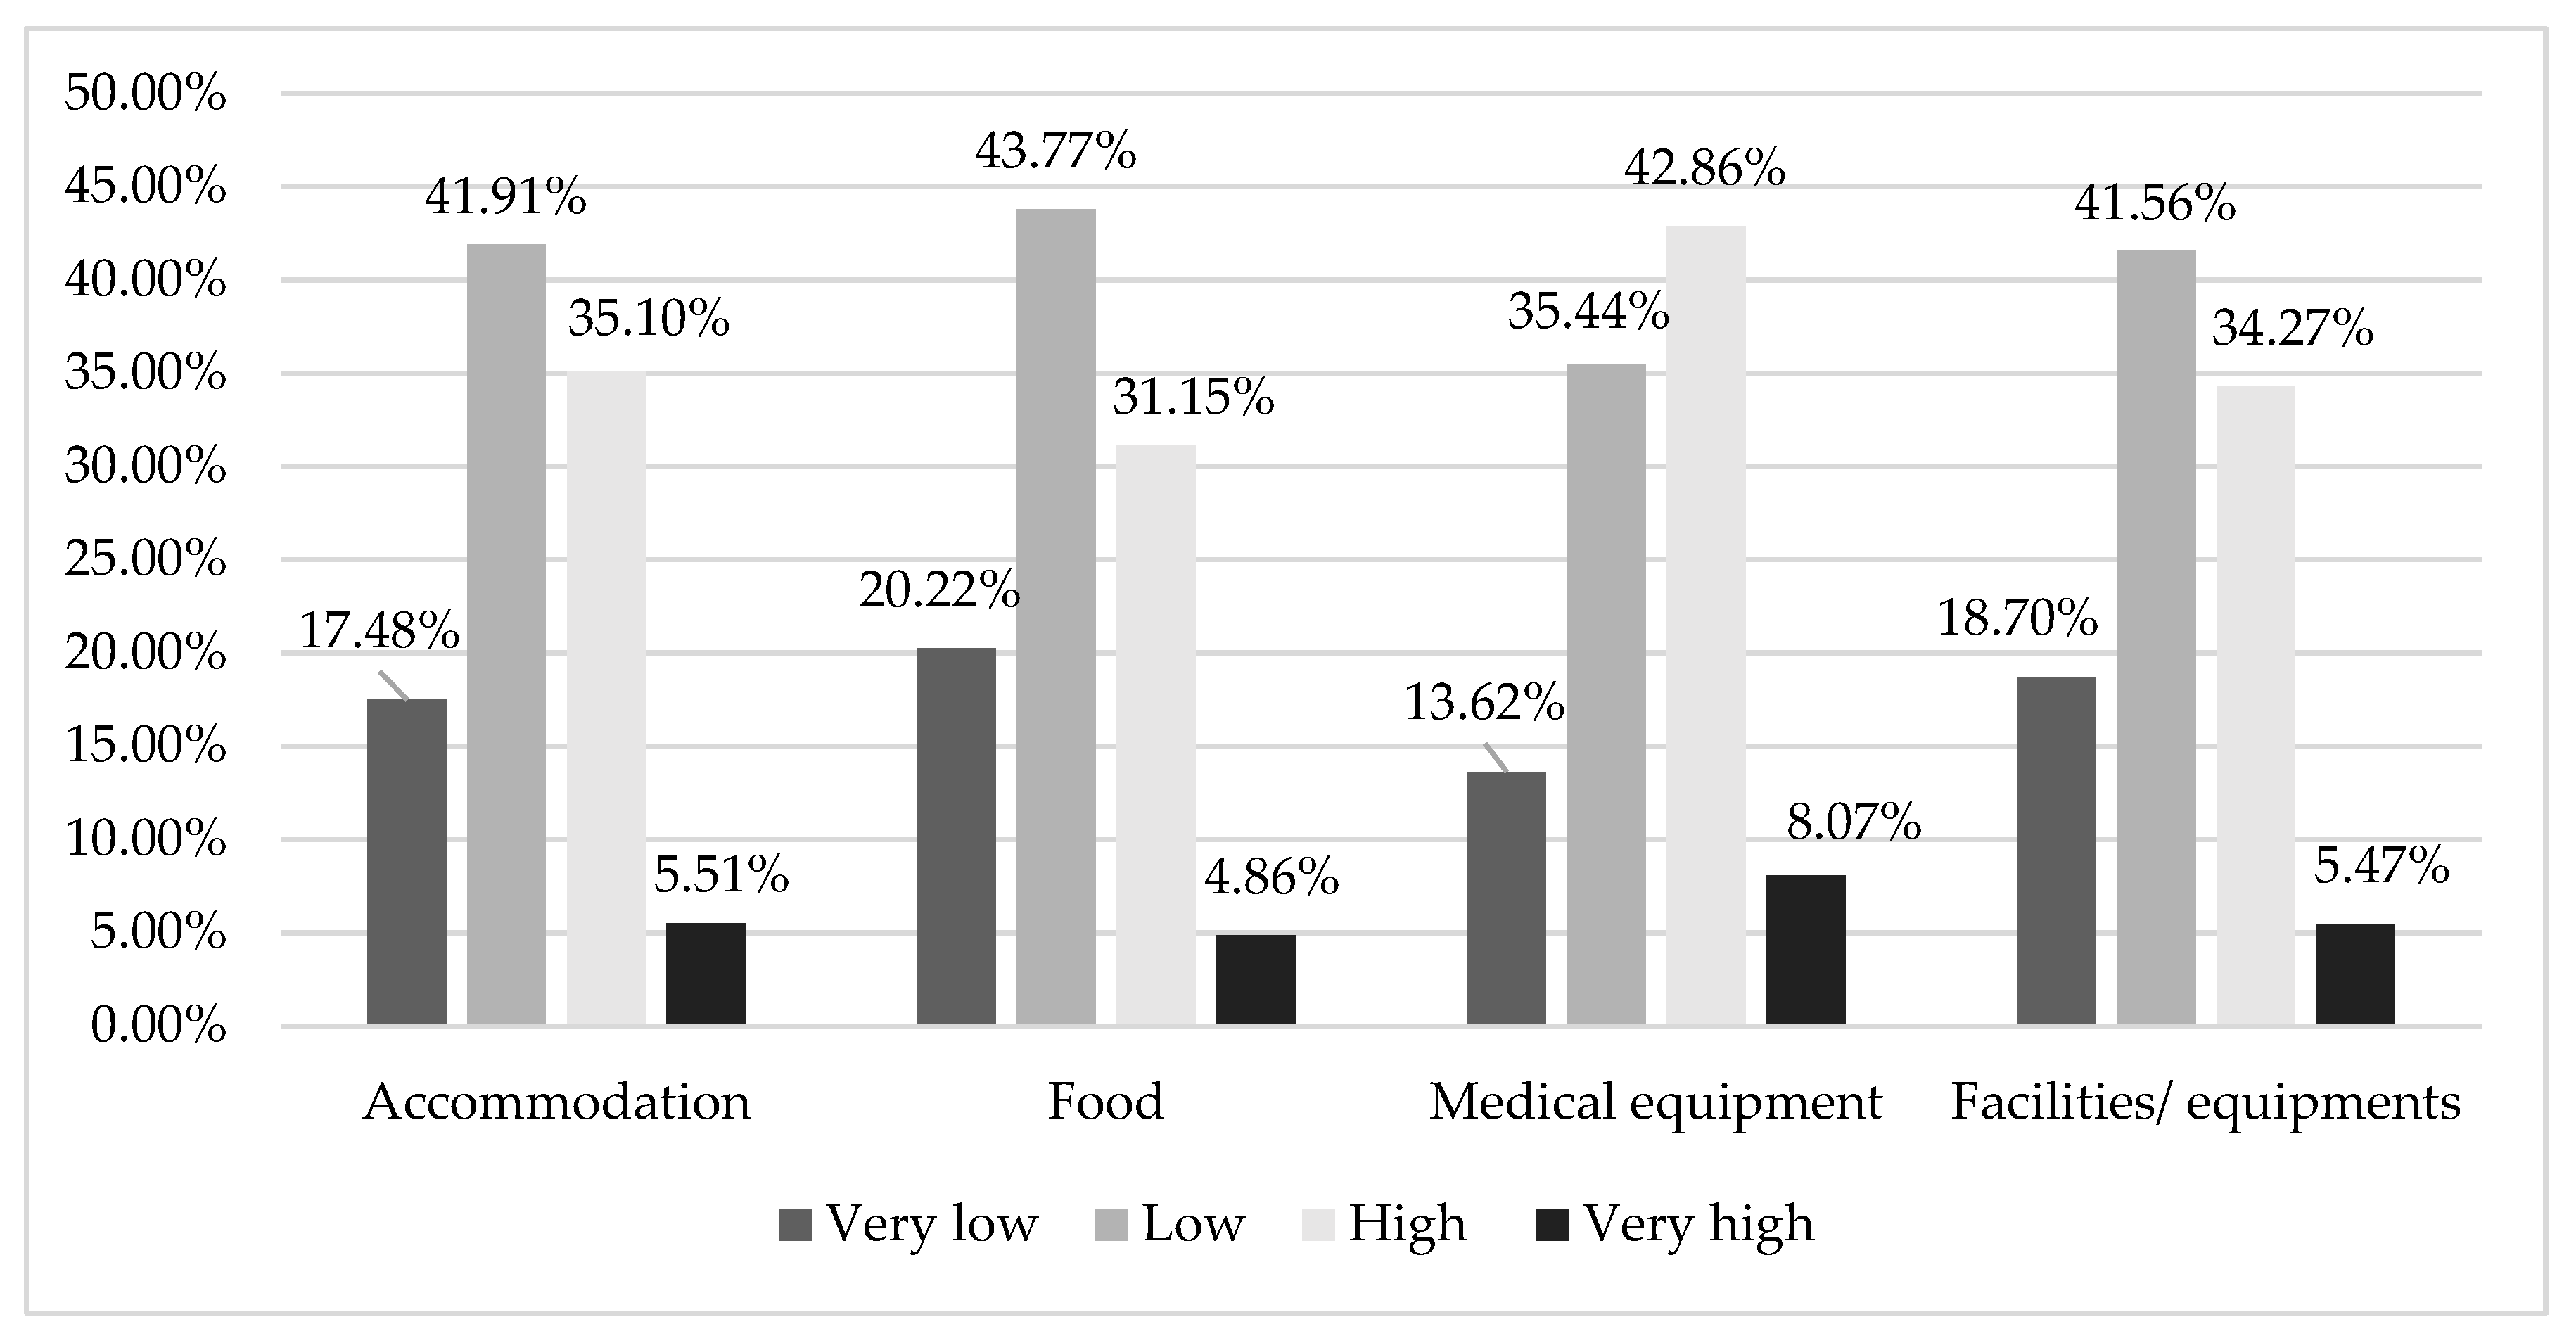
The research also investigated the opinion of people regarding complementary services to the healthcare system. Regarding the conditions and facilities offered in Romanian hospitals most respondents appreciate the accommodation, food, and other facilities in hospitals as being poor, but the majority appreciate the medical equipment (Figure 4). Seventy-three point nine-nine percent are not satisfied with the food, 60.26% with the facilities, 59.39% are not satisfied with the accommodation and 49.08% withe the medical equipment offered by the Romanian HS.
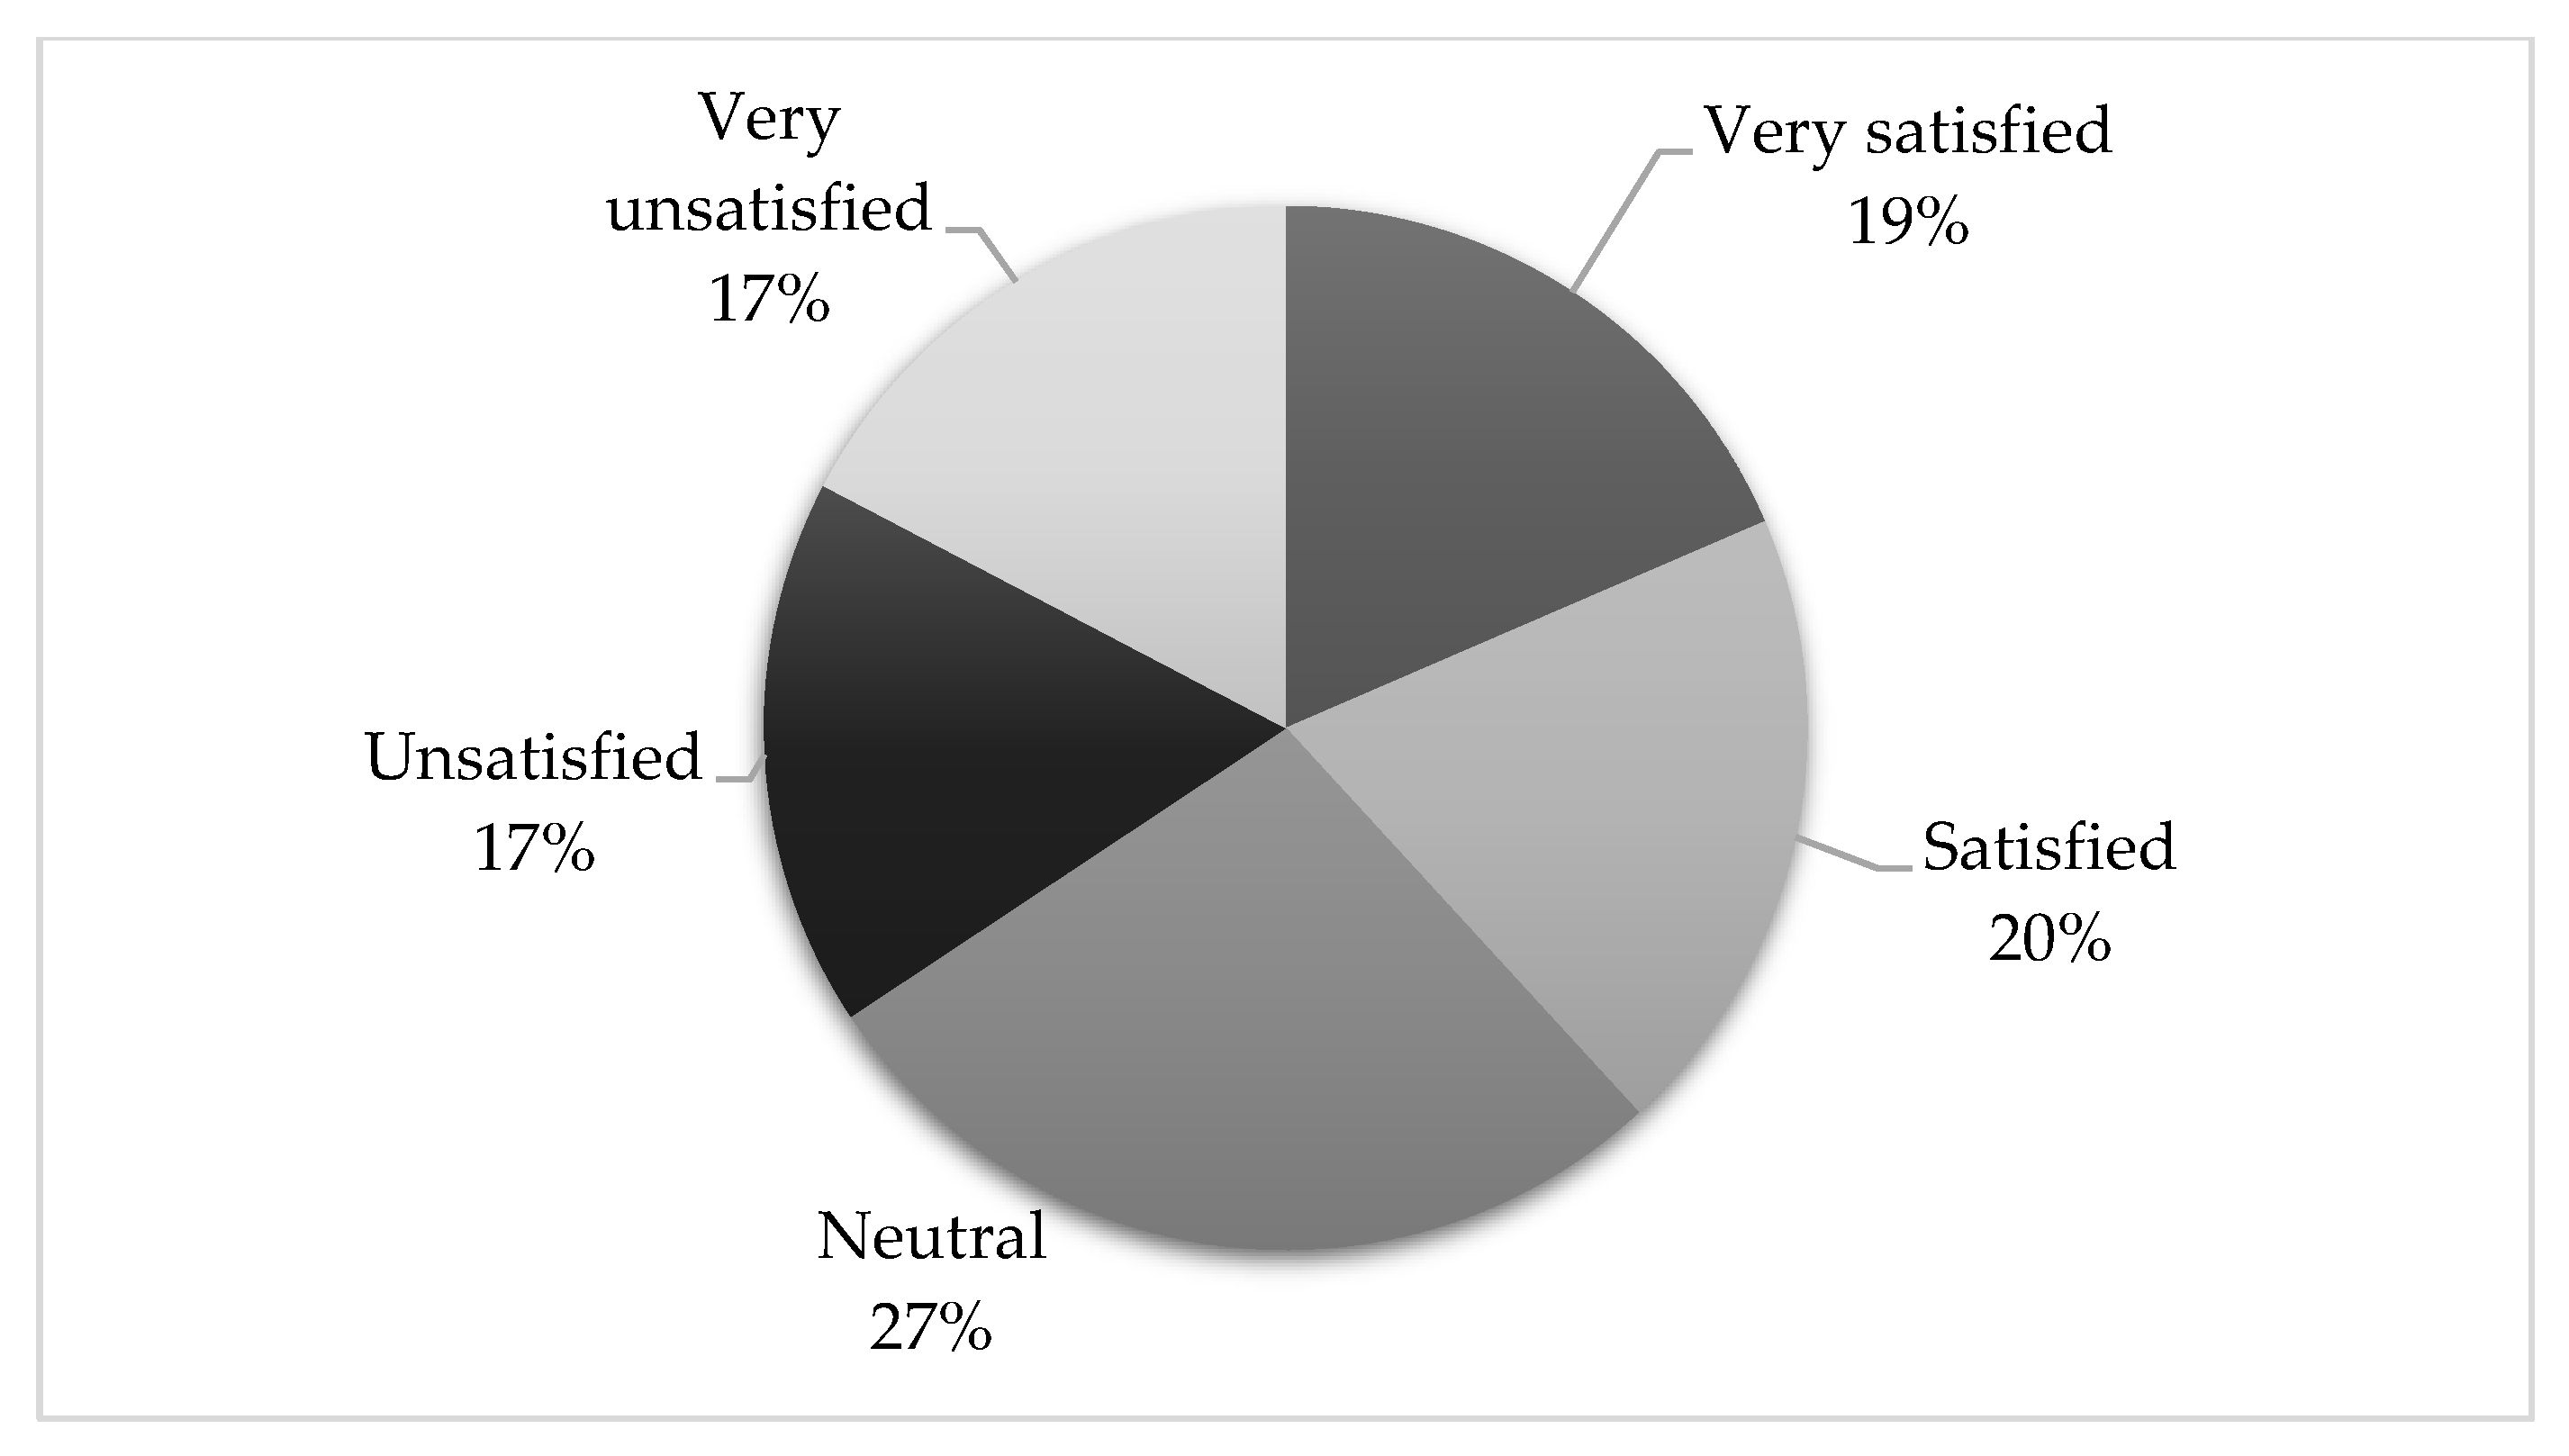
Thirty-nine percent of respondents are satisfied and very satisfied with the overall impression of the Romanian HS, while 34% are unsatisfied and very unsatisfied (Figure 5). Most respondents did not have an opinion about the healthcare system or did not wish to express it. This result highlights the sensitivity of the subject or the indifference and lack of confidence in the Romanian HS of the respondents.
3.3. Associations between Different Analyzed Variables
Using the Kendall correlation coefficient, point biserial correlation coefficient and Chi-Square test, the study investigated various associations between analyzed variables. The results are presented in Table 4 and Table 5.
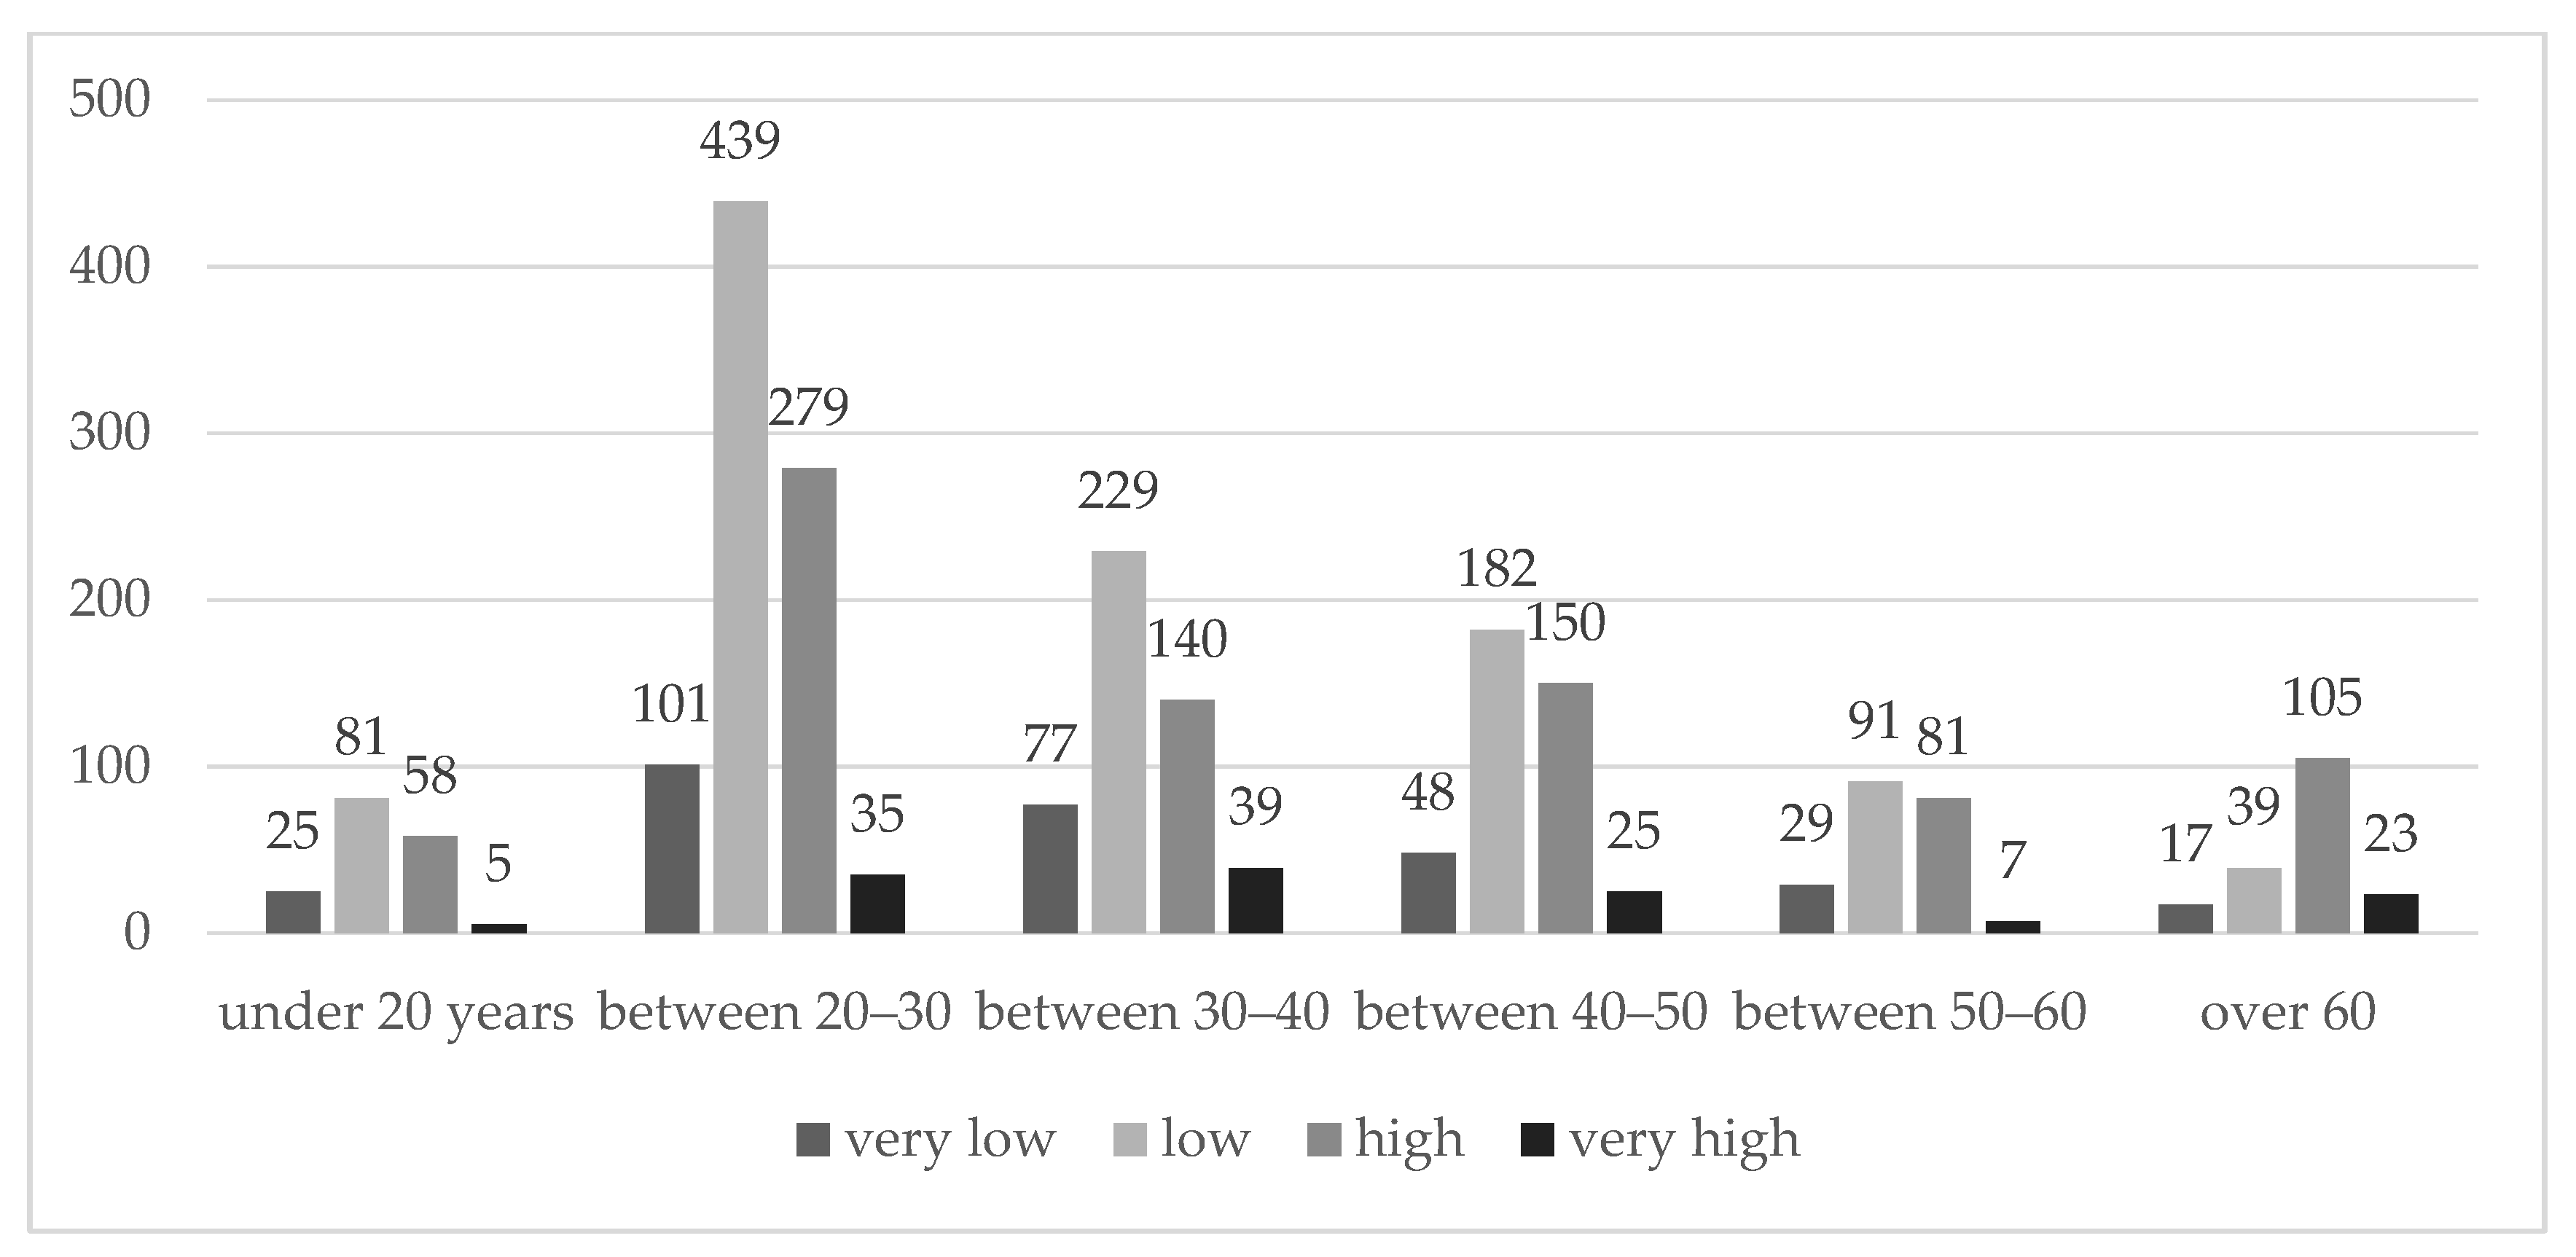
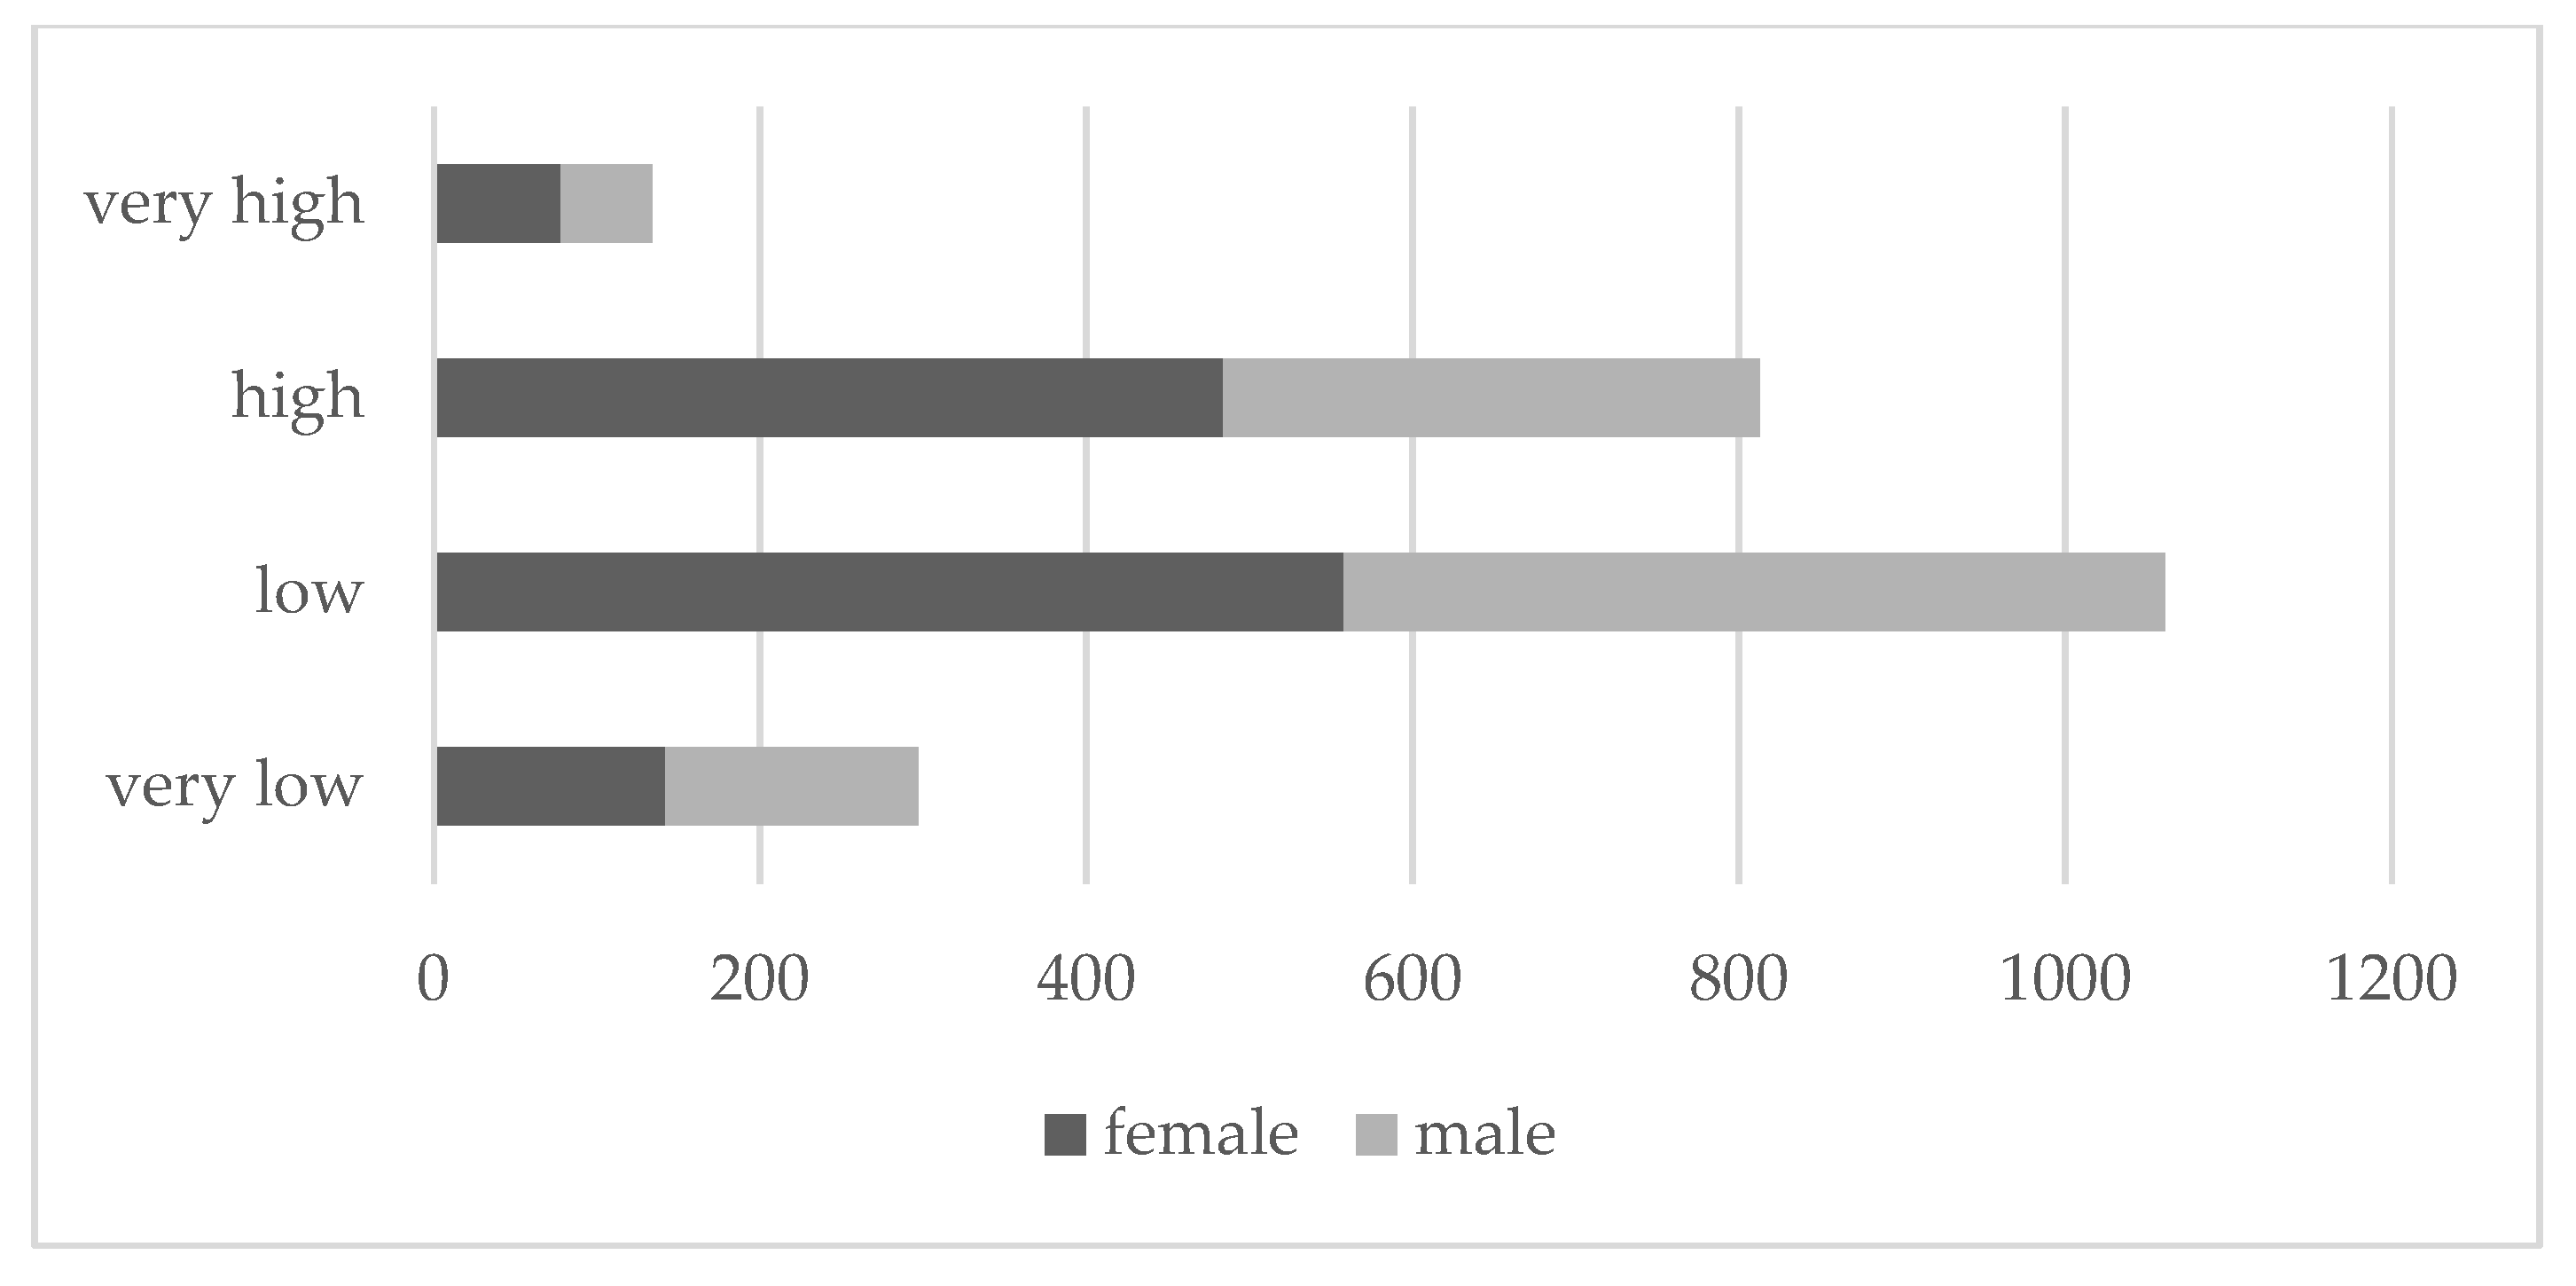
The correlations between the confidence in the HS and the variables in Table 4 are weak even though the ones with age and gender are statistically significant. The research reveals a statistically significant relationship between confidence in the healthcare system and the age (p < 0.001, Chi-Square-24 df) (Figure 6), and gender (p < 0.001, Chi-Square-8 df) (Figure 7), a negative not statistically significant relationship between confidence and education and a negative not statistically significant relationship between confidence and income.
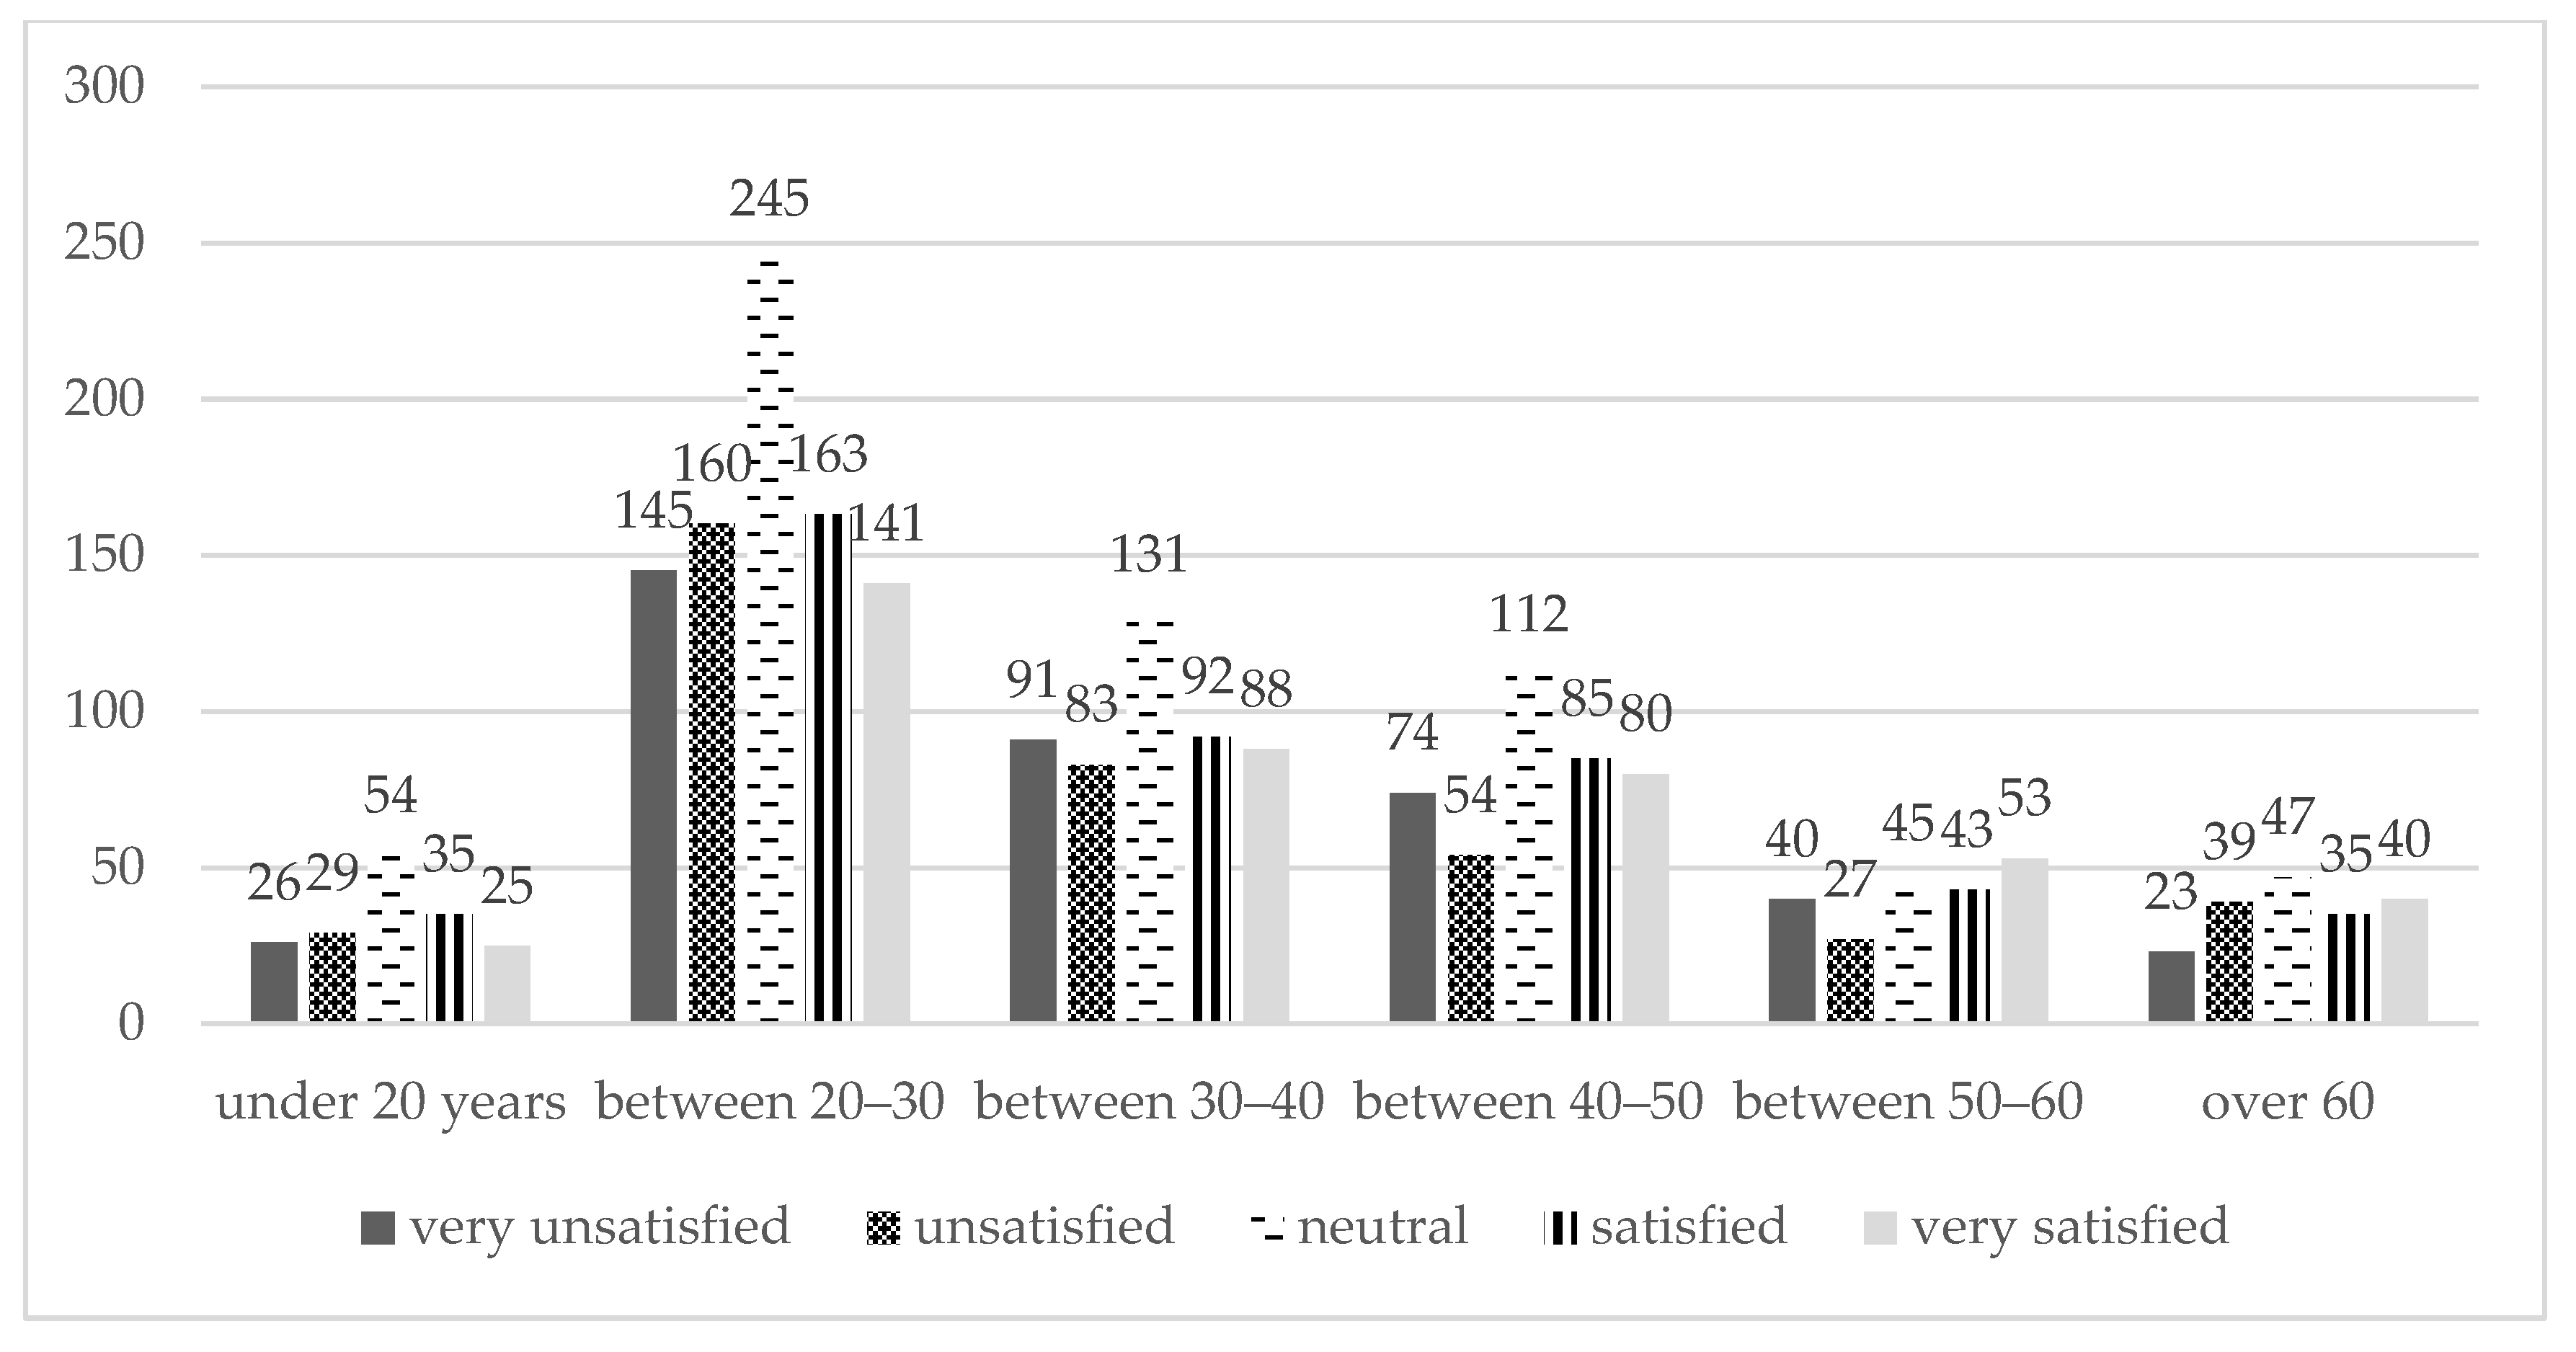
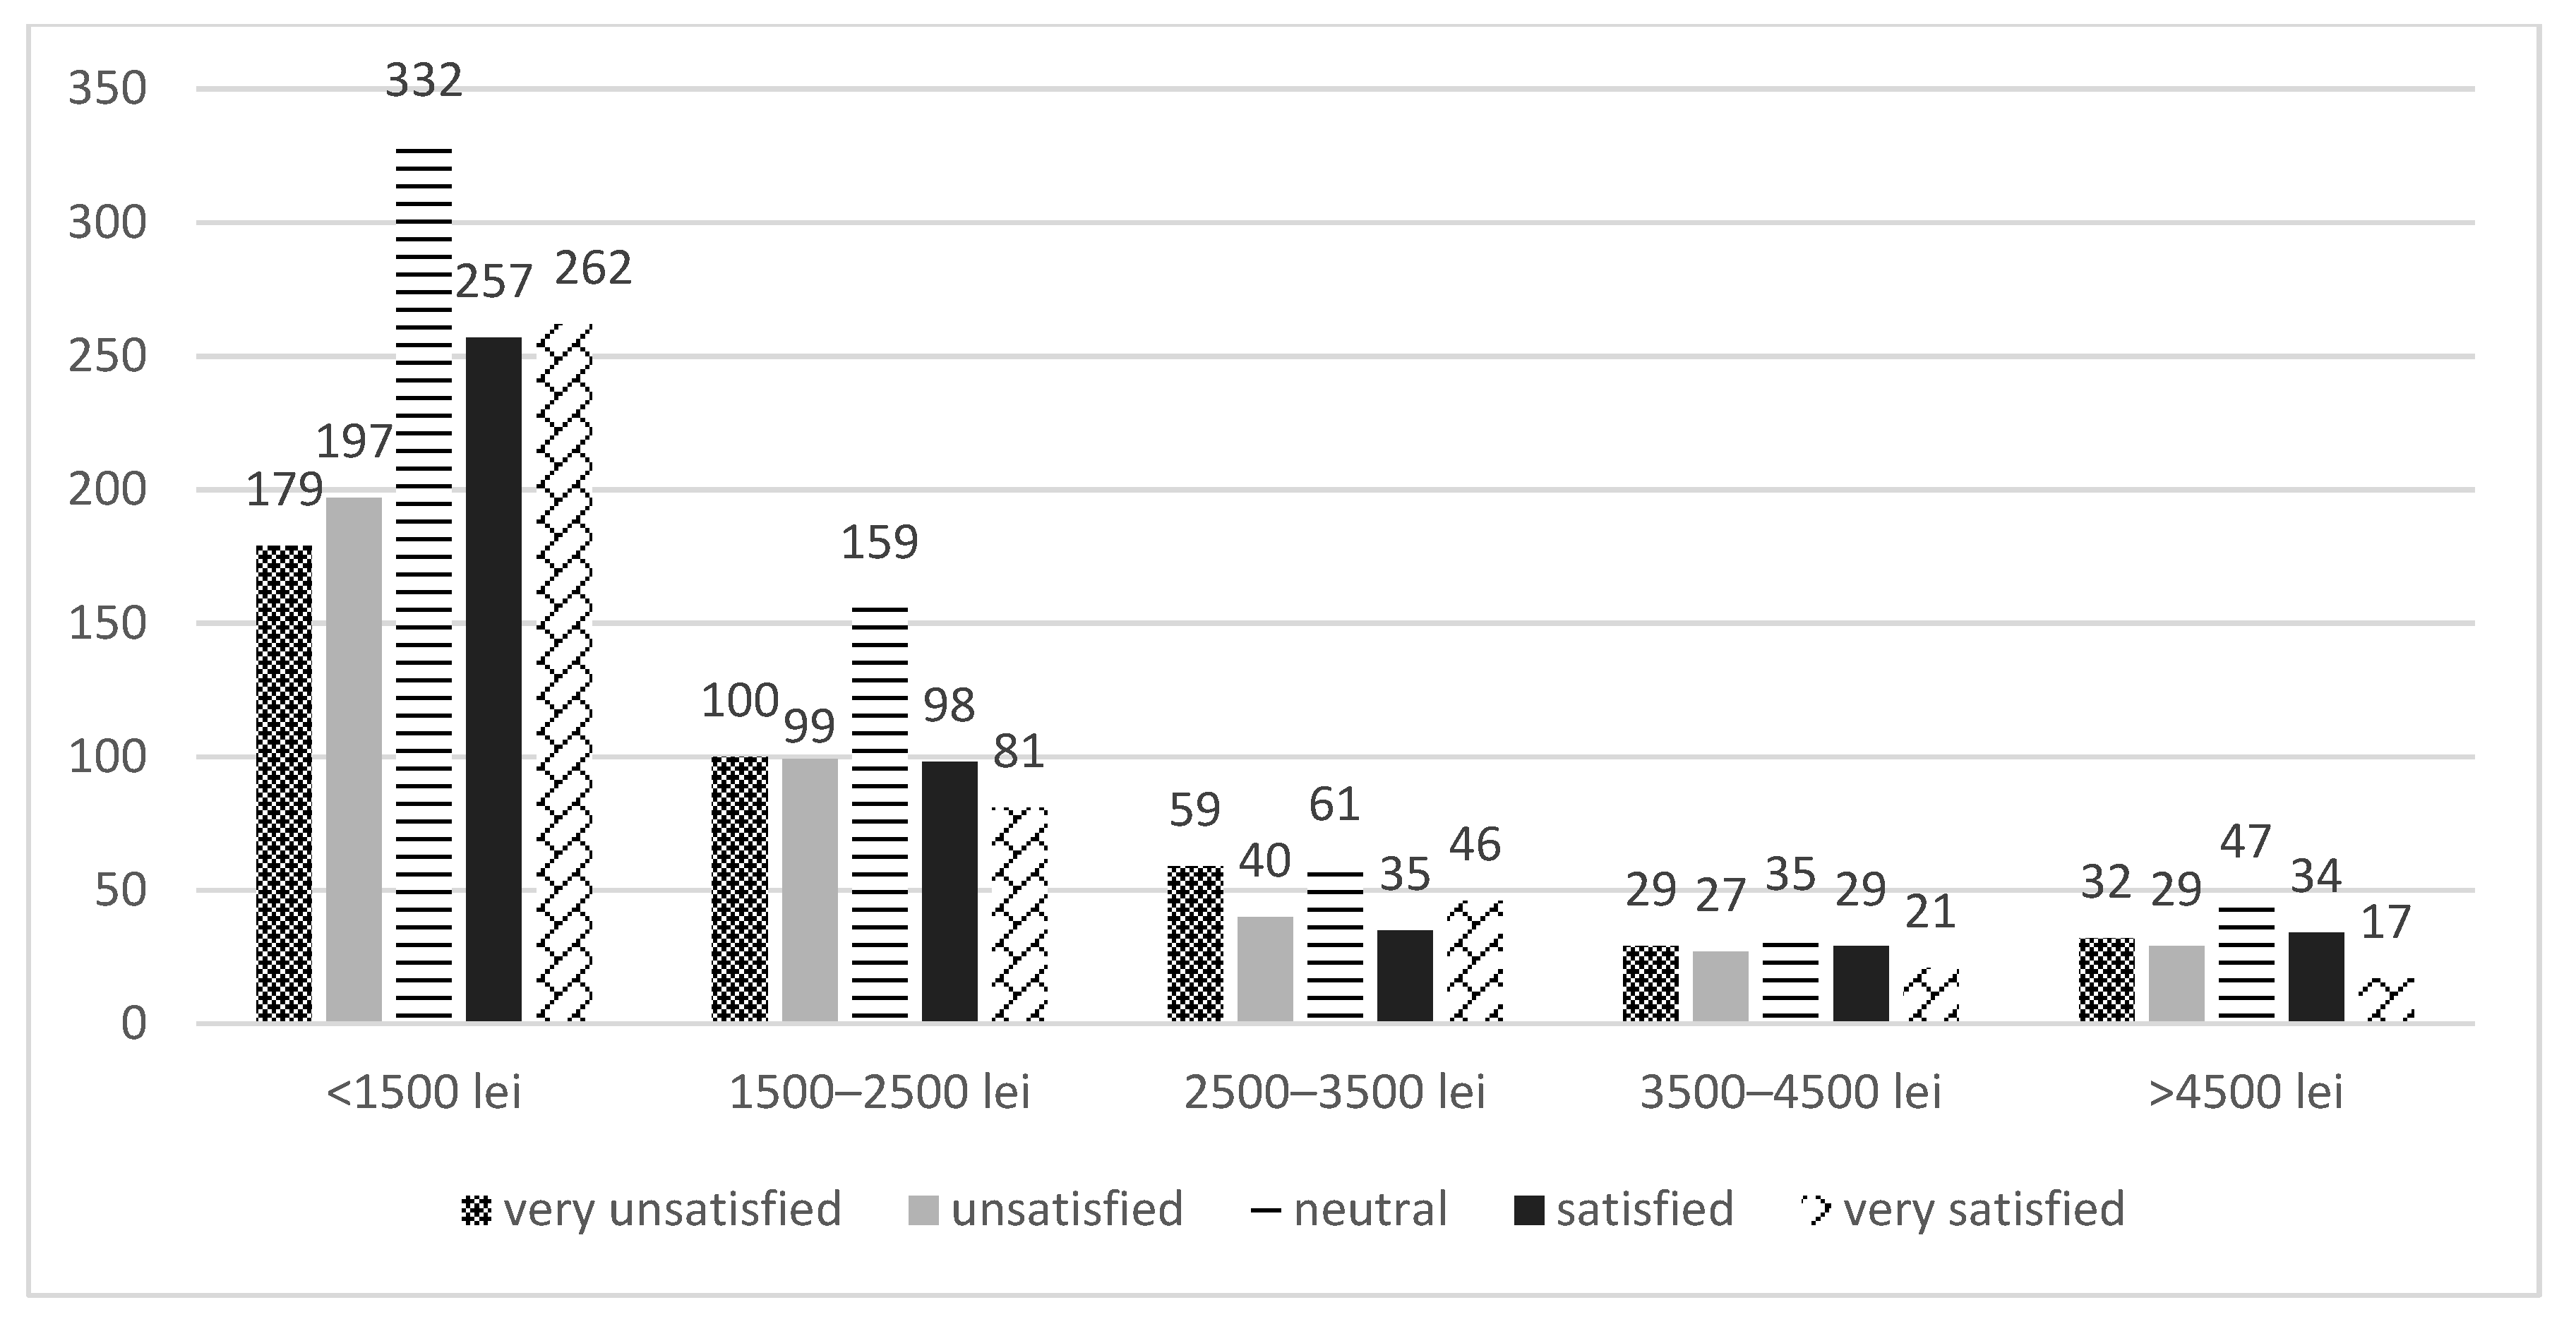
Considering the overall perception (Table 5), the study demonstrated a statistically significant relationship between the overall impression of the Romanian HS and age (p = 0.023, Chi-Square-30 df) (Figure 8), no relationship between impression and gender (p = 0.58, Chi-Square-10 df), no relation between impression and education (p = 0.116, Chi-Square-25 df) and a negative statistically significant relationship between overall impression and income (p = 0 < 0.001, Chi-Square-20 df) (Figure 9).
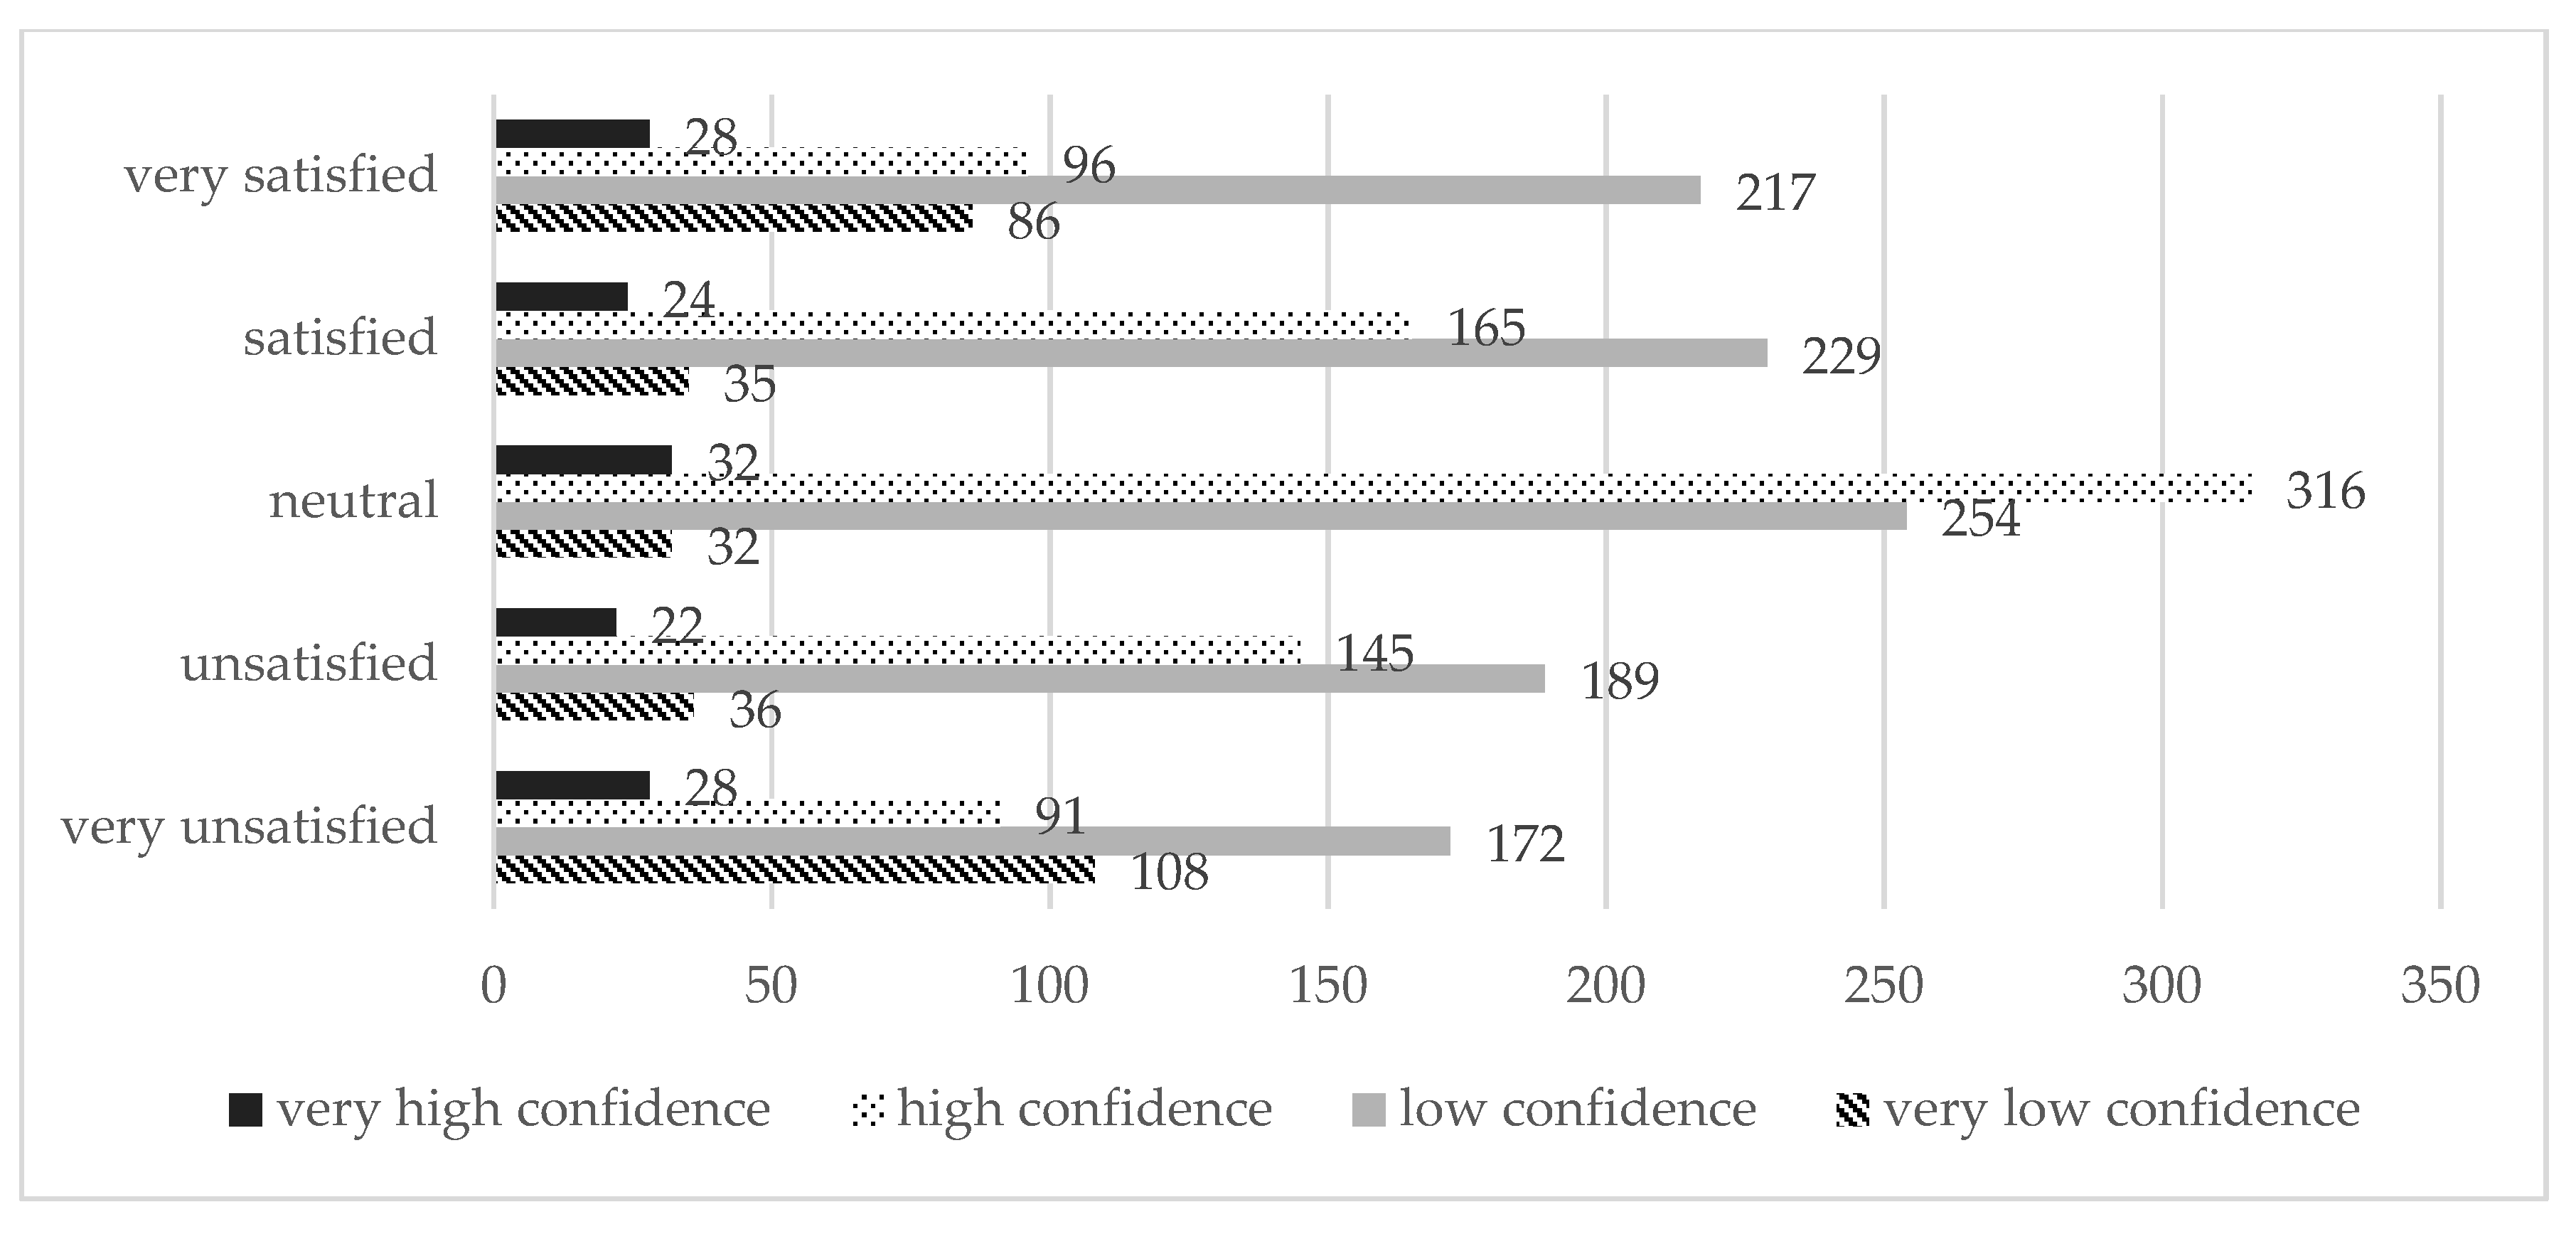
Also, the majority of those respondents that are neutral with the healthcare system have high confidence in it, but most with low confidence are either satisfied and very satisfied or unsatisfied and very unsatisfied. The study demonstrated a strong statistically significant relationship between overall perception and confidence (p < 0.001, Chi-Square-12 df) (Figure 10).
4. Discussion
Several studies on patients’ satisfaction and the increasing interest in patients’ experience among social scientists [49] began when medicine became marketable. In this respect, many studies at the national and international level are made by official authorities and also by researchers.
Starting from a pilot study, a more in-depth investigation was performed on a statistically representative sample in order to identify the perceptions and behaviors of the Romanian patients concerning the healthcare system.
Information about demographic characteristics was correlated with how often patients contacted the Romanian healthcare system in the last year. For example, 9.93% from those under 40 years old never used the HS. Regarding the gender of the investigated respondents, 35.14% of the feminine sample contacted the system 1–3 times. With respect to the income, the study reveals that only 2.55% of the respondents with higher level of income (over 3500 lei) used the healthcare system more than 3 times.
The study reveals that in the last 12 months, 17% of the sample never used the Romanian HS. Sixty-three percent (63%) of the sample used the healthcare system more than once and 58% of the respondents do not have confidence in the HS. An interesting and useful result of the study can be considered the high confidence in the system (36% of the investigated population), that majority used the HS more than once.
Different studies showed that the healthcare outcome depends on patients’ satisfaction [50,51]. The satisfaction is improved by the attitude and behaviour of medical staff [52]. Besciu shows that over 72% of the Romanian patients are satisfied with the attention paid by the doctor, and over 60% of the interviewees trust the doctor to whom they referred [53].
Patients’ adherence to treatment is associated to a higher degree of satisfaction and also to confidence in medical care [54,55]. The interest and involvement of medical staff lead to increasing patients’ confidence in the HS [56]. According to our results, the majority of the patients (82.51%) take into account the doctors’ opinion when ill. The study reveals the importance of the specialists’ opinion compared to other sources of information and influence such as alternative medicine (7.07%) and friends’ advice (5.2%).
Regarding the level of satisfaction, our study reveals that only a little over a third of our respondents are satisfied (20%) or very satisfied (19%) by the Romanian HS. In a study conducted in China, in 14 public hospitals, it is showed that patients’ satisfaction level is high (Cronbach’s alpha was 0.949) [28]. In another study developed in Bangladesh a high level of satisfaction with health services was found (score 4.17 from 5.0, Cronbach’s alpha was 0.93) [57].
In accordance with another study realized in Romania, our research, reveals that the most satisfied patients are: older, with a low level of education or with low incomes [58].
Popa, Druguș, Leasu, et al. noticed [29], our study reveals that the conditions and facilities offered in the Romanian hospitals are perceived at a low level concerning the accommodation, food and other facilities. Only medical equipment was positively appreciated by the majority. Opposite to our study, Meng, Li, Zhang, et al. showed that the service organization and facilities is placed on the second place out of five (the Cronbach’s alpha of service organization and facilities was 0.878) [28]. Like our results, another study regarding Romanian patients’ satisfaction showed that the quality of attention and care increase the satisfaction level even the healthcare resources are less [31,33,58]. The differences between the group of satisfied and dissatisfied investigated respondents in respect with the overall impression of the Romanian HS are not revealing, even if more are satisfied. Also, a significant percentage (27%) are indifferent to Romanian HS.
Our study reveal that more than half (58%) of the respondents are not confident with the Romanian HS, but this result is better compared to previous study of Sarbu and Zanfir that highlighted a percentage of 93.85 as unconfident Romanian respondents [59].
The study demonstrates a strong statistically significant relationship between confidence in the healthcare system and the age and gender of the respondents. The confidence in Romanian HS increases with age. Women have greater confidence than men in Romanian HS. Also, taking into account the overall impression, the research demonstrated a statistically significant relationship between the overall perception of the Romanian HS and age and a negative statistically significant relationship between overall impression and patients’ income. Romanian patients are more satisfied with the HS as they age and as income level increases, they become slightly dissatisfied.
5. Conclusions
One important strategy in the service industry that gives a boost to global competition in the field is sustainability. Today, the healthcare industry has begun embracing sustainability more aggressively. Patients’ satisfaction in using healthcare services becomes an important tool in devising healthcare service quality, access improvement and monitoring.
The present study regarding patients’ satisfaction in the context of ensuring a Romanian sustainable healthcare system has several limitations. The most important one is related to sample consistency. Although the results cannot be generalized to the entire population, they offer important insights into the perceptions of Romanian patients. It can be noticed that the respondents are part of the business administration student’s social network, almost all from urban areas, not always representative of the Romanian population. Another important limitation refers to the fact that 17% of the respondents have set opinions about the healthcare system in Romania, although they did not used it in the last 12 months. The limits above can become a topic of further research. Given that recently the salaries of HS employees in Romania have increased considerably and that large investments have been made in equipment in most hospitals, it would be interesting to replicate the study to analyze whether patients’ perceptions have changed. The present research offers a support in understanding, evaluating and improving the services offered by the Romanian healthcare system. Our results can bring a valuable contribution to further studies on patients’ satisfaction that can be improved by a more in-depth approach, but also offer practical implications and managerial recommendations especially for authorities and related institutions and private businesses in their planning for further development. Like other previous studies highlighted [53], the following recommendations that can improve the level of patient satisfaction could be formulated for the policy-makers: increasing the financing of the HS, including the level of salaries of doctors, the development of medical emergency structures, as well as the professionalization of the management of health units.
Author Contributions
These authors contributed equally to this work. Conceptualization, S.A.C., D.C.; methodology, S.A.C., M.B., M.V.; software, C.F., M.V.; validation, S.A.C., M.B., M.V.; formal analysis, S.A.C.; investigation, S.A.C., M.B., C.F., C.M.; resources, C.F.; data curation, S.A.C., D.C.; writing—original draft preparation, S.A.C., C.F., C.M.; writing—review and editing, S.A.C., M.B., C.F., C.M., M.V., D.C.; visualization, S.A.C., M.V.; supervision, D.C.; All authors have read and agreed to the published version of the manuscript.
Funding
This research received no external funding.
Acknowledgments
The authors thank all the participants for their cooperation in data collection and in preparation of this manuscript.
Conflicts of Interest
The authors declare no conflict of interest. The funders had no role in the design of the study; in the collection, analyses, or interpretation of data; in the writing of the manuscript, or in the decision to publish the results.
References
- Hannon, A.; Callaghan, E.G. Definitions and organizational practice of sustainability in the for-profit sector of Nova Scotia. J. Clean. Prod. 2011, 19, 877–884. [Google Scholar] [CrossRef]
- Smith, M.E.F. Sustainable healthcare: A path to sustainability. Master’s Thesis, Lund University, Lund, Sweden, June 2012. [Google Scholar]
- Brundtland, G.H. Our Common Future: Report of the world Commission in Environment and Development; Oxford University Press: Oxford, UK, 1987. [Google Scholar]
- Lee, K.H.; Farzipoor Saen, R. Measuring corporate sustainability management: A data envelopment analysis approach. Int. J. Prod. Econ. 2012, 140, 219–226. [Google Scholar] [CrossRef]
- Lawrence, G. Indicators for Sustainable Development. In The Way Forward: Beyond Agenda 21; Dodds, F., Ed.; Earthscan Publications Ltd.: London, UK, 1997; pp. 179–189. [Google Scholar]
- WHO Constitution of the World Health Organization (Preamble). Available online: https://www.who.int/governance/eb/who_constitution_en.pdf (accessed on 20 June 2015).
- WHO Declaration of Alma-Ata. Available online: http://www.euro.who.int/en/publications/policy-documents/declaration-of-alma-ata,-1978 (accessed on 20 June 2015).
- Last, J.M. A Dictionary of Epidemiology, 4th ed.; Oxford University Press: Oxford, UK, 2000. [Google Scholar]
- Alliance of Natural Health. Available online: https://www.anhinternational.org/ (accessed on 19 February 2020).
- Morgovan, C.; Cosma, S.; Burta, C.; Ghibu, S.; Polinicencu, C.; Vasilescu, D. Measures to reduce the effects of the economic and financial crisis in pharmaceutical companies. Farmacia 2010, 58, 400–407. [Google Scholar]
- Ministry of Health of the Republic of Lithuania. Speech by Vytenis Povilas Andriukaitis, Minister of Health, at the European Parliament, Environment, Public Health and Food Safety Committee. Available online: https://sam.lrv.lt/en/news/speech-by-vytenis-povilas-andriukaitis-minister-of-health-at-the-european-parliament-environment-public-health-and-food-safety-committee (accessed on 19 February 2020).
- Jankauskienė, D.; Jankauskaitė, I. Access and quality of health care system by opinion of patients in ten European countries. Manag. Health 2011, 15, 31–39. [Google Scholar]
- Mendoza Aldana, J.; Piechulek, H.; Al-Sabir, A. Client satisfaction and quality of health care in rural Bangladesh. Bull. World Health Organ. 2002, 79, 512–517. [Google Scholar]
- Patient Satisfaction Survey for AIDS Institute. For the Design and Validation of a Patient Satisfaction Survey For HIV+ Clients in Ambulatory Care Settings. Available online: https://pdfs.semanticscholar.org/d5bf/531042ca26713a50e36c2d03d2b6d8746ebc.pdf?_ga=2.124305737.252708314.1582219146-1073224698.1582219146 (accessed on 20 June 2015).
- Purcărea, T. Creating the ideal patient experience. J. Med. Life 2016, 9, 380–385. [Google Scholar]
- Ahmad, I.; Din, S. Patients’ satisfaction from the health care services. Gomal J. Med Sci. 2010, 8, 95–97. [Google Scholar]
- Almujali, A.A.; Alshehy, A.H.; Ahmed, A.; Ismail, M.F.S. Assessment of enablement effect of consultation on patients attending primary health centers in Qatar. Middle East J. Fam. Med. 2009, 7, 3–6. [Google Scholar]
- Ganova-Iolovska, M.; Kalinov, K.; Geraedts, M. Satisfaction of inpatients with acute coronary syndrome in Bulgaria. Health Qual. Life Outcomes 2008, 6, 50. [Google Scholar] [CrossRef] [Green Version]
- Aljaberi, M.A.; Juni, M.H.; Al-Maqtari, R.A.; Lye, M.S.; Saeed, M.A.; Al-Dubai, S.A.R.; Kadir Shahar, H. Relationships among perceived quality of healthcare services, satisfaction and behavioural intentions of international students in Kuala Lumpur, Malaysia: A cross-sectional study. BMJ Open 2018, 8, e021180. [Google Scholar] [CrossRef] [Green Version]
- Chen, Q.; Beal, E.W.; Okunrintemi, V.; Cerier, E.; Paredes, A.; Sun, S.; Olsen, G.; Pawlik, T.M. The Association Between Patient Satisfaction and Patient-Reported Health Outcomes. J. Patient Exp. 2019, 6, 201–209. [Google Scholar] [CrossRef] [PubMed] [Green Version]
- Sitzia, J.; Wood, N. Patient satisfaction: A review of issues and concepts. Soc. Sci. Med. 1997, 45, 1829–1843. [Google Scholar] [CrossRef]
- Prasanna, K.S.; Bashith, M.A.; Sucharitha, S. Consumer satisfaction about hospital services: A study from the outpatient department of a private medical college hospital at Mangalore. Indian J. Community Med. 2009, 34, 156–159. [Google Scholar] [CrossRef] [PubMed]
- Mihailovic, N.M.; Kocic, S.S.; Trajkovic, G.; Jakovljevic, M. Satisfaction with Health Services among the Citizens of Serbia. Front. Pharmacol. 2017, 8, 50. [Google Scholar] [CrossRef] [PubMed] [Green Version]
- Hall, J.A.; Dornan, M.C. Patient sociodemographic characteristics as predictors of satisfaction with medical care: A meta-analysis. Soc. Sci. Med. 1990, 30, 811–818. [Google Scholar] [CrossRef]
- Morgovan, C.; Cosma, S.; Polinicencu, C.; Burta, C.; Ghibu, S. Comparative study regarding commercial policies for the Romanian antidiabetics’ market. Farmacia 2011, 59, 679–689. [Google Scholar]
- Naidu, A. Factors affecting patient satisfaction and healthcare quality. Int. J. Health Care Qual. Assur. 2009, 22, 366–381. [Google Scholar] [CrossRef]
- Bara, A.C.; van den Heuvel, W.J.A.; Maarse, J.A.M.; van Dijk, J.P. Users’ satisfaction with the Romanian health care system: An evaluation of recent health care reforms. Eur. J. Public Health Suppl. 2002, 12, 39–40. [Google Scholar]
- Meng, R.; Li, J.; Zhang, Y.; Yu, Y.; Luo, Y.; Liu, X.; Zhao, Y.; Hao, Y.; Hu, Y.; Yu, C. Evaluation of patient and medical staff satisfaction regarding health care services in Wuhan public hospitals. Int. J. Environ. Res. Public Health 2018, 15, 769. [Google Scholar] [CrossRef] [Green Version]
- Popa, D.; Druguș, D.; Leașu, F.; Azoicăi, D.; Repanovici, A.; Rogozea, L.M. Patients’ perceptions of healthcare professionalism—A Romanian experience. BMC Health Serv. Res. 2017, 17, 463. [Google Scholar] [CrossRef] [Green Version]
- Vladescu, C.; Silvia, V.; Scîntee, G.; Olsavszky, V.; Hernández-Quevedo, C.; Sagan, A. Health Systems in Transition: Romania; European Observatory on Health Systems and Policies: Brussels, Belgium, 2016. [Google Scholar]
- Coţiu, M.A.; Crişan, I.M.; Catană, G.A. Patient satisfaction with healthcare—A focus group exploratory study. IFMBE Proc. 2014, 44, 119–124. [Google Scholar]
- Burcea, M.; Toma, S.-G.; Papuc, R.-M. Patients’ Satisfaction With the Health Care Systemin the Age of Globalization: The Case of Romania. Transylv. Rev. Adm. Sci. 2014, 5–20. [Google Scholar]
- Druică, E.; Mihăilă, V.; Burcea, M.; Cepoi, V. Combining direct and indirect measurements to assess patients’ satisfaction with the quality of public health services in Romania: Uncovering structural mechanisms and their implications. Int. J. Environ. Res. Public Health 2020, 17, 152. [Google Scholar] [CrossRef] [PubMed] [Green Version]
- Baba, C.; David, I.D.C. Evaluarea satisfacției pacienților cu privire la serviciilor medicale și prestația medicilor-Studiu pilot. Rev. Transilv. Ştiinţe Adm. 2007, 9, 5–15. [Google Scholar]
- Ştefănescu, A.; Turlea, E.; Calu, D.A. Performance measurement in Romanian public hospitals. Afr. J. Bus. Manag. 2011, 5, 552–576. [Google Scholar]
- Agheorghiesei, D.-T.; Copoeru, I. Evaluating patient satisfaction–a matter of ethics in the context of the accreditation process of the Romanian hospitals. Procedia Soc. Behav. Sci. 2013, 82, 404–410. [Google Scholar]
- Frâncu, V.; Frâncu, O. Patients’ satisfaction, a measure of health care quality. Acta Med. 2012, 2, 147–148. [Google Scholar]
- Cosma, S. Marketing Research; Alma Mater: Cluj-Napoca, Romania, 2008. (In Romanian) [Google Scholar]
- Hendriks, V.M.; Blanken, P.; Adriaans, N.F.P.; Hartnoll, R. Snowball Sampling: A Pilot Study on Cocaine Use; Erasmus Universiteit Rotterdam: Rotterdam, The Netherlands, 1992; ISBN 9789074234023. [Google Scholar]
- Snijders, T.A.B. Estimation On the Basis of Snowball Samples: How To Weight? Bull. Méthodologie Sociol. 1992, 36, 59–70. [Google Scholar] [CrossRef]
- Vǎleanu, M.; Cosma, S.; Cosma, D.; Moldovan, G.; Vasilescu, D. Optimization for date redistributed system with applications. Int. J. Comput. Commun. Control 2009, 4, 178–184. [Google Scholar] [CrossRef] [Green Version]
- Naderifar, M.; Goli, H.; Ghaljaie, F. Snowball Sampling: A Purposeful Method of Sampling in Qualitative Research. Strides Dev. Med Educ. 2017. [Google Scholar] [CrossRef] [Green Version]
- Faul, F.; Erdfelder, E.; Lang, A.G.; Buchner, A. G*Power 3: A flexible statistical power analysis program for the social, behavioral, and biomedical sciences. Behav. Res. Methods Psychon. 2007, 39, 175–191. [Google Scholar] [CrossRef] [PubMed]
- Bitner, M.J.; Hubbert, A.R. Encounter Satisfaction versus Overall Satisfaction versus Quality: The Customer’s Voice. In Service Quality: New Directions in Theory and Practice; SAGE Publications Inc.: Thousand Oaks, CA, USA, 2012; pp. 72–94. [Google Scholar]
- IRMA. Brand Culture and Identity: Concepts, Methodologies, Tools, and Applications; IGI Global: Harrisburg PA, USA, 2019; ISBN 1522571167. [Google Scholar]
- Parasuraman, A.; Zeithaml, V.A.; Berry, L.L. Servqual: A Multiple-Item Scale for Measuring Customer Perceptions of Service Quality—MSI Web Site. J. Retail. 1988, 64, 12–40. [Google Scholar]
- Reichheld, F.F.; Sasser, W.E. Zero defections: Quality comes to services. Harv. Bus. Rev. 1990, 68, 105–111. [Google Scholar] [PubMed]
- Cosma, S.; Vǎleanu, M.; Cosma, D.; Vasilescu, D.; Moldovan, G. Efficient data organisation in distributed computer systems using data warehouse. Int. J. Comput. Commun. Control 2013, 8, 366–374. [Google Scholar] [CrossRef] [Green Version]
- Valdmanis, V.G. Factors Affecting Well-Being at the State Level in the United States. J. Happiness Stud. 2015, 16, 985–997. [Google Scholar] [CrossRef]
- Pascoe, G.C. Patient satisfaction in primary health care: A literature review and analysis. Eval. Program Plan. 1983, 6, 185–210. [Google Scholar] [CrossRef]
- DuPree, E.; Anderson, R.; Nash, I.S. Improving Quality in Healthcare: Start with the Patient. J. Trans. Personal. Med. 2011, 78, 813–819. [Google Scholar] [CrossRef]
- Boquiren, V.M.; Hack, T.F.; Beaver, K.; Williamson, S. What do measures of patient satisfaction with the doctor tell us? Patient Educ. Couns. 2015, 98, 1465–1473. [Google Scholar] [CrossRef]
- Beşciu, C.D. Patient Satisfaction in the Hospital’s Emergency Units in Bucharest. Procedia Econ. Financ. 2015, 32, 870–877. [Google Scholar] [CrossRef] [Green Version]
- Hofer, R.; Choi, H.; Mase, R.; Fagerlin, A.; Spencer, M.; Heisler, M. Mediators and Moderators of Improvements in Medication Adherence: Secondary Analysis of a Community Health Worker–Led Diabetes Medication Self-Management Support Program. Health Educ. Behav. 2017, 44, 285–296. [Google Scholar] [CrossRef] [Green Version]
- Jha, A.K.; Orav, E.J.; Zheng, J.; Epstein, A.M. Patients’ perception of hospital care in the United States. New Engl. J. Med. 2008, 359, 1921–1931. [Google Scholar] [CrossRef] [PubMed] [Green Version]
- Coculescu, B.I.; Coculescu, E.C.; Purcărea, V.L. Orientation to the patient as a marketing strategy in the Romanian healthcare system. J. Med. Life 2016, 9, 302–305. [Google Scholar] [PubMed]
- Sarker, A.R.; Sultana, M.; Ahmed, S.; Mahumud, R.A.; Morton, A.; Khan, J.A.M. Clients’ experience and satisfaction of utilizing healthcare services in a community based health insurance program in bangladesh. Int. J. Environ. Res. Public Health 2018, 15, 1637. [Google Scholar] [CrossRef] [PubMed] [Green Version]
- Constantinescu-Dobra, A.; Sabou, A.; Coțiu, M.C. The influence of socio-demographic, psychological and medical variables on patient satisfaction with diabetes care in the hospital setting in Romania. IFMBE Proc. 2019, 71, 277–281. [Google Scholar]
- Sârbu, R.; Zanfir, A. Necesitatea implementarii unui sistem de management al calitatii in unitatile sanitare din Romania. O abordare din perspectiva pacientului. Amfiteatrul Econ. 2011, 13, 561–569. [Google Scholar]
- Maharlouei, N.; Akbari, M.; Akbari, M.; Lankarani, K.B. Socioeconomic status and satisfaction with public healthcare system in Iran. Int. J. Community Based Nurs. Midwifery 2017, 5, 22–29. [Google Scholar]
- Malat, J. Social distance and patients’ rating of healthcare providers. J. Health Soc. Behav. 2001, 42, 360–372. [Google Scholar] [CrossRef]
- Blendon, R.J.; Schoen, C.; DesRoches, C.M.; Osborn, R.; Scoles, K.L.; Zapert, K. Inequities in health care: A five-country survey. Health Aff. 2002, 21, 182–191. [Google Scholar] [CrossRef] [Green Version]
Figure 1.
The contact frequencies of Romanian healthcare system in the last year.

Figure 2.
The confidence in the Romanian healthcare system.

Figure 3.
Who the patients addressed in the case of illness.

Figure 4.
Appreciation of the conditions offered in the Romanian hospitals.

Figure 5.
General impression regarding the healthcare system from Romania.

Figure 6.
Association between confidence in the HS and age.

Figure 7.
Association between confidence in the HS and gender.

Figure 8.
Association between the overall impression of the Romanian HS and age.

Figure 9.
Association between overall impression of the Romanian HS and income.

Figure 10.
Association between confidence and overall impression of the Romanian HS.


Table 1.
Scores and Cronbach’s Alpha coefficient.
| Mean | Std. Deviation | Cronbach’s Alpha | |
|---|---|---|---|
| Appreciate the conditions offered in the Romanian hospitals [Accommodation] | 2.17 | 0.83 | 0.82 |
| Appreciate the conditions offered in the Romanian hospitals [Food] | 2.14 | 0.83 | 0.83 |
| Appreciate the conditions offered in the Romanian hospitals [Medical equipment] | 2.27 | 0.85 | 0.82 |
| Appreciate the conditions offered in the Romanian hospitals [Facilities/ Equipment] | 2.06 | 0.83 | 0.82 |
| Confidence | 2.32 | 0.74 | 0.83 |
| Quality of the care provided by the doctors | 2.75 | 0.77 | 0.82 |
| Quality of the care provided by the nurses | 2.52 | 0.85 | 0.82 |
| Doctors attitudes | 2.74 | 0.79 | 0.82 |
| Nurses attitudes | 2.52 | 0.87 | 0.82 |
Table 2.
Relations between scales and items.
| Appreciate the Conditions Offered in the Romanian Hospitals | Confidence | Quality of the Care Provided by | |||||||
|---|---|---|---|---|---|---|---|---|---|
| Accommodation | Food | Medical Equipment | Facilities/ Equipment | The Doctors | The Nurses | Doctors Attitudes | |||
| Appreciate the conditions offered in the Romanian hospitals | Food | 0.656 (**) | |||||||
| Medical equipment | 0.568 (**) | 0.479 (**) | |||||||
| Facilities/ Equipment | 0.577 (**) | 0.498 (**) | 0.704 (**) | ||||||
| Confidence | 0.216 (**) | 0.157 (**) | 0.252 (**) | 0.260 (**) | |||||
| Quality of the care provided by | the doctors | 0.270 (**) | 0.157 (**) | 0.242 (**) | 0.217 (**) | 0.436 (**) | |||
| the nurses | 0.208 (**) | 0.185 (**) | 0.215 (**) | 0.206 (**) | 0.423 (**) | 0.622 (**) | |||
| Doctors attitudes | 0.251 (**) | 0.161 (**) | 0.224 (**) | 0.248 (**) | 0.442 (**) | 0.705 (**) | 0.509 (**) | ||
| Nurses attitudes | 0.176 (**) | 0.161 (**) | 0.194 (**) | 0.212 (**) | 0.379 (**) | 0.486 (**) | 0.708 (**) | 0.632 (**) | |
(**) p < 0.001.
Table 3.
Patients of Romanian healthcare system profile.
| Characteristics | No. of Respondents | |
|---|---|---|
| Age | <20 | 169 |
| 20–30 | 854 | |
| 30–40 | 485 | |
| 40–50 | 405 | |
| 50–60 | 208 | |
| >60 | 184 | |
| Gender | Female | 1262 |
| Male | 1043 | |
| Studies | Basic studies | 257 |
| High school | 808 | |
| Post-secondary | 268 | |
| University studies | 812 | |
| Post-university studies | 160 | |
| Income | <1500 lei * | 1227 |
| 1500–2500 lei | 537 | |
| 2500–3500 lei | 241 | |
| 3500–4500 lei | 141 | |
| 4500 lei | 159 | |
* 1 RON = 0.21 EUR.
Table 4.
Correlations between confidence in the healthcare system and different variables.
| Variables | Correlation Coefficient | P-Value |
|---|---|---|
| Age | 0.089 | <0.001 |
| Gender | −0.076 | <0.001 |
| Education | −0.018 | 0.334 |
| Income | −0.017 | 0.367 |
Table 5.
Correlations between overall impression and different variables.
| Variables | Correlation Coefficient | P-Value |
|---|---|---|
| Age | 0.038 | 0.023 |
| Gender | −0.032 | 0.085 |
| Education | −0.027 | 0.116 |
| Income | −0.087 | <0.001 |
© 2020 by the authors. Licensee MDPI, Basel, Switzerland. This article is an open access article distributed under the terms and conditions of the Creative Commons Attribution (CC BY) license (http://creativecommons.org/licenses/by/4.0/).
Share and Cite
MDPI and ACS Style
Cosma, S.A.; Bota, M.; Fleșeriu, C.; Morgovan, C.; Văleanu, M.; Cosma, D. Measuring Patients’ Perception and Satisfaction with the Romanian Healthcare System. Sustainability 2020, 12, 1612. https://doi.org/10.3390/su12041612
AMA Style
Cosma SA, Bota M, Fleșeriu C, Morgovan C, Văleanu M, Cosma D. Measuring Patients’ Perception and Satisfaction with the Romanian Healthcare System. Sustainability. 2020; 12(4):1612. https://doi.org/10.3390/su12041612
Chicago/Turabian StyleCosma, Smaranda Adina, Marius Bota, Cristina Fleșeriu, Claudiu Morgovan, Mădălina Văleanu, and Dan Cosma. 2020. "Measuring Patients’ Perception and Satisfaction with the Romanian Healthcare System" Sustainability 12, no. 4: 1612. https://doi.org/10.3390/su12041612
Note that from the first issue of 2016, this journal uses article numbers instead of page numbers. See further details here.