Effect of Landscape Microclimates on Thermal Comfort and Physiological Wellbeing


1
Department of Landscape Study, College of Architecture and Urban Planning, Tongji University, Shanghai 200092, China
2
Landscape Architecture and Urban Planning, Texas A&M University, College Station, TX 77840, USA
*
Author to whom correspondence should be addressed.
Sustainability 2019, 11(19), 5387; https://doi.org/10.3390/su11195387
Submission received: 31 August 2019
/
Revised: 16 September 2019
/
Accepted: 24 September 2019
/
Published: 29 September 2019
(This article belongs to the Collection Climate Change, Landscape in Transition and Tools for Sustainable Landscape Planning)
Abstract
:Global climate change and intensifying heat islands have reduced human thermal comfort and health in urban outdoor environments. However, there has been little research that has focused on how microclimates affect human thermal comfort, both psychologically and physiologically. We investigated the effect of a range of landscape microclimates on human thermal comfort and health using questionnaires and physiological measurements, including skin temperature, skin conductance, and heart rate variability, and compared the results with the effect of prevailing climate conditions in open spaces. We observed that in landscape microclimates, thermal sensation votes significantly decreased from 1.18 ± 0.66 (warm–hot) to 0.23 ± 0.61 (neutral–slightly warm), and thermal comfort increased from 1.18 ± 0.66 (uncomfortable–neutral) to 0.23 ± 0.61 (neutral–comfortable). In the landscape microclimates, skin temperature and skin conductance decreased 0.3 ± 0.8 °C and 0.6 ± 1.0 μs, respectively, while in the control, these two parameters increased by 0.5 ± 0.9 °C and 0.2 ± 0.7 μs, respectively. Further, in landscape microclimates, subject heart rate variability increased significantly. These results suggest landscape microclimates improve human thermal comfort and health, both psychologically and physiologically. These findings can provide an evidence base that will assist urban planners in designing urban environments for the health and wellbeing of residents.
1. Introduction
Rapid urbanization, especially in developing countries, has led to massive migrations to urban areas, where the proportion of the world population is over 55% and increasing [1]. However, due to global climate change and intensifying urban heat island effects, urban living environments have deteriorated, becoming increasingly detrimental to human thermal comfort and health, not only psychologically, such as in terms of thermal sensation, mood, and concentration [2,3,4], but also physiologically by way of, for example, sunburn, heat stroke, and heat cramps [5,6].
In order to achieve the sustainability of urban areas, the increasing research interest in thermal comfort and health has heightened the need to figure out how the human body responds, both psychologically and physiologically, to different microclimates.
Research has been broadly conducted to study the influencing factors of thermal comfort. For example, researchers have concluded that in some situations, air temperature and solar radiation are the two most significant variables affecting outdoor thermal comfort and behavior [7,8,9]; Lenzholzer found that wind speed and experience influenced thermal comfort perceptions more than other parameters in the Netherlands [10]; and Nikolopoulou suggested psychological adaption including thermal expectation effected the use of outdoor environments [11]. A large number of indices have been developed to evaluate human comfort based on microclimate parameters; for instance, the comfort formula (ComFA) [12,13], universal thermal comfort index (UTCI) [14,15,16], physiological equivalent temperature (PET) [17], predicted mean vote (PMV) [18], etc. Much research has focused on investigating human thermal comfort in different climate zones [9]. Employing numerical simulation to explore thermal comfort performance of various environment settings has drawn much attention. For example, researchers suggested that, in Cuba, aspect ratios of streets between 1 and 1.5 could achieve acceptable thermal comfort levels for people in both summer and winter [19]; others found that the aspect ratio had a greater influence on thermal condition than street orientation [20]. Fahmy et al. suggest 15 m high Ficus elastica trees could provide the best indoor thermal levels in Cairo’s urban area [21]. Much recent research has emphasized the physical and psychological aspects of thermal comfort by combining thermal questionnaires with microclimate parameters and thermal comfort models.
Other research has suggested that green space can benefit human physiological health. For example, Gladwell et al. suggested that viewing natural environments can alter autonomic control of the heart, as well as increase vagal activity [22], while Lee found viewing garden landscapes could increase the mean oxygenated hemoglobin of subjects [23]. Likewise, better indoor microclimates can also provide better thermal perception and wellbeing [24,25,26].
There is a call for research that synthesizes the physiological, psychological, and microclimatology for the health and wellbeing of people in outdoor urban areas. However, few studies have provided evidence of the effect of microclimate on human thermal comfort from both the psychological and physiological perspectives simultaneously [27].
The purpose of this study was to investigate the psychological and physiological benefits provided by landscape microclimates compared with open spaces covered by pavement, used as the control, in an urban square.
First, we employed weather stations to collect and compare the microclimate parameters of both sites on three experiment days, including air temperature (TA), solar radiation (SR), relative humidity (RH), wind speed (WS), and ground temperature (GT). Second, we conducted on-site surveys to assess participants’ psychological responses to thermal comfort. Third, we used the ErgoLAB platform to measure the physiological parameters, including skin temperature (SKT), skin conductance (SC), and heart rate variability (HRV) simultaneously, during 3-min periods. Finally, we statistically analyzed the data and compared the significant difference of both psychological and physiological responses between landscape microclimates and the control. Results demonstrated landscape microclimates can significantly improve human psychological and physiological thermal comfort and health.
2. Methods
2.1. Study Area and Participants
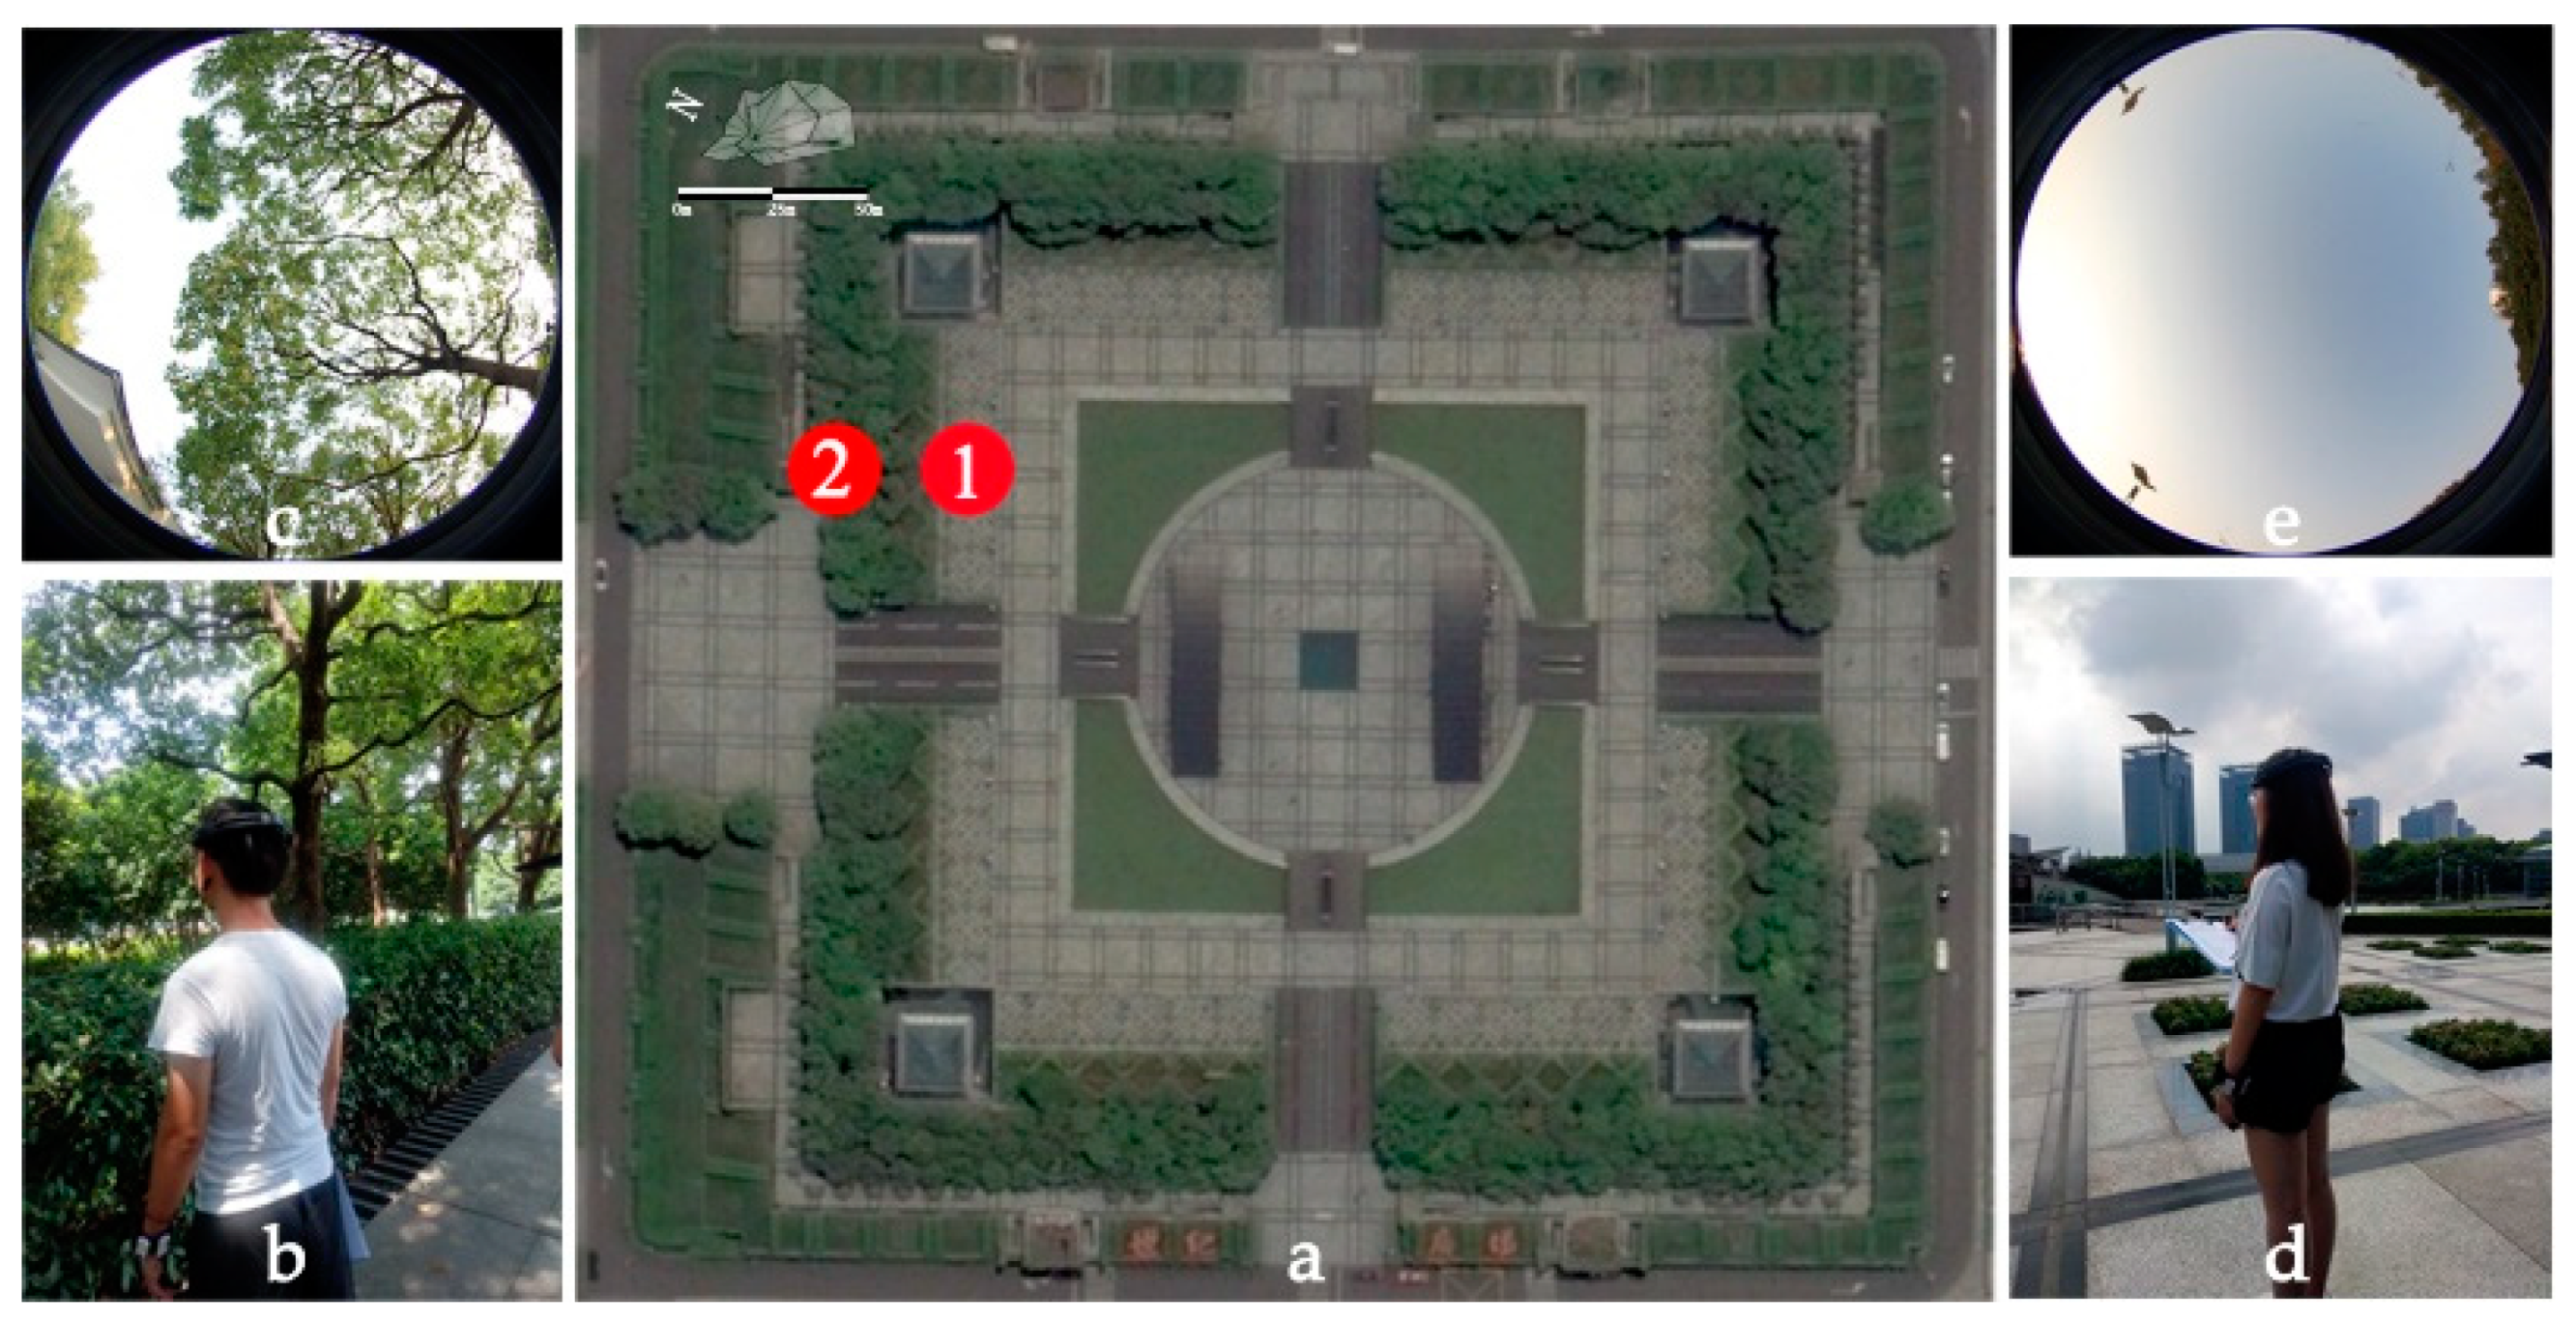
The experiment took place between 4–6 August 2018 at Century Square in Shanghai, China. Shanghai experiences a subtropical humid climate [28], located between 120°52′ to 122°12′ east longitude and 30°40′ to 31°53′ north latitude. In winter, the lowest temperature is usually between 0 °C and 5 °C, while in summer, the highest temperature can reach between 35 °C and 40 °C. Further, the wind direction is predominantly from the southeast and the annual average relative humidity is about 68%. Century Square is located in the Pudong New Area of Shanghai, with a side length about 220 m, and the main axis is at an angle of about 45° to the east–west direction (Figure 1a).
In order to investigate the benefit of landscape microclimates, we chose site 2 (Figure 1b) as a representation of a landscape space and site 1 as the control.
Site 1 is an open space with a granite ground surface and is framed by several small flower beds with a sky view factor (SVF) of 0.91 (Figure 1d). Site 2 is a greenery space with the top covered by a crown of Cinnamomum camphora (L.) Presl with an SVF of 0.25 and granite ground surface material. In site 2, subjects stood by a row of shrubs of Photinia serrulata Lindl. with grass lawn ahead (Figure 1c).
Twenty-two healthy voluntary college students (13 male, 9 female, age 24.6 ± 5.2) from Tongji University were recruited via a poster for the field experiment (Table 1). Clothing information was recorded in the demographic information in the questionnaire and clothing levels were estimated according to ASHRAE (American Society of Heating, Refrigerating and Air-Conditioning Engineers) [29]. Metabolic rate was calculated based on the age, weight, and activities according to Livingston and Kohlstadt [30]. All subjects were without cardiovascular disease history or skin disease. In addition, subjects were informed not to stay up late and drink alcohol the day before the experiment to ensure physical and mental health during the test.
2.2. Experiment Design
Preparation: Before the experiment, subjects rested under a shelter to stabilize their physiological state. Simultaneously, we helped subjects attach experimental instruments to their bodies and explained the experimental procedure and precautions again.
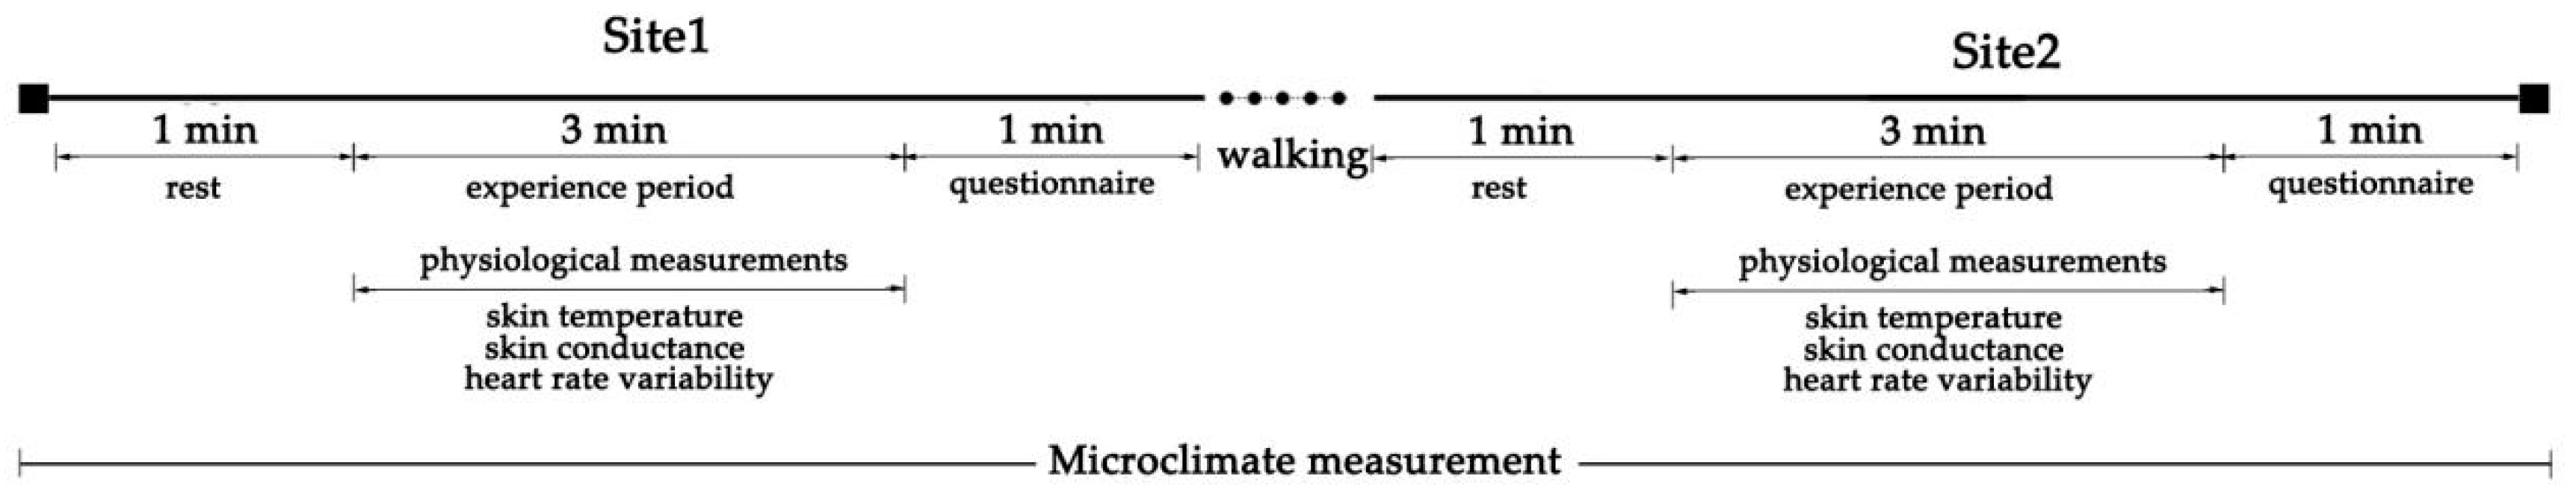
Each test involved two subjects. The sequence of experience was from site 1 to site 2. At each site subjects were first required to rest for 1 min, then experience the microclimate for 3 min, then complete the questionnaire. During the microclimate experience period, physiological parameters were measured, and subjects were required to remain near the weather station, remain at rest, and avoid intense body movement (Figure 2).
This experiment was approved by the university’s ethics committee and conformed to the guidelines contained within the Declaration of Helsinki.
2.3. Microclimate
Two watchdog 2000 series weather stations (Spectrum Technologies, Inc., Aurora, IL, USA, 2012) were employed to measure microclimate parameters, including solar radiation (SR), air temperature (TA), wind speed (WS), relative humidity (RH), and ground temperature (GT). Parameters, except the GT, were measured at 1.5 m height above the ground with a 1-min data logged interval from 8:00–18:00. Measurement range and accuracy of each parameter of the weather stations are shown in Supplementary Materials Table S1.
2.4. Questionnaire
Subjects were required to fill in a questionnaire about their thermal comfort during the previous 3-min period. The questionnaires consisted of two parts, with the first part asking for demographic information and the second part used to evaluate their thermal comfort, including thermal sensation vote (TSV), thermal comfort vote (TCV), solar radiation sensation vote (RSA), air temperature sensation vote (ASV), humidity sensation vote (HSV), wind speed sensation vote (WSV), etc. Questions were designed based on five- to nine-point Likert scales, consistent with ASHRAE [29] (see Supplementary Materials Table S2).
2.5. Physiological Measurements
The ErgoLAB “Human–Machine–Environment” synchronization platforms (Kingfar Inc. Beijing, China, 2014) were employed to measure skin temperature (SKT), skin conductance (SC), and heart rate variability (HRV). ErgoLAB consists of wireless wearable sensors and a computer-based platform, connected by a wireless receiver. The validity of ErgoLAB has been verified by researchers in related fields [31,32,33].
2.5.1. Skin Temperature
For the relationship between skin temperature and thermal comfort, researchers suggested that the change of skin temperature of an extremity and the forehead should be used as they are the most sensitive to the thermal environment in warm or hot climate [34]. Others provided evidence that hand skin temperature is closely related to body temperature regulation processes and has a high correlation with thermal sensation [35]. In the experience period, we measured the fingertip skin temperature using the wireless skin temperature sensor, which has a 10 °C to 60 °C measurement range, 0.1 °C accuracy, and 32 Hz sampling frequency. The temperature probe was attached to the fingertip of the left hand using medical adhesive tape.
2.5.2. Skin Conductance
Skin conductance is the conductivity between two points on the surface of the skin, which characterizes the electrodermal response of the skin and is one of the important indicators for studying the thermophysiology of the human body. The skin electrodermal response is related to the diastolic contraction of blood vessels and the function of skin sweat glands [36]. To a certain extent, it can reflect the tension and sweating of the body, thus reflecting the physiological status of people in a microclimate environment. In the experience period, we measured the fingertip skin conductance using wireless skin electrodermal sensor with a 0–30 μs measurement range, 0.1 μs accuracy, and 32 Hz sampling frequency. Two electrodes of the sensor were attached to two fingertips of the left hand to form a loop.
2.5.3. Heart Rate Variability
Heart rate variability (HRV) represents how much the human body changes in adjacent heartbeat intervals within a certain time segment [37]. It has been reported that HRV is highly correlated with ambient temperature, as well as being an objective indicator to evaluate a subject’s thermal comfort [26,38,39]. When the human body is experiencing thermal discomfort, the HRV will be lower, the parasympathetic nerve activity will decrease or the sympathetic nerve activity increase, and at the same time, the body sweats or the blood vessels contract causing skin temperature changes in order to adapt to the ambient temperature.
It has been reported that high frequency (HF) is mainly affected by parasympathetic activity, while low frequency (LF) is mainly affected by sympathetic activity, and LF/HF can reflect the balance of sympathetic and parasympathetic nerves [40]. Researchers have found that higher LF/HF might result from thermal discomfort, and subjects are thermally neutral when LF/HF is low [41]. In the experience period, we used ultra-short-term (3 min) sampling to measure HRV [42,43].
A wireless wearable sensor, based on a photoplethysmogram (PPG), was attached to the fingertip of the left hand to measure HRV with a 64 Hz sampling frequency. HRV data was analyzed in both the time and frequency domains. Indices such as heart rate (HR), the average of all NN (normal to normal) intervals (AVNN), the standard deviation of all NN intervals (SDNN), and root-mean-square of the successive differences (RMSSD) of the time domain were selected to compare the HRV for the two sites. Likewise, LF power, HF power, and LF/HF of frequency domain were also measured.
2.6. Statistical Analysis
Physiological data including HRV, SKT, and SC were processed on the ErgoLAB platform. HRV was processed using filters such as white de-noise, low-pass de-noise, baseline de-noise, and band stop, then ectopic values were replaced to analyze the time domain and frequency domain. Skin conductance and skin temperature data were processed using a moving average filter.
All data were expressed as mean ± standard deviation or mean (standard error). SPSS 20.0 (IBM Corp, Armonk, NY, USA, 2011) was employed to conduct the Wilcoxon signed-rank test for the statistical significance between two groups of data. The level of significance was set at p < 0.05.
3. Results
3.1. Microclimate
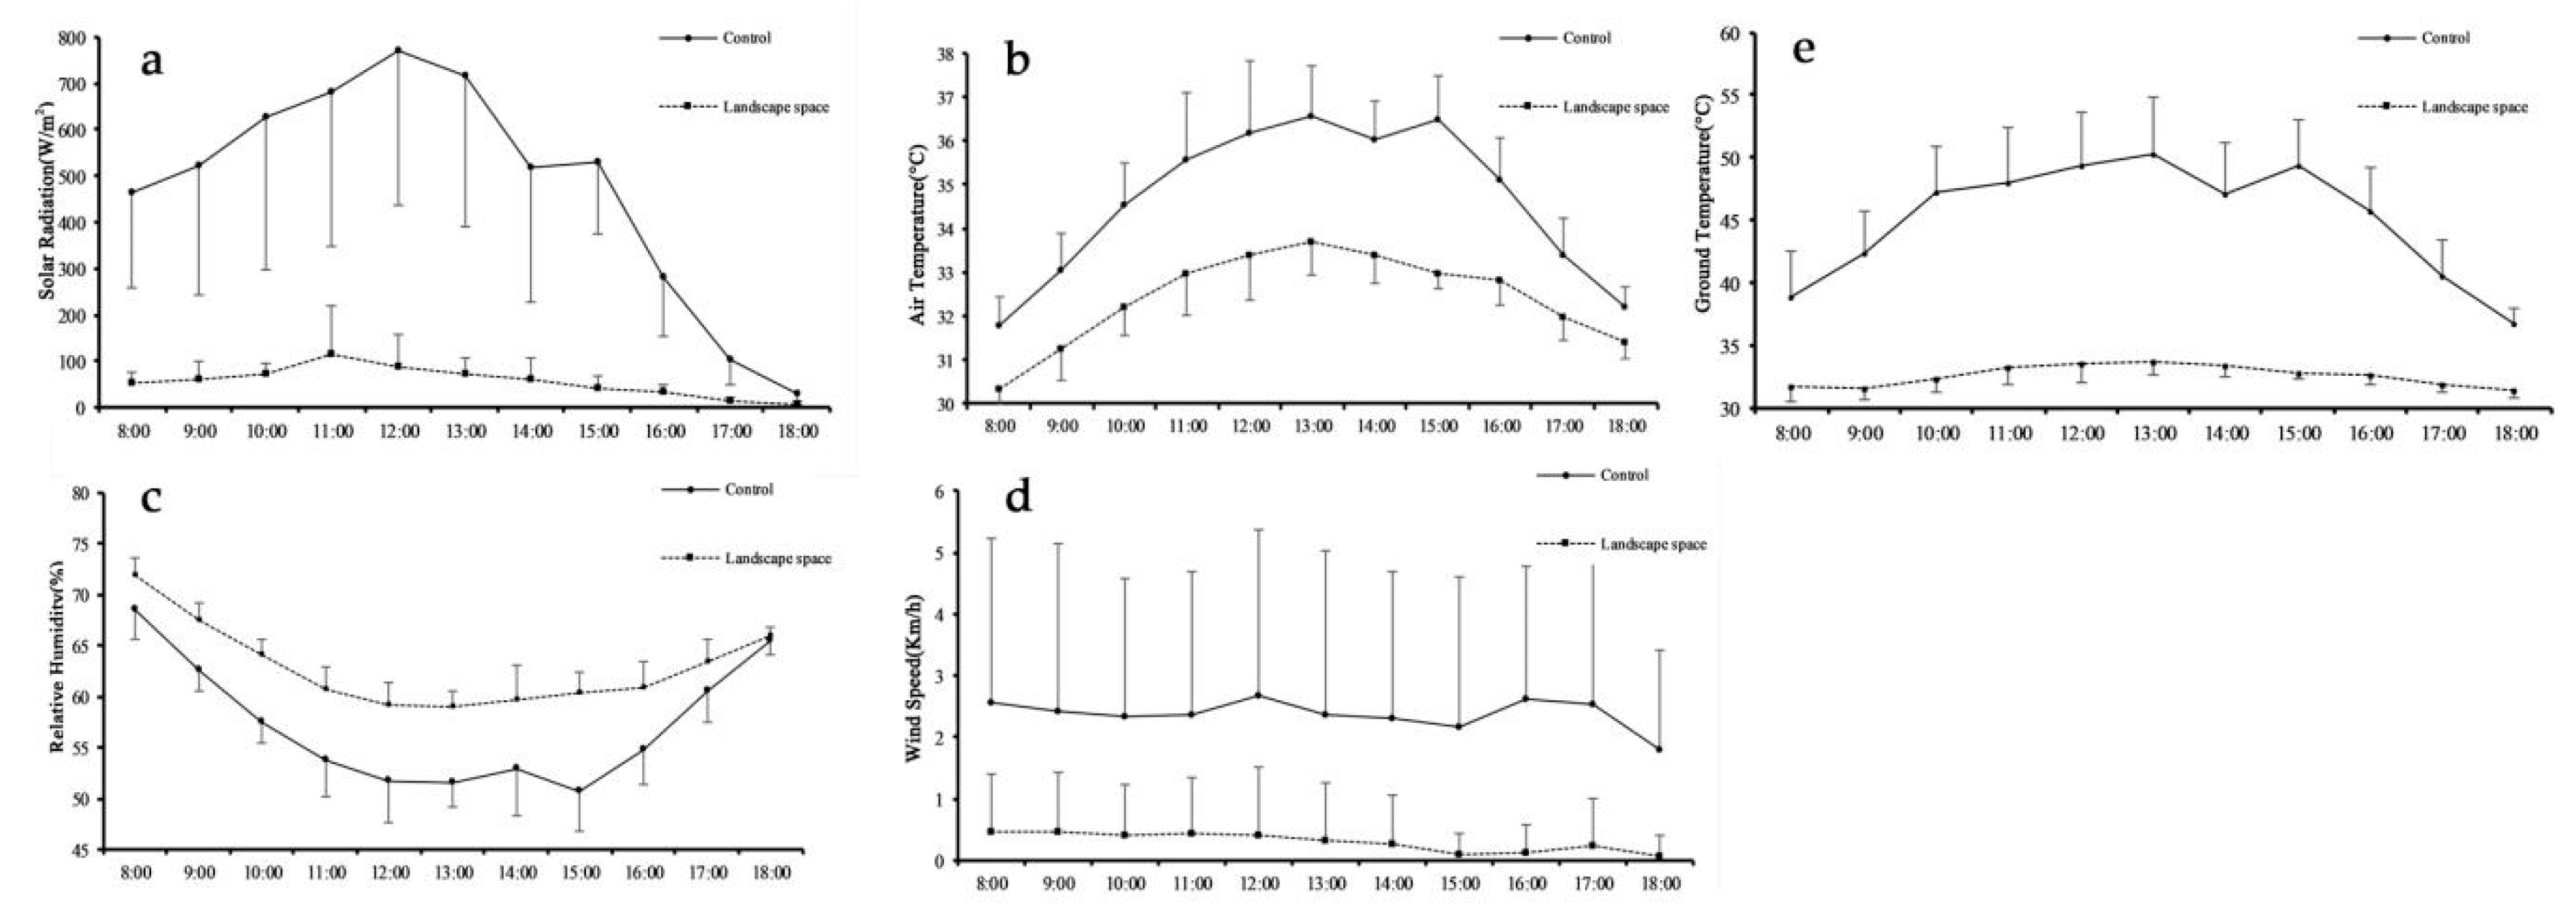
Watchdog weather stations were employed to measure the microclimate, including five parameters at two sites, over the experiment days from 8:00 a.m–18:00 p.m. Figure 3 and Table 2 show the trends and mean values of the microclimate parameters of the two sites, where values are given for each hour over the three experiment days. For SR, values of the landscape space were always lower than the control (59.42 ± 54.84 vs. 497.60 ± 334.11 W/m2, p < 0.001), with the largest gap appearing around 12:00 p.m., while values decreased to their lowest and were close to each other around 18:00 p.m. In addition, the SD of the landscape space was much higher than the control. For TA, values of the landscape space were lower than the control (32.49 ± 1.25 vs. 34.74 ± 1.94 °C, p < 0.001). Their lowest and highest values both appeared at 8:00 a.m. and 13:00 p.m., respectively. For RH, the value of the landscape space was higher than the control (62.62 ± 4.60 vs. 56.89 ± 6.54%, p < 0.001), with the lowest appearing around noon. The WSs of landscape space were much lower than the control (0.31 ± 0.83 vs. 2.41 ± 2.41 km/h, p < 0.001), and likewise for the GT (32.68 ± 1.34 vs. 45.44 ± 5.58 °C, p < 0.001).
3.2. Thermal Comfort
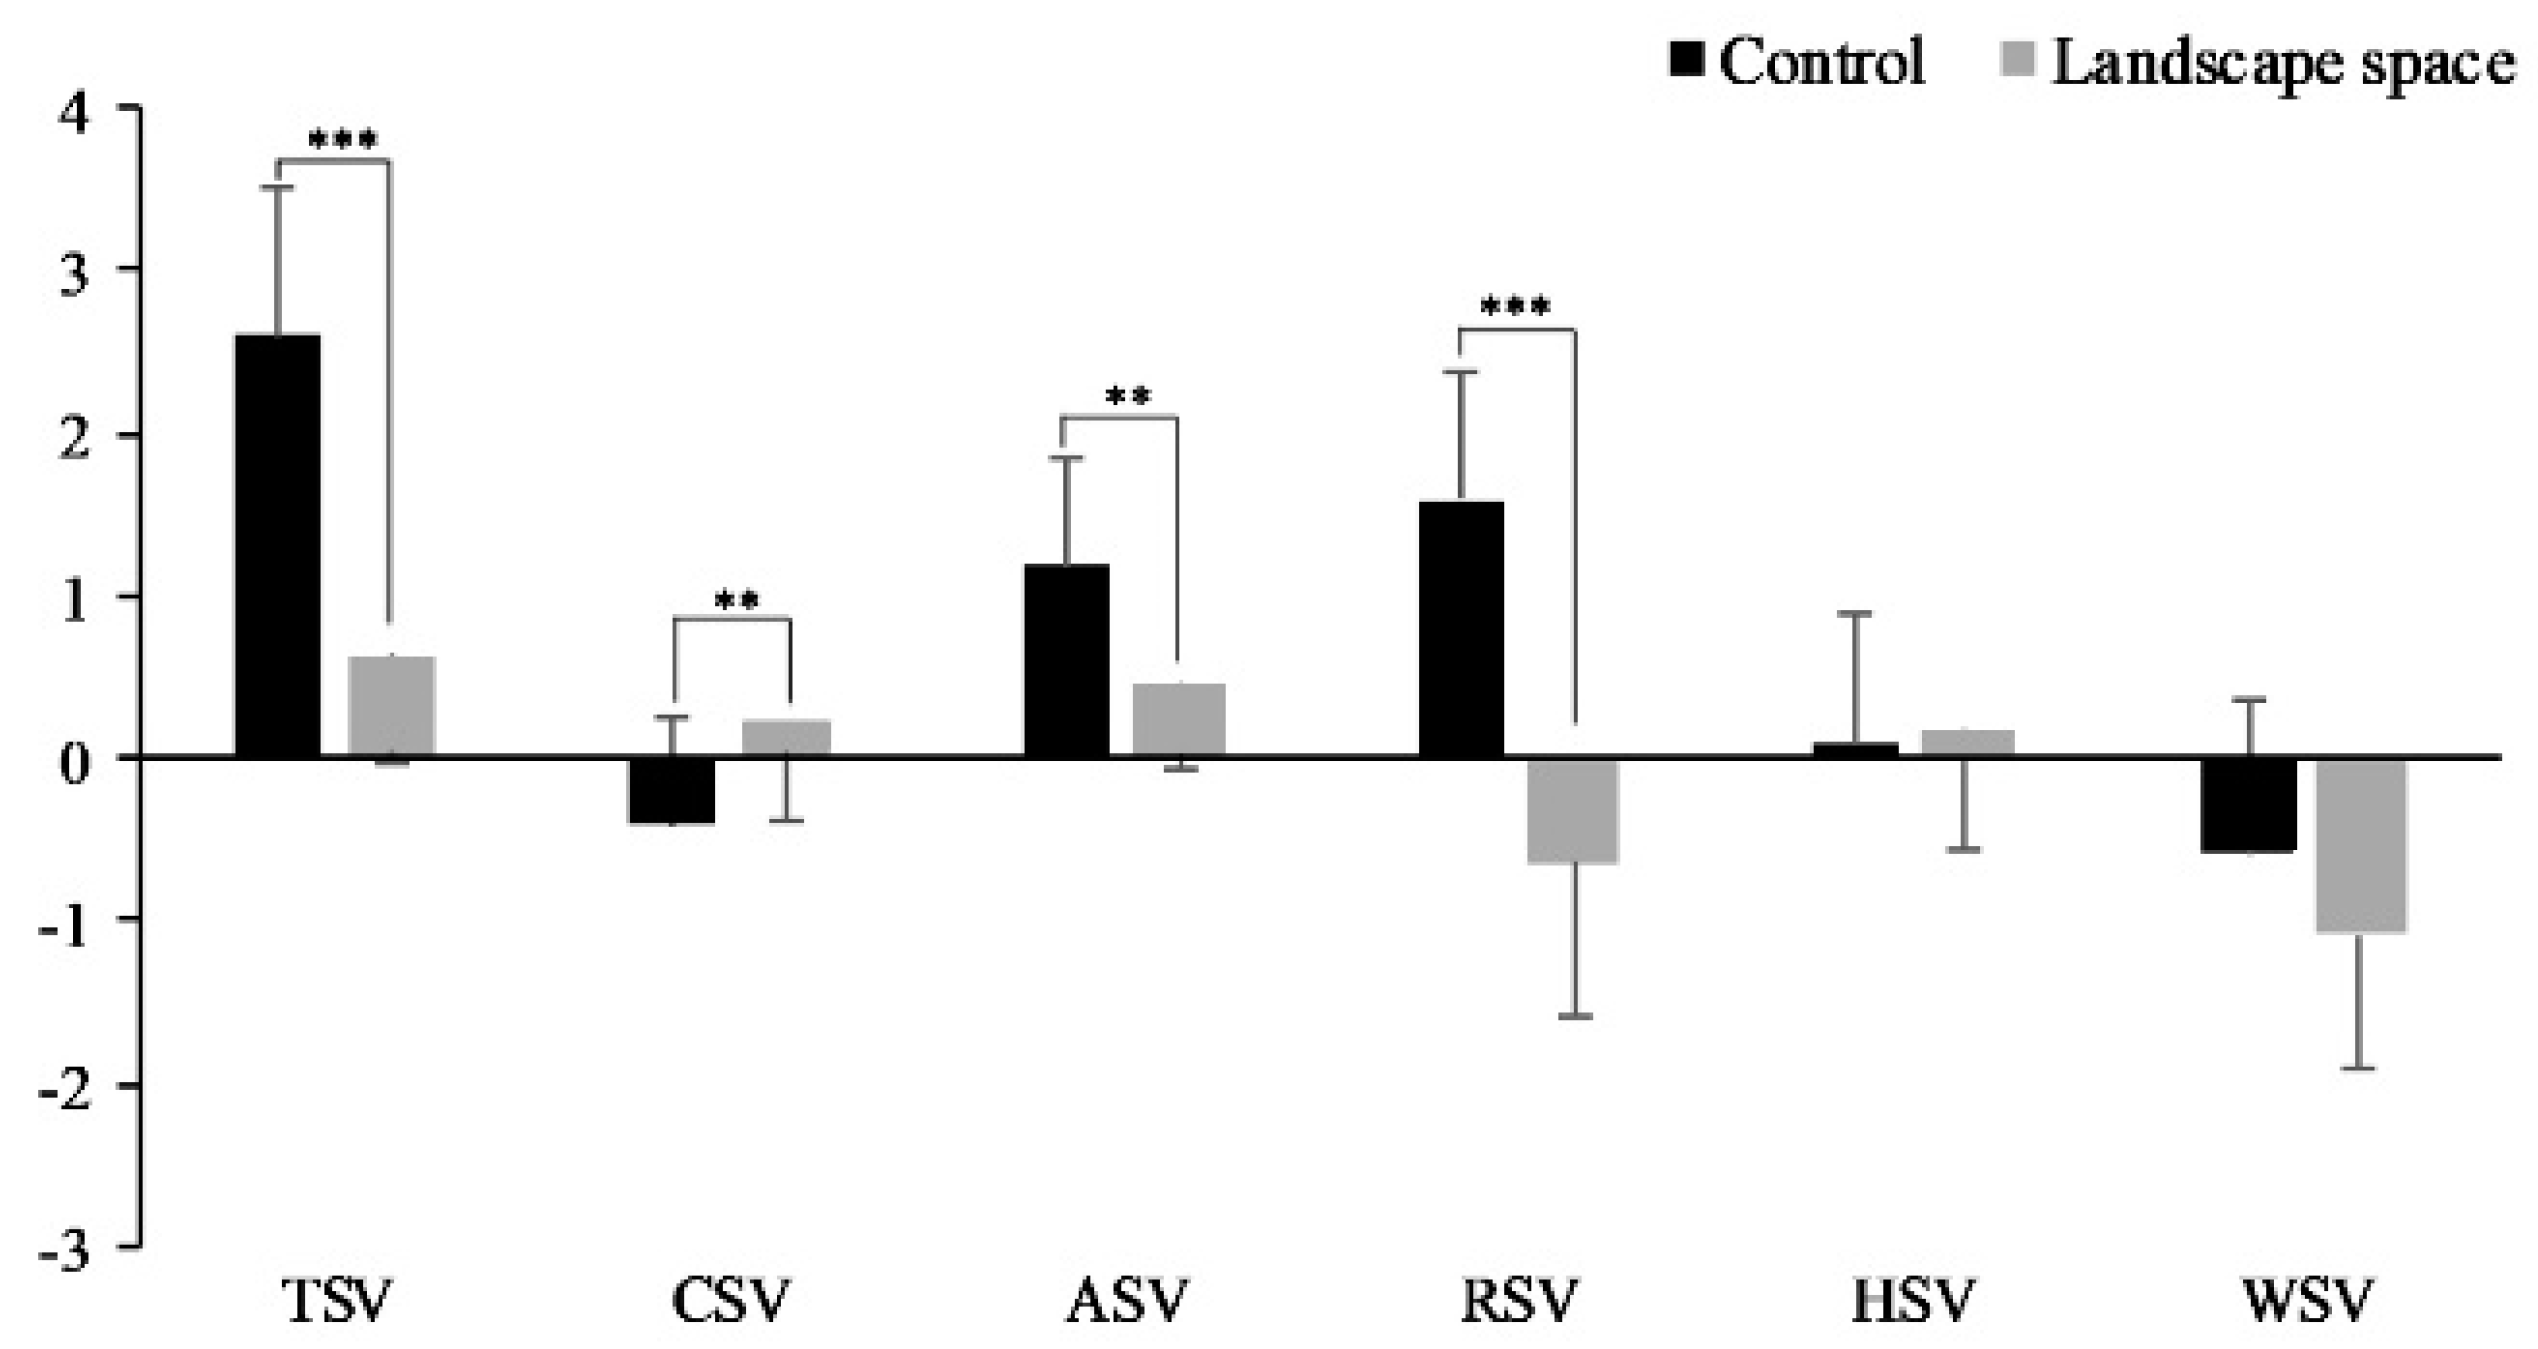
The thermal comfort survey was conducted after the experience period, and subjects were asked to vote on thermal sensation, comfort sensation, solar radiation, air temperature, humidity, and wind speed. In total, 44 samples were collected. Figure 4 shows the results of the thermal comfort survey. For TSV, the values of landscape microclimates were significantly lower than the control, with 0.64 ± 0.66 (between “neutral” and “slightly warm”) and 2.59 ± 0.91 (between “warm” and “hot”), respectively, p < 0.001. The CSV of landscape microclimates was significantly higher than the control, with 0.23 ± 0.61 (between “neutral” and “comfortable”) and −0.41 ± 0.66 (between “uncomfortable” and “neutral”), respectively, p < 0.01. For ASV, the values of landscape microclimates were significantly lower than the control, with 0.45 ± 0.11 (between “neutral” and “slightly high”) and 1.18 ± 0.66 (between “slightly high” and “high”), respectively, p < 0.01. The RSV of landscape microclimates was significantly lower than the control, with −0.64 ± 0.95 (between “slightly low” and “neutral”) and 1.59 ± 0.79 (between “slightly high” and “high”), respectively, p < 0.001. However, for WSV and HSV, there were no significant differences between the control and landscape microclimates.
Table 3 shows the correlation analysis for thermal response votes. TSV showed a significant correlation with CSV, ASV, and RSV, with coefficients of −0.61, 0.69, and 0.79, respectively. This reveals that RSV was most positively correlated with TSV, while TSV decreased when CSV increased. Furthermore, CSV had a significant correlation to ASV and RSV, with coefficients of −0.56 and −0.44, which meant CSV tended to decrease when ASV and RSV increased. Finally, RSV significantly increased when ASV increased. Meanwhile, there were no significant correlations between WSV, HSV, and other variables.
3.3. Physiological Wellbeing
3.3.1. Skin Temperature
Skin temperature was measured on the middle fingertip using a wearable sensor from the ErgoLAB platform during the 3-min experience period with a 16 Hz sampling frequency. Signals were processed using a moving-average filter, then analyzed using IBM SPSS Statistics 20.0.
Figure 5 shows the trend of mean skin temperature of the 22 subjects in the control and landscape microclimates. There was a clear upward pattern of skin temperature in the control, compared with a downward trend in the landscape microclimates. This reveals that skin temperature constantly increased during the experience period in the control, while it continuously decreased in the landscape microclimates. Mean skin temperature in the control were significantly higher than its value in the landscape (36.3 ± 0.2 °C vs. 35.2 ± 0.1 °C, p < 0.01). Likewise, results for the ΔSKT were 0.5 ± 0.9 °C versus −0.3 ± 0.8 °C, p < 0.05, respectively for the control versus landscape, which meant that after 3 min, the subjects’ skin temperature decreased on average nearly 0.3 °C in landscape microclimates, while it increased on average nearly 0.50 °C in the control (Table 4).
3.3.2. Skin Conductance
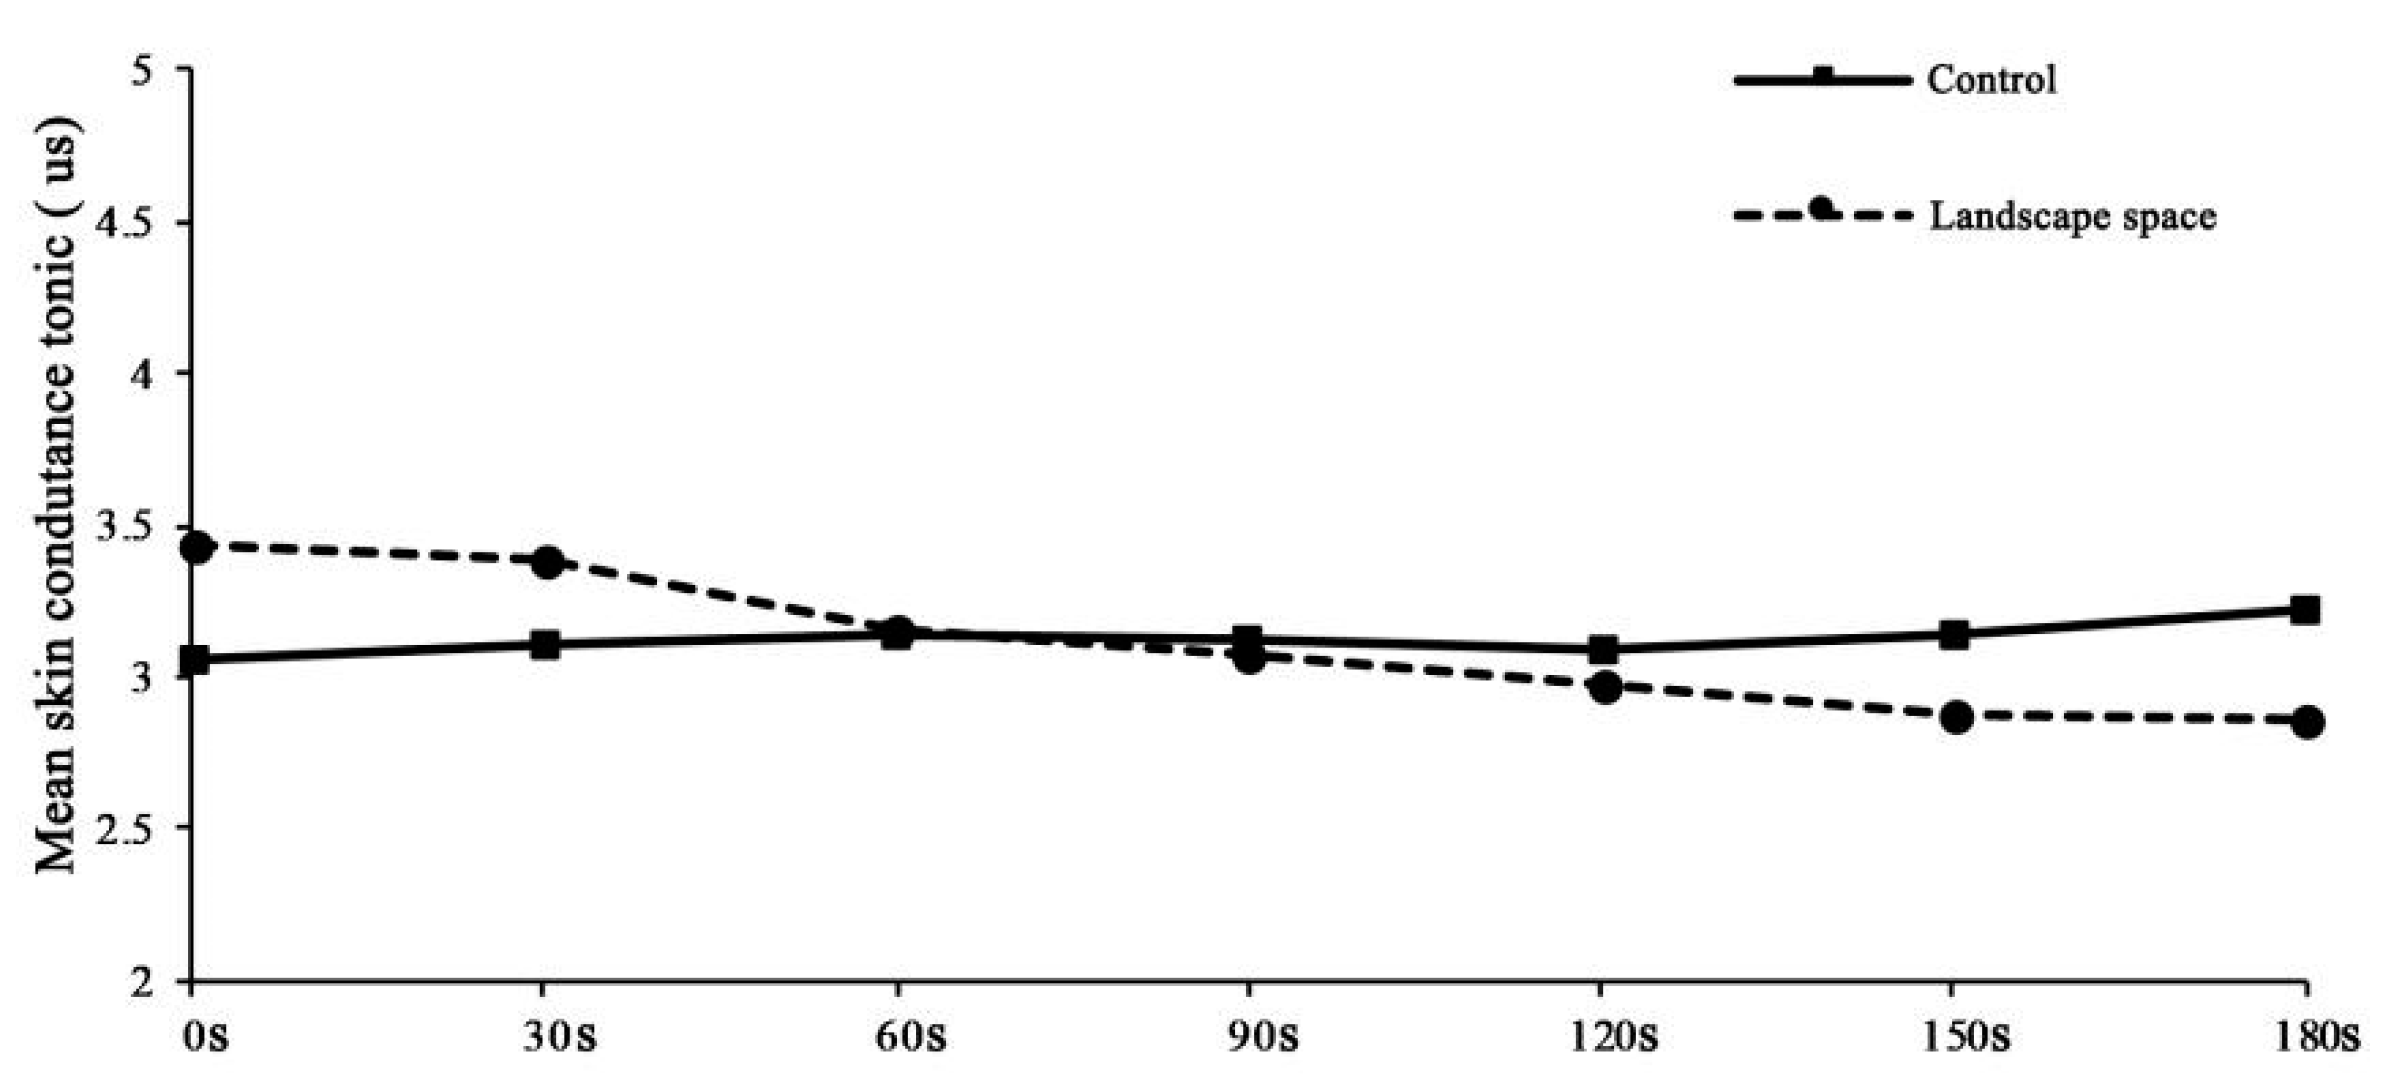
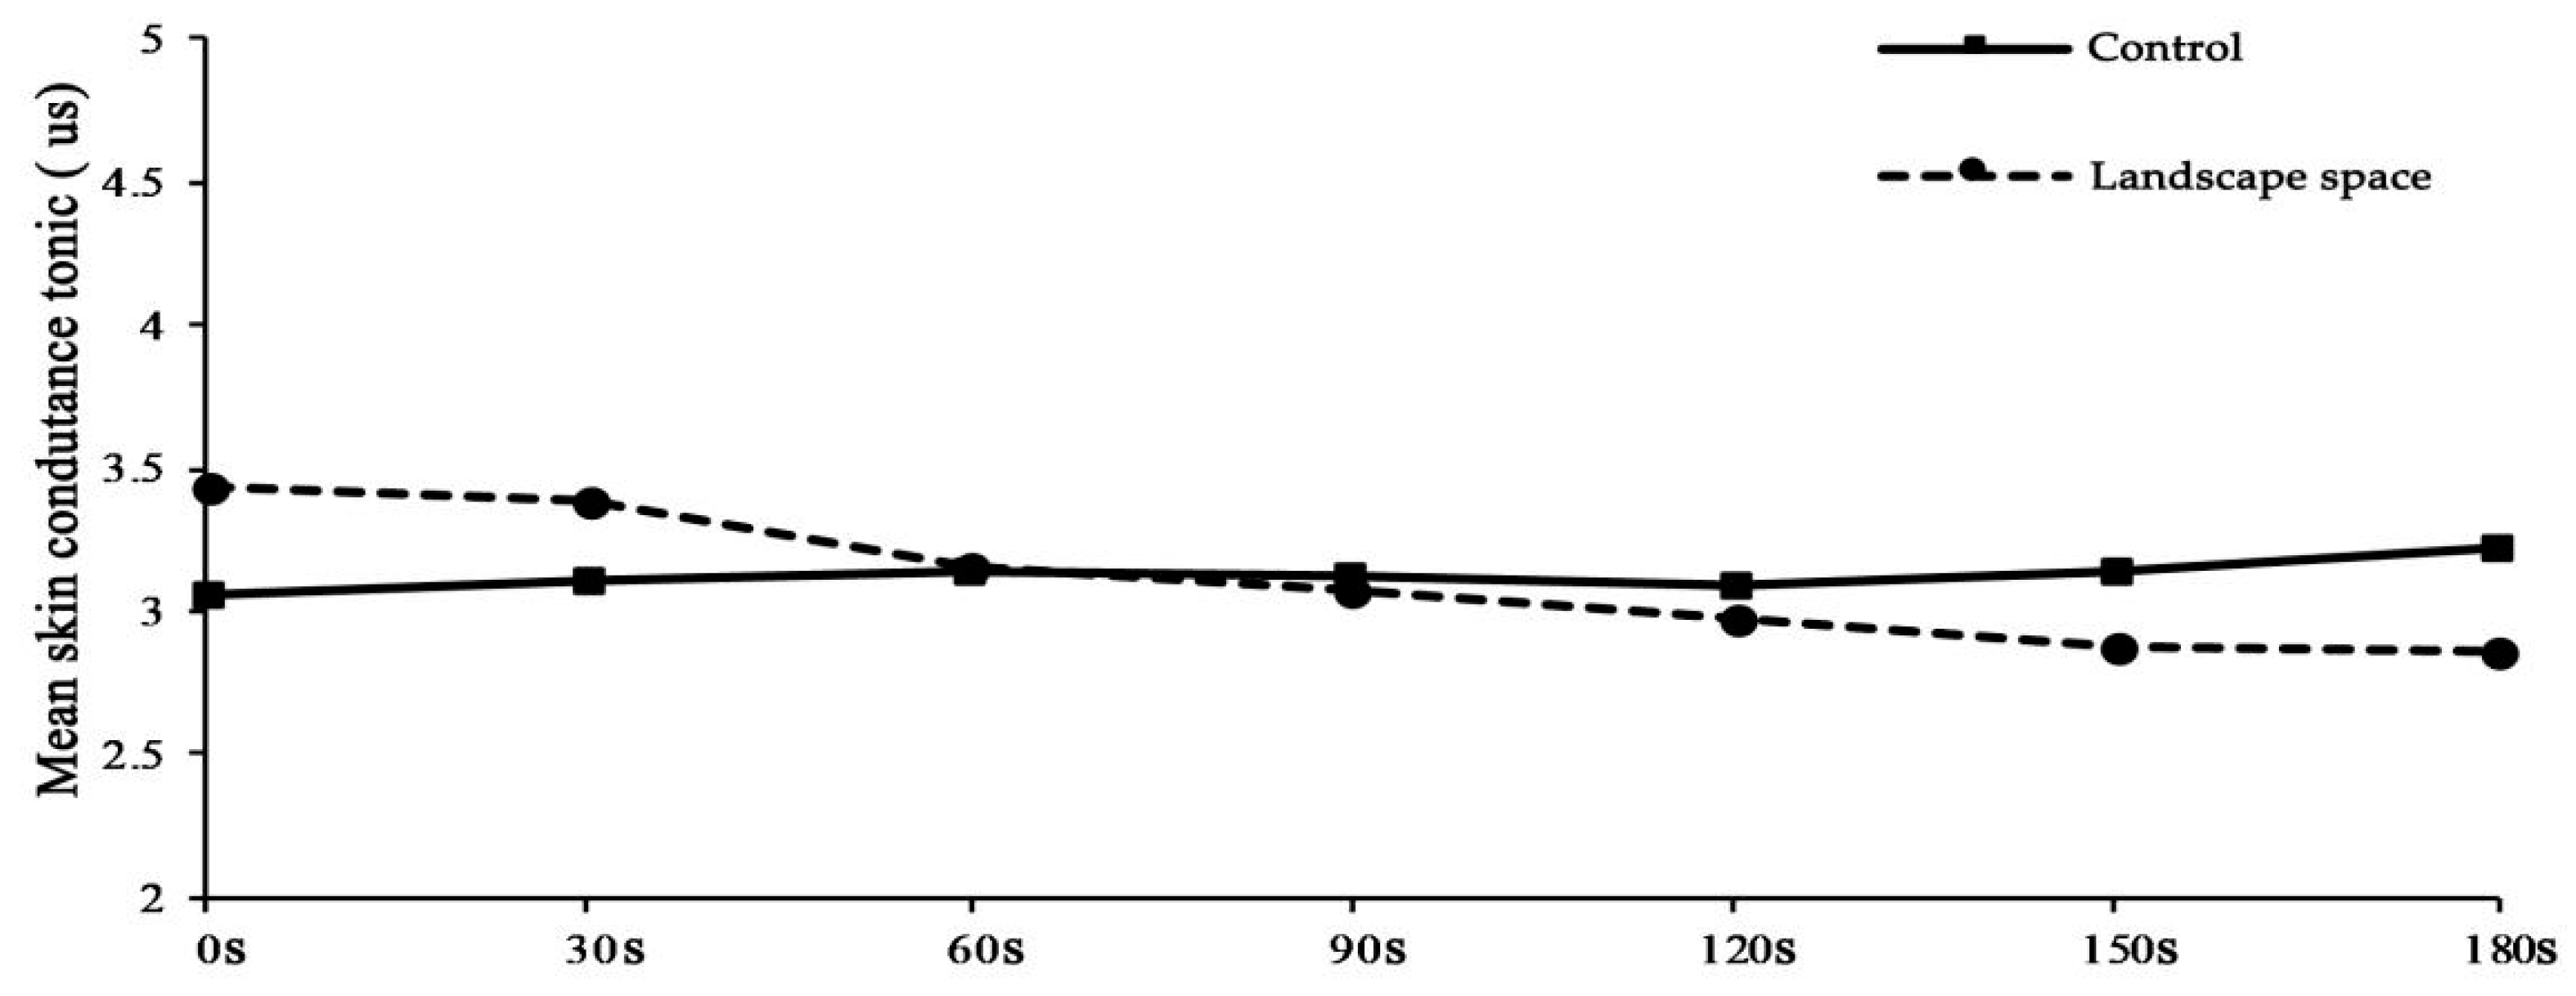
Skin conductance signals were measured using a wearable sensor with a 32-Hz sampling frequency and processed on the ErgoLAB platform (Kingfar Inc., Beijing, China, 2014). Data were filtered using a moving-average then analyzed based on the time domain. Because of the steady-state characteristic of the microclimates, we used SCT (skin conductive tonic signal) to represent skin conductance. Figure 6 demonstrates the trend of the skin conductance of subjects during the 3-min experience period. In the control, mean skin conductance continuously increased during the period, while it decreased more steeply in the landscape microclimates. There was no significant difference in mean SCT between the two sites, while ΔSCT in the control was significantly higher than in the landscape microclimates (0.2 ± 0.7 μs vs. −0.6 ± 1.0 μs, p < 0.001) (Table 4).
3.3.3. Heart Rate Variability
The HRV signal was measured using a wireless wearable sensor, based on the blood volume pulse (BVP), with a 64-Hz sampling frequency, during the 3-min experience period and processed on the ErgoLAB platform. Signals were filtered using the white de-noise method and ectopics were replaced. Then, the time and frequency domain analyses were conducted. As a short-term measurement, the average heart rate (AVHR); average normal-normal intervals (AVNN); standard deviation of normal-normal intervals (SDNN); root-mean-square of the successive differences (RMSSD) of the time domain; and LF power, HF power, and LF/HF of the frequency domain were used to compared the differences between the two sites.
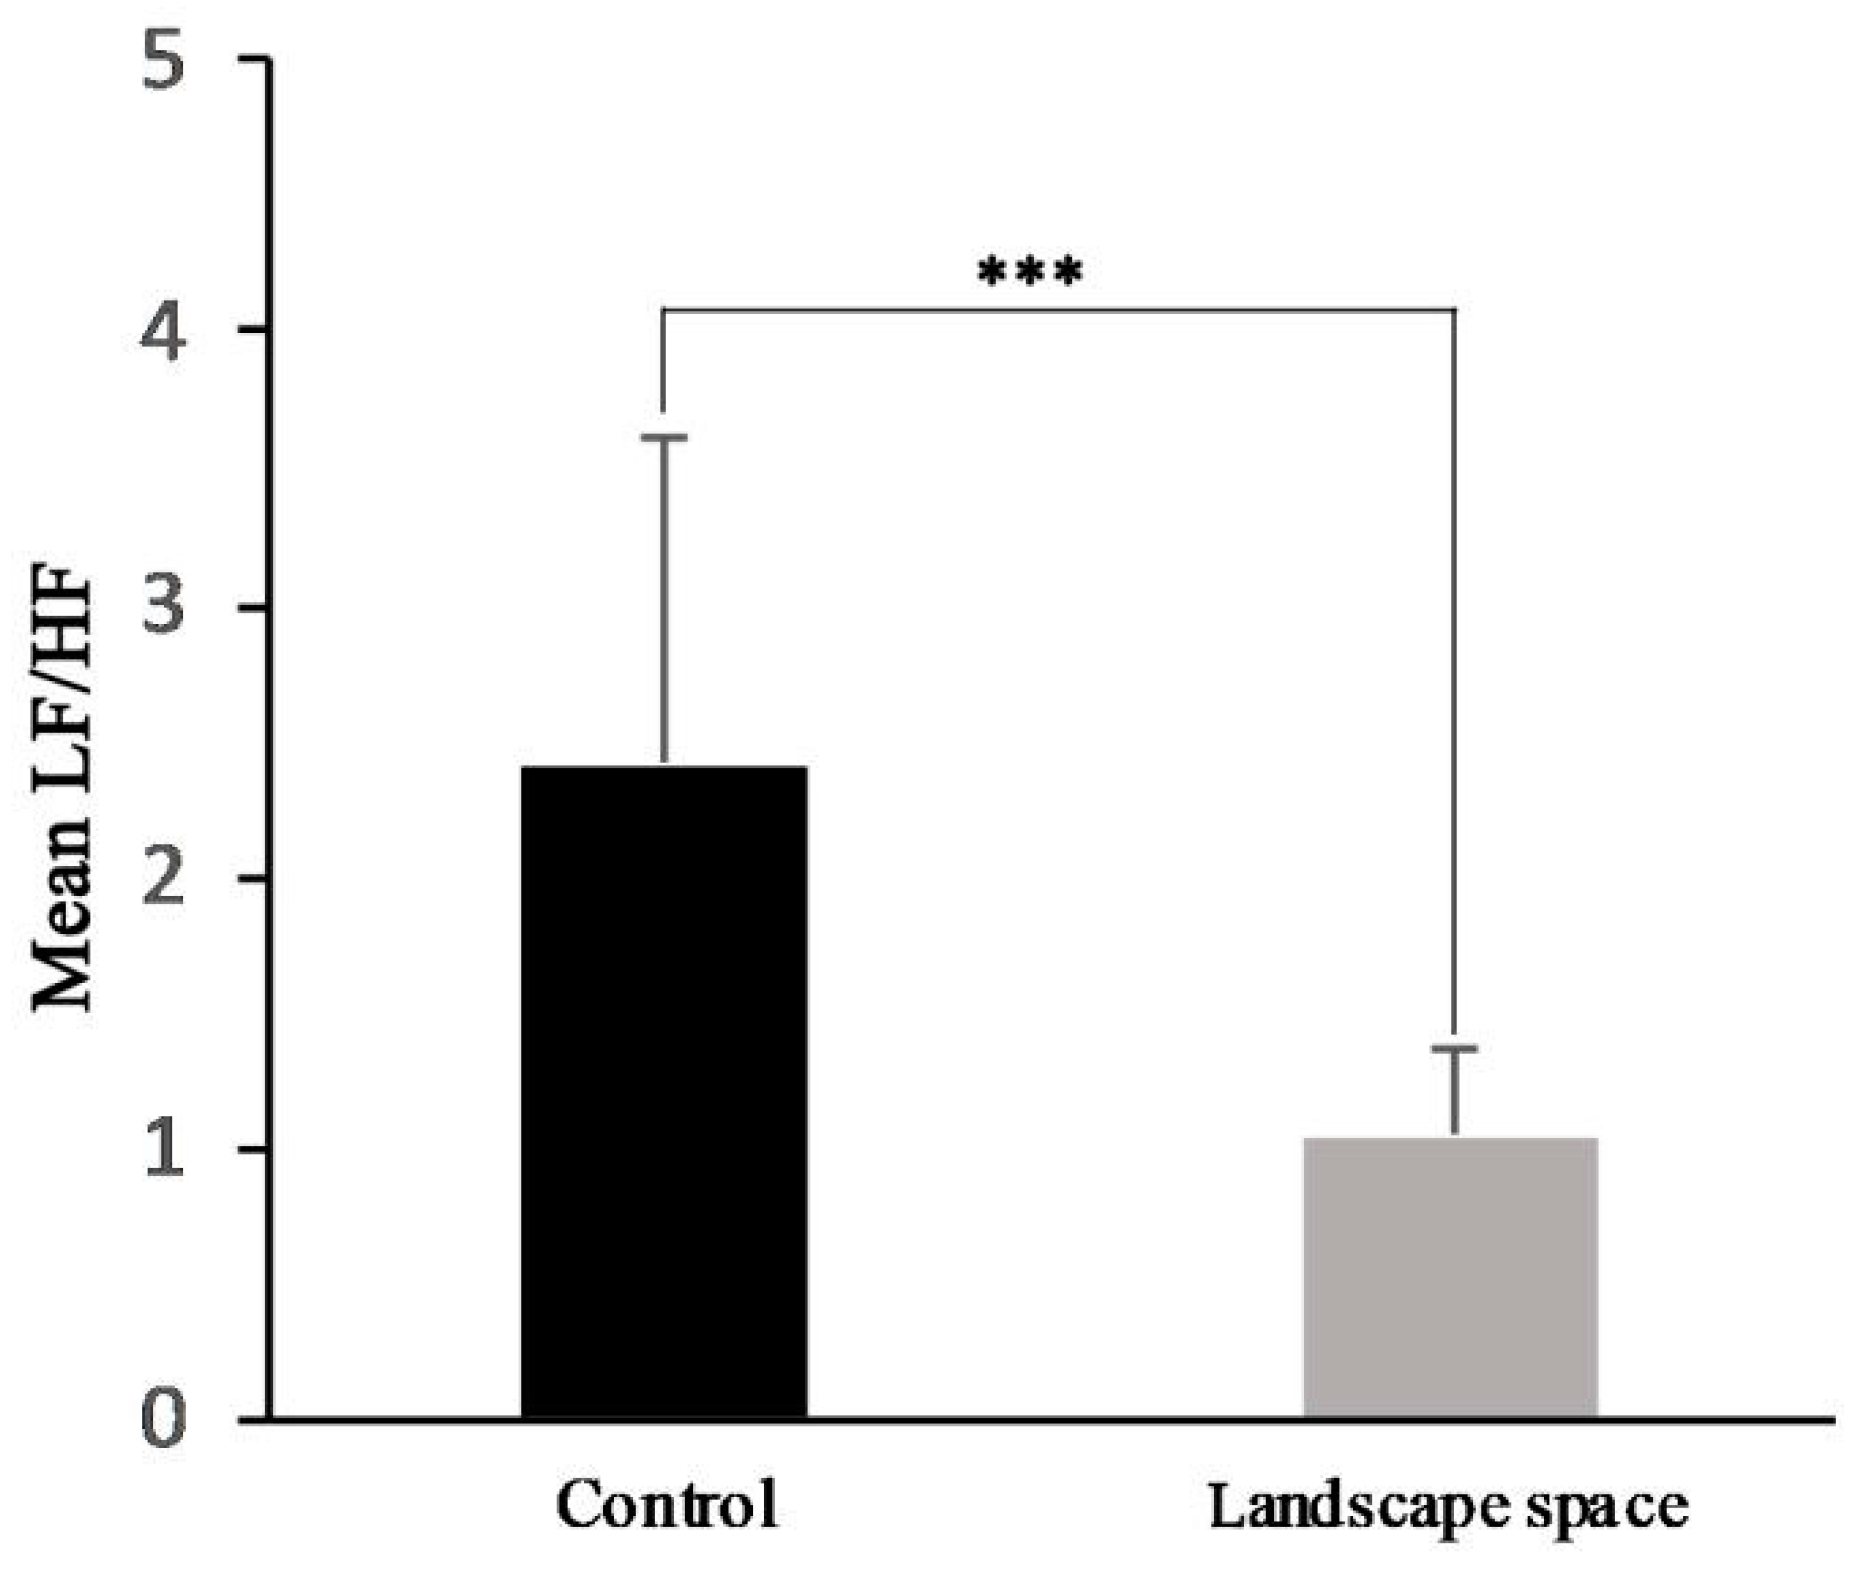
Figure 7 shows that the mean LF/HF in the control was significantly higher than in the landscape (2.41 ± 1.21 vs. 1.04 ± 0.32, p < 0.001). Furthermore, according to Table 5, in the frequency domain, HF in the landscape was significantly higher than in the control (396.2 ± 87.3 vs. 196.1 ± 51.1, p < 0.05). Whereas, for LF, it was the reverse (298.5 ± 52.0 vs. 595.2 ± 132.1, p < 0.05). Further, in the time domain, there were significant differences in SDNN and RMSSD between in the control and landscape spaces, while no significant differences were seen in AVNN and AVHR between these two sites.
4. Discussion
In this investigation of landscape microclimates in relation to the subjects’ psychological responses and physiologically wellbeing, we found the landscape substantially ameliorated microclimatic conditions, thus improving human thermal comfort and physiologically wellbeing compared with the control.
Among those microclimate parameters modified, solar radiation was the most affected. The landscape space was measured to have a lower solar radiation by up to 400 W/m2, resulting mostly from the different SVF. This resulted in a 2.23 decline of RSV in the thermal comfort survey (Figure 4). This is similar to previous study findings [2,44]. In contrast, air temperature changed the least among the five parameters, with decreases of less than 2 °C. This was an expected result and was likely caused by very efficient mixing of air at 1.5 m above the ground [45]. Similar results have been documented in previous studies. For examples, Thorsson et al. found that the air temperature in a park was only about 1.1 °C lower than in an adjacent urban square [46].
For the psychological responses, similar to other previous results [47,48], we found that solar radiation and air temperature had the strongest positive correlation with the thermal sensation vote. In contrast to previous investigations [10,49], there were no significant correlations between WSV and other sensation votes, and likewise for the HSV. This may have been due to the steady and low wind speed during the experiment days.
Further, after the 3-min rest in the landscape microclimates, subjects’ mean skin temperature had decreased by approximately 0.3 °C compared with an increase of nearly 0.5 °C in the control. Yao et al. found that a variation of 2 °C of ambient temperature can cause a pronounced change in skin temperature [24]. Previous research in biological theory has demonstrated that in hot environments, skin temperature increases due to the stimulation of the nervous system because the temperature regulator, located in the hypothalamus, senses the sympathetic tone of skin vessels, which results in an increase of blood flow [50,51].
We also found that the mean ΔSCT in the landscape microclimates was significantly lower than in the control. This meant there was a 0.6 μs decrease of SCT induced by the landscape microclimates compared with an increased 0.2 μs in the control. These results indicated that landscape microclimates may relieve the thermal stress on a human body. Few studies have reported the relationship between SCT and thermal comfort or stress outdoors. Our findings are similar with References [52,53]. They found skin conductance in a state of thermal comfort was significantly lower than in a state of thermal discomfort indoors. Researchers suggested that in uncomfortable thermal environments, human receptors, i.e., finger skin, are stimulated by external heat stress, thus sweat glands are activated to dissipate heat, resulting in an increase of skin electrodermal activity [36].
Unexpectedly, no significant difference of mean SCT was found between the two sites during the 3-min experience period. This may have been due to the gradual change of skin conductance, which may have increased between the two measurements, then remained at a higher value at the beginning of measurement in landscape microclimates (Figure 6).
Lastly, for HRV, similar to References [24,25,26], researchers indicated that LF/HF was higher at a discomfort level compared with a comfort level. We found that LF/HF in the landscape microclimates was significantly lower than in the control, which meant that subjects’ HRV in the landscape microclimates was higher than in the control. It has been shown that the higher the LF/HF, the more relaxed the subject is [54]. The same trend can also be seen in SDNN and RMSSD, both indicating higher HRVs [55].
Few research papers have clearly documented the relationship between different thermal comfort and heart rate. Researchers from environment science suggested there were no differences in heart rate between walking in a natural setting, compared with in an urban setting [22,56,57], while a small sample investigation by Tang and Brown found viewing a natural landscape would lower the heart rate of older women [58]. As shown in Table 5, we observed that neither AVNN nor heart rate showed significant differences between the two sites.
In conclusion, the major strength of our research is that it is the first evidence-based proof that a landscape space can substantially ameliorate the microclimate, and as a result, significantly improve thermal comfort and health, both psychologically and physiologically.
Despite these findings, our research had several limitations. First, our study participants were young college students, so it is not known whether our results are applicable for other age groups.
Second, the experiment site is in a moderate climate zone. Future study should be conducted in other climate zones to verify the results.
Third, considering the heat stress suffered by participants outdoors, we used only short-time measurement in this research. Theoretically, a longer measurement is needed to investigate physiological parameters, particularly, the heart rate variability.
Lastly, since it is hard to eliminate the interference from other unexpected variables in outdoor settings, we optimized the experimental design and data processing methods; however, the results need to be verified by further research.
Notwithstanding these limitations, our research adds to the accumulating evidence that suggests landscape microclimates can improve thermal comfort and both psychological and physiological health and assist urban planners to make better use of landscape microclimates to design sustainable and healthier urban areas.
Supplementary Materials
The following are available online at https://www.mdpi.com/2071-1050/11/19/5387/s1, Table S1: Watchdog weather station parameters, Table S2: Thermal comfort questionnaire.
Author Contributions
All three authors contributed equally to this manuscript.
Funding
This research was funded as a key project of the National Nature Science Foundation of China—“Research on the Design Theory and Method of Landscape Architecture Responses to Microclimate Suitability in Urban Livable Environment” (grant number 51338007).
Acknowledgments
We would like to thank Mohammed Elsadek and Cundong Ma for their kind help during the experiment days.
Conflicts of Interest
The authors declare no conflict of interest.
References
- UN. 2018 Revision of World Urbanization Prospects; United Nations Department of Economic and Social Affairs: New York, NY, USA, 2018. [Google Scholar]
- Lin, T.-P.; Matzarakis, A.; Hwang, R.-L. Shading effect on long-term outdoor thermal comfort. Build. Environ. 2010, 45, 213–221. [Google Scholar] [CrossRef]
- Chen, L.; Ng, E. Outdoor thermal comfort and outdoor activities: A review of research in the past decade. Cities 2012, 29, 118–125. [Google Scholar] [CrossRef]
- Elsadek, M.; Liu, B.; Lian, Z.; Xie, J. The influence of urban roadside trees and their physical environment on stress relief measures: A field experiment in Shanghai. Urban For. Urban Green. 2019, 42, 51–60. [Google Scholar] [CrossRef]
- Olsen, H.; Kennedy, E.; Vanos, J. Shade provision in public playgrounds for thermal safety and sun protection: A case study across 100 play spaces in the United States. Landsc. Urban Plan. 2019, 189, 200–211. [Google Scholar] [CrossRef]
- Harlan, S.L.; Brazel, A.J.; Prashad, L.; Stefanov, W.L.; Larsen, L. Neighborhood microclimates and vulnerability to heat stress. Soc. Sci. Med. 2006, 63, 2847–2863. [Google Scholar] [CrossRef] [PubMed]
- Lin, T.-P. Thermal perception, adaptation and attendance in a public square in hot and humid regions. Build. Environ. 2009, 44, 2017–2026. [Google Scholar] [CrossRef]
- Zacharias, J.; Stathopoulos, T.; Wu, H. Microclimate and downtown open space activity. Environ. Behav. 2001, 33, 296–315. [Google Scholar] [CrossRef]
- Nikolopoulou, M.; Lykoudis, S. Thermal comfort in outdoor urban spaces: Analysis across different European countries. Build. Environ. 2006, 41, 1455–1470. [Google Scholar] [CrossRef] [Green Version]
- Lenzholzer, S. Research and design for thermal comfort in Dutch urban squares. Resour. Conserv. Recycl. 2012, 64, 39–48. [Google Scholar] [CrossRef]
- Nikolopoulou, M.; Baker, N.; Steemers, K. Thermal comfort in outdoor urban spaces: Understanding the human parameter. Sol. Energy 2001, 70, 227–235. [Google Scholar] [CrossRef]
- Brown, R.; Gillespie, T. Estimating outdoor thermal comfort using a cylindrical radiation thermometer and an energy budget model. Int. J. Biometeorol. 1986, 30, 43–52. [Google Scholar] [CrossRef] [PubMed]
- Kenny, N.A.; Warland, J.S.; Brown, R.D.; Gillespie, T.G. Part A: Assessing the performance of the COMFA outdoor thermal comfort model on subjects performing physical activity. Int. J. Biometeorol. 2009, 53, 415. [Google Scholar] [CrossRef]
- Fiala, D.; Havenith, G.; Bröde, P.; Kampmann, B.; Jendritzky, G. UTCI-Fiala multi-node model of human heat transfer and temperature regulation. Int. J. Biometeorol. 2012, 56, 429–441. [Google Scholar] [CrossRef] [PubMed]
- Jendritzky, G.; de Dear, R.; Havenith, G. UTCI—Why another thermal index? Int. J. Biometeorol. 2012, 56, 421–428. [Google Scholar] [CrossRef] [PubMed]
- Bröde, P.; Fiala, D.; Błażejczyk, K.; Holmér, I.; Jendritzky, G.; Kampmann, B.; Tinz, B.; Havenith, G. Deriving the operational procedure for the Universal Thermal Climate Index (UTCI). Int. J. Biometeorol. 2012, 56, 481–494. [Google Scholar] [CrossRef] [PubMed]
- Matzarakis, A.; Mayer, H.; Iziomon, M.G. Applications of a universal thermal index: Physiological equivalent temperature. Int. J. Biometeorol. 1999, 43, 76–84. [Google Scholar] [CrossRef] [PubMed]
- Fanger, P.O. Thermal Comfort, Analysis and Application in Environmental Engineering; McGrew-Hill: New York, NY, USA, 1972. [Google Scholar]
- Algeciras, J.A.R.; Consuegra, L.G.; Matzarakis, A. Spatial-temporal study on the effects of urban street configurations on human thermal comfort in the world heritage city of Camagüey-Cuba. Build. Environ. 2016, 101, 85–101. [Google Scholar] [CrossRef]
- Kariminia, S.; Ahmad, S.S.; Saberi, A. Microclimatic Conditions of an Urban Square: Role of built environment and geometry. Procedia-Soc. Behav. Sci. 2015, 170, 718–727. [Google Scholar] [CrossRef]
- Fahmy, M.; Sharples, S.; Eltrapolsi, A. Dual stage Simulations to Study the Microclimatic Effects of Trees on Thermal Comfort in a Residential Building, Cairo, Egypt. In Proceedings of the 11th International IBPSA Conference, Glasgow, UK, 27–30 July 2009. [Google Scholar]
- Gladwell, V.; Brown, D.; Barton, J.L.; Tarvainen, M.; Kuoppa, P.; Pretty, J.; Suddaby, J.; Sandercock, G. The effects of views of nature on autonomic control. Eur. J. Appl. Physiol. 2012, 112, 3379–3386. [Google Scholar] [CrossRef]
- Lee, J. Experimental study on the health benefits of garden landscape. Int. J. Environ. Res. Public Health 2017, 14, 829. [Google Scholar] [CrossRef]
- Yao, Y.; Lian, Z.; Liu, W.; Shen, Q. Experimental study on physiological responses and thermal comfort under various ambient temperatures. Physiol. Behav. 2008, 93, 310–321. [Google Scholar] [CrossRef] [PubMed]
- Xiong, J.; Lian, Z.; Zhang, H. Physiological response to typical temperature step-changes in winter of China. Energy Build. 2017, 138, 687–694. [Google Scholar] [CrossRef]
- Liu, W.; Lian, Z.; Liu, Y. Heart rate variability at different thermal comfort levels. Eur. J. Appl. Physiol. 2008, 103, 361–366. [Google Scholar] [CrossRef] [PubMed]
- Vanos, J.K.; Warland, J.S.; Gillespie, T.J.; Kenny, N.A. Review of the physiology of human thermal comfort while exercising in urban landscapes and implications for bioclimatic design. Int. J. Biometeorol. 2010, 54, 319–334. [Google Scholar] [CrossRef] [PubMed]
- McKnight, T.L.; Hess, D. Climate Zones and Types: The Koppen System, Physical Geography: A Landscape Appreciation; Pearson: Upper Saddle River, NJ, USA, 2000. [Google Scholar]
- ANSI/ASHARE Standard 55, Thermal Environmental Conditions for Human Occupancy; ASHRAE Inc.: Atlanta, GA, USA, 2004.
- Livingston, E.H.; Kohlstadt, I. Simplified resting metabolic rate—Predicting formulas for normal-sized and obese individuals. Obes. Res. 2005, 13, 1255–1262. [Google Scholar] [CrossRef]
- Zhang, Y.; Kang, J.; Jin, H. An Experimental Study on the Restorative Experience of Typical Urban Soundscape Based on EDA; The International Institute of Acoustics and Vibration: Auburn, AL, USA, 2015. [Google Scholar]
- Zou, H.; Li, N.; Cao, L. Emotional response–based approach for assessing the sense of presence of subjects in virtual building evacuation studies. J. Comput. Civ. Eng. 2017, 31, 04017028. [Google Scholar] [CrossRef]
- Zhang, Y.; Hu, W.; Xiao, L.; Chen, Y.; Zhao, C.; Hu, H. Study on the Influences of Vehicle Braking Failure on Human’s Physiological and Psychological Behavior. In International Conference on Applied Human Factors and Ergonomics; Springer: Cham, Switzerland, 2018; pp. 795–801. [Google Scholar] [CrossRef]
- Wang, D.; Zhang, H.; Arens, E.; Huizenga, C. Observations of upper-extremity skin temperature and corresponding overall-body thermal sensations and comfort. Build. Environ. 2007, 42, 3933–3943. [Google Scholar] [CrossRef] [Green Version]
- Jacquot, C.M.; Schellen, L.; Kingma, B.R.; van Baak, M.A.; van Marken Lichtenbelt, W.D. Influence of thermophysiology on thermal behavior: The essentials of categorization. Physiol. Behav. 2014, 128, 180–187. [Google Scholar] [CrossRef]
- Hasanbasic, A.; Spahic, M.; Bosnjic, D.; Mesic, V.; Jahic, O. Recognition of Stress Levels among Students with Wearable Sensors. In Proceedings of the 2019 18th International Symposium Infoteh-Jahorina (Infoteh), Jahorina mountain, Republic of Srpska, 20–22 March 2019; pp. 1–4. [Google Scholar] [CrossRef]
- McCraty, R.; Shaffer, F. Heart rate variability: New perspectives on physiological mechanisms, assessment of self-regulatory capacity, and health risk. Glob. Adv. Health Med. 2015, 4, 46–61. [Google Scholar] [CrossRef]
- Markov, A.; Solonin, I.; Bojko, E. Heart rate variability in workers of various professions in contrasting seasons of the year. Int. J. Occup. Med. Environ. Health 2016, 29, 793. [Google Scholar] [CrossRef]
- Okada, M.; Kakehashi, M. Effects of outdoor temperature on changes in physiological variables before and after lunch in healthy women. Int. J. Biometeorol. 2014, 58, 1973–1981. [Google Scholar] [CrossRef] [PubMed] [Green Version]
- Malliani, A.; Pagani, M.; Lombardi, F.; Cerutti, S. Cardiovascular neural regulation explored in the frequency domain. Circulation 1991, 84, 482–492. [Google Scholar] [CrossRef] [PubMed]
- Zhu, H.; Wang, H.; Liu, Z.; Li, D.; Kou, G.; Li, C. Experimental study on the human thermal comfort based on the heart rate variability (HRV) analysis under different environments. Sci. Total Environ. 2018, 616, 1124–1133. [Google Scholar] [CrossRef] [PubMed]
- Baek, H.J.; Cho, C.-H.; Cho, J.; Woo, J.-M. Reliability of ultra-short-term analysis as a surrogate of standard 5-min analysis of heart rate variability. Telemed. E Health 2015, 21, 404–414. [Google Scholar] [CrossRef] [PubMed]
- Salahuddin, L.; Cho, J.; Jeong, M.G.; Kim, D. Ultra Short Term Analysis of Heart rate Variability for Monitoring Mental Stress in Mobile Settings. In Proceedings of the 2007 29th Annual International Conference of the IEEE Engineering in Medicine and Biology Society, Lyon, France, 23–26 August 2007; pp. 4656–4659. [Google Scholar] [CrossRef]
- Mazhar, N.; Brown, R.D.; Kenny, N.; Lenzholzer, S. Thermal comfort of outdoor spaces in Lahore, Pakistan: Lessons for bioclimatic urban design in the context of global climate change. Landsc. Urban Plan. 2015, 138, 110–117. [Google Scholar] [CrossRef]
- Brown, R.D.; Gillespie, T.J. Microclimatic Landscape Design: Creating Thermal Comfort and Energy Efficiency; John Wiley & Sons, Inc.: New York, NY, USA, 1995. [Google Scholar]
- Thorsson, S.; Honjo, T.; Lindberg, F.; Eliasson, I.; Lim, E.-M. Thermal comfort and outdoor activity in Japanese urban public places. Environ. Behav. 2007, 39, 660–684. [Google Scholar] [CrossRef]
- Yang, W.; Wong, N.H.; Jusuf, S.K. Thermal comfort in outdoor urban spaces in Singapore. Build. Environ. 2013, 59, 426–435. [Google Scholar] [CrossRef]
- Li, L.; Zhou, X.; Yang, L. The Analysis of Outdoor Thermal Comfort in Guangzhou during Summer. Procedia Eng. 2017, 205, 1996–2002. [Google Scholar] [CrossRef]
- Taleghani, M.; Kleerekoper, L.; Tenpierik, M.; van den Dobbelsteen, A. Outdoor thermal comfort within five different urban forms in the Netherlands. Build. Environ. 2015, 83, 65–78. [Google Scholar] [CrossRef]
- Campbell, I. Body temperature and its regulation. Anaesth. Intensive Care Med. 2008, 9, 259–263. [Google Scholar] [CrossRef]
- Tansey, E.; Roe, S.; Johnson, C. The sympathetic release test: A test used to assess thermoregulation and autonomic control of blood flow. Adv. Physiol. Educ. 2014, 38, 87–92. [Google Scholar] [CrossRef] [PubMed]
- Wang, H.; Hu, S. Experimental study on thermal sensation of people in moderate activities. Build. Environ. 2016, 100, 127–134. [Google Scholar] [CrossRef]
- Chaudhuri, T. Predictive Modelling of Thermal Comfort Using Physiological Sensing. Ph.D. Dissertation, Interdisciplinary Graduate School, Singapore, 31 December 2018. [Google Scholar]
- Malik, M. Heart rate variability: Standards of measurement, physiological interpretation, and clinical use: Task force of the European Society of Cardiology and the North American Society for Pacing and Electrophysiology. Ann. Noninvasive Electrocardiol. 1996, 1, 151–181. [Google Scholar] [CrossRef]
- Shaffer, F.; Ginsberg, J. An overview of heart rate variability metrics and norms. Front. Public Health 2017, 5, 258. [Google Scholar] [CrossRef] [PubMed]
- Hartig, T.; Mang, M.; Evans, G.W. Restorative effects of natural environment experiences. Environ. Behav. 1991, 23, 3–26. [Google Scholar] [CrossRef]
- Ottosson, J.; Grahn, P. Measures of restoration in geriatric care residences: The influence of nature on elderly people’s power of concentration, blood pressure and pulse rate. J. Hous. Elder. 2006, 19, 227–256. [Google Scholar] [CrossRef]
- Tang, J.W.; Brown, R.D. The effect of viewing a landscape on physiological health of elderly women. J. Hous. Elder. 2006, 19, 187–202. [Google Scholar] [CrossRef]
Figure 1.
(a) Century Square plan and space location of two sites, (b) site 2: landscape space, (c) sky view factor of site 2, (d) site 1: open space, and (e) sky view factor of site 1.
Figure 1.
(a) Century Square plan and space location of two sites, (b) site 2: landscape space, (c) sky view factor of site 2, (d) site 1: open space, and (e) sky view factor of site 1.

Figure 2.
Experiment design.

Figure 3.
Microclimate parameters trends during experiment days: (a) solar radiation trend, (b) air temperature trend, (c) relative humidity trend, (d) wind speed trend, and (e) ground temperature trend.
Figure 3.
Microclimate parameters trends during experiment days: (a) solar radiation trend, (b) air temperature trend, (c) relative humidity trend, (d) wind speed trend, and (e) ground temperature trend.

Figure 4.
Thermal comfort response votes in landscape microclimates and the control; n = 22, mean ± SD, ** p < 0.01, *** p < 0.001 (Wilcoxon-signed rank test).
Figure 4.
Thermal comfort response votes in landscape microclimates and the control; n = 22, mean ± SD, ** p < 0.01, *** p < 0.001 (Wilcoxon-signed rank test).

Figure 5.
Mean skin temperature trend of subjects during 3 min experience period (n = 22).

Figure 6.
Mean skin conductance tonic trend of subjects during the 3-min experience period (n = 22).
Figure 6.
Mean skin conductance tonic trend of subjects during the 3-min experience period (n = 22).

Figure 7.
LF/HF during the 3-min experience period; n = 22, mean ± SD, *** p < 0.001 (Wilcoxon-signed rank test).
Figure 7.
LF/HF during the 3-min experience period; n = 22, mean ± SD, *** p < 0.001 (Wilcoxon-signed rank test).


Table 1.
Subjects’ information summary.
| Gender | Subjects (n) | Age (Years) | Height (cm) | Weight (kg) | Clothing (clo) | Metabolic Rate (kJ) |
|---|---|---|---|---|---|---|
| Male | 13 | 26.1 ± 5.4 | 173.8 ± 0.1 | 66.8 ± 5.8 | 0.42 ± 0.1 | 103.3 ± 2.7 |
| Female | 9 | 22.6 ± 4.2 | 163.2 ± 0.1 | 52.6 ± 2.9 | 0.49 ± 0.1 | 93.1 ± 2.2 |
| Total | 22 | 24.6 ± 5.2 | 169.1 ± 0.7 | 60.9 ± 8.5 | 0.45 ± 0.1 | 99.1 ± 5.6 |
Values are means ± standard deviation.
Table 2.
Microclimate parameters summary during the experiment days.
| Site | Solar Radiation (W/m2) | Air Temperature (°C) | Relative Humidity (%) | Wind Speed (km/h) | Ground Temperature (°C) |
|---|---|---|---|---|---|
| Control | 497.6 ± 334.11 | 34.74 ± 1.94 | 56.89 ± 6.54 | 2.41 ± 2.41 | 45.44 ± 5.58 |
| Landscape space | 59.42 ± 54.84 *** | 32.49 ± 1.25 *** | 62.62 ± 4.60 *** | 0.31 ± 0.83 *** | 32.68 ± 1.34 *** |
Values are means ± standard deviation. *** p < 0.001 (Wilcoxon-signed rank test).
Table 3.
Correlation analysis for thermal response votes.
| TSV | CSV | ASV | RSV | WSV | HSV | |
|---|---|---|---|---|---|---|
| TSV | 1 | −0.61 ** | 0.69 ** | 0.79 ** | 0.03 | −0.16 |
| CSV | 1 | −0.56 ** | −0.44 ** | 0.02 | 0.19 | |
| ASV | 1 | 0.56 ** | −0.14 | −0.13 | ||
| RSV | 1 | 0.23 | −0.11 | |||
| WSV | 1 | 0.08 | ||||
| HSV | 1 |
** p < 0.01 (Wilcoxon-signed rank test).
Table 4.
Skin temperature and skin conductance summary during the 3-min experience period.
| Mean SKT (°C) | ΔSKT (°C) | Mean SCT (μs) | ΔSCT (μs) | |
|---|---|---|---|---|
| Control | 36.3 ± 0.2 | 0.5 ± 0.9 | 3.1 ± 0.1 | 0.2 ± 0.7 |
| Landscape space | 35.2 ± 0.1 ** | −0.3 ± 0.8 * | 3.2 ± 0.2 | −0.6 ± 1.0 *** |
Values are means ± standard deviation (n = 22). *** p < 0.001, ** p < 0.01, * p < 0.05 (Wilcoxon-signed rank test).
Table 5.
Time and frequency domain analyses of the HRV summary during the 3-min experience period.
| AVHR (bpm) | AVNN (ms) | SDNN (ms) | RMSSD (ms) | LF Power (ms2) | HF Power (ms2) | |
|---|---|---|---|---|---|---|
| Control | 96.6 (2.6) | 622.3 (15.7) | 40.9 (4.1) | 47.8 (7.9) | 595.2 (132.1) | 196.1 (51.1) |
| Landscape space | 96 (2.5) | 621.9 (14.7) | 51.4 (4.6) * | 57.6 (5.6) * | 298.5 (52.0) * | 396.2 (87.3) * |
Values are means (SEM) (n = 22). * p < 0.05 (Wilcoxon-signed rank test).
© 2019 by the authors. Licensee MDPI, Basel, Switzerland. This article is an open access article distributed under the terms and conditions of the Creative Commons Attribution (CC BY) license (http://creativecommons.org/licenses/by/4.0/).
Share and Cite
MDPI and ACS Style
Liu, B.; Lian, Z.; Brown, R.D. Effect of Landscape Microclimates on Thermal Comfort and Physiological Wellbeing. Sustainability 2019, 11, 5387. https://doi.org/10.3390/su11195387
AMA Style
Liu B, Lian Z, Brown RD. Effect of Landscape Microclimates on Thermal Comfort and Physiological Wellbeing. Sustainability. 2019; 11(19):5387. https://doi.org/10.3390/su11195387
Chicago/Turabian StyleLiu, Binyi, Zefeng Lian, and Robert D. Brown. 2019. "Effect of Landscape Microclimates on Thermal Comfort and Physiological Wellbeing" Sustainability 11, no. 19: 5387. https://doi.org/10.3390/su11195387
Note that from the first issue of 2016, this journal uses article numbers instead of page numbers. See further details here.