Assessment of Hydrological Changes and Their Influence on the Aquatic Ecology over the last 58 Years in Ganjiang Basin, China

 , ,
, ,
Abstract
:1. Introduction
2. Materials and Methods
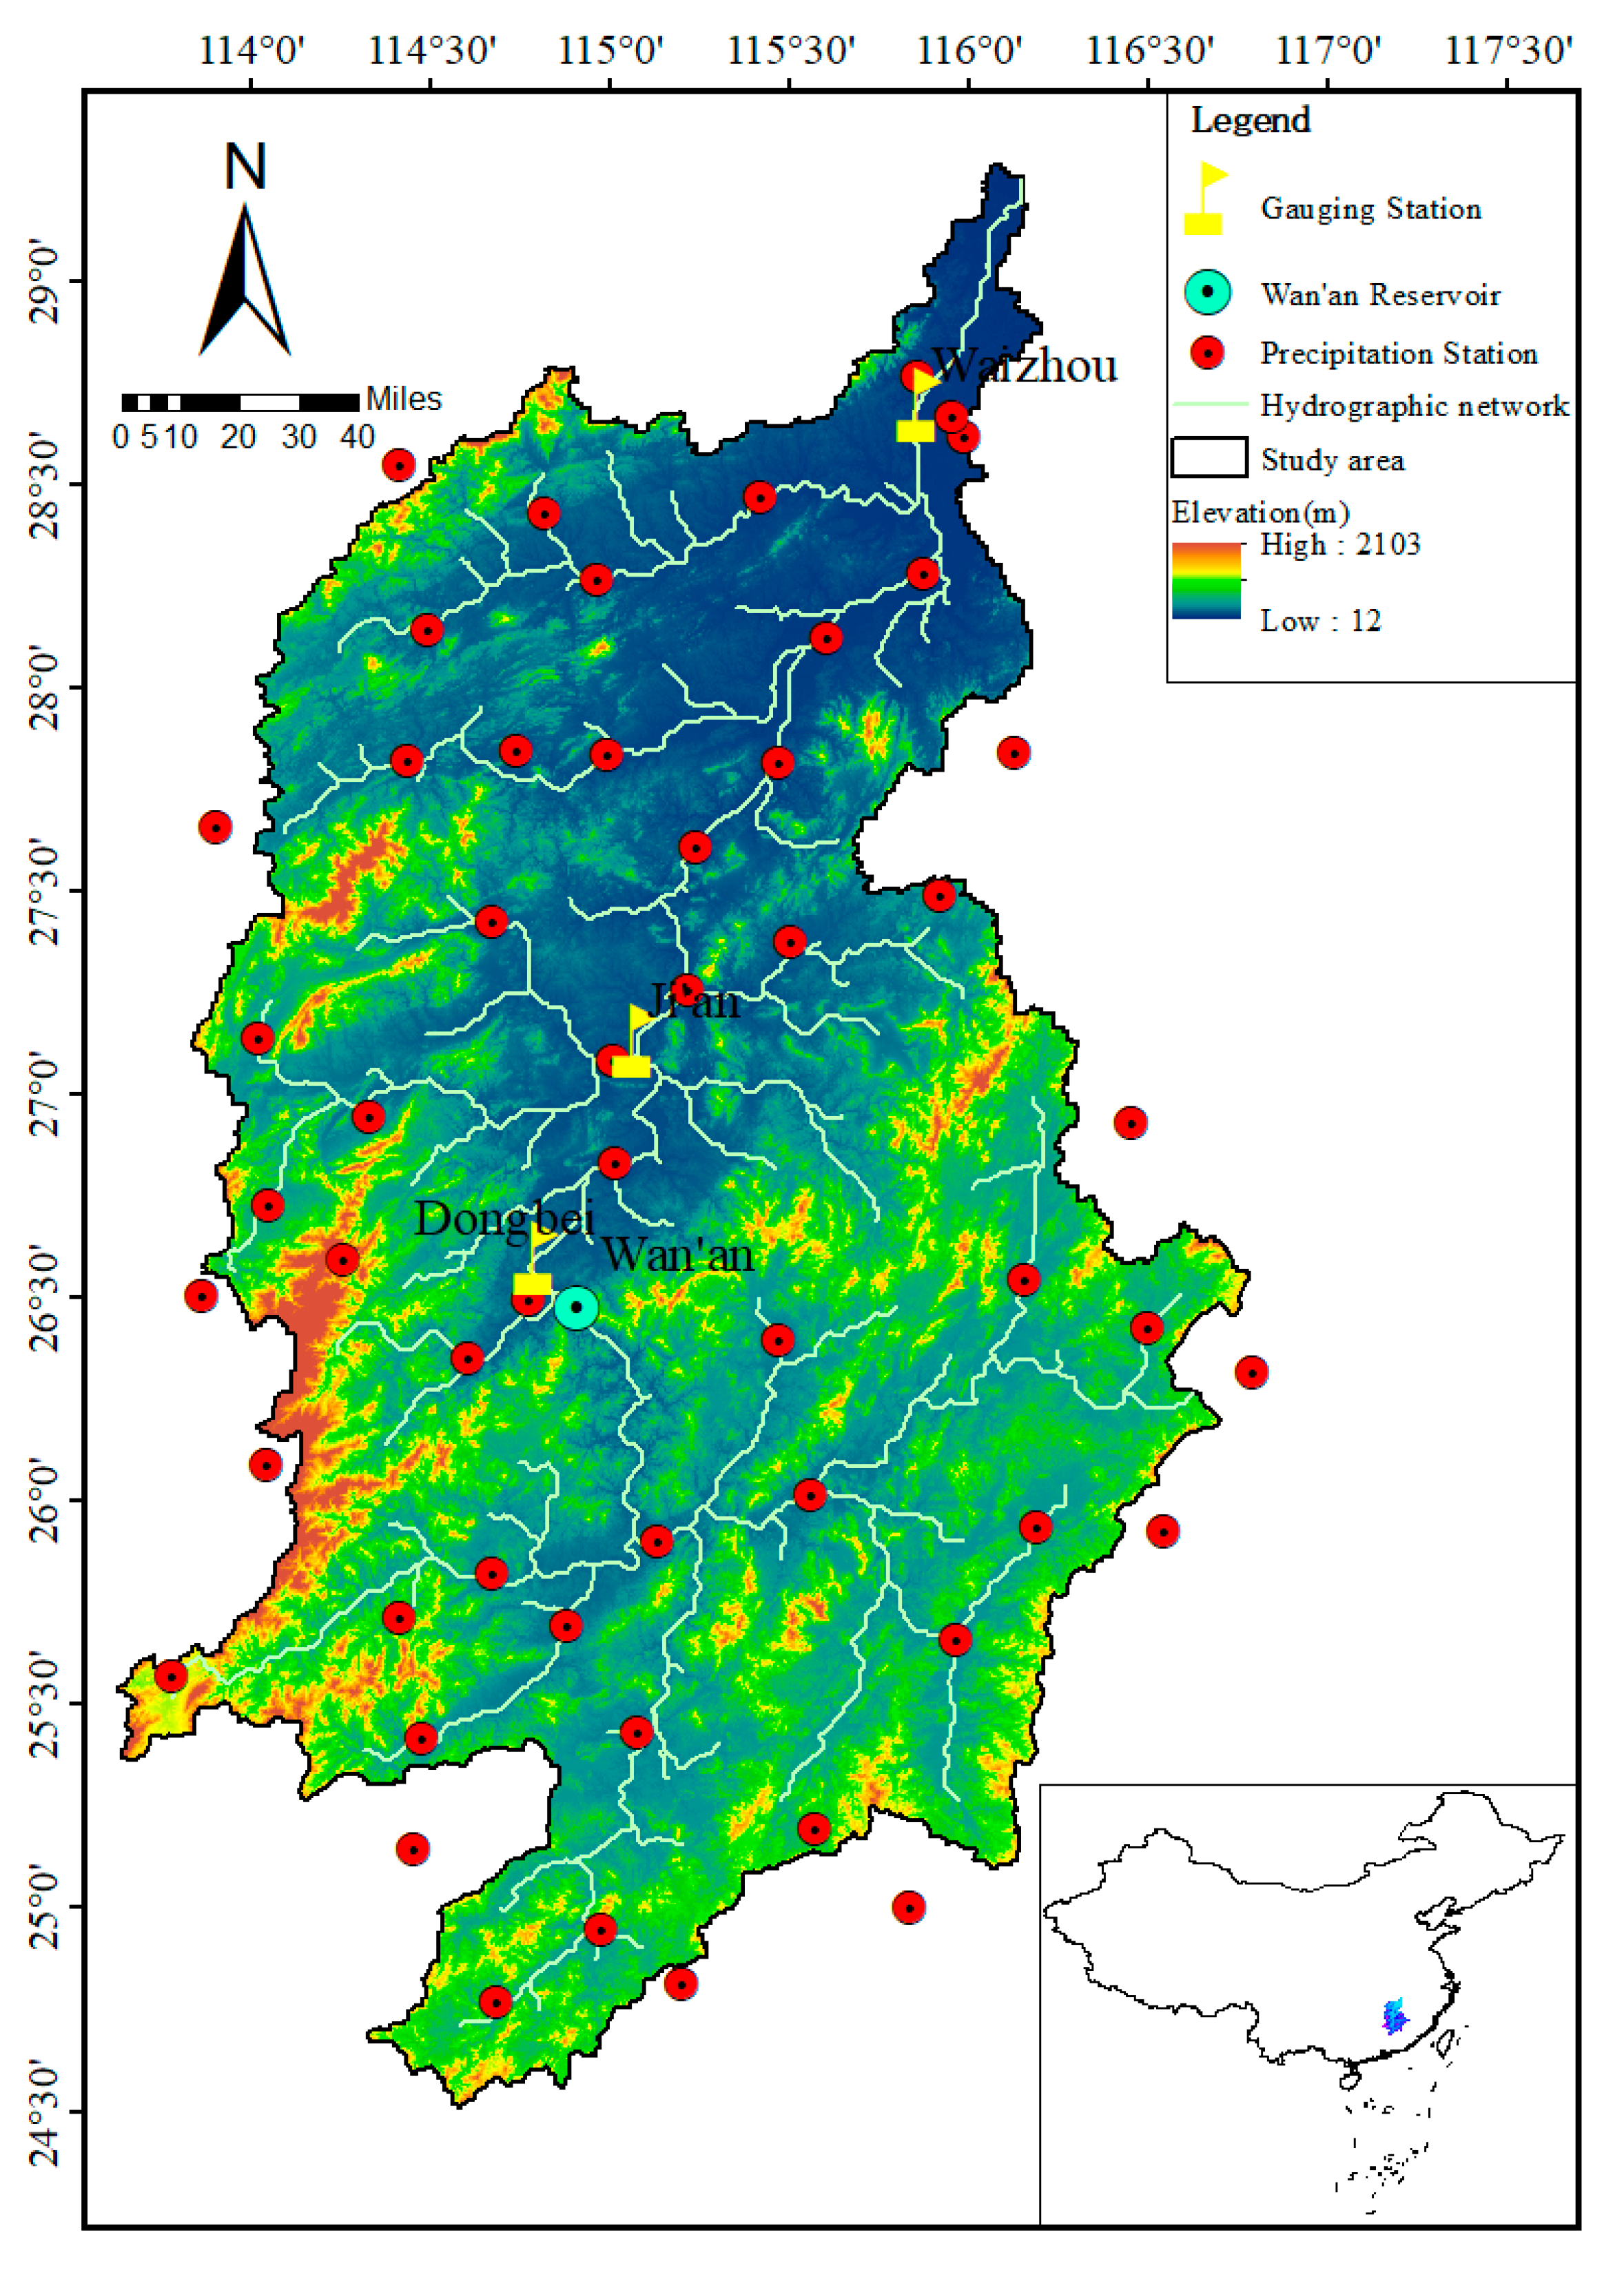
2.1. Ganjiang River Basin
2.2. Data
2.3. Method
2.3.1. Trend and Abrupt Change Analysis Method
2.3.2. Indicators of Hydrological Alteration (IHA)
3. Results
3.1. Trend and Abrupt Change Analysis of Precipitation and Runoff
3.2. IHA Changes in Typical Sections of the Upper, Middle and Lower Reaches of the Ganjiang River Basin
3.2.1. Upstream Typical Section
3.2.2. Middle Typical Section
3.2.3. Downstream Typical Section
3.2.4. Comparison of Changes in IHA in Upper, Middle and Lower Reaches
4. Discussion
4.1. Impact of Climate Change and Human Activities on Runoff Change of Ganjiang River
4.2. The Influence of Reservoir on Hydrological Regime and River Ecology
5. Conclusions
- (1)
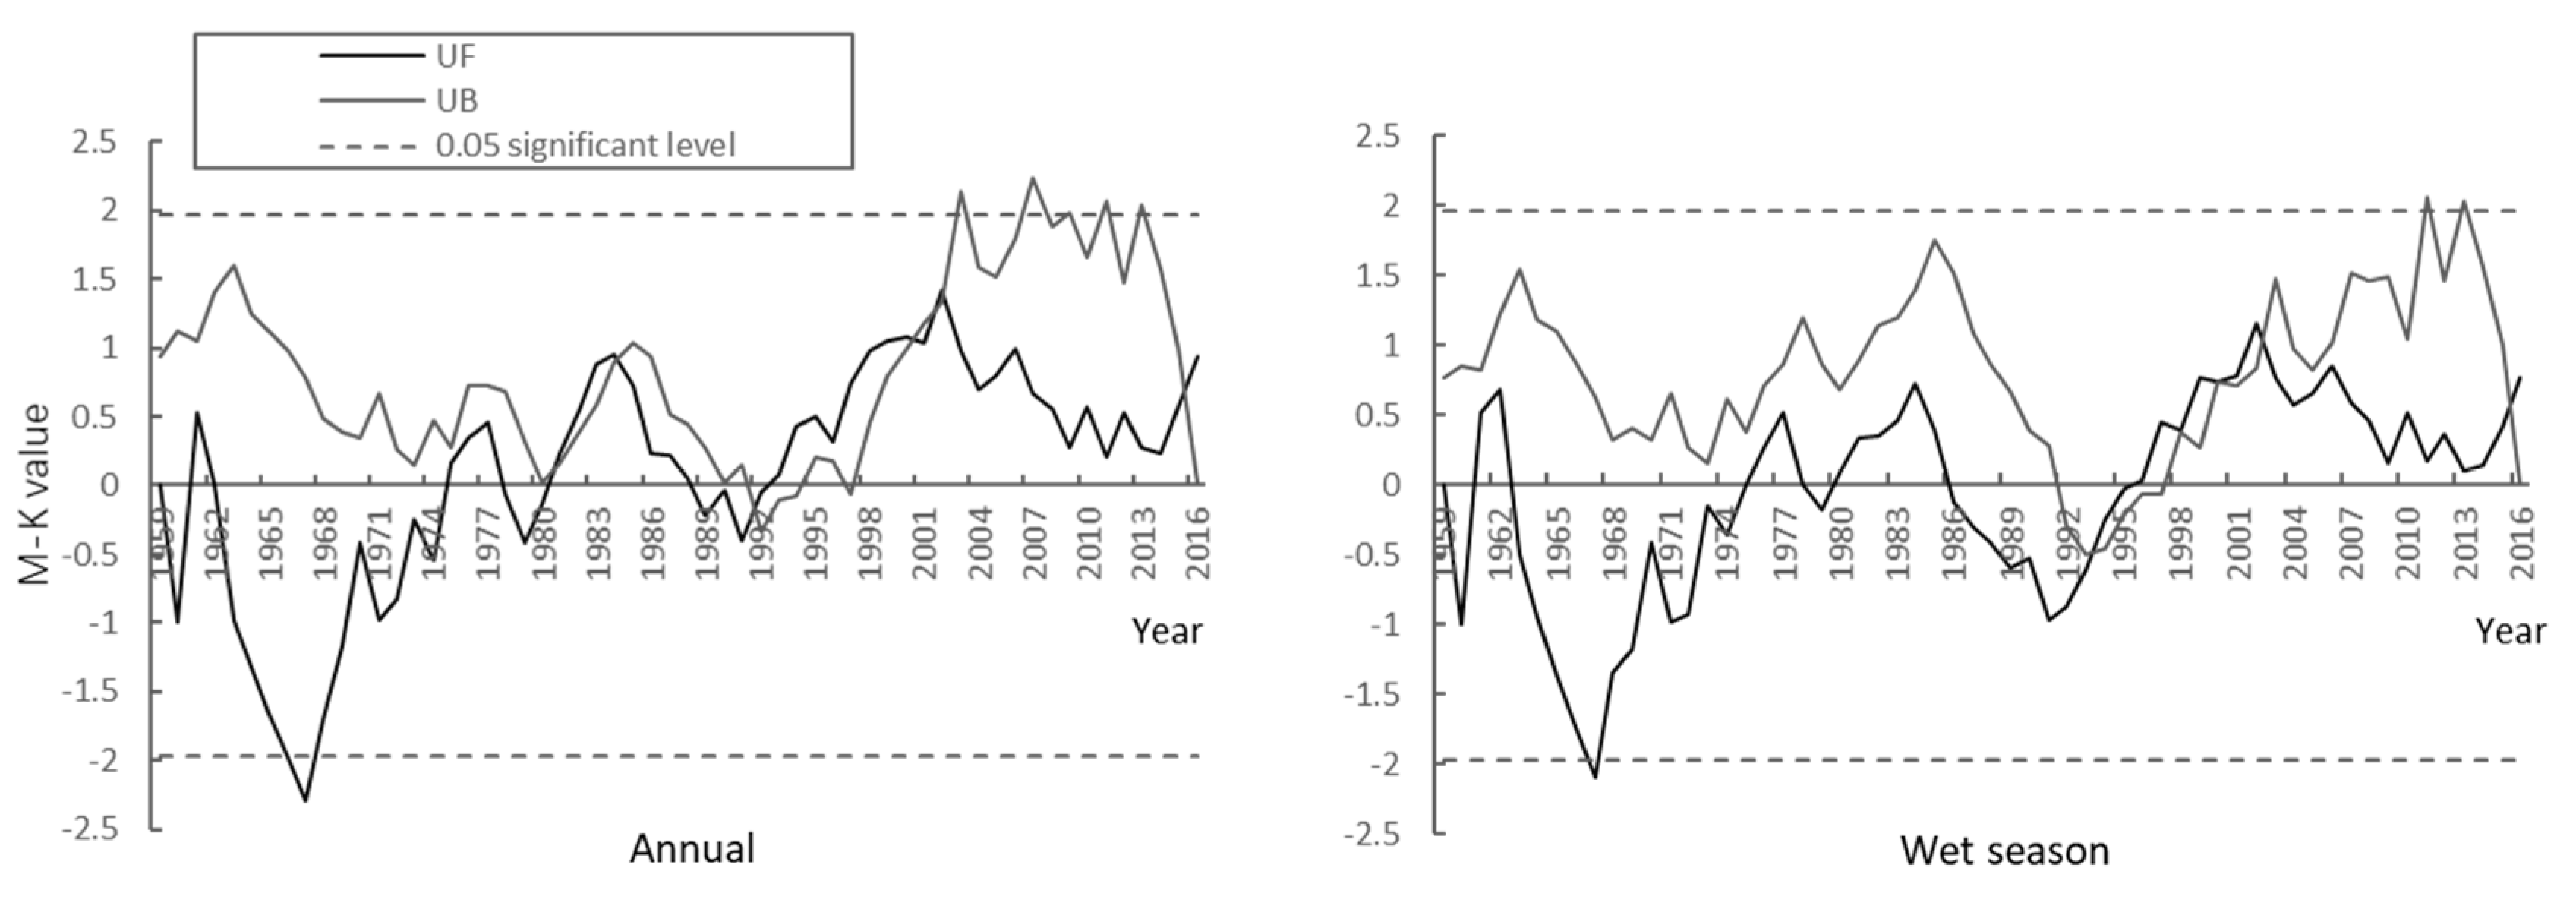
- The annual and flood season precipitation in Ganjiang River Basin increased from 1992 to 2016, but it did not reach a significant level, the change of annual runoff at Dongbei and Waizhou Stations was the same as that of the annual precipitation in Ganjiang River Basin. The runoff at Dongbei Station in flood season decreased from 1986 to 2016, and the runoff at Waizhou Station in flood season decreased from 2008 to 2016. The annual runoff increases with the annual precipitation, but decreases with the increase of precipitation in wet season. It shows that precipitation has a great influence on annual runoff, and human activities made the annual runoff distribution process more uniform.
- (2)
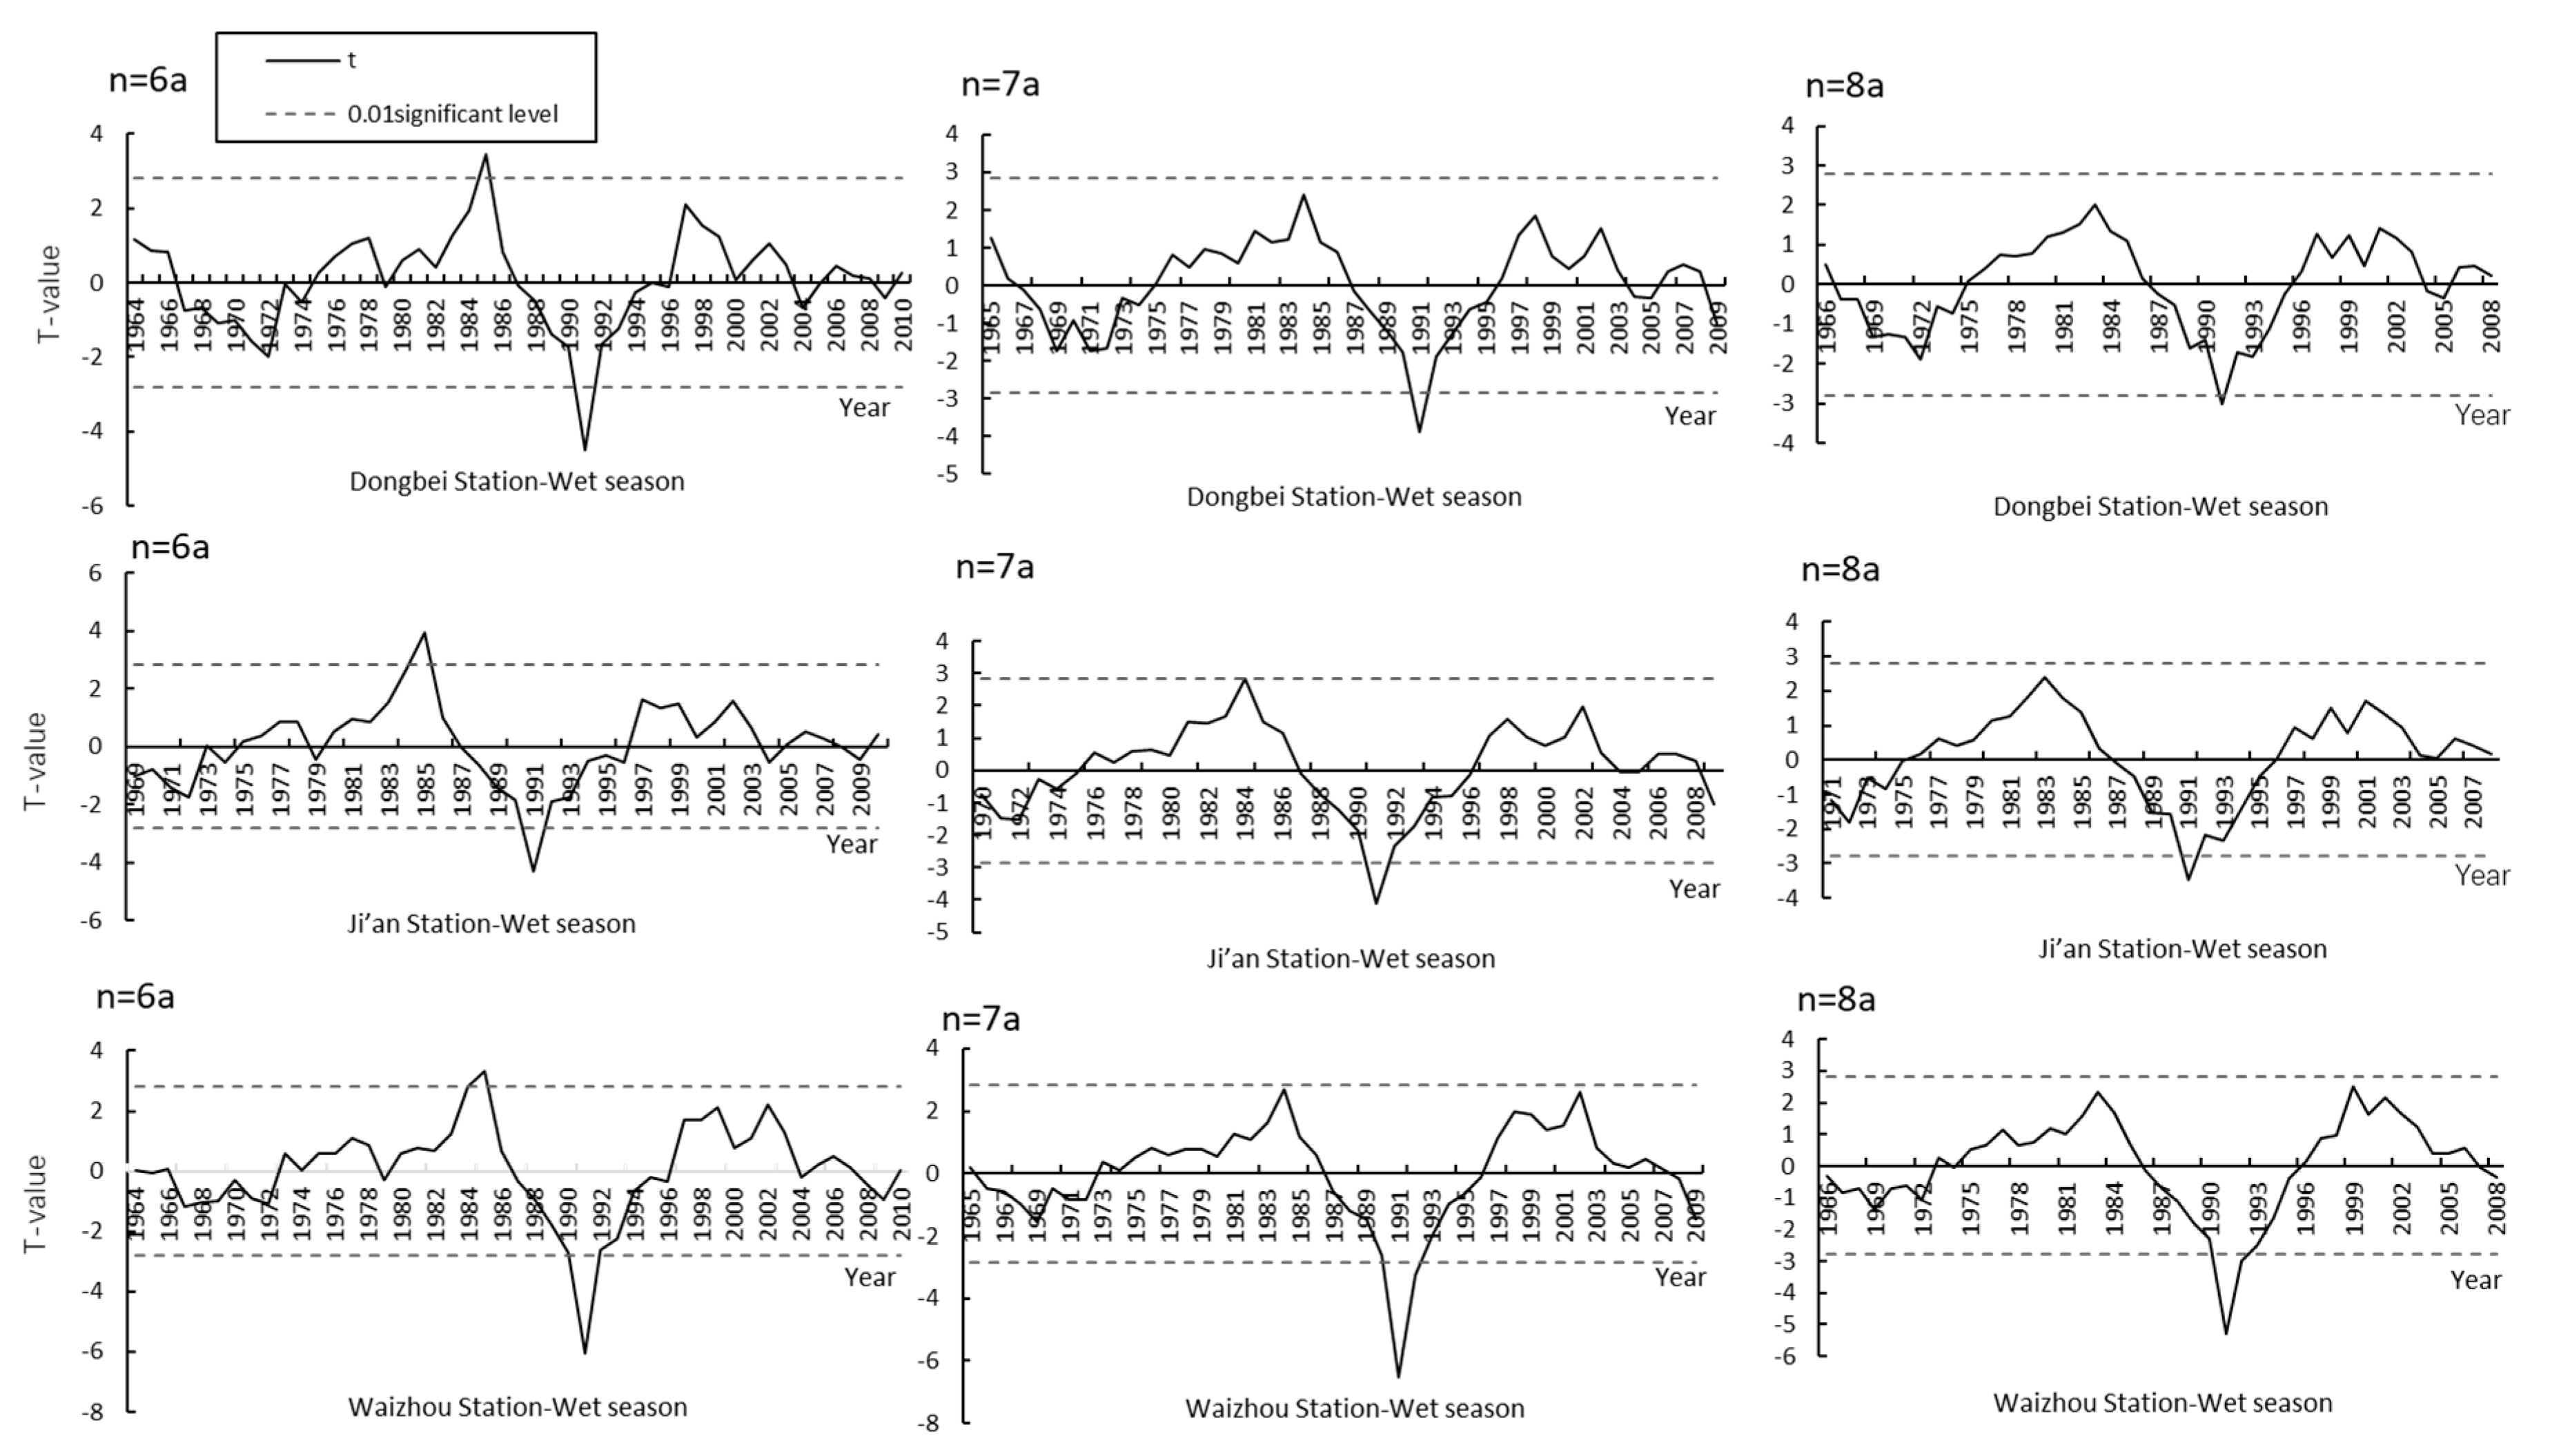
- The abrupt changes of runoff in flood season at three hydrological stations in Ganjiang River Basin occurred in 1991, and reached 0.01 significant level.
- (3)
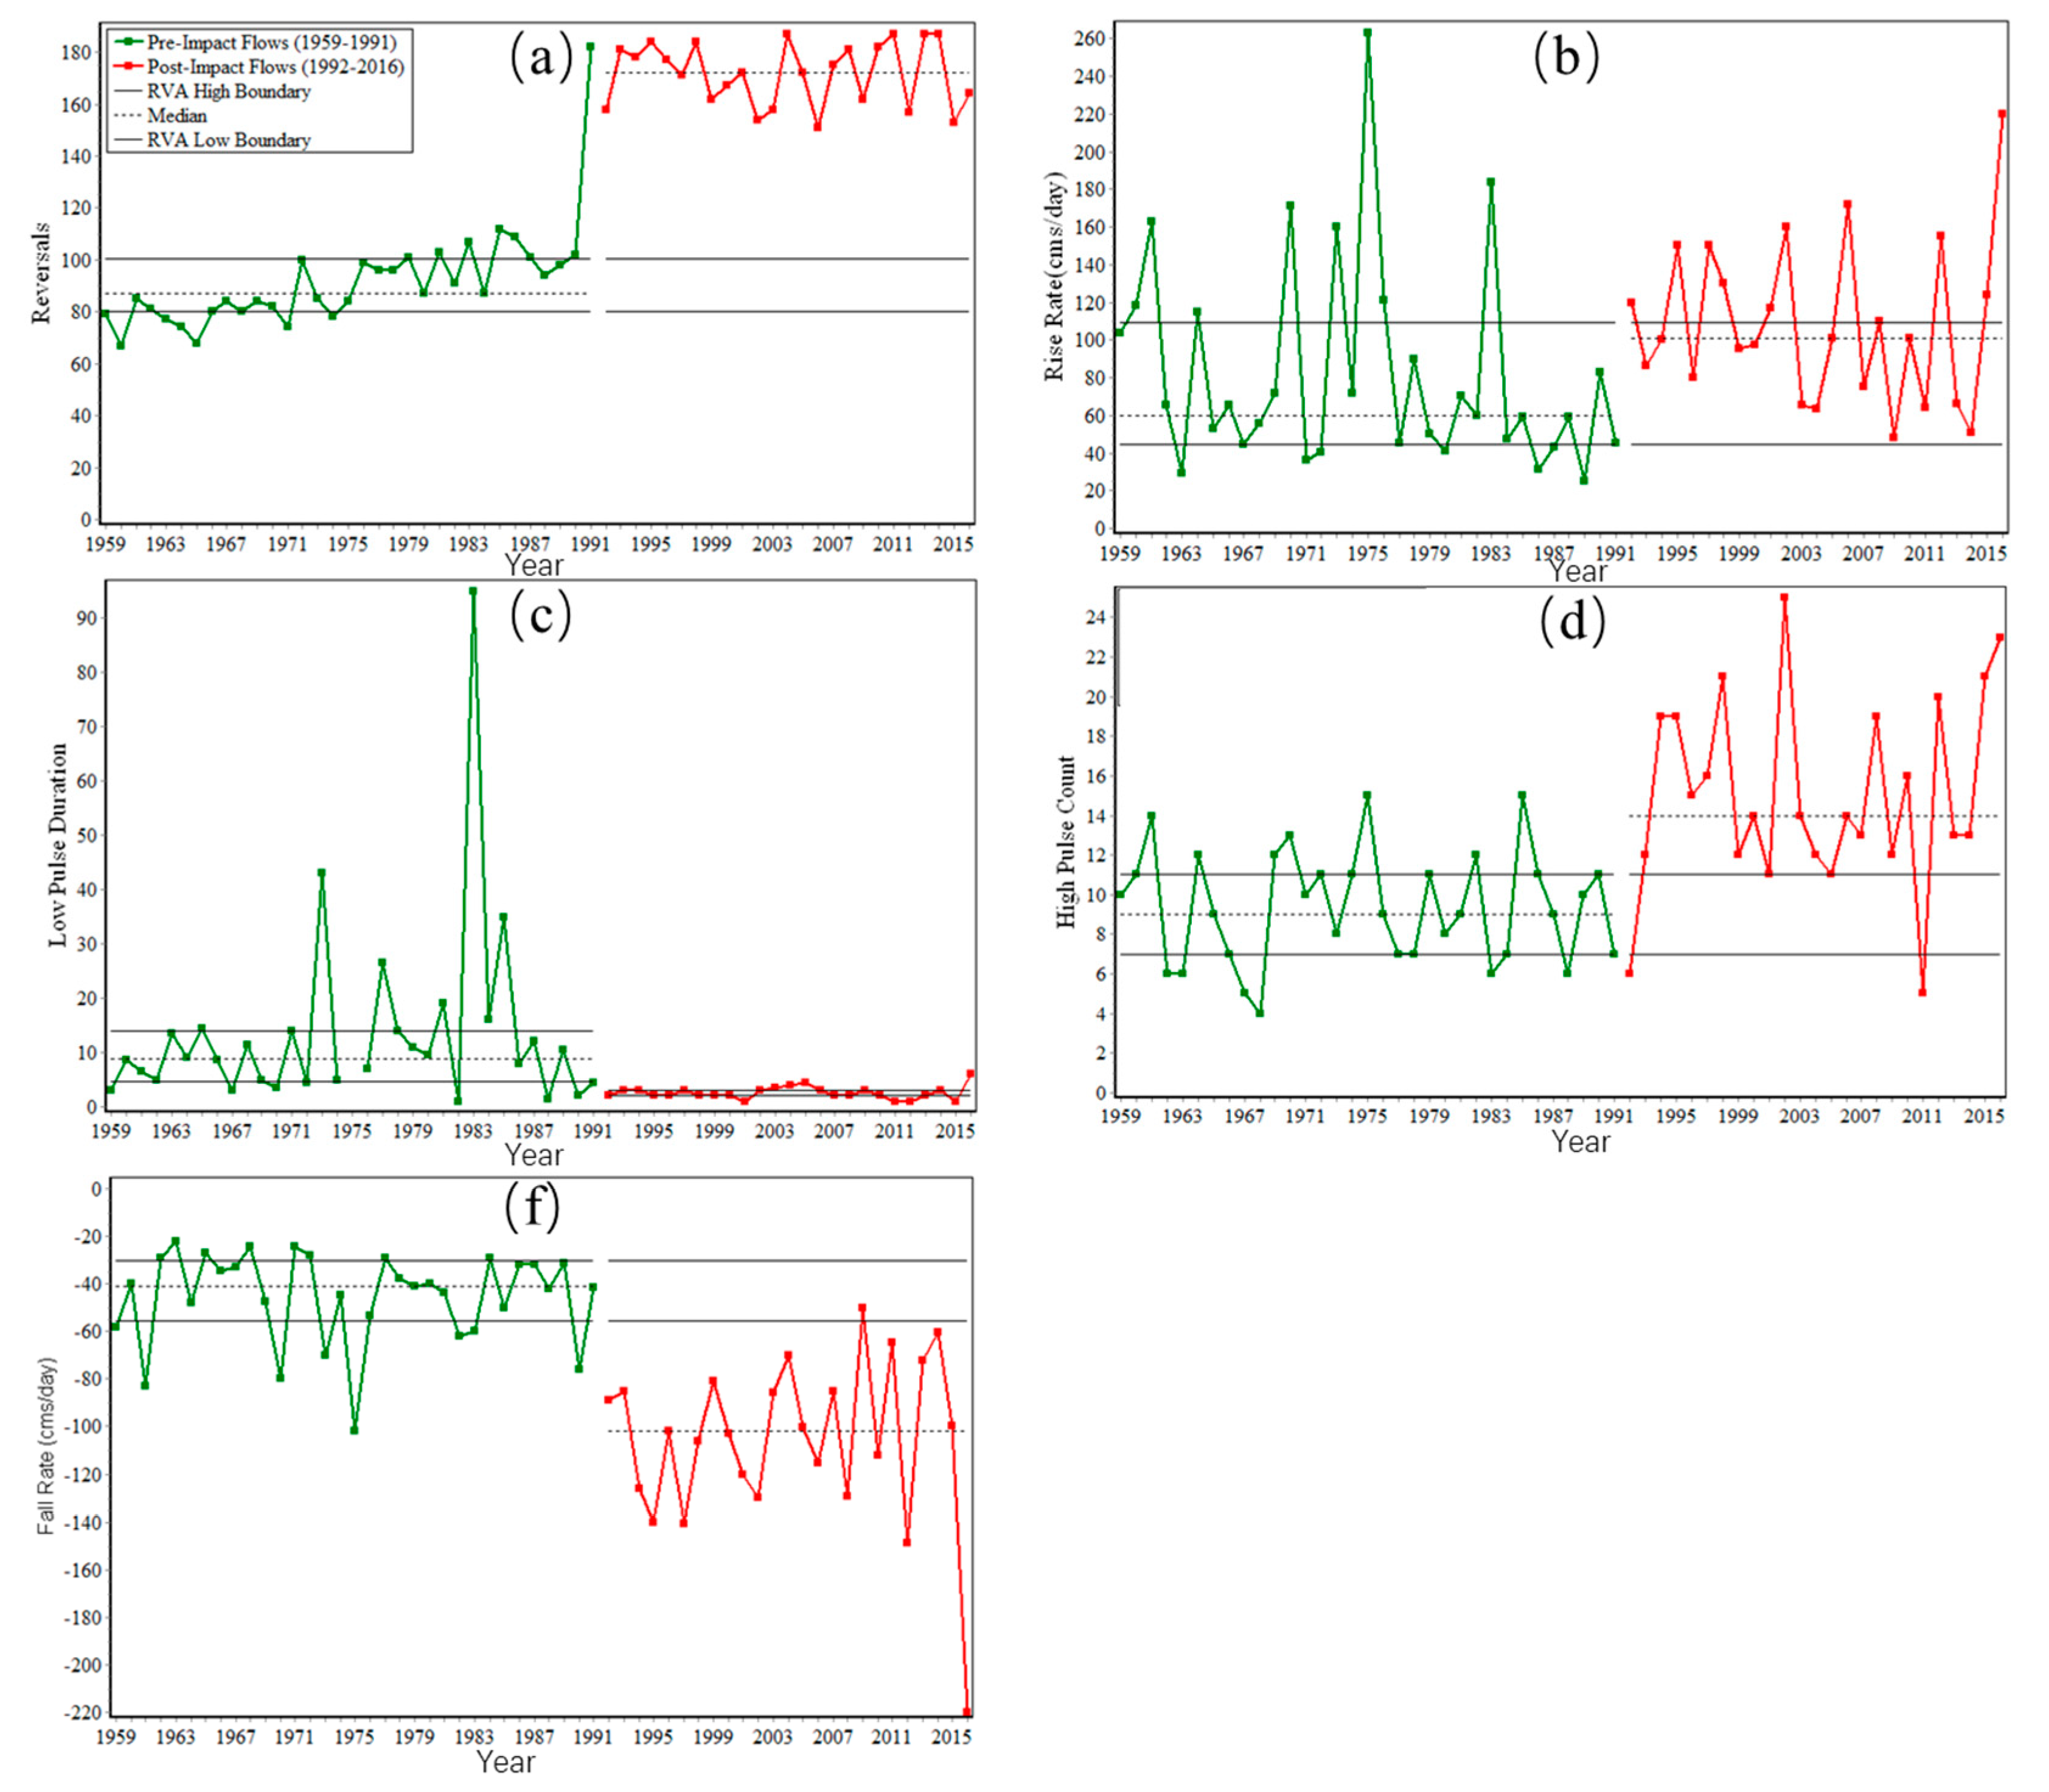
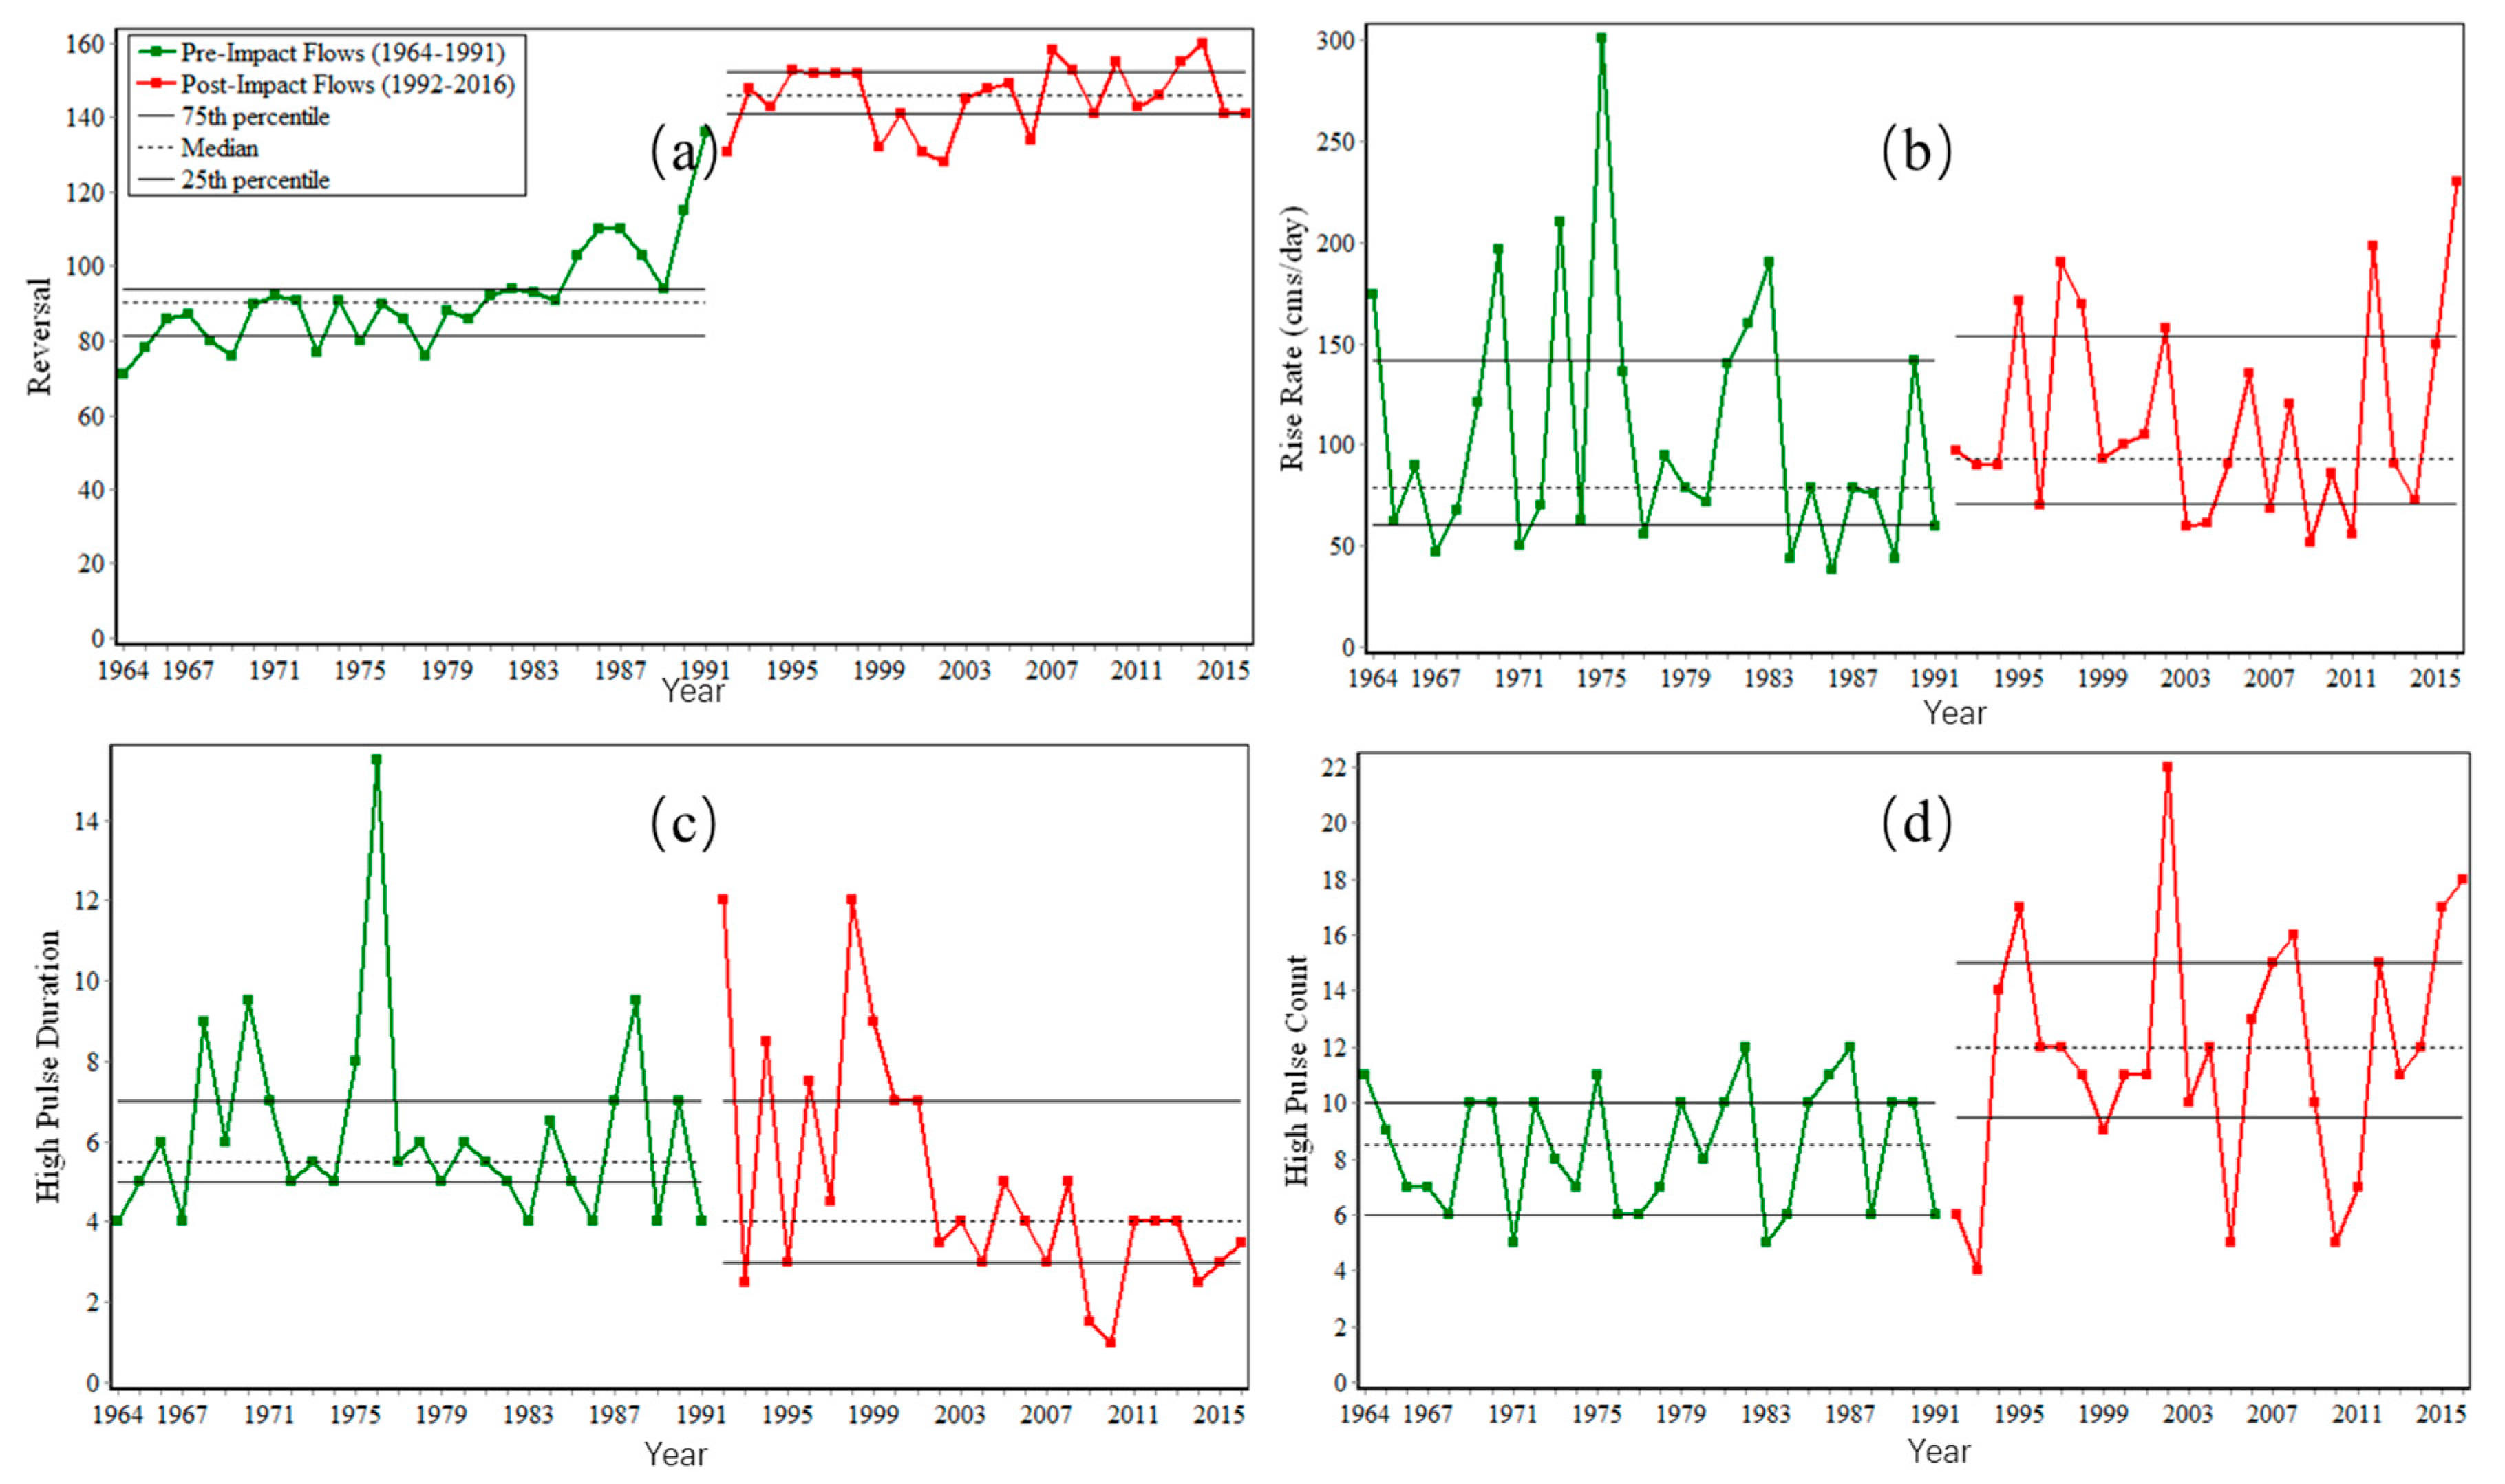
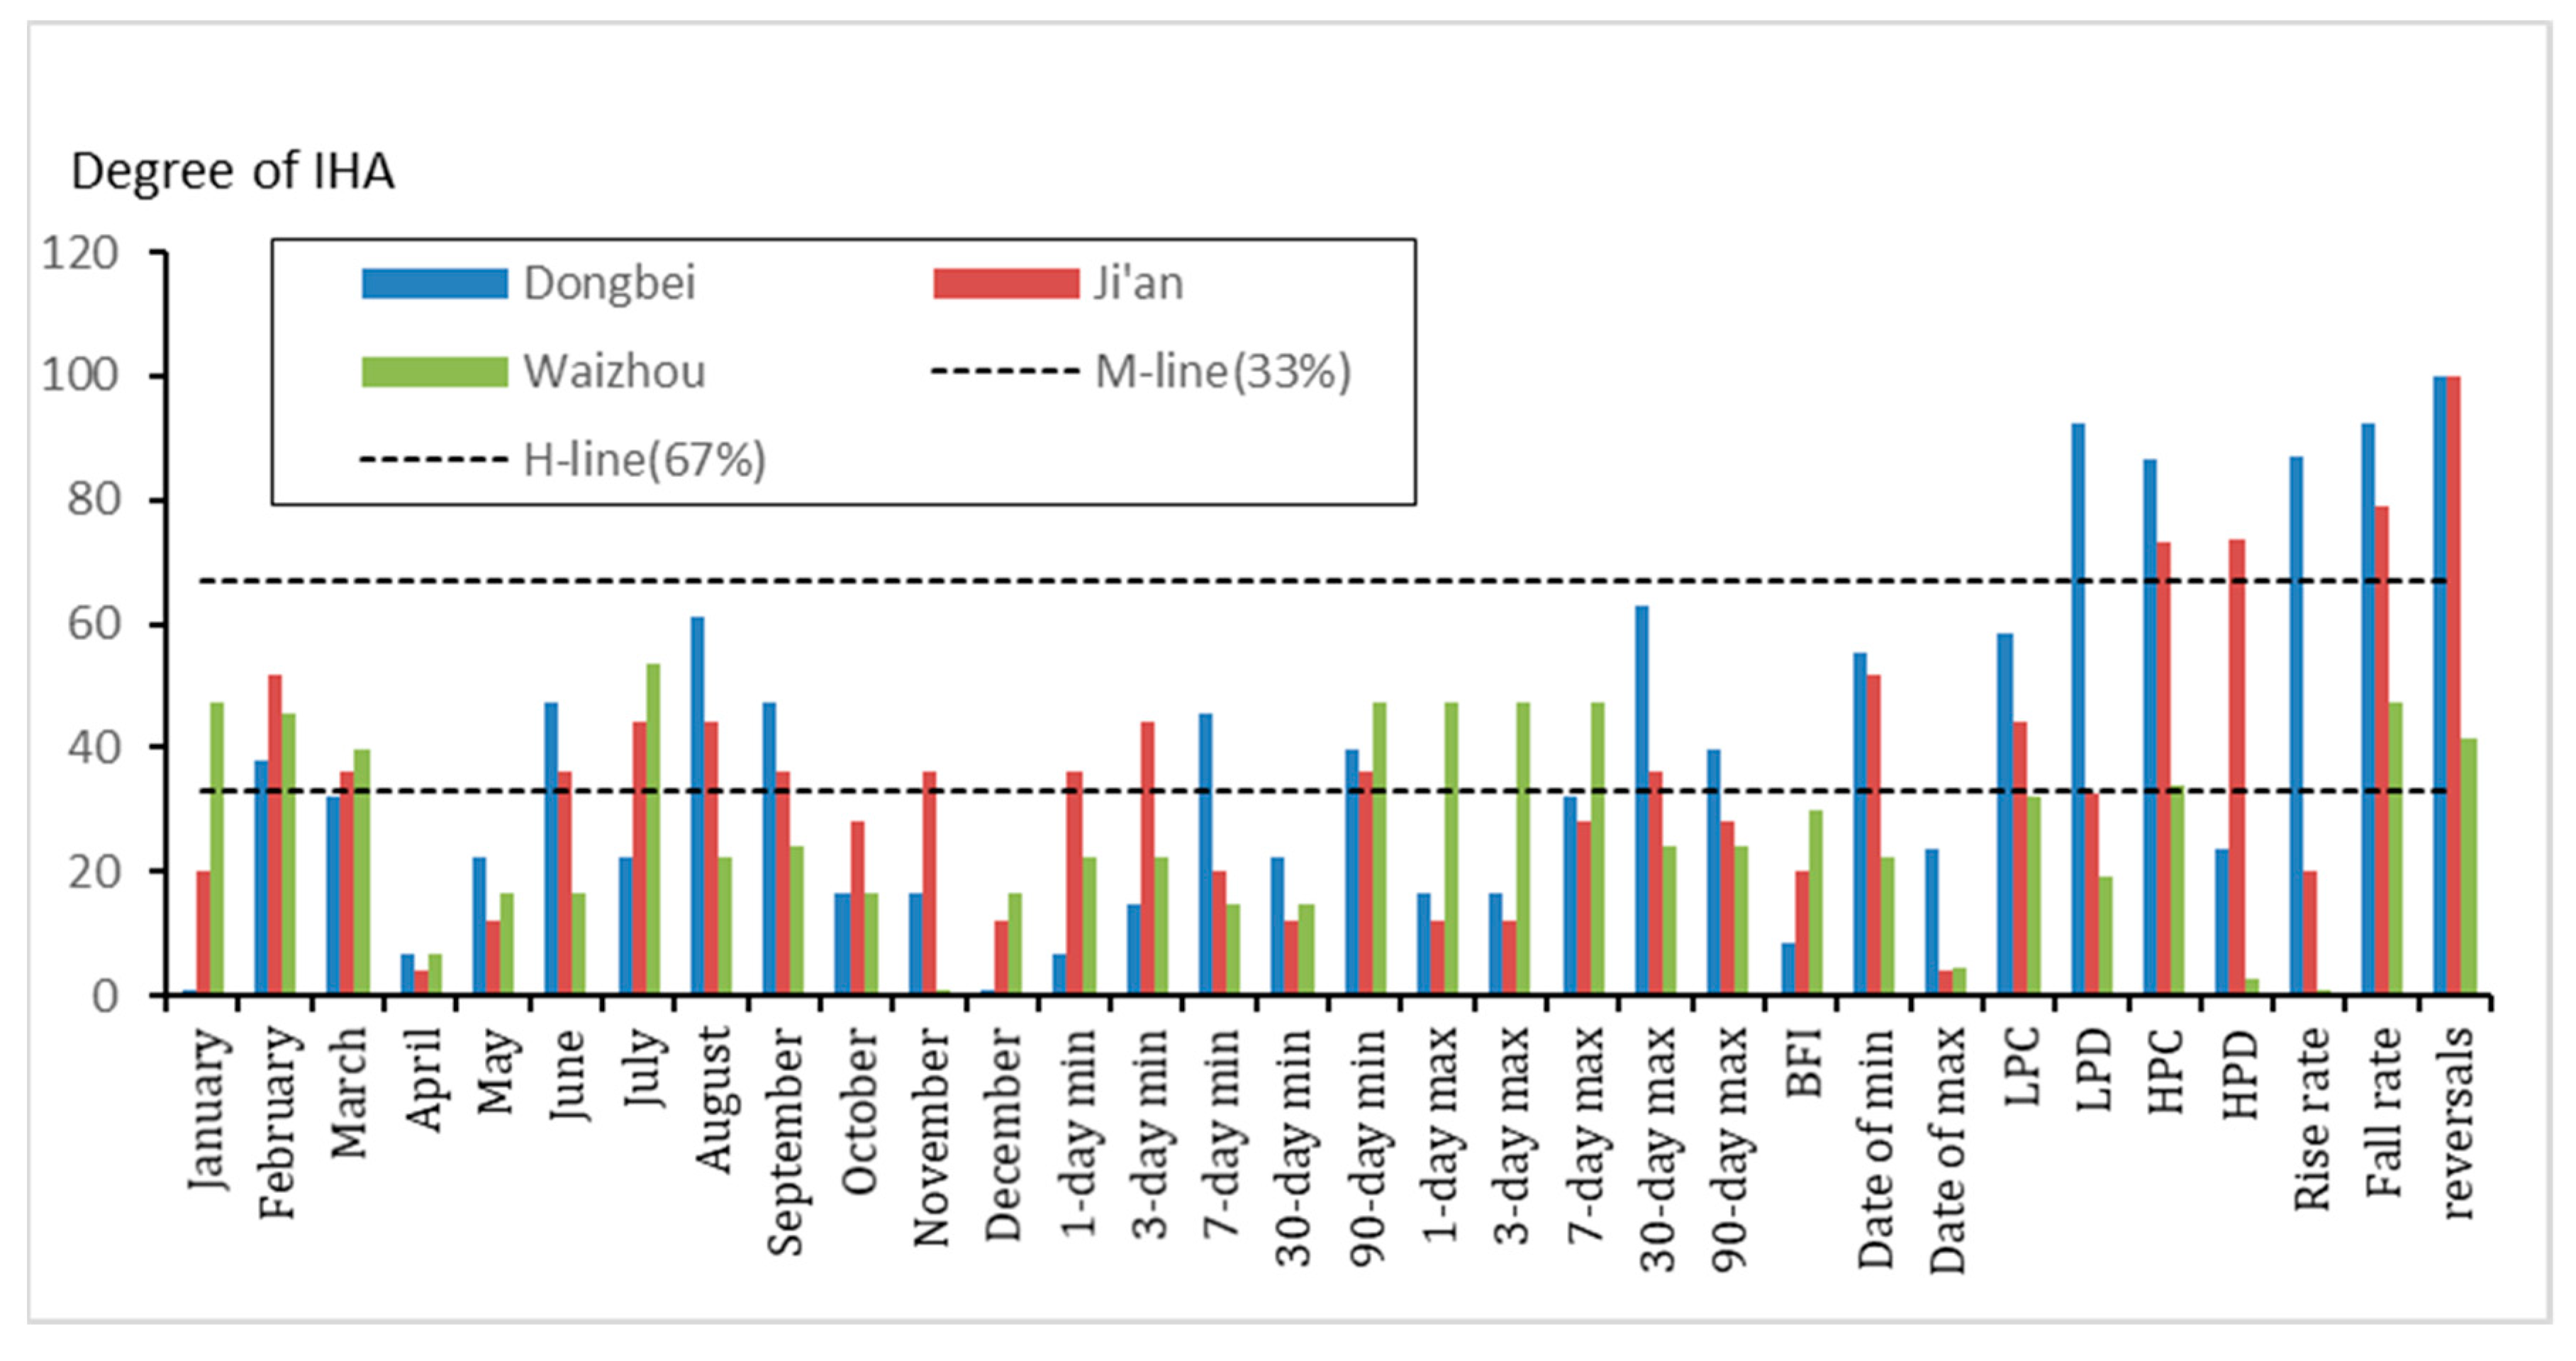
- There were five hydrological indicators of Dongbei Station which reached height change. Four hydrological indicators of Ji’an Station have reached a high change degree. Waizhou Station did not reach the high change indicator. The hydrological regime of the upper and middle reaches of Ganjiang River has changed greatly, while the hydrological regime of the lower reaches has changed little.
Author Contributions
Funding
Conflicts of Interest
References
- Ma, Z.Z. Hydrograph-Based Hydrologic Alteration Assessment and Its Application to the Yellow River. J. Environ. Inform. 2014, 23, 1–13. [Google Scholar] [CrossRef]
- Li, D.; Di, L.; Zhao, J.; Hui, L.; Yang, H. Observed changes in flow regimes in the Mekong River basin. J. Hydrol. 2017, 551, 217–232. [Google Scholar] [CrossRef]
- Starzec, M. A critical evaluation of the methods for the determination of required volumes for detention tank. E3S Web Conf. 2018, 45, 88. [Google Scholar] [CrossRef] [Green Version]
- Starzec, M.; Dziopak, J.; Słyś, D.; Pochwat, K.; Kordana, S. Dimensioning of Required Volumes of Interconnected Detention Tanks Taking into Account the Direction and Speed of Rain Movement. Water 2018, 10, 1826. [Google Scholar] [CrossRef]
- Zou, S.; Jilili, A.; Duan, W.; Maeyer, P.D.; de Voorde, T.V. Human and Natural Impacts on the Water Resources in the Syr Darya River Basin, Central Asia. Sustainablity (Basel) 2019, 11, 3084. [Google Scholar] [CrossRef]
- Benjankar, R.; Jorde, K.; Yager, E.M.; Egger, G.; Goodwin, P.; Glenn, N.F. The impact of river modification and dam operation on floodplain vegetation succession trends in the Kootenai River, USA. Ecol. Eng. 2012, 46, 88–97. [Google Scholar] [CrossRef]
- Chen, Q.; Xiao, Z.; Chen, Y.; Li, Q.; Qiu, L.; Miao, L. Downstream effects of a hydropeaking dam on ecohydrological conditions at subdaily to monthly time scales. Ecol. Eng. 2015, 77, 40–50. [Google Scholar] [CrossRef]
- Gorla, L.; Perona, P. On quantifying ecologically sustainable flow releases in a diverted river reach. J. Hydrol. 2013, 489, 98–107. [Google Scholar] [CrossRef]
- Zhang, Q.; Xiao, M.; Liu, C.L.; Singh, V.P. Reservoir-induced hydrological alterations and environmental flow variation in the East River, the Pearl River basin, China. Stoch. Environ. Res. Risk Assess. 2014, 28, 2119–2131. [Google Scholar] [CrossRef]
- Vogel, R.M.; Sieber, J.; Archfield, S.A.; Smith, M.P.; Apse, C.D.; Huber-Lee, A. Relations among storage, yield, and instream flow. Water Resour. Res. 2007, 43. [Google Scholar] [CrossRef]
- Wałęga, A.; Młyński, D.; Kokoszka, R.; Miernik, W. Possibilities of Applying Hydrological Methods for Determining Environmental Flows in Select Catchments of the Upper Dunajec Basin. Pol. J. Environ. Stud. 2015, 29, 32. [Google Scholar]
- Suen, J.P.; Eheart, J.W. Reservoir Management to Balance Ecosystem and Human Needs: Incorporating the Paradigm of the Ecological Flow Regime. Water Resour. Res. 2006, 42, 178–196. [Google Scholar] [CrossRef]
- Shiau, J.T.; Wu, F.C. Pareto-optimal solutions for environmental flow schemes incorporating the intra-annual and interannual variability of the natural flow regime. Water Resour. Res. 2007, 43. [Google Scholar] [CrossRef]
- Richter, B.D.; Baumgartner, J.V.; Powell, J.; Braun, D.P. A Method for Assessing Hydrologic Alteration within Ecosystems. Conserv. Biol. 1996, 10, 1163–1174. [Google Scholar] [CrossRef] [Green Version]
- Chatterjee, S.; Daniels, M.D.; Sheshukov, A.Y.; Gao, J. Projected climate change impacts on hydrologic flow regimes in the Great Plains of Kansas. River Res. Appl. 2018, 34, 195–206. [Google Scholar] [CrossRef]
- Borgohain, P.L.; Phukan, S.; Ahuja, D.R. Downstream channel changes and the likely impacts of flow augmentation by a hydropower project in River Dikrong, India. Int. J. River Basin Manag. 2018, 17, 1–40. [Google Scholar] [CrossRef]
- Qiang, Z.; Zhang, Z.; Shi, P.; Singh, V.P.; Gu, X. Evaluation of ecological instream flow considering hydrological alterations in the Yellow River basin, China. Glob. Planet. Chang. 2018, 160, 61–74. [Google Scholar]
- Olsen, M.; Troldborg, L.; Henriksen, H.J.; Conallin, J.; Refsgaard, J.C.; Boegh, E. Evaluation of a typical hydrological model in relation to environmental flows. J. Hydrol. 2013, 507, 52–62. [Google Scholar] [CrossRef]
- Yang, Z.; Yan, Y.; Liu, Q. Assessment of the flow regime alterations in the Lower Yellow River, China. Ecol. Inform. 2012, 10, 56–64. [Google Scholar] [CrossRef]
- Liu, G.H.; Zhu, Q.X.; Wang, D. Quantitative analysis of the impacts of climate change and human activities on the runoff in the Poyang Lake Basin. Lake Sci. 2016, 28, 682–690. [Google Scholar]
- Ye, X.; Qi, Z.; Jian, L.; Li, X.; Xu, C. Analysis of the effects of climate and human activities on the runoff changes in the Minjiang River. J. Hohai Univ. (Nat. Sci. Ed.) 2013, 41, 196–203. [Google Scholar]
- Tian, J. Fish Survey and Fisheries Utilization Opinions in Ganjiang River before the Closure of Wan’an Dam. Freshw. Fish 1989, 1, 33–39. [Google Scholar]
- Mann, H.B. Nonparametric Tests Against Trend. Econometrica 1945, 13, 245–259. [Google Scholar] [CrossRef]
- Kendall, M.G. Rank Correlation Methods; Griffin: London, UK, 1975. [Google Scholar]
- Tabari, H.; Talaee, P.H. Temporal variability of precipitation over Iran: 1966–2005. J. Hydrol. 2011, 396, 313–320. [Google Scholar] [CrossRef]
- Hu, Y.; Maskey, S.; Uhlenbrook, S. Trends in temperature and rainfall extremes in the Yellow River source region, China. Clim. Chang. 2012, 110, 403–429. [Google Scholar] [CrossRef]
- Wang, W.; Wei, J.; Shao, Q.; Xing, W.; Yong, B.; Yu, Z.; Jiao, X. Spatial and temporal variations in hydro-climatic variables and runoff in response to climate change in the Luanhe River basin, China. Stoch. Environ. Res. Risk Assess. 2015, 29, 1117–1133. [Google Scholar] [CrossRef]
- Rui, G.; Li, F.; He, W.; Yang, S.; Sun, G. Spatial and Temporal Variability of Annual Precipitation during 1958–2007 in Loess Plateau, China. In Proceedings of the Computer & Computing Technologies in Agriculture IV-IFIP TC 12 Conference, Nanchang, China, 22–25 October 2010. [Google Scholar]
- Yang, X.; Xiang, Z.; Hui, W.; Wang, Y.; Cheng, L.; Xia, J. Spatial and temporal characteristics of rainfall across Ganjiang River Basin in China. Meteorol. Atmos. Phys. 2016, 128, 167–179. [Google Scholar]
- Durbin, J.; Watson, G.S. Testing for Serial Correlation in Least Squares Regression I. Biometrika 1950, 37, 409–428. [Google Scholar] [PubMed]
- Durbin, J.; Watson, G.S. Testing for Serial Correlation in Least Squares Regression II. Biometrika 1951, 38, 159–179. [Google Scholar] [CrossRef]
- Tóth, G. The replacement of the Neumann trend test and the Durbin-Watson test on residuals by one-way ANOVA with resampling and an extension of the tests to different time lags. J. Chemom. 2010, 24, 140–148. [Google Scholar] [CrossRef]
- Richter, B.D.R.; Summar, Y. How much water does a river need? Freshw. Biol. 1997, 37, 231–249. [Google Scholar] [CrossRef] [Green Version]
- Ye, X.; Qi, Z.; Jian, L.; Li, X.; Xu, C. Distinguishing the relative impacts of climate change and human activities on variation of streamflow in the Poyang Lake catchment, China. J. Hydrol. 2013, 494, 83–95. [Google Scholar] [CrossRef]
- Guo, Y.; Su, B.; Wang, Y.; Jiang, T. Impacts of Climate Factors on Runoff Coefficients in the Poyang Lake Basin in 1955–2002. Adv. Clim. Chang. Res. 2006, 1, 217–222. [Google Scholar]
- Mittal, N.; Mishra, A.; Singh, R.; Bhave, A.G.; Valk, M.V.D. Flow regime alteration due to anthropogenic and climatic changes in the Kangsabati River, India. Ecohydrol. Hydrobiol. 2014, 14, 182–191. [Google Scholar] [CrossRef]
- Vega-Jácome, F.; Lavado-Casimiro, W.S.; Felipe-Obando, O.G. Assessing hydrological changes in a regulated river system over the last 90 years in Rimac Basin (Peru). Appl. Clim. 2018, 132, 347–362. [Google Scholar] [CrossRef]
- Lin, K.; Lin, Y.; Xu, Y.; Chen, X.; Lu, C.; Singh, V.P. Inter- and intra-annual environmental flow alteration and its implication in the Pearl River Delta, South China. J. Hydro-Environ. Res. 2017, 15, 27–40. [Google Scholar] [CrossRef]
- Jiangxi Forestry Records Compilation Committee. Jiangxi Forestry; Huangshan Book Society: Hefei, Anhui, China, 1999. [Google Scholar]
- Xia, S. Response of Ganjiang River Sediment Transport to Forest Vegetation Restoration Based on Distributed SEDD Model; Nanchang Institute of Engineering: Nanchang, China, 2017. [Google Scholar]
- Jiangxi Provincial Water Resources Department. Jiangxi Province River and Lake Dictionary; C hangjiang Publishing House: Wuhan, Hubei, China, 2010.
- Grill, G.; Lehner, B.; Lumsdon, A.E.; Macdonald, G.K.; Zarfl, C.; Liermann, C.R. An index-based framework for assessing patterns and trends in river fragmentation and flow regulation by global dams at multiple scales. Environ. Res. Lett. 2015, 10, 15001. [Google Scholar] [CrossRef]
- Okello, A.M.L.S.; Masih, I.; Uhlenbrook, S.; Jewitt, G.P.W.; Zaag, P.V.D.; Riddell, E. Drivers of spatial and temporal variability of streamflow in the Incomati River basin. Hydrol. Earth Syst. Sci. 2015, 11, 657–673. [Google Scholar] [CrossRef]
- Kennedy, T.A.; Yackulic, C.B.; Cross, W.F.; Grams, P.E.; Yard, M.D.; Copp, A.J. The relation between invertebrate drift and two primary controls, discharge and benthic densities, in a large regulated river. Freshw. Biol. 2014, 59, 557–572. [Google Scholar] [CrossRef]
- Renofalt, B.M.; Jansson, R.; Nilsson, C. Effects of hydropower generation and opportunities for environmental flow management in Swedish riverine ecosystems. Freshw. Biol. 2010, 55, 49–67. [Google Scholar] [CrossRef]
- Fantin-Cruz, I.; Pedrollo, O.; Girard, P.; Zeilhofer, P.; Hamilton, S.K. Effects of a diversion hydropower facility on the hydrological regime of the Correntes River, a tributary to the Pantanal floodplain, Brazil. J. Hydrol. 2015, 531, S1206173816. [Google Scholar] [CrossRef]
- Fan, H.; He, D.; Wang, H. Environmental consequences of damming the mainstream Lancang-Mekong River: A review. Earth Sci. Rev. 2015, 146, 77–91. [Google Scholar] [CrossRef]
- Richter, B.D.; Warner, A.T.; Meyer, J.L.; Lutz, K. A Collaborative and Adaptive Process for Developing Environmental Flow Recommendations. River Res. Appl. 2006, 22, 297–318. [Google Scholar] [CrossRef]
- Sinnathamby, S.; Douglas Ankin, K.R.; Muche, M.E.; Hutchinson, S.L.; Anandhi, A. Ecohydrological Index, Native Fish, and Climate Trends and Relationships in the Kansas River Basin. Ecohydrology 2018, 11, e1909. [Google Scholar] [CrossRef] [PubMed]
- Poff, N.L.; Zimmerman, J.K.H. Ecological responses to altered flow regimes: A literature review to inform the science and management of environmental flows. Freshw. Biol. 2010, 55, 194–205. [Google Scholar] [CrossRef]
- Zou, S. Study on the Impact of Large-Scale Water Conservancy Projects on Fishes and Their Ecological Environment in the Middle Reaches of Ganjiang River; Nanchang University: Nanchang, China, 2011. [Google Scholar]
- Huang, Y. Environmental Impact Analysis of Planned Cascade Important Water Conservancy Project in Ganjiang River Basin. Jiangxi Sci. 2014, 32, 699–703. [Google Scholar]
- Xue, L.; Zhang, H.; Yang, C.; Zhang, L.; Sun, C. Quantitative Assessment of Hydrological Alteration Caused by Irrigation Projects in the Tarim River basin, China. Sci. Rep. UK 2017, 7, 4291. [Google Scholar] [CrossRef] [PubMed]
- Liechti, T.C.; Matos, J.P.; Boillat, J.L.; Schleiss, A.J. Influence of Hydropower Development on Flow Regime in the Zambezi River Basin for Different Scenarios of Environmental Flows. Water Resour. Manag. 2015, 29, 731–747. [Google Scholar] [CrossRef]
- Gao, B.; Yang, D.; Zhao, T.; Yang, H. Changes in the eco-flow metrics of the Upper Yangtze River from 1961 to 2008. J. Hydrol. 2012, 448–449, 30–38. [Google Scholar] [CrossRef]


| Statistics Group | Hydrologic Parameters | Ecosystem Influences |
|---|---|---|
| Group 1: Magnitude of monthly water conditions | Mean value for each calendar month | Habitat availability for aquatic organisms Soil moisture availability for plants Availability of water for terrestrial animals |
| Group 2: Magnitude and duration of annual extreme water conditions | Annual minima 1-day means Annual maxima 1-day means Annual minima 3-day means Annual maxima 3-day means Annual minima 7-day means Annual maxima 7-day means Annual minima 30-day means Annual maxima 30-day means Annual minima 90-day means Annual maxima 90-day means | Balance of competitive, ruderal and stress tolerant organisms Creation of sites for plant colonization Structuring of aquatic ecosystems by abiotic vs. biotic factors Structuring of river channel morphology and physical habitat conditions |
| Group 3 Timing of annual extreme water conditions | Julian date of each annual 1-day maximum Julian date of each annual 1-day minimum | Compatibility with life cycles of organisms Predictability/avoidability of stress for organisms Access to special habitats during reproduction or to avoid predation |
| Group 4: Frequency and duration of high and low pulses | No. of high pulses each year No. of low pulses each year Mean duration of high pulses within each year Mean duration of low pulses within each year | Frequency and magnitude of soil moisture stress for plans Frequency and duration of anaerobic stress for plans Availability of floodplain habitats for aquatic organisms Nutrient and organic matter exchanges between river and floodplain |
| Group 5: Rate and frequency of water condition changes | Means of all positive differences between consecutive daily means Means of all negative differences between consecutive daily means No. of rises No. of falls | Drought stress on plans Entrapment of organisms on islands, flood plains Desiccation stress on low mobility stream edge (varial zone) organisms |
| Data Sequence | dw (Annual) | dw (Wet Season) | du | 4-du | Results |
|---|---|---|---|---|---|
| Precipitation | 2.150 | 2.094 | 1.614 | 2.386 | Reject autocorrelation |
| Dongbei Staion | 2.120 | 2.325 | 1.614 | 2.386 | Reject autocorrelation |
| Ji’an Staion | 2.129 | 2.379 | 1.599 | 2.401 | Reject autocorrelation |
| Waizhou Staion | 2.134 | 2.344 | 1.614 | 2.386 | Reject autocorrelation |
| Station | Time Series | Results | Significance |
|---|---|---|---|
| Dongbei | n = 6a | 1985, 1991 | * |
| n = 7a | 1991 | * | |
| n = 8a | 1991 | * | |
| Ji’an | n = 6a | 1985, 1991 | * |
| n = 7a | 1991 | * | |
| n = 8a | 1991 | * | |
| Waizhou | n = 6a | 1985, 1991 | * |
| n = 7a | 1991 | * | |
| n = 8a | 1991 | * |
| 5 Groups | Pre-Impact Period: 1959–1991 | Post-Impact Period: 1975–2006 | RVA Targets | Hydrologic Alteration | Degree | |
|---|---|---|---|---|---|---|
| Medians | Medians | Low | High | D (%) | ||
| Parameter Group #1 | ||||||
| January | 302 | 345 | 227 | 449.5 | 0.9412 | L |
| February | 399.5 | 442.5 | 308.5 | 572.3 | −37.88 | M |
| March | 642 | 694 | 420.5 | 1100 | 32 | L |
| April | 1210 | 1225 | 917.8 | 1885 | −6.824 | L |
| May | 1580 | 1540 | 1050 | 2155 | −22.35 | L |
| June | 1700 | 1995 | 1158 | 2788 | 47.53 | M |
| July | 686 | 1060 | 487 | 1050 | −22.35 | L |
| August | 599 | 921 | 457.5 | 784 | −61.18 | M |
| September | 532.5 | 699 | 348.8 | 893.8 | 47.53 | M |
| October | 414 | 437 | 316.5 | 577 | 16.47 | L |
| November | 357 | 381 | 264.3 | 540.3 | 16.47 | L |
| December | 283 | 365 | 215.5 | 370.5 | 0.9412 | L |
| Parameter Group #2 | ||||||
| 1-day minimum | 176 | 195 | 136 | 217 | −6.824 | L |
| 3-day minimum | 177.3 | 214 | 137.7 | 219.5 | −14.59 | L |
| 7-day minimum | 179 | 235.9 | 145.9 | 225.5 | −45.65 | M |
| 30-day minimum | 201.5 | 299.7 | 175.9 | 289.5 | −22.35 | L |
| 90-day minimum | 366 | 417.5 | 277.5 | 509.2 | 39.76 | M |
| 1-day maximum | 6340 | 7360 | 5290 | 10150 | 16.47 | L |
| 3-day maximum | 5333 | 6767 | 4402 | 8648 | 16.47 | L |
| 7-day maximum | 4291 | 4939 | 3370 | 6574 | 32 | L |
| 30-day maximum | 2963 | 3058 | 2024 | 4363 | 63.06 | M |
| 90-day maximum | 2130 | 2249 | 1570 | 2881 | 39.76 | M |
| Base flow index | 0.1892 | 0.202 | 0.158 | 0.2367 | 8.706 | L |
| Parameter Group #3 | ||||||
| Date of minimum | 11 | 338 | 30 | 354.5 | 55.29 | M |
| Date of maximum | 145 | 166 | 102.5 | 170 | −23.58 | L |
| Parameter Group #4 | ||||||
| Low pulse count | 5 | 13 | 3.5 | 8 | −58.32 | M |
| Low pulse duration | 8.75 | 2 | 4.625 | 14 | −92.24 | H |
| High pulse count | 9 | 14 | 7 | 11 | −86.8 | H |
| High pulse duration | 5 | 3.5 | 3.5 | 7 | −23.58 | L |
| Parameter Group #5 | ||||||
| Rise rate | 60 | 101 | 44.75 | 109.5 | 87.06 | H |
| Fall rate | −41 | −102 | −55.75 | −30.25 | −92.24 | H |
| Number of reversals | 87 | 172 | 80 | 100.5 | −100 | H |
| 5 Groups | Pre-Impact Period: 1964–1991 | Post-Impact Period: 1992–2016 | RVA Targets | Hydrologic Alteration | Degree | |
|---|---|---|---|---|---|---|
| Medians | Medians | Low | High | D (%) | ||
| Parameter Group #1 | ||||||
| January | 439 | 474 | 294.3 | 622.5 | 20 | L |
| February | 573.3 | 675 | 513 | 765.8 | −52 | M |
| March | 962 | 1030 | 568.5 | 1473 | 36 | M |
| April | 1930 | 1880 | 1620 | 3206 | 4 | L |
| May | 2470 | 2340 | 1705 | 3095 | 12 | L |
| June | 2323 | 3100 | 1710 | 3395 | 36 | M |
| July | 1006 | 1490 | 724.3 | 1403 | −44 | M |
| August | 825 | 1260 | 618.5 | 1023 | −44 | M |
| September | 646.8 | 965 | 486.4 | 1061 | 36 | M |
| October | 572 | 601 | 445 | 880.3 | 28 | L |
| November | 498.3 | 496.5 | 345.9 | 806 | 36 | M |
| December | 383.5 | 480 | 281.5 | 538 | 12 | L |
| Parameter Group #2 | ||||||
| 1-day minimum | 234.5 | 304 | 201.5 | 300.3 | −36 | M |
| 3-day minimum | 240.5 | 310 | 203.8 | 307 | −44 | M |
| 7-day minimum | 246.1 | 339.6 | 206.7 | 326.7 | −20 | L |
| 30-day minimum | 273 | 380.1 | 242 | 391.4 | 12 | L |
| 90-day minimum | 452.2 | 597.9 | 364.7 | 760.9 | 36 | M |
| 1-day maximum | 8495 | 9900 | 6803 | 11830 | 12 | L |
| 3-day maximum | 7657 | 9417 | 5916 | 10830 | 12 | L |
| 7-day maximum | 6336 | 7074 | 4647 | 8775 | 28 | L |
| 30-day maximum | 4077 | 4255 | 2884 | 5566 | 36 | M |
| 90-day maximum | 2911 | 3108 | 2144 | 3831 | 28 | L |
| Base flow index | 0.1838 | 0.1987 | 0.1522 | 0.2274 | 20 | L |
| Parameter Group #3 | ||||||
| Date of minimum | 362.5 | 366 | 21.75 | 355.8 | 52 | M |
| Date of maximum | 142 | 166 | 101.3 | 174 | 4 | L |
| Parameter Group #4 | ||||||
| Low pulse count | 5 | 8 | 2.25 | 7 | −44 | M |
| Low pulse duration | 10.5 | 3.5 | 5 | 17.5 | −32.8 | M |
| High pulse count | 8.5 | 12 | 6 | 10 | −73.33 | H |
| High pulse duration | 5.5 | 4 | 5 | 7 | −73.65 | H |
| Parameter Group #5 | ||||||
| Rise rate | 78.75 | 93.5 | 60.5 | 141.5 | 20 | L |
| Fall rate | −53 | −107 | −66.38 | −40 | −79 | H |
| Number of reversals | 90.5 | 146 | 81.5 | 94 | −100 | H |
| 5 Groups | Pre-Impact Period: 1964–1991 | Post-Impact Period: 1992–2016 | RVA Targets | Hydrologic Alteration | Degree | |
|---|---|---|---|---|---|---|
| Medians | Medians | Low | High | (%) | ||
| Parameter Group #1 | ||||||
| January | 679 | 668 | 411.5 | 922 | 47.53 | M |
| February | 985 | 936 | 595.8 | 1263 | −45.65 | M |
| March | 1700 | 1920 | 935.5 | 2450 | 39.76 | M |
| April | 3265 | 2915 | 2350 | 4428 | −6.824 | L |
| May | 3610 | 3830 | 2625 | 5180 | 16.47 | L |
| June | 3615 | 4220 | 2620 | 5085 | 16.47 | L |
| July | 1520 | 2570 | 1100 | 2320 | −53.41 | M |
| August | 1130 | 1770 | 864 | 1545 | −22.35 | L |
| September | 1014 | 1390 | 677 | 1563 | 24.24 | L |
| October | 846 | 869 | 586 | 1210 | 16.47 | L |
| November | 668.5 | 818.5 | 532.5 | 1123 | 0.9412 | L |
| December | 596 | 741 | 405.5 | 875 | 16.47 | L |
| Parameter Group #2 | ||||||
| 1-day minimum | 350 | 463 | 287.5 | 444 | −22.35 | L |
| 3-day minimum | 351 | 476 | 294.3 | 448.8 | −22.35 | L |
| 7-day minimum | 360 | 484.7 | 299.1 | 477.4 | −14.59 | L |
| 30-day minimum | 432 | 591.5 | 338.5 | 583.9 | −14.59 | L |
| 90-day minimum | 687.7 | 837.7 | 513.4 | 1096 | 47.53 | M |
| 1-day maximum | 11,900 | 11,300 | 7875 | 14,600 | 47.53 | M |
| 3-day maximum | 10,970 | 10,700 | 7450 | 13,950 | 47.53 | M |
| 7-day maximum | 9319 | 9111 | 6375 | 12,250 | 47.53 | M |
| 30-day maximum | 5685 | 6258 | 4841 | 8273 | 24.24 | L |
| 90-day maximum | 4359 | 4751 | 3407 | 5484 | 24.24 | L |
| Base flow index | 0.1857 | 0.2082 | 0.156 | 0.2229 | −30.12 | L |
| Parameter Group #3 | ||||||
| Date of minimum | 10 | 9 | 22 | 317.5 | −22.35 | L |
| Date of maximum | 160 | 171 | 131 | 175.5 | −4.667 | L |
| Parameter Group #4 | ||||||
| Low pulse count | 4 | 4 | 3 | 7 | 32 | L |
| Low pulse duration | 9 | 6.75 | 6 | 15.13 | −19.33 | L |
| High pulse count | 6 | 8 | 5 | 8 | −34 | M |
| High pulse duration | 7 | 7.5 | 5.5 | 11.75 | −2.737 | L |
| Parameter Group #5 | ||||||
| Rise rate | 108 | 100 | 64.75 | 142.8 | 0.9412 | L |
| Fall rate | −70 | −100 | −90 | −50 | −47.2 | M |
| Number of reversals | 78 | 85 | 71.5 | 84 | −41.33 | M |
| Name of Reservoir | Completion Time | Dead Storage (106 m3) | Total Storage (106 m3) |
|---|---|---|---|
| Sanshiba | 1980 | 6.55 | 26.53 |
| Youluokou | 1981 | 31.9 | 110 |
| Wanbao | 1981 | 2.1 | 28.78 |
| Nanhe | 1983 | 25.7 | 52.5 |
| Laoyingpan | 1983 | 22 | 101.6 |
| Fanbuqiao | 1983 | 3 | 21.2 |
| Wan’an | 1990 | 319 | 2214 |
| Huangyun | 1990 | 6.7 | 47.9 |
| Longyuankou | 1990 | 8.55 | 45.15 |
© 2019 by the authors. Licensee MDPI, Basel, Switzerland. This article is an open access article distributed under the terms and conditions of the Creative Commons Attribution (CC BY) license (http://creativecommons.org/licenses/by/4.0/).
Share and Cite
Huang, Y.; Huang, B.; Qin, T.; Nie, H.; Wang, J.; Li, X.; Shen, Z. Assessment of Hydrological Changes and Their Influence on the Aquatic Ecology over the last 58 Years in Ganjiang Basin, China. Sustainability 2019, 11, 4882. https://doi.org/10.3390/su11184882
Huang Y, Huang B, Qin T, Nie H, Wang J, Li X, Shen Z. Assessment of Hydrological Changes and Their Influence on the Aquatic Ecology over the last 58 Years in Ganjiang Basin, China. Sustainability. 2019; 11(18):4882. https://doi.org/10.3390/su11184882
Chicago/Turabian StyleHuang, Yinghou, Binbin Huang, Tianling Qin, Hanjiang Nie, Jianwei Wang, Xing Li, and Zhenqian Shen. 2019. "Assessment of Hydrological Changes and Their Influence on the Aquatic Ecology over the last 58 Years in Ganjiang Basin, China" Sustainability 11, no. 18: 4882. https://doi.org/10.3390/su11184882