Evaluation of Regionalization of Soil and Water Conservation in China

1
College of Environmental Science and Engineering, Hunan University, Changsha 410082, China
2
Key Laboratory of Environmental Biology and Pollution Control (Hunan University), Ministry of Education, Changsha 410082, China
3
Guangdong Key Laboratory of Integrated Agro-Environmental Pollution Control and Management, Guangdong Institute of Eco-Environment Science & Technology, Guangzhou 510650, China
*
Author to whom correspondence should be addressed.
Sustainability 2018, 10(9), 3320; https://doi.org/10.3390/su10093320
Submission received: 15 June 2018
/
Revised: 7 September 2018
/
Accepted: 10 September 2018
/
Published: 17 September 2018
Abstract
:This paper evaluates the regionalization of soil and water conservation in China, decades after its widespread implementation across the country. The authors mainly address two questions. First, to what extent could achievements in soil erosion and water management be attributed to regionalization? Statistics and cases show that enhancement of research on soil erosion and ecology, popularization of technologies and mathematical methods and more complete databases are the main improvements to theoretical research; the distribution of region-specific measures and monitoring sites and the development of a responsibility system are the main impacts on practice. Second, is there any weakness to regionalization? Econometric and management methods are currently not well integrated into the process of regionalization; indicators used for division lack standardization, thus weakening the accuracy of regionalization; also, there are limits to its implementation. Using scenario analysis, the authors discuss the possibility of involving economics and management science in the process of regionalization and the approach to combine qualitative analysis with quantitative analysis, while also arguing the importance of establishing an effective cooperation mechanism between different government departments and between government and actors. For government, the evaluation could be helpful to recognize the success, strengths and weaknesses of regionalization of soil and water in China and hence to take further steps to formulate region-specific policies dealing with complex environmental and economic problems in different regions.
1. Introduction
Worldwide efforts at geographical regionalization have had a long history. Several efforts of regionalization developed by government agencies and scholars for improved understanding of nature or social principles are widely known to the public. Examples are global climate zones and agricultural belts of the United States [1,2,3]; among which regionalization of soil and water conservation in China has existed for nearly 70 years and serves as a framework for soil erosion and water management over the whole country.
China spans nearly 50 degrees in latitude and has almost all existing landform patterns; types, rates and controls of soil erosion vary substantially from one region to another [4,5,6,7,8]. Chinese society is undergoing dramatic change. The eastern developed regions attract immigrants from the middle and the western underdeveloped regions, causing a higher urbanization level in the eastern regions (19.17% (calculated from the urbanization level of individual provinces recorded in the China Statistical Yearbook 2016) higher than the middle and western regions in 2015), which results in a change in the use of land from woodland, farmland and lakes to industrial or residential buildings [9]. Due to overexploitation of natural resources, severe environmental problems have been emerging including soil degradation and water quality deterioration [10]. Meanwhile, although the western underdeveloped regions have been less disturbed by human activities, the vulnerable environments are more likely to cause severe ecological problems, especially in the Loess Plateau and the Tibet Plateau [11,12]. Under the background of escalating regional imbalance, it is urgent to formulate region-specific policies to deal with complex environmental and economic problems in different regions. Moreover, after the concept of ecological civilization was first raised at the 17th National People’s Congress, 2007, and the Ministry of Natural Resources and the Ministry of Ecology and Environment were established in 2018, emphasis on the balance between development and conservation also calls for region-specific plans and measures [13]. Considering these, regionalization of soil and water conservation in China was aimed at dividing a certain area into several functional regions, with the hope that region-specific management rather than site-specific management could be applied without too much adjustment in each region [14,15]. The first regionalization scheme of soil and water conservation in China, the Water and Soil Conservation Plan of the Middle Yellow River, was developed by the Yellow River Conservancy Commission in 1955 [16]. By this scheme, the Loess Plateau was divided into eight regions, and each region was assigned different jobs for soil erosion and water management in the next five years. Yet, this original effort was interrupted by the Great Leap Forward (1958–1961) and then by the Great Proletarian Cultural Revolution (1966–1976) until Chinese economic reform was implemented in 1978. At the Fourth National Conference on Soil and Water Conservation held in Beijing 1982, the State Council issued the Regulations of Soil and Water Conservation, defining that the departments of water resources at all administrative levels undertake the task of regionalization. After that, works have been revived. Especially after 2011, the first national regionalization of soil and water conservation (Appendix A), which divided the country into eight super-regions (first-level), 40 regions (second-level) and 115 sub-regions (third-level), was approved by the Ministry of Water Resources [14], and finer distinctions based on this scheme are being made by local governments and institutions within their administrative areas [17,18,19,20].
As efforts on regionalization of soil and water conservation are still burgeoning, questions arise such as: To what extent could progress in soil erosion and water management be attributed to regionalization? Is there any weakness as to the formulation and applying of regionalization? Addressing these questions, this article evaluates the regionalization of soil and water conservation in China from three aspects: (i) How is theoretical research on soil erosion enhanced by regionalization? (ii) How is practical management of soil erosion promoted by regionalization? (iii) Is there any drawback of regionalization? By evaluation, this article could be helpful for decision makers to improve regionalization schemes and formulate more region-specific policies.
2. Methods
Quantitatively evaluating regionalization is particularly difficult for two reasons. First, comparative trials are unavailable. It is not practicable to apply another scheme in an area and then compare it with the already existing one. Second, the contribution of regionalization to soil and water conservation is not possible to separate from other factors such as technological advance, financial support and labor input, because the effect of regionalization is always indirect. Considering these difficulties and the fact that so far, to our knowledge, there is no published information on this issue, this paper evaluates the achievements of regionalization in a manner combining statistical analysis of literature with qualitative analysis.
Specifically, to study the effect of regionalization on theoretical research, first we searched the keyword “regionalization of soil and water conservation” on the Chinese National Knowledge Infrastructure (CNKI, the most comprehensive knowledge database that stores over 90% of information resources including Chinese journals, newspapers, conference proceedings, yearbooks, patents, standards, laws and regulations) and gathered the top 10 most highly cited articles (Appendix B) about regionalization. Since almost all research advances about regionalization of soil and water conservation can be accessed on this database, citations of these top 10 would cover most of the theoretical influences of regionalization. Second, we classified these citations according to both the research field they belonged to and their content and then calculated the citation number of each category. Third, according to the citation results and compared to the research advances promoted by regionalization with already exiting research before the implementation of regionalization, we detailed the effect of regionalization on theoretical research.
To study the effect of regionalization on practice, we combined on-the-spot investigation with information retrieval from research articles and government documents. The authors travelled to seven provinces (Shannxi, Gansu, Hubei, Hunan, Jiangxi, Fujian, Guangdong) in 2016–2017 and collected information including region-specific measures and the distribution and operation of soil erosion monitoring sites. Moreover, by consulting local ministries of water resources and local residents, the author acquired their attitude towards and comments on the implementation of regionalization.
To identify the weaknesses of regionalization itself, we selected a total of 19 regionalization schemes at different scales (Appendix C) and focused on the process of regionalization, especially the indicator systems they used. We compared the indicators used for regionalization at the same and at different scales to identify the drawbacks of indicator systems. Additionally, on-the-spot investigation helped to identify deficiencies of regionalization in practice.
3. Results
3.1. Effect on Theoretical Research
By keyword searching, the top 10 most highly cited articles were selected. As Figure 1 illustrates, the top 10 articles were collectively cited 204 times, excluding self-citations and repeated citations. Classified by discipline, they were cited139 times by articles on soil science, among which 32 articles were on the regionalization of soil and water conservation at different scales (e.g., province, city or watershed), another 107 were research on soil conservation, including 83 theoretical research works mainly concerning the benefit of soil conservation, and 24 empirical articles mostly were on the experience of soil erosion management. The other 65 articles of the total of 204 were on regionalization in general use within different research fields, especially in ecology (mainly concerning ecological regionalization and ecological compensation). In addition, 24 articles of the total 204 concerned RS technology and mathematical methods, while the other 180 did not.
Hence, before detailed analysis, these numbers present general viewpoints: (i) regionalization of soil and water conservation influences not only soil science (both theoretically and practically), but also other related disciplines; and (ii) although technologies and mathematical methods such as RS/GIS have been employed, there is still a long way to go to systematically integrate quantitative approaches into the process of regionalization.
3.1.1. Driving the Research on Soil and Water Conservation
Regionalization stimulates the generation of new concepts related to soil erosion. New concepts and formulas have been proposed in the process of regionalization [21,22,23,24]. For example, the potential risk of soil loss (Ie) and the comprehensive index of soil erosion (E) were initially raised in 2007 by the Chinese Academy of Engineering to establish a technical framework for regionalization of soil and water conservation [24]. By calculating the Ie and E value of different regions in the targeted area, a general distribution of soil erosion could be established and further help the regionalization. These two concepts were not only used for regionalization, but also have been employed in other research concerning soil erosion [25,26,27], such as evaluating soil erosion susceptibility, capturing the spatial variation of soil erosion.
Comparative research has been promoted because of regionalization. As differences in both the natural environment and society between different areas have been emphasized by division, researchers are inspired to reveal more information with comparative studies. For example, Cheng et al. (2008) [28] compared the different characteristics of splash erosion on loess soil sampled in IV-2-2jt (the loess and hilly sub-region of Northwest Shanxi) and purple soil in VI-1-4tw (the Dabashan mountainous sub-region) and found that soil properties, especially particle size distribution, resulted in the different erosion rates in different regions. Ma et al. (2009) [29] calculated the economic losses caused by soil and water loss on slope cropland in four regions, and the result showed that the red soil region of Southern China suffers the most severe losses (84.63 billion yuan), followed by the Loess Plateau (64.96), the hilly and mountainous region of Northern China (26.78) and the black soil region of Northeast China (16.08); also, the different influences of soil erosion in different regions on sustainable development were analyzed.
Long-standing problems have been solved in the process of regionalization. The boundary between karst area of southwest China and red soil area of southern China had been an issue of controversy for a long time. However, this was settled in 2011 when the regionalization of soil and water conservation of the Pearl River drainage basin was carried out by the Pearl River Water Resources Commission. After detailed inspection and consultation with local departments and inhabitants, six counties (Hechi, Baise, Chongzuo, Longan, Mashan and Yicheng) in Guangxi province were determined as the northeast boundary between karst area and red soil area [30].
3.1.2. Impacting Other Research Fields
Regionalization restricts plans and designs in other fields [31]. In planning the development of the Xinhua-Ziquejie scenic area, the exploitation of resources was severely restricted in high Ie regions according to the regionalization of soil and water conservation of Xinhua county; different types of agriculture were applied in different regions (e.g., sightseeing agriculture and stereoscopic agriculture) [32]. Another case is the afforestation plan of Ningxia Hui Autonomous Region [33]. In generating the plan, regionalization of soil and water conservation of Ningxia was used to determine vegetation species and coverage, with the purpose to both restore native vegetation and conserve soil and water. Furthermore, ecology research has been enriched by regionalization. For example, indicators used for regionalization of soil and water conservation of Beijing were used in a P-S-R model for quantitatively evaluating the ecological security of Beijing [31].
Regionalization serves as a framework for interdisciplinary research [34,35]. Traditional research on soil science was mostly issue-oriented [36,37]. After the appearance of regionalization schemes, however, this manner has been replaced by the region-oriented one to some extent. One can easily find that more research conducted by workers from two or more disciplines, especially ecology, economics and management science, is centering on complex issues within a particular region rather than viewing questions as isolated. For example, in 2010, a cost-benefit analysis of soil and water conservation in different soil and water conservation regions was accomplished by the cooperation between the Ministry of Water Resources (MWR) and local departments of economy. The investment cost, operating cost, total/net benefit and the average time to become profitable of different soil conservation measures in different regions were calculated and then served as the guide for distributing region-specific measures with the hope to balance economy and ecology. For example, in the third-level region, V-4-6tr (the Center Hunan sub-region), the investment cost, operating cost, total benefit and net benefit of land terracing were 3510, 4510, 22,570 and 14,550 million yuan, respectively, and the average time to become profitable was one year [24].
3.1.3. Popularizing Advanced Methods and Completing Databases
Compared with experience, remote sensing (RS) and image interpretation are more accurate and convenient for acquiring the knowledge of how soil, vegetation, terrain and landform are integrated in a certain area, while this knowledge is the basis of regionalization [38]. The first use of RS in regionalization of soil and water conservation was by 56 technicians from the agriculture department of Shanxi province in October 1981, when they interpreted 200 images of the 23 quadrats picked out from six land types (i.e., farmland, woodland, grassland, water, eroded soil and check dams) in east Shanxi province and obtained 80 spectral curves [39].
Regionalization in turn spreads RS technology. Once the advantage of this new approach had been realized, it was widely applied in divisions. For example, in January 1982, just three months after the very first use, a training course in RS technology was organized by the Department of Soil and Water Conservation in Ganzhou, Jiangxi province [40]. Trainees learned how to interpret 1972 MSS satellite images and how to map according to the interpretation. Using this knowledge, they acquired the soil erosion distribution of Xingguo (a county in Ganzhou), which was then mapped [41].
Because quantitative methods could eliminate subjective judgment, which is considered as unreliable, as much as possible, mathematical methods were initially applied by Zhang (1990) [42], who introduced fuzzy clustering into the process of regionalization of soil and water conservation of Ansai county, located in the central Loess Plateau. After that, more and more mathematical methods, including the stepwise method, constellation graphical method, etc., have been generally applied for regionalization of soil and water conservation [43,44,45,46,47].
Because generating regionalization demands a large database of geographic and socioeconomic data, it is certain that these data, some of which were not collected or organized before, were completed in the course of regionalization. For example, the national soil erosion distribution map, drew in 2011 at the request of the workgroup for water census released in January 2010, with its detailed illustration, acted as an important basis for developing the national regionalization of soil and water conservation. Another case is that those 200 images interpreted by the agriculture department of Shanxi province, after being used for regionalization in 1981, were compiled and published in 1982 for further use [39]. Moreover, regionalization improved laws and regulations concerning soil erosion and water management. When the Law of the People’s Republic of China on Water and Soil Conservation was first adopted in 1991, no articles were involved with regionalization. When it was revised in 2010, regionalization of soil and water conservation was written into the law as an article in a separate chapter (Chapter II, planning of soil and water conservation).
3.2. Effect on Practice
3.2.1. Distributing Region-Specific Measures
Regionalization serves as the basis for the distribution of region-specific measures. The proportion of the seven measures (terrace, tree, shrubbery, grassland, energy forest, non-tillage and check dam) commonly used in China varies between different first-level regions (Figure 2). Region V has the largest proportion of terraced field (26.53%), almost eight-times higher than Region I (3.45%). This is because compared with Northeast China, which is mostly flatlands, hills and mountains dominate Southern China. Trees are more than shrubberies in Regions I/III/V/VI/VII, while Regions II/IV/VIII have the contrary cases because the lesser rainfall and hot environment are not suitable for trees. For the same reason, grassland has the largest proportion in Region VIII (23.5%) than other regions. Regions VII, III and V have more energy forests (20.73%, 13.7% and 12.93%, respectively) for two reasons: more appropriate climate to grow fast-growing trees and more integrated industry for efficient wood processing. Both Regions VI and VIII have of larger proportion of non-tillage land (30.27% and 28.26%, respectively) than other regions, but for different reasons: in the purple soil region, plants could grow due to the advantage of abundant rainfall and sunlight without tillage, while in the Tibet Plateau, human activities may disturb the fragile ecosystem. Check dams are unique to Regions II, III and IV; especially Region IV, because of the severe soil erosion over, 95% of check dams in China are constructed in the Loess Plateau.
3.2.2. Distributing Monitoring Sites
Soil erosion monitoring sites are distributed according to regionalization [49]. In China, the existing monitoring system of soil erosion consists of one national monitoring center run by MWR, seven regional monitoring centers run by the Conservancy Commissions of the seven main rivers and 30 provincial monitoring centers run by provincial water resources departments. The 483 monitoring sites under the supervision of these 38 centers are generally evenly distributed in the 41 sub-regions divided by the national regionalization of soil and water conservation. Another case is as illustrated in Figure 3: in order for soil erosion to be systematically monitored, the Huaihe River drainage basin was divided into seven monitoring regions, the boundaries of which are exactly similar to the boundaries of the soil and water conservation third-level regions [50].
3.2.3. Developing the Responsibility System
Regionalization enables the household responsibility system to operate. Before the 1980s, the period when the centrally-planned economy and equalitarianism prevailed, confusion over roles and responsibilities were one of the top reasons for less-than-ideal performance of soil erosion and water management. However, this has been changed after China’s economic reform and decollectivization of agriculture. In 1984, the household responsibility system was applied to soil management in Sichuan province. According to the regionalization scheme, 19.6 million yuan was allocated to each region for practices [24]. The principle that “whoever has the land management right shall be responsible for its erosion management; whoever is responsible for erosion management shall be entitled to its benefit” encouraged farmers to build water conservation projects and terraced fields with labor and capital inputs. Another case is that from 1986–2005, the crop yield and per capita annual net income of rural households had increased from 4305 kg/hm2 to 5600 km/hm2 and from 504 yuan to 3630 yuan in eight southern China provinces where the responsibility system of soil erosion and water management was also implemented [24]. Furthermore, this system has been evolved into several new forms in the 21th Century. In Jiangxi province, the pattern “government-company-household”, in which local governments offer preferential policies to companies who offer job opportunities to farmers, has achieved remarkable success. For example, a series of policies such as including Gardenia jasminoides planting into the “Returning Farmland to Forest” (RFFP) program [51,52], providing free nurseries and five years’ tax exemption on agricultural specialty products attracted 264-million-yuan in capital investment in fiscal year 2004 alone, and over 4670 hm2 of Gardenia jasminoides were planted. In addition, because villages within one region were more likely to take joint actions, regionalization made massive mechanization possible. In 2000–2004, under the supervision of a government workgroup, over 16,700 hm2 of terraced fields were constructed by bulldozers in Tongwei county, Gansu province [53].
3.3. Weaknesses of Regionalization
3.3.1. Weaknesses of Regionalization Itself
First, because socio-economic factors are of great importance for regionalization, it is necessary to have them integrated into the process of regionalization. However, the current situation is opposite. Methods and models of economics and management science have always been absent from regionalization. The proof is that, as in Figure 1, only 3% of the total 204 articles concerned these two disciplines. However, the common practice of merely including some socio-economic factors into indicator system is not enough to reflect the effect of society and economy on regionalization. Second, economic and administrative departments fail to participate in the development of regionalization. Most of the regionalization schemes are generated merely by local and national departments of water resources without taking advice from others, e.g., the department of agriculture/transport/industry. The lack of cooperation between disciplines and between departments impairs the accuracy of division and could hinder its implementation once generated.
Second, building an indicator system by including core factors concerning geographic features, socio-economic condition and soil erosion (e.g., mean annual precipitation, population density and soil erosion rate) is the essential first step of regionalization [54,55]. However, the indicator system has drawbacks. For a detailed statistical analysis of the indicator system, as in Table 1, in total, 19 regionalization schemes have been selected, including three sets at the drainage basin scale, four sets at each regional scale, provincial scale, small watershed scale and country scale.
Define the Indicator’s Degree of Aggregation (IDA) as the quotient of the net number of indicators (excluding repeated occurrences) divided by the total number of indicators. Larger IDA values indicate less aggregation and, hence, less uniformity. The IDA value of regionalization at the drainage basin scale, regional scale, provincial scale, small watershed scale and country scale were 0.80, 0.64, 0.51, 0.90 and 0.62, respectively. From these numbers, it is possible to conclude that regionalization at the same scale had no universally accepted standards for selecting indicators. Especially at the small watershed scale, even a total 51 indicators was used in the four schemes, and only four of them occurred more than once.
The lesser aggregation indicates that unreasonable indicators have been used for regionalization. For example, the proportion of fishery production in primary industry, reservoir volume and fertilizer used per year, which are barely related to soil erosion and water management, are considered as indicators for generating the regionalization of Lishui watershed [56]. Furthermore, involving too many less related factors into the indicator system resulted in a noticeably high correlation between indicators. In developing the regionalization of Yunnan province [20], the proportion of nonagricultural population and the proportion of agricultural population were both included in the indicator system. However, the Pearson’s correlation coefficient between the two variables was one, indicating that a liner function, y = 1 − x, could explain their relationship. Considering that all indicators could impact the calculation, there is no doubt that unreasonable indicators and collinearity between variables could damage the accuracy of fuzzy cluster analysis, which serves as a basis of regionalization.
In contract with regionalization at the same scale, works at different scales tended to use more similar indicator systems. The scale effect lost its significance. By adding up the number of the most repeated indicators at each scale and removing repeated occurrences, we obtained the total IDA value of 0.42, which is much lower than that at any scale, indicating that too many factors were repeatedly used at different scales. For example, population density and vegetation coverage were the two most repeated indicators at both the drainage basin scale and small watershed scale. This suggests that for both of the two scales, while a drainage basin could be 20–30-times larger than a small watershed, the population density and vegetation coverage were all key factors for regionalization. However, this was in contradiction to already existing knowledge, that heat and rainfall (controls of vegetation coverage) worked on larger scales, while human activities (partly expressed as population density) were only prominent at scatter ed sites [57,58].
3.3.2. Lack of Implementation
Because of the incomplete communication platforms and the conflict of interest between different regions and between different departments of government, there is a lack of a data sharing mechanism in China. This causes the data of some factors, which may have important influence on division, not to be included in the indicator system for calculation. Consequently, the accuracy of regionalization could be weakened.
Second, in many cases, regionalization schemes are merely formalities. Decision makers do not recognize regionalization schemes as the basis of distributing region-specific measures; they tend to put less emphasis on local-specific soil erosion management, but apply other region’s experience without adjustment. Hence, regionalization only is done to cope with supervisors’ requirements and has no practical effects on practice.
Third, the regionalization of soil and water conservation could be in conflict with other regionalization schemes or development plans generated by departments of transport, housing, land resources, water resources, environment, agriculture and industry. For example, in many cases, a certain area could belong to both a forbidden development region in the regionalization of soil and water conservation where human activities are prohibited to avoid soil disturbance and the development region in the plan of transport where an expressway is intended to be constructed. Under this circumstance, actors would be confused about balancing environment protection and infrastructure construction. This conflict is because the performance assessment of the Department of Transport does not include its responsibility for the environment; likewise, the performance assessment of the Department of Water Resources does not include its responsibility for construction. Consequently, each department acts to its own benefit, and plans and ideas of different departments are hardly exchanged clearly and efficiently. Furthermore, as the national policy of “remain committed to economic development as our central task” is currently valid, the priority of regionalization of soil and water conservation is in doubt.
4. Discussion
4.1. Modifying the Process of Regionalization
4.1.1. Integrating Economics and Management Science
As mentioned in Section 3.1.3, fuzzy clustering has been widely used in the process of regionalization. Cluster analysis assigns every single unit to clusters such that units in the same cluster are as similar as possible, while units belonging to different clusters are as dissimilar as possible [59]. Clusters are identified via the Euclidean distance; a certain region belongs to the category in the regionalization scheme that has the shortest Euclidean distance to it.
However, there are times that the Euclidean distance disables identifying clusters. Consider the scenario in Figure 4: Cities 1~6 located in Regions A, B and X and connected by Roads a~h; A, B are already existing first-level regions, and A-X and B-X have the exactly same Euclidean distance. The question is: should Region X be incorporated into A or B?
Apparently, fuzzy clustering is not applicable here because the equal Euclidean distance failed to identify clusters. However, the minimum cost flow model could be used. This model belongs to operational research and management science. As an approach to linear programming problems, it has been widely used in economics [54,60,61,62].
This model views cities as nodes and roads as arcs; goods (flow) transported from a supply city to a demand city (whether via a transshipment city or not) are limited by the cost per unit and the road capacity. The minimum transportation cost between two cities could be calculated by the following formula:
for each node i, subject to:
and for each arc i → j:
where Z represents the minimum cost between node i and j; cij represents the cost per unit flow through arc i → j; xij represents the flow through arc i → j; uij represents the arc capacity for arc i → j; bi represents the net flow generated at node i.
When applying the minimum cost flow model in this scenario, we first make hypotheses:
- (i)
- Soil erosion management in the undeveloped Region X demands resources support from developed Regions A and B;
- (ii)
- In Figure 4, Cities 1 and 4 are supply cities; City 3 is a demand city; Cities 2, 5 and 6 are transshipment cities;
- (iii)
- Road condition, truck availability and resource abundance limit the road capacity (unit: t) and the cost per unit (unit: dollars per t);
- (iv)
- In Figure 4, the road capacity and the cost per unit are listed in the brackets;
- (v)
- Managers want the maximum flow and the minimum cost at the same time.
Hence, for Regions A and X, we have:
- Minimum ZAX = 2x12 + 3x13 + 4x23
- subject to: x12 + x13 = 14, x23 − x12 = 0, −x13 − x23 = −16
- and 0 < x12 ≤ 5, 0 < x13 ≤ 9, 0 < x23 ≤ 7.
For Regions B and X, we have:
- Minimum ZBX = 3x45 + 3x46 + 6x43 + 2x53 + x63
- subject to: x45 + x46 = 15, −x53 − x43 − x63 = −14, x45 − x53 = 0, x46 − x63 =0
- and 0 < x45 ≤ 6, 0 < x43 ≤ 6, 0 < x46 ≤ 9, 0 < x53 ≤ 5, 0 < x63 ≤ 6.
Calculating the two linear programming equation sets, we have the results: for Regions A and X, the maximum flow and the minimum cost are 14 t and 57 dollars per t; for Regions B and X, the numbers are 14 t and 67 dollars per t. Since to maintain the same maximum flow, Region A costs less than Region B, it is reasonable for Region X to be incorporated into Region A for efficient management.
There are other models that could be employed in the process of regionalization; examples are the shortest-path model, the maximum flow model and the network simplex method [63]. Applying these models/methods makes it possible to realize better interdisciplinary cooperation in the process of regionalization and, thus, better regionalization schemes.
4.1.2. Combining Quantitative Analysis with Qualitative Analysis
The “3S” technology and mathematical methods have limitations when employed in regionalization [64]. First, indicators selected have been limited to those that are easy to express as exact numbers rather than descriptions; mathematical models could hardly include several important socio-economic factors quantitatively, such as farmers’ enthusiasm for soil conservation. Moreover, mathematical methods and computer calculation occasionally make it possible to use more unreasonable factors. Because computers can process a large volume of data at extremely high speed, some research is encouraged to include as many indicators as possible. For example, in generating the regionalization of soil and water conservation of Yunnan province [20], a total of 86 indicators was included in the indicator system, ten of which were about slope cropland: the area of slope cropland, the area of slope cropland with slopes <5°, 5–8°, 8–15°, 5–15°, 15–25°, >5°, >15°, >25° and 25–35°. These ten indicators are apparently unnecessary to all be used because of their linear correlation.
Second, because cluster analysis and the Euclidean distance are commonly used for division, mathematical methods only calculate indicators as numbers and throw their actual meanings away [65,66,67]. This could be illustrated by a scenario analysis assuming that: (i) R2 and R3 are two existing first-level regions; (ii) the indicator system includes only two factors: X1, soil erosion rate, and X2, population density; (iii) μ(X1) and μ(X2) are membership functions determined by the random fuzzy statistics method, and the dependent variables’ values are listed as in Table 2. The work is, by calculating the Euclidean distance with the formulas below, to determine whether the second-level region R1 should be incorporated into R2 or R3.
where rij represents the Euclidean distance between areas i and j; n represents the total number of indicators (here, two); Xik and Xjk are the values of the k-th factor in areas i and j, respectively.
Calculations (r12 = 0.4, r13 = 0.5) demonstrate that, technically, R1 could be incorporated into R2 as they have a comparatively lower value, therefore shorter distance. However, if we thoroughly inspect Table 2 and consider the actual meanings behind those figures, a question would be posed. Both R1 and R3 have a comparatively high soil erosion rate and low population density; on the contrary, R2 has a comparatively low soil erosion rate and high population density. Thus, is it inappropriate to incorporate R1 into a region that has the quite opposite condition? As region-specific soil erosion and water management expect measures could be implemented in a more homogeneous region, perhaps it is more reasonable to incorporate one area into another that shares similar natural characteristics and social conditions. Holding to this thought, qualitative analyses are needed for further study.
4.2. Strengthening the Implementation of Regionalization
To let regionalization of soil and water conservation guide the practice of soil erosion and water management, works should be emphasized on: (i) constructing a data sharing platform between different regions and between different departments of government to guarantee researchers’ access to the data needed for regionalization; (ii) coordinating the work of different departments of government to avoid conflict between different regionalization schemes and plans; and (iii) raising decision makers’ awareness of the effect of regionalization on region-specific soil conservation practice to lead to them formulate policies balancing economy and environment.
Both theoretical research on soil erosion and management practices of soil and water conservation are the bases of regionalization because of the theories and experience they brought. Studies on controls of soil erosion could help to establish a more reliable indicator system; already existing conservation projects are also important for division. At present, there is a trend that both governments and researchers tend to introduce more mathematical methods into the process of regionalization without considering their real effect. In the authors’ view, it is of priority to pay more attention to practice, because it is just meaningless to do regionalization work if actors do not have profound understanding of the importance of regionalization and if government departments do not put regionalization into practice.
5. Conclusions
This article is the first time the achievements and drawbacks of regionalization of soil and water conservation in China after its nearly 70-year implementation have been generally evaluated. Combining statistical analysis and on-the-spot investigation, the effect of regionalization on theoretical research and on practice are evaluated. Results show that regionalization drives the research on soil and water conservation, and other disciplines, especially ecology, popularize the “3S” technology and mathematical methods and help database construction. Regionalization serves as a framework for distributing region-specific measures and soil erosion monitoring sites, while also complementing the responsibility system that could encourage works on soil erosion and water management. On the other side, there exists limits to regionalization itself and its implementation. Addressing these weaknesses, methods of economics and management science should be employed in the process of regionalization, and qualitative methods should be combined with quantitative methods. Above all, for better implementation of regionalization in practice, it is of great importance to establish an effective cooperation mechanism between different government departments and between the government and actors. For researchers in the field of regionalization, deeper interdisciplinary research could be inspired by the idea of integrating operations research into the process of regionalization. For governments, this evaluation could be helpful to recognize the success, strengths and weaknesses of regionalization of soil and water in China and hence to take further steps to formulate region-specific policies dealing with complex environmental and economic problems in different regions.
Author Contributions
D.W. and Z.L. collected the information and wrote the paper. X.N. and C.L. contributed to statistical analysis and artwork. D.W., Z.L. and G.Z. revised the manuscript.
Funding
This research was funded by [the National Key Research and Development Program of China] grant number [2017YFC0505401]. The APC was funded by [2017YFC0505401].
Acknowledgments
This work was supported by the National Key Research and Development Program of China (No. 2017YFC0505401).
Conflicts of Interest
The authors declare no conflict of interests.
Appendix A. The National Regionalization of Soil and Water Conservation
| First-Level Region | Second-Level Region | Third-Level Region | |||
| ID | Name | ID | Name | ID | Name |
| I | The black soil super-region of Northeast China | I-1 | The mountainous region of Great Khingan and Lesser Khingan | I-1-1hw | The mountainous sub-region of Great Khingan for water conservation and ecological balance maintenance |
| I-1-2wt | The mountainous sub-region of Lesser Khingan for soil conservation and ecological balance maintenance | ||||
| I-2 | The hilly and mountainous region of Changbai-Wanda mountain | I-2-1wn | The Sanjiang Plain-Xingkai Lake sub-region for ecological balance maintenance and farmland protection | ||
| I-2-2hz | The Changbai mountainous sub-region for water conservation and disasters prevention | ||||
| I-2-3st | The Changbai hilly and mountainous sub-region for water quality maintenance and soil conservation | ||||
| I-3 | The flood plain region of Northeast China | I-3-1t | The flood plain sub-region of Northeast China for soil conservation | ||
| I-4 | The windy and sandy region of Song-Liao plain | I-4-1fn | The Song-Liao plain sub-region for dune fixation and farmland protection | ||
| I-5 | The hilly and mountainous region of Southeast Great Khingan | I-5-1t | The hilly and mountainous sub-region of Southeast Great Khingan for soil conservation | ||
| I-6 | The hilly and plain region of Hulun Buir | I-6-1fw | The hilly and plain sub-region of Hulun Buir for dune fixation and ecological balance maintenance | ||
| First-Level Region | Second-Level Region | Third-Level Region | |||
| ID | Name | ID | Name | ID | Name |
| II | The windy and sandysuper-region of Northern China | II-1 | The highland and hilly region of The Inner Mongolia | II-1-1tw | The highland sub-region of Xilingol for soil conservation and ecological balance maintenance |
| II-1-2tx | The Meng-Ji hilly sub-region for soil conservation and water impoundment | ||||
| II-1-3tx | The mountainous and highland sub-region of the northern slope of Yinshan Mountain for soil conservation and water impoundment | ||||
| II-2 | The Hexi Corridor and Alxa highland region | II-2-1fw | The Alxa highland sub-region for dune fixation and ecological balance maintenance | ||
| II-2-2nf | The Hexi Corridor sub-region for dune fixation and farmland protection | ||||
| II-3 | The mountainous and basin region of Northern Xinjiang | II-3-1hw | The Northern Junggar Basin sub-region for water conservation and ecological balance maintenance | ||
| II-3-2rn | The northern slope of Tianshan Mountain sub-region for habitat improvement and farmland protection | ||||
| II-3-3zx | The Yinli River valley sub-region for disasters prevention and water conservation | ||||
| II-3-4wf | The Tu-Ha basin sub-region for ecological balance maintenance and dune fixation | ||||
| II-4 | The mountainous and basin region of Sothern Xinjiang | II-4-1nh | The Northern Tarim Basin sub-region for farmland protection and water conservation | ||
| II-4-2nf | The Northern Tarim Basin sub-region for farmland protection and dune fixation | ||||
| II-4-3nz | The Northern Tarim Basin sub-region for farmland protection and disasters prevention | ||||
| First-Level Region | Second-Level Region | Third-Level Region | |||
| ID | Name | ID | Name | ID | Name |
| III | The hilly and mountainous super-region of Northern China | III-2 | The hilly and mountainous region of East Liaoning and Yanshan Mountain | III-2-2hw | The hilly and mountainous sub-region of Yanshan Mountain for water conservation and ecological balance maintenance |
| III-3 | The hilly and mountainous region of the Taihang Mountain | III-3-1fh | The hilly and mountainous sub-region of the Northwest Taihang Mountain for dune fixation and water conservation | ||
| III-3-2ht | The hilly and mountainous sub-region of the East Taihang Mountain for water conservation and soil conservation | ||||
| III-3-3th | The hilly and mountainous sub-region of the Southwest Taihang Mountain for soil conservation and water conservation | ||||
| III-4 | The hilly and mountainous region of Taiyi and Jiaodong | III-4-1xt | The Jiaodong Peninsula hilly sub-region for water impoundment and water conservation | ||
| III-4-2t | The hilly and mountainous sub-region of South Central Shandong for soil conservation | ||||
| III-5 | The North China Plain region | III-5-1rn | The Beijing-Tianjing-Hebei urban sub-region for Habitat improvement and farmland protection | ||
| III-5-2w | The Bohai Gulf sub-region Tianjin-Hebei-Shandong for ecological balance maintenance | ||||
| III-5-3fn | The Yellow River Flood Plain sub-region for dune fixation and farmland protection | ||||
| III-5-4nt | The hilly and plain sub-region of Northern Huaihe River for farmland protection and soil conservation | ||||
| III-6 | The hilly and mountainous region of Southwest Hnan | III-6-1tx | The loess and hilly sub-region of Southwest Henan for soil conservation and water conservation | ||
| III-6-2th | The hilly and mountainous sub-region of the Funiushan Mountain for soil conservation and water conservation | ||||
| First-Level Region | Second-Level Region | Third-Level Region | |||
| ID | Name | ID | Name | ID | Name |
| IV | The Losses Plateau | IV-1 | The losses and hilly region of Ningmeng | IV-1-1xt | The Yinshan mountainous and hilly sub-region for water impoundment and soil conservation |
| IV-1-2tx | The E-Wu Plateau hilly sub-region for soil conservation and water impoundment | ||||
| IV-1-3fw | The Center North Ningxia hilly and plain sub-region for dune fixation and ecological balance maintenance | ||||
| IV-2 | The gully and hilly region of Jin-Shan-Meng | IV-2-1jt | The Hu-E hilly and gully sub-region for sediment reduction and soil conservation | ||
| IV-2-2jt | The losses and hilly sub-region of Northwest Shanxi for sediment reduction and soil conservation | ||||
| IV-2-3jt | The losses and hilly sub-region of Northern Shannxi for sediment reduction and soil conservation | ||||
| IV-2-4jf | The gully and hilly sub-region of Northern Shannxi for sediment reduction and dune fixation | ||||
| IV-2-5jt | The hilly and gully sub-region of Center Yanan for sediment reduction and soil conservation | ||||
| IV-3 | The Wei-Fen and Jincheng hilly and terrace region | IV-3-1tx | The hilly and gully sub-region of the Middle Fen River for soil conservation and water impoundment | ||
| IV-3-2tx | The Southern Shanxi hilly and terrace sub-region for soil conservation and water impoundment | ||||
| IV-3-3tx | The northern slope of Qinling-hilly and terrace of Weihe River sub-region for soil conservation and water impoundment | ||||
| IV-4 | The tableland and gully region of Shannxi-Shanxi-Gansu | IV-4-1tx | The tableland and gully sub-region of Shannxi-Shanxi-Gansu for soil conservation and water impoundment | ||
| IV-5 | The hilly, gully and mountainous region of Gan-Ning-Qing | IV-5-1xt | The Southern Ningxia and Eastern Long hilly and gully region for water impoundment and soil conservation | ||
| IV-5-2xt | The Center Long hilly sub-region for water impoundment and soil conservation | ||||
| IV-5-3xt | The Eastern Qinghai and Southern Gaosu sub-region for water impoundment and soil conservation | ||||
| First-Level Region | Second-Level Region | Third-Level Region | |||
| ID | Name | ID | Name | ID | Name |
| V | The red soil super-region of Southern China | V-1 | The Jianghuai hilly and the downstream of Huaihe River region | V-1-1ns | The plain sub-region of Huaihe River downstream for farmland protection and soil conservation |
| V-1-2nt | The Jianghuai hilly sub-region for farmland protection and soil conservation | ||||
| V-1-3rs | The Zhe-Hu plain sub-region for habitat improvement and water quality maintenance | ||||
| V-1-4sr | The Taihu Lake hilly and plain sub-region for water quality maintenance and habitat improvement | ||||
| V-1-5nr | The hilly sub-region along the Huaihe river for farmland protection and habitat improvement | ||||
| V-2 | The Dabie-Tongbai mountainous and hilly region | V-2-1ht | The Tongbai-Dabie mountainous and hilly sub-region for water conservation and soil conservation | ||
| V-2-2tn | The Nanyang basin and the Dahongshan hilly sub-region for soil conservation and farmland protection | ||||
| V-3 | The hilly and plain region of the Middle Yangtze River | V-3-1nr | The Jianghan plain and hilly sub-region for farmland protection and habitat improvement | ||
| V-3-2ns | The Dongting Lake plain and hill sub-region for farmland protection and water quality maintenance | ||||
| V-4 | The hilly and mountainous region of Southern Yangtze River Basin | V-4-1ws | The Zhe-Wan hilly sub-region for ecological balance maintenance and water quality maintenance | ||
| V-4-2rt | The Zhe-Gan hilly sub-region for habitat improvement and soil conservation | ||||
| V-4-3ns | The Poyang Lake hilly and plain sub-region for farmland protection and water quality maintenance | ||||
| V-4-4tw | The Mufu-Jiuling mountainous and hilly sub-region for soil conservation and ecological balance maintenance | ||||
| V-4-5t | The Center Jiangxi sub-region for soil conservation | ||||
| V-4-6tr | The Center Hunan sub-region for soil conservation and habitat improvement | ||||
| V-4-7tw | The Southern Hunan sub-region for soil conservation and ecological balance maintenance | ||||
| V-4-8t | The Southern Jiangxi mountainous sub-region for soil conservation | ||||
| First-Level Region | Second-Level Region | Third-Level Region | |||
| ID | Name | ID | Name | ID | Name |
| V | The red soil super-region of Southern China | V-5 | The Zhe-Min mountainous and hilly region | V-5-1sr | The East Zhejiang hilly and islands sub-region for water quality maintenance and habitat improvement |
| V-5-2tw | The Southwest mountainous sub-region for soil conservation and ecological balance maintenance | ||||
| V-5-3ts | The Northeast Fujian mountainous sub-region for soil conservation and water quality maintenance | ||||
| V-5-4wz | The Northwest Fujian mountainous and hilly sub-region for ecological balance maintenance and disasters prevention | ||||
| V-5-5rs | The Northeast Fujian coastal hilly and plain sub-region for habitat improvement and ecological balance maintenance | ||||
| V-5-6tw | The Southwest Fujian mountainous and hilly sub-region for soil conservation and ecological balance maintenance | ||||
| V-6 | The Nanling mountainous and hilly region | V-6-1ht | The Nanling mountainous and hilly sub-region for water conservation and soil conservation | ||
| V-6-2th | The Southern Nanling mountainous and hilly sub-region for soil conservation and water conservation | ||||
| V-6-3t | The Center Guangxi hilly sub-region for soil conservation | ||||
| V-7 | The Southern China coastal hilly and terrace region | V-7-1r | The Southern China coastal hilly and terrace sub-region for habitat improvement | ||
| V-8 | The hilly and terrace region of South China Sea islands and Hannan province | V-8-1r | The coastal hilly and terrace sub-region of Hannan province for habitat improvement | ||
| V-8-2h | The Center Hainan mountainous sub-region for water conservation | ||||
| V-8-3w | The South China Sea islands sub-region for ecological balance maintenance | ||||
| V-9 | The Taiwan mountainous and hilly region | V-9-1zr | The Southern Taiwan mountainous and plain sub-region for disasters prevention and habitat improvement | ||
| V-9-2zw | The Huadong mountainous sub-region for disasters prevention and ecological balance maintenance | ||||
| First-Level Region | Second-Level Region | Third-Level Region | |||
| ID | Name | ID | Name | ID | Name |
| VI | The purple soil super-region of Southwest China | VI-1 | The Qingling-Dabashan region | VI-1-1st | The mountainous and hilly sub-region nearby Danjiangkou reservoir |
| VI-1-2ht | The southern slope of Qingling sub-region for water conservation and soil conservation | ||||
| VI-1-3tz | The Sourthern Long mountainous sub-region for soil conservation and disasters prevention | ||||
| VI-1-4tw | The Dabashan mountainous sub-region for soil conservation and ecological balance maintenance | ||||
| VI-2 | The Wuling mountainous and hilly region | VI-2-1ht | The Hubei-Chongqing mountainous sub-region for water conservation and soil conservation | ||
| VI-2-2ht | The Northwest Hunan mountainous and hilly sub-region for water conservation and soil conservation | ||||
| VI-3 | The Sichuan-Chongqing mountainous and hilly region | VI-3-1tr | The Sichuan-Chongqing Pingxing mountainous sub-region for soil conservation and habitat improvement | ||
| VI-3-2tr | The hilly and mountainous sub-region of Center North Sichuan Basin for soil conservation and habitat improvement | ||||
| VI-3-3zw | The Longmen-Emei mountainous sub-region for disasters prevention and ecological balance maintenance | ||||
| VI-3-4t | The hilly sub-region of Southern Sichuan Basin for soil conservation | ||||
| First-Level Region | Second-Level Region | Third-Level Region | |||
| ID | Name | ID | Name | ID | Name |
| VII | The karst super-region of Southwest China | VII-1 | The Yunnan-Guizhou-Guangxi mountainous and hilly region | VII-1-1t | The Center Guizhou mountainous sub-region for soil conservation |
| VII-1-2tx | The Yunnan-Guizhou-Guangxi plateau and mountainous sub-region for soil conservation and water impoundment | ||||
| VII-1-3h | The Guizhou-Guangxi mountainous sub-region for water impoundment | ||||
| VII-1-4xt | The Yunnan-Guizhou-Guangxi karst sub-region for water impoundment and soil conservation | ||||
| VII-2 | The mountainous and valley region of Northern Yunnan and Southwest Sichuan | VII-2-1tz | The Southwest Sichuan mountainous and valley sub-region for soil conservation and disasters prevention | ||
| VII-2-2xj | The Northern Yunnan hilly sub-region for water impoundment and sediment reduction | ||||
| VII-2-3w | The Northwest Yunnan mountainous sub-region for ecological balance maintenance | ||||
| VII-2-4tr | The East Yunnan plateau sub-region for soil conservation and habitat improvement | ||||
| VII-3 | The Southwest Yunnan mountainous region | VII-3-1w | The west Yunnan hilly and valley sub-region for ecological balance maintenance | ||
| VII-3-2tz | The Southwest Yunnan hilly sub-region for soil conservation and disasters prevention | ||||
| VII-3-3w | The Southern Yunnan hilly and valley sub-region for ecological balance maintenance | ||||
| First-Level Region | Second-Level Region | Third-Level Region | |||
| ID | Name | ID | Name | ID | Name |
| VIII | The Tibet Plateau | VIII-1 | The plateau region of Qaidam Basin and the northern slope of Kunlun Mountain | VIII-1-1ht | The Qilian mountainous sub-region for water conservation and soil conservation |
| VIII-1-2wt | The Qinghai Lake plateau and mountainous sub-region for ecological balance maintenance and soil conservation | ||||
| VIII-1-3nf | The Qaitam Basin sub-region for ecological balance maintenance and dune fixation | ||||
| VIII-2 | The Zoige-River sources mountainous and plateau region | VIII-2-1wh | The Zoige Plateau sub-region for ecological balance maintenance and water conservation | ||
| VIII-2-2wh | The Three River Sources mountainous sub-region for ecological balance maintenance and water conservation | ||||
| VIII-3 | The Qiangtang-Southwest plateau region | VIII-3-1w | The Qiangtang plateau sub-region of Northern Tibet for ecological balance maintenance | ||
| VIII-3-2wf | The plateau and mountainous sub-region of Southwest Tibet for ecological balance maintenance and dune fixation | ||||
| VIII-4 | The East Tibet-West Sichuan mountainous and valley region | VIII-4-1wh | The mountainous and valley sub-region of West Sichuan for ecological balance maintenance and water conservation | ||
| VIII-4-2wh | The East Tibet mountainous and valley sub-region for ecological balance maintenance and water conservation | ||||
| VIII-5 | The Yalu Zangbo River valley and Southern Tibet region | VIII-5-1w | The Southeast Tibet mountainous and valley sub-region for ecological balance maintenance | ||
| VIII-5-2n | The Center Tibet Plateau mountainous and valley sub-region for farmland protection | ||||
| VIII-5-3w | The Southern Tibet Plateau mountainous for ecological balance maintenance | ||||
Figure A1.
The National Regionalization of Soil and Water Conservation. (Source: The National Plan of Soil and Water Conservation of China).
Figure A1.
The National Regionalization of Soil and Water Conservation. (Source: The National Plan of Soil and Water Conservation of China).

Appendix B. The Top 10 Most Highly Cited Articles (Source: CNKI)
Note: Some titles and abstracts have grammatical/spelling errors or “Chinglish” expression, instead of correct we keep their published form. Four of the ten are Master’s Thesis, they may hardly access unless searching in Chinese databases. However, these do not weaken their popularity, because the ideas and methods of these articles do contribute to the regionalization of soil and water conservation in China.
(1) Problems of regionalization and planning of soil and water conservation in China.
Zhiguo Wang, Chunhong Wang, 2007. Science of Soil and Water Conservation. 5 (1), 105–109.
Abstract: Soil and water conservation planning is based on the data the of regionalization of soil and water conservation, and the data of soil erosion classification and regionalization. It is very important to understand the relation between the kinds of regionalization and planning correctly. Some conceptions, problems and interaction about it be discussed in this paper. The main viewpoints are that water resources administration should work out the blue prints of soil and water conservation regionalization, soil erosion regionalization and ecological natural restoration regionalization based on investigated results of soil erosion.
(2) Function and Value of Soil & Water Conservation Ecological Svices
Lan Wu, 2007. Beijing Forestry University, Beijing. Master’s Thesis.
Abstract: In this study, soil and water conservation, ecology, ecological economics theory as a guide, soil and water conservation function of ecological services division base on comprehensive analysis of China’s soil erosion and soil and water conservationon. Use avariety of methods to evaluate the ecological functions of Soiland Water Conservation value and the status and dynamic changes of the ecological services function capacity. According to the status quo value of soil and water conservation ecological services on the national ecological regionalization, explore the ways and methods of the Soil and Water Conservation ecological services compensation. Main research results as follows:
- Soil and Water Conservation ecological services functional definition refers to the process of soil and water conservation and the use of various measures to maintain, improvement and protection of human society and human survival in the natural environment for the comprehensive effectiveness, including the maintenance and water conservation, maintain and improve soil function of maintaining biodiversity, carbon fixation and oxygen release, air-cleaning, sand-fixing and maintaining the landscapes even functions, which functions of the former three is main functions.
- Soil Conservation Service ecological value of the concept of assessment: In particular scale and scope of regional soil and water conservation measures for the human and social services provided by the monetary measurement research. Among them, maintain and improve soil conservation value through conserving soil, reduce sedimentation and reduce soil erosion to measure; maintain and water conservation function through the protection of water resources and flood prevention measure; Air-cleaning through absorption value of SO2, reduce the absorption of fluoride and dust to measure; carbon fixation and oxygen release through vegetation value oxygen absorption of CO2 and O2 release to measure; maintain biodiversity functions, sand-fixing and wind preservation functional and the environment landscape function their evaluation index and function have the same name.
- Preliminary estimates the National Soil and Water Conservation ecosystem services volume value of the status quo: protection and conservation of water ecosystem services amount to 5.92 billion m3, maintain and improve the soil ecosystem services of a total of 8.09 billion tons. The various zones of ecological services for the overall ranking: Northwest > Southwest > South China > North China > Northeast; In additional, grass and forest measures, ecological restoration and project measures on the ecological services-oriented effect, and ecological restoration and the grass and forest measures more important than the projects measure; Simply take a soil and water conservation measures of soil and water significantly lower than the results of the effect of comprehensive measures.
- In 2003, additional soil and water conservation measures with a total value of ecological services for 10.021 billion yuan. Among them, maintain and improve soil and water conservation have a largest value. Sand-fixing and wind preservation functional is rather important in “Three North” area.
- Northeast, north China, northwest, south and southwest of five patches in 1950–1990, 1991–2005, 2006–2010, three periods of ecological services value is 74.668 billion yuan, 141.764 billion yuan and 172.692 billion yuan.
- Rainfall, soil erosion modulus, biological diversity and GDP was significantly correlated with ecological services total value, Soil bulk density, >10 °C accumulated temperature, wind speed, the average annual sunshine hours with total value is relevant intergovernmental relations, only with the total value of the average air humidity, altitude is not significant. The total value of ecological services is more sensitive.
- National water and soil conservation ecological services division to be three types of areas: water and soil conservation service fragile ecological zones (I), sensitive district of soil and water conservation ecological services (II) and ecological monitoring district (III).
- Soil and Water Conservation ecological services should be viewed as public goods; in the development process should be used for ecological compensation. Ecological compensation funds come from four ways: Region II, III region rely on industries, compensation for damage to sectors that benefit from benefit sectors; when resources development in I, the deposit should be paid to the development of enterprise compensation; II, III district through watershed ecological compensation for I district; establishment of a fund through all people taxes collected to co-ordinate arrangements for inter-generational compensation.
- In ecologic compensation strength, compensation strength to carry out full compensation to I and the soil and water conservation ecological services value is lower boundary; II ecological compensation intensity should do to meet “the necessary compensation” and “full compensation” according to local conditions, the soil and water conservation ecological services value is upper—limit; Soil and water conservation construction input can be as its upper—limit to III district.
(3) A primary study on scheme of soil and water conservation regionalization in China
Yan Zhao, Zhiguo Wang, Baoping Sun, Chao Zheng, Qiang Ji, Lei Feng, Qiankun Zhao, 2013. Acta Geographica Sinica. 68 (3), 307–317.
Abstract: Regionalization of soil and water conservation is the basis for the planning of soil and water conservation in China. It can provide scientific basis for constructing healthy ecological environments and regional management and development. It makes a brief review of related regionalization of study and makes clear the concept of regionalization of soil and water conservation. In this paper, based on synthetical analysis of the characteristics of ecological environments of China, the principles, indices and nomenclature of the regionalization of soil and water conservation are proposed. Through the construction of the regionalization of soil and water conservation collaboration platform and data reporting system, combined with the existing soil and water conservation research, this paper uses the top-down and bottom-up and the combination of qualitative and quantitative methods to build soil and water conservation regionalization preliminary scheme, with 8 regions, 41 subregions and 117 sections divided across the country.
(4) Review and thoughts on the regionalization of soil and water conservation in China.
Chao Zhang, Zhiguo Wang, Xiuru Wang, Lei Han, 2008. Science of Soil and Water Conservation. 6 (4), 100–104.
Abstract: Regionalization of soil and water conservation is an important and based work of soil and water conservation work. In this paper, initiating with the positioning, development history and current situation of the regionalization of the soil and water conservation, the existing problems of the regionalization of the soil and water conservation in China was analyzed, the characteristics, principles, principles of index setting, methods of the regionalization of soil and water conservation were discussed, and the framework of the regionalization of soil and water conservation in China was presented preliminarily.
(5) The study of regionalization on ecological restoration in China.
Baofeng Di, Peng Cui, Nanshan Ai, 2008. Journal of Sichuan University (Engineering Science Edition). 40 (5), 32–37.
Abstract: Developing nation wide ecological restoration researches for soil and water conservation are proposed in China. In this paper, optimal conditions of ecological restoration were analyzed abide by the principle of heterogeneity, zonation, grade, conjugacy, primary factor and county land integrity. The special mapping database was developed, based on the raw materials of 2861 counties. With the application of GIS, choosing the key actors, such as climate, vegetation, soil, physiognomy, the types of soil erosion, and population density, the national area, except TaiWan and maritime space, was divided into 4 first-level ecological restoration domains and 14 second-level ecological restoration regions by the way of adopting superposed analytical method and superincumbent partition method. Humid and Sem-humid ecological restoration domains have better natural conditions for afforestation. Arid and Semi-arid ecological restoration domains are only fit for afforestation in brush-fire area.
(6) Study on soil and water conservation regionalization and its system architecture—case in Shanxi Province.
Chao Zhang, 2008. Beijing Forestry University, Beijing. Master’s Thesis.
Abstract: Soil and water conservation regionalization has been a focus in basic research of Soil and Water Conservation, but the systemic research of soil and water conservation regionalization in large-scale is not much. The systemic and deep studies on soil and water conservation regionalization in China were done in the theories and methods in this paper. The studies have important theoretical and practical significance to the development of soil and water conservation regionalization in China, and certain significance to guide works of soil and water conservation in China. In this paper, study methods of theoretical analysis and example analysis are used. On the basis of the comprehensive analysis of domestic and international studies, history, current situation and existing problems of soil and water conservation regionalization are understood correctly. The connotation and nature of soil and water conservation regionalization are defined, and soil and water conservation regionalization is posited. The theoretical basis and principles of soil and water conservation regionalization are defined, indexes system design principles and component of soil and water conservation regionalization in China are presented, and methods of regionalization are confirmed. For the first time, the system architecture of soil and water conservation regionalization is discussed; research and analysis are carried out in Shanxi Province as an example in this paper. The results show that:
- (1)
- Soil and water conservation regionalization is the sector compositive regionalization, is a basic task of soil and water conservation, is a macro, strategic, directional and technical document, is the strategy in large and medium-scale of soil and water conservation.
- (2)
- Basic theories of soil and water conservation regionalization include regional heterogeneity rule, sustainable development theory, the system scientific principles, ecological economics, soil and water resource management differences; Regionalization principles include genetic principle, similar in the region and difference between regions, holistic principle, dominant principle, regional conjugate principle, integrity of the administrative border, combining qualitative and quantitative analysis, time limit principle.
- (3)
- Based on the design principles of indexes system of soil and water conservation regionalization, and combined impact factor of soil and water conservation, indexes system includes four elements of nature, land use, society-economy, soil erosion and water loss, principal component analysis is used to extract components and the weight of every component is put by rate of contribution.
- (4)
- The methods combining statistical analysis and spatial overlay analysis are used in soil and water conservation regionalization. Firstly, hierarchical cluster analysis is carried out according to integrated scores of every component, so zoning maps of every element are gotten. Where after, spatial overlay analysis is processed by GIS, zoning maps of every element are folded, so the results of soil and water conservation regionalization are achieved after adjusting.
- (5)
- The system architecture of soil and water conservation regionalization in China is the integration including research system, framework system and application system. Research system is the technical support system. Framework system includes the database system and establishment of soil and water conservation regionalization system, which is the way to the realization of soil and water conservation regionalization system. Application system defines the legal status of soil and water conservation regionalization and the relation between related regionalization (district), this system is the guarantee to execute soil and water conservation regionalization.
- (6)
- Based on the example of Shanxi Province, soil and water conservation regionalization is carried out according to determined theories and methods, which proved the scientificalness of theories and the feasibility of methods. The innovation of this paper: Through studies, the position of the soil and water conservation regionalization is defined clearly. The extraction methods of the dominant components from every element are presented, and regionalization methods combining statistical analysis and spatial overlay analysis are used. The system architecture of soil and water conservation regionalization in China is put forward, that has important guiding significance to the future works of soil and water conservation.
(7) Study on soil and water conservation regionalization and function orientation.
Yan Zhao, 2013. Beijing Forestry University, Beijing. Master’s Thesis.
Abstract: With beautiful Chinese ecological civilization construction and the national strategic target, the problem of ecological environment construction and regional sustainable development has become the focus of attention of many scholars. Soil and water conservation is a long-term basic state policy of China, soil and water conservation regionalization is the key premise of the planning. However, at the request of the new period, the problem of nationwide and large-scale soil and water conservation regionalization still has not been resolved. Based on the national primary soil and water conservation regionalization soil, this article is focused on systems, methods and functions of secondary and tertiary soil and water conservation regionalization. This paper is based on summarizing the relevant division results and a comprehensive analysis of China’s natural geography, soil erosion, ecological environment, social and economic characteristics. Giving full consideration to the characteristics and needs of economic and social development of regional soil and water conservation. The paper is to established the basic principles, methods and index system and put forward the type of soil and water conservation function, the evaluation index system and method. The data were collected through the National Soil and Water Conservation regionalization data reporting system. The paper completed secondary and tertiary soil and water conservation regionalization and functional orientation by remote sensing, geographical information system (ARCGIS), statistical analysis (SPSS, MATALAB) and other technical. According to the leading function, the paper put forward the prevention technology ways. This paper chooses Northwest Loess Plateau and South China red soil region as a typical case study. The purpose of this study is to provide a scientific basis for soil and water conservation regionalization and ecological environment construction. Ideas and results of this study are as follows:
- This paper determines the soil and water conservation regionalization theoretical foundation and principles. Soil and water conservation regionalization is integrated sector economic regionalization, which is distinct but related to the completed the topography, soil and forestry regionalization. The regionalization was based on natural geographic differentiation theory, scientific theory and ecological economic theory, using principles of regional similarity and inter-regional diversity, combining the dominant factor with synthesis, regional continuity, taking the larger one, dominant function of soil and water conservation as the regionalization principles. The objectives and tasks of secondary and tertiary soil and water conservation regionalization raised by related division level hierarchy.
- The paper constructs the index system and method of soil and water conservation regionalization. After analyzing the impact factors of soil erosion and soil and water conservation, the results showed that the index system consists of four aspects including natural geographic features, soil and water conservation research, this paper uses the top-down and bottom-up and the combination of qualitative and quantitative methods to build soil and water conservation regionalization preliminary scheme. Component analysis, system clustering, artificial neural network (SOFM), the spatial overlay status evaluation and experts discrimination were defined as Soil and Water Conservation regionalization method. The county-level administrative regionalization was defined as the basic unit of regionalization.
- Secondary soil and water conservation regionalization. The basis for regionalization was defined and the indicators include reference common indicators of the characteristics of dominant landforms and altitude, soil erosion type and intensity, hydrothermal indicators. The method of analysis is quantitative analysis, combined with qualitative. Northwest Loess Plateau as a instance, the average annual rainfall, vegetation cover and erosion intensity ratio were selected as the five leading indicators, through the use of system clustering method, the Northwest Loess Plateau is divided to five secondary regions. Spatial overlay analysis and artificial neural network model were used to analysis the secondary regionalization in Southern Red Soil Regions. Eight secondary regions were reached analyzing 6 indicators including the average annual rainfall, ^10"C accumulated temperature, land use type, soil type and others with spatial overlay. It is divided to eight secondary regions analyzing 9 indicators including the average annual rainfall, the average runoff, >15 °C slope area ratio, more than mild erosion area ratio, mountain area and others with artificial neural network model (SOFM). By analyzing the results of two methods, combined with expert discriminant, Southern Red Soil Regions is divided to eight secondary regions.
- Tertiary soil and water conservation regionalization. This paper proposes the tertiary soil and water conservation index selection principles and methods of regionalization. The tertiary soil and water conservation regionalization was studied by taking the Northwest Loess Plateau for example» and the classify of secondary regions were studied in comparison with the technical solution by factors. The index system of tertiary regions in Northwest Loess Plateau includes natural factors, factors of soil erosion, land-use factors and economic and social factors of a total of 24 indicators. The plan a is based on the combination of principal component analysis and system clustering method for the tertiary regions of each secondary regions. The plan b is based on the principal component analysis, cluster and spatial overlay by combining the elements. By contrast plan a and b, the Northwest Loess Plateau is divided into 16 sections combined with expert discriminant.
- Soil and Water Conservation Function Orientation and partition prevention. This paper proposes 8 basic functions of soil and water conservation with the connotation and defined conditions, and the function of soil and water conservation evaluation index system and evaluation methods. Northwest Loess Plateau function importance evaluation map is obtained through the function of evaluation results of soil and water conservation, then by spatial overlay analysis, received the Northwest Loess Plateau Soil and Water Conservation comprehensive evaluation map. The Soil and Water Conservation dominant function of each tertiary regions in the Northwest Loess in determined by stacked the comprehensive evaluation map with tertiary regions boundary. The partition prevention technical ways is put forward by the dominant function of the tertiary regions.
Through studies, the objectives and tasks of the secondary and tertiary soil and water conservation regionalization is defined clearly. This paper constructs the index system of soil and water conservation regionalization. and explores the dominant index, principal component analysis, cluster analysis, artificial neural network (SOFM), spatial overlay and expert evaluation division method in feasibility zoning of soil and water conservation. This paper first put forward positioned the tertiary regions by dominant function and the evaluation index system, and for the different partitions prevention technical approach. It is to provide the theoretical basis and practical significance for the regionalization and planning of soil and water conservation in China.
(8) Appraise on water and soil conservation ecological function and regionalization in Yi-Shu-Si Basin of Shandong Province based on GIS.
Xiumei Sun, 2005. Shandong Normal University, Jinan. Master’s Thesis.
Abstract: Yi-Shu-Si basin of Shandong province is the most serious area of water and soil losses over Huaihe basin. The emergence and development of water and soil losses for a long time, cause the land to cut brokenly, the area of stony desertification is expanded, natural vegetation depredated, bio-diversity destruction, soil degradation, water resource consume, ecosystem function decay, flood and droughts hurt getting frequent, have formed the special erosion environment. The extensive distributions of soil and water losses have aggravated the contradictions of the population, resource, environment and development, high-density population avail themselves of the natural resources predatorily in order to survive and develop. It has very important meanings in controlling water and soil losses and constructing eco-environment to carry on ecological function districts and to study the erosion characters of Yi-Shu-Si basin of Shandong province.
Because of its ocular, vivid, high-efficient working way, diversified information sources and strong ability to deal with space data, GIS is widely used in such fields as water and soil conservation and ecological function districts, etc. The application of the computer and GIS has brought enormous efficiency in water and soil conservation in recent years, especially in soil corroding investigating and appraising aspects. It has saved the funds expenses, raised efficiency, produced enormous society and economic benefits since GIS is more and more used in soil corroding investigating, setting-up of the information system of water and soil conservation and ecological function districts.
Referring to the domestic and international materials about soil and water losses and conservations, the thesis sets up the ecological function evaluation index system and appraise models of water and soil conservation for the experimental region combining t its uniqueness. Based on the evaluation of the ecological function of water and soil conservation, the experimental region is divided into several different kinds of ecological function districts and the countermeasures for constructing eco-environment are put forward.
First of all, the thesis defines the ranges of Yi-Shu-Si basin of Shandong province, summarizes the physical geography state and social economic situation of this area and analyses the soil erosion situation and problems existing in ecological environment construction and protection work at present. Secondly, it confirms each factor of the sensitiveness that influences the soil to corrode according to the principles, such as scientific, practical, quantitative, etc. Then the thesis analyses the impact on soil erosion of R, K, S, C factor separately and carries on comprehensive appraisal; And appraises the ecological service function referring to “the tentative specification of ecological function zoning”. Finally, the thesis marks off the ecological function districts of water and soil conservation. According to the guidelines and principle of ecological function zoning of water and soil conservation, it concretely gives the zoning basis of Yi-Shu-Si basin of Shandong and makes several districts based on the natural geographical feature of space, space dispersed differentiation law of soil corrode sensitiveness and ecological service function type. On this basis, it sums up the characteristic of each ecological function district, including physical geography condition, climate description, typical ecosystem type, main ecological environment questions that exist or potential and ecological protective measures.
(9) An approach to soil and water conservation division in Shandong Province.
Yujian Wang, 1990. Bulletin of Soil and Water Conservation. 10 (5), 19–22.
Abstract: The soil and water conservation division of Shandong Province was discussed in this paper. Based on the natural and social conditions, the factors which affect soil erosion and water loss and erosion situation, the principle of soil and water conservation division in Shandong Province was proposed under the premise of water conservancy ministry for unified division of first and second grade. According to this principle, whole province was divided into 3 third grades and 12 subgrades.
(10) The use of fuzzy clustering in regionalization of soil and water conservation.
Hanxiong Zhang, 1990. Soil and Water Conservation in China. 11, 52–54.
This article is the first-time mathematical methods employed in China for regionalization of soil and water conservation. Because it didn’t involve any abstract in English, we summarize its main points as follow:
- (1)
- Fuzzy clustering was used for regionalization of soil and water conservation in Ansai country, Losses Plateau;
- (2)
- Eight factors were selected for building the indicator system: mean annual precipitation, depth of runoff, gully density, vegetation coverage, the proportion of terrace land, population density, soil erosion modulus, and per capita cultivated land;
- (3)
- Consequently, three regions were recognized.
Appendix C. Supplement to Table 2, Indicators Used in Each of the 19 Regionalization Schemes
- (1)
- The Pearl River drainage basin
- lithological characters
- causes of soil and water loss
- dominant landscape
- type of soil and water loss
- rate of soil and water loss (%)
- type of soil
- landscape characteristics
- population density (per/km2)
- cultivation intensity (%)
- goals of soil erosion management
- (2)
- The Huaihe River drainage basin
- proportion of hilly land (%)
- mean annual precipitation (mm)
- vegetation coverage (%)
- proportion of soil apt to suffer wind erosion (%)
- population density (per/km2)
- proportion of eroded land (%)
- (3)
- The Taihu Lake drainage basin
- altitude (m)
- land slope (°)
- mean annual precipitation (mm)
- soil erodibility
- wind speed (m/s)
- vegetation coverage (%)
- proportion of slope cropland (%)
- population density (per/km2)
- proportion of eroded land (%)
- (4)
- The mountainous region of Zhejiang and Fujian
- altitude (m)
- landscape characteristics
- population density (per/km2)
- per capita income (yuan/a)
- GDP per capita (yuan)
- proportion of secondary industry production (%)
- cultivation intensity (%)
- vegetation coverage (%)
- soil thickness (cm)
- accumulated temperature above 10 °C (°C)
- mean annual precipitation (mm)
- goals of soil erosion management
- (5)
- The hilly and gully region of the Loess Plateau
- cultivation intensity (%)
- vegetation coverage (%)
- population density (per/km2)
- grain output per mu (1 mu= 0.0666667 ha.) (kg/mu)
- mean annual precipitation (mm)
- mean annual evaporation (mm)
- (6)
- The plateau region of Yunnan, Guizhou and Sichuan
- altitude (m)
- GDP per capita (yuan)
- mean annual temperature (°C)
- accumulated temperature above 10 °C (°C)
- population density (per/km2)
- proportion of slope cropland (%)
- vegetation coverage (%)
- proportion of stony desertification land (%)
- proportion of eroded land (%)
- proportion of restored land (%)
- (7)
- The mountainous region of Yanshan
- altitude (m)
- topographic relief (m)
- land slope (°)
- population density (per/km2)
- rate of soil erosion (%)
- type of soil
- type of vegetation
- vegetation coverage (%)
- (8)
- Liaoning
- mean altitude (m)
- mean annual temperature (°C)
- accumulated temperature above 10 °C (°C)
- mean annual precipitation (mm)
- mean wind speed (m/s)
- strong wind days (d)
- vegetation coverage (%)
- population density (per/km2)
- per capita annual net income of rural households (per/yuan)
- GDP per capita (yuan)
- proportion of secondary industry production (%)
- proportion of cropland (%)
- proportion of slope cropland (%)
- proportion of forestland (%)
- proportion of eroded land (%)
- type of soil erosion
- rate of soil erosion (%)
- proportion of highly eroded land (%)
- proportion of desertification land (%)
- function of soil and water conservation
- goals of soil erosion management
- (9)
- Jiangsu
- mean altitude (m)
- proportion of hilly land (%)
- mean annual precipitation (mm)
- mean annual temperature (°C)
- vegetation coverage (%)
- proportion of desertification land (%)
- proportion of water area (%)
- population density (per/km2)
- GDP per capita (yuan)
- proportion of primary industry production (%)
- proportion of secondary industry production (%)
- proportion of orchard (%)
- proportion of forestland (%)
- proportion of unused land (%)
- proportion of land for construction (%)
- proportion of eroded land (%)
- proportion of level-I eroded land (%)
- proportion of level-II eroded land (%)
- proportion of level-III eroded land (%)
- proportion of level-IV eroded land (%)
- proportion of level-V eroded land (%)
- proportion of level-VI eroded land (%)
- (10)
- Shanxi
- altitude (m)
- accumulated temperature above 10 °C (°C)
- annual precipitation (mm)
- microtopography
- type of soil
- rate of soil and water loss (%)
- vegetation coverage (%)
- per capita annual net income of rural households (yuan/a)
- (11)
- Hubei
- mean land slope (°)
- proportion of slope cropland (%)
- mean annual precipitation (mm)
- mean annual temperature (°C)
- vegetation coverage (%)
- population density (per/km2)
- GDP per capita (yuan)
- proportion of primary industry production (%)
- proportion of secondary industry production (%)
- proportion of orchard (%)
- proportion of forestland (%)
- proportion of unused land (%)
- proportion of land for construction (%)
- proportion of eroded land (%)
- proportion of level-I eroded land (%)
- proportion of level-II eroded land (%)
- proportion of level-III eroded land (%)
- proportion of level-IV eroded land (%)
- proportion of level-V eroded land (%)
- proportion of level-VI eroded land (%)
- (12)
- Kuyehe
- gully density (km/km2)
- soil fertility
- depth of runoff (cm)
- modulus of sediment yield (t/km2·a)
- vegetation coverage (%)
- organic matter content (g/kg)
- maximum daily precipitation (mm)
- strong wind days (d)
- Surface evaporation (mm)
- mean annual temperature (°C)
- (13)
- Tuweihe
- gully density (km/km2)
- soil erosion modulus (t/km2)
- proportion of coarse sand (%)
- proportion of clay particle (%)
- population density (per/km2)
- per capita cultivated land (per/mu)
- sunshine duration (h)
- (14)
- Xiannangou
- slope of land (°)
- vegetation coverage (%)
- land use type
- measures of soil and water conservation
- soil erosion modulus (t/km2)
- (15)
- Lishui
- Altitude (m)
- proportion of mountainous area (%)
- proportion of hilly land (%)
- proportion of basin and plain (%)
- drainage density (km/km2)
- proportion of eroded land (%)
- soil erosion modulus (t/km2)
- precipitation during flood season (mm)
- population density (per/km2)
- natural population growth rate (%)
- urbanization level (%)
- proportion of cropland (%)
- proportion of farmland (%)
- proportion of forestland (%)
- proportion of orchard (%)
- proportion of grassland (%)
- proportion of land for construction and others (%)
- reservoir capacity (m3)
- dam capacity (m3)
- fertilizer used per year (t/mu)
- GDP per capita of 2007 (yuan)
- GDP growth (%)
- proportion of primary industry production (%)
- proportion of tertiary industry production (%)
- proportion of agricultural production (%)
- proportion of forestry industry production (%)
- proportion of animal husbandry industry production (%)
- proportion of fishery industry production (%)
- proportion of service industry production (%)
- (16)
- Fangshan
- population density (per/km2)
- cultivation intensity (%)
- vegetation coverage (%)
- gully density (km/km2)
- soil erosion modulus (t/km2)
- land development goals
- soil conservation measures
- (17)
- Ansai
- mean annual precipitation (mm)
- depth of runoff (mm)
- gully density (km/km2)
- vegetation coverage (%)
- proportion of tableland (%)
- soil erosion modulus (t/km2)
- per capita cultivated land (per/mu)
- population density (per/km2)
- (18)
- Shaowu
- rate of soil and water loss (%)
- tendency of soil and water loss
- slope land quality level (determined according to soil thickness, soil fertility and soil texture)
- land slope (°)
- altitude (m)
- vegetation coverage (%)
- population density (per/km2)
- cultivation intensity (%)
- multiple cropping index (%)
- (19)
- Xigu
- mean annual precipitation (mm)
- population density (%)
- vegetation coverage (%)
- proportion of eroded land (%)
- soil thickness (cm)
- landscape characteristics
- rate of soil erosion
- management of soil erosion
- goals of land use
References
- Homer, C.; Huang, C.; Yang, L.; Wylie, B.; Coan, M. Development of a 2001 National Land-Cover Database for the United States. Photogramm. Eng. Remote Sens. 2004, 70, 829–840. [Google Scholar] [CrossRef]
- Tao, F.; Zhang, Z.; Xiao, D.; Zhang, S.; Rötter, R.P.; Shi, W.; Liu, Y.; Wang, M.; Liu, F.; Zhang, H. Responses of wheat growth and yield to climate change in different climate zones of China, 1981–2009. Agric. For. Meteorol. 2014, 189–190, 91–104. [Google Scholar] [CrossRef]
- Schnieders, J.; Feist, W.; Rongen, L. Passive houses for different climate zones. Energy Build. 2015, 105, 71–87. [Google Scholar] [CrossRef]
- Zhang, B.; Yang, Y.S.; Zepp, H. Effect of vegetation restoration on soil and water erosion and nutrient losses of a severely eroded clayey plinthudult in southeastern china. Catena 2004, 57, 77–90. [Google Scholar] [CrossRef]
- Wang, X.; Zhao, X.; Zhang, Z.; Yi, L.; Zuo, L.; Wen, Q.; Liu, F.; Xu, J.; Hu, S.; Liu, B. Assessment of soil erosion change and its relationships with land use/cover change in China from the end of the 1980s to 2010. Catena 2016, 137, 256–268. [Google Scholar] [CrossRef]
- Liu, C.; Li, Z.; Dong, Y.; Nie, X.; Liu, L.; Xiao, H.; Zeng, G. Do land use change and check-dam construction affect a real estimate of soil carbon and nitrogen stocks on the loess plateau of China? Ecol. Eng. 2017, 101, 220–226. [Google Scholar] [CrossRef]
- Teng, H.; Liang, Z.; Chen, S.; Liu, Y.; Viscarra Rossel, R.A.; Chappell, A.; Yu, W.; Shi, Z. Current and future assessments of soil erosion by water on the Tibetan plateau based on rusle and CMIP5 climate models. Sci. Total Environ. 2018, 635, 673–686. [Google Scholar] [CrossRef] [PubMed]
- Zhang, Y.; Wang, P.; Wang, T.; Cai, C.; Li, Z.; Teng, M. Scenarios simulation of spatio-temporal land use changes for exploring sustainable management strategies. Sustainability 2018, 10, 1013. [Google Scholar] [CrossRef]
- Robert, J.R.E.; Sun, P.; Zhu, T. The direct and indirect effect of urbanization on energy intensity: A province-level study for China. Energy 2017, 123, 677–692. [Google Scholar] [CrossRef]
- Cai, J.L.; He, Y.; Olli, V. Impacts of urbanization on water use and energy-related CO2 emissions of residential consumption in China: A spatio-temporal analysis during 2003–2012. J. Clean. Prod. 2018, 194, 23–33. [Google Scholar] [CrossRef]
- Wang, X.D.; Zhong, X.H.; Fan, J.R. Spatial distribution of soil erosion sensitivity on the Tibet Plateau. Pedosphere 2005, 4, 465–472. [Google Scholar]
- Chen, L.; Wei, W.; Fu, B.; Lü, Y. Soil and water conservation on the Loess Plateau in China: Review and perspective. Prog. Phys. Geogr. 2007, 4, 389–403. [Google Scholar] [CrossRef]
- Zhang, W.; Li, H.; An, X. Ecological civilization construction is the fundamental way to develop low-carbon economy. Energy Procedia 2011, 5, 839–843. [Google Scholar] [CrossRef]
- Zhao, Y.; Wang, Z.; Sun, B.; Zhang, C.; Ji, Q.; Feng, L.; Shi, M. A study on scheme of soil and water conservation regionalization in China. J. Geogr. Sci. 2013, 23, 721–734. [Google Scholar] [CrossRef]
- Zhao, Y.; Wang, Z.; Sun, B.; Zhang, C.; Ji, Q.; Feng, L.; Zhao, Q.K. A primary study on scheme of soil and water conservation regionalization in China. Acta Geogr. Sin. 2013, 68, 307–317. (In Chinese) [Google Scholar]
- Wang, F.; Mu, X.; Li, R.; Fleskens, L.; Stringer, L.C.; Ritsema, C.J. Co-evolution of soil and water conservation policy and human-environment linkages in the yellow river basin since 1949. Sci. Total Environ. 2015, 508, 166–177. [Google Scholar] [CrossRef] [PubMed]
- Wang, X.M.; Zhang, C.; Chai, Z.P.; Jia, R.S. Regionalization of Soil and Water Conservation of Fuyun County. Soil Water Conserv. China 2011, 9, 25–28. (In Chinese) [Google Scholar] [CrossRef]
- Zhang, Y.X.; Zang, G.M.; Li, H.L.; Niu, Z.H.; Mu, X.M. Management pattern and regionalization of soil and water conservation in hilly area of Zhejiang and Fujian province. Bull. Soil Water Conserv. 2013, 33, 112–115. (In Chinese) [Google Scholar] [CrossRef]
- Liu, H.; Qi, S.; Zhang, H.L. Research on soil and water conservation zonation based on method of spatial autocorrelation-a case study in black soil region of Northeast China. Bull. Soil Water Conserv. 2016, 36, 321–326. (In Chinese) [Google Scholar] [CrossRef]
- Mi, Z.J.; Zhu, Y.Y.; Jiang, H.L.; Zhao, C.; Huang, J.W. Regionalization method of soil and water conservation in Yunnan province based on multivariate data. Res. Soil Water Conserv. 2017, 24, 64–69. (In Chinese) [Google Scholar] [CrossRef]
- Liu, J.H.; Zhou, C.X.; Gao, J.X.; Ma, S.; Wang, W.J.; Wu, K.; Liu, Y. Location determination of ecologically vulnerable regions in China. Biodivers. Sci. 2015, 6, 725–732. [Google Scholar] [CrossRef]
- Wang, D.L.; Bi, Y.Y. Land loss and terracing of the land on the slopes of the central and west China’s fragile ecological zone. China Pop. Resour. Environ. 2002, 5, 88–91. (In Chinese) [Google Scholar]
- Fan, F.D.; Wang, K.L.; Xiong, Y.; Xuan, Y.; Zhang, W.; Yue, Y.M. Assessment and spatial distribution of water and soil loss in karst regions, southwest China. Acta Ecol. Sin. 2011, 21, 6353–6362. (In Chinese) [Google Scholar]
- The Ministry of Water Resources of the PRC; Chinese Academy of Sciences; Chinese Academy of Engineering. Management of Soil and Water Loss in China and Ecological Security, 1st ed.; China Science Publication: Beijing, China, 2010; pp. 194–196. ISBN 978-7-03-026275-2. (In Chinese) [Google Scholar]
- Yang, W.; Li, L.; Guo, W.H.; Ma, L.M. Study on the regional differentiation characteristics of soil erosion in Hubei province based on the soil erosion aggregative index. Subtrop. Soil Water Conserv. 2015, 27, 1–5. (In Chinese) [Google Scholar]
- Gan, C.H.; Zhao, Y.J.; Li, Y.B. Relation between watershed type and soil erosion in hinterland of Three Gorges Reservoir area. Bull. Soil Water Conserv. 2015, 35, 291–295. (In Chinese) [Google Scholar]
- Yang, Q.L.; Ding, P.K.; Xian, W.; Yi, X.; Shao, H.Y.; Sun, X.F. Forecasting and pre-warning system development for rainstorm waterlogging in Hongze Lake detention basin. Yangtze River 2018, 49, 30–35. (In Chinese) [Google Scholar]
- Cheng, Q.; Cai, Q.; Ma, W. Comparative study on rain splash erosion of representative soils in China. Chin. Geogr. Sci. 2008, 18, 155–161. [Google Scholar] [CrossRef]
- Ma, G.X.; Shi, J.M.; Li, M. Economical cost evaluation of ecological environment degradation in China. China Pop. Resour. Environ. 2009, 1, 162–168. (In Chinese) [Google Scholar]
- Ma, Y.; Xie, L.; Liao, J.W.; Ding, F.L. Discussion on third-level regionalization of soil and water conservation in Zhujiang river basin. Soil Water Conserv. China 2015, 12, 31–35. [Google Scholar] [CrossRef]
- Liang, P.; Liming, D.; Guijie, Y. Ecological security assessment of Beijing based on PSR model. Procedia Environ. Sci. 2010, 2, 832–841. [Google Scholar] [CrossRef]
- Gan, D.X.; Long, Y.L.; Yuan, X.Z.; Qi, Z.X. Analysis on the development of eco-tourism of terrace landscape in Ziquejie. Econ. Geogr. 2007, 6, 1056–1059. (In Chinese) [Google Scholar] [CrossRef]
- Qi, Y.X.; Shen, G.T.; Su, Y.H.; Yu, F. Forestry eco-environmental construction divisions of Ningxia Municipality. Res. Soil Water Conserv. 2007, 5, 217–220. (In Chinese) [Google Scholar]
- Chen, P.; Shang, J.; Qian, B.; Jing, Q.; Liu, J. A new regionalization scheme for effective ecological restoration on the Loess Plateau in China. Remote Sens. 2017, 9, 1323. [Google Scholar] [CrossRef]
- Dai, F.Q.; Nan, L.; Liu, G.C. Assessment of regional ecological security based on ecological footprint and influential factors analysis: A case study of Chongqing Municipality, China. Int. J. Sustain. Dev. World Ecol. 2010, 5, 390–400. [Google Scholar] [CrossRef]
- Cao, Y.; Ouyang, Z.Y.; Zheng, H.; Huang, Z.G.; Wang, X.K.; Miao, H. Effects of forest plantations on rainfall redistribution and erosion in the red soil region of Southern China. Land Degrad. Dev. 2008, 3, 321–330. [Google Scholar] [CrossRef]
- Lin, C.W.; Tu, S.H.; Huang, J.J.; Chen, Y.B. The effect of plant hedgerows on the spatial distribution of soil erosion and soil fertility on sloping farmland in the purple-soil area of China. Soil Tillage Res. 2009, 2, 307–312. [Google Scholar] [CrossRef]
- Melack, J.M.; Hess, L.L.; Gastil, L.; Forsberg, B.R.; Hamilton, S.K.; Lima, I.B.T.; Novo, E.M.L.M. Regionalization of methane emissions in the Amazon Basin with microwave remote sensing. Glob. Chang. Biol. 2004, 10, 530–544. [Google Scholar] [CrossRef]
- Luo, H.G. Images interpreted by the agriculture department of Shanxi province have been compiled and published. Soil Water Conserv. Sci. Technol. Shanxi 1982, 4, 57–58. [Google Scholar]
- Shi, Q.B. Training course in RS technology organized by the department of soil and water conservation in Ganzhou. Soil Water Conserv. China 1983, 2, 35. (In Chinese) [Google Scholar] [CrossRef]
- The work group of regionalization of soil and water conservation in Xingguo. Regionalization of soil and water conservation of Xingguo (discussion draft). Soil Water Conserv. China 1983, 3, 1–7. (In Chinese) [Google Scholar] [CrossRef]
- Zhang, H.X. The use of fuzzy clustering in regionalization of soil and water conservation. Soil Water Conserv. China 1990, 11, 52–54. (In Chinese) [Google Scholar]
- Zhou, S.B.; Shi, L.F.; Liu, L.R. Computer Used for Regionalization of Soil and Water Conservation. Soil Water Conserv. China 1990, 6, 41–45. (In Chinese) [Google Scholar]
- Liu, Z.J. Using Fuzzy Clustering to Determine Soil Erosion Level in a Small Watershed. Sci. Tech. Inf. of Soil Water Conserv. 1993, 1, 38–40, 48. (In Chinese) [Google Scholar]
- Deng, G.S.; Wei, X.C.; Wang, L.J. Apply Grey System Theory to Regionalization of Soil and Water Conservation. Fujian Soil Water Conserv. 1995, 4, 14–18. (In Chinese) [Google Scholar]
- Peng, J.B.; Di, L.; Lin, B.; Shi, B.; Yu, S.G. The ecological security evaluation of small watershed based on entropy weight and gray correlation analysis—A case study of the Anjiagou small watershed in Dingxi city. Hunan Agric. Sci. 2010, 7, 84–87. (In Chinese) [Google Scholar] [CrossRef]
- Yang, X.; Le, L. Study on soil and water conservation at country scale—A case study of the Meitan country, Guizhou province. Environ. Prot. Circ. Econ. 2018, 3, 37–41. (In Chinese) [Google Scholar]
- The Work Group of the First National Water Census of China. Report of the National Water Census of China, 1st ed.; China Water & Power Press: Beijing, China, 2017; pp. 161–176. ISBN 978-7-5170-4631-8. (In Chinese) [Google Scholar]
- Zhao, Y.; Ma, L.G. A brief analysis of the distribution scheme of soil and water conservation monitoring sites in China. Soil Water Conserv. in China 2016, 1, 23–25. (In Chinese) [Google Scholar] [CrossRef]
- Wang, B.; Hu, X.; Xu, Z.Q.; Zhang, G.C.; Yuan, L.; Li, H.; Yao, X.Y.; Liu, X. Zoing of soil and water conservation monitoring in Huaihe River Basin. Sci. Soil Water Conserv. 2015, 4, 51–57. [Google Scholar] [CrossRef]
- Trac, C.J.; Schmidt, A.H.; Harrell, S.; Hinckley, T.M. Is the returning farmland to forest program a success? Three case studies from Sichuan. Environ. Pract. 2013, 15, 350–366. [Google Scholar] [CrossRef] [PubMed]
- Zinda, J.A.; Trac, C.J.; Zhai, D.; Harrell, S. Dual-function forests in the returning farmland to forest program and the flexibility of environmental policy in China. Geoforum 2017, 78, 119–132. [Google Scholar] [CrossRef]
- Sun, Z.G.; Ma, X.Y. Effect of land terracing by rented machines in Tongwei. Soil Water Conserv. China 2005, 10, 44–45. [Google Scholar] [CrossRef]
- Bunn, A.G.; Urban, D.L.; Keitt, T.H. Landscape connectivity: A conservation application of graph theory. J. Environ. Manag. 2000, 59, 265–278. [Google Scholar] [CrossRef]
- Hezri, A.A. Sustainability indicator system and policy processes in Malaysia: A framework for utilisation and learning. J. Environ. Manag. 2004, 73, 357–371. [Google Scholar] [CrossRef] [PubMed]
- Yin, H.; Li, J.B.; Liao, T.; Zhou, H.P. Soil and water conservation regionalization of Lishui river watershed in Hunan province. Bull. Soil Water Conserv. 2009, 3, 44–49. [Google Scholar] [CrossRef]
- Barbero, M.; Bonin, G.; Loisel, R.; Quezel, P. Changes and disturbances of forest ecosystem caused by human activities in the western part of the Mediterranean basin. Vegetatio 1990, 87, 151–173. [Google Scholar] [CrossRef]
- Walther, G.R.; Post, E.; Convey, P.; Menzel, A.; Parmesan, C.; Beebee, T.J.C.; Fromentin, J.M.; Hoegh-Guldberg, O.; Bairlein, F. Ecological responses to recent climate change. Nature 2002, 416, 389–395. [Google Scholar] [CrossRef] [PubMed]
- Krishnapuram, R.; Keller, J.M. A possibilistic approach to clustering. IEEE Trans. Fuzzy Syst. 1993, 2, 98–110. [Google Scholar] [CrossRef]
- Hanski, I. Spatially realistic theory of metapopulation ecology. Naturwissenschaften 2001, 88, 372–381. [Google Scholar] [CrossRef] [PubMed]
- Minor, E.S.; Urban, D.L. Graph theory as a proxy for spatially explicit population models in conservation planning. Ecol. Appl. 2007, 17, 1771–1782. [Google Scholar] [CrossRef] [PubMed]
- Fortin, M.-J.; James, P.M.A.; MacKenzie, A.; Melles, S.J.; Rayfield, B. Spatial statistics, spatial regression, and graph theory in ecology. Spat. Stat. 2012, 1, 100–109. [Google Scholar] [CrossRef]
- Hillier, F.S.; Lieberman, G.J. Introduction to Operations Research, 10th ed.; McGraw-Hill Education: New York, NY, USA, 2015; pp. 372–437. ISBN 978-0-07-352345-3. [Google Scholar]
- Jacek, M. GIS-based land-use suitability analysis: A critical overview. Prog. Plan. 2004, 62, 3–65. [Google Scholar] [CrossRef]
- Mcrae, B.H.; Dickson, B.G.; Keitt, T.H.; Shah, V.B. Using circuit theory to model connectivity in ecology, evolution, and conservation. Ecology 2008, 89, 2712–2724. [Google Scholar] [CrossRef] [PubMed]
- Ketchen JR, D.J.; Shook, C.L. The application of cluster analysis in strategic management research: An analysis and critique. Strateg. Manag. J. 1996, 17, 441–458. [Google Scholar] [CrossRef]
- Fovell, R.G.; Fovell, M.Y.C. Climate zones of the conterminous united states defined using cluster analysis. J. Clim. 2009, 6, 2103–2135. [Google Scholar] [CrossRef]
Figure 1.
Citation statistics of the top 10 most highly cited articles.

Figure 2.
Different combinations of soil conservation measures in the eight first-level regions. Source of data: Report of the first national water census of China [48].
Figure 2.
Different combinations of soil conservation measures in the eight first-level regions. Source of data: Report of the first national water census of China [48].

Figure 3.
The overlapped boundaries of monitoring regions and conservation sub-regions.

Figure 4.
A case of introducing operations research into regionalization.


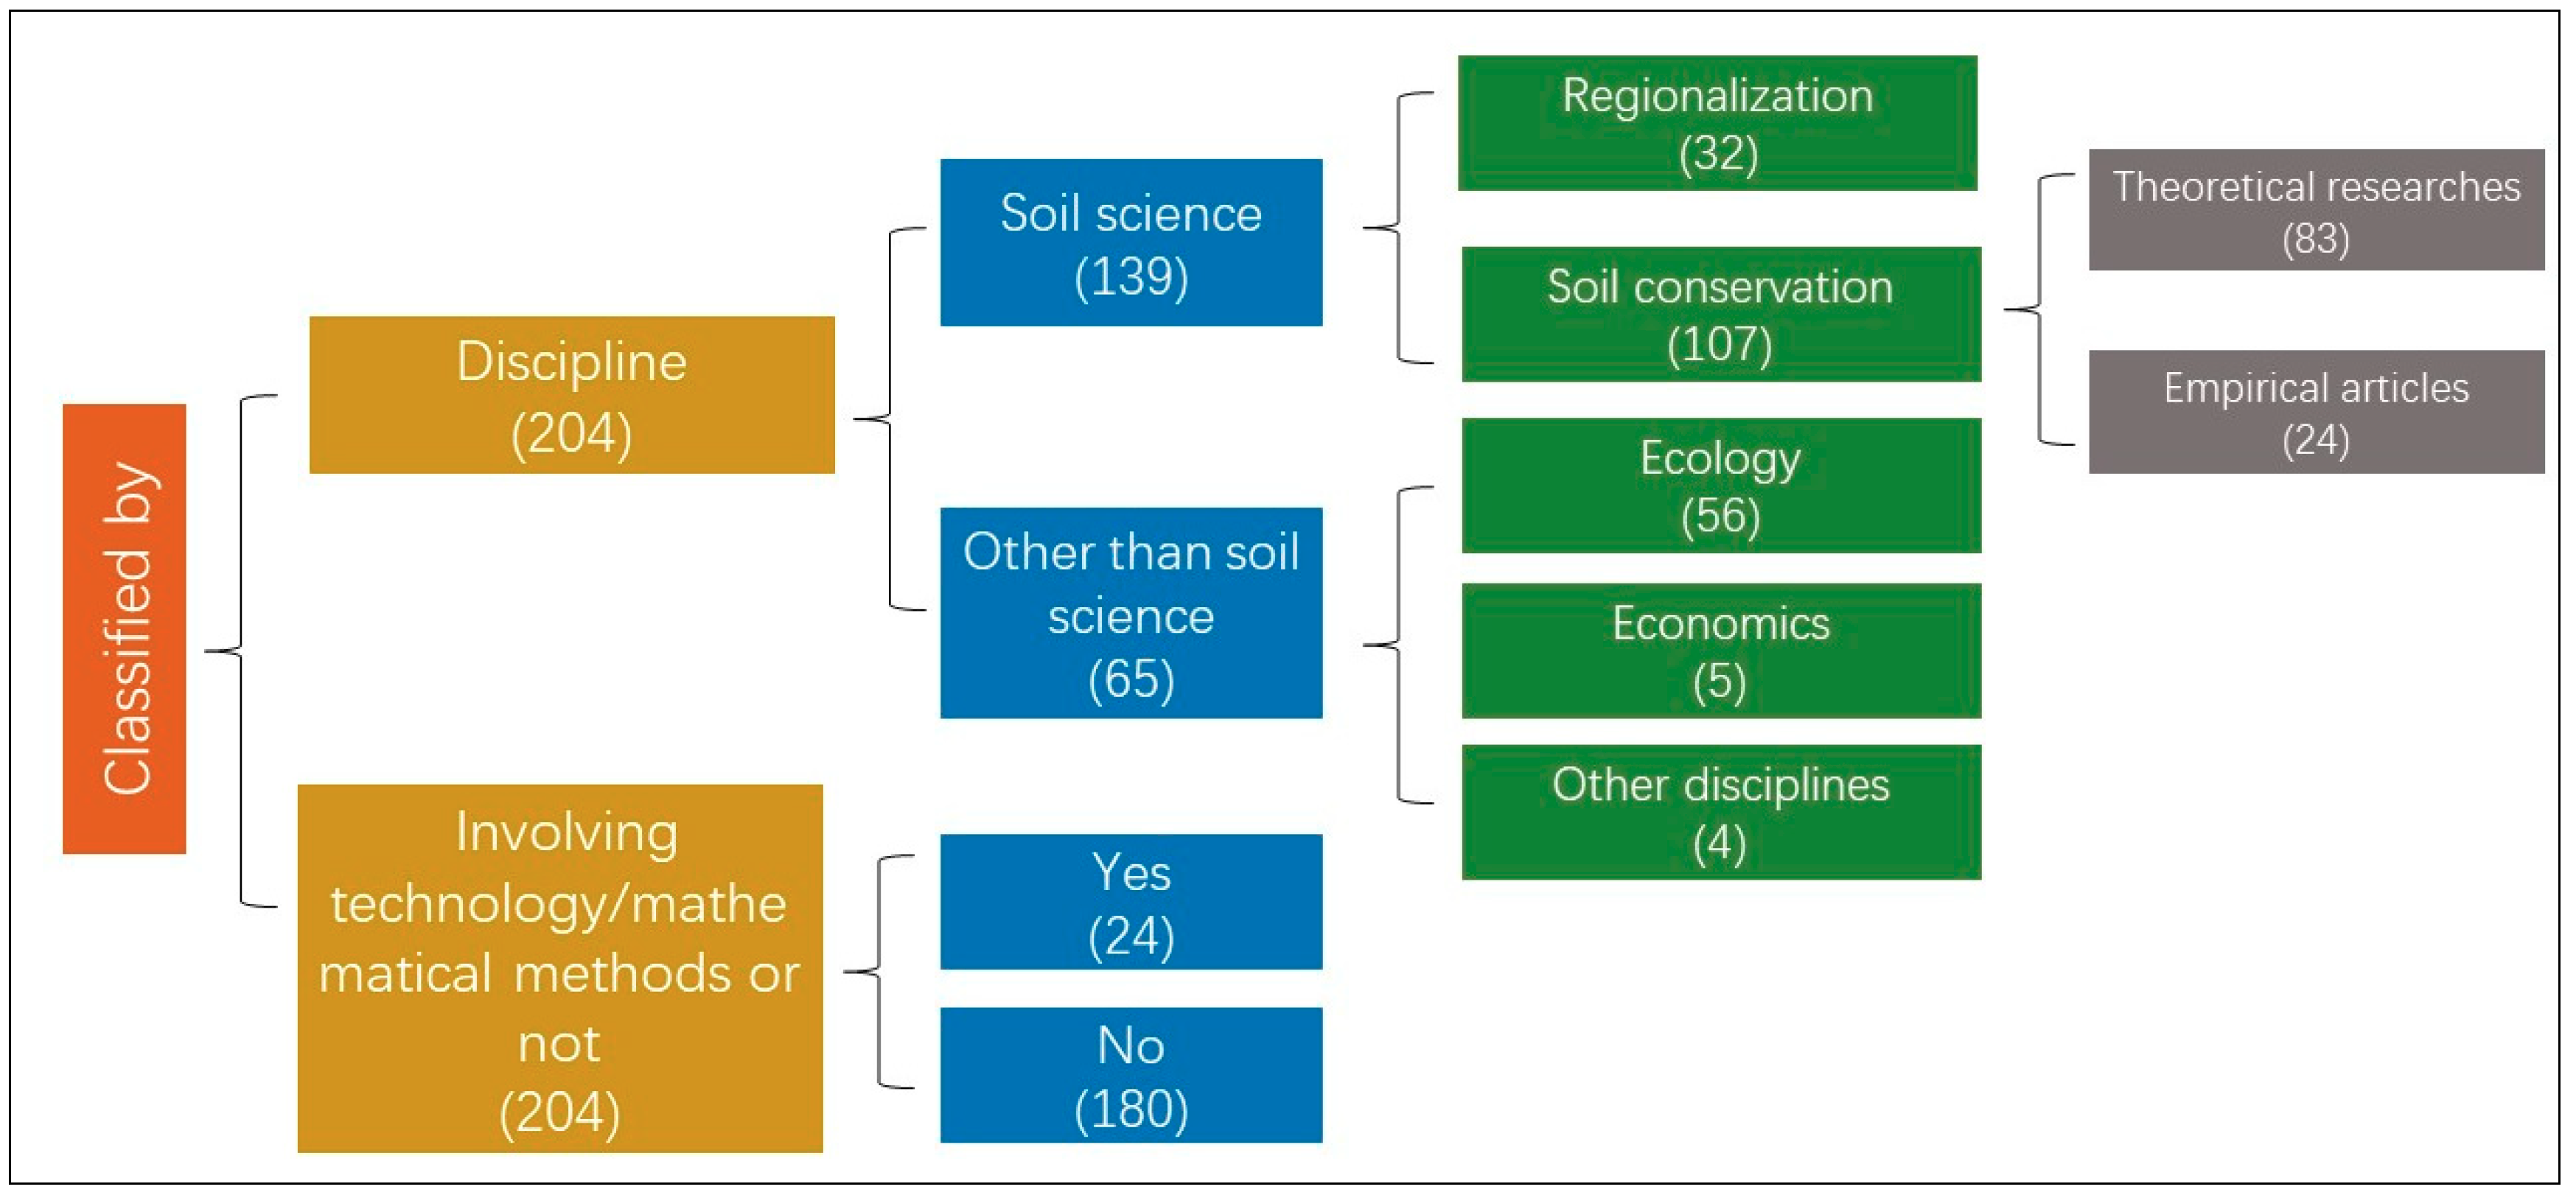
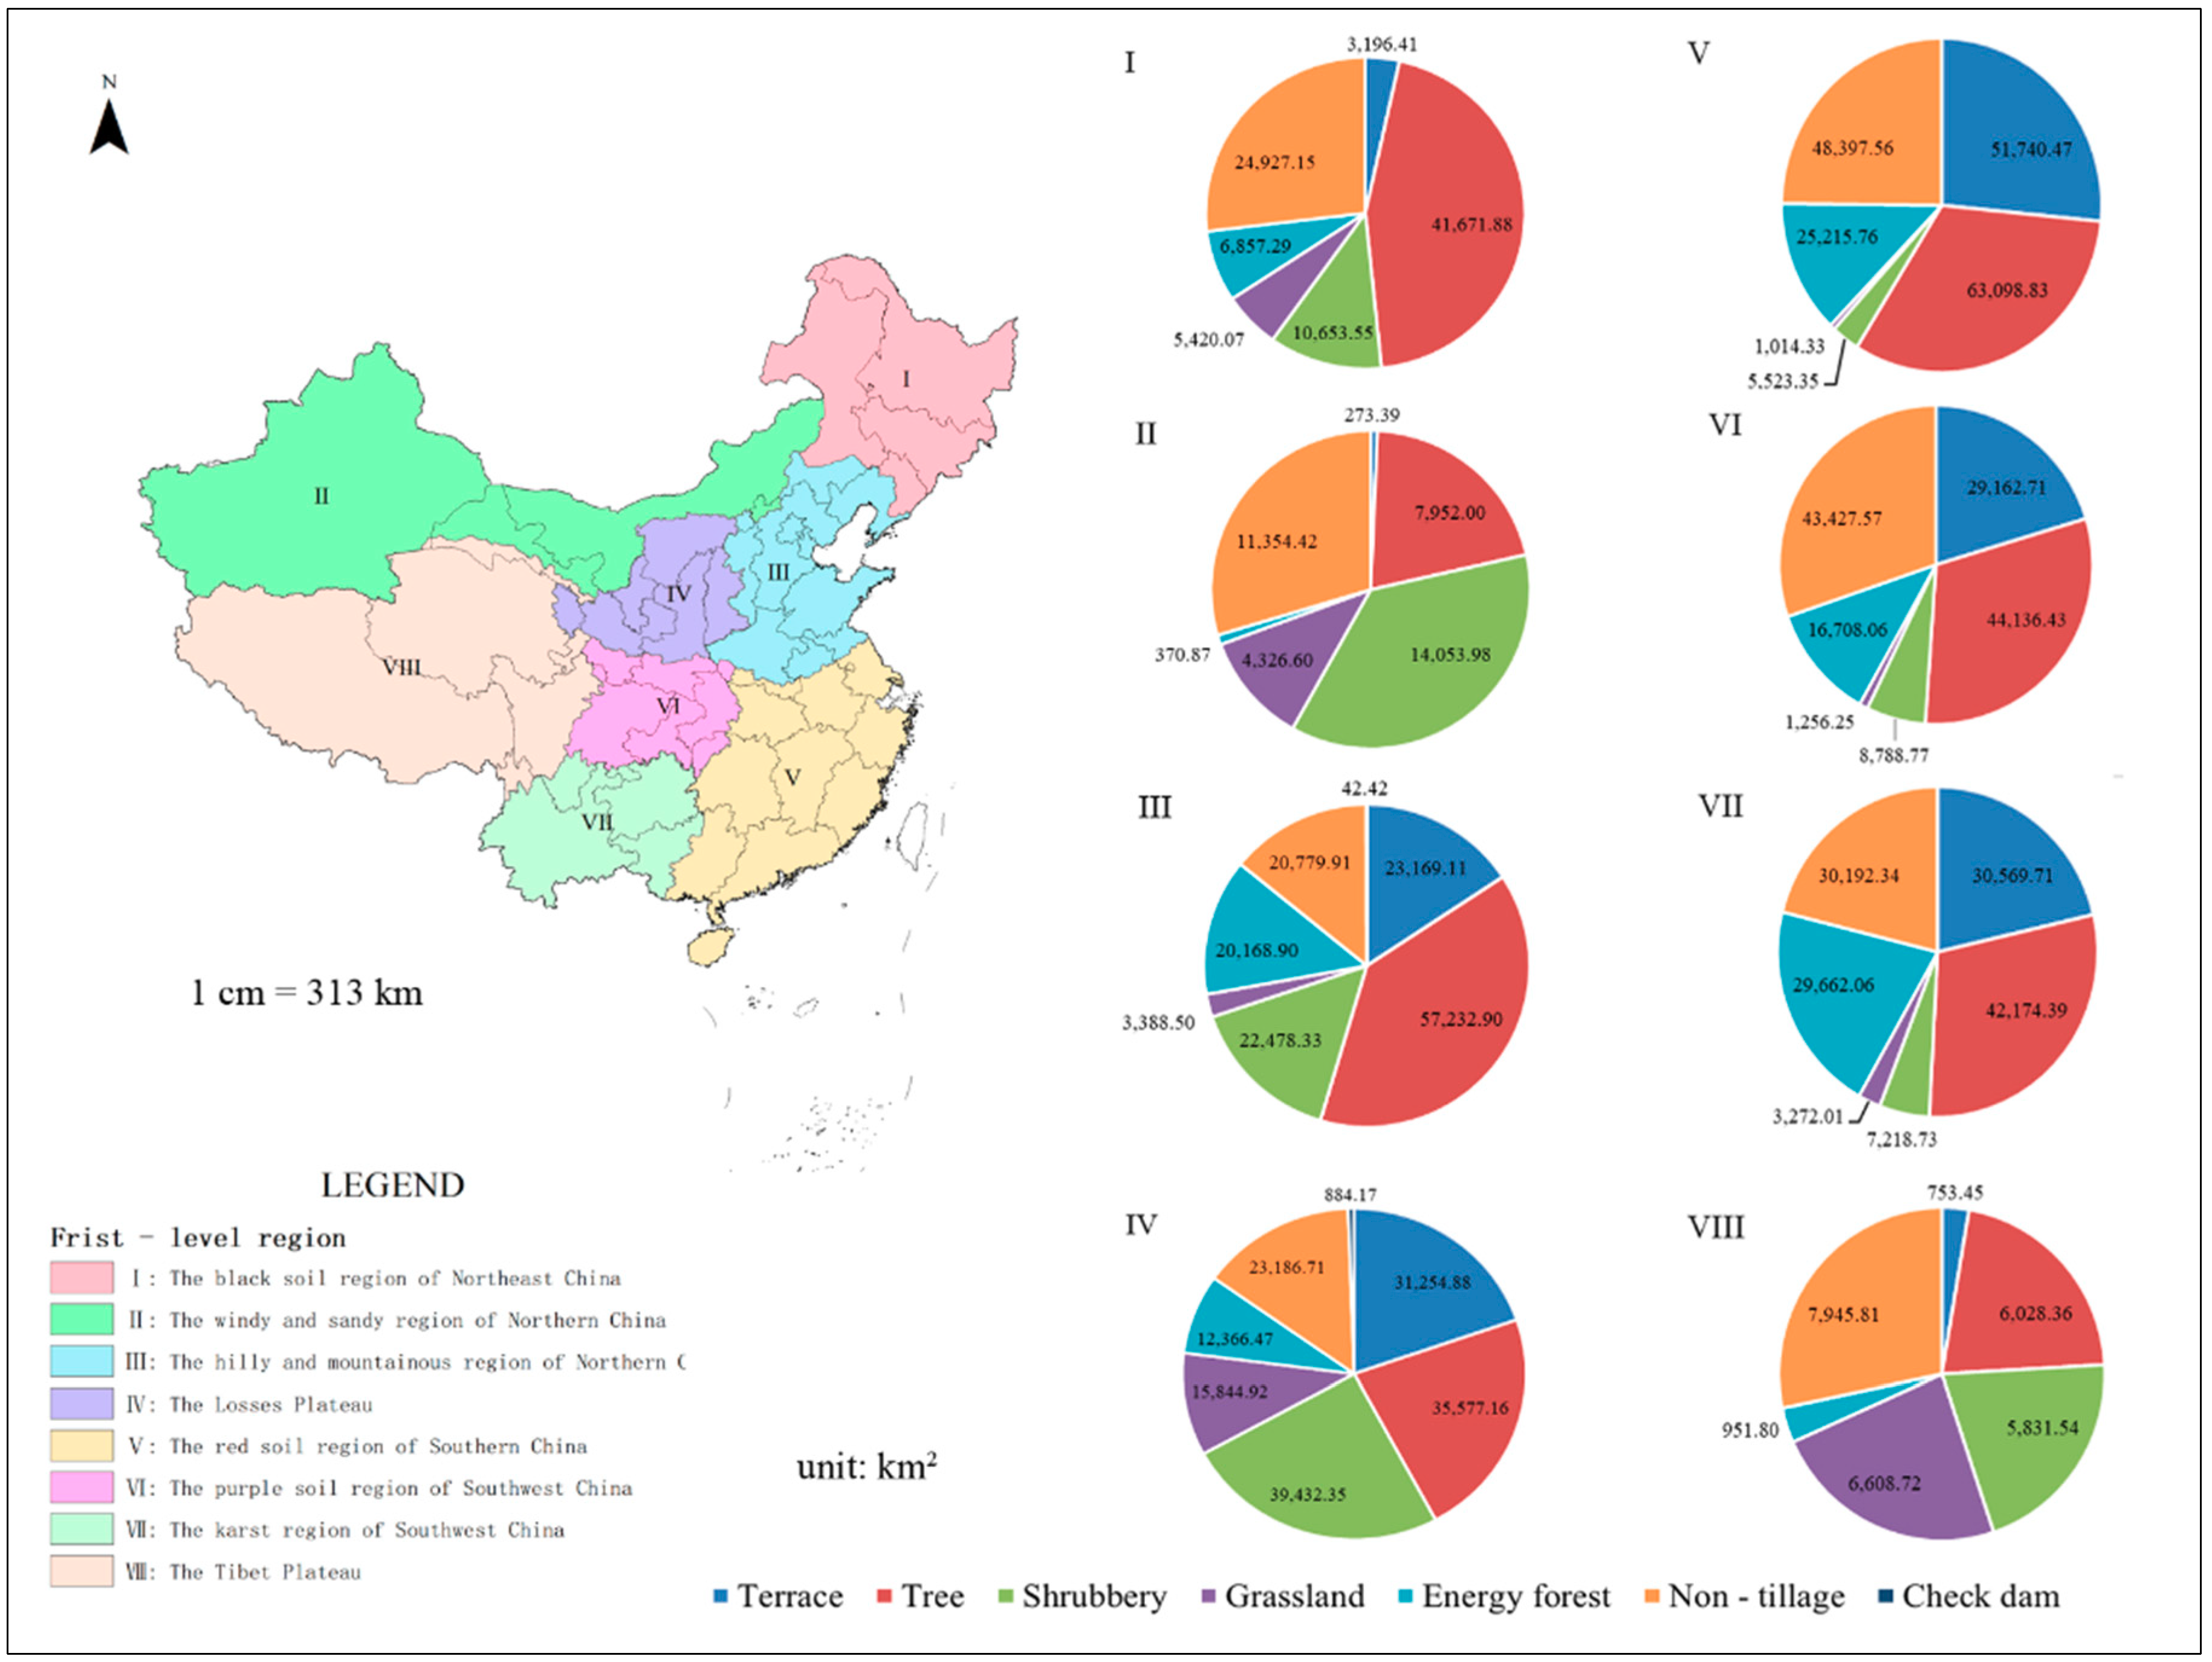
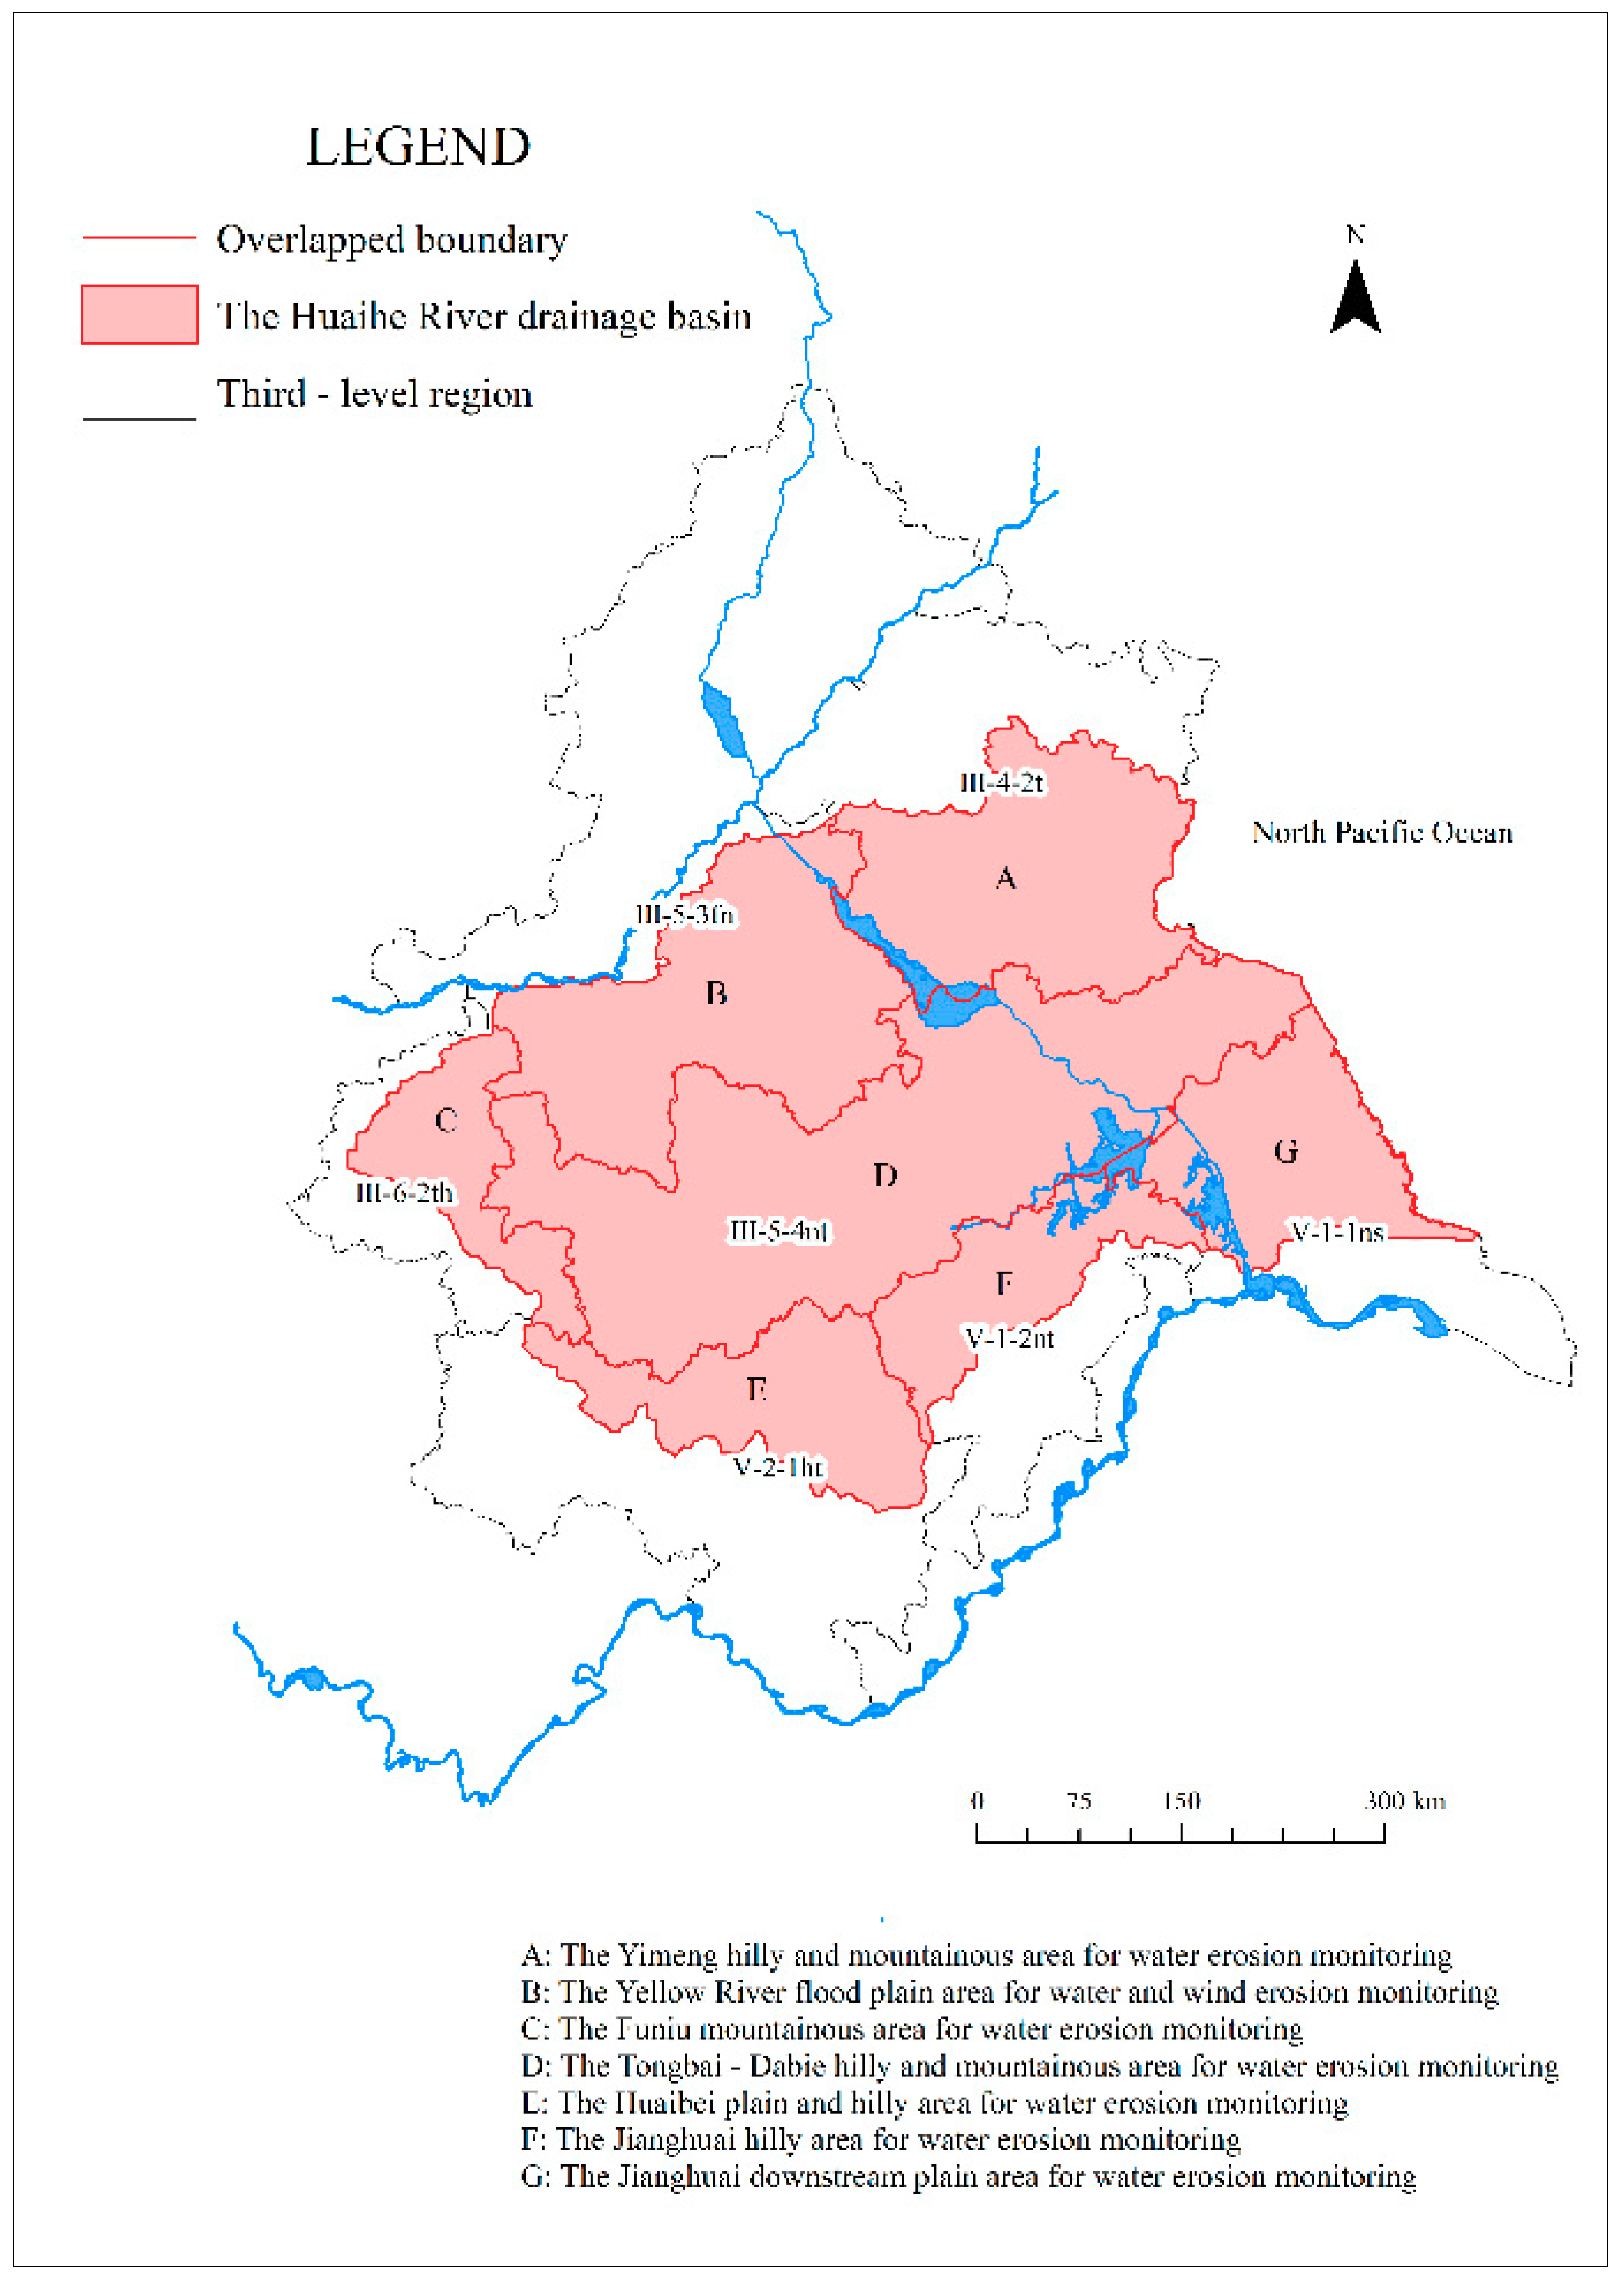
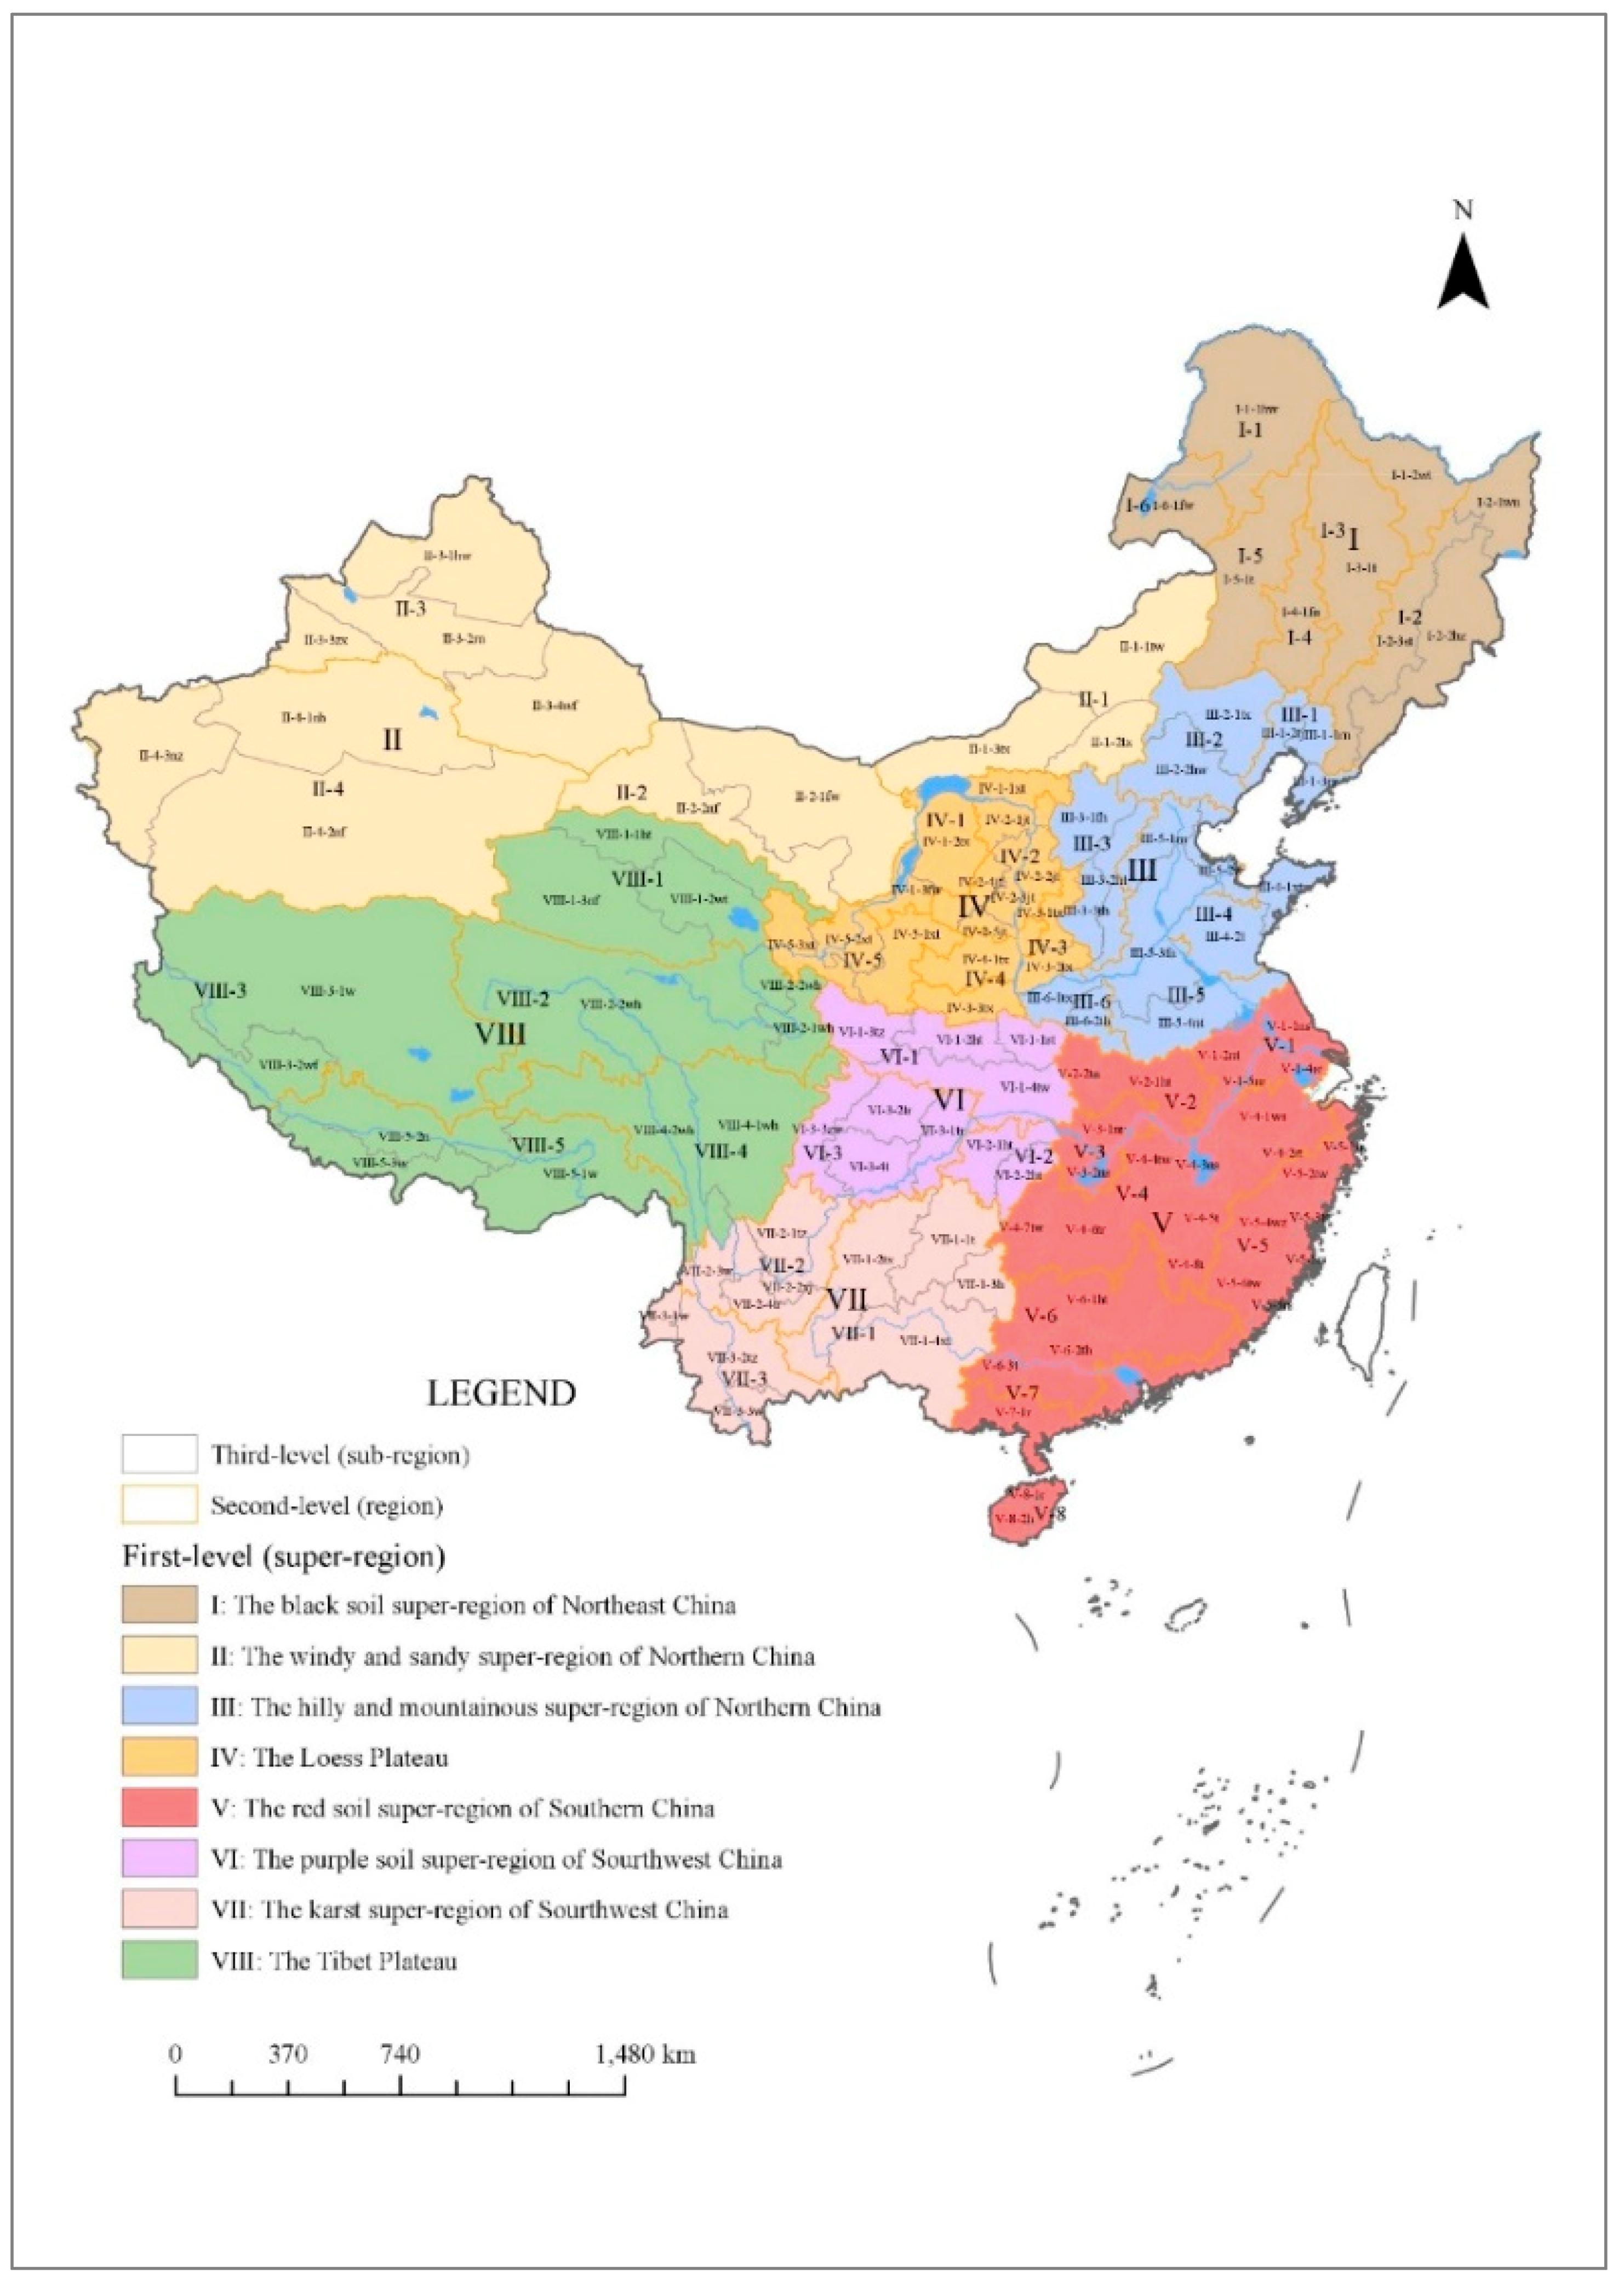
Table 1.
Statistical analysis of the indicator system.
| Scale | Area | The Number of Indicators Used | Total/Excluding Repetition | Most Repeated Indicators/Repeated Times | Total/Excluding Repetition | Most Repeated Indicators/Repeated Times |
|---|---|---|---|---|---|---|
| drainage basin | the Pearl River | 10 | 25/20 | population density/3 mean annual precipitation/2 vegetation coverage/2 proportion of eroded soil/2 | 31/13 | population density/5 vegetation coverage/5 mean annual precipitation/4 |
| the Huaihe River | 6 | |||||
| the Taihu Lake | 9 | |||||
| region | the mountainous region of Zhejiang and Fujian | 12 | 36/23 | population density/4 vegetation coverage/4 average elevation/3 soil erosion modulus/2 mean annual precipitation/2 accumulated temperature above 10 °C/2 GDP per capita/2 farming intensity/2 | ||
| the hilly-gully region of the Loess Plateau | 6 | |||||
| the plateau region of Yunnan, Guizhou and Sichuan | 10 | |||||
| the mountainous region of Yanshan | 8 | |||||
| province | Liaoning | 21 | 71/36 | mean annual precipitation/4 vegetation coverage/4 average elevation/3 mean annual temperature/3 population density/3 GDP per capita/3 secondary industry production/3 proportion of eroded soil/3 proportion of forestland/3 | ||
| Jiangsu | 22 | |||||
| Shanxi | 8 | |||||
| Hubei | 20 | |||||
| small watershed | Tuweihe | 7 | 51/46 | soil erosion modulus/3 gully density/2 vegetation coverage/2 population density/2 | ||
| Kuyehe | 10 | |||||
| Xiannangou | 5 | |||||
| Lishui | 29 | |||||
| county | Fangshan | 5 | 29/18 | population density/4 vegetation coverage/4 soil erosion modulus/4 farming intensity/2 gully density/2 mean annual precipitation/2 | ||
| Ansai | 8 | |||||
| Shaowu | 9 | |||||
| Xigu | 7 |
Table 2.
Membership functions values of the three regions.
| μ (X1) | μ (X2) | |
|---|---|---|
| R1 | 0.8 | 0.4 |
| R2 | 0.4 | 0.8 |
| R3 | 0.4 | 0.1 |
© 2018 by the authors. Licensee MDPI, Basel, Switzerland. This article is an open access article distributed under the terms and conditions of the Creative Commons Attribution (CC BY) license (http://creativecommons.org/licenses/by/4.0/).
Share and Cite
MDPI and ACS Style
Wang, D.; Li, Z.; Zeng, G.; Nie, X.; Liu, C. Evaluation of Regionalization of Soil and Water Conservation in China. Sustainability 2018, 10, 3320. https://doi.org/10.3390/su10093320
AMA Style
Wang D, Li Z, Zeng G, Nie X, Liu C. Evaluation of Regionalization of Soil and Water Conservation in China. Sustainability. 2018; 10(9):3320. https://doi.org/10.3390/su10093320
Chicago/Turabian StyleWang, Danyang, Zhongwu Li, Guangming Zeng, Xiaodong Nie, and Chun Liu. 2018. "Evaluation of Regionalization of Soil and Water Conservation in China" Sustainability 10, no. 9: 3320. https://doi.org/10.3390/su10093320
Note that from the first issue of 2016, this journal uses article numbers instead of page numbers. See further details here.